Embed Size (px)
Citation preview
Dynamic Transmission Line Rating
Technology Review
208478-CR-001
30 July 2009
Dynamic Transmission Line Rating - Technology Review Revision No: 1 208478-CR-001 30 July 2009
The concepts and information contained in this document are the property of Hydro Tasmania Consulting. This document may only be used
for the purposes for which, and upon the conditions, the report is supplied. Use or copying of this document in whole or in part for any other
purpose without the written permission of Hydro Tasmania Consulting constitutes an infringement of copyright.
ii
Document information
Title Dynamic Transmission Line Rating
Technology Review
Client organisation Electricity Commission of New Zealand
Client contact John Gleadow
Document number 208478-CR-001
Project manager Angus Ketley / Geoff McDougall
Project reference 208478
Revision history Revision 1
Revision description
Prepared by Adonis Dino/Angus Ketley
Reviewed by Geoff McDougall
Approved by Donald Vaughan (name) (signature) (date)
Distributed to John Gleadow Electricity Commission of
New Zealand
(name) (organisation) (date)
Dynamic Transmission Line Rating - Technology Review Revision No: 1 208478-CR-001 30 July 2009
iii
Executive Summary
The line rating represents the line current which corresponds to the maximum allowable
conductor temperature for a particular line without clearance infringements or significant loss
in conductor tensile strength due to annealing. This report deals primarily with the provision
of ratings which ensure that the required clearances are not violated. However, this can be
extended to other applications such as the management of annealing.
Transmission of electric power has traditionally been limited by conductor thermal capacity
defined in terms of a static line rating, which is based on a predetermined set of conditions.
These conditions are incorporated into the design of the line to take into account statutory
vertical clearances. In the last two decades, technologies and strategies have emerged to
allow the real-time or pseudo-real-time measurement of transmission line characteristics and
environmental conditions which enabled calculation of a real-time rating.
Transmission line ratings are determined using the conductor�s heat balance and are
dependent on the cooling effect of wind, warming due to line current, air temperature and
solar heating. By accurately monitoring these conditions, a corresponding line current limit
can be determined, thereby enabling the system operator to ensure that conductor
temperature does not exceed the design limit, and maximises line utilisation under all
conditions.
Dynamic line rating methods can be broken down into two main categories:
Weather based (indirect)
The line rating is determined by measurement of ambient climatic conditions, and by means
of the heat balance equation, to obtain the instantaneous conductor temperature rise
available, and hence, the allowable current that can be transferred.
Field data includes the following
(a) Wind speed measured by an anemometer;
(b) Wind direction;
(c) Air temperature;
(d) Solar heat intensity; and
(e) Conductor parameters
Dynamic Transmission Line Rating - Technology Review Revision No: 1 208478-CR-001 30 July 2009
iv
Sag based (direct)
The line rating is determined by direct measurement of the conductor�s state. The actual
conductor temperature can be calculated using the predetermined relationship between
conductor position/tension and temperature. The heat balance equation is used to determine
the additional current that can be transferred before the conductor�s maximum operating
temperature is achieved.
This method still requires the indirect parameters to be measured. However, it has the added
benefit of providing a direct alarm should the conductor sag exceed or tension fall below a
predetermined point that represents a violation of the required statutory ground clearance.
Field data includes the following:
(a) Conductor position and or tension;
(b) Air temperature;
(c) Wind speed measured by an anemometer;
(d) Wind direction;
(e) Solar heat intensity;
(f) Line current; and
(g) Conductor parameters
Benefits and Considerations
The benefits of dynamic line rating include but are not limited to; improved system reliability
and safety, reduced and or deferred capital expenditure, increased efficiency of generation
resources, and lower rates for utility customers. However, the following issues need to be
considered, clearly understood, and evaluated accurately when applying either direct or
indirect rating strategies:
In line rating calculations, it is normally assumed that the conductors are in their �as
designed� and �as installed� condition. The line to which dynamic rating is to be
implemented should be inspected and its actual state confirmed prior to the application
of available strategies.
Dynamic Transmission Line Rating - Technology Review Revision No: 1 208478-CR-001 30 July 2009
v
While in general new connectors and line hardware runs cooler than the conductor,
older connectors and hardware may not. Unless periodically inspected, the use of
system-wide line ratings could lead to line failures.
It is common for measuring devices to be in a remote location. A high standard of
reliability and durability is vital for effective real-time rating determination, as well as a
robust power source and communication links. Orders of backup adjacent monitoring
stations are important and �watchdogs� are necessary to monitor the integrity of the
telemetered data elements.
Dynamic rating does not eliminate the risk of violating statutory ground clearances.
However, it does arm the network controller with much more information in order to
better manage contingent events and periods of uncharacteristic weather conditions.
The magnetic field of a transmission line increases with line ampacity, and increases at
ground level with increased conductor sag. Even though transmission line voltage is
managed to remain at the rated level, electric fields also need to be evaluated as its
strength at ground level is affected by conductor sag.
Overhead conductors elongate with time, temperature and tension. Despite the effects
of weather and loading, the conductors have to remain at a safe distance from
buildings, objects, and people or vehicles passing beneath and near the line at all
times.

Dynamic Transmission Line Rating - Technology Review Revision No: 1 208478-CR-001 30 July 2009
vii
Contents
1. Introduction 1
2. Current State of the Art 3
2.1 Background 3 2.2 Line Rating Parameters 4
2.2.1 Measuring Climatic Conditions 4 2.2.2 Monitoring Conductor State 5
2.3 Dynamic Line Rating Advantages and Disadvantages 6 2.4 Consequences of too Optimistic Rating Assumptions 8
2.4.1 Clearance Violations 8 2.4.2 Conductor Annealing 8 2.4.3 Elevated Temperature Creep 8
3. Australian Experience 9
3.1 NEMMCO Requirements 11 3.1.1 Selection of Short Time Ratings 11
3.2 Tasmanian Rating Scheme 11 3.2.1 Background 11 3.2.2 Current Practice 12
4. New Zealand Opportunities 15
4.1 Background 15 4.2 The New Zealand Electricity Market 15
4.2.1 Market Design and Operation 15 4.2.2 Right of Capacity or Dispatch 16
4.3 Transpower�s Line Rating Process 16 4.4 Possible Opportunities 17 4.5 Implementation Considerations 19
5. References 20
Appendices
Appendix. A Existing Dynamic Line Rating Technologies

Dynamic Transmission Line Rating - Technology Review Revision No: 1 208478-CR-001 30 July 2009
viii
List of figures
Figure 3-1 Typical Daily Operation of the NEM [11] 10
Figure 3-2 Completed Installation of a Load Cell to Monitor Conductor Tension in Tasmania 13
Figure 3-3 Completed Installation of a Weather Station in Tasmania 14
Figure A-1 Power DonutTM (© Courtesy of Underground Systems, Inc) A-1
Figure A-2 On-line temperature monitoring system comprised of Power DonutTM temperature sensors, and weather station and ground station RTU (© Courtesy of Nitech, Inc) A-2
Figure A-3 ThermalRateTM Sensor A-3
Figure A-4 Completed Installation ThermalRateTM Sensor A-3
Figure A-5 A weather station with a 3D ultrasonic anemometer mounted next to a standard propeller-type anemometer A-4
Figure A-6 Load Cells to measure tension A-5
Figure A-7 Completed Installation of Load Cells to measure tension A-5
Figure A-8 EPRI�s Video Sagometer mounted on a wood pole A-6
Figure A-9 Sagometer Target A-6
Figure A-10 Proposed Basic Configuration of Differential GPS A-7
List of tables
Table 2-1 Simplified Comparison of Common Dynamic Line Rating Methods 6
Table 2-2 Dynamic Line Rating System Advantages and Disadvantages 7
Table 3-1 Seasonal Alternate Rating in Tasmania 12
Dynamic Transmission Line Rating - Technology Review Revision No: 1 208478-CR-001 30 July 2009
1
1. Introduction
The Electricity Commission of New Zealand (EC) engaged Hydro Tasmania Consulting
(HTC) to prepare a review of the application of real-time thermal rating to overhead lines in
New Zealand, in an attempt to remove existing restrictions to the development of renewable
generation sources. This review includes a description of possible strategies, the present
state-of-the-art in Australia, specifically Tasmania, and a discussion of their possible
application within the New Zealand network.
This review does not provide a full assessment of the actual opportunities and benefits to
New Zealand. This review should form part of an overall feasibility study into the use of
dynamic rating technology in New Zealand, including a cost/benefit analysis.

Dynamic Transmission Line Rating - Technology Review Revision No: 1 208478-CR-001 30 July 2009
3
2. Current State of the Art
2.1 Background
The steady state thermal current rating of a conductor is the level of current that induces the
maximum steady state temperature for a given ambient condition. This temperature is based
on the heat balance equation where conductor heat gain equals conductor heat loss:
Pj + Ps = Pr + Pc
The heat gain term, Pj, represents the joule heating due to resistance of the conductor. Ps is
the solar heat gain (air temp and solar radiation). The heat loss term, Pc, represents natural
and forced convection cooling (wind) while Pr denotes radiation cooling. Secondary terms of
heat gain such as eddy currents and corona are not considered. Likewise, the evaporative
cooling heat loss term is also discounted.
Line resistance determines a level of Pj which, when combined with the remaining terms,
results in a conductor temperature that ensures required clearances are maintained for safe
operation of the line. This also ensures integrity of the conductor is not compromised through
annealing or loss of grease.
Rating strategies can be divided in two main groups; static and dynamic.
Static line ratings in their simplest form involve the predetermination of �worst-case� weather
conditions (the highest expected ambient temperature, a low wind speed, and a low
conductor emissivity) along the entire line for an extended period of time. This assures the
network operator that the conductor will not sag below the required vertical clearances at any
point in the line�s life. However, this assurance may be misguided during extreme climatic
conditions over and above the predetermined criteria. The static rating approach also has the
effect of underutilising the lines potential during climatic conditions below the predetermined
criteria. This is especially important for the wind developers, as the simplified static model
does not take ambient wind strengths or wind direction into account which would greatly
increase the possible rating of the line.
The Static rating model can be enhanced by the introduction of the line�s geography, the time
of year and the time of day; with ratings based on long term average conditions over the

Dynamic Transmission Line Rating - Technology Review Revision No: 1 208478-CR-001 30 July 2009
4
required periods. This approach results in a workbook or lookup table for each line and will
provide for better utilisation of the line during times where the actual climatic condition match
the long term averages. However, the possibility of missed opportunities is still present and
the probability of falling below the required clearances on days where the ambient
temperature exceeds the long term average is increased.
The application of a Dynamic line rating strategy is quite different since the predetermination
of the �worst-case� weather condition need only apply for the next 5 to 15 minutes. Clearly,
dynamic ratings are likely to be higher than the static rating but have the disadvantages of
volatility and unpredictability. [2]
Quasi-dynamic line ratings are typically calculated for longer time periods than dynamic
ratings and, while typically higher than static ratings, they can be more predictable and less
variable than dynamic ratings. [2]
2.2 Line Rating Parameters
The following section discusses the parameters which may be measured in order to
determine the rating of an overhead line. The current devices and technologies used to
measure these parameters have been detailed in Appendix B.
2.2.1 Measuring Climatic Conditions
Transmission network operators typically prepare load capacity limits based on known
seasonal conditions and wind speeds. These can be measured at locations throughout the
network and provide the representative conditions for the region in question and, hence, the
possible line rating.
(a) Ambient Air Temperature
Typically, during winter-time, a line can be rated at higher capacity because at low ambient
temperatures and the conductors will have a higher nominal load carrying capacity, due
largely to their ability to dissipate heat. During summer, the line rating may decrease due to
hotter ambient temperatures.
(b) Wind Speed and Direction
Wind exerts a very strong cooling influence on the conductors irrespective of the ambient
temperature and is, therefore, an important parameter in the determination of line capacity.
However, the volatility of wind data can create some problems. Management strategies may
Dynamic Transmission Line Rating - Technology Review Revision No: 1 208478-CR-001 30 July 2009
5
include discounting wind direction, averaging the wind speed over a time period and or
setting upper and lower bounds.
(c) Solar Radiation
The level of direct and diffuse solar radiation can be reliably measured but is also volatile due
to variable cloud cover. The real-time measurement of this parameter is generally discounted
in favour of established solar radiation charts for the particular region.
(d) Conductor Condition
The emissivity and absorptivity of a conductor depends on the conductor�s surface
properties. Emissivity is a measure of the thermal radiation from the conductor while
absorptivity is a measure of how much the conductor is heated by solar radiation, and hence
both influence the heat balance equation.
Conductor emissivity and absorptivity evolve over time as the conductor ages, collects dust
and other particles, or is affected by pollution.
Due to significant uncertainty in the current measure of emissivity and absorptivity, conductor
manufacturers are generally satisfied with assigning conservative emissivity and absorptivity
values to be used in dynamic rating of transmission lines. However, determining emissivity
and absorptivity values more accurately could reap significant savings in the form of reduced
conductor size or higher transmission line ratings.
2.2.2 Monitoring Conductor State
The actual state of the conductor can be measured to determine the amount of additional
current that can be transferred by the line before the predetermined maximum conductor
temperature is exceeded. The selection of the span to be measured is important, as it
should be representative of the whole line.
(a) Conductor Sag
Conductor sag is defined as the vertical distance between any point on a conductor and a
straight line between the two attachment points. The conductor sag at any point in a given
span is a function of the conductor�s mass per unit length (ùc), tension and the span length.
Therefore, using measured sag, the conductor tension can be determined. This tension,
when combined with the conductor parameters, can be converted into a corresponding
conductor temperature. The heat balance equation is then used to determine the additional
Dynamic Transmission Line Rating - Technology Review Revision No: 1 208478-CR-001 30 July 2009
6
current that can be transferred before the conductor�s maximum operating temperature is
achieved.
(b) Conductor Tension
Conductor tension can be measured directly using a load cell within the tension insulator
string. This value is then used in the same manner as described above.
This process is complicated by the presence of wind, which has the dual effect of cooling the
conductor and also effectively adding a component to the conductor�s unit load (ùc +ùh). To
establish the line rating, direct measurements of the conductor must be made as well as the
ambient conditions of wind and air temperature.
(c) Conductor Temperature
The simplest strategy is to measure conductor temperature directly. This inherently takes into
account all external influences. However, it does introduce the added complication of
maintaining sensor isolation from the telemetry device.
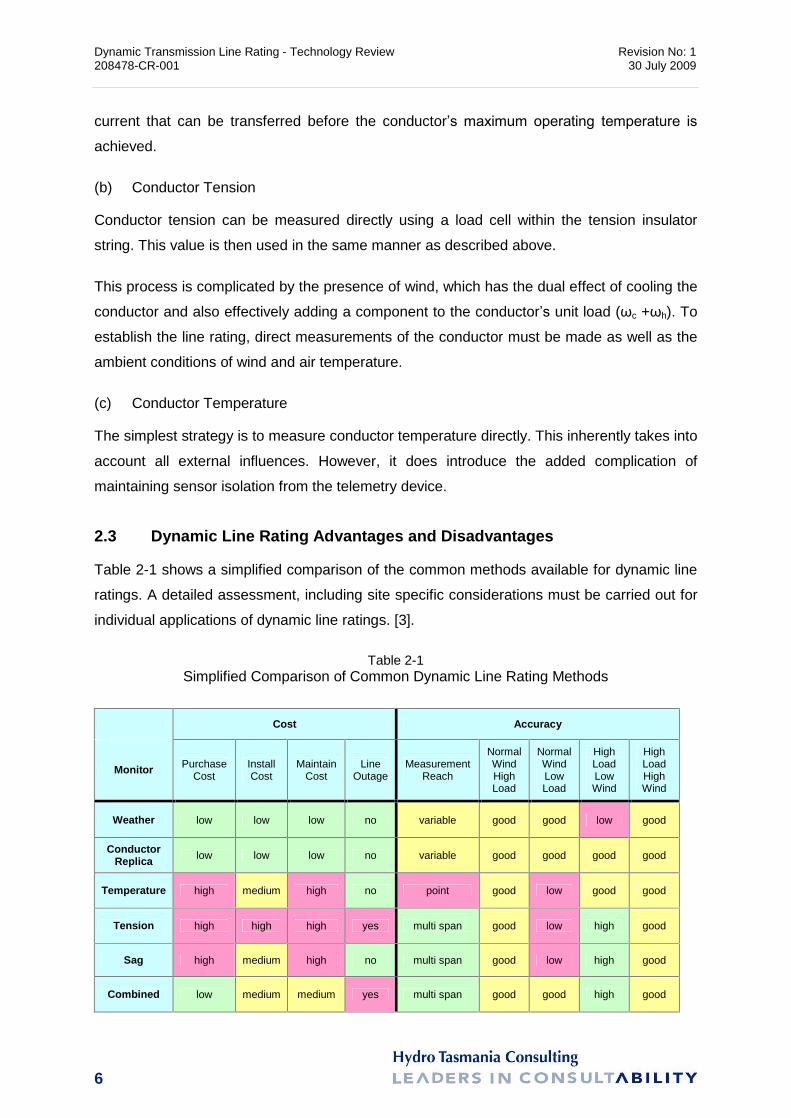
2.3 Dynamic Line Rating Advantages and Disadvantages
Table 2-1 shows a simplified comparison of the common methods available for dynamic line
ratings. A detailed assessment, including site specific considerations must be carried out for
individual applications of dynamic line ratings. [3].
Table 2-1 Simplified Comparison of Common Dynamic Line Rating Methods
Cost Accuracy
Monitor Purchase Cost
Install Cost
Maintain Cost
Line Outage
Measurement Reach
Normal Wind High Load
Normal Wind Low Load
High Load Low Wind
High Load High Wind
Weather low low low no variable good good low good
Conductor Replica low low low no variable good good good good
Temperature high medium high no point good low good good
Tension high high high yes multi span good low high good
Sag high medium high no multi span good low high good
Combined low medium medium yes multi span good good high good

Dynamic Transmission Line Rating - Technology Review Revision No: 1 208478-CR-001 30 July 2009
7
Table 2-2 summarises the possible advantages and disadvantages of the available systems
for dynamic line rating.
Table 2-2 Dynamic Line Rating System Advantages and Disadvantages
Dynamic Line Rating System Advantage Disadvantage
Weather Station Simplest method to implement;
Ideal for lines with relatively low current density of less than about 0.5 amps/mm2 [1]
Can be maintenance intensive;
At low wind speeds, the prediction of wind direction and persistence is nearly impossible.
Conductor Replica A simple method to implement Measured conductor temperature may or may not be a good estimate of the average conductor temperature along the line.
Direct Temperature Measurement
Effectively prevents the loss of conductor strength at high temperature
Measured conductor temperature may or may not be a good estimate of the average conductor temperature along the line.
Tension Ideal for heavily loaded transmission lines with current density greater than approximately 1 amp/mm2. [1];
High accuracy for use in a line section with multiple suspension spans having nearly the same tension.
Can be maintenance intensive.
Sag Ideal for heavily loaded transmission lines with current density greater than approximately 1 amp/mm2. [1];
High accuracy for use in a line section with multiple suspension spans having nearly the same tension.
Wind on conductor may affect the measured sag
Combined Safest and an ideal method of dynamically rating transmission lines
High premium cost

Dynamic Transmission Line Rating - Technology Review Revision No: 1 208478-CR-001 30 July 2009
8
Combinations of both weather and physical line monitoring is clearly more expensive but will
enable improved dynamic rating at both high and low conductor current densities. This is
particularly important for lines requiring dynamic rating that may be lightly loaded with
periods of near rated load.
2.4 Consequences of too Optimistic Rating Assumptions
When weather monitoring equipment produces a poor representation of weather conditions
for a dynamically rated conductor, the conductor rated temperature may be significantly
exceeded, which may result in:
2.4.1 Clearance Violations
During line design, the location and height of each structure in a pre-selected line route is
determined using an assumed maximum conductor temperature and required statutory
clearance to which the line is expected to operate. Transmission lines operated at
temperatures higher than the designed temperature may result in clearance violations.
2.4.2 Conductor Annealing
When hard drawn aluminum conductors are operated at temperatures beyond their rated
temperature, the aluminum starts to anneal. Annealing weakens the conductor and can
potentially cause the conductor to break under wind or ice conditions. [17]
2.4.3 Elevated Temperature Creep
Permanent or irreversible elongation of the conductor is known to occur due to operation of
the conductor at elevated temperature. The elongation is a result of molecular realignment of
the conductor�s base material. Elongation increases conductor sag and reduces the
conductor clearance to ground.
Dynamic Transmission Line Rating - Technology Review Revision No: 1 208478-CR-001 30 July 2009
9
3. Australian Experience
Australia�s National Electricity Market (NEM) consists of six (6) regions - Queensland, New
South Wales, the Australian Capital Territory, Victoria, South Australia and Tasmania. It is
the mechanism through which electricity is physically traded between registered generators
and market customers. Trade in electricity takes place dynamically, 24-hours-a-day and
seven-days-a-week.
The National Electricity Market Management Company Limited (NEMMCO)1 is responsible
for managing and operating NEM in accordance with the National Electricity Rules (NER).
NEMMCO is required to balance supply with demand by scheduling the most cost-effective
generators into production. Each Transmission Network Service Provider (TNSP) provides
the necessary information to NEMMCO to allow it to forecast electricity consumption in each
of the 6 regions, identify the capability of the transmission network to transmit electricity, and
to capture the present state of the power system. NEMMCO�s system issues dispatch
instructions every five minutes after a set of rules (referred to as the dispatch algorithm) is
applied to all dispatch bids, to determine the most cost-effective way to satisfy demand. The
calculation takes into account any loss factors to be applied, the technical limitations of the
system, and any bottlenecks or physical constraint that exist [11].
While forecasting demand and managing congestions on the network rely on the input and
monitoring of operators, many of the processes that constitute NEM trade are automated
through sophisticated information technology systems.
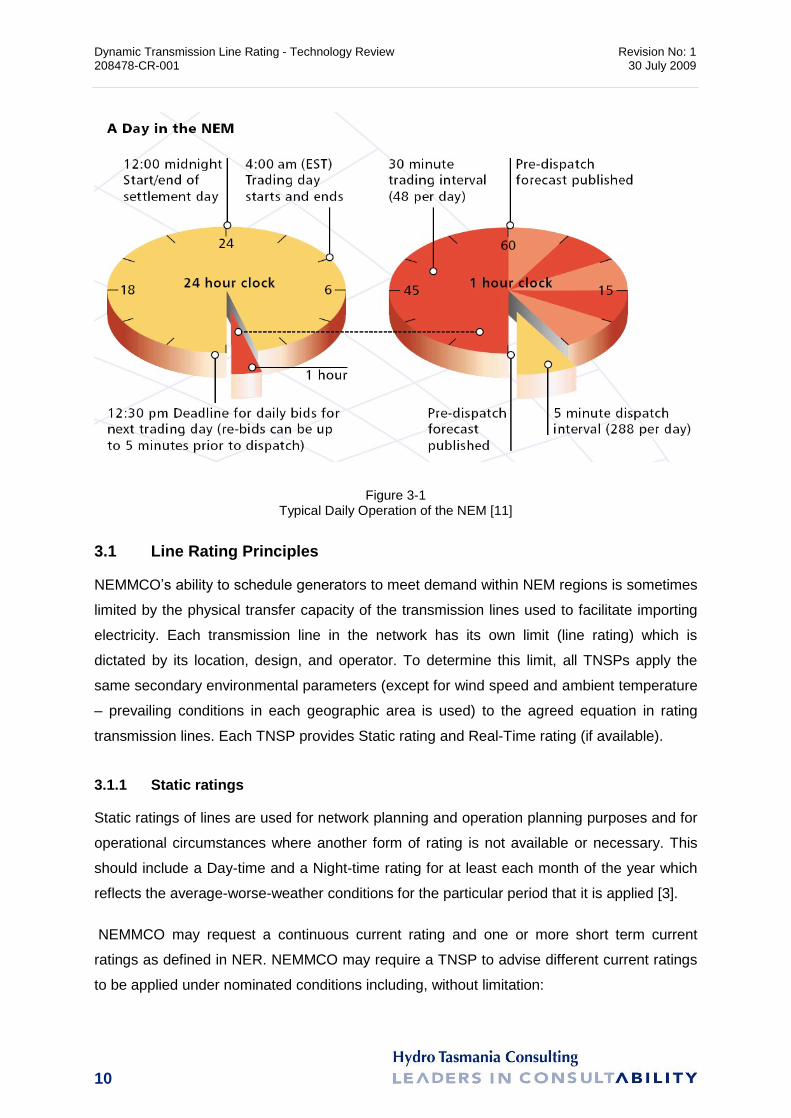
Figure 3-1 shows that each day, NEMMCO prepares and publishes a pre-dispatch schedule
that covers the supply and projected demand for all periods from the next trading interval to
the final trading interval of the next trading day.
1 From 1 July 2009 NEMMCO ceased operations. NEMMCO's roles and responsibilities have transitioned to the
Australian Energy Market Operator (AEMO).
Dynamic Transmission Line Rating - Technology Review Revision No: 1 208478-CR-001 30 July 2009
10
Figure 3-1 Typical Daily Operation of the NEM [11]
3.1 Line Rating Principles
NEMMCO�s ability to schedule generators to meet demand within NEM regions is sometimes
limited by the physical transfer capacity of the transmission lines used to facilitate importing
electricity. Each transmission line in the network has its own limit (line rating) which is
dictated by its location, design, and operator. To determine this limit, all TNSPs apply the
same secondary environmental parameters (except for wind speed and ambient temperature
� prevailing conditions in each geographic area is used) to the agreed equation in rating
transmission lines. Each TNSP provides Static rating and Real-Time rating (if available).
3.1.1 Static ratings
Static ratings of lines are used for network planning and operation planning purposes and for
operational circumstances where another form of rating is not available or necessary. This
should include a Day-time and a Night-time rating for at least each month of the year which
reflects the average-worse-weather conditions for the particular period that it is applied [3].
NEMMCO may request a continuous current rating and one or more short term current
ratings as defined in NER. NEMMCO may require a TNSP to advise different current ratings
to be applied under nominated conditions including, without limitation:
Dynamic Transmission Line Rating - Technology Review Revision No: 1 208478-CR-001 30 July 2009
11
1. Ambient weather conditions;
2. Seasons and/or times of day;
3. Ratios of the current during an emergency to the current prior to the emergency (taking
into account pre-contingent loading history where applicable); and
4. The period of loading at the nominated level.
3.1.2 Real-Time ratings
Real-Time rating (if available) is used over Static rating during favourable weather conditions
to maximise the use of the transmission system. To provide a stable value, this rating should
be calculated using the averaged measured data of weather conditions (accurate and timely
measurements of wind speed and air temperature) which characterise the entire length of the
line over a 10-minute period. The average measured data and calculated rating are provided
to an energy control centre in a suitable format to realise any potential benefits [3].
3.2 Tasmanian Rating Scheme
3.2.1 Background
Hydro Tasmania commenced a dynamic rating strategy for transmission lines in the mid
1990s. This was brought on by the need to maximize the N-1 transfer capacity of a radial
double circuit 110kV line in the event of a single circuit outage on that line during a major
outage of a local power station. As this maximised transfer capacity was required for only a
few months, this was achieved by the installation of an earthed �safety span� under the most
critical 110kV span. In the event of a trip, the remaining circuit would pick-up the entire load
until the sag approached the statutory ground clearance limit at which point the circuit would
trip. This was a relatively crude strategy and fortunately was not engaged. This short term
strategy led to the introduction of the CAT-1 system onto a number of lines deemed to be
system critical either under normal or contingent operation. Initially the scheme measured
tension only and used the span geometry to determine conductor temperature. The system
would issue an alarm should the tension drop below a designated limit. This system has
been augmented, and in some cases superseded, by the present day use of regional
weather stations to determine ambient conditions and hence available rating. The present
use of tension monitors is restricted, to provide a check for the main rating scheme and input
into the anti-icing scheme, as they signal the commencement of conductor icing.

Dynamic Transmission Line Rating - Technology Review Revision No: 1 208478-CR-001 30 July 2009
12
In 2005, ownership of these weather stations was transferred to Transend Networks Pty Ltd
(Transend), Tasmania�s network asset owner and system operator.
3.2.2 Static Rating of Transmission lines
The selection of a particular rating is time based identified as follows:
(a) 2 Season (Seasonal Rating)
Table 3-1 Seasonal Alternate Rating in Tasmania
Season Start End
Summer (TASSUM) Start of December End of February
Winter (TASWIN) Start of March End of November
(b) Temperature Based (Locational Rating)
To accommodate the temperature based ratings, temperature zones were defined
(CENTRAL, NORTH, NORTH WEST, SOUTH, WEST and FAR NORTH WEST) and each
end of all lines is allocated a temperature zone. Ratings for transmission lines within each
zone are provided on a 5 degree incremental basis from 0 degrees to 40 degrees as Static
rating data (historical static rating2).
3.2.3 Real-Time Rating Implementation
In Tasmania, the use of weather stations to support real time transmission line ratings is a
valuable and cost effective means of maximising the utilisation of, and minimising constraints
on, the existing transmission network.
Transend maintains 15 weather stations and has 19 transmission line conductor tension
monitors on 12 transmission circuits. The real-time weather information and measured
conductor tension from these devices is telemetered from remote weather stations to
Network Operation Centres (NOCs) via Remote Terminal Units (RTUs) at substations [9].
Rating software, �TRCalc�, uses circuit and conductor definition files, solar characteristics,
and the worst measured data (lowest wind and highest ambient) from the primary and
co-primary weather stations to calculate the real-time transmission circuit ratings using an
enhanced Cigré method [9] [3]. The wind speed used in the calculation is de-rated and must 2 The historical static rating is stored in a workbook which serves as the last level of back-up for TRCalc.
Dynamic Transmission Line Rating - Technology Review Revision No: 1 208478-CR-001 30 July 2009
13
be between 0.5 and 2m/s to produce a conservative result. Together with the actual bus
voltage, the Real-Time MVA rating is provided to NEMMCO for use in the 5 minute dispatch
process.
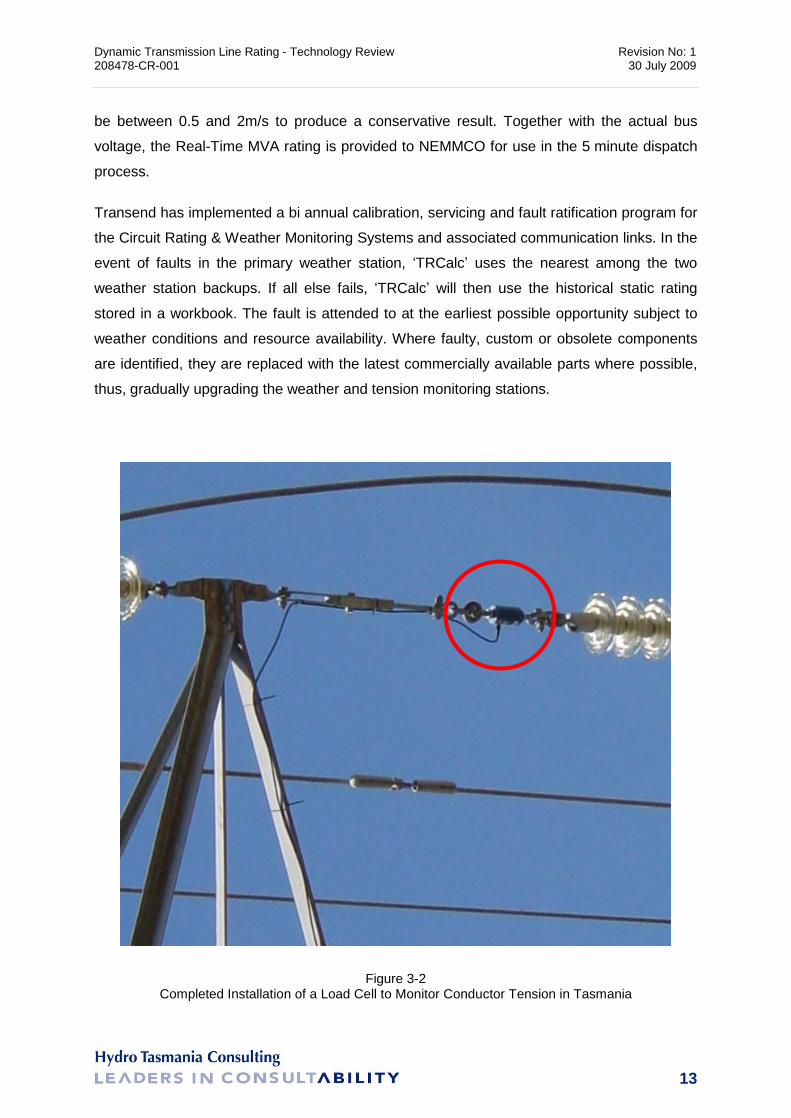
Transend has implemented a bi annual calibration, servicing and fault ratification program for
the Circuit Rating & Weather Monitoring Systems and associated communication links. In the
event of faults in the primary weather station, �TRCalc� uses the nearest among the two
weather station backups. If all else fails, �TRCalc� will then use the historical static rating
stored in a workbook. The fault is attended to at the earliest possible opportunity subject to
weather conditions and resource availability. Where faulty, custom or obsolete components
are identified, they are replaced with the latest commercially available parts where possible,
thus, gradually upgrading the weather and tension monitoring stations.
Figure 3-2 Completed Installation of a Load Cell to Monitor Conductor Tension in Tasmania
Dynamic Transmission Line Rating - Technology Review Revision No: 1 208478-CR-001 30 July 2009
14
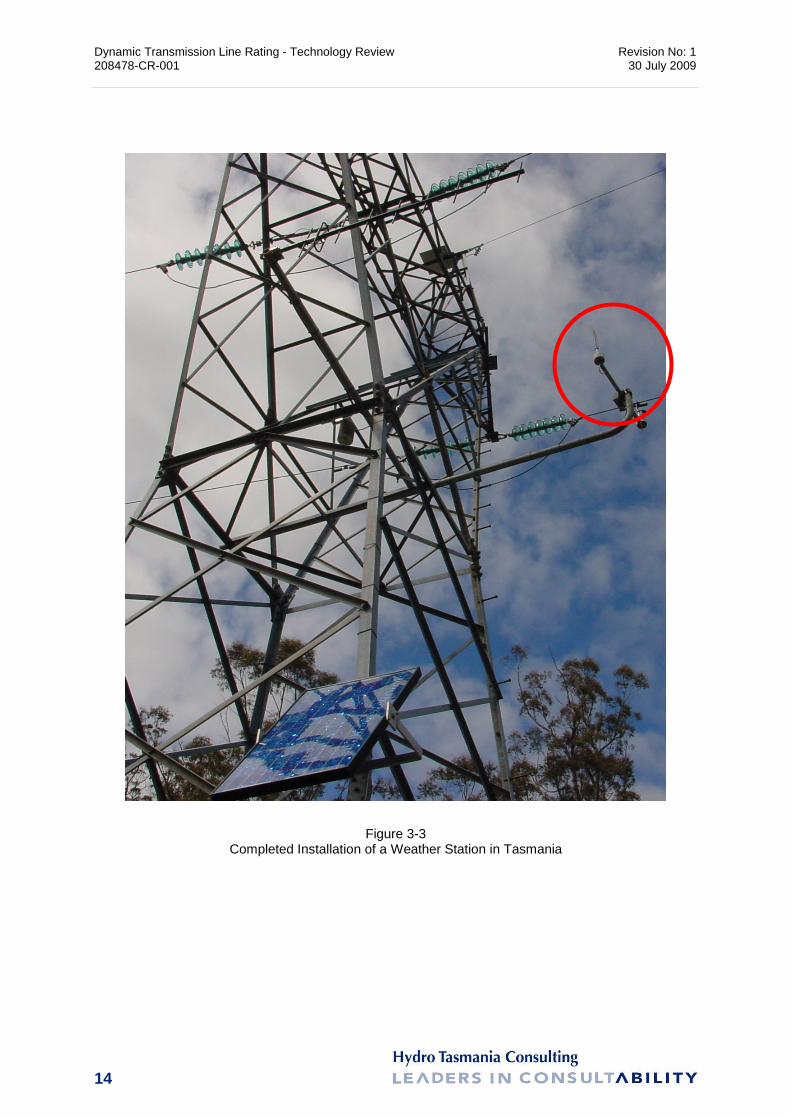
Figure 3-3 Completed Installation of a Weather Station in Tasmania
Dynamic Transmission Line Rating - Technology Review Revision No: 1 208478-CR-001 30 July 2009
15
4. New Zealand Opportunities
4.1 Background
New Zealand�s transmission networks can be viewed as narrow and longitudinal, with areas
of demand (load) commonly some distance from the areas of significant generation.
Consequently, an extensive transmission system that allows generators to transfer energy
with minimum losses has to be developed and maintained. The National Grid consists of:
A high voltage AC transmission network made up of a grid back bone of 220kV and
110kV transmission lines that supply most of the major load centres; and
An inter-island 350kV high voltage DC link that runs from Benmore in the South Island
to Haywards in the North Island. This link includes 535km of double circuit overhead
line from Benmore to Fighting Bay, a 40 km submarine cable between Fighting Bay
and Oteranga Bay across the Cook Strait, and a further 37km double circuit overhead
line between Oteranga Bay and Haywards (ref. North & South Islands Network Maps).
4.2 The New Zealand Electricity Market
In 1996, a deregulated electricity market was introduced to New Zealand. Transpower, as the
system operator, is responsible for scheduling and dispatching generation at minimum cost
according to market rules. In addition, Transpower is also responsible for providing ancillary
services to the market including the management of reserves.
The New Zealand Electricity Market (NZEM) was previously a self regulated market
overseen by M-Co and the market surveillance committee. Since September 2003, market
regulation has been conducted by the Electricity Commission (Commission). The
Commission regulates the operation of the electricity industry and markets (wholesale and
retail) in accordance with the Electricity Act and government energy policy.
4.2.1 Market Design and Operation
The operation of NZEM relies on its Scheduling, Pricing, and Dispatch (SPD) process to take
generation offers and load bids that are used to determine the optimum clearing price for
electricity at each of approximately 250 nodes in the power system.
Dynamic Transmission Line Rating - Technology Review Revision No: 1 208478-CR-001 30 July 2009
16
The Scheduling mode of SPD is used to forecast a schedule of generation for 13 to 35 hours
ahead of time. Market participants (Generators and Loads) will make offers and bids to inject
or take off power at each node in the power system. Reserves are also offered by
Generators and contracted interruptible Loads. The offers and bids are associated with half
hour trading periods.
The SPD solver takes the offers and bids for a trading period and employs a linear
programming solution to match generation to load at minimum cost, subject to constraints in
the network. Forecast information on cleared generation and load (those that have had
successful offers and bids) as well as nodal prices is then fed back to the market
participants. The participants may then choose to alter their offers and bids and resubmit
these for a subsequent scheduling solution, up to two hours ahead of dispatch.
Dispatch occurs every five minutes through formal dispatch instructions sent electronically.
There is no Automatic Governor Control (AGC) in New Zealand.
4.2.2 Right of Capacity or Dispatch
A connection to the National Grid does not result in any capacity rights for that connected
party. Existing or future congestion on the national grid will affect the ability of a generator to
deliver its energy to the market.
Connection to the grid and participation in the electricity market does not guarantee that a
generator will be dispatched at all times by the System Operator. A generator will not be
dispatched where:
o There is sufficient lower priced generation to meed demand;
o There are constraints on the power system that limit the amount of electricity that
the generating unit can produce; or
o The generator is non-compliant with the Asset Owner Performance Obligations
(AOPOs) and technical codes.
4.3 Transpower�s Line Rating Process
Transpower currently applies a fixed summer and winter ambient temperature of, 30°C and
20°C, respectively, in a long-standing proprietary formula (Latta) developed by the
New Zealand Electricity Department (NZED) to establish the seasonal ratings
(Summer/Winter) of its transmission lines [18]. Transpower reported that the results of the
Dynamic Transmission Line Rating - Technology Review Revision No: 1 208478-CR-001 30 July 2009
17
Latta rating method are slightly higher compared to the results of modern rating methods,
such as IEEE [19].
In 1996, Transpower began exploring the available DLR systems to increase the capacities
of its major lines. Transpower have investigated the use of direct temperature monitoring and
tension monitoring systems. The latter was selected to be installed on two of its lines as a
trial setup utilising the hardware and software provided by Valley Group, USA. The analysis
of the results provided by the experiment demonstrated the real capabilities of Transpower's
transmission lines. The study concluded that dynamic line rating can contribute towards
efficient control of transmission lines [14]. However, Transpower was not able to advance
further due to the inflexibility of their legacy market system software [20].
In 2010, Transpower will be introducing additional shoulder seasonal (spring/autumn) ratings
across all transmission lines. Region specific line ratings are also planned to be applied.
Dynamic line rating will be trialled in one of its transmission routes in 2012.
4.4 Possible Opportunities
Dynamic line ratings are normally higher than static ratings and have the following
advantages:
1. Although it may require accurate prediction of values up to a day ahead, dynamic
ratings allow considerable market benefit due to more optimal generation dispatch
calculations.
2. When dynamic normal ratings are available, Transpower may easily ascertain that
normal load levels higher than the static rating do not require action, since the load
does not surpass the dynamic rating.
3. When dynamic emergency ratings are available, low probability, post-contingency
loads that exceed static emergency ratings may be less than dynamic emergency
ratings, thus avoiding the need for Transpower�s intervention to reduce load.
To gain the benefits of implementing dynamic line ratings, Transpower would need to focus
on overcoming constraints introduced by the current market processes and related software.
Some of the issues that need to be addressed would include:
1. Market process
Dynamic Transmission Line Rating - Technology Review Revision No: 1 208478-CR-001 30 July 2009
18
a. For pre-dispatch schedules, forecast weather information could be used by
employing a suitable tool for wind forecasting (Similar to wind generation
dispatch)
b. Temperature is telemetered to Transpower for use in dispatch time frame.
Therefore, for the 2-hour gate closure, combinations of forecast and
telemetered/local temperatures could be used.
It should be noted that the only case for weather input would be to change risk/security
criteria during storms. This is probably best done manually as at present.
2. Market software
Processing of dynamic rating information was not possible in the previously used market
software. This issue may now be addressed with the aid of the new market software, as
it can be designed to accommodate variable line rating data.
3. Existing line rating calculation tools in SCADA/EMS (Overload Calculation Tools)
a. Tools need updating to incorporate variable dynamic inputs of temperature
b. The calculations have to be circuit specific
c. Instead of 2 seasons or 4 seasons, the tools should be able to handle dynamic
data � e.g. temperature data of every time interval
d. Engines suitable for handling large amounts of data
e. Error checking / data validation
4. Accommodation of variable line rating during dispatch
In dealing with variable line rating during the dispatch time frame and sudden changes in
wind, fast acting monitoring tools in the DLR hardware, and similar processes as used
for wind generation need to be considered for the implementation of dynamic line rating.
5. Implications for market participants over longer time scales.
Variable transmission line ratings would require market participants to develop a more
sophisticated understanding of available transmission capacity, as ratings would have to
Dynamic Transmission Line Rating - Technology Review Revision No: 1 208478-CR-001 30 July 2009
19
be predicted using static climate data. The degree of variability would be similar to wind
generation and demand variation, and at times be coincident with it.
4.5 Implementation Considerations
Where required, existing transmission lines should be surveyed and studied to find out the
critical span upon where the sensors are to be installed.
Installation of tension monitors on selected tension structures are to be properly coordinated
and scheduled as this requires a line outage.
The cost of weather monitoring stations using standard propeller-type or cup-type
anemometers is relatively low but they can be maintenance and calibration intensive. In fact,
use of such anemometers is generally discouraged, as its reliability and accuracy decreases
with time due to wear and tear of its mechanical components. Its use is further discouraged
in areas where ice is expected to build up. The 3D ultrasonic anemometer (an expensive
alternative) offers a more reliable and accurate readings.
In general, transmission lines in rugged terrain, like that of New Zealand, may have many
changes in direction. Thus, two or more sag or tension line monitors combined with two or
more weather stations may be necessary to achieve monitoring data that is a good
representation of the entire line. Whereas, when monitoring a straight section of transmission
line using either sag or tension line monitors and a weather station, only one monitoring
location is considered necessary. [1]
In general, for short lines less than 10km, a single line section should be monitored if
weather monitoring is the only form of field data used for dynamic rating. If the station used
does not observe wind direction, the line rating should be calculated assuming a fixed wind
heading angle of between 20 and 30 degrees from the line direction [1]. For longer lines
using weather monitoring, at least two line sections should have operating weather stations.
Ideally wind direction and wind speed would be measured simultaneously at several
locations within each line section.
Dynamic Transmission Line Rating - Technology Review Revision No: 1 208478-CR-001 30 July 2009
20
5. References
1 Probabilistic and Predictive Circuit Thermal Rating Technology. Electric Power Research
Institute (EPRI), Palo Alto, CA: 2006. 1012409
2 Increased Power Flow Through Transmission Circuits: Overhead Line Case Studies and
Quasi-Dynamic Rating. Electric Power Research Institute (EPRI), Palo Alto, CA: 2006.
1012533.
3 TNSP Operational Line Ratings (Draft). February 2009
4 Transpower Transmission Code (Preliminary Issue). 4 March 2009
5 Guide for Selection of Weather Parameters for Bare Overhead Conductor Ratings. CIGRE
WG.B2.12, 2006. No.299
6 The ThermalRate System: A Solution for Thermal Uprating of Overhead Transmission Lines.
Power Technology, April 2004, Newsletter Issue 95.
7 Deb, Anjan K., Powerline Ampacity System � Theory, Modeling, and Applications. CRC
Press, 2000
8 Strategic Energy Research - Dynamic Circuit Thermal Line Rating. Public Interest Energy
Research (PIER), California Energy Commission, 1999. P600-00-036
9 Circuit Monitoring and Weather Monitoring System. Transend Networks Pty, Hobart
Tasmania, 2007. TNM-SY-808-0221
10 Holbert, K.E. and Heydt GT, Prospects for Dynamic Transmission Circuit Ratings. Arizona
State University, Arizona, USA
11 An Introduction to Australia�s National Electricity Market. National Electricity Market
Management Company Limited (NEMMCO), 2005. Australia
12 2008 Statement of Opportunities for National Electricity Market. National Electricity Market
Management Company Limited (NEMMCO), 2007. Australia
13 National Electricity Rules Version 28. Australian Energy Market Commission (AEMC), 2009.
Australia
Dynamic Transmission Line Rating - Technology Review Revision No: 1 208478-CR-001 30 July 2009
21
14 Raniga, J.K.; Rayudu, R.K. Dynamic rating of transmission lines-a New Zealand experience.
Power Engineering Society Winter Meeting, 2000. IEEE Volume 4, Issue , 2000
Page(s):2403 - 2409 vol.4
15 Increased Power Flow Guidebook � Increasing Power Flow in Transmission and Substation
Circuits. Electric Power Research Institute (EPRI), Palo Alto, CA: 2005. 1010627.
16 Instrumentation for Increasing Power Flow: Needs, Concepts, Feasibility, and Benefits.
Electric Power Research Institute (EPRI), Palo Alto, CA: 2005. 1012534.
17 Morgan, V.T., The Loss of Tensile Strength of Hard-drawn conductors by Annealing in
Service. IEEE Transactions, Power Engineering Society. 1978.
18 Khot, Milind. Use of Probabilistic Temperatures in the Calculation of Transmission Line
Ratings using PLS-CADD. Transpower.
19 Transpower Response to EC Request for Information (EC letter dated 12 October 2005).
Transpower. 10 November 2005.
20 Simpson, Bob. Line Rating Review. Transpower. 12 June 2009.
The information contained in this document has been carefully compiled but Hydro Tasmania Consulting takes no responsibility for any loss or liability of any kind suffered by any party, not being the intended recipient of this document, in reliance upon its contents whether arising from any error or inaccuracy in the information or any default, negligence or lack of care in relation to the preparation of the information in this document.


23
Appendices

Dynamic Transmission Line Rating - Technology Review Revision No: 1 208478-CR-001 30 July 2009
A-1
Appendix. A Existing Dynamic Line Rating Technologies
There is a distinction to be made between the real-time monitoring and dynamic rating of
overhead lines. Real-time monitoring is easy, but less useful in guiding operator actions than
providing dynamic ratings.
The following are examples of line monitors typically used by various utilities in facilitating
their dynamic rating schemes:
A.1 Conductor Temperature Sensors
The accuracy of conductor temperature sensors depends on how close the measured
conductor temperature at one spot is to the average line section temperature. It has been
observed that conductor temperature can vary significantly along its length due to large
variations in wind speed and direction.
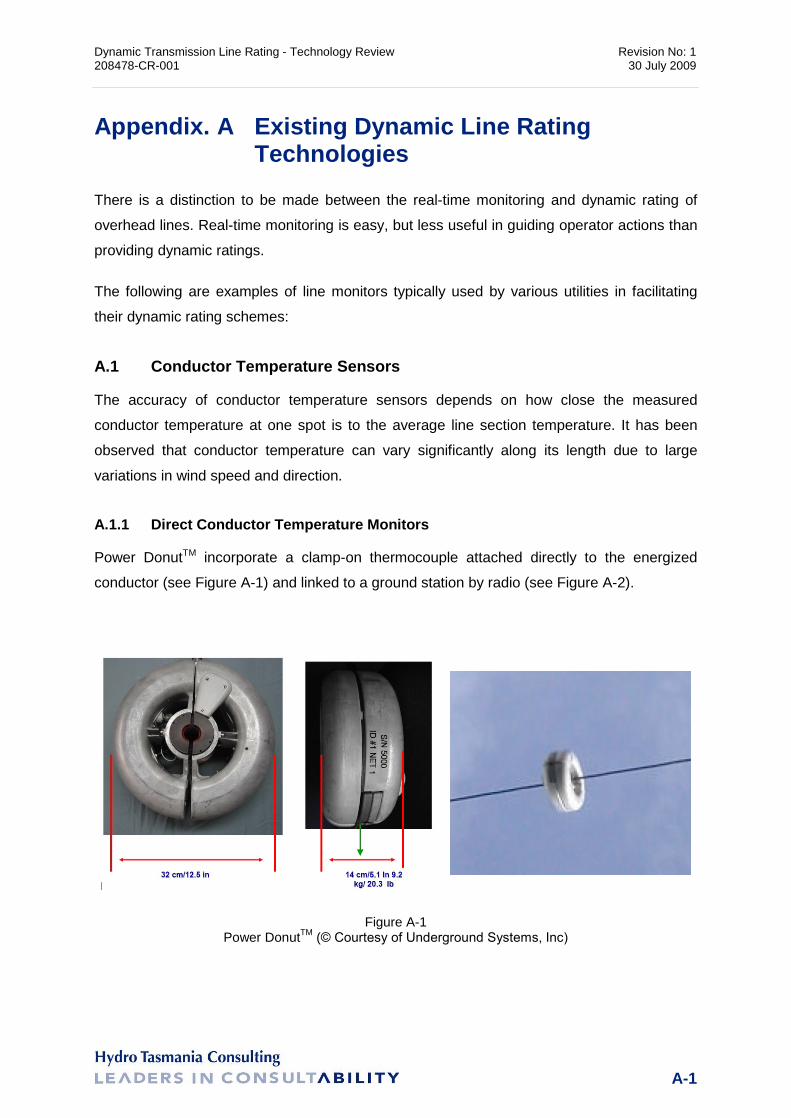
A.1.1 Direct Conductor Temperature Monitors
Power DonutTM incorporate a clamp-on thermocouple attached directly to the energized
conductor (see Figure A-1) and linked to a ground station by radio (see Figure A-2).
Figure A-1 Power DonutTM (© Courtesy of Underground Systems, Inc)
Dynamic Transmission Line Rating - Technology Review Revision No: 1 208478-CR-001 30 July 2009
B-2
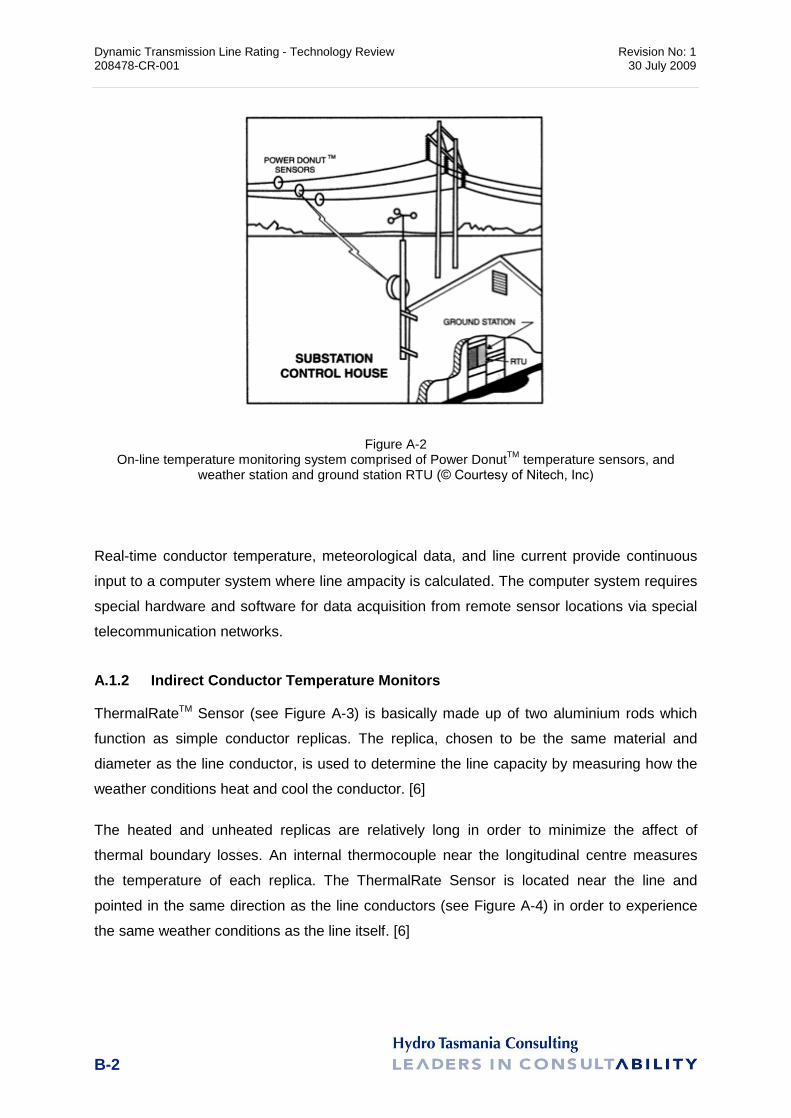
Figure A-2 On-line temperature monitoring system comprised of Power DonutTM temperature sensors, and
weather station and ground station RTU (© Courtesy of Nitech, Inc)
Real-time conductor temperature, meteorological data, and line current provide continuous
input to a computer system where line ampacity is calculated. The computer system requires
special hardware and software for data acquisition from remote sensor locations via special
telecommunication networks.
A.1.2 Indirect Conductor Temperature Monitors
ThermalRateTM Sensor (see Figure A-3) is basically made up of two aluminium rods which
function as simple conductor replicas. The replica, chosen to be the same material and
diameter as the line conductor, is used to determine the line capacity by measuring how the
weather conditions heat and cool the conductor. [6]
The heated and unheated replicas are relatively long in order to minimize the affect of
thermal boundary losses. An internal thermocouple near the longitudinal centre measures
the temperature of each replica. The ThermalRate Sensor is located near the line and
pointed in the same direction as the line conductors (see Figure A-4) in order to experience
the same weather conditions as the line itself. [6]

Dynamic Transmission Line Rating - Technology Review Revision No: 1 208478-CR-001 30 July 2009
A-3
Figure A-3 ThermalRateTM Sensor
Figure A-4 Completed Installation ThermalRateTM Sensor
Dynamic Transmission Line Rating - Technology Review Revision No: 1 208478-CR-001 30 July 2009
B-4
A.2 Weather stations
Weather stations generally measure wind speed and direction, air temperature, solar
intensity, and rain. Knowing the line current and weather conditions in real-time, the
conductor temperature near the weather monitor can be calculated in real-time. [2]
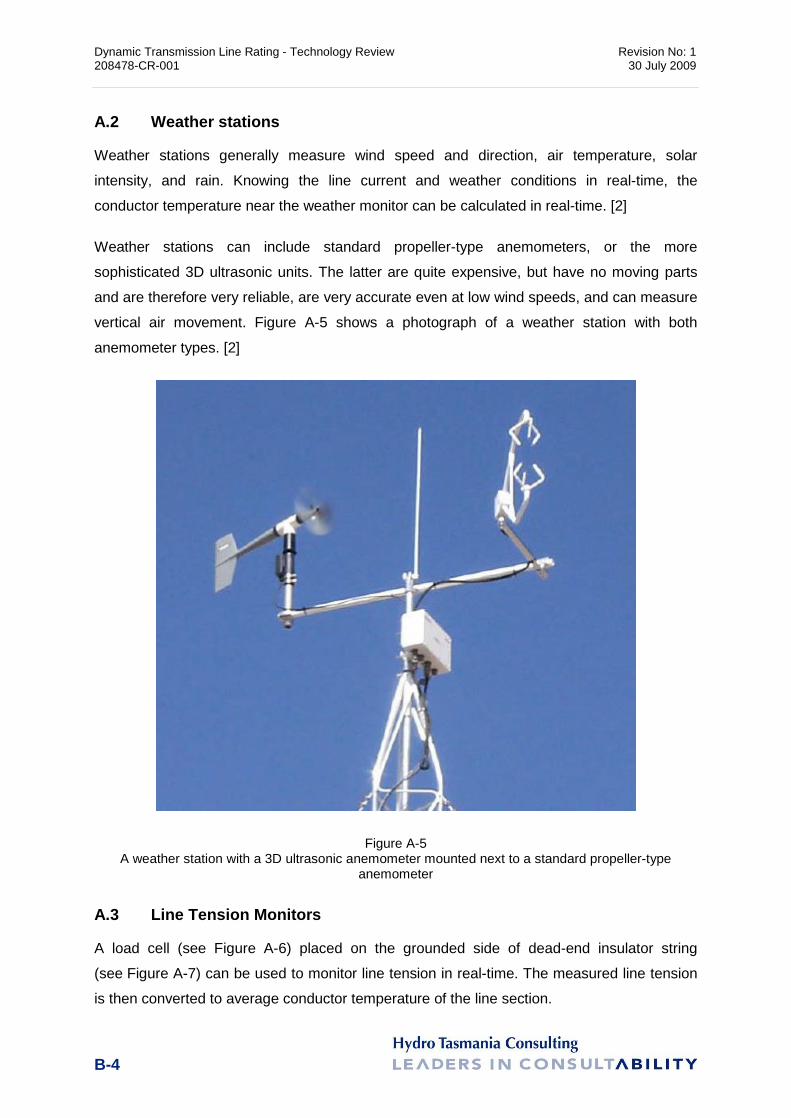
Weather stations can include standard propeller-type anemometers, or the more
sophisticated 3D ultrasonic units. The latter are quite expensive, but have no moving parts
and are therefore very reliable, are very accurate even at low wind speeds, and can measure
vertical air movement. Figure A-5 shows a photograph of a weather station with both
anemometer types. [2]
Figure A-5 A weather station with a 3D ultrasonic anemometer mounted next to a standard propeller-type
anemometer
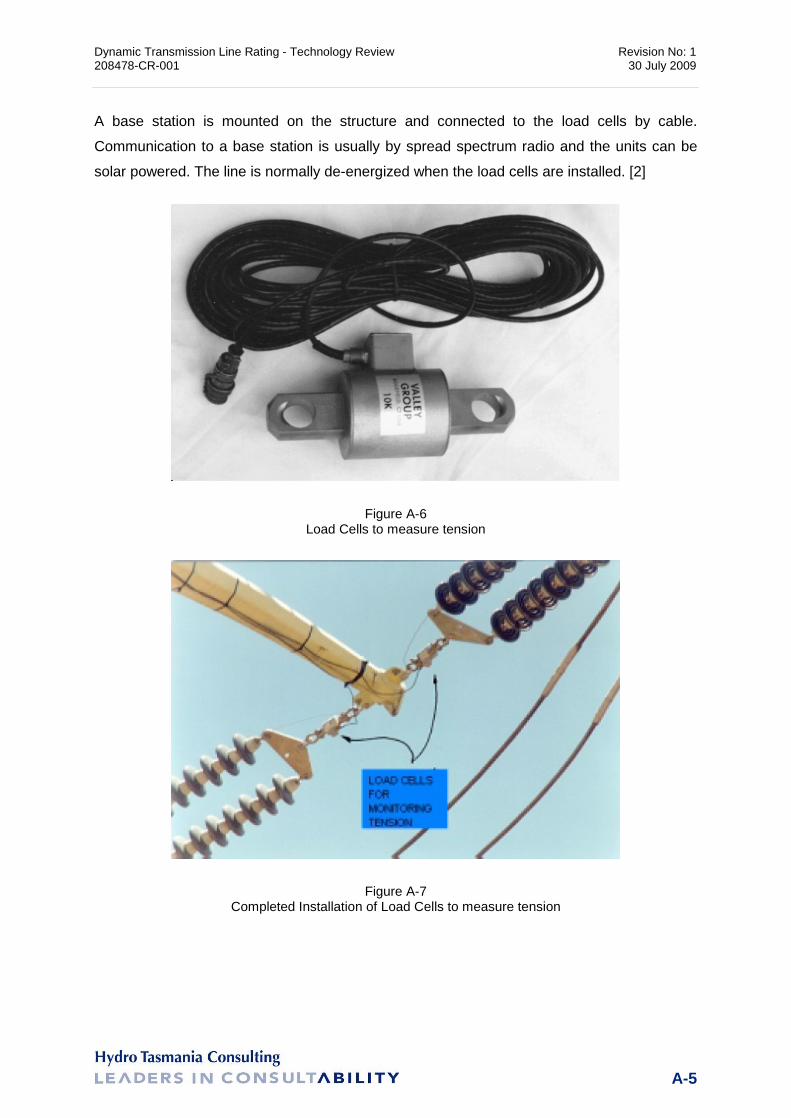
A.3 Line Tension Monitors
A load cell (see Figure A-6) placed on the grounded side of dead-end insulator string
(see Figure A-7) can be used to monitor line tension in real-time. The measured line tension
is then converted to average conductor temperature of the line section.
Dynamic Transmission Line Rating - Technology Review Revision No: 1 208478-CR-001 30 July 2009
A-5
A base station is mounted on the structure and connected to the load cells by cable.
Communication to a base station is usually by spread spectrum radio and the units can be
solar powered. The line is normally de-energized when the load cells are installed. [2]
Figure A-6 Load Cells to measure tension
Figure A-7 Completed Installation of Load Cells to measure tension
Dynamic Transmission Line Rating - Technology Review Revision No: 1 208478-CR-001 30 July 2009
B-6
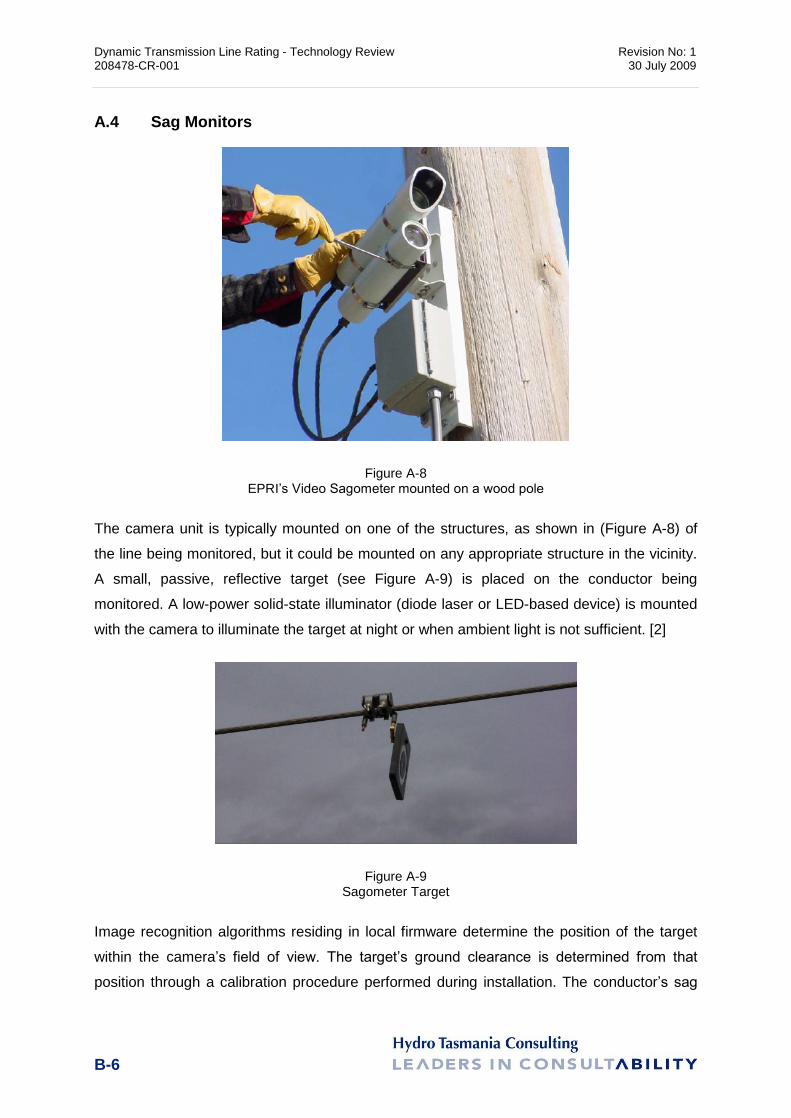
A.4 Sag Monitors
Figure A-8 EPRI�s Video Sagometer mounted on a wood pole
The camera unit is typically mounted on one of the structures, as shown in (Figure A-8) of
the line being monitored, but it could be mounted on any appropriate structure in the vicinity.
A small, passive, reflective target (see Figure A-9) is placed on the conductor being
monitored. A low-power solid-state illuminator (diode laser or LED-based device) is mounted
with the camera to illuminate the target at night or when ambient light is not sufficient. [2]
Figure A-9 Sagometer Target
Image recognition algorithms residing in local firmware determine the position of the target
within the camera�s field of view. The target�s ground clearance is determined from that
position through a calibration procedure performed during installation. The conductor�s sag
Dynamic Transmission Line Rating - Technology Review Revision No: 1 208478-CR-001 30 July 2009
A-7
and/or ground clearance is determined at any point along the span from the catenary
equation. [2]
The systems can be powered by solar-cell/battery arrangements, or by standard AC
distribution power if available at the site. The systems, including the targets, can readily be
installed on energised EHV transmission lines, or readily removed and relocated. [2]
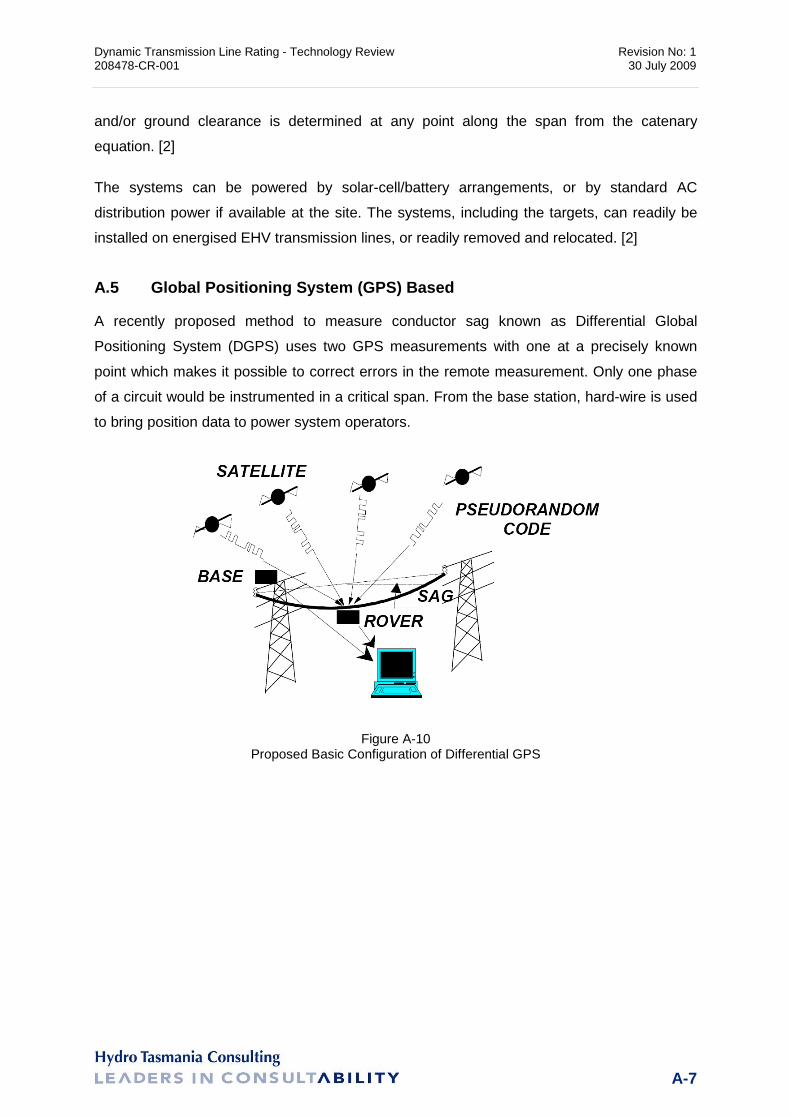
A.5 Global Positioning System (GPS) Based
A recently proposed method to measure conductor sag known as Differential Global
Positioning System (DGPS) uses two GPS measurements with one at a precisely known
point which makes it possible to correct errors in the remote measurement. Only one phase
of a circuit would be instrumented in a critical span. From the base station, hard-wire is used
to bring position data to power system operators.
Figure A-10 Proposed Basic Configuration of Differential GPS