Embed Size (px)
Citation preview
Dynamic Light-Scattering Studies of Internal Motions in DNA. 111. Evidence for Titratable
Joints Associated with Bound Polycations
S. C . LIN, J. C . THOMAS,* S. A. ALLISON, and J. M. SCHURR, Department of Chemistry, University of Washington, Seattle,
Washington 98195
Synopsis
Dynamic light-scattering techniques are employed to study the internal Brownian motions of a commercial calf thymus DNA, clean and contaminated $29 DNAs, and a clean $29 DNA with bound spermidine as a function of pH. The Rouse-Zimm model parameters of both calf thymus and contaminated $29 DNAs differ substantially from those of clean $29 DNA in the neutral-pH region. However, this difference is largely removed by adding 0.01M EDTA (which has no effect on clean $29 DNA) to the calf thymus DNA sample. These findings imply the existence in that preparation of polycation contaminants, presumably basic proteins, that can substantially alter the local mechanical properties of the DNA near their binding sites. The internal motion parameters kBT/f and b of both calf thymus and contaminated $29 DNAs are found to exhibit pronounced characteristic variations between pH 8.5 and 10.5, over which range there is essentially no detectable titration to a resolution of about 1% of the base pairs. These variations, which are not observed for clean $29 DNA, are qualitatively similar to those previously reported for a $29 DNA with 21 single-strand breaks per chain. This indicates the formation of titratable joints associated with bound polycation contaminants. These basic ligands presumably facilitate local denaturation by stabilizing the titration of one or more protons on base-ring nitrogens near their binding sites. Spermidine binding up to 8547% of neutralization of the total DNA charge has only a relatively minor effect on the internal motion parameters at neutral pH in 0.01M NaCl. However on raising the pH to 10.2, the internal motion parameter k B T / f undergoes a marked decrease similar to that observed for both calf thymus and contaminated $29 DNAs and also $29 DNA with single-strand breaks. This indicates that spermidine, too, is capable of inducing titratable joints. Evidence is presented that the titratable joints associated with bound polycations on the calf thymus DNA may serve primarily as torsion joints, as was found previously for the titratable joints associated with single-strand breaks.
INTRODUCTION
Dynamical studies of the internal motions of DNA in solution by various physical techniques have proliferated rapidly in recent years. Although the results have generally been interpreted in terms of models that exhibit essentially uniform properties along the length of the DNA, certain of these studies have indicated that structural inhomogeneities may exist in some preparations, at least for periods long compared to the time scale of the
* Present address: Department of Physics, University of Waikato, Private Bag, Hamilton, New Zealand.
Biopolymers, Vol. 20,209-230 (1981) 0 1981 John Wiley & Sons, Inc. 0006-3525/81/0020-0209$02.20
210 LIN ET AL.
particular motions investigated, and that they can exert a substantial in- fluence on the internal dynamics.
In a companion paper,l hereinafter referred to as 11, it was shown for a clean viral 429 DNA (Mr = 11.5 X lo6) that the introduction of 21 single- strand breaks per chain produced no noticeable effect on the internal dy- namics, as manifested in the polarized dynamic light scattering at pH 9.45. Subsequent experiments on another preparation with even more single- strand breaks per chain have confirmed that they exert no detectable in- fluence on the internal dynamics down to pH 7.6 (unpublished results ob- tained in this laboratory by Jess Wilcoxon). However, on raising the pH to 10.0 or 10.2, still well below the critical denaturation point at pH 11.4, pronounced changes in the dynamic light-scattering data, and in the Rouse-Zimm model parameters obtained from those data, were observed for the nicked DNA (in comparison to the intact DNA).' This clearly in- dicates the introduction of titratable joints, or structural inhomogeneities, into the nicked DNA in the region near pH 10. A requirement for titration of protons on the ring nitrogens to form such structural inhomogeneities is also apparent from these findings, and is in accord with the models ad- vanced by Printz and Von Hippe12 and McConnell and Von HippeP to account for the pH dependence of tritium exchange kinetics in intact DNAs.
Dielectric dispersion studies of high-molecular-weight DNAs as a function of the degree of contamination by proteins (at about the 1% level) indicate that decreasing the amount of initially bound protein by factors of 2-4 results in small (--15-30%), but significant, decreases in the dielectric relaxation time, which monitors primarily the longest coil-deformation mode of the extended coil-envelope of the DNA.4 In view of the rather small amount of protein initially present, this suggests that structural in- homogeneities induced by the protein may have a disproportionately large effect on the internal dynamics.
On a much shorter time scale ( t S 100 nsec), the existence of torsion joints, or torsionally weak regions, separated on the average by about 86 base pairs, has been inferred from a detailed theoretical analysis5 of existing literature data for the decay of the fluorescence polarization anisotropy of ethidium cation bound to calf thymus DNA. In fact, that theoretical study was originally motivated by some of the dynamic light-scattering observations reported below, which provide evidence for titratable torsion joints in certain DNA preparations, especially calf thymus DNA. Such work has already been presented at meetings: and parts of it were described in detail in the Ph.D. thesis of S. C. Lin.7 Experiments currently in progress in this laboratory on the decay of the fluorescence polarization anisotropy of ethidium cation bound to a clean 429 DNA are, interestingly, giving a rather different result, which follows very closely the theoretical expectation for a continuous elastic filament with no widely spaced torsion soft-spots or joints.8 This is in accord with the dynamic light-scattering results de- scribed in 11 for similar intact clean 429 DNAs, which were remarkably
LIGHT-SCATTERING STUDIES OF DNA. I11 211
insensitive to pH and EDTA, indicating an absence of any significant effects due to adsorbed basic proteins or polycations in those preparations.
The present work is concerned in large part with the observation of a particular class of pH-dependent mechanical inhomogeneities, or titratable joints, in certain DNA preparations, which are devoid of single-strand breaks, and the demonstration that such titratable joints can be approxi- mately simulated by polycationic ligands, such as spermidine, bound to clean 429 DNA. Although several accounts of the condensation of DNA under low-ionic-strength conditions by spermidine _ _ and other polycations have been r e ~ o r t e d , ~ - l ~ and evidence for a B-A conformational transition noted,16 the effect of bound spermidine on the Rouse-Zimm model pa- rameters of the DNA under somewhat higher ionic strength conditons, where precipitation or collapse do not occur, is reported here for the first time.
A striking feature of these data and those that we have obtained previ- ously for solutions of different NaCl concentration is how little the internal motions of this clean 429 DNA are affected by rather large changes in its small-ion environment at neutral pH. Our conclusion that the mechanical rigidity of DNA a t netural pH is only weakly dependent on ionic environ- ment is discussed in detail in a companion paper,17 where it is compared with other data in the literature with generally satisfactory agreement, except in the case of recently reported flow-birefringence data. There it is also shown to agree with recent theoretical results of Odijk18 for the polyelectrolyte contribution to the local stiffness, or persistence length, of DNA, as well as with the bending theory of Manning,1g.20 after a critical error in the latter has been corrected.
MATERIALS AND METHODS
Calf thymus DNA Lot No. 35A614 was purchased from Worthington Biochemical Corp., Freehold, N.J. The method of sample preparation and the molecular-weight determination for this particular DNA have been described in a previous publication,21 hereinafter referred to as I. The molecular weight was found to be 10.2 X lo6 a t pH 11.05, and apparently increased slightly to 11.7 X lo6 at pH 11.35, then dropped to 4.7 X lo6 at pH 11.45, and to (4.0-4.4) X lo6 a t pH 12.30, indicating that this DNA de- natures abruptly near pH 11.4 and that it contains, a t most, a negligible number of single-strand breaks. The sedimentation boundaries were to- lerably sharp with a 114-314 widths of 1-2 s out of a total of 24 s.
Viscosity measurements using a Crothers-Zimm-type viscometer with a shear of about 1.6 sec-' lacked precision due to the occasional uncon- trollable formation of surface films. Nevertheless, the low-shear limiting viscosity of this calf thymus DNA at 0.01 mglml in a buffer (0.016M KzHP04 + 0.027M KH2P04) a t 25OC was found to be in the range 6-7 l.lg, slightly lower than the value estimated previously for a similar calf thymus DNA.22
212 LIN ET AL.
Dynamic light-scattering studies of this DNA were carried out at con- centrations near 0.05 mg/ml in a solvent containing 1.OM NaC1, plus 0.05M Na2C03, and, where noted, 0.01M EDTA. As described previously, all buffers were prepared using double-distilled H2O and were passed through 0.2 pm Millipore filters before introduction of the DNA.
The pH profile of the optical absorbance A260 is presented by Lin.7 A sharp rise to a peak in the absorbance at pH 11.4 confirmed the abrupt denaturation at that point.7
The A280/A260 absorbance ratio for calf thymus DNA was found to be about 0.52, below the value 0.55 reported by Liebe and Stuehr23 for a low- protein-contaminated sample of calf-thymus DNA. I t will be clear from the sequel that the A280/A260 ratio is not, for the purposes of dynamic light scattering, an especially useful indicator of the degree of contamination by bound ligands, which are most likely basic proteins in these prepara- tions.
were prepared by R. D. Holder exactly as described in paper 11. Both native and pH-denatured forms ran as single sharp bands during electrophoresis in neutral agarose gels. The $29 DNA was studied at concentrations near 0.05 mg/ml in two different solvents, one of which was 1.OM NaCl plus 0.05M NaC03 plus 0.01M EDTA, titrated to the desired pH, as described in 11. The other was 0.009M NaCl plus 0.001M sodium cacodylate pH 7.7. The lower ionic strength (10-2M) of the latter solvent was necessary to achieve binding of the spermidine at low concentrations. The choice of cacodylate, rather than phosphate or citrate, as the buffering agent was intended to minimize possible interactions between spermidine and the buffer.25 A t high pH (>9) this buffer was augmented with 0.005M Na2C03 titrated with small amounts of glacial acetic acid to obtain the desired pH. As a note of cau- tion, a further decrease of the ionic strength by a factor of 10 to 10-3M in the presence of spermidine results in a collapse of the DNA to form compact structures at spermidine concentrations near 2.5 X 10⁻⁵M.10312J3 These compact structures appear to be either rodlike, spheroidal, or toroidal in shape, as seen by electron microscopy, and exhibit a strong tendency to aggregate. A description of such compact forms of $29 DNA in the pres- ence of spermidine, and their changes near pH 10, will soon be forth- coming.
Spermidine trichloride was purchased from Sigma and checked for purity by paper chromatography using an n-butanollacetic acid/HaO (50:25:25, v/v) solvent,26 followed by ninhydrin spray. A single band was observed with Rf = 0.28 corresponding to spermidine. There was no trace of sper- mine (Rf P 0.10), so the spermidine was used without further purifica- tion.
$29 DNA samples were introduced to the spermidine by dialyzing 15 ml of a 0.05 mg/ml DNA solution against 500 ml of the 0.01M ionic strength cacodylate buffer containing spermidine at the appropriate concentration at 4°C for 48 hr with constant stirring. The total amount of spermidine
Samples of $29 DNA (M, = 11.5 X
LIGHT-SCATTERING STUDIES OF DNA. I11 213
in the dialysate was always in large excess over the amount required to completely neutralize all of the DNA phosphates, so the free spermidine concentration was essentially just that of the dialysate. Direct addition of spermidine results in some ambiguity in the free spermidine concen- tration, because the binding constant is either imprecisely known (at neutral pH) or not known at all (at high pH), and the binding curve might not re- flect a simple noncooperative equilibrium in any case. Moreover, direct addition of spermidine was observed to result in irreproducible results in some instances.
The actual extent of spermidine binding was computed using both the reported equilibrium constant27 and the electrostatic condensation theory of Manning19,20 as modified by Wilson and Bloomfield,12 with comparable results at the higher spermidine concentrations, as shown in the next sec- tion.
All DNA samples were filtered under gravity flow through unsupported 1.2 ym Millipore filters into cells that had just been thoroughly cleaned and rinsed with the similarly filtered solvent.
For dynamic light-scattering studies on the calf thymus DNA, the light source was a Spectra Physics model 165 argon-ion laser with an intracavity etalon operating in the TEMoo mode at X = 4880 A with an output power of about 250 mW. The photomultiplier tube was an ITT FW 130 with an S20 photocathode. The response of the locally constructed photocurrent amplifier was flat to better than 1% from 300 kHz to 1.6 Mz. Photocurrent autocorrelation functions for the calf thymus DNA were determined using a 400-channel Saicor 43A autocorrelator (on loan from Professor Ken Schmitz) operated in its (double) clipped mode. The developing correla- tion functions were visually monitored continuously for dust “Tyndalls” during the data-collection periods, which were as long as 30-40 min at the higher scattering angles. The occurrence of a dust particle, or Tyndall, invariably prompted a restart of the developing autocorrelation func- tion.
For studies of the 429 DNA, the light source was a Spectra Physics model 164-05 argon-ion laser (on loan from Professor James Callis) equipped with special uv optics delivering about 90 mW of power in three near-uv lines. After passing through the optical train, including a 363.8-nm spike filter (48% transmittance) in the detection optics, the effective incident uv power retained in the line at XO = 363.8 nm was approximately 20 mW. A de- scription of the train of optical elements, including lenses and apertures, employed in the near-uv scattering system has been presented previ-
As described in 11, the photomultiplier-output pulses were discriminated, amplified, and converted to TTL pulses, which were then conveyed to a 256-channel 4-bit X n digital autocorrelator of local design and construc- tion. This instrument, which will be described in greater detail elsewhere, has a two-tier 27-bit memory with an optional dust-discrimination facility that aborts the transfer of inordinately high-count-rate data from the
ously.28
214 LIN ET AL.
temporary tier to the permanent tier of memory. To prevent biasing the data, the dust-discrimination level was always set to several times the mean count rate, so that only data due to spurious scattering from anomalously large particles were actually rejected. Such a capability eliminated the need for continuous visual monitoring of the developing correlation func- tion, although a great deal of visual monitoring was, in fact, the normal operating procedure.
Correlation functions were simply force-fit to a single-exponential plus base line,
(1) as described in I and 11. Considerable effort was made to employ delay times such that the relaxation time 7 was always close to 1/8 of the total number of channels employed in the fitting process. This was generally achieved by appropriate selection of delay time and the (adjustable) final channel employed in the fitting routine. The apparent diffusion coeffi- cient was calculated from the relaxation time using the standard rela- tionl
G @ ) ( t ) = Ae- t /T + B
Dapp = 1/(27K2) (2) where K = (4rrnho) sin(8/2), n is the solvent refractive index, A0 the inci- dent wavelength, and 0 is the scattering angle. For A0 = 6328 A, n = 1.334, and for A0 = 3638 A, n = 1.348.
The circular dichroism changes associated with spermidine binding to 429 DNA were determined using a Dicrograph Mark I11 CD spectropho- tometer.
Reduction of the Light-Scattering Data
Typical intensity autocorrelation functions for calf thymus DNA were reported in I,21 and a typical near-uv photon-correlation function for 429 DNA was likewise presented in a previous communication.28 General features of the respective correlation functions, which are nearly single- exponential in any case, have been extensively discussed in both I and II,l and require no further comment here.
Typical curves of Dapp vs K2 for calf thymus DNA were reported in and for clean 29 DNA were reported in 111, as well as in an earlier commu- nication.28 As noted in 11, the curves of Dapp vs K2 for calf thymus DNA and for clean 429 DNA differ substantially, but in either case can be sat- isfactorily simulated by a Rouse-Zimm model p ~ l y m e r ~ ~ , ~ ~ with an ap- propriate choice of the three parameters: (1) subchain diffusion coefficient kBT/f, (2) root-mean-squared subchain extension b, and (3) the number N + 1 of subchains. As indicated in 11, these parameters for 429 DNA differ significantly from those for calf thymus DNA, with kBT/f being about twice as large, the characteristic subchain length b about half as large, and the number N + 1 of subchains about 3-5 times as large as the values ob- tained for calf thymus DNA in 1.OM NaC1.
LIGHT-SCATTERING STUDIES OF DNA. I11 215
As shown in I, and extended in 11, the three Rouse-Zimm model param- eters can be determined from the three parameters characterizing a curve of Dapp vs K2, namely (1) DO the (center-of-mass) translational diffusion coefficient at small K2, (2) the asymptotic plateau diffusion coefficient DpIat at large K2, and (3) the value Kk of the abscissa where Dapp = (DO + Dplat)/2 is halfway between DO and Dplat, using the following algorithm (corre- sponding to scheme I in paper I).
1. Set
kBT/ f = Dplat (3)
where Dplat can generally be read directly from the Dapp vs K 2 curve for calf thymus DNA, but should be taken to lie 2-396 above the value of Dapp at K2 = 19.1 X 1O1O cm-2 for the 429 DNAs, which approach their rather higher plateaus much more slowly.
2. Set
b2 = CIKk (4)
where C z 8 for the calf thymus DNAz1 and C g 6.75 for 429 DNA.' 3. Set
where F is a quasiconstant tabulated for various values of N + 1 and b in Table IV of paper I.21 Besides the values in that table, exact calculations described in I1 for N + 1 = 33 and b = 1130 - 1160 A, both of which are typical for 429 DNA, yield the value F = 6.8 X cm3/sec, which is very close to those computed for N = 30 and somewhat larger values of b in Table IV of paper I.21
Our subsequent discussion of these light-scattering data will be presented in terms of the experimental parameters DO, Dplat, and K$ obtained from curves of Dapp vs K 2 , and the three corresponding Rouse-Zimm model pa- rameters kBTlf = Dplat, b = (C/K;)1/2, and N + l determined according to Eqs. (3)-(5).
RESULTS AND DISCUSSION
Calf Thymus and Contaminated 429 DNA
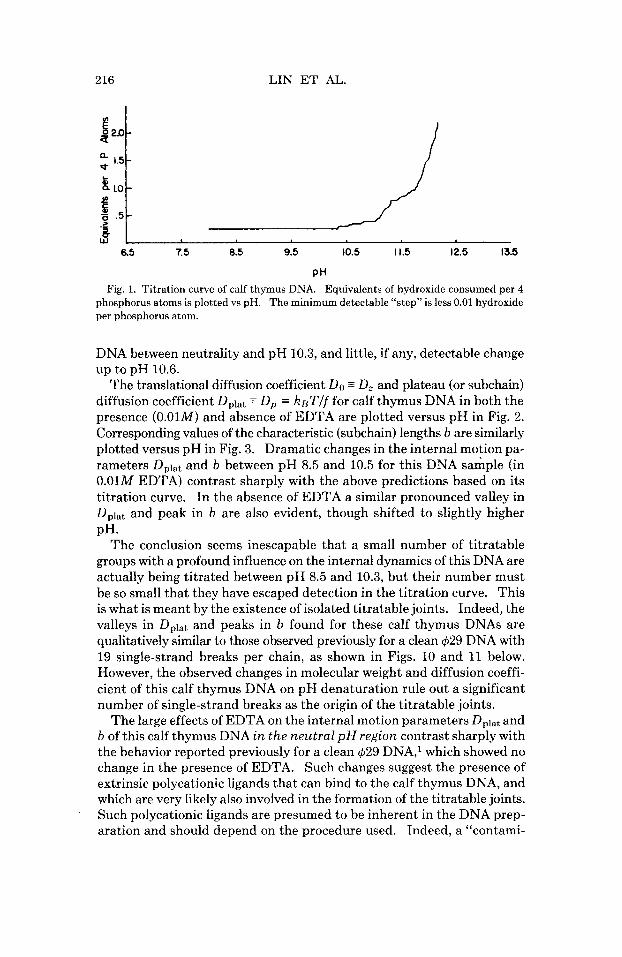
The titration curve of the present calf thymus DNA sample in 0.01M EDTA is shown in Fig. 1 and closely resembles published titration data for other calf thymus D N A s . ~ ~ Of essential significance for the present study is the fact that there is no detectable titration between the neutral region and pH 10.3, and even up to pH 10.6 the net titration amounts to less than 2.5% of the total base pairs. (pH denaturation occurs in a very sharp transition between pH 11.35 and 11.45.) On the basis of its titration curve alone one would not expect to find any pH-dependent properties of this
216
a L- 1.5-
$ L O -
f = . 5 - > -3 w
LIN ET AL.
6.5 7.5 8.5 9.5 10.5 11.5 12.5 13.5
PH Fig. 1. Titration curve of calf thymus DNA. Equivalents of hydroxide consumed per 4
phosphorus atoms is plotted vs pH. The minimum detectable “step” is less 0.01 hydroxide per phosphorus atom.
DNA between neutrality and pH 10.3, and little, if any, detectable change up to pH 10.6.
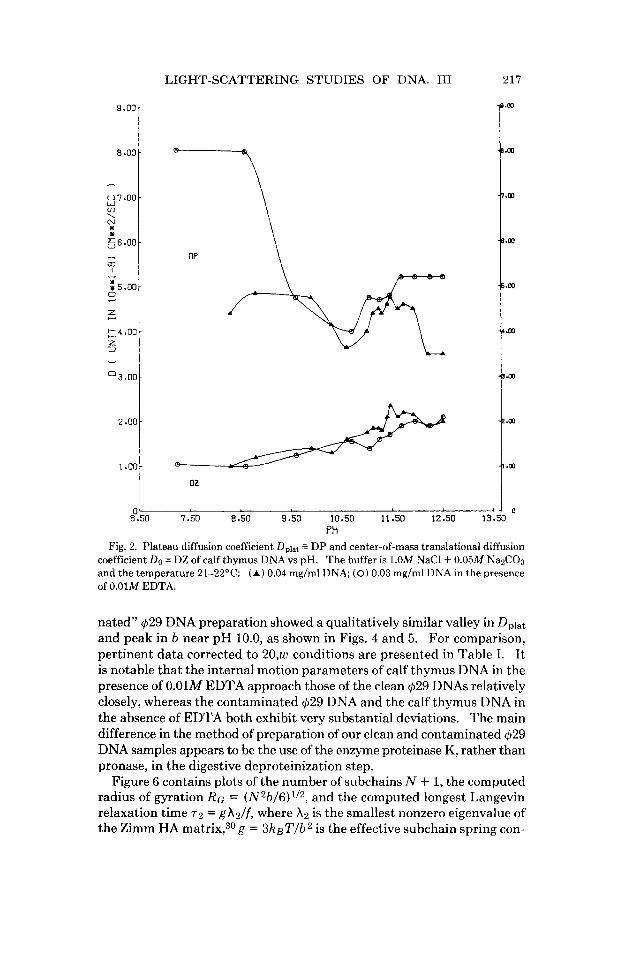
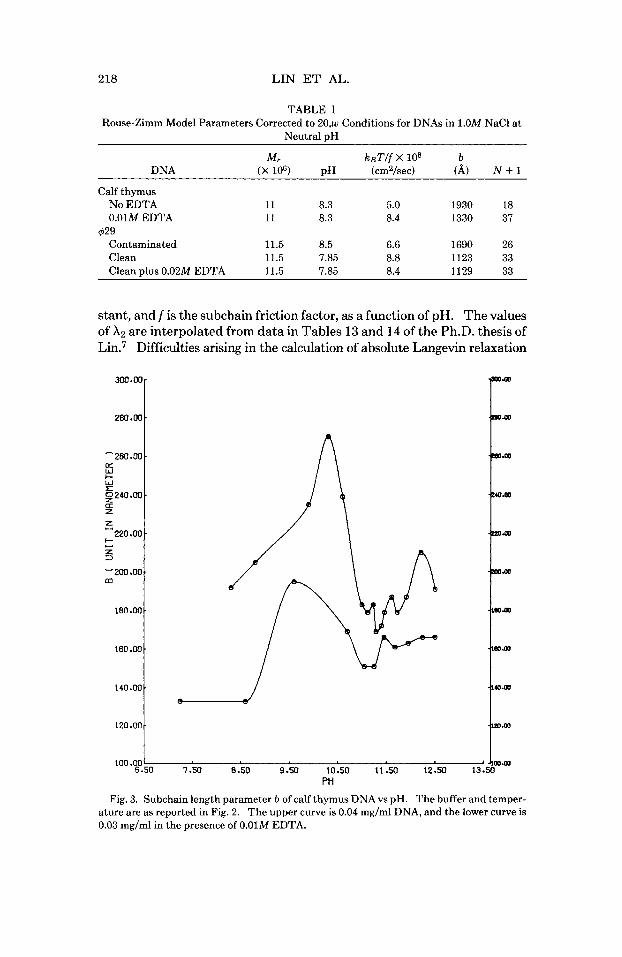
The translational diffusion coefficient DO 5 D, and plateau (or subchain) diffusion coefficient Dplat = D, = keT/f for calf thymus DNA in both the presence (0.01M) and absence of EDTA are plotted versus pH in Fig. 2. Corresponding values of the characteristic (subchain) lengths b are similarly plotted versus pH in Fig. 3. Dramatic changes in the internal motion pa- rameters Dplat and b between pH 8.5 and 10.5 for this DNA sample (in 0.01M EDTA) contrast sharply with the above predictions based on its titration curve. In the absence of EDTA a similar pronounced valley in Dplat and peak in b are also evident, though shifted to slightly higher
The conclusion seems inescapable that a small number of titratable groups with a profound influence on the internal dynamics of this DNA are actually being titrated between pH 8.5 and 10.3, but their number must be so small that they have escaped detection in the titration curve. This is what is meant by the existence of isolated titratable joints. Indeed, the valleys in Dplat and peaks in b found for these calf thymus DNAs are qualitatively similar to those observed previously for a clean $29 DNA with 19 single-strand breaks per chain, as shown in Figs. 10 and 11 below. However, the observed changes in molecular weight and diffusion coeffi- cient of this calf thymus DNA on pH denaturation rule out a significant number of single-strand breaks as the origin of the titratable joints.
The large effects of EDTA on the internal motion parameters Dplat and b of this calf thymus DNA in the neutral p H region contrast sharply with the behavior reported previously for a clean $29 DNA,l which showed no change in the presence of EDTA. Such changes suggest the presence of extrinsic polycationic ligands that can bind to the calf thymus DNA, and which are very likely also involved in the formation of the titratable joints. Such polycationic ligands are presumed to be inherent in the DNA prep- aration and should depend on the procedure used. Indeed, a “contami-
PH.
-a .m
-n.m
-1.m
-8.m
-5.m
-4.m
-3.m
LIGHT-SCATTERING STUDIES O F DNA. I11
9 .oo
8.00-
- 07.00- W v) \ c\I
* 56 .00 - - 03 - Es.00-
2
0 ..+
E4.00- z 3 - a3.00-
\
-
\ OP \
\ 7
DZ
0 6.50 7.50 8 .so 9.50 10.50 11.50 12.50 13.50
PH Fig. 2. Plateau diffusion coefficient D,lat DP and center-of-mass translational diffusion
coefficient Do = DZ of calf thymus DNA vs pH. The buffer is 1.OM NaCl + 0.05M NaZC03 and the temperature 21-22OC: (A) 0.04 mg/ml DNA; (0) 0.03 mg/ml DNA in the presence of 0.01M EDTA.
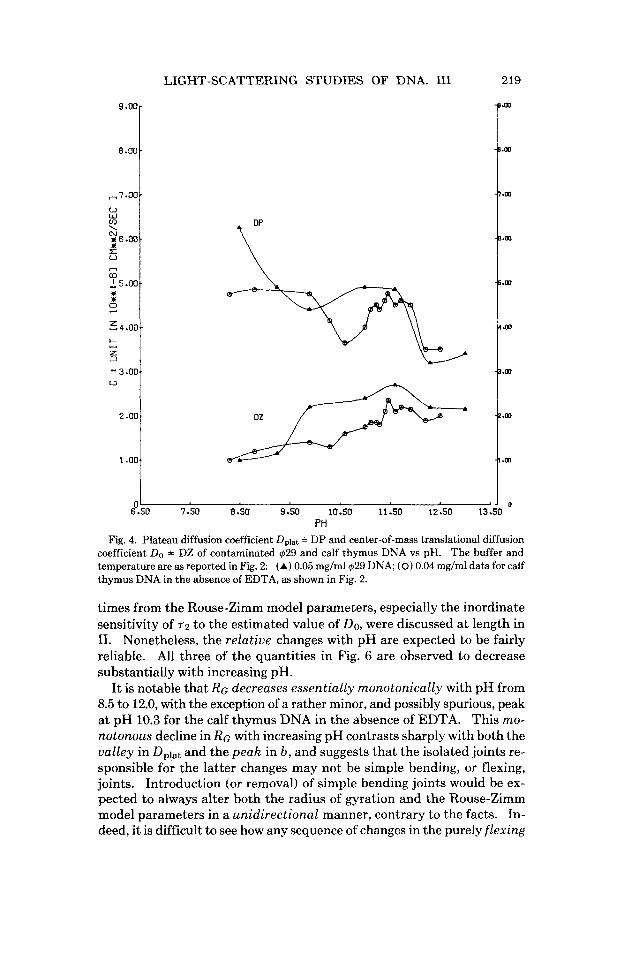
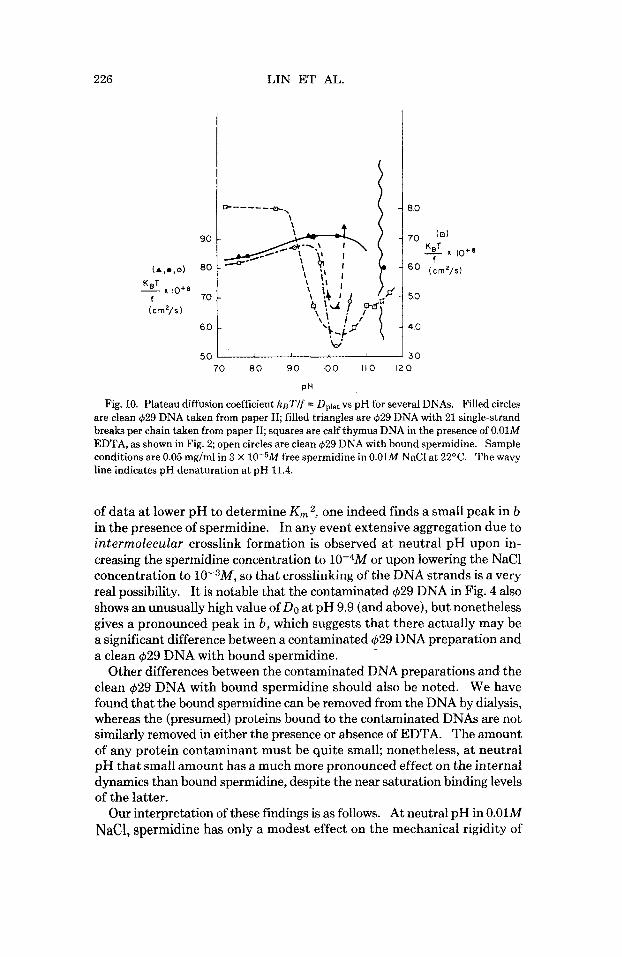
nated” $29 DNA preparation showed a qualitatively similar valley in Dplat and peak in b near pH 10.0, as shown in Figs. 4 and 5. For comparison, pertinent data corrected to 20,w conditions are presented in Table I. It is notable that the internal motion parameters of calf thymus DNA in the presence of 0.01M EDTA approach those of the clean $29 DNAs relatively closely, whereas the contaminated $29 DNA and the calf thymus DNA in the absence of EDTA both exhibit very substantial deviations. The main difference in the method of preparation of our clean and contaminated $29 DNA samples appears to be the use of the enzyme proteinase K, rather than pronase, in the digestive deproteinization step.
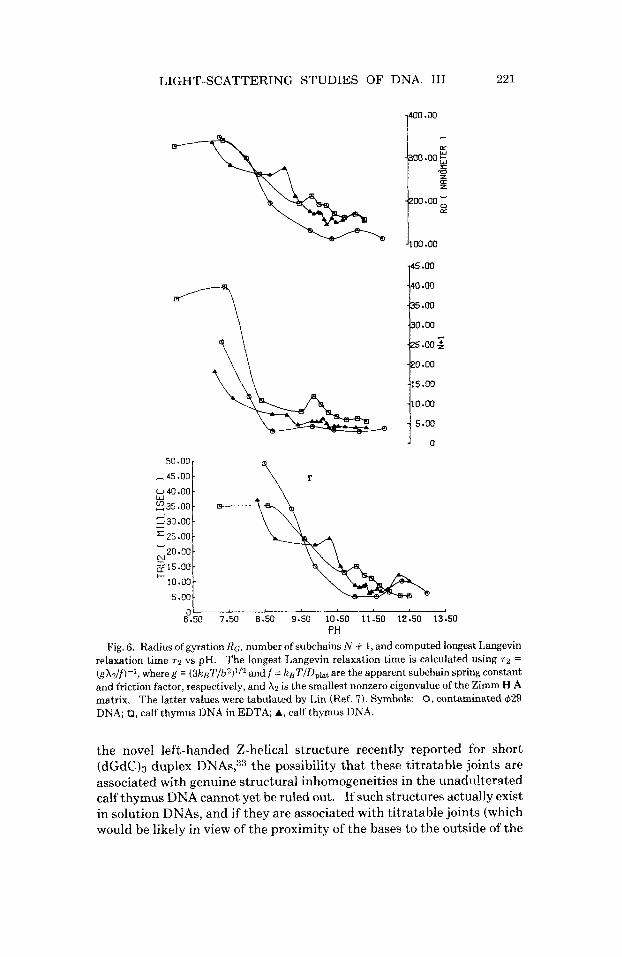
Figure 6 contains plots of the number of subchains N + 1, the computed radius of gyration RG = (N2b/6)lI2, and the computed longest Langevin relaxation time 7 2 = gX2/f, where A2 is the smallest nonzero eigenvalue of the Zimm HA mat r i~ ,~Og = 3 k ~ T I b ~ is the effective subchain spring con-
218 LIN ET AL.
- 260 .OO. Dc W c W ?= 8240.00. U z
5 !I
zo.00-
z 3
-200.00 m
180.00.
160.00-
140.00.
120.00-
100.00
TABLE I Rouse-Zimm Model Parameters Corrected to 20,w Conditions for DNAs in 1.OM NaCl at
Neutral pH
M, ksT/f X 10' b DNA (X lo6) pH (cmZ/sec) (A) N + 1
-
6.50 7.50 8.50 9.50 10150 I l k 0 12:50 13:
Calf thymus No EDTA 11 8.3 5.0 1930 18 0.01M EDTA 11 8.3 8.4 1330 37
Contaminated 11.5 8.5 6.6 1690 26 Clean 11.5 7.85 8.8 1123 33 Clean ulus 0.02M EDTA 11.5 7.85 8.4 1129 33
$29
stant, and f is the subchain friction factor, as a function of pH. The values of A2 are interpolated from data in Tables 13 and 14 of the Ph.D. thesis of
Difficulties arising in the calculation of absolute Langevin relaxation
280.00
9.00-
8.00-
-7.00- 0 w 02 \ N
E 0
a3
I I
16.00-
r l
IS .00 -
0, 5 4 . 0 0 - c z 3
"3.00-
Y
I3
2.00-
1.00-
LIGHT-SCATTERING STUDIES OF DNA. 111
-8.m
-0.m
-7.m
-0.W
-6.m
-4.m
-3.m
-2.m
-1.m
0 6 S O 7.50 8.50 9.50 10.50 11.50 12.50 13-50
PH Fig. 4. Plateau diffusion coefficient Dplat = DP and center-of-mass translational diffusion
coefficient Do = DZ of contaminated 429 and calf thymus DNA vs pH. The buffer and temperature are as reported in Fig. 2: (A) 0.05 mg/ml429 DNA; (0) 0.04 mg/ml data for calf thymus DNA in the absence of EDTA, as shown in Fig. 2.
times from the Rouse-Zimm model parameters, especially the inordinate sensitivity of 72 to the estimated value of DO, were discussed at length in 11. Nonetheless, the relative changes with pH are expected to be fairly reliable. All three of the quantities in Fig. 6 are observed to decrease substantially with increasing pH.
It is notable that RG decreases essentially monotonically with pH from 8.5 to 12.0, with the exception of a rather minor, and possibly spurious, peak at pH 10.3 for the calf thymus DNA in the absence of EDTA. This mo- notonous decline in RG with increasing pH contrasts sharply with both the valley in Dplat and the peak in b, and suggests that the isolated joints re- sponsible for the latter changes may not be simple bending, or flexing, joints. Introduction (or removal) of simple bending joints would be ex- pected to always alter both the radius of gyration and the Rouse-Zimm model parameters in a unidirectional manner, contrary to the facts. In- deed, it is difficult to see how any sequence of changes in the purely flexing
220 LIN ET AL.
180.00
160.00.
220 .oo
z
’
I 140.00
i I20 .w
100.00L J Jlmm 6.50 7.50 8.50 9.50 10.50 11.50 12.50 13.50
PH
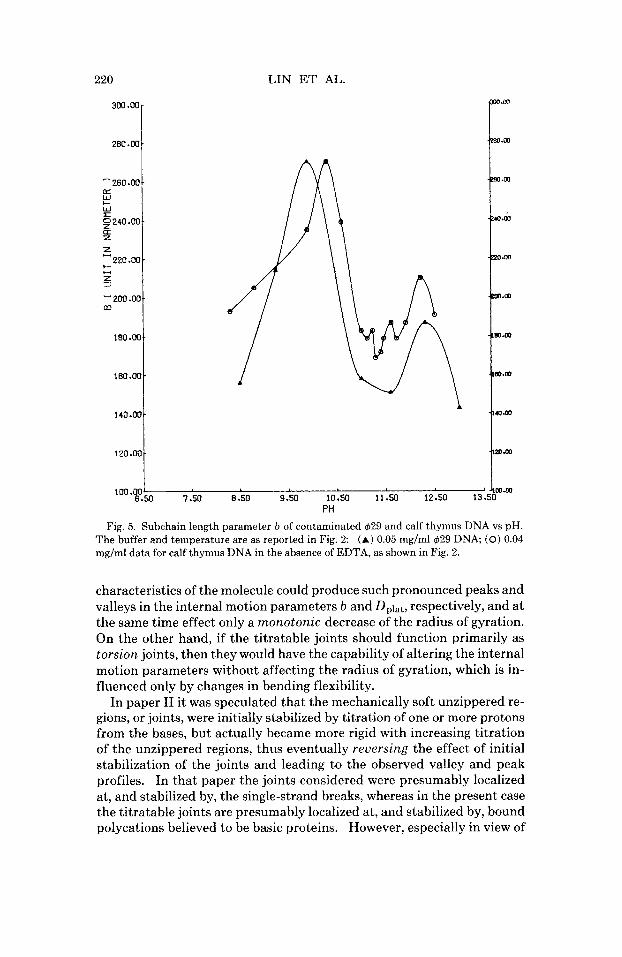
Fig. 5. Subchain length parameter b of contaminated 429 and calf thymus DNA vs pH. The buffer and temperature are as reported in Fig. 2: (A) 0.05 mg/ml429 DNA; (0) 0.04 mg/ml data for calf thymus DNA in the absence of EDTA, as shown in Fig. 2.
characteristics of the molecule could produce such pronounced peaks and valleys in the internal motion parameters b and Dplat, respectively, and a t the same time effect only a monotonic decrease of the radius of gyration. On the other hand, if the titratable joints should function primarily as torsion joints, then they would have the capability of altering the internal motion parameters without affecting the radius of gyration, which is in- fluenced only by changes in bending flexibility.
In paper I1 it was speculated that the mechanically soft unzippered re- gions, or joints, were initially stabilized by titration of one or more protons from the bases, but actually became more rigid with increasing titration of the unzippered regions, thus eventually reversing the effect of initial stabilization of the joints and leading to the observed valley and peak profiles. In that paper the joints considered were presumably localized at, and stabilized by, the single-strand breaks, whereas in the present case the titratable joints are presumably localized at, and stabilized by, bound polycations believed to be basic proteins. However, especially in view of
LIGHT-SCATTERING STUDIES OF DNA. I11
-
-
221
5.00
40 -00
-35.00
-30 .OO I
-25 .oo & -20.00
-15.00
-10.00
5.00
- 0
5o.w- -45.00-
U40.00-
35 .OO 230.00- =25.00
20.00- N 215.00- b-
10.00
W
-
5.00-
0'
~
-
-
the novel left-handed Z-helical structure recently reported for short (dGdC)s duplex DNAs,"~ the possibility that these titratable joints are associated with genuine structural inhomogeneities in the unadu!terated calf thymus DNA cannot yet be ruled out. If such structures actually exist in solution DNAs, and if they are associated with titratable joints (which would be likely in view of the proximity of the bases to the outside of the
222 LIN ET AL.
Z-helix, as well as the implicit existence of junctions between the two helix types), the absence of such titratable joints in clean $129 DNAs would imply an absence of such structural inhomogeneities in that DNA.
Although titratable joints may account for the valley and peak profiles of Dplat and b-near pH 10.2, there remains the question of the large differ- ence in the values of Dplat and b associated with the presence or absence of EDTA in the neutral region below pH 8.5 (cf. Figs. 2 and 3). It is ap- parent that the bound polycations in the absence of EDTA are able to substantially decrease Dplat and increase b in comparison to the values observed in the presence of 0.01M EDTA, which presumably interferes with the binding of the polycations to the DNA. As these rather large changes in Dplat and b are in the same respective directions as those produced by titration to pH 10.2, they suggest that simply binding the polycations or basic proteins to the DNA may produce a joint, or elastically soft region, near the binding site even at neutral pH. The onset of the valley and peak in Dplat and b, respectively, a t the higher pHs is then presumed to reflect either the introduction of new joints, or a change in the nature of the ex- isting joints, possibly a change in the mode of binding of the polycation. Perhaps one or more of its basic groups relinquishes a backbone phosphate and affiliates instead with a negative charge on a titrated base-ring nitrogen, thus stabilizing that premature titration event. This would be in accord with nmr data demonstrating complex formation between spermidine and 5’-UMP at low concentrations at pH 10.5, where the ring proton is titrat- ed.32 A local conformational transition of the DNA to a different form, such as the Z - h e l i ~ , ~ ~ is also a possibility.
Numerical values of the data presented in this section are given by Lin.7
Effect of Spermidine on the Internal Dynamics of Clean 629 DNAs
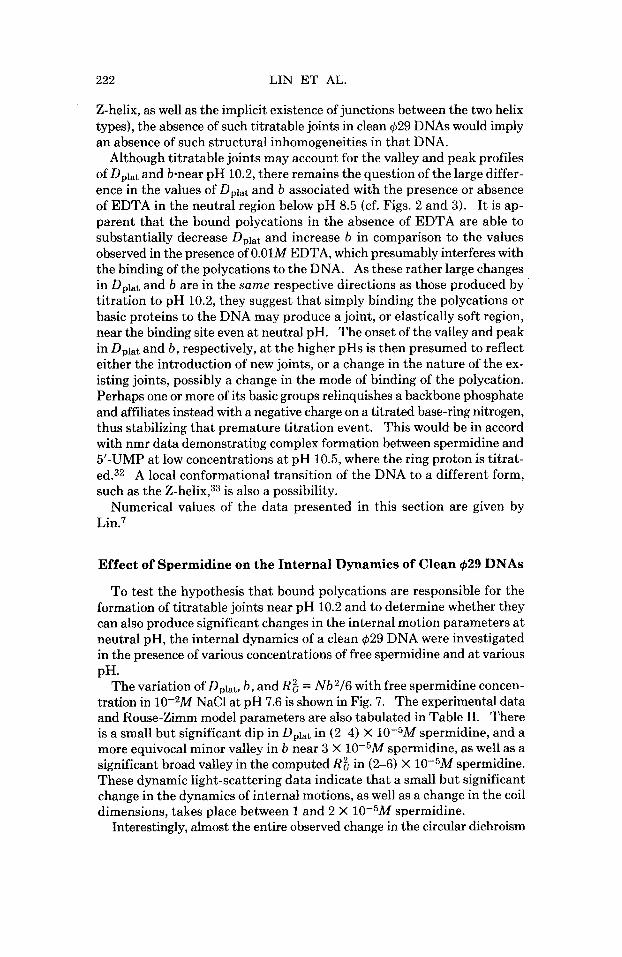
To test the hypothesis that bound polycations are responsible for the formation of titratable joints near pH 10.2 and to determine whether they can also produce significant changes in the internal motion parameters a t neutral pH, the internal dynamics of a clean $29 DNA were investigated in the presence of various concentrations of free spermidine and at various PH.
The variation of Dplat, b, and R i = Nb2/6 with free spermidine concen- tration in 10-2M NaCl at pH 7.6 is shown in Fig. 7. The experimental data and Rouse-Zimm model parameters are also tabulated in Table 11. There is a small but significant dip in Dplat in (2-4) X 10-5M spermidine, and a more equivocal minor valley in b near 3 X 10⁻⁵M spermidine, as well as a significant broad valley in the computed Rg in (2-6) X 10-5M spermidine. These dynamic light-scattering data indicate that a small but significant change in the dynamics of internal motions, as well as a change in the coil dimensions, takes place between 1 and 2 X 10⁻⁵M spermidine.
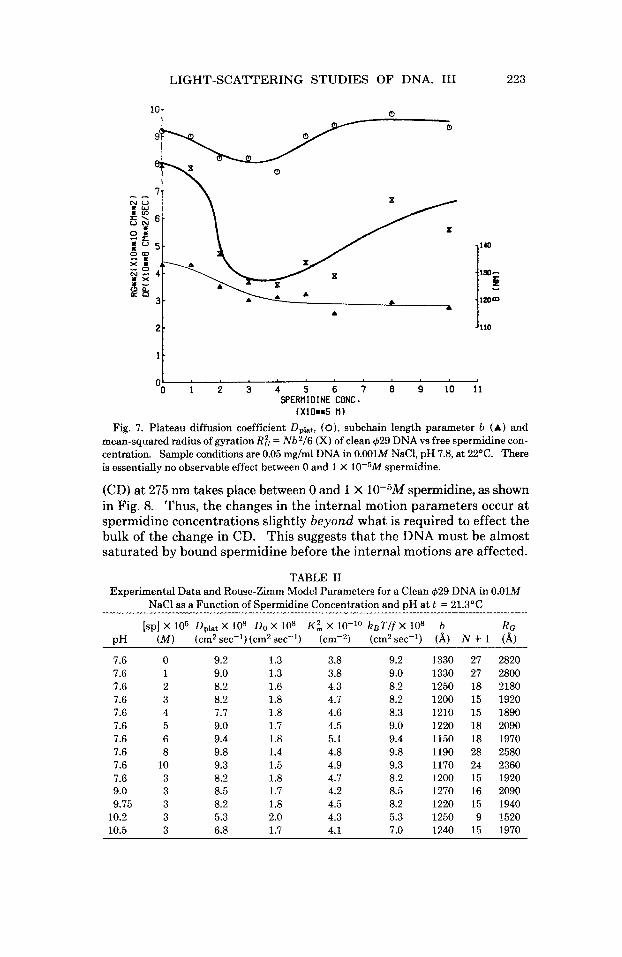
Interestingly, almost the entire observed change in the circular dichroism
LIGHT-SCATTERING STUDIES OF DNA. I11 223
A
J l l O 2t 0 1 2 3 4 5 6 7 8 9 10 1 1 OL
SPERBIDINE CONC. (XlOmK5
Fig. 7. Plateau diffusion coefficient Dplat, ( O ) , subchain length parameter b (A) and mean-squared radius of gyration Rg = Nb2/6 (X) of clean $29 DNA vs free spermidine con- centration. Sample conditions are 0.05 mg/ml DNA in 0.001M NaCl, pH 7.8, at 22OC. There is essentially no observable effect between 0 and 1 X 10⁻⁵M spermidine.
(CD) at 275 nm takes place between 0 and 1 X 10⁻⁵M spermidine, as shown in Fig. 8. Thus, the changes in the internal motion parameters occur at spermidine concentrations slightly beyond what is required to effect the bulk of the change in CD. This suggests that the DNA must be almost saturated by bound spermidine before the internal motions are affected.
TABLE I1 Experimental Data and Rouse-Zimm Model Parameters for a Clean $29 DNA in 0.01M
NaCl as a Function of Spermidine Concentration and pH at t = 21.3OC
[sp] X 105 D,lat X los Do X los K i X lo-'' kBT/f X 10' b Rc pH ( M ) (cmz sec-l) (cm2 sec-l) (cm-2) (cm2 sec-I) (8) N + 1 (A) 7.6 0 9.2 1.3 3.8 9.2 1330 27 2820 7.6 1 9.0 1.3 3.8 9.0 1330 27 2800 7.6 2 8.2 1.6 4.3 8.2 1250 18 2180 7.6 3 8.2 1.8 4.7 8.2 1200 15 1920 7.6 4 7.7 1.8 4.6 8.3 1210 15 1890 7.6 5 9.0 1.7 4.5 9.0 1220 18 2090 7.6 6 9.4 1.8 5.1 9.4 1150 18 1970 7.6 8 9.8 1.4 4.8 9.8 1190 28 2580 7.6 10 9.3 1.5 4.9 9.3 1170 24 2360 7.6 3 8.2 1.8 4.7 8.2 1200 15 1920 9.0 3 8.5 1.7 4.2 8.5 1270 16 2090 9.75 3 8.2 1.8 4.5 8.2 1220 15 1940
10.2 3 5.3 2.0 4.3 5.3 1250 9 1520 10.5 3 6.8 1.7 4.1 7.0 1240 15 1970
224 LIN ET AL.
1 .m
44 .I 0 1 2 3 4 5 6 7 0
SPERHIDINE CONC. (X10mu5 HI
Fig. 8. Relative circular dichroism of clearr429 DNA vs free spermidine concentration. The ratio of the circular dichroism a t a given spermidine concentration to that for clean 429 DNA with no spermidine is plotted on the ordinate. The entire observable effect takes place between 0 and 1 X 10⁻⁵M spermidine.
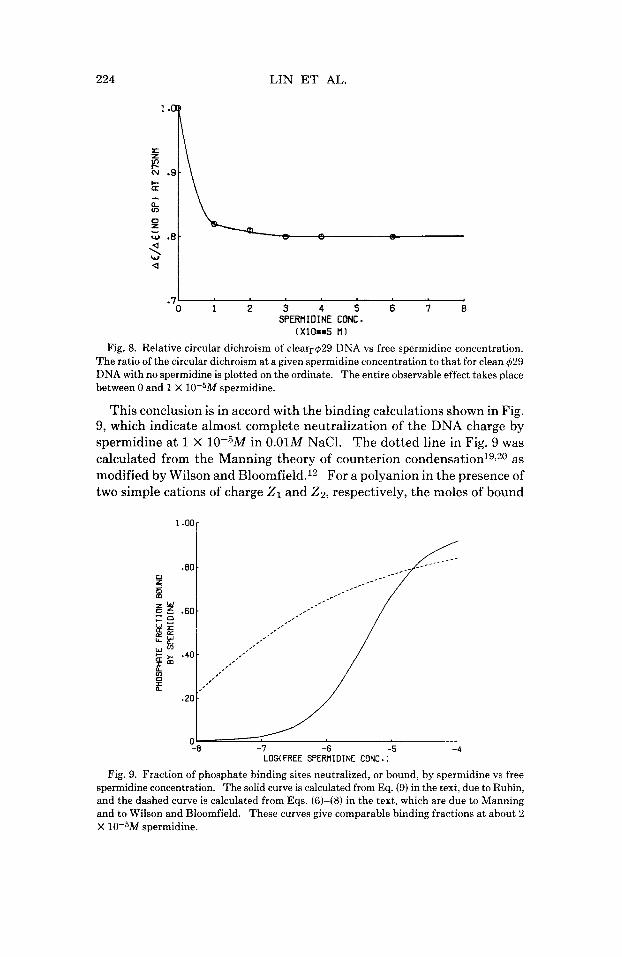
This conclusion is in accord with the binding calculations shown in Fig. 9, which indicate almost complete neutralization of the DNA charge by spermidine at 1 X lO+M in 0.01M NaC1. The dotted line in Fig. 9 was calculated from the Manning theory of counterion c o n d e n s a t i ~ n l ~ , ~ ~ as modified by Wilson and Bloomfield.12 For a polyanion in the presence of two simple cations of charge 21 and 2 2 , respectively, the moles of bound
1 .ooy
Fig. 9. Fraction of phosphate binding sites neutralized, or bound, by spermidine vs free spermidine concentration. The solid curve is calculated from Eq. (9) in the text, due to Rubin, and the dashed curve is calculated from Eqs. (6)-(8) in the text, which are due to Manning and to Wilson and Bloomfield. These curves give comparable binding fractions a t about 2 X 10⁻⁵M spermidine.
LIGHT-SCATTERING STUDIES OF DNA. I11 225
counterions per mole of total polyelectrolyte charge, denoted by 81 and 02,
are determined by solving the following simultaneous equations:
(7)
where K is the Debye screening parameter, b is the linear charge separation (1.7 for DNA), 6 = q2/ekBTb, where q is the protonic charge and c is the bulk dielectric constant, e = 2.718, and c1 and c2 are the molar concentra- tions of the free counterions. The bound counterion volumes V p 1 and V p 2
are given by
where N A = 6.02 X u, is the stoichiometric factor of counterion j , and primes denote coions. The bound volumes of Na+ and spermidine (2 = 3) were found to be 647 and 1563 cm3/mol P, respectively.
The solid line in Fig. 9 was computed using the experimental binding equation of R ~ b i n ~ ~ :
(9)
where K = 2.40 X 10⁴M-l is his reported binding constant for association of spermidine with DNA at an ionic strength of 10-2M. It is notable that these binding values are quite comparable above a free spermidine con- centration of 1 X 10⁻⁵M, but at much lower spermidine concentrations the Manning theory predicts significantly higher binding levels than the simple equilibrium formulation of Rubin. The original spermidine binding data are not of sufficient precision t o allow an accurate assessment of the de- viation from ordinary noncooperative association behavior, so the com- parative validity of the Manning theory (which is effectively highly an- ticooperative) and an ordinary association equilibrium cannot be reliably assayed.
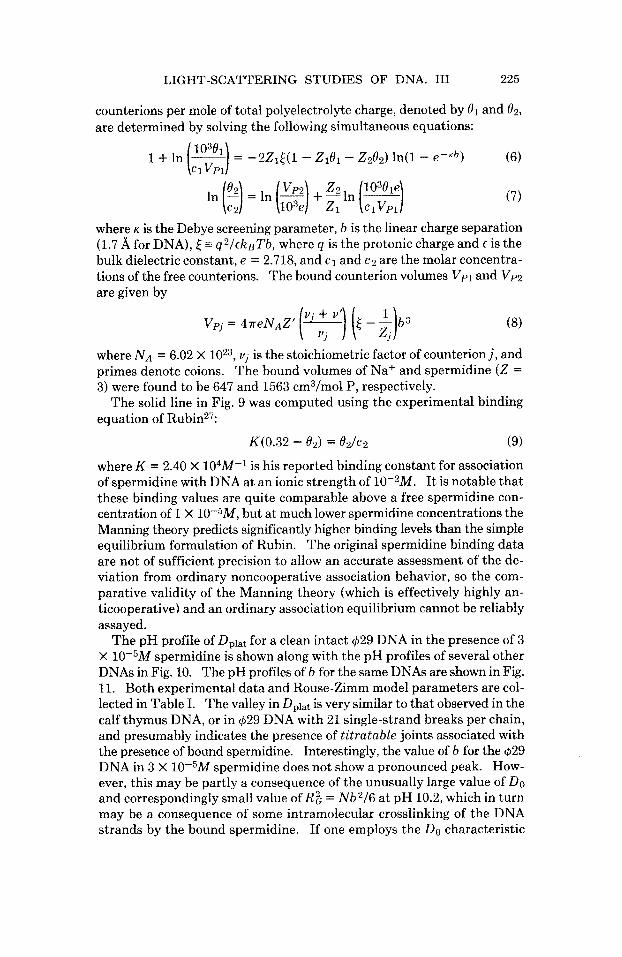
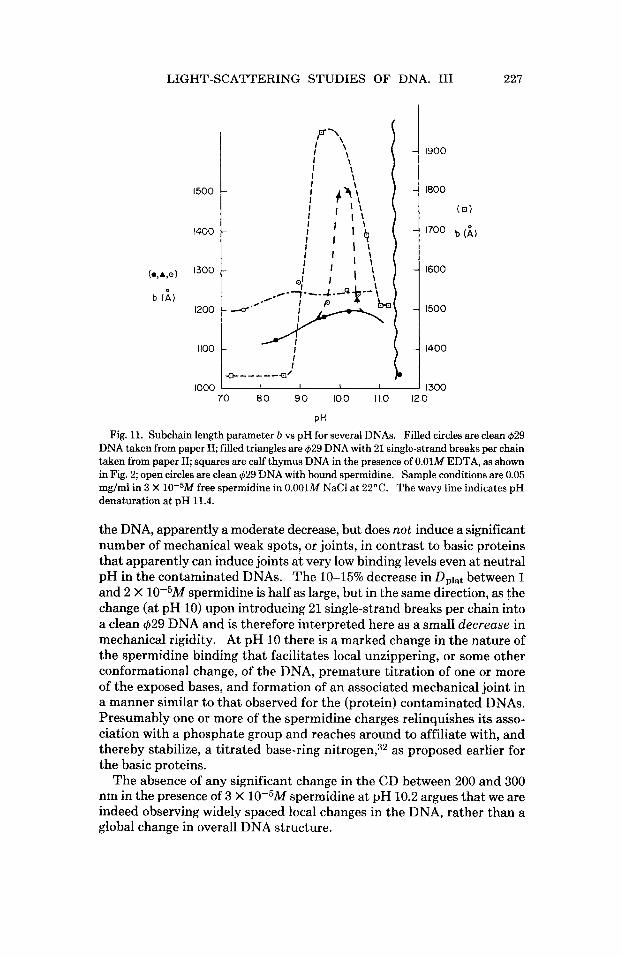
The pH profile of Dplat for a clean intact (629 DNA in the presence of 3 X 10⁻⁵M spermidine is shown along with the pH profiles of several other DNAs in Fig. 10. The pH profiles of b for the same DNAs are shown in Fig. 11. Both experimental data and Rouse-Zimm model parameters are col- lected in Table I. The valley in Dplat is very similar t o that observed in the calf thymus DNA, or in (629 DNA with 21 single-strand breaks per chain, and presumably indicates the presence of titratable joints associated with the presence of bound spermidine. Interestingly, the value of b for the $29 DNA in 3 X 10⁻⁵M spermidine does not show a pronounced peak. How- ever, this may be partly a consequence of the unusually large value of Do and correspondingly small value of Rg = N b 2 / 6 at pH 10.2, which in turn may be a consequence of some intramolecular crosslinking of the DNA strands by the bound spermidine. If one employs the DO characteristic
K(0.32 - 82) = 82/~2
226 LIN ET AL.
90
( c m2/s
60
5.0
'\ 9\ I \ i' I
d
70 80 90 100 I10 I 2 0
PH
Fig. 10. Plateau diffusion coefficient ksT/f = Dplat vs pH for several DNAs. Filled circles are clean 429 DNA taken from paper 11; filled triangles are 429 DNA with 21 single-strand breaks per chain taken from paper II; squares are calf thymus DNA in the presence of 0.01M EDTA, as shown in Fig. 2; open circles are clean 429 DNA with bound spermidine. Sample conditions are 0.05 mg/ml in 3 X 10⁻⁵M free spermidine in 0.01M NaCl at 22°C. The wavy line indicates pH denaturation at pH 11.4.
of data at lower pH to determine K , 2, one indeed finds a small peak in b in the presence of spermidine. In any event extensive aggregation due to intermolecular crosslink formation is observed at neutral pH upon in- creasing the spermidine concentration to 10-4M or upon lowering the NaCl concentration to 10-3M, so that crosslinking of the DNA strands is a very real possibility. It is notable that the contaminated $29 DNA in Fig. 4 also shows an unusually high value of DO at pH 9.9 (and above), but nonetheless gives a pronounced peak in b , which suggests that there actually may be a significant difference between a contaminated $29 DNA preparation and a clean $29 DNA with bound spermidine.
Other differences between the contaminated DNA preparations and the clean 429 DNA with bound spermidine should also be noted. We have found that the bound spermidine can be removed from the DNA by dialysis, whereas the (presumed) proteins bound to the contaminated DNAs are not similarly removed in either the presence or absence of EDTA. The amount of any protein contaminant must be quite small; nonetheless, at neutral pH that small amount has a much more pronounced effect on the internal dynamics than bound spermidine, despite the near saturation binding levels of the latter.
Our interpretation of these findings is as follows. At neutral pH in 0.01M NaC1, spermidine has only a modest effect on the mechanical rigidity of
-
LIGHT-SCATTERING STUDIES OF DNA. I11 227
1500
1400
(O,A,Q) I3O0
P I I I I
I I I I I
1900
1800
(0)
I7O0 b (i)
1600
1500
1400
1300 I I I I 1000 ... I 70 8 0 90 100 110 120
PH
Fie. 11. Subchain length Darameter b vs DH for several DNAs. Filled circles are clean d29 DNA taken from paper 11; filled triangles are 629 DNA with 21 single-strand breaks per chain taken from paper 11; squares are calf thymus DNA in the presence of 0.01M EDTA, as shown in Fig. 2; open circles are clean $29 DNA with bound spermidine. Sample conditions are 0.05 mg/ml in 3 X 10⁻⁵M free spermidine in 0.001M NaCl at 22°C. The wavy line indicates pH denaturation at pH 11.4.
the DNA, apparently a moderate decrease, but does not induce a significant number of mechanical weak spots, or joints, in contrast to basic proteins that apparently can induce joints at very low binding levels even at neutral pH in the contaminated DNAs. The 10-15% decrease in Dplat between 1 and 2 X 10⁻⁵M mermidine is half as larce. but in the same direction. as the change (at pH 10) upon introducing 21 single-strand breaks per chain into a clean 429 DNA and is therefore interpreted here as a small decrease in mechanical rigidity. A t pH 10 there is a marked change in the nature of the spermidine binding that facilitates local unzippering, or some other conformational change, of the DNA, premature titration of one or more of the exposed bases, and formation of an associated mechanical joint in a manner similar to that observed for the (protein) contaminated DNAs. Presumably one or more of the spermidine charges relinquishes its asso- ciation with a phosphate group and reaches around to affiliate with, and thereby stabilize, a titrated base-ring nitrogen,32 as proposed earlier for the basic proteins.
The absence of any significant change in the CD between 200 and 300 nm in the presence of 3 X lO+M spermidine at pH 10.2 argues that we are indeed observing widely spaced local changes in the DNA, rather than a global change in overall DNA structure.
228 LIN ET AL.
A remaining question is whether these pH-induced joints in DNA with bound spermidine are primarily bending or torsion joints. The decrease in R g a t pH 10.2 suggests that bending might be involved, but the situation is ambiguous here because the possibility of intramolecular crosslinks, which would also cause 8 decrease in R& cannot be ruled out and, in fact, is rather likely. This question is best attacked by studying the torsional Brownian motions of DNA in the presence of spermidine as a function of pH using the decay of the fluorescence polarization anisotropy of the rigidly bound ethidium Such experiments with both spermidine and basic proteins are currently in progress in this laboratory, and the answer will, hopefully, soon be forthcoming.
Effect of Spermidine Binding and Ionic Environment on the Mechanical Properties of DNA at Neutral pH
In the presence of 3 X 10VM spermidine the fraction of phosphate charges neutralized by bound spermidine is 85-90% (see Fig. 9), and the internal motion parameters LIP,, = keTlf and b are changed from their values in the absence of spermidine by factors of 0.89 and 0.90, respectively. Because the change in Dplat is in the same direction as that caused by sin- gle-strand breaks a t pH 10.2,l it is inferred that spermidine binding leads to a slight decrease in the bending and/or torsion rigidity.
The quantity R i is directly proportional to the persistence length a of an ideal wormlike coil, as is-apparent from the well-known r e 1 a t i d 4
a ( L 2 ) z 6R:; 2 2aL
where ( L 2 ) is the mean-squared end-to-end distance and L is the contour length. The change in RK by a factor of 0.46 should be regarded only as an approximate lower bound for the corresponding change in persistence length, or bending rigidity, because the spermidine very likely forms in- tramolecular crosslinks that would act to reduce Rc independently of any change in local molecular rigidity. Despite the systematic error (due in part to the uncertain procedure for extrapolating to K 2 = 0) discussed at length in paper 11, which renders our reported Do values 20% too high and the corresponding R(; values 20% too low, the ratios of R;; values under different conditions are expected to be substantially correct within limits set by our 10-20% random errors in Do.
These small relative changes in internal motion parameters related to the rigidity of the DNA induced by spermidine binding are similar to those reported previously for the same DNA as a function of NaCl concentra- t i ~ n . ' , : ~ ~ From data presented in Table I1 of paper 11, it is easily verified that Dplat and b change by factors of 0.94 and 0.84, respectively, as the NaCl concentration is increased from 0.01 to 1.0M. The computed R:; changes by a factor of 0.88 f 0.3 over the same range. Although the uncertainty in this latter factor is rather large, we consider it most unlikely that it could be as small as that (0.46) associated with the binding of spermidine.
LIGHT-SCATTERING STUDIES OF DNA. 111 229
These rather small changes in D,lat and b suggest that the local bending and/or torsion rigidity does not change much with either spermidine binding or large change in ionic strength. The comparatively small change in Rg between 0.01 and 1.OM NaCl argues directly that the change in per- sistence length, or bending rigidity, is rather small, amounting to a factor of <1.10-1.20 for this DNA. Such a small change lies well below the re- ported experimental estimate of H a r r i n g t ~ n ~ ~ and the corresponding theoretical estimate of Manning,20 both of which claim a change in per- sistence length by a factor of 2.6 between 1.0 and 0.01M NaC1. However, Odijk has reached a substantially different theoretical conclusion.18 His prediction that the persistence length should change by only a factor of 1.07 between 1.0 and 0.01M NaCl is in substantial agreement with all of the results obtained here. A detailed discussion of this dilemma is deferred to a companion paper. There it is shown that Manning’s theoretical esti- matez0 suffers from a subtle geometrical error, and when corrected yields the value 1.07 for the change in persistence length due to polyelectrolyte effects. Moreover, numerous sedimentation and viscosity data from the literature are analyzed and shown to yield upper bounds for the relative changes in a ranging from 1.15 to 1.6. As part of this factor must represent the change in the long-range electrostatic contribution to excluded volume and coil expansion,l8 a rather small change in local rigidity appears to be compatible with all of these data. Certainly any change in persistence length between 1.0 and 0.01M NaCl is restricted to be less than a factor of about 1.5, which, as noted above, is well below some recent estimates.
To date our results on the internal motions of DNA at neutral p H indi- cate a general insensitivity to single-strand breaks, G-C content, and now small-ion environment. The effect of temperature is currently under in- vestigation.
The authors are grateful to Professor Ken Schmitz for his generous loan of the Saicor au-
This work was supported in part by Grant PCM 78-12136 from the National Science tocorrelator and to R. Douglas Holder for preparing the 429 DNA.
Foundation.
References
1. Thomas, J. C., Holder, R. D., Allison, S. A. & Schurr, J. M. (1980) Biopolymers 19,
2. Printz, M. P. & Von Hippel, P. H. (1968) Biochemistry 7,3194-3206. 3. McConnell, B. & Von Hippel, P. H. (1970) J . Mol. Bid. 50,297-316. 4. Sakamoto, M., Hayakawa, R. & Wada, Y. (1979) Biopolymers 18,2769-2782. 5. Allison, S. A. & Schurr, J. M. (1979) Chem. Phys. 41,35-59. 6. Lin, S. C. & Schurr, J. M. (1978) Abstracts of the Sixth International Biophysics Con-
7. Lin, S. C. (1978) Ph.D. thesis, Department of Chemistry, University of Washington,
8. Thomas, J. C., Allison, S. A., Appellof, C. J. & J. M. Schurr (1980)Biophys. Chem. 12,
9. Gosule, L. C. & Schellman, J. A. (1976) Nature 259,333-335.
1451-1474.
gress, Kyoto, Japan, September 3-9, p. 320.
Seattle.
177-188.
230 LIN ET AL.
10. Gosule, L. C. & Schellman, J. A. (1978) J. Mol. Biol. 121,311-326. 11. Chattoraj, D. K., Gosule, L. C. & Schellman, J. A. (1978) J. Mol. Biol. 121,327-337. 12. Wilson, R. W. & Bloomfield, V. A. (1979) Biochemistry 18,2192-2196. 13. Gosule, L. C., Chattoraj, D. K. & Schellman, J . A. (1978) Aduances in Polyamine Re-
14. Skuridin, S. G., Kadykov, V. A., Shashkov, V. S., Evdokimov, Y. M. & Varshavskii, Y.
15. Eickbush, T. H. & Moudrianakis, E. N. (1978) Cell 13,295-306. 16. Minyat, E. E., Ivanov, V. I., Kritzyn, A. M., Minchenkova, L. E. & Schyolkina, A. (1978)
17. Schurr, J. M. & Allison, S. A. (1981) Biopolymers 20,(to appear). 18. Odijk, Th. (1979) Biopolymers 18,3111-3113. 19. Manning, G. S. (1977) Biophys. Chem. 7,95102. 20. Manning, G. S. (1978) Q. Reu. Biophys. 11,179-246. 21. Lin, S. C. & Schurr, J. M. (1978) Biopolymers 17,425-461. 22. Schmitz, K. S. & Schurr, J. M. (1973) Biopolymers 12,1543-1564. 23. Liebe, D. C. & Stuehr, J. E. (1972) Biopolymers 11,167-184. 24. Anderson, D. L. & Mosharatta, E. T. (1968) J. Virol. 2,1185-1190. 25. Hirschman, R. Z., Leng, M. & Felsenfeld, G. (1967) Biopolymers 5,227-233. 26. Razin, S., Gery, I. & Bachrach, U. (1959) Biochem. J. 71,551-558. 27. Rubin, R. (1977) J. Bacteriol. 129,916-925. 28. Thomas, J. C. & Schurr, J. M. (1979) Opt. Lett. 4,222-223. 29. Rouse, P. E. (1953) J. Chem. Phys. 21,1272-1280. 30. Zimm, B. H. (1956) J. Chem. Phys. 24,269-278. 31. Lee, W. A. & Peacocke, A. R. (1951) J . Chem. Soc., 3361-3373. 32. Bunce, S. & Kong, E. S. W. (1978) Biophys. Chem. 8,357-368. 33. Wang, A. H.-J., Quigley, F. J. Kolpak, F. J. Crawford, J. L., van Boom, J. H., van der
34. Bloomfield, V. A., Crothers, D. M. & Tinoco, I., Jr. (1974) Physical Chemistry of Nucleic
35. Thomas, J. C. & Schurr, J. M. (1980) Biopolymers 19,215-218. 36. Harrington, R. E (1978) Biopolymers 17,919-936.
search, Vol. 1, Campbell, R. A,, et al., Eds., Raven Press, New York.
M. (1978) ~ o i . ~ i o i . (MOSCOW) 12,413-420.
J. Mol. Biol. 128,397-409.
Mare1 G. & Rich, A. (1979) Nature 282,680-686.
Acids, Harper & Row, New York.
Received February 26,1980 Accepted July 25,1980