Embed Size (px)
Citation preview
Page 2 Source: Company, www.dynamiclevels.com
Muthoot Finance Ltd- India's No 1 Gold Loan Company.
Company Overview and Stock Price 3
Muthoot Finance & Its Subsidiaries 4
Business Segments 6
Company Financials 7
Peer Comparison 11
Shareholding Pattern 12
Industry Overview 13
Govt. Initiatives 14
Growth Prospects 15
Investment Rationale 16
Page 3 Source: Company, www.dynamiclevels.com
Company’s Overview and Stock Price
Muthoot Finance Ltd, the largest gold financing company in India in terms of loan portfolio, registered an increase in net profit of 48%, at 270 crs for the quarter ended June 2016 as against 183 crs in last year. Retail loans registered an increase of 1481cr during the quarter as against 1000 cr in last year translating to an increase in growth rate by 48%. AUM has increased by 6% at 25860crs at the end of June 30,2016 as against 24409crs last year. CRISIL has upgraded long term debt rating of Muthoot Finance from AA-/STABLE to AA/ Stable. Long term debt rating covers debt instruments of above one year whereas short term debt rating is for debt instruments of upto one year.Under CRISIL rating scale, AA rating will fall under ‘High Safety’ category and carries very low credit risk. Under short term debt rating, Muthoot Finance already has highest rating from CRISIL with A1+ rating which is considered to have very strong degree of safety and carries lowest credit risk.
.
COMPANY PROFILE OF MUTHOOT
Date of Incorporation 14-Mar-1997 Date of Listing 06-May-2011
Management Name Designation M G George Muthoot
Chairman
Pamela Anna Mathew
Ind. Non-ED
K John Mathew Ind. Non-ED K George John Ind. Non-ED John K Paul Ind. Non-ED George Joseph Ind. Non-ED George Alexander Muthoot
MD & CEO
George Thomas Muthoot
Whole Time Director
George Jacob Muthoot
Whole Time Director
Alexander M George Whole Time Director Pamela Anna Mathew
Ind. Non-ED
Registered Office Address Muthoot Chambers, 2nd Floor,Opposite
Saritha Theatre Complex,Banerji Road,682018,Kochi,Kerala,India
Website http://www.muthootfinance.com
BROAD INDUSTRY Finance PE ratio 15.30 MARKET CAP
(RS. CR.) 13607.64
INDUSTRY Finance-NBFC % Pledge 0 FV/ML 10/1
GROUP Muthoot Group NSE CODE MUTHOOTFIN 52 WEEK
HIGH/LOW (RS.) 407/168
LTP (RS.) 340 INST.INVESTORS
(%) 20.49
PROMOTERS (%)
74.63
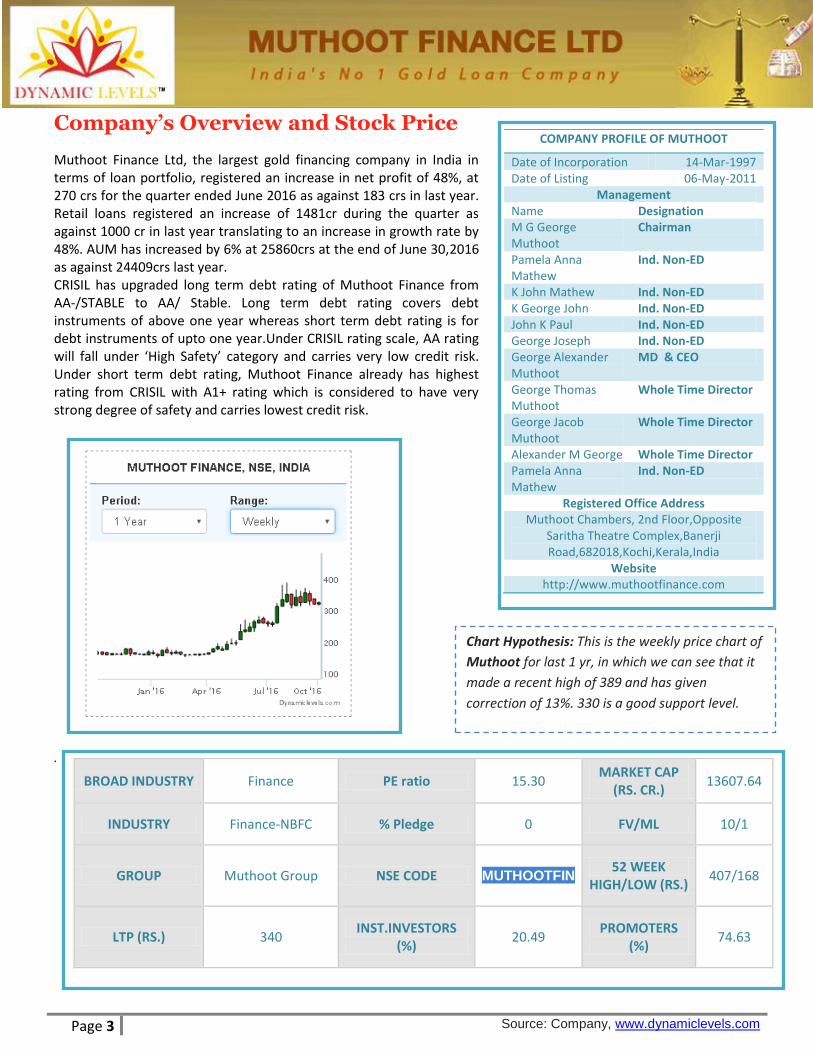
Chart Hypothesis: This is the weekly price chart of
Muthoot for last 1 yr, in which we can see that it
made a recent high of 389 and has given
correction of 13%. 330 is a good support level.
Page 4 Source: Company, www.dynamiclevels.com
Muthoot Fin & It’s Subsidiaries: Founded in 1887, the Muthoot Group started as a small trading business enterprise in Kozhencherry, a remote village in Kerala. Over the years, the Muthoot Group has diversified its presence across financial services, plantations & estates, education, leisure & hospitality, healthcare, housing & infrastructure, infotech, wealth management, money transfer, forex, media, power generation, precious metals, securities, vehicle & asset finance and travel services, among others. Also, the Group has expanded its reach and broadened its scope through these years. Muthoot Finance Limited is the flagship Company of the Muthoot Group. Headquartered in South Indian state of Kerala, India, they have emerged as the largest gold financing company in India in terms of loan portfolio. The Muthoot Group has been in this business for over 77years. Classified as a ‘Systemically Important Non-deposit taking NBFC’ as per the Reserve Bank of India regulations. they also offer home loans and insurance through subsidiaries. Asia Asset Finance PLC, Srilanka Asia Asset Finance PLC, (AAF) Colombo, Sri Lanka became a foreign subsidiary of Muthoot Finance Ltd on December 31, 2014. The company has been in operation for over 45 years, evolving to serve the growing needs of people of Sri Lanka. As on June 30, 2016, total holding in AAF by Muthoot Finance stood at 501 million equity shares representing 59.71% of their total capital. AAF is a Registered Financial Company based in Sri Lanka a fully licensed, deposittaking institution registered with the Central Bank of Sri Lanka and listed in the Colombo Stock Exchange. AAF is in lending business since 1970. At present the company is involved in Retail Finance, Hire Purchase & Business Loans and has 15 branches across Sri Lanka. It has total staff strength of 393 currently. Recently, it has entered the space of Gold Loans with assistance of Muthoot Finance. Muthoot Homefin (India) Limited MHIL is a Housing Finance Company registered with The National Housing Bank (NHB). As on June 30, 2016, Muthoot Finance holds 79% of equity capital of MHIL. MHIL’s prime goal is to contribute towards financial inclusion of LMI families by opening doors of formal housing finance to them. Its focus is on extending Affordable Housing Finance. MHIL would be concentrating primarily on retail housing loans in the initial stages. It would operate on a ‘Hub and Spoke’ model, with the centralised processing based out of Corporate Office at Mumbai. MHIL plans to expand its operations in Maharashtra (including Mumbai), Gujarat, Rajasthan, Madhya Pradesh and Kerala shortly.

Page 5 Source: Company, www.dynamiclevels.com
Muthoot Insurance Brokers Pvt Limited
MIBPL is an unlisted private limited company holding a licence to act as
Direct Broker from IRDA since 2013.It is actively distributing both life
and non-life insurance products of various insurance companies.
During FY15, It has insured more than 2,92,000 lives with a premium
collection of ` 35 Crore under Traditional, Term and Health products.
The same has increased to 4,59,000 lives with a premium collection of `
49 Crore in FY16.
Belstar Investment and Finance Private Limited (BIFPL)
BIFPL was incorporated on January 1988 at Bangalore and the
Company was registered with the RBI in March 2001 as a Non- Banking
Finance Company. The Company was reclassified as “NBFC-MFI” by RBI
effective from 11th December 2013. BIFPL was acquired by the ‘Hand
in Hand’ group in September 2008 to provide scalable microfinance
services to entrepreneurs nurtured by ‘Hand in Hand’s’ Self Help Group
(SHG) program. The Company commenced its first lending operations
at Haveri District of Karnataka in March 2009 to 3 SHGs, 22 members
for INR 0.02 crores. In the last six years of its operations, BIFPL
primarily relied on taking over the existing groups formed by Hand in
Hand India . BIFPL predominantly follows the SHG model of lending.
Effective January 2015, BIFPL started working in JLG model of lending
in Pune district, Maharashtra. As of March 31, 2016, BIFPL operations
are spread over four states and 1 UT (Tamil Nadu, Karnataka, Madhya
Pradesh, Maharashtra and Pondicherry). It has 76 branches, with 13
controlling regional offices in 12 Districts and employs 561 staff. Its
loan portfolio has grown from INR 0.02 Crores in March 2009 to INR
264 crores in March 2016. For FY 16 , Its Net Profit After Tax was
`6.11crs and had a networth of `39.90crs.

Page 6 Source: Company, www.dynamiclevels.com
Business Segment:
The Company operates in two segments – Financing and Power
Generation.
Foraying into Microfinance:
Acquired a stake in Belstar Investment and Finance Private Limited
(BIFPL), a microfinance company. BIFPL’s operations span four states
(Tamil Nadu, Karnataka, Madhya Pradesh, and Maharashtra) and one
union territory (Puducherry). As on 30th June, 2016, the Company had
94 branches, with 16 controlling regional offices across 14 districts,
driven by a team of 705 members.
Growing Investment Products Bouquet
Acquired Muthoot Insurance Brokers Pvt Limited (MIBPL), making it a
wholly-owned subsidiary of Muthoot Finance. Thus, they are further
diversifying their bouquet of investment products for existing and
potential customers.
Fortifying Home Finance Business
Their home finance arm, Muthoot Homefin (India) Limited (MHIL) is a
professionally-managed company with a clear focus on the affordable
housing segment. It is focusing on providing home loans to the low and
middle-income families in extended suburbs of tier-I, tier-2 and tier 3
cities and towns.
Strengthening Sri Lankan business
Muthoot entered into potential high-growth Sri Lankan market with
the acquisition of Asia Asset Finance PLC, (AAF). During 2015-16, they
increased stake to 59.70% from 51%. AAF is a Registered Financial
Company, Sri Lanka based, fully licensed, deposit-taking institution,
registered with the Central Bank of Sri Lanka and listed on the Colombo
Stock Exchange. AAF has operations across Sri Lanka with 15 branches.
They are growing their scale of operations across Sri Lanka with
enhanced focus on the gold loan and microfinance business.

Page 7 Source: Company, www.dynamiclevels.com
Company Financials
Jun-16 Mar-16 % Growth
Quarterly Quarterly (QoQ)
Net Sales/Income from operations 1,271.22 1,429.06 -11.05%
Other Operating Income 25.18 17.89 40.75%
Total Income From Operations 1,296.39 1,446.95 -10.41%
Employees Cost 184.89 160.71 15.05%
Admin. And Selling Expenses 11.8 14.95 -21.07%
Depreciation 11.69 14.65 -20.20%
Other Expenses 94.09 92.13 2.13%
Total Expenditure 302.47 282.45 7.09%
Operating Profit 976.37 1,034.61 -5.63%
Provisions And Contingencies 17.55 129.89 -86.49%
Other Income 4.42 4.34 1.84%
P/L Before Int., Excpt. Items & Tax 980.8 1,038.95 -5.60%
Interest 557.08 563.9 -1.21%
P/L Before Exceptional Items & Tax 423.71 475.05 -10.81%
Tax 153.44 209.83 -26.87%
P/L After Tax from Ordinary Activities 270.27 265.22 1.90%
PAT 270.27 265.22 1.90%
Equity Share Capital 399.05 399 0.01%
EPS (Rs.) [Before Extraordinary items] 6.77 6.67 1.50%
Page 8 Source: Company, www.dynamiclevels.com
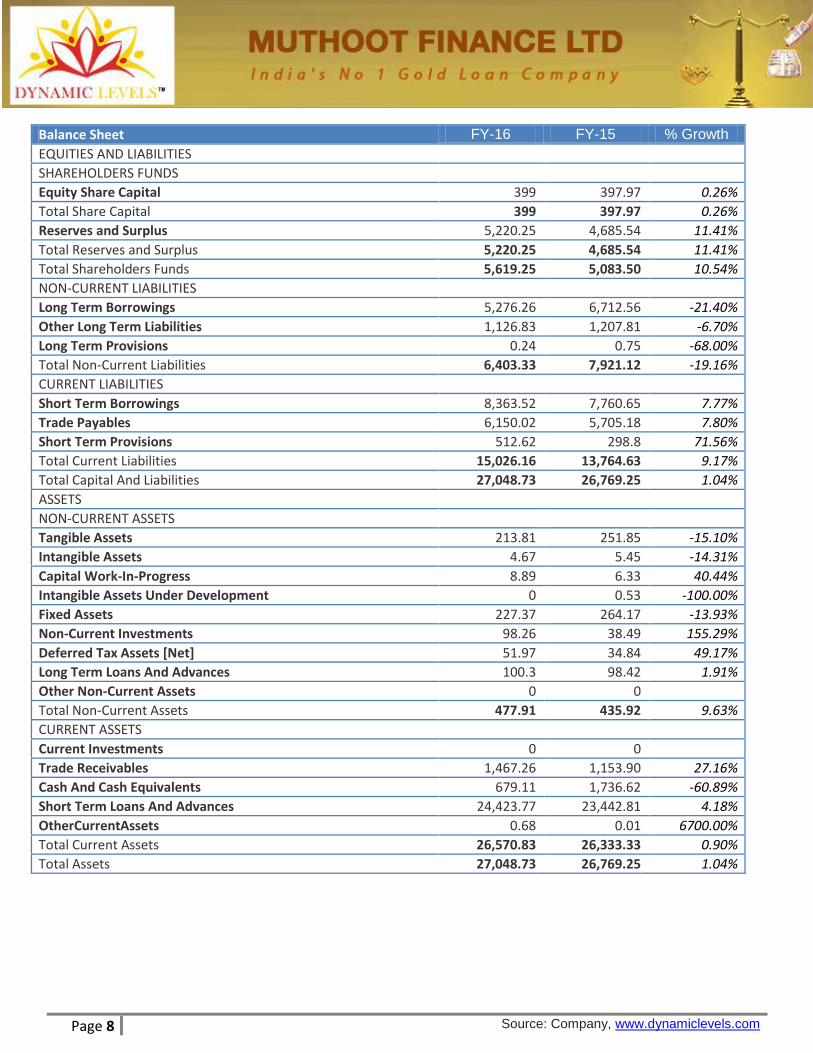
Balance Sheet FY-16 FY-15 % Growth
EQUITIES AND LIABILITIES SHAREHOLDERS FUNDS Equity Share Capital 399 397.97 0.26%
Total Share Capital 399 397.97 0.26%
Reserves and Surplus 5,220.25 4,685.54 11.41%
Total Reserves and Surplus 5,220.25 4,685.54 11.41%
Total Shareholders Funds 5,619.25 5,083.50 10.54%
NON-CURRENT LIABILITIES Long Term Borrowings 5,276.26 6,712.56 -21.40%
Other Long Term Liabilities 1,126.83 1,207.81 -6.70%
Long Term Provisions 0.24 0.75 -68.00%
Total Non-Current Liabilities 6,403.33 7,921.12 -19.16%
CURRENT LIABILITIES Short Term Borrowings 8,363.52 7,760.65 7.77%
Trade Payables 6,150.02 5,705.18 7.80%
Short Term Provisions 512.62 298.8 71.56%
Total Current Liabilities 15,026.16 13,764.63 9.17%
Total Capital And Liabilities 27,048.73 26,769.25 1.04%
ASSETS NON-CURRENT ASSETS Tangible Assets 213.81 251.85 -15.10%
Intangible Assets 4.67 5.45 -14.31%
Capital Work-In-Progress 8.89 6.33 40.44%
Intangible Assets Under Development 0 0.53 -100.00%
Fixed Assets 227.37 264.17 -13.93%
Non-Current Investments 98.26 38.49 155.29%
Deferred Tax Assets [Net] 51.97 34.84 49.17%
Long Term Loans And Advances 100.3 98.42 1.91%
Other Non-Current Assets 0 0 Total Non-Current Assets 477.91 435.92 9.63%
CURRENT ASSETS Current Investments 0 0 Trade Receivables 1,467.26 1,153.90 27.16%
Cash And Cash Equivalents 679.11 1,736.62 -60.89%
Short Term Loans And Advances 24,423.77 23,442.81 4.18%
OtherCurrentAssets 0.68 0.01 6700.00%
Total Current Assets 26,570.83 26,333.33 0.90%
Total Assets 27,048.73 26,769.25 1.04%
Page 9 Source: Company, www.dynamiclevels.com
Peer Comparison
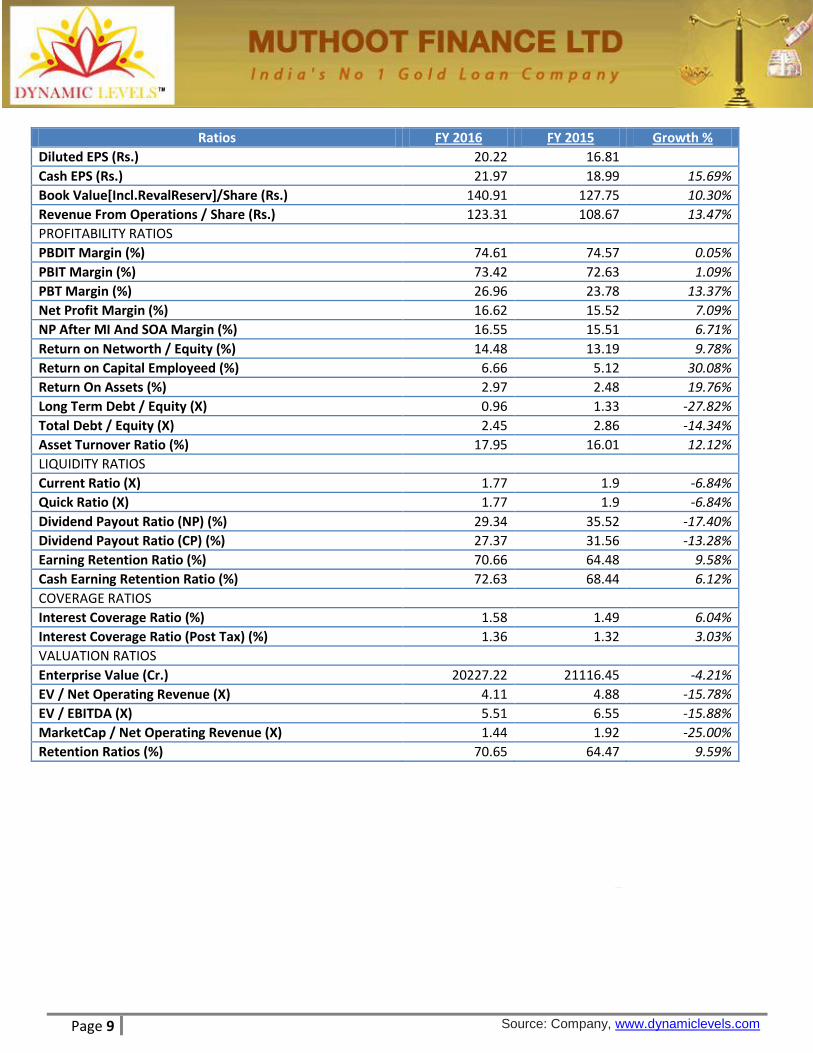
Ratios FY 2016 FY 2015 Growth %
Diluted EPS (Rs.) 20.22 16.81 Cash EPS (Rs.) 21.97 18.99 15.69%
Book Value[Incl.RevalReserv]/Share (Rs.) 140.91 127.75 10.30%
Revenue From Operations / Share (Rs.) 123.31 108.67 13.47%
PROFITABILITY RATIOS PBDIT Margin (%) 74.61 74.57 0.05%
PBIT Margin (%) 73.42 72.63 1.09%
PBT Margin (%) 26.96 23.78 13.37%
Net Profit Margin (%) 16.62 15.52 7.09%
NP After MI And SOA Margin (%) 16.55 15.51 6.71%
Return on Networth / Equity (%) 14.48 13.19 9.78%
Return on Capital Employeed (%) 6.66 5.12 30.08%
Return On Assets (%) 2.97 2.48 19.76%
Long Term Debt / Equity (X) 0.96 1.33 -27.82%
Total Debt / Equity (X) 2.45 2.86 -14.34%
Asset Turnover Ratio (%) 17.95 16.01 12.12%
LIQUIDITY RATIOS Current Ratio (X) 1.77 1.9 -6.84%
Quick Ratio (X) 1.77 1.9 -6.84%
Dividend Payout Ratio (NP) (%) 29.34 35.52 -17.40%
Dividend Payout Ratio (CP) (%) 27.37 31.56 -13.28%
Earning Retention Ratio (%) 70.66 64.48 9.58%
Cash Earning Retention Ratio (%) 72.63 68.44 6.12%
COVERAGE RATIOS Interest Coverage Ratio (%) 1.58 1.49 6.04%
Interest Coverage Ratio (Post Tax) (%) 1.36 1.32 3.03%
VALUATION RATIOS Enterprise Value (Cr.) 20227.22 21116.45 -4.21%
EV / Net Operating Revenue (X) 4.11 4.88 -15.78%
EV / EBITDA (X) 5.51 6.55 -15.88%
MarketCap / Net Operating Revenue (X) 1.44 1.92 -25.00%
Retention Ratios (%) 70.65 64.47 9.59%
Page 10 Source: Company, www.dynamiclevels.com
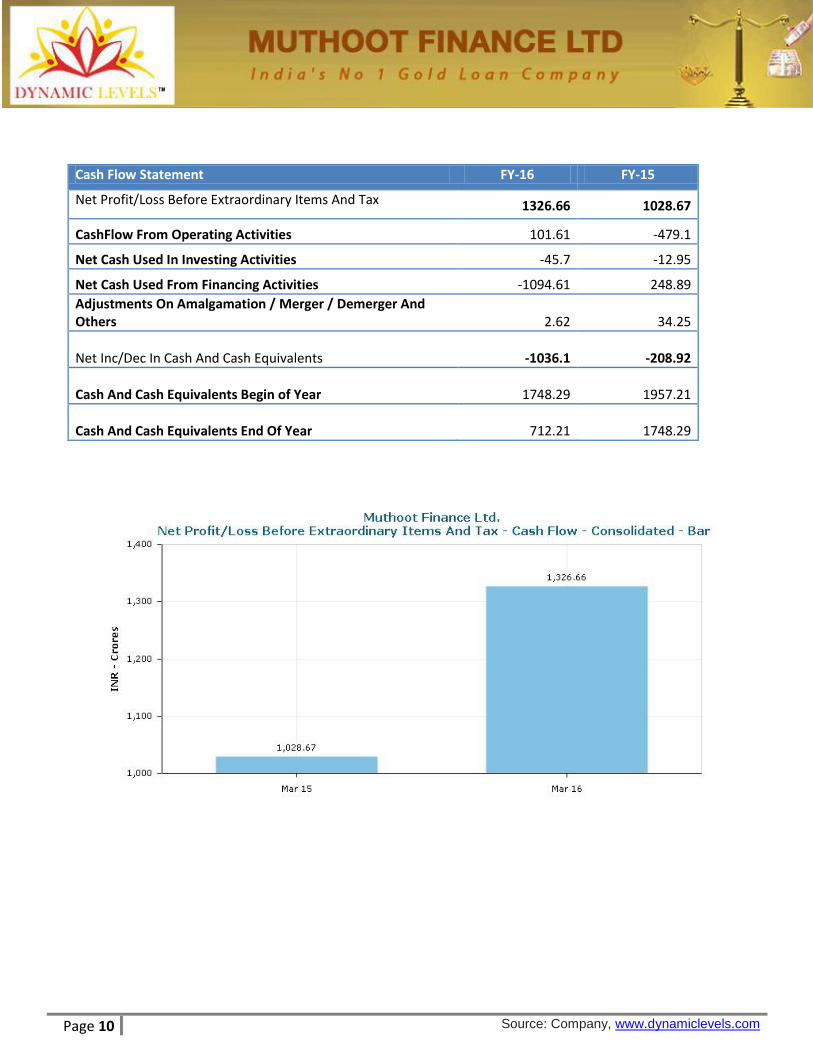
Cash Flow Statement FY-16 FY-15
Net Profit/Loss Before Extraordinary Items And Tax 1326.66 1028.67
CashFlow From Operating Activities 101.61 -479.1
Net Cash Used In Investing Activities -45.7 -12.95
Net Cash Used From Financing Activities -1094.61 248.89
Adjustments On Amalgamation / Merger / Demerger And Others 2.62 34.25
Net Inc/Dec In Cash And Cash Equivalents -1036.1 -208.92
Cash And Cash Equivalents Begin of Year 1748.29 1957.21
Cash And Cash Equivalents End Of Year 712.21 1748.29
Page 11 Source: Company, www.dynamiclevels.com
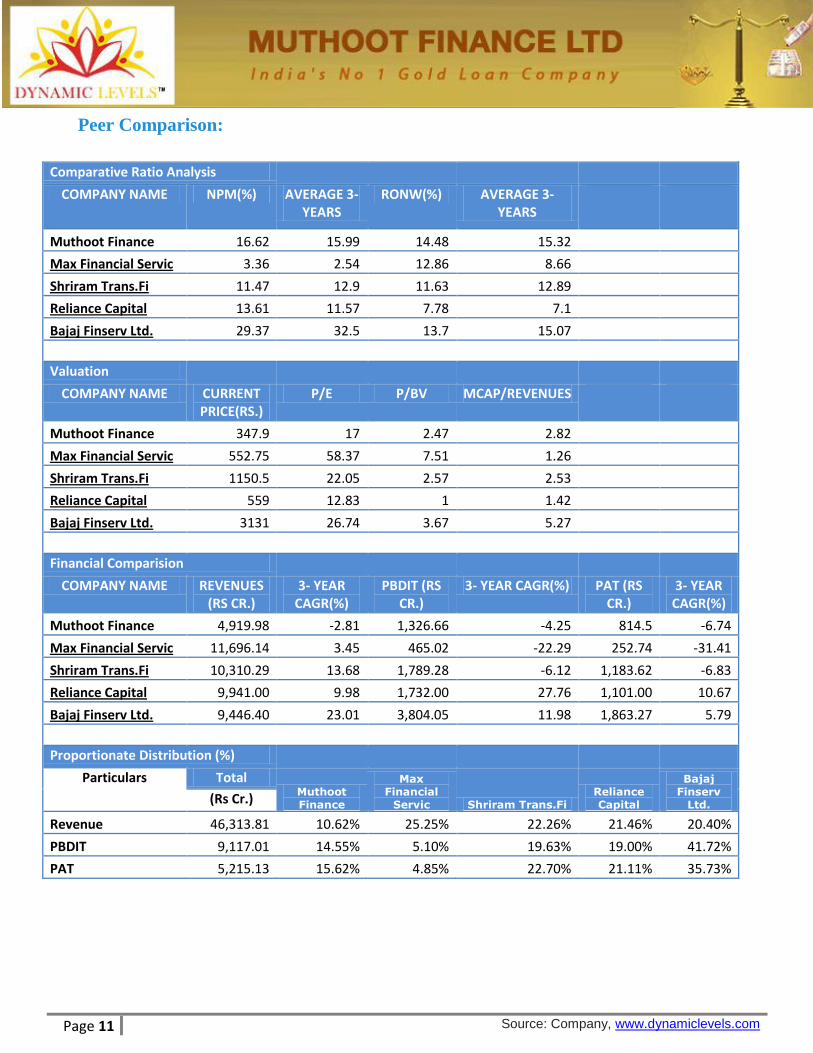
Peer Comparison:
Comparative Ratio Analysis
COMPANY NAME NPM(%) AVERAGE 3-YEARS
RONW(%) AVERAGE 3-YEARS
Muthoot Finance 16.62 15.99 14.48 15.32
Max Financial Servic 3.36 2.54 12.86 8.66
Shriram Trans.Fi 11.47 12.9 11.63 12.89
Reliance Capital 13.61 11.57 7.78 7.1
Bajaj Finserv Ltd. 29.37 32.5 13.7 15.07
Valuation
COMPANY NAME CURRENT PRICE(RS.)
P/E P/BV MCAP/REVENUES
Muthoot Finance 347.9 17 2.47 2.82
Max Financial Servic 552.75 58.37 7.51 1.26
Shriram Trans.Fi 1150.5 22.05 2.57 2.53
Reliance Capital 559 12.83 1 1.42
Bajaj Finserv Ltd. 3131 26.74 3.67 5.27
Financial Comparision
COMPANY NAME REVENUES (RS CR.)
3- YEAR CAGR(%)
PBDIT (RS CR.)
3- YEAR CAGR(%) PAT (RS CR.)
3- YEAR CAGR(%)
Muthoot Finance 4,919.98 -2.81 1,326.66 -4.25 814.5 -6.74
Max Financial Servic 11,696.14 3.45 465.02 -22.29 252.74 -31.41
Shriram Trans.Fi 10,310.29 13.68 1,789.28 -6.12 1,183.62 -6.83
Reliance Capital 9,941.00 9.98 1,732.00 27.76 1,101.00 10.67
Bajaj Finserv Ltd. 9,446.40 23.01 3,804.05 11.98 1,863.27 5.79
Proportionate Distribution (%)
Particulars Total Muthoot Finance
Max Financial
Servic Shriram Trans.Fi Reliance Capital
Bajaj Finserv
Ltd. (Rs Cr.)
Revenue 46,313.81 10.62% 25.25% 22.26% 21.46% 20.40%
PBDIT 9,117.01 14.55% 5.10% 19.63% 19.00% 41.72%
PAT 5,215.13 15.62% 4.85% 22.70% 21.11% 35.73%
Page 12 Source: Company, www.dynamiclevels.com
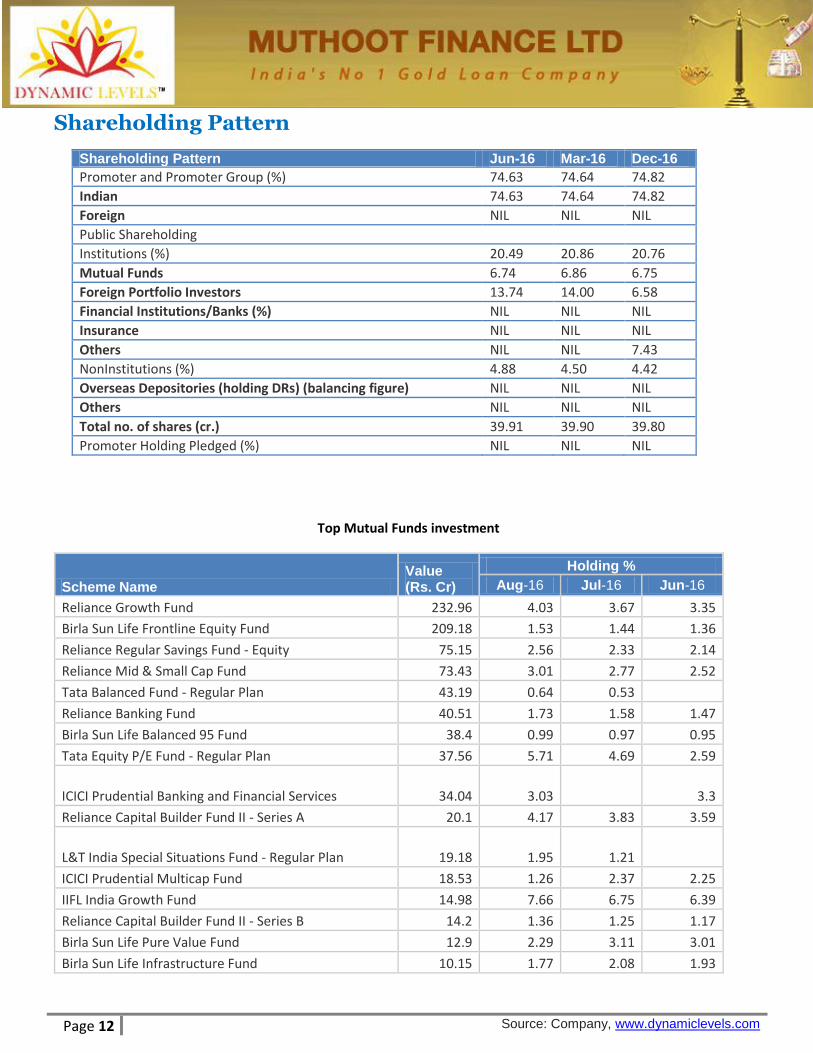
Shareholding Pattern
Shareholding Pattern Jun-16 Mar-16 Dec-16
Promoter and Promoter Group (%) 74.63 74.64 74.82
Indian 74.63 74.64 74.82
Foreign NIL NIL NIL
Public Shareholding
Institutions (%) 20.49 20.86 20.76
Mutual Funds 6.74 6.86 6.75
Foreign Portfolio Investors 13.74 14.00 6.58
Financial Institutions/Banks (%) NIL NIL NIL
Insurance NIL NIL NIL
Others NIL NIL 7.43
NonInstitutions (%) 4.88 4.50 4.42
Overseas Depositories (holding DRs) (balancing figure) NIL NIL NIL
Others NIL NIL NIL
Total no. of shares (cr.) 39.91 39.90 39.80
Promoter Holding Pledged (%) NIL NIL NIL
Top Mutual Funds investment
Scheme Name Value (Rs. Cr)
Holding %
Aug-16 Jul-16 Jun-16
Reliance Growth Fund 232.96 4.03 3.67 3.35
Birla Sun Life Frontline Equity Fund 209.18 1.53 1.44 1.36
Reliance Regular Savings Fund - Equity 75.15 2.56 2.33 2.14
Reliance Mid & Small Cap Fund 73.43 3.01 2.77 2.52
Tata Balanced Fund - Regular Plan 43.19 0.64 0.53
Reliance Banking Fund 40.51 1.73 1.58 1.47
Birla Sun Life Balanced 95 Fund 38.4 0.99 0.97 0.95
Tata Equity P/E Fund - Regular Plan 37.56 5.71 4.69 2.59
ICICI Prudential Banking and Financial Services 34.04 3.03 3.3
Reliance Capital Builder Fund II - Series A 20.1 4.17 3.83 3.59
L&T India Special Situations Fund - Regular Plan 19.18 1.95 1.21
ICICI Prudential Multicap Fund 18.53 1.26 2.37 2.25
IIFL India Growth Fund 14.98 7.66 6.75 6.39
Reliance Capital Builder Fund II - Series B 14.2 1.36 1.25 1.17
Birla Sun Life Pure Value Fund 12.9 2.29 3.11 3.01
Birla Sun Life Infrastructure Fund 10.15 1.77 2.08 1.93
Page 13 Source: Company, www.dynamiclevels.com
Industry Overview: India has certainly the potential to become a double-digit growth
economy. In order to fulfill its ambition, it requires a strong financial
sector. India’s financial sector has come a long way since liberalisation
started in 1990 and has been a key contributor to the growth. Access
to financial services has improved in a big way but remains below than
that of scenario in similar economies. The Government and the RBI
have initiated several policies for expanding the availability of financial
services to common masses. However, a large part of financial assets is
concentrated among few institutions which is limiting the inhibiting
competition and passing on the benefits of competition. Non-Banking
Finance Companies (NBFCs) like Muthoot Finance play an important
role in filling this vacuum. NBFCs have been able to expand nationally
contributing to credit growth and providing the last mile connectivity,
thereby fostering financial inclusion.
ECONOMIC SCENARIO
Global recovery continues, but at an ever-slowing and increasingly
fragile pace. These developments led International Monetary Fund to a
further broad-based reduction in their baseline projections for
economic growth in 2016 and 2017. The global macroeconomic
landscape is currently chartering a rough and uncertain terrain
characterized by weak growth of world output. The situation has been
exacerbated by: (i) declining prices of a number of commodities, with
reduction in crude oil prices being the most visible among them, (ii)
turbulent financial markets (more so equity markets), and (iii) volatile
exchange rates. These conditions reflect extreme risk-aversion
behaviour of global investors, thus putting many, and in particular,
commodity-exporting economies under considerable stress. Even in
these trying and uncertain circumstances, India’s growth story has
largely remained positive on the strength of domestic absorption, and
the country has registered a robust and steady pace of economic
growth in 2015-16 as it did in 2014-15. Even in cloudy scenario of
economic development, India remained fastest growing economy in
the world. However financial sector saw a mixed performance wherein
banking industry saw dramatic downward trends due to increasing and
unmanageable non-performing assets which led most of leading banks
to show a loss or reduced profit, on the other hand, leading Non-
Banking Financial Companies showed a positive growth in business and
profit in comparison with previous year.

Page 14 Source: Company, www.dynamiclevels.com
Government Initiatives:
Several measures were outlined in the Union Budget 2015-16 that
aimed at reviving and accelerating investment:-
The Prime Minister of India has launched the Micro Unit Development and Refinance Agency (MUDRA) to fund and promote Micro Finance Institutions (MFIs), which would provide loans to small and vulnerable sections of the business community.
Government of India’s ‘Jan Dhan’ initiative for financial inclusion is gaining momentum, as the number of bank accounts opened by 15th July, 2015 has more than doubled to 169 million from 68.7 million at end of October 2014. Government of India aims to extend insurance, pension and credit facilities to those excluded from these benefits under the Pradhan Mantri Jan Dhan Yojana (PMJDY).
NBFCs shall be eligible for deduction to the extent of 5% of their income in respect of provision for bad and doubtful debts (NPAs).
FDI will be allowed beyond the 18 specified NBFC activities in the automatic route in other activities which are regulated by financial sector regulators.
The Pradhan Mantri Mudra Yojana (PMMY) was launched for the benefit of bottom of the pyramid entrepreneurs. Banks and NBFC-MFIs have reported that the amount sanctioned under PMMY had reached about 1 Lakh Crore to over 2.5 Crores borrowers by early February 2016, while the target next year is raised to 180,000 Crores.
Investment limit for foreign entities in Indian stock exchanges will be enhanced from 5% to 15% on par with domestic institutions.
It is proposed to provide additional options to banking companies and financial institutions, including NBFCs, for reversal of input tax credits with respect to non-taxable services provided by them by way of extending deposits, loans and advances with effect from 1st April, 2016.
Gold Monetization Scheme - The Gold monetization scheme is
basically a new deposit tool to ensure mobilization of gold held
by households and institutions of the country and facilitate its
use for productive purposes. In the long run it aims to reduce
the country’s reliance on the import of gold.
Page 15 Source: Company, www.dynamiclevels.com
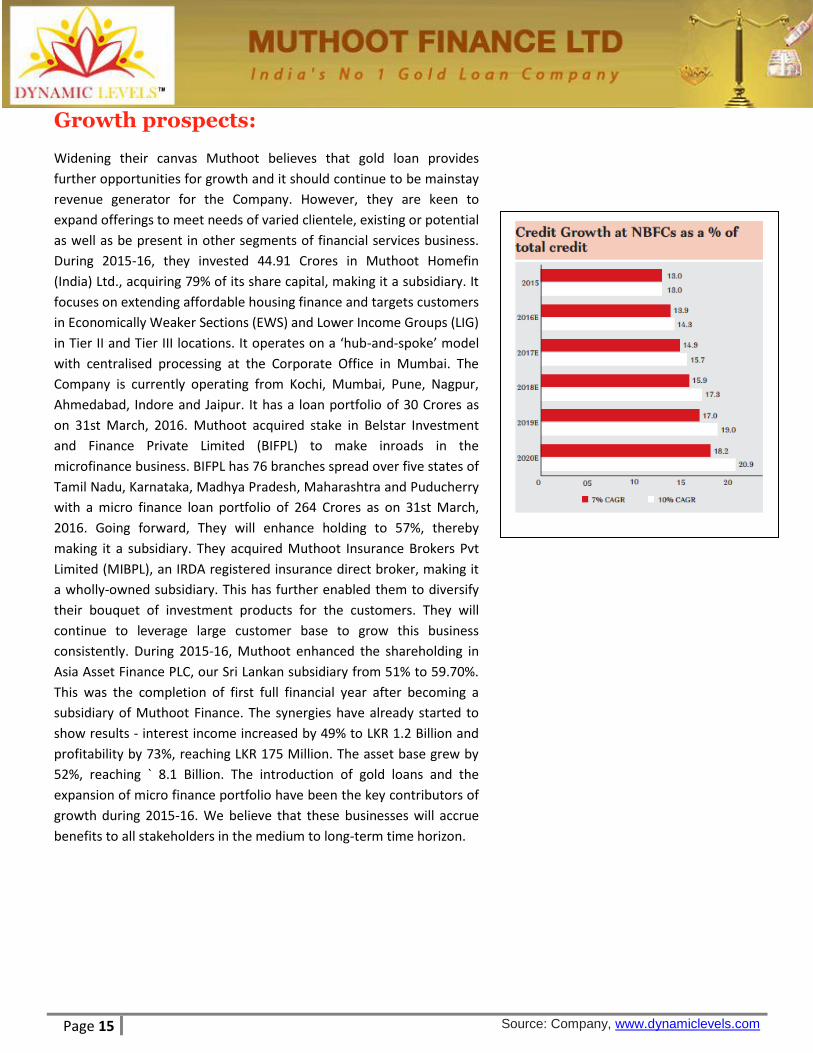
Growth prospects:
Widening their canvas Muthoot believes that gold loan provides
further opportunities for growth and it should continue to be mainstay
revenue generator for the Company. However, they are keen to
expand offerings to meet needs of varied clientele, existing or potential
as well as be present in other segments of financial services business.
During 2015-16, they invested 44.91 Crores in Muthoot Homefin
(India) Ltd., acquiring 79% of its share capital, making it a subsidiary. It
focuses on extending affordable housing finance and targets customers
in Economically Weaker Sections (EWS) and Lower Income Groups (LIG)
in Tier II and Tier III locations. It operates on a ‘hub-and-spoke’ model
with centralised processing at the Corporate Office in Mumbai. The
Company is currently operating from Kochi, Mumbai, Pune, Nagpur,
Ahmedabad, Indore and Jaipur. It has a loan portfolio of 30 Crores as
on 31st March, 2016. Muthoot acquired stake in Belstar Investment
and Finance Private Limited (BIFPL) to make inroads in the
microfinance business. BIFPL has 76 branches spread over five states of
Tamil Nadu, Karnataka, Madhya Pradesh, Maharashtra and Puducherry
with a micro finance loan portfolio of 264 Crores as on 31st March,
2016. Going forward, They will enhance holding to 57%, thereby
making it a subsidiary. They acquired Muthoot Insurance Brokers Pvt
Limited (MIBPL), an IRDA registered insurance direct broker, making it
a wholly-owned subsidiary. This has further enabled them to diversify
their bouquet of investment products for the customers. They will
continue to leverage large customer base to grow this business
consistently. During 2015-16, Muthoot enhanced the shareholding in
Asia Asset Finance PLC, our Sri Lankan subsidiary from 51% to 59.70%.
This was the completion of first full financial year after becoming a
subsidiary of Muthoot Finance. The synergies have already started to
show results - interest income increased by 49% to LKR 1.2 Billion and
profitability by 73%, reaching LKR 175 Million. The asset base grew by
52%, reaching ` 8.1 Billion. The introduction of gold loans and the
expansion of micro finance portfolio have been the key contributors of
growth during 2015-16. We believe that these businesses will accrue
benefits to all stakeholders in the medium to long-term time horizon.
Page 16 Source: Company, www.dynamiclevels.com
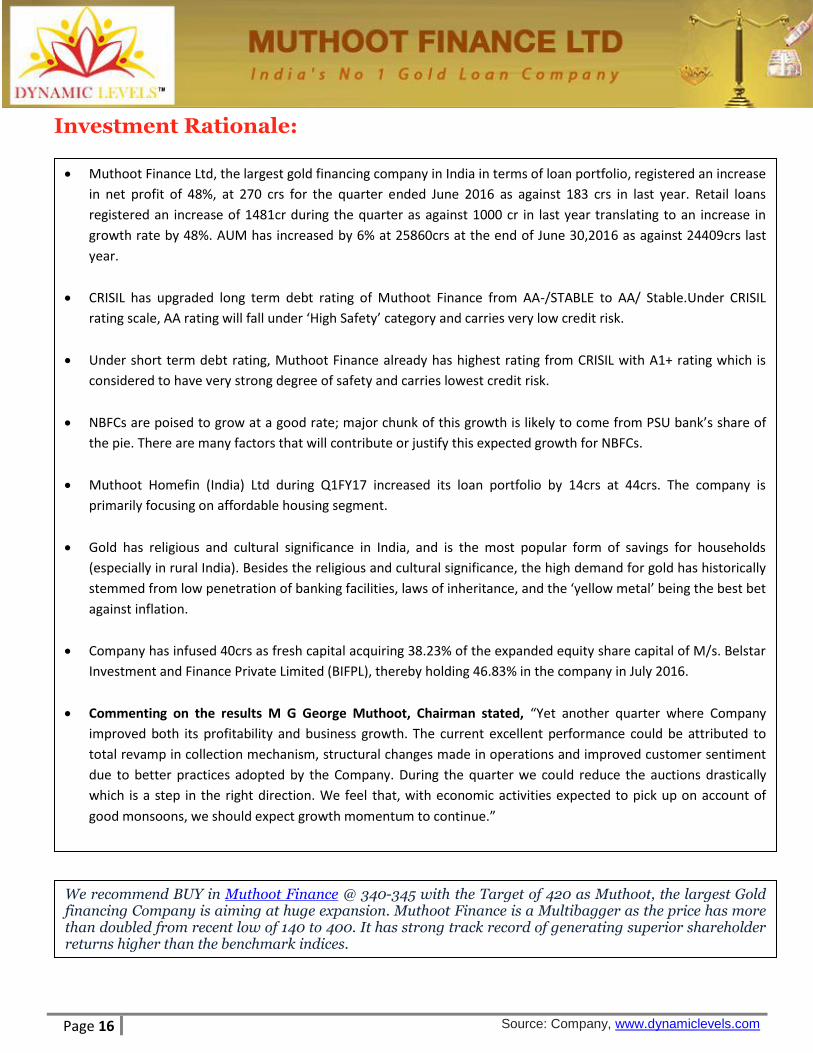
Investment Rationale:
Muthoot Finance Ltd, the largest gold financing company in India in terms of loan portfolio, registered an increase
in net profit of 48%, at 270 crs for the quarter ended June 2016 as against 183 crs in last year. Retail loans
registered an increase of 1481cr during the quarter as against 1000 cr in last year translating to an increase in
growth rate by 48%. AUM has increased by 6% at 25860crs at the end of June 30,2016 as against 24409crs last
year.
CRISIL has upgraded long term debt rating of Muthoot Finance from AA-/STABLE to AA/ Stable.Under CRISIL
rating scale, AA rating will fall under ‘High Safety’ category and carries very low credit risk.
Under short term debt rating, Muthoot Finance already has highest rating from CRISIL with A1+ rating which is
considered to have very strong degree of safety and carries lowest credit risk.
NBFCs are poised to grow at a good rate; major chunk of this growth is likely to come from PSU bank’s share of
the pie. There are many factors that will contribute or justify this expected growth for NBFCs.
Muthoot Homefin (India) Ltd during Q1FY17 increased its loan portfolio by 14crs at 44crs. The company is
primarily focusing on affordable housing segment.
Gold has religious and cultural significance in India, and is the most popular form of savings for households
(especially in rural India). Besides the religious and cultural significance, the high demand for gold has historically
stemmed from low penetration of banking facilities, laws of inheritance, and the ‘yellow metal’ being the best bet
against inflation.
Company has infused 40crs as fresh capital acquiring 38.23% of the expanded equity share capital of M/s. Belstar
Investment and Finance Private Limited (BIFPL), thereby holding 46.83% in the company in July 2016.
Commenting on the results M G George Muthoot, Chairman stated, “Yet another quarter where Company
improved both its profitability and business growth. The current excellent performance could be attributed to
total revamp in collection mechanism, structural changes made in operations and improved customer sentiment
due to better practices adopted by the Company. During the quarter we could reduce the auctions drastically
which is a step in the right direction. We feel that, with economic activities expected to pick up on account of
good monsoons, we should expect growth momentum to continue.”
We recommend BUY in Muthoot Finance @ 340-345 with the Target of 420 as Muthoot, the largest Gold financing Company is aiming at huge expansion. Muthoot Finance is a Multibagger as the price has more than doubled from recent low of 140 to 400. It has strong track record of generating superior shareholder returns higher than the benchmark indices.
Page 17 Source: Company, www.dynamiclevels.com
Disclaimer: Research Disclaimer and Disclosure inter-alia as required under Securities and Exchange Board of India (Research Analysts) Regulations, 2014. Dynamic Equities Pvt. Ltd. is a member of National Stock Exchange of India Ltd. (NSEIL), Bombay Stock Exchange Ltd (BSE), Multi Stock Exchange of India Ltd (MCX-SX) and also a depository participant with National Securities Depository Ltd (NSDL) and Central Depository Services Ltd.(CDSL). Dynamic is engaged in the business of Stock Broking, Depository Services, Investment Advisory Services and Portfolio Management Services. Dynamic Equities Pvt. Ltd. is holding company of Dynamic Commodities Pvt. Ltd. , a member of Multi Commodities Exchange (MCX) & National Commodity & Derivatives Exchange Ltd.(NCDEX). We hereby declare that our activities were neither suspended nor we have defaulted with any stock exchange authority with whom we are registered. SEBI, Exchanges and Depositories have conducted the routine inspection and based on their observations have issued advise letters or levied minor penalty on for certain operational deviations. Answers to the Best of the knowledge and belief of Dynamic/ its Associates/ Research Analyst who prepared this report
DYANMIC/its Associates/ Research Analyst/ his Relative have any financial interest in the subject company? No
DYANMIC/its Associates/ Research Analyst/ his Relative have actual/beneficial ownership of one per cent or more securities of the subject company? No
DYANMIC/its Associates/ Research Analyst/ his Relative have any other material conflict of interest at the time of publication of the research report or at the time of public appearance? No
DYANMIC/its Associates/ Research Analyst/ his Relative have received any compensation from the subject company in the past twelve months? No
DYANMIC/its Associates/ Research Analyst/ his Relative have managed or co-managed public offering of securities for the subject company in the past twelve months? No
DYANMIC/its Associates/ Research Analyst/ his Relative have received any compensation for investment banking or merchant banking or brokerage services from the subject company in the past twelve months? No
DYANMIC/its Associates/ Research Analyst/ his Relative have received any compensation for products or services other than investment banking or merchant banking or brokerage services from the subject company in the past twelve months? No
DYANMIC/its Associates/ Research Analyst/ his Relative have received any compensation or other benefits from the Subject Company or third party in connection with the research report? No
DYANMIC/its Associates/ Research Analyst/ his Relative have served as an officer, director or employee of the subject company? No
DYANMIC/its Associates/ Research Analyst/ his Relative have been engaged in market making activity for the subject company? No
General Disclaimer: - This Research Report (hereinafter called “Report”) is meant solely for use by the recipient and is not for circulation. This Report does not constitute a personal recommendation or take into account the particular investment objectives, financial situations, or needs of individual clients. The recommendations, if any, made herein are expression of views and/or opinions and should not be deemed or construed to be neither advice for the purpose of purchase or sale of any security, derivatives or any other security through Dynamic nor any solicitation or offering of any investment /trading opportunity on behalf of the issuer(s) of the respective security (ies) referred to herein. These information / opinions / views are not meant to serve as a professional investment guide for the readers. No action is solicited based upon the information provided herein. Recipients of this Report should rely on information/data arising out of their own investigations. Readers are advised to seek independent professional advice and arrive at an informed trading/investment decision before executing any trades or making any investments. This Report has been prepared on the basis of publicly available information, internally developed data and other sources believed by Dynamic to be reliable. Dynamic or its directors, employees, affiliates or representatives do not assume any responsibility for, or warrant the accuracy, completeness, adequacy and reliability of such information / opinions / views. While due care has been taken to ensure that the disclosures and opinions given are fair and reasonable, none of the directors, employees, affiliates or representatives of Dynamic shall be liable for any direct, indirect, special, incidental, consequential, punitive or exemplary damages, including loss profits arising in any way whatsoever from the information / opinions / views contained in this Report. The price and value of the investments referred to in this Report and the income from them may go down as well as up, and investors may realize losses on any investments. Past performance is not a guide for future performance. Dynamic levels do not provide tax advice to its clients, and all investors are strongly advised to consult with their tax advisers regarding taxation aspects of any potential investment. Opinions expressed are our current opinions as of the date appearing on this Research only. We do not undertake to advise you as to any change of our views expressed in this Report. User should keep this risk in mind and not hold dynamic levels, its employees and associates responsible for any losses, damages of any type whatsoever. Dynamic and its associates or employees may; (a) from time to time, have long or short positions in, and buy or sell the investments in/ security of company (ies) mentioned herein and it may not be construed as potential conflict of interest with respect to any recommendation and related information and opinions. Without limiting any of the foregoing, in no event shall Dynamic and its associates or employees or any third party involved in, or related to computing or compiling the information have any liability for any damages of any kind. We and our affiliates/associates, officers, directors, and employees, Research Analyst(including relatives) worldwide may: (a) from time to time, have long or short positions in, and buy or sell the securities thereof, of company (ies) mentioned herein or (b) be engaged in any other transaction involving such securities and earn brokerage or other compensation or act as a market maker in the financial instruments of the subject company/company (ies) discussed herein or act as advisor to such company (ies) or have other potential/material conflict of interest with respect to any recommendation and related information and opinions at the time of publication of Research Report. Dynamic may have proprietary long/short position in the above mentioned scrip(s) and therefore may be considered as interested. The views provided herein are general in nature and does not consider risk appetite or investment objective of particular investor; readers are requested to take independent professional advice before investing. This should not be construed as invitation or solicitation to do business with Dynamic. Dynamic Equities Pvt. Ltd. are also engaged in Proprietary Trading apart from Client Business.
https://www.dynamiclevels.com/en/disclaimer