Embed Size (px)
Citation preview
Sympatec develops, manufactures, sells, services and supports a range of best instruments for particle size and shape analysis
in laboratory and process applications for customers worldwide. With continuous innovations Sympatec makes a prominent
contribution to ❱ laser diffraction, ❱ image analysis, ❱ ultrasonic extinction and ❱ photon cross-correlation spectroscopy.
QICPIC | RODOS & Co. | Dynamic Image AnalysisParticle Measurement | LaboratorySize and Shape | < 1 µm to 34,000 µm
[2]
Size
Shapedynamic
The spherical model of laser diffraction
Laser diffraction has been recog-nized as a technology for fast and reliable determination of particle size distributions. For decades it has been the dominant method for the analysis of particle collectives in research and industry. The diffrac-tion method assumes the validity of the spherical particle model.
With the determination of particle size as the equivalent diameter of a sphere characteristics of differ-ent particle shapes are assumed as integral values. For many applica-tions this calculation is viable. The assumption of spherically shaped particles is sufficiently precise to characterize the relevant physical properties of a particle collective.
Size and shape – closer to reality with image analysis
For different applications not only particle size but also particle shape determines relevant properties of the collective. Flowability, adhesion and friction, hardness, compress-ibility, roughness and attrition or solubility of disperse systems can better be characterized with supple-mentary shape descriptors such as sphericity, aspect ratio or convexity. Differences in the quality of batches, showing identical particle size distributions become clearer with the additional evaluation of particle shape.
Shape recognition of single particlesWith laser diffraction the particle size distribution is determined by the characteristic diffraction pattern of a particle collective. In contrast, image analysis captures the physical properties of each single particle. The distribution of a property such as size or shape descriptor can thus be resolved in nearly any class.
With image analysis even smallest amounts of over or under sized par-ticles may be detected. Even single particles with specific geometric properties such as aggregates, fractures or foreign particles are traceable.
Image analysis operates in a similar way to a modern microscope: a digital camera with special optics captures the particles within the frame. Physical information about particle properties is transmitted to a com puter. For each single particle in the image size and shape descrip-tors are determined by evaluation software.
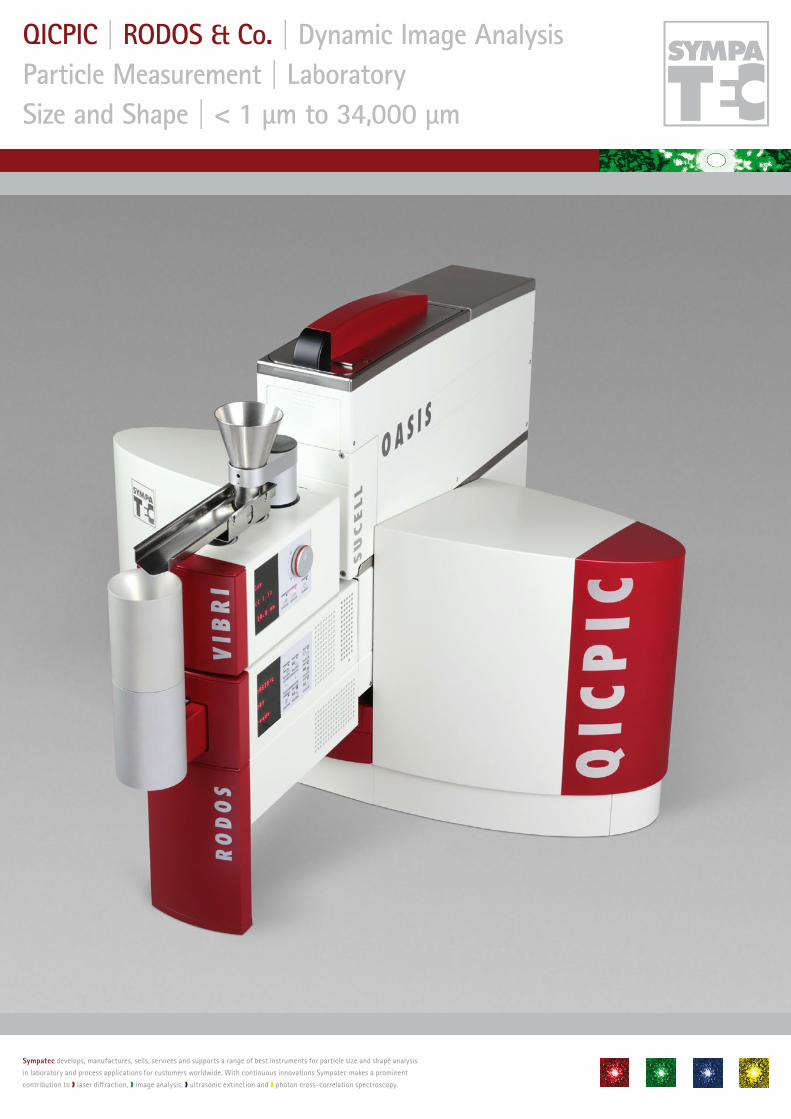
Static image analysis ➊Particles are prepared on to an object slide with a fixed orienta-tion, which may generate systematic errors. Particles are normally pre-sented with their largest area facing the camera, with little clue as to the real shape. Depending on nature and preparation of the sample, disper-sions may be poor with overlaying particles and hidden fine fractions.
The h statistical significance of static image analysis has the most substantial limitations. The particle number is significantly constrained
due to the limited size of the object slide leading to poor statistical analysis and larger error for broadly distributed particle collectives.
Dynamic image analysis ➋Considering dynamic image analysis the particles are streaming con-tinuously through the measuring volume controlled by the camera. The free movement leads to random orientation of the particles. From the different perspectives their actual shape and size distribution can be accurately determined.
With a continuous feed of dispersed particles reliable and representa-tive results are achieved based on a statistically significant number of particles. By closely controlling the concentration of the particle flow the overlay of particles is prevented.
h A standard deviation < 1 % for a number distribution
Q0(x) requires > 10,000 particles per size class. For a
volume related Q3(x) distribution the number of
particles required depends on the size distribution
itself. Here, for a standard deviation < 1 % more than
1,000,000 particles are necessary.
Camera
Object field
Object slide
Static particles
Camera
Particle flow
Velocity v
Freely movable particles
»All particles are spheres? Let us simply check ...«
➊
➋
QICPIC | Dynamic Image Analysis
The Universal Shapefinder
The Discovery of Shape – Particle after Particle after Particle
[3]
dynamic
QICPICDynamic image analysis with QICPIC
Applying components of highest performance our modular sensor QICPIC develops the full power of dynamic image analysis.
High speed image analysisUsing a pulsed light source with illumination times in the nanosec-ond range the particles are opti-cally frozen while a high-resolution, high-speed camera captures the razor-sharp particle projections with a frequency of up to 500 frames per second. With powerful algo-rithms QICPIC is evaluating millions of particles in shortest time and guarantees outstanding statistically relevant results.
Modular system designWith a selection of up to 4 from 7 available precision lenses the total measuring range from below 1 µm to 34 mm can be covered seamlessly. The wide dynamic measuring range of the optical modules (1:2,000) also means the characterization of disperse systems with broad distributions is easily achievable. As the images of each single particle is evaluated individually the quality of singling of particles is of prime importance. Applying dosing and dispersing units of modular design for dry and wet products QICPIC is flexible to adapt to powders, granules, fibres, suspensions and emulsions. This ensures a product-specific characterization matching the true nature of the application. The extremely short exposure time of the sensor and the high image frequency are adjusted to the dry disperser RODOS, which has been
proven in dry powder applications many thousands of times. Thus the particles or fibres, perfectly dispersed in an aerosol free jet, are accurately and sharply imaged even with particle velocities of up to 100 metres per second.
Meaningful resultsA specially developed optical set-up sets the h standards for precision of the measuring results. The particle outlines, generated in a parallel beam, are imaged with telecentric optics practically free of aberrations and with highest contrast – even for transparent particles. The camera precisely captures the particle projections with 256 greyscale intensities and a resolution of up to 4 megapixels. The raw data is transmitted to the computer for
storage and evaluation with transfer rates up to 25 gigabit per second.
Applying powerful algorithms the evaluation software provides all relevant size and shape descriptors within seconds after the measure-ment. Measures for length, width, equivalent circumference and diameter of a circle describe the size of a particle. Sphericity, aspect ratio, convexity and roundness provide information about the shape. Fibres can also be properly evaluated with length, diameter, straightness and elongation. All parameters may either be presented as distribution for the whole sample or individually for each single particle. A particle gallery with numerous selection and
filter parameters supports the gen-eration of specific and meaningful results. With the recorded particle video stored in the data-base the complete measurement can be viewed retrospectively.
Image analysis in the process
The powerful and proven system components of QICPIC are also avail-able for process integration. With PICTOS & Co disperser and sensor of QICPIC are integrated into one robust body, developed specifically for dry and wet on-line applica-tions. Elaborate technologies for representative in-line sampling make image analysis an excellent option for process control.
h QICPIC not only complies to the requirements of
the image analysis standard ISO 13322-1/2 but also
decisively defines parts of the standard since 2004.
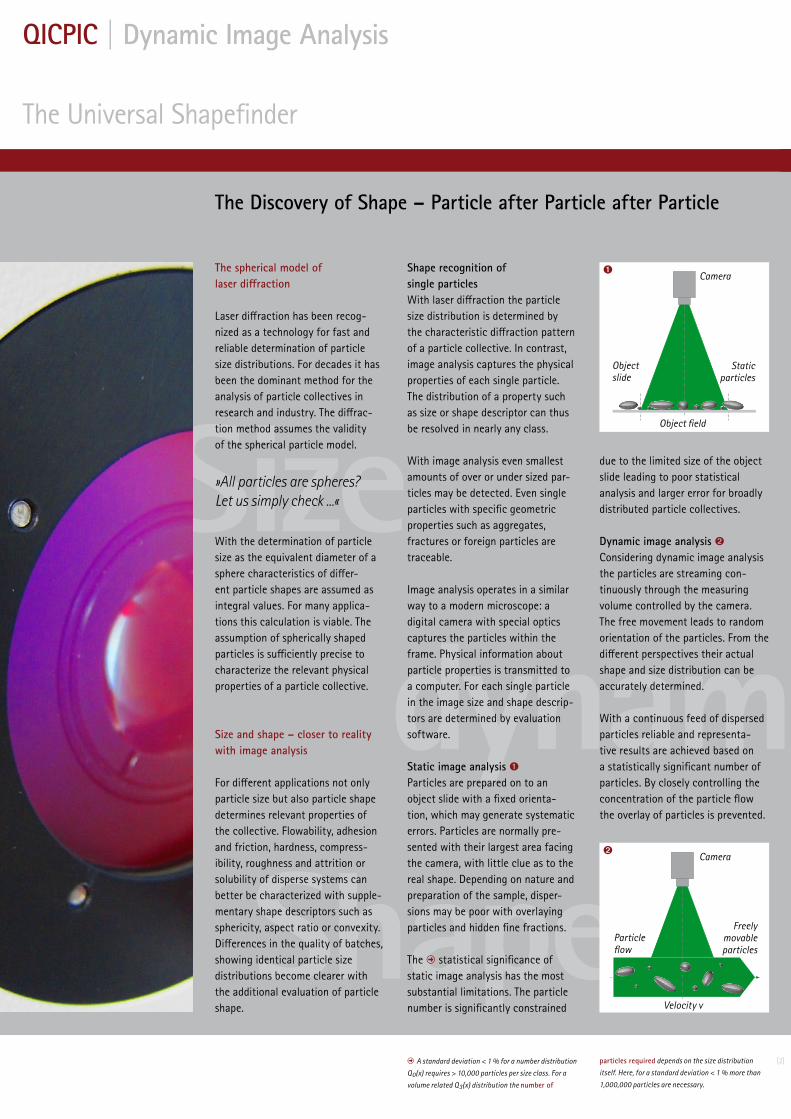
God’s Sparks | Aerosol free jet in the laser light of QICPIC
The quality of dispersion determines the significance and reliability of results – also for image analysis.
Innovations for High Performance Image Analysis
Fast. Product-fit. Reliable.
[4]
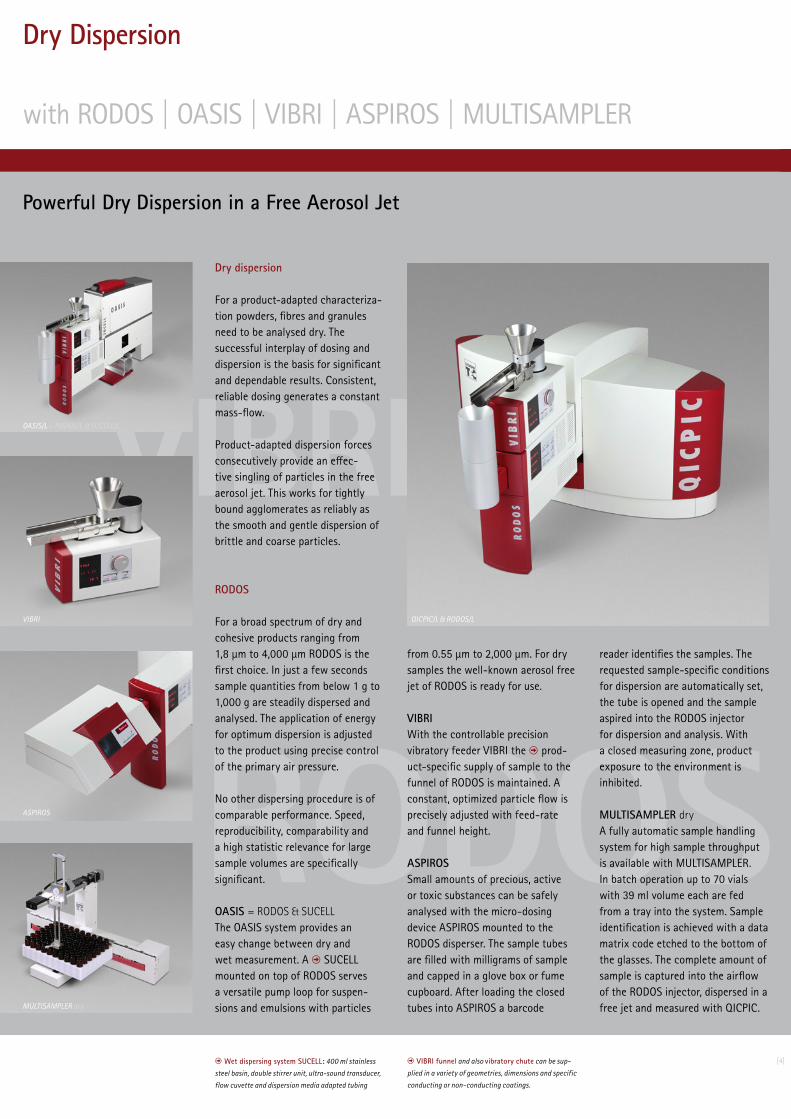
RODOS
VIBRIQICPIC/L & RODOS/L
OASIS/L = RODOS/L & SUCELL/L
ASPIROS
VIBRI
Dry dispersion
For a product-adapted characteriza-tion powders, fibres and granules need to be analysed dry. The successful interplay of dosing and dispersion is the basis for significant and dependable results. Consistent, reliable dosing generates a constant mass-flow.
Product-adapted dispersion forces consecutively provide an effec-tive singling of particles in the free aerosol jet. This works for tightly bound agglomerates as reliably as the smooth and gentle dispersion of brittle and coarse particles.
RODOS
For a broad spectrum of dry and cohesive products ranging from 1,8 µm to 4,000 µm RODOS is the first choice. In just a few seconds sample quantities from below 1 g to 1,000 g are steadily dispersed and analysed. The application of energy for optimum dispersion is adjusted to the product using precise control of the primary air pressure.
No other dispersing procedure is of comparable performance. Speed, reproducibility, comparability and a high statistic relevance for large sample volumes are specifically significant.
OASIS = RODOS & SUCELLThe OASIS system provides an easy change between dry and wet measurement. A h SUCELL mounted on top of RODOS serves a versatile pump loop for suspen-sions and emulsions with particles
from 0.55 µm to 2,000 µm. For dry samples the well-known aerosol free jet of RODOS is ready for use.
VIBRIWith the controllable precision vibratory feeder VIBRI the h prod-uct-specific supply of sample to the funnel of RODOS is maintained. A constant, optimized particle flow is precisely adjusted with feed-rate and funnel height.
ASPIROSSmall amounts of precious, active or toxic substances can be safely analysed with the micro-dosing device ASPIROS mounted to the RODOS disperser. The sample tubes are filled with milligrams of sample and capped in a glove box or fume cupboard. After loading the closed tubes into ASPIROS a barcode
reader identifies the samples. The requested sample-specific conditions for dispersion are automatically set, the tube is opened and the sample aspired into the RODOS injector for dispersion and analysis. With a closed measuring zone, product exposure to the environment is inhibited.
MULTISAMPLER dryA fully automatic sample handling system for high sample throughput is available with MULTISAMPLER. In batch operation up to 70 vials with 39 ml volume each are fed from a tray into the system. Sample identification is achieved with a data matrix code etched to the bottom of the glasses. The complete amount of sample is captured into the airflow of the RODOS injector, dispersed in a free jet and measured with QICPIC.
h VIBRI funnel and also vibratory chute can be sup-
plied in a variety of geometries, dimensions and specific
conducting or non-conducting coatings.
h Wet dispersing system SUCELL: 400 ml stainless
steel basin, double stirrer unit, ultra-sound transducer,
flow cuvette and dispersion media adapted tubing
MULTISAMPLER dry
Powerful Dry Dispersion in a Free Aerosol Jet
Dry Dispersion
with RODOS | OASIS | VIBRI | ASPIROS | MULTISAMPLER
[5]
Fine
Powders
+
0.6
0.7
0.8
0.9
1
1 10 100
0
0.5
1
1.5
2
2.5
3
0
10
20
30
40
50
60
70
80
90
100
1 10 100
0.6
0.7
0.8
0.9
1
1 10 100
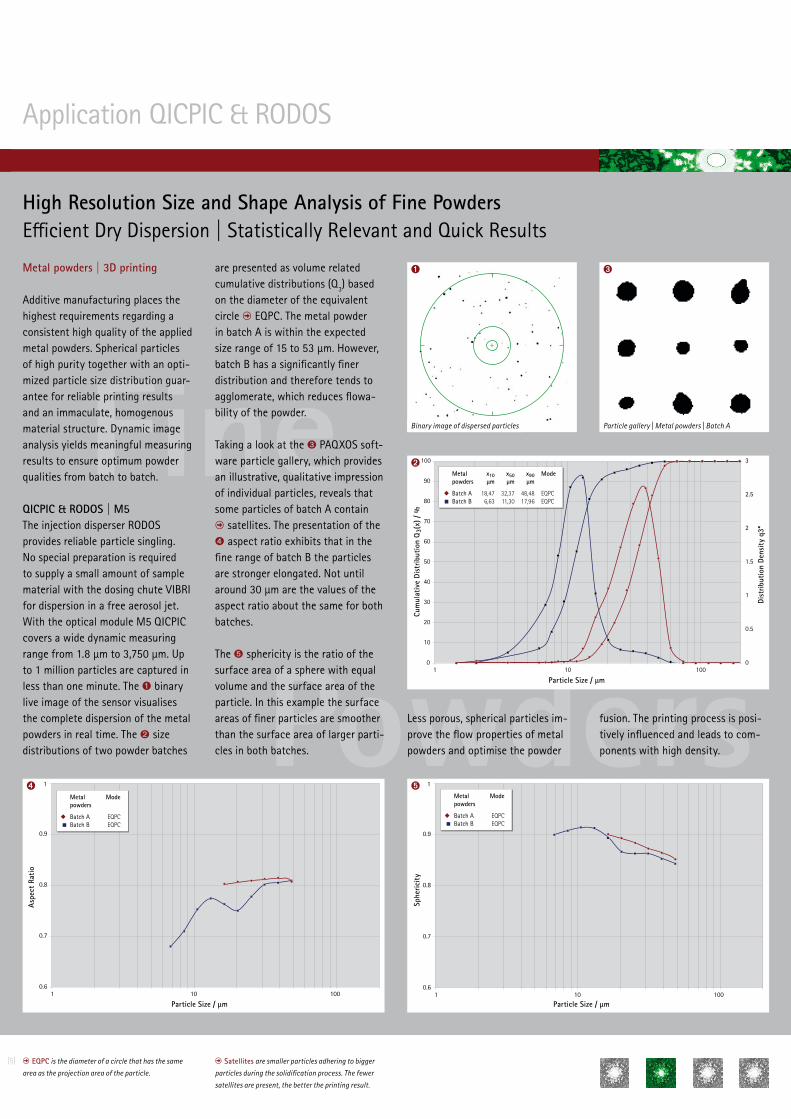
are presented as volume related cumulative distributions (Q3) based on the diameter of the equivalent circle h EQPC. The metal powder in batch A is within the expected size range of 15 to 53 µm. However, batch B has a significantly finer distribution and therefore tends to agglomerate, which reduces flowa-bility of the powder.
Taking a look at the ➌ PAQXOS soft-ware particle gallery, which provides an illustrative, qualitative impression of individual particles, reveals that some particles of batch A contain h satellites. The presentation of the ➍ aspect ratio exhibits that in the fine range of batch B the particles are stronger elongated. Not until around 30 µm are the values of the aspect ratio about the same for both batches.
The ➎ sphericity is the ratio of the surface area of a sphere with equal volume and the surface area of the particle. In this example the surface areas of finer particles are smoother than the surface area of larger parti-cles in both batches.
Metal powders | 3D printing
Additive manufacturing places the highest requirements regarding a consistent high quality of the applied metal powders. Spherical particles of high purity together with an opti-mized particle size distribution guar-antee for reliable printing results and an immaculate, homogenous material structure. Dynamic image analysis yields meaningful measuring results to ensure optimum powder qualities from batch to batch.
QICPIC & RODOS | M5The injection disperser RODOS provides reliable particle singling. No special preparation is required to supply a small amount of sample material with the dosing chute VIBRI for dispersion in a free aerosol jet. With the optical module M5 QICPIC covers a wide dynamic measuring range from 1.8 µm to 3,750 µm. Up to 1 million particles are captured in less than one minute. The ➊ binary live image of the sensor visualises the complete dispersion of the metal powders in real time. The ➋ size distributions of two powder batches
Less porous, spherical particles im-prove the flow properties of metal powders and optimise the powder
fusion. The printing process is posi-tively influenced and leads to com-ponents with high density.
➋
➊ ➌
➍ ➎
h Satellites are smaller particles adhering to bigger
particles during the solidification process. The fewer
satellites are present, the better the printing result.
Binary image of dispersed particles Particle gallery | Metal powders | Batch A
Particle Size / μm
Cum
ulat
ive
Dist
ribut
ion
Q3(
x) /
%
Dist
ribut
ion
Dens
ity
q3*
h EQPC is the diameter of a circle that has the same
area as the projection area of the particle.
Particle Size / μm
Sphe
ricit
y
Particle Size / μm
Asp
ect
Ratio
Metal Mode powders
◆ Batch A EQPC ■ Batch B EQPC
Metal Mode powders
◆ Batch A EQPC ■ Batch B EQPC
Metal x10 x50 x90 Mode powders µm µm µm
◆ Batch A 18,47 32,37 48,48 EQPC ■ Batch B 6,63 11,30 17,96 EQPC
High Resolution Size and Shape Analysis of Fine PowdersEfficient Dry Dispersion | Statistically Relevant and Quick Results
Application QICPIC & RODOS
[6]
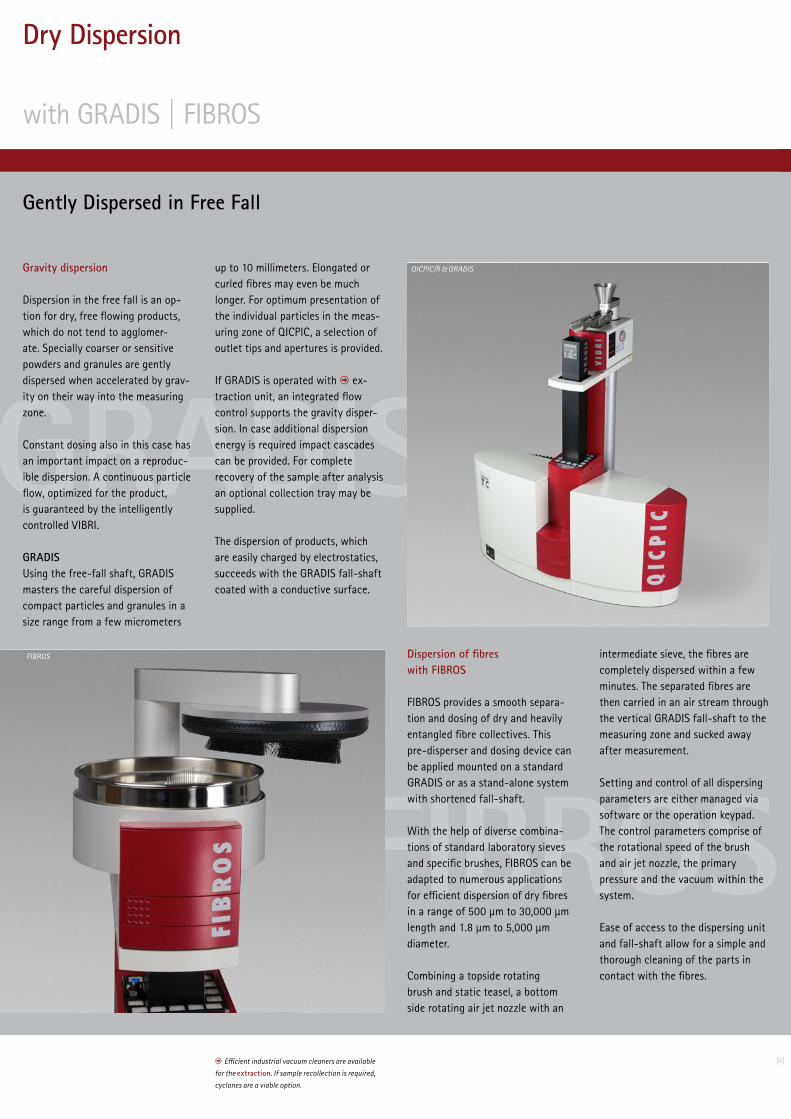
GRADIS
FIBROS
QICPIC/R & GRADIS
FIBROS
Gravity dispersion
Dispersion in the free fall is an op-tion for dry, free flowing products, which do not tend to agglomer-ate. Specially coarser or sensitive powders and granules are gently dispersed when accelerated by grav-ity on their way into the measuring zone.
Constant dosing also in this case has an important impact on a reproduc-ible dispersion. A continuous particle flow, optimized for the product, is guaranteed by the intelligently controlled VIBRI.
GRADISUsing the free-fall shaft, GRADIS masters the careful dispersion of compact particles and granules in a size range from a few micrometers
up to 10 millimeters. Elongated or curled fibres may even be much longer. For optimum presentation of the individual particles in the meas-uring zone of QICPIC, a selection of outlet tips and apertures is provided.
If GRADIS is operated with h ex-traction unit, an integrated flow control supports the gravity disper-sion. In case additional dispersion energy is required impact cascades can be provided. For complete recovery of the sample after analysis an optional collection tray may be supplied.
The dispersion of products, which are easily charged by electrostatics, succeeds with the GRADIS fall-shaft coated with a conductive surface.
Dispersion of fibres with FIBROS
FIBROS provides a smooth separa-tion and dosing of dry and heavily entangled fibre collectives. This pre-disperser and dosing device can be applied mounted on a standard GRADIS or as a stand-alone system with shortened fall-shaft.
With the help of diverse combina-tions of standard laboratory sieves and specific brushes, FIBROS can be adapted to numerous applications for efficient dispersion of dry fibres in a range of 500 µm to 30,000 µm length and 1.8 µm to 5,000 µm diameter.
Combining a topside rotating brush and static teasel, a bottom side rotating air jet nozzle with an
intermediate sieve, the fibres are completely dispersed within a few minutes. The separated fibres are then carried in an air stream through the vertical GRADIS fall-shaft to the measuring zone and sucked away after measurement.
Setting and control of all dispersing parameters are either managed via software or the operation keypad. The control parameters comprise of the rotational speed of the brush and air jet nozzle, the primary pressure and the vacuum within the system.
Ease of access to the dispersing unit and fall-shaft allow for a simple and thorough cleaning of the parts in contact with the fibres.
h Efficient industrial vacuum cleaners are available
for the extraction. If sample recollection is required,
cyclones are a viable option.
Gently Dispersed in Free Fall
Dry Dispersion
with GRADIS | FIBROS
[7]
reproducible
Granulates
0
0.5
1.0
1.5
2.0
10 100 1000
0
10
20
30
40
50
60
70
80
90
100
0 0.1 0.2 0.3 0.4 0.5 0.6 0.7 0.8 0.9 1.0
0.6
0.7
0.8
10 100 1000
EQPC
Feretmax
Feretmin
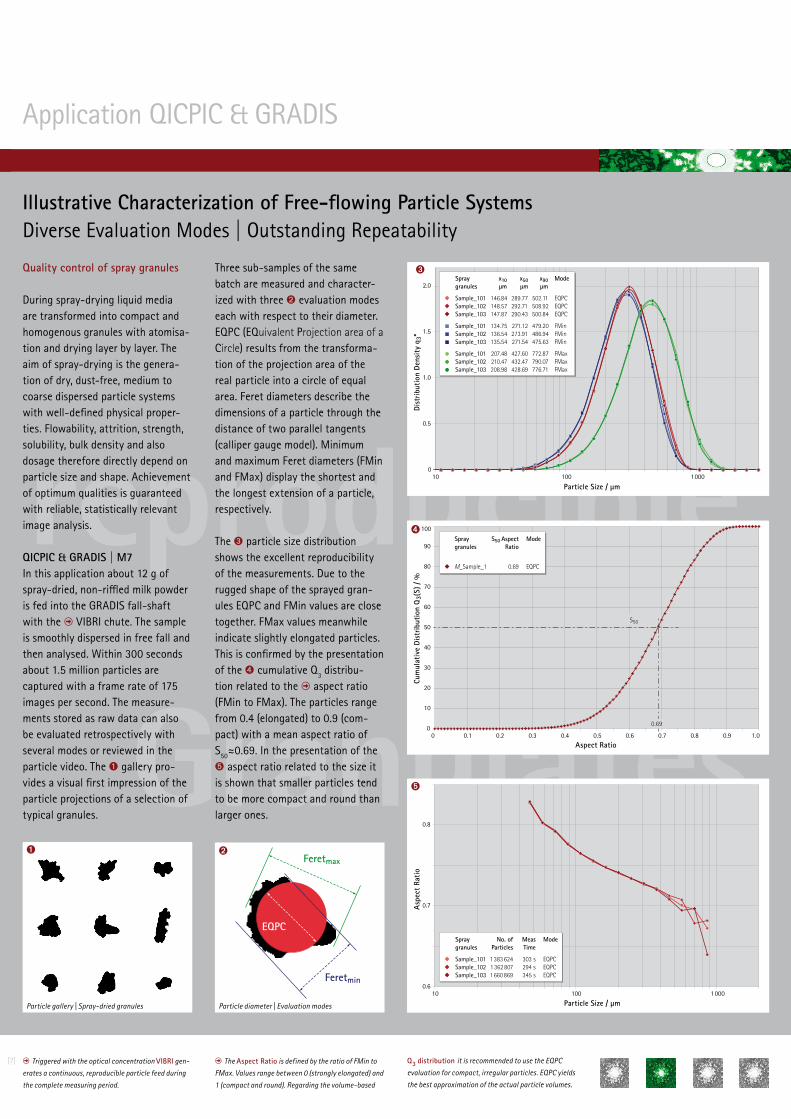
Quality control of spray granules
During spray-drying liquid media are transformed into compact and homogenous granules with atomisa-tion and drying layer by layer. The aim of spray-drying is the genera-tion of dry, dust-free, medium to coarse dispersed particle systems with well-defined physical proper-ties. Flowability, attrition, strength, solubility, bulk density and also dosage therefore directly depend on particle size and shape. Achievement of optimum qualities is guaranteed with reliable, statistically relevant image analysis.
QICPIC & GRADIS | M7In this application about 12 g of spray-dried, non-riffled milk powder is fed into the GRADIS fall-shaft with the h VIBRI chute. The sample is smoothly dispersed in free fall and then analysed. Within 300 seconds about 1.5 million particles are captured with a frame rate of 175 images per second. The measure-ments stored as raw data can also be evaluated retrospectively with several modes or reviewed in the particle video. The ➊ gallery pro-vides a visual first impression of the particle projections of a selection of typical granules.
Three sub-samples of the same batch are measured and character-ized with three ➋ evaluation modes each with respect to their diameter. EQPC (EQuivalent Projection area of a Circle) results from the transforma-tion of the projection area of the real particle into a circle of equal area. Feret diameters describe the dimensions of a particle through the distance of two parallel tangents (calliper gauge model). Minimum and maximum Feret diameters (FMin and FMax) display the shortest and the longest extension of a particle, respectively.
The ➌ particle size distribution shows the excellent reproducibility of the measurements. Due to the rugged shape of the sprayed gran-ules EQPC and FMin values are close together. FMax values meanwhile indicate slightly elongated particles. This is confirmed by the presentation of the ➍ cumulative Q3 distribu-tion related to the h aspect ratio (FMin to FMax). The particles range from 0.4 (elongated) to 0.9 (com-pact) with a mean aspect ratio of S50≈0.69. In the presentation of the ➎ aspect ratio related to the size it is shown that smaller particles tend to be more compact and round than larger ones.
➊
➌
➍
➎
➋
h Triggered with the optical concentration VIBRI gen-
erates a continuous, reproducible particle feed during
the complete measuring period.
Particle Size / μm
Dist
ribut
ion
Dens
ity
q 3*
Particle gallery | Spray-dried granules
Aspect Ratio
Cum
ulat
ive
Dist
ribut
ion
Q3(
S) /
%A
spec
t Ra
tio
Particle Size / μm
0.69
S50
Spray x10 x50 x90 Mode granules µm µm µm
◆ Sample_101 146.84 289.77 502.11 EQPC ◆ Sample_102 148.57 292.71 508.92 EQPC ◆ Sample_103 147.87 290.43 500.84 EQPC
■ Sample_101 134.75 271.12 479.20 FMin ■ Sample_102 136.54 273.91 486.94 FMin ■ Sample_103 135.54 271.54 475.63 FMin
● Sample_101 207.48 427.60 772.87 FMax ● Sample_102 210.47 432.47 790.07 FMax ● Sample_103 208.98 428.69 776.71 FMax
Spray S50 Aspect Mode granules Ratio
◆ M_Sample_1 0.69 EQPC
Spray No. of Meas Mode granules Particles Time
◆ Sample_101 1 383 624 303 s EQPC ◆ Sample_102 1 362 807 294 s EQPC ◆ Sample_103 1 660 869 345 s EQPC
h The Aspect Ratio is defined by the ratio of FMin to
FMax. Values range between 0 (strongly elongated) and
1 (compact and round). Regarding the volume-based
Q3 distribution it is recommended to use the EQPC
evaluation for compact, irregular particles. EQPC yields
the best approximation of the actual particle volumes.
Particle diameter | Evaluation modes
Application QICPIC & GRADIS
Illustrative Characterization of Free-flowing Particle SystemsDiverse Evaluation Modes | Outstanding Repeatability
[8][8]
MIXCEL
LIXELL
FLOW CELLFLOWCELL 20
QICPIC/R & LIXELL & LIQXI
MIXCEL
[8]
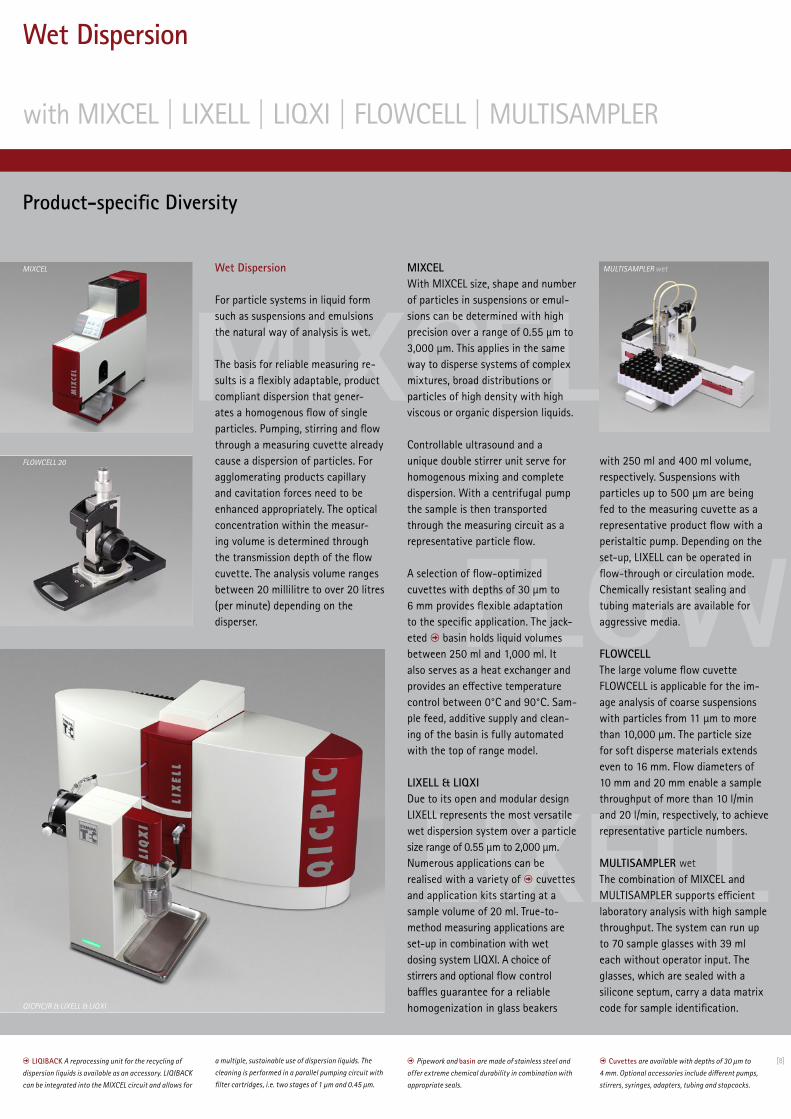
Wet Dispersion
For particle systems in liquid form such as suspensions and emulsions the natural way of analysis is wet.
The basis for reliable measuring re-sults is a flexibly adaptable, product compliant dispersion that gener-ates a homogenous flow of single particles. Pumping, stirring and flow through a measuring cuvette already cause a dispersion of particles. For agglomerating products capillary and cavitation forces need to be enhanced appropriately. The optical concentration within the measur-ing volume is determined through the transmission depth of the flow cuvette. The analysis volume ranges between 20 millilitre to over 20 litres (per minute) depending on the disperser.
MIXCELWith MIXCEL size, shape and number of particles in suspensions or emul-sions can be determined with high precision over a range of 0.55 µm to 3,000 µm. This applies in the same way to disperse systems of complex mixtures, broad distributions or particles of high density with high viscous or organic dispersion liquids.
Controllable ultrasound and a unique double stirrer unit serve for homogenous mixing and complete dispersion. With a centrifugal pump the sample is then transported through the measuring circuit as a representative particle flow.
A selection of flow-optimized cuvettes with depths of 30 µm to 6 mm provides flexible adaptation to the specific application. The jack-eted h basin holds liquid volumes between 250 ml and 1,000 ml. It also serves as a heat exchanger and provides an effective temperature control between 0°C and 90°C. Sam-ple feed, additive supply and clean-ing of the basin is fully automated with the top of range model.
LIXELL & LIQXIDue to its open and modular design LIXELL represents the most versatile wet dispersion system over a particle size range of 0.55 µm to 2,000 µm. Nu merous applications can be realised with a variety of h cuvettes and application kits starting at a sample volume of 20 ml. True-to-method measuring applications are set-up in combination with wet dosing system LIQXI. A choice of stirrers and optional flow control baffles guarantee for a reliable homogenization in glass beakers
with 250 ml and 400 ml volume, respectively. Suspensions with particles up to 500 µm are being fed to the measuring cuvette as a representative product flow with a peristaltic pump. Depending on the set-up, LIXELL can be operated in flow-through or circulation mode. Chemically resistant sealing and tubing materials are available for aggressive media.
FLOWCELLThe large volume flow cuvette FLOWCELL is applicable for the im-age analysis of coarse suspensions with particles from 11 µm to more than 10,000 µm. The particle size for soft disperse materials extends even to 16 mm. Flow diameters of 10 mm and 20 mm enable a sample throughput of more than 10 l/min and 20 l/min, respectively, to achieve representative particle numbers.
MULTISAMPLER wetThe combination of MIXCEL and MULTISAMPLER supports efficient laboratory analysis with high sample throughput. The system can run up to 70 sample glasses with 39 ml each without operator input. The glasses, which are sealed with a silicone septum, carry a data matrix code for sample identification.
h Cuvettes are available with depths of 30 µm to
4 mm. Optional accessories include different pumps,
stirrers, syringes, adapters, tubing and stopcocks.
h Pipework and basin are made of stainless steel and
offer extreme chemical durability in combination with
appropriate seals.
MULTISAMPLER wet
h LIQIBACK A reprocessing unit for the recycling of
dispersion liquids is available as an accessory. LIQIBACK
can be integrated into the MIXCEL circuit and allows for
a multiple, sustainable use of dispersion liquids. The
cleaning is performed in a parallel pumping circuit with
filter cartridges, i.e. two stages of 1 µm and 0.45 µm.
Wet Dispersion
with MIXCEL | LIXELL | LIQXI | FLOWCELL | MULTISAMPLER
Product-specific Diversity
[9][9]
LIXELL
FLOW CELL
SphericityQICPIC /R & FLOWCELL
0
0.5
1
1.5
2
2.5
3
0
10
20
30
40
50
60
70
80
90
100
100 1 000 10 0000
10
20
30
40
50
60
70
80
90
100
0 0.1 0.2 0.3 0.4 0.5 0.6 0.7
[9]
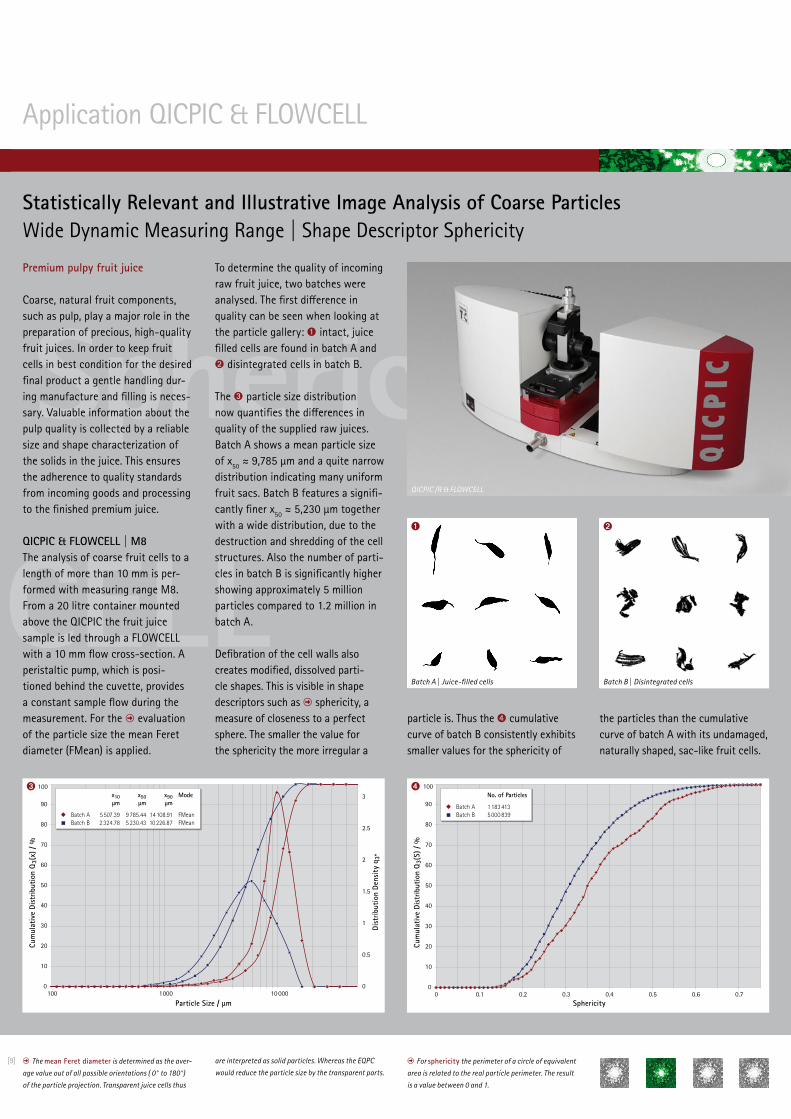
To determine the quality of incoming raw fruit juice, two batches were analysed. The first difference in quality can be seen when looking at the particle gallery: ➊ intact, juice filled cells are found in batch A and ➋ disintegrated cells in batch B.
The ➌ particle size distribution now quantifies the differences in quality of the supplied raw juices. Batch A shows a mean particle size of x50 ≈ 9,785 µm and a quite narrow distribution indicating many uniform fruit sacs. Batch B features a signifi-cantly finer x50 ≈ 5,230 µm together with a wide distribution, due to the destruction and shredding of the cell structures. Also the number of parti-cles in batch B is significantly higher showing approximately 5 million particles compared to 1.2 million in batch A.
Defibration of the cell walls also creates modified, dissolved parti-cle shapes. This is visible in shape descriptors such as h sphericity, a measure of closeness to a perfect sphere. The smaller the value for the sphericity the more irregular a
Premium pulpy fruit juice
Coarse, natural fruit components, such as pulp, play a major role in the preparation of precious, high-quality fruit juices. In order to keep fruit cells in best condition for the desired final product a gentle handling dur-ing manufacture and filling is neces-sary. Valuable information about the pulp quality is collected by a reliable size and shape characterization of the solids in the juice. This ensures the adherence to quality standards from incoming goods and processing to the finished premium juice.
QICPIC & FLOWCELL | M8The analysis of coarse fruit cells to a length of more than 10 mm is per-formed with measuring range M8. From a 20 litre container mounted above the QICPIC the fruit juice sample is led through a FLOWCELL with a 10 mm flow cross-section. A peristaltic pump, which is posi-tioned behind the cuvette, provides a constant sample flow during the measurement. For the h evaluation of the particle size the mean Feret diameter (FMean) is applied.
particle is. Thus the ➍ cumulative curve of batch B consistently exhibits smaller values for the sphericity of
the particles than the cumulative curve of batch A with its undamaged, naturally shaped, sac-like fruit cells.
h The mean Feret diameter is determined as the aver-
age value out of all possible orientations ( 0° to 180°)
of the particle projection. Transparent juice cells thus
are interpreted as solid particles. Whereas the EQPC
would reduce the particle size by the transparent parts.
Batch A | Juice-filled cells Batch B | Disintegrated cells
Cum
ulat
ive
Dist
ribut
ion
Q3(
S) /
%
Cum
ulat
ive
Dist
ribut
ion
Q3(
x) /
%
Dist
ribut
ion
Dens
ity
q 3*
Particle Size / μm Sphericity
h For sphericity the perimeter of a circle of equivalent
area is related to the real particle perimeter. The result
is a value between 0 and 1.
➊ ➋
➌ ➍ x10 x50 x90 Mode µm µm µm
◆ Batch A 5 507.39 9 785.44 14 108.91 FMean ■ Batch B 2 324.78 5 230.43 10 226.87 FMean
No. of Particles
◆ Batch A 1 183 413 ■ Batch B 5 000 839
Application QICPIC & FLOWCELL
Statistically Relevant and Illustrative Image Analysis of Coarse ParticlesWide Dynamic Measuring Range | Shape Descriptor Sphericity
[10]
PICTOSTWISTER
on-linePulverhaus
0
1
2
3
4
5
6
7
8
9
10
0
10
20
30
40
50
60
70
80
90
100
1000
0
0,05
0,1
0,15
0,2
0,25
1375 1425 1475 1525
Production of EPS Raw Beads
The foaming of Expandable Polysty-rene (EPS) materials requires high density EPS beads as a raw material. After its initial polymerization the compact and granular EPS is rinsed, dried, sieved and packed. Depend-ing on its final h application, the EPS beads need to fulfil specific requirements regarding particle size distribution.
The raw beads are separated into different product qualities with tight specifications applying large-scale screen decks. While sieving small-est amounts of oversized grain are indicators for a beginning screen damage. In order to avoid production down time and expensive repro-cessing of rejected batches screen failures need to be detected reliably at an early stage.
Due to its ability to detect single particles dynamic image analysis provides exceptional sensitivity. Smallest amounts of coarse material is reliably detected even within nar-row size distributions.
PICTOS & TWISTERThe application showcases the monitoring of screen decks of nine product lines, operating in parallel. Sampling is realized with the dy-namic probe TWISTER continuously scanning the product flow in each line. The probe tip is travelling the entire pipe cross-section on a spiral path in order to yield a representa-tive sample.
Line by line, the vacuum of the integrated RODOS injector aspirates the sample and creates a perfectly
dispersed free aerosol jet inside the PICTOS measuring zone. The 10 mm RODOS nozzle together with the optical module M8 of PICTOS is mastering a measuring range of about 10 µm up to 3,500 µm.
Two batches of EPS beads have been analysed. The first batch (EPS A) was contaminated with a small amount of coarser material in order to test the sensitivity of the on-line image analysis. Evaluation of particle size is based on diameter-oriented EQPC (EQuivalent Projection area of a Circle).
The ➊ size distributions of both batches display the narrow grain range of about 900 µm to 1,500 µm, which was result of the fractiona-tion. There is no significant deviation between the two batches, regarding the respective values for mean par-ticle diameter of x50,EPS_A ≈ 1,157 µm and x50,EPS_B ≈ 1,151 µm.
More critical is the ➋ residue at 1,400 µm. In order to comply with the specifications, the coarse frac-tion is not to exceed a value of R3,1400 < 0.5 %. The contaminated batch EPS A displays a slightly in-creased amount of coarse material of 0.57 %, indicating a screen break-
age at a very early stage. PICTOS is capable of resolving these fine vari-ations reliably thus inducing a timely change of screen decks.
A powerful computing infrastructure guarantees for fastest measurement
cycles for all nine production lines. Based on our control and evaluation software, three dedicated comput-ers take care of device control and data acquisition, data evaluation and visualisation of measuring results at the master display.
h EPS materials are foamed up from granular,
compact EPS raw beads with steam and moulded to
solid masses and final shapes depending on the final
application. The beads are growing to a multiple of
its initial volume throughout the (repeated) swelling
process. Typical applications include e.g., noise and
Cum
ulat
ive
Dist
ribut
ion
Q3(
x) /
%
Dist
ribut
ion
Dens
ity
q 3*
Particle Size / μm
heat insulation materials for construction and shock
absorbing packing material.
500 5000
TWISTER | in-line Sampling
PICTOS | on-line Image Analysis Sensor with RODOS-Dispersion
➊
●➋ x10 x50 x90 µm µm µm
◆ EPS A 1 004.06 1 157.22 1 291.26 ■ EPS B 998.23 1 151.20 1 287.36
R3,1 400
◆ EPS A 0.57 % ■ EPS B 0.22 %
Reliable Detection of Oversized ParticlesGreatest Sensitivity | Production Control in Real-Time
Image Analysis on-line
Application PICTOS & TWISTER
[11]
PulverhausConfidence
Perspective
“A classic is timeless and at the same time ahead of its time.”
The variety of disperse products requires innovative and sustainable technologies to master the challeng-es in today’s research, development, quality and production control.
With dry dispersion we have introduced product orientation and adaptation to laser diffraction. The HELOS sensor family and a unique, powerful selection of dispersing units – spear-headed by RODOS – offer you premium performance. Our laser diffraction instruments allow for a significant extension of your particle knowledge concerning size and size distributions.
New questions and desires inevitably arise with boundless progress. Power of innovation consequently remains key to future developments.
Today, if we encounter application limits of laser diffraction e.g., in sus-pensions of high optical concentra-tion, we offer efficient solutions with ultrasonic extinction (NIMBUS).
If particle shape becomes of inter-est, we provide a great spectrum of powerful solutions with high-speed dynamic image analysis (QICPIC family). Now even sophisticated fibre analysis is amongst the range of multifaceted particle shape aspects.
And should particles predominantly belong to the nanometre range, we have brought the unique Photon Cross-Correlation Spectroscopy (PCCS) to market with Sympatec‘s NANOPHOX.
By nature, we also keep an eye on the production of disperse systems when developing methods of particle characterization. Hence, you may also have confidence to address us in case process control becomes an issue. Laser diffraction with MYTOS, ultrasonic extinction with OPUS and dynamic image analysis with PICTOS are hundredfold approved process applications from Sympatec.
Designed with a consistent techno-logical basis, our in-, on- and at-line systems reliably deliver results that are perfectly comparable to those of our laboratory instruments – most accurate, reproducible and at the shortest measuring times.
As “Particle People” we originate from the powder technology field. We have a natural approach to process engineering and the production of disperse systems. The collective particle expertise of our physicists, mathematicians, computer scientists, engineers, electronic and mechanic techni-cians is built into our instruments.
Your particles in the best of hands with us.
Better Particles with Best Instruments.
Development of Innovative Methods for Particulate Systems CharacterizationLaser Diffraction | Image Analysis | Ultrasonic Extinction | PCCS
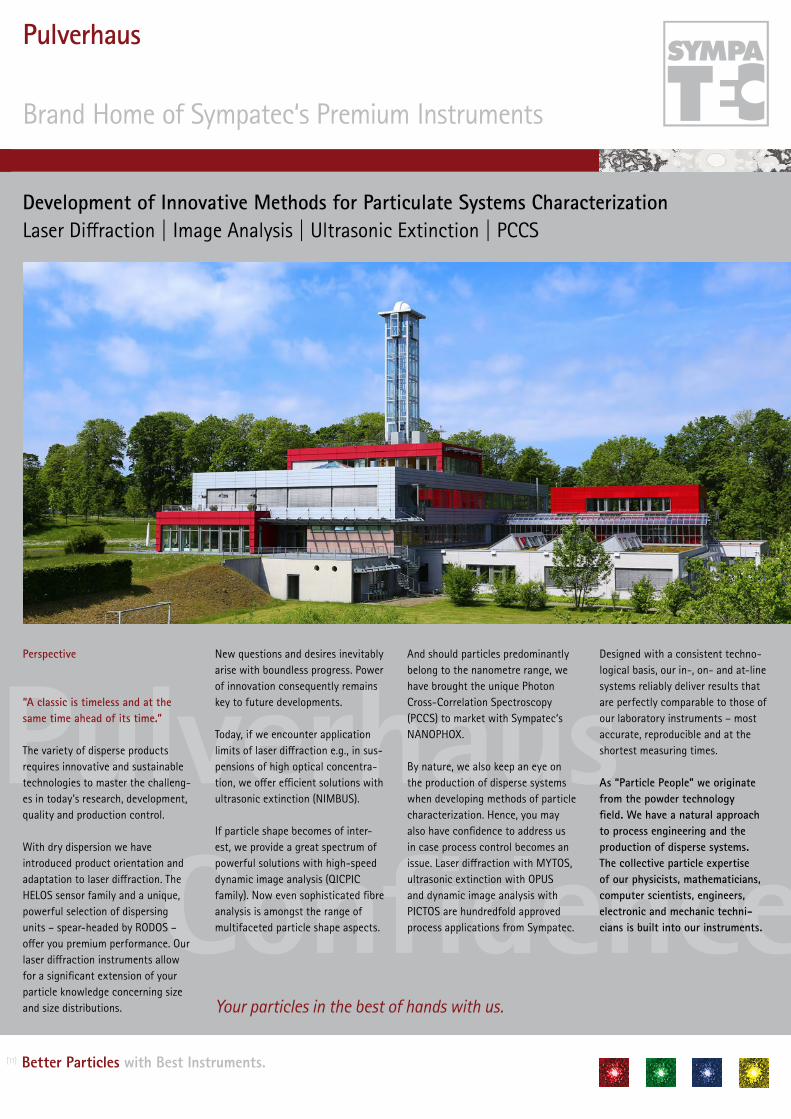
Pulverhaus
Brand Home of Sympatec‘s Premium Instruments

worldwidepartners
❱ Your personal contact
❱ Partner❱ Sympatec
Sympatec sales offices
Partner enterprises
Partner periphery
Sympatec Pulverhaus
United Kingdom & Republic of IrelandManchester GB+44 161 763 5757
Head Office AmericasUSA & Canada East Coast Princeton NJ +1 609 303 0066
USA MidwestIndianapolis IN+1 812 859 3699
USA & Canada WestFort Collins CO+1 267 886 3455
KoreaSeoul+82 2 3443 7237
India & South AsiaMumbai & Chennai IN+91 81 2257 1208
Australia & OceaniaSydney AU+61 439 739 560
HeadquartersPulverhaus ClausthalGermany & Eastern Europe+49 5323 717 0
Germany South & AlpsSoutheastern EuropeAugsburg+49 8231 605 7991
Germany WestKrefeld | Service+49 2151 978 100 | 101
Switzerland Basel+41 61 303 1040
BeNeLuxBreda NL+31 76 503 1634
France Paris+33 1 6918 1955
NordicJönköping SE+46 70 6641 701
Commonwealth ofIndependent States (CIS)Ekaterinburg RU+7 343 311 6147
Head Office ChinaGrand East | HK | TW | MCSuzhou+86 512 6660 7566
China Grand NorthBeijing+86 10 6831 1290
China Grand SouthGuangzhou+86 136 5621 8634
China EastQingdao+86 139 1553 8679
China NorthwestXi’an+86 151 6244 7476
China SouthwestChengdu+86 188 9674 0965
❱ 03 2019 All rights reserved.
All information without guarantee and
subject to change without notice.
❱ Contact +49 5323 717 0
❱ Sympatec GmbH – System | Partikel | Technik
Am Pulverhaus 1, 38678 Clausthal-Zellerfeld
Germany
Sales | Service and Partner Network
Particle Measurement and Know-how from PulverhausSeveral Thousand InstallationsAt Particle Professionals Worldwide


![Sh - [∫] [∫] She sells sea shells at the sea shore. The shells she sells are surely sea shells. So if she sells shells on the seashore, I'm sure she sells](https://img.pdfslide.us/doc/110x75/56649f165503460f94c2b775/sh-she-sells-sea-shells-at-the-sea-shore-the-shells-she-sells.jpg)