Embed Size (px)
Citation preview

Dynamic Hedging of Portfolio Credit Risk in a Markov Copula
Model
Tomasz R. Bielecki1,∗, Areski Cousin2†,
Stephane Crepey3,‡, Alexander Herbertsson4,§
1 Department of Applied Mathematics
Illinois Institute of Technology, Chicago, IL 60616, USA
2 Universite de Lyon, Universite Lyon 1, LSAF, France
3 Laboratoire Analyse et Probabilites
Universite d’Evry Val d’Essonne, 91025 Evry Cedex, France
4 Centre for finance/Department of Economics
University of Gothenburg, SE 405 30 Goteborg, Sweden
October 8, 2012
Abstract
We consider a bottom-up Markovian copula model of portfolio credit risk wheredependence among credit names mainly stems from the possibility of simultaneous de-faults. Due to the Markovian copula nature of the model, calibration of marginals anddependence parameters can be performed separately using a two-steps procedure, muchlike in a standard static copula set-up. In addition, the model admits a common shocksinterpretation, which is a very important feature as, thanks to it, efficient convolutionrecursion procedures are available for pricing and hedging CDO tranches, conditionallyon any given state of the underlying multivariate Markov process. As a result this modelallows us to dynamically hedge CDO tranches using single-name CDSs in a theoreticallysound and practically convenient way. To illustrate this we calibrate the model againstmarket data on CDO tranches and the underlying single-name CDSs. We then studythe loss distributions as well as the min-variance hedging strategies in the calibratedportfolios.
Keywords: Portfolio Credit Risk, Basket Credit Derivatives, Markov Copula Model,Common Shocks, Dynamic Min-Variance Hedging.
∗The research of T.R. Bielecki was supported by NSF Grant DMS–0604789 and NSF Grant DMS–0908099.†The research of A. Cousin benefited from the support of the DGE and the ANR project Ast&Risk.‡The research of S. Crepey benefited from the support of the ‘Chaire Risque de credit’, Federation
Bancaire Francaise.§The research of A. Herbertsson was supported by the Jan Wallander and Tom Hedelius Foundation and
by Vinnova

2
1 Introduction
The CDO market have been deeply and adversely impacted by the last financial crises. Inparticular, CDO issuances have become quite rare. Nevertheless, there are huge notionalsof CDO contracts outstanding and market participants continue to be confronted with thetask to hedge their positions in these contracts up to maturity date. Moreover, accordingto the current regulation (see [3]), tranches on standard indices and their associated liquidhedging positions continue to be charged as hedge-sets under internal VaR-based method,which makes the issue of hedging even more important for standardized CDO tranches. Forprevious studies of this issue we refer the reader to, among others, Laurent, Cousin andFermanian [31], Frey and Backhaus [24], Cont and Kan [15] or Cousin, Crepey and Kan [17].In particular it has been established empirically in [15] and [17] that a single-instrumenthedge of a CDO tranche by the corresponding credit index is often not good enough. In thispaper we deal with a bottom-up Markovian copula model, in which hedging loss derivativesby single-name instruments can be performed in a theoretically sound and practical way.
There are two major theoretical contributions of the paper:
• First, we construct a Markov copula model that is adequate for the problem at hand,that is for the problem of dynamic hedging of portfolio credit risk. The (dynamic)copula property of the model allows for separation of calibration of the univariatemarginals of the underlying multivariate Markov process, from calibration of the de-pendence structure between the components of the process. This is of critical impor-tance from the practical point of view.
• Second, we provide the common shocks interpretation of our Markovian copula model.This is important from the practical point of view as this interpretation underlies semi-explicit, convolution based pricing and Greeking schemes for basket credit derivatives.Such numerical schemes play a crucial role when calibrating credit portfolio modelsand in related applications such as counterparty risk valuation for portfolios (see[2, 6]). This allows one to address in a dynamic and theoretically consistent way theissues of hedging basket credit derivatives by individual names, whilst preserving thestatic common factor tractability.
The common shock aspect of our model is related to the work by Elouerkhaoui [22](see also Brigo et al. [12, 13, 14]). Consequently, some results derived in this paper areconsistent with results derived in [22]. However, there are major differences between ourstudy and the one presented in [22]:
• First of all, while Elouerkhaoui [22] works in a point-process set-up, we use a Marko-vian model; the practical interest of our framework is thus an increased model tractabil-ity, especially with regard to the dynamic hedging aspect of our approach;
– In particular, the approach of [22] suffers from the “curse of dimensionality” dueto the need of summation (integration) over the set denoted by Πn in [22] (see forexample equation (2.6) therein, and compare with our own result (17) below),the set of all subsets of the set 1, 2, . . . , n. By contrast, the complexity of ourformula (7) for the generator of our Markov process, or of our common shockalgorithms described in Subsection 3.3, are controlled by the cardinality of ourtriggering-events set Y, which one can typically be taken of the order of n inapplications; see Section 4.

3
• Secondly, as already stated, our methodology allows for separation of calibration ofidiosyncratic (marginal) laws of the underlying Markov process, from the calibration ofthe dependence structure of the process. The calibration really amounts to calibratingthe infinitesimal generator of the underlying Markov process, and once this is done,the model can be used for consistent pricing and hedging of both the underlyingproducts, such as CDO tranches, as well as options on such with future expirationdates; this feature obviously contributes to increased practical use of our methodology.In this sense, our Markov copula model is a genuine dynamic model, as a model ofdependence between underlying stochastic processes. This not really the case withthe model developed in [22], where the “dynamic copula” feature is in the sense ofPatton’s conditional copula [37], which is a stochastic process itself, and as such can’tbe calibrated to initial data.
• Last, but not least, the Markov copula approach of this paper is generic in the sensethat, as demonstrated in [10, 11], it also applies to modeling of dynamics of creditratings. This is not the case with the approach of [22].
Comparing now our methodology to the what is done in Brigo et al. [12, 13, 14], wesee that the major differences can be summarized as follows:
• We are using a truly dynamic copula method, whereas in [12, 13, 14] a dynamicrepresentation of essentially static copula – i.e. the Marshall-Olkin copula – is used.
• Our approach is a bottom-up approach, hence an approach applicable for hedgingbasket products using individual names, whereas the approach taken in [12, 13] is atop-down approach, and, as such, is not applicable for hedging basket products usingindividual names;
– This also applies to the so-called GPCL extension of the model of [14] in whichindividual names are represented of the model so that, in principle, hedging bas-ket products using individual names could be considered in this setup. This isnot practical however because fault of a suitable decoupling property betweenthe dependence structure and the individual names in the model, the calibrationof the model can only be addressed through a global joint optimization proce-dures involving all the model parameters at the same time, which is untractablenumerically.
• Again, our approach is generic in the sense that it also applies to modeling of dynamicsof credit ratings. This is not the case with the approach of [12, 13, 14].
The paper is organized as follows. In Section 2 we formulate a bottom-up Markoviancopula model, in which individual default processes for various credit names are coupledtogether by means of simultaneous defaults. We then prove that conditionally on the fullinformation in this model, the dependence structure of surviving names is equivalent to aMarshall-Olkin copula. In Section 3 we use this equivalence with the Marshall-Olkin frame-work in order to derive a common shocks model interpretation of our Markovian setting.This enables us to derive fast deterministic computational tractable algorithms for pricingand Greeking schemes in our heterogeneous model. In Section 4 we present numerical resultsof calibration against market data from CDO tranches as well as individual CDS spreads.We also discuss hedging sensitivities computed in the models thus calibrated. Technical

4
proofs are deferred to Appendix A.
In the rest of the paper we consider a risk neutral pricing model (Ω,F ,P), for a filtrationF = (Ft)t∈[0,T ] which will be specified below and where T ≥ 0 is a fixed time horizon. Wedenote Nn = 1, . . . , n and let Nn denote the set of all subsets of Nn where n representsthe number of obligors in the underlying credit portfolio. Further, we set max ∅ = −∞.
2 Model of Default Times
In this section we construct a bottom-up Markovian model consisting of a multivariatefactor process X and a vector H representing the default indicator processes in a pool of ndifferent credit names. More specifically, Ht is a vector in 0, 1n where the i-th entry ofHt is the indicator function for the event of a default of obligor i up to time t. The purposeof the factor process X is to more realistically model diffusive randomness of credit spreads.
In our model defaults are the consequence of some “triggering-events” associated withgroups of obligors. We then define the following pre-specified set of groups
Y = 1, . . . , n, I1, . . . , Im,
where I1, . . . , Im are m subsets of Nn (elements of the set Nn of all parts of Nn), and eachgroup Il contains at least two obligors or more. The triggering events are divided in twocategories: the ones associated with singletons 1, . . . , n can only trigger the default ofname 1, . . . , n individually, while the others associated with multi-name groups I1, . . . , Immay simultaneously trigger the default of all names in these groups. Note that severaltriggering events may affect the same particular name, so that only the one occurring firsteffectively triggers the default of that name. As a result, when a triggering-event associatedwith a specific group occurs at time t, it only triggers the default of names that are stillalive in that group at time t. In the following, the elements Y of Y will be used to designatetriggering events and we let I = (Il)1≤l≤m denote the pre-specified set of multi-name groupsof obligors.
Let ν = |Y| = n + m denote the cardinality of Y. Given a multivariate Brownianmotion W = (W Y )Y ∈Y with independent components, we assume that the factor processX = (XY )Y ∈Y is a strong solution to
dXYt = bY (t,XY
t ) dt + σY (t,XYt ) dW Y
t , (1)
for suitable drift and diffusion functions bY = bY (t, x) and σY = σY (t, x). By application ofTheorem 32 page 100 of Protter [38], this makes X an FW-Markov process admitting thefollowing generator acting on functions v = v(t,x) with x = (xY )Y ∈Y
Atv(t,x) =∑
Y ∈Y
(bY (t, xY )∂xY
v(t,x) + 12σ
2Y (t, xY )∂2
x2Yv(t,x)
). (2)
Let F := F (W,H) be the filtration generated by the Brownian motion W and the pointprocess H. Given the “intensity functions”1 of triggering-events, say λY = λY (t, xY ) forevery triggering-event Y ∈ Y, we would like to construct a model in which the F-predictableintensity of a jump of H = (H i)1≤i≤n from Ht− = k to Ht = l, with l 6= k in 0, 1n, is
1These functions will indeed be interpreted as shock intensity functions in subsection 2.3.

5
given by
λ(t,Xt,k, l) :=∑
Y ∈Y ;kY =l
λY (t,XYt ), (3)
where, for any Z ∈ Nn, the expression kZ denotes the vector obtained from k = (k1, . . . , kn)by replacing the components ki, i ∈ Z, by numbers one (whenever ki is not equal to onealready). The intensity of a jump of H from k to l at time t is thus equal to the sum of theintensities of the triggering-events Y ∈ Y such that, if the joint default of the survivors ingroup Y occurred at time t, then the state of H would move from k to l.
Example 2.1 Figure 1 shows one possible defaults path in our model with n = 5 andY = 1, 2, 3, 4, 5, 4, 5, 2, 3, 4, 1, 2. The inner oval shows which common-shock triggering-event happened and caused the observed default scenarios at successivedefault times. At the first instant, default of name 2 is observed as the consequence oftriggering-event 2. At the second instant, names 4 and 5 have defaulted simultaneouslyas a consequence of triggering-event 4, 5. At the fourth instant, the triggering-event2, 3, 4 triggers the default of name 3 alone as name 2 and 4 have already defaulted. Atthe fifth instant, default of name 1 alone is observed as the consequence of triggering-event1, 2. Note that the information produced by the arrival of the triggering-events cannotbe deduced from the mere observation of the sequence of states followed by Ht.
Figure 1: One possible defaults path in a model with n = 5 and Y =1, 2, 3, 4, 5, 4, 5, 2, 3, 4, 1, 2.
To achieve (3) we follow the classical methodology: we construct H by an X-relatedchange of probability measure, starting from a continuous-time Markov chain with intensityone. This construction is detailed in Appendix A.1.
2.1 Ito Formula
In this subsection we state the Ito formula for functions of the Markov process (X,H).For any set Z ∈ Nn, let the set-event indicator process HZ denote the indicator
process of a joint default of the names in Z and only in Z. For k = (k1, . . . , kn) ∈ 0, 1n,we introduce supp(k) = i ∈ Nn; ki = 1 and suppc(k) = i ∈ Nn; ki = 0. Hence, supp(k)

6
denotes the obligors who have defaulted in state k and similarly suppc(k) are the survivednames in the portfolio-state k.
The following lemma provides the structure of the so called compensated set-eventmartingales MZ , which we will use later as fundamental martingales to represent the purejump martingale components of the various price processes involved.
Lemma 2.2 For every set Z ∈ Nn the intensity of HZ is given by ℓZ(t,Xt,Ht), so
dMZt = dHZ
t − ℓZ(t,Xt,Ht)dt
is a martingale, and the set-event intensity function ℓZ(t,x,k) is defined as
ℓZ(t,x,k) =∑
Y ∈Y ;Y ∩suppc(k)=Z
λY (t, xY ). (4)
Proof. See Appendix A.1.1.
So ℓZ(t,Xt,Ht−) =∑
Y ∈Y ;Yt=Z λY (t,XYt ), where for every Y in Y = 1, . . . , n, I1, . . . , Im
we define
Yt = Y ∩ suppc(Ht−), (5)
the set-valued process representing the survived obligors in Y right before time t. Let alsoZt = Z ∈ Nn;Z = Yt for at least one Y ∈ Y \ ∅ denote the set of all non-empty sets ofsurvivors of sets Y in Y right before time t.
We now derive a version of the Ito formula, which is relevant for our model. It will beused below for establishing the Markov properties of our set-up, as well as for deriving pricedynamics. Let σ(t,x) denote the diagonal matrix with diagonal (σY (t, xY ))Y ∈Y . Given afunction u = u(t,x,k) with x = (xY )Y ∈Y and k = (ki)1≤i≤n in 0, 1n, we denote
∇u(t,x,k) = (∂x1u(t,x,k), . . . , ∂xνu(t,x,k)).
Let also δuZ represent the sensitivity of u to the event Z ∈ Nn, so
δuZ(t,x,k) = u(t,x,kZ) − u(t,x,k).
Proposition 2.3 Given a regular enough function u = u(t,x,k), one has
du(t,Xt,Ht) =(∂t + At
)u(t,Xt,Ht)dt + ∇u(t,Xt,Ht)σ(t,Xt)dWt
+∑
Z∈Zt
δuZ(t,Xt,Ht−)dMZt ,
(6)
where
Atu(t,x,k) =∑
Y ∈Y
(bY (t, xY )∂xY
u(t,x,k) +1
2σ2
Y (t, xY )∂2x2
Yu(t,x,k)
)
+∑
Y ∈Y
λY (t, xY )δuY (t,x,k).(7)

7
Proof. See Appendix A.1.2.
In the Ito formula (6), the jump term may involve any of the 2n set-events martingalesMZ for Z ∈ Nn. This suggests that the martingale dimension2 of the model is ν + 2n,
where ν = n + m corresponds to the dimension of the Brownian motion W driving thefactor process X and 2n corresponds to the jump component H. Yet by a reduction whichis due to specific structure of the intensities in our set-up, the jump term of At in (7) is asum over the set of triggering-events Y, which has cardinality ν.
Note that our model excludes direct contagion effects in which intensities of survivingnames would be affected by past defaults, as opposed to the bottom-up contagion modelstreated by e.g. [16, 27, 28, 31]. To provide some understanding in this regard, we give asimple illustrative example.
Example 2.4 Take Nn = 1, 2, 3, so that the state space of H contains 8 elements:
(0, 0, 0), (1, 0, 0), (0, 1, 0), (0, 0, 1), (1, 1, 0), (1, 0, 1), (0, 1, 1), (1, 1, 1) .
Now, let Y be given as Y = 1, 2, 3, 1, 2, 1, 2, 3. This is an example of the nestedstructure of I with I1 = 1, 2 ⊂ I2 = 1, 2, 3. Suppose for simplicity that λY does notdepend either on t or on x (dependence in t,x will be dealt with in Subsection 2.2). Then,the generator A of the chain H is given in matrix-form by
A ≡
· λ1 λ2 λ3 λ1,2 0 0 λ1,2,3
0 · 0 0 λ2 + λ1,2 λ3 0 λ1,2,3
0 0 · 0 λ1 + λ1,2 0 λ3 λ1,2,3
0 0 0 · 0 λ1 λ2 λ1,2,3 + λ1,2
0 0 0 0 · 0 0 λ3 + λ1,2,3
0 0 0 0 0 · 0 λ2 + λ1,2,3 + λ1,2
0 0 0 0 0 0 · λ1 + λ1,2,3 + λ1,2
0 0 0 0 0 0 0 0
(8)
where ‘·’ represents the sum of all other elements in the row multiplied with −1. Now,consider group 1, 2, 3. Suppose, that at some point of time obligor 2 is defaulted, butobligors 1 and 3 are still alive, so that process H is in state (0, 1, 0). In this case thetwo survivors in the group 1, 2, 3 may default simultaneously with intensity λ1,2,3. Ofcourse, here λ1,2,3 cannot be interpreted as intensity of all three defaulting simultaneously,as obligor 2 has already defaulted. In fact, the only state of the model in which λ1,2,3 canbe interpreted as the intensity of all three defaulting, is state (0, 0, 0). Note that obligor1 defaults with intensity λ1 + λ1,2,3 + λ1,2 regardless of the state of the pool, as longcompany 1 is alive. Similarly, obligor 2 will default with intensity λ2 + λ1,2,3 + λ1,2
regardless of the state of the pool, as long company 1 is alive. Also, obligors 1 and 2 willdefault together with intensity λ1,2,3 + λ1,2 regardless of the state of the pool, as longas company 1 and 2 still are alive.
2Minimal number of fundamental martingales which can be used as integrators to represent all themartingales in the model, see Appendix A.1.

8
2.2 Markov Copula Properties
Below, for every obligor i, a real-valued marginal factor process Xi will be defined as asuitable function of the above multivariate factor process X = (XY )Y ∈Y . We shall thenstate conditions on the default intensities which enables us to prove that the marginal pair(Xi,H i) is a Markov process. Markovianity of the model marginals (Xi,H i) is crucial at thestage of calibration of the model, so that these marginals can be calibrated independently.
Observe that in view of (3), the intensity of a jump of H i from H it− = 0 to 1 is given
by, for t ∈ [0, T ], ∑
Y ∈Y ; i∈Y
λY (t,XYt ), (9)
where the sum in this expression is taken over all pre-specified groups that contain name i.We define the marginal factor Xi as a linear functional ϕi of the multivariate factor processX = (XY )Y ∈Y so that Xi
t := ϕi(Xt). In general the transition intensity (9) implies non-Markovianity of the marginal (Xi,H i). Hence, in order to make the process (Xi,H i) to beMarkov, one needs to impose a more specified parametrization of (9) as well as conditionson the mapping ϕi. To be more specific:
Assumption 2.5 For every obligor i, there exists a linear form ϕi(x) and a real-valuedfunction λi(t, x) such that for every (t,x) with x = (xY )Y ∈Y
∑
Y ∈Y ; i∈Y
λY (t, xY ) = λi(t, ϕi(x)), (10)
where, in addition, Xit := ϕi(Xt) is a Markov-process with respect to the filtration F =
F (W,H), with the following generator acting on functions vi = vi(t, x) with x ∈ R
Aitvi(t, x) = bi(t, x)∂xvi(t, x) +
1
2σ2
i (t, x)∂2x2vi(t, x) (11)
for suitable drift and diffusion coefficients bi(t, x) and σi(t, x).
Note that under such a specification of the intensities, dependence between defaults inthe model does not only stem from the possibility of common jumps as in Example 2.4 butit can also come from the factor process X as in Example 2.7 below.
In the above assumption we require that Xit = ϕi(Xt) is a Markov process. This
assumption is a non-trivial in general, as a process which is a measurable function of aMarkov process does not have to be a Markov process itself. We refer to Pitman and Rogers[39] for some discussion of this issue. In our model set-up one, one can show that underappropriate regularity conditions, if for every (t,x, x) with x = (xY )Y ∈Y and x = ϕi(x),one has
∑
Y ∈Y
bY (t,x)∂xYϕi(x) = bi(t, x)
∑
Y ∈Y
σ2Y (t,x)(∂xY
ϕi(x))2 = σ2i (t, x)
(12)
then Xit = ϕi(Xt) is an F-Markov process with generator Ai in (11). The proof follows
from Lemma A.2 (up to the reservation which is made right after the lemma regarding

9
technicalities about the domain of the generators) since for every regular test-functionvi = vi(t, x), one has with u(t,x) := vi(t, ϕ
i(x))
vi(t,Xit) −
∫ t
0
(∂s +Ai
s
)vi(s,X
is)ds
= u(t,Xt) −∫ t
0
(∂s +As
)u(s,Xs)ds.
In the two examples given below, the F-Markov property of Xit = ϕi(Xt) also rigorously
follows, in case of Example 2.6 where ϕi is a coordinate projection operator, from the Markovconsistency results of [8], or, in case of Example 2.7, from the semimartingale representationof Xi provided by the SDE (14). The F-Markov property of Xi in Example 2.7 thus followsfrom the fact that a strong solution to the Markovian SDE (14) driven by the F-Brownianmotion W i, is an F-Markov process, by application of Theorem 32 page 100 of Protter[38]. Example 2.7 is important, as it goes beyond the case of Example 2.6 where the λI
are deterministic functions of time, and it provides a fully stochastic specification of the λY
(including the λI).
Example 2.6 (Deterministic Group Intensities) For every group I ∈ I, the intensityλI(t,x) does not depend on x.
Letting ϕi(x) = xi, then (10) and (12) hold with
λi(t, x) := λi(t, x) +∑
I∈I; i∈I
λI(t)
bi(t, x) := bi(t, x)
σi(t, x) := σi(t, x).
So, Xi = Xi is F-Markov with drift and diffusion coefficients bi(t, x) and generator σi(t, x)thus specified.
Example 2.7 (Extended CIR Intensities) For every Y ∈ Y, the pre-specified groupintensities are given by λY (t,XY
t ) = XYt , where the factor XY is an extended CIR process
dXYt = a(bY (t) −XY
t )dt + c
√XY
t dWYt (13)
for non-negative constants a, c and non-negative functions bY (t). The SDE-s for the factorsXY have thus the same coefficients except for the bY (t).
Letting ϕi(x) =∑
Y ∈Y ; i∈Y
xY = xi +∑
I∈I; i∈I
xI , and denoting likewise bi(t) =
∑
Y ∈Y ; i∈Y
bY (t) = bi(t) +∑
I∈I; i∈I
bI(t), then (10) and (12) hold with
λi(t, x) := x
bi(t, x) := a(bi(t) − x)
σi(t, x) := c√x.
So, Xi =∑
Y ∈Y ; i∈Y
XY is an F-Markov process with drift and diffusion coefficients bi(t, x)
and generator σi(t, x) thus specified.

10
Note that Xi satisfies the following extended CIR SDE with parameters a, bi(t) and cas
dXit = a(bi(t) −Xi
t)dt+ c
√Xi
tdWit (14)
for the F-Brownian motion W i such that√Xi
tdWit =
∑
i∈Y
√XY
t dWYt , dW
it =
∑
i∈Y
√XY
t√∑i∈Y X
Yt
dW Yt .
Remark 2.8 Both the time-deterministic group intensities specification of Example 2.6and the affine intensities specification of Example 2.7 have already been fruitfully used inthe context of various credit and counterparty credit risk applications (anticipating thetheoretical aspects of the model which are dealt with in the present paper), see [7, 2, 6].
For every Y ∈ Y and every set of non-negative constants ti, we define the quantitiesΛY
s,t,ΛYt and θY
t as
ΛYs,t =
∫ t
sλY (s,XY
s )ds , ΛYt = ΛY
0,t =
∫ t
0λY (s,XY
s )ds and θYt = max
i∈Y ∩suppc(Ht)ti
where Y ∩ suppc(Ht) in θYt is the set of survivors in Y at time t (and we use in θY
t ourconvention that max ∅ = −∞). Note that ΛI is a deterministic function of time for everygroup I ∈ I. Let τi denote the default time for obligor i. Since H i is the default indicatorof name i, we have
τi = inft > 0 ;H it = 1, H i
t = 1τi≤t.
The following Proposition gathers the Markov properties of the model.
Proposition 2.9 (i) (X,H) is an F-Markov process with infinitesimal generator given by
A.
(ii) For every obligor i, (Xi,H i) is an F-Markov process3 admitting the following generator
acting on functions ui = ui(t, xi, ki) with (xi, ki) ∈ R × 0, 1
Aitui(t, xi, ki) = bi(t, xi)∂xiui(t, xi, ki) +
1
2σ2
i (t, xi)∂2x2
iui(t, xi, ki)
+λi(t, xi)(ui(t, xi, 1) − ui(t, xi, ki)
). (15)
Moreover, the F-intensity process4 of H i is given by 1τi>tλi(t,Xit). In other words, the
process M i defined by
M it = 1τi≤t −
∫ t
01τi>sλi(s,X
is)ds, (16)
is an F-martingale.5
(iii) For any fixed non-negative constants t, t1, . . . , tn, one has
P (τ1 > t1, . . . , τn > tn | Ft) = P (τ1 > t1, . . . , τn > tn | Ht,Xt) (17)
= 1ti<τi , i∈supp(Ht)E
exp
(−∑
Y ∈Y
ΛYt,θY
t
) ∣∣∣Xt
.
3And hence an F(Xi,Hi)-Markov process.4And hence, F(Xi,Hi)-intensity process.5And hence, an F(Xi,Hi)-martingale.
11
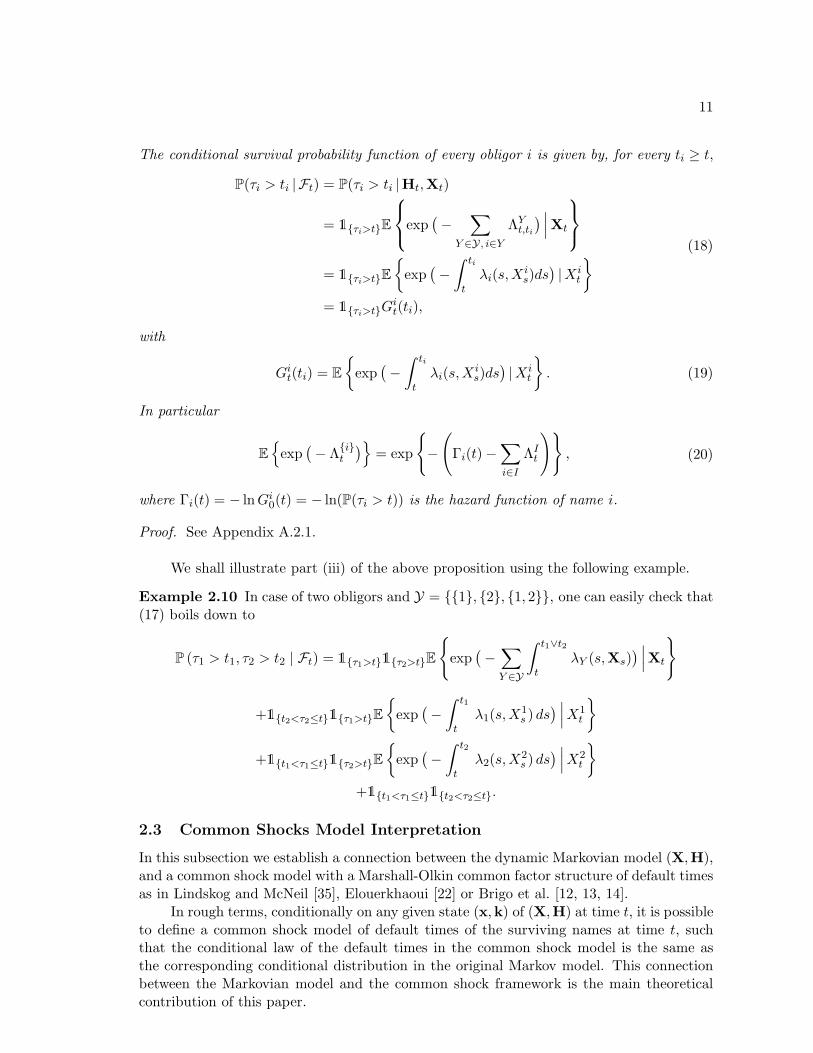
The conditional survival probability function of every obligor i is given by, for every ti ≥ t,
P(τi > ti | Ft) = P(τi > ti |Ht,Xt)
= 1τi>tE
exp(−
∑
Y ∈Y , i∈Y
ΛYt,ti
) ∣∣∣Xt
= 1τi>tE
exp
(−∫ ti
tλi(s,X
is)ds
)|Xi
t
= 1τi>tGit(ti),
(18)
with
Git(ti) = E
exp
(−∫ ti
tλi(s,X
is)ds
)|Xi
t
. (19)
In particular
E
exp
(− Λ
it
)= exp
−(
Γi(t) −∑
i∈I
ΛIt
)
, (20)
where Γi(t) = − lnGi0(t) = − ln(P(τi > t)) is the hazard function of name i.
Proof. See Appendix A.2.1.
We shall illustrate part (iii) of the above proposition using the following example.
Example 2.10 In case of two obligors and Y = 1, 2, 1, 2, one can easily check that(17) boils down to
P (τ1 > t1, τ2 > t2 | Ft) = 1τ1>t1τ2>tE
exp(−∑
Y ∈Y
∫ t1∨t2
tλY (s,Xs)
) ∣∣∣Xt
+1t2<τ2≤t1τ1>tE
exp
(−∫ t1
tλ1(s,X
1s ) ds
) ∣∣∣X1t
+1t1<τ1≤t1τ2>tE
exp
(−∫ t2
tλ2(s,X
2s ) ds
) ∣∣∣X2t
+1t1<τ1≤t1t2<τ2≤t.
2.3 Common Shocks Model Interpretation
In this subsection we establish a connection between the dynamic Markovian model (X,H),and a common shock model with a Marshall-Olkin common factor structure of default timesas in Lindskog and McNeil [35], Elouerkhaoui [22] or Brigo et al. [12, 13, 14].
In rough terms, conditionally on any given state (x,k) of (X,H) at time t, it is possibleto define a common shock model of default times of the surviving names at time t, suchthat the conditional law of the default times in the common shock model is the same asthe corresponding conditional distribution in the original Markov model. This connectionbetween the Markovian model and the common shock framework is the main theoreticalcontribution of this paper.

12
We thus introduce a family of common shocks copula models, parameterized by thecurrent time t. For every Y ∈ Y, we define
τY (t) = infθ > t; ΛYθ > ΛY
t + EY ,
where the random variables EY are i.i.d. and exponentially distributed with parameter 1.For every obligor i we let
τi(t) = minY ∈Y ; i∈Y
τY (t) , (21)
which defines the default time of obligor i in the common shocks copula model starting attime t. We also introduce the common shock model indicator processes HY
θ (t) = 1τY (t)≤θ
and H iθ(t) = 1τi(t)≤θ, for every triggering-event Y , obligor i and time horizon θ ≥ t. Let
Z ∈ Nn denote a set of obligors, meant in the probabilistic interpretation to represent theset suppc(Ht) of survived obligors in the Markov model at time t. We now prove that onsuppc(Ht) = Z, the conditional law of (τi)i∈suppc(Ht) given Ft in the Markov model, isequal to the conditional law of (τi(t))i∈Z given Xt in the common shocks framework. Letalso Nθ =
∑1≤i≤nH
iθ denote the cumulative number of defaulted obligors in the Markov
model up to time θ. Let Nθ(t, Z) = n− |Z|+∑i∈Z Hiθ(t), denote the cumulative number of
defaulted obligors in the common shocks framework up to time θ where |Z| is the cardinalityof the set Z.
Proposition 2.11 Let Z ∈ Nn denote an arbitrary subset of obligors and let t ≥ 0. Then,
(i) for every t1, . . . , tn ≥ t, one has
1suppc(Ht)=ZP(τi > ti, i ∈ suppc(Ht)
∣∣Ft
)= 1suppc(Ht)=ZP
(τi(t) > ti, i ∈ Z
∣∣∣Xt
).(22)
(ii) for every θ ≥ t, one has that for every k = n− |Z|, . . . , n,
1suppc(Ht)=ZP(Nθ = k
∣∣Ft
)= 1suppc(Ht)=ZP
(Nθ(t, Z) = k
∣∣∣Xt
).
Proof. Part (ii) readily follows from part (i), that we now show. Let, for every obligor i,ti = 1i∈suppc(Ht)ti. Note that one has, for Y ∈ Y
maxi∈Y ∩suppc(Ht)
ti = maxi∈Y ∩suppc(Ht)
ti = θYt .
Thus, by application of identity (17) in Proposition 2.9 to the sequence of times (ti)1≤i≤n,it comes,
1suppc(Ht)=ZP(τi > ti, i ∈ suppc(Ht)
∣∣Ft
)
= 1suppc(Ht)=ZP((τi > ti, i ∈ Z
),(τi > 0, i ∈ Zc
) ∣∣Ft
)
= 1suppc(Ht)=ZE
exp(−∑
Y ∈Y
ΛYt,θY
t
) ∣∣∣Xt
which on suppc(Ht) = Z coincides with the expression
E
exp(−∑
Y ∈Y
ΛYt,maxi∈Y ∩Z ti
) ∣∣∣Xt

13
derived for P(τi(t) > ti, i ∈ Z∣∣∣Xt) in the common shocks model of Elouerkhaoui [22]. 2
For instance, in the situation of Example 2.4, the shock interpretation at time t = 0is clear: there are five different shocks, corresponding to the elements of Y. In particular,obligors 1 and 2 can default simultaneously if either the shock corresponding to 1, 2arrives, or the shock corresponding to 1, 2, 3 arrives.
This interpretation will be used in the next section for deriving fast exact convolutionrecursion procedures for pricing portfolio loss derivatives.
The common shocks interpretation can also be used for simulation purposes. In viewof Proposition 2.11(i) and given Ft, the simulation of the random times (τi)i∈suppc(Ht), orequivalently on suppc(Ht) = Z, (τi(t))i∈Z , is fast. One essentially needs to simulate IIDexponential random variables EY .
3 Pricing, Calibration and Hedging Issues
This section treats the pricing, calibration and hedging issues in the Markov copula modelof Section 2. First, in Subsection 3.1 we derive the price dynamics for CDS contracts andfor CDO tranches in this model. In Subsection 3.2 we use dynamics of Subsection 3.1 toderive min-variance hedging strategies in the Markov copula model. In the case of CDO-s these formulas lead to a very large PDE-system which in practice is difficult to solve.So, in Subsection 3.3 we instead exploit the relationship between our Markov model andthe common shock model, which enables us to derive fast, deterministic, computationallytractable algorithms for derivation of the prices and sensitivities.
For notational convenience, we assume zero interest rates. The extension of all theo-retical results to time dependent, deterministic interest rates is straightforward but morecumbersome notationally, especially regarding hedging. Time-dependent deterministic in-terest rates will be used in the numerical part.
3.1 Pricing Equations
In this subsection we derive price dynamics formulas for CDS contracts and CDO tranches inthe Markov model; all prices are considered from perspective of the protection buyers. Thesedynamics will be useful when deriving the min-variance hedging strategies in Subsection 3.2.
In a zero interest-rates environment, the (ex-dividend) price process of an asset issimply given by the risk neutral conditional expectation of future cash flows associatedwith the asset; the cumulative value process is the sum of the price process and of thecumulative cash-flows process. The cumulative value process is a martingale, as opposedto the price process. When it comes to hedging, the cumulative value process is the mainquantity of interest (see for instance Frey and Backhaus [24]).
For a fixed maturity T , we let Si denote the T -year CDS spread for obligor i, withrecovery rate Ri. Similarly, we let S denote the T -year model CDO tranche spread for thetranche [a, b], with payoff process
La,bt = La,b(Ht) = (Lt − a)+ − (Lt − b)+ , (23)
where Lt = 1n
∑ni=1(1 − Ri)H
it is the credit loss process for the underlying portfolio. The
premium legs in these products are payed at t1 < t2 < . . . < tp = T where tj − tj−1 = hand h is typically a quarter. Below, the notation is the same as in the Ito formula (6).

14
Proposition 3.1 (i) The price P i and the cumulative value P i at time t ∈ [0, T ] of the
single-name CDS on obligor i with contractual spread Si are given by
P it = 1τi>tvi(t,X
it )
dP it = 1τi>t∂xivi(t,X
it)σi(t,X
it)dW
it +
∑
Z∈Zt
1i∈Z
(1 −Ri − vi(t,X
it))dMZ
t(24)
for a pre-default pricing function vi(t, xi) such that
1τi>tvi(t,Xit) = E[−Sih
∑
t<tj≤T
1τi>tj + (1 −Ri)1t<τi≤T|Ft].
(ii) The price process Π and cumulative value Π at time t ∈ [0, T ] of a CDO tranche [a, b]with contractual spread S are given by
Πt = u(t,Xt,Ht)
dΠt = ∇u(t,Xt,Ht)σ(t,Xt)dWt
+∑
Z∈Zt
(La,b(H
Zt−) − La,b(Ht−) + δuZ(t,Xt,Ht−)
)dMZ
t
(25)
for a pricing function u(t,x,k) such that
u(t,Xt,Ht) = E
[− S h
∑
t<tj≤T
(b− a− L
a,btj
)+ L
a,bT − L
a,bt
∣∣∣Ft
].
Proof. See Appendix A.2.2.
Note that in view of the marginal Markov property of the model, the martingalerepresentation (24) of P i can be reduced to a “univariate” martingale representation basedon the compensated martingale M i of H i in (16). However, as will be clear from Subsection3.2, it is more useful to state martingale representations of Π and P i relatively to a commonset of fundamental martingales in order to handle the hedging issue.
The pricing functions vi and u can be characterized as the unique solutions to therelated Kolmogorov equations (68) and (70) in Appendix A.2.2. If the pricing functionsare known, the prices at a given time are recovered by plugging the corresponding state ofthe model into the right-hand-side of the first lines of (24) or (25). The pricing equation(70) for a CDO tranche leads to a large system of PDEs which in practice is impossible tohandle numerically as soon as n is larger than a few units. As a remedy for this we will inSubsection 3.3 instead use the translation to a Marshall-Olkin framework which allows usto derive practical recursive pricing schemes for CDO tranche price processes.
3.2 Min-Variance Hedging
In this subsection we use the price dynamics from Subsection 3.1 to derive min-variancehedging strategies in the Markov copula model. By min-variance hedging strategies wemean strategies that minimize the variance of the hedging error. Note that one could alsotry to minimize the variance relatively to the historical probability measure, however in thispaper we minimize the risk-neutral variance for simplicity: see Schweizer [40] for a surveyabout various quadratic hedging approaches. The hedging strategies are theoretically sound

15
due to our bottom-up Markovian framework and they will be shown in Subsection 3.3 to becomputationally tractable thanks to the Marshall-Olkin copula interpretation of Subsection2.3.
Consider a CDO tranche [a, b] with pricing function u specified in Proposition 3.1.Our aim is to find explicit min-variance hedging formulas when hedging this CDO trancheby using the savings account and d single-name CDSs with pricing functions vi given byProposition 3.1. First we introduce the CDS cumulative value vector-function
v(t,x,k) = (1k1=0v1(t, x1) + 1k1=1(1 −R1), . . . ,1kd=0vd(t, xd) + 1kd=1(1 −Rd))T .
Let ∇v denote the Jacobian matrix of v with respect to x in the sense of the d× ν-matrixsuch that ∇v(t,x,k)ji = 1kj=0∂xjvi(t, xi), for every 1 ≤ i ≤ d and 1 ≤ j ≤ ν. Let ∆vZ
represent the vector-function of the sensitivities of v with respect to the event Z ∈ Nn, so
∆vZ(t,x,k) = (11∈Z, k1=0 ((1 −R1) − v1(t, x1)) , . . . ,1d∈Z, kd=0 ((1 −Rd) − vd(t, xd)))T.
By using the vector notation P = (P i)1≤i≤d, one has in view of Proposition 3.1(i)
dPt = ∇v(t,Xt,Ht)σ(t,Xt)dWt +∑
Z∈Zt
∆vZ(t,Xt,Ht−)dMZt . (26)
Let
∆uZ(t,x,k) = δZu(t,x,k) + La,b(kZ) − La,b(k).
represent the function of sensitivity of the CDO tranche [a, b] cumulative value process withrespect to the event Z ∈ Nn. Let ζ be an d-dimensional row-vector process, representingthe number of units held in the first d CDSs which are used in a self-financing6 hedgingstrategy for the CDO tranche [a, b]. Given (25) and (26), the tracking error (et) of thehedged portfolio satisfies e0 = 0 and, for t ∈ [0, T ]
det = dΠt − ζtdPt
=(∇u(t,Xt,Ht) − ζt∇v(t,Xt,Ht)
)σ(t,Xt)dWt
+∑
Z∈Zt
(∆uZ(t,Xt,Ht−) − ζt∆vZ(t,Xt,Ht−)
)dMZ
t .
(27)
Since the martingale dimension of the model is ν+ 2n, replication is typically out-of-reach7
in the Markov model. However, in view of (27), we still can find min-variance hedgingformulas.
Proposition 3.2 The min-variance hedging strategy ζ is
ζt =d〈Π, P〉t
dt
(d〈P〉tdt
)−1
= ζ (t,Xt,Ht−) (28)
where ζ = (u,v)(v,v)−1, with
(u,v) = (∇u)σ2(∇v)T +∑
Y ∈Y
λY ∆uY (∆vY )T
(v,v) = (∇v)σ2(∇v)T +∑
Y ∈Y
λY ∆vY (∆vY )T.(29)
6Using also the savings account (constant asset).7See the comments following Proposition 2.3.

16
Proof. The first identity in (28) is a classical risk neutral min-variance hedging8 formula,derived for instance in Section 3.5 of Crepey [18]. Moreover, one has by computation of theoblique brackets based on the second lines in (24) and (25):
d〈Π, P〉tdt
=
((∇u)σ2(∇v)T +
∑
Z∈Zt
λZ∆uZ(∆vZ)T
)(t,Xt,Ht−) = (u,v)(t,Xt,Ht−)
d〈P〉tdt
=
(
(∇v)σ2(∇v)T +∑
Z∈Zt
λZ∆vZ(∆vZ)T
)
(t,Xt,Ht−) = (v,v)(t,Xt,Ht−)
(30)
where the second identities in both lines of (30) use simplifications similar to those used inthe proof of the Ito formula (6) in Appendix A.1.2. 2
In (29), the u-related terms can be computed by using the conditional convolution-recursion procedures presented in Subsection 3.3; the vi-related terms can be computed veryquickly (actually semi-explicitly in either of the specifications of examples 2.6 and 2.7). Wewill illustrate in Subsection 4.5 the tractability of this approach for computing min-variancehedging deltas.
We refer the reader to Elouerkhaoui [22] for analogous results in the context of thecommon shock model presented in Subsection 2.3. A nice feature of our set-up however isthat due to the specific structure of the intensities, the sums in (29) are over the set Y oftriggering-events Y which is of cardinality ν = n + m rather than over the set Nn of allset-events Z, which would be of cardinality 2n.
We also refer the reader to Frey and Backhaus [24] for other related min-variancehedging formulas.
3.3 Convolution Recursion Pricing Schemes
In this subsection we use the common shock model interpretation to derive fast convolutionrecursion algorithms for computing the portfolio loss distribution. In the case where therecovery rate is the same for all names, i.e., Ri = R, i = 1, . . . , n, the aggregate loss Lt attime t is equal to (1 − R)Nt, where we recall Nt is the total number of defaults that haveoccurred in the Markov model up to time t. It is well known, see, e.g., [15, 24, 26, 31],and Proposition 3.1(ii), that the price process for a CDO tranche [a, b] is determined bythe probabilities P [Nθ = k | Ft] for k = |Ht|, . . . , n and θ ≥ t ≥ 0. Thanks to the commonshock model interpretation of Subsection 2.3, one has from Proposition 2.11(ii) that
P [Nθ = k | Ft] = P [Nθ(t, Z) = k |Xt]
on the event suppc(Ht) = Z, so we will focus on computation of the latter probabilities,which are derived in formula (32) below. Furthermore, recall that suppc(Ht) denotes theobligors who have survived in state Ht at time t.
We henceforth assume a nested structure of the sets Ij given by
I1 ⊂ . . . ⊂ Im. (31)
This structure implies that if all obligors in group Ik have defaulted, then all obligorsin group I1, . . . , Ik−1 have also defaulted. As we shall detail in Remark 3.4, the nested
8See Schweizer [40]

17
structure (31) yields a particularly tractable expression for the portfolio loss distribution.This nested structure also makes sense financially with regards to the hierarchical structureof risks which is reflected in standard CDO tranches.
Remark 3.3 A dynamic group structure would be preferable from a financial point of view.In the same vein one could deplore the absence of direct contagion effects in this model (itonly has joint defaults). However it should be stressed that we are building a pricing model,not an econometric model; the applications we have in mind are hedging CDO tranches byindividual names (see Subsection 4.5), as well as valuation and hedging of counterparty riskon credit portfolios (see [6]). In these regards, efficient pricing (at any future point in time,not only at time 0 [6]) and Greeking procedures, as well as efficient joint calibration to CDSand CDO data (see Subsections 4.1 and 4.3), are the main issues, and these are alreadyquite difficult to achieve simultaneously in a single model.
Denoting conventionally I0 = ∅ and HI0θ (t) = 1, then in view of (31), the events
Ωjθ(t) := HIj
θ (t) = 1,HIj+1
θ (t) = 0, . . . ,HImθ (t) = 0, 0 ≤ j ≤ m
form a partition of Ω. Hence, we have
P(Nθ(t, Z) = k |Xt) =∑
0≤j≤m
P(Nθ(t, Z) = k |Ωj
θ(t),Xt
)P(Ωj
θ(t) |Xt
)(32)
where, by construction of the HIθ (t) and independence of the λI(t,X
It ) we have
P(Ωj
θ(t) |Xt
)=(1 − E
(e−Λ
Ijt,θ |XIj
t
)) ∏
j+1≤l≤m
E(e−Λ
Ilt,θ |XIl
t
)(33)
which in our Markov setup can be computed very quickly (actually, semi-explicitly in eitherof the specifications of examples 2.6 and 2.7). We now turn to the computation of the term
P(Nθ(t, Z) = k |Ωj
θ(t),Xt
)(34)
appearing in (32). Recall first that Nθ(t, Z) = n− |Z| +∑i∈Z Hiθ(t) with |Z| denoting the
cardinality of Z. We know that for every group j = 1, . . . ,m, given Ωjθ(t), the marginal
default indicators H iθ(t) for i ∈ Z are such that:
H iθ(t) =
1, i ∈ Ij ,H
iθ (t), else.
(35)
Hence, the H iθ(t) are conditionally independent given Ωj
θ(t). Finally, conditionally on
(Ωjθ(t),Xt) the random vector Hθ(t) = (H i
θ(t))i∈Nn is a vector of independent Bernoulli
random variables with parameter p = (pi,jθ (t))i∈Nn , where
pi,jθ (t) =
1, i ∈ Ij ,
1 − E
exp
(− Λ
it,θ
)|Xi
t
, else
(36)
The conditional probability (34) can therefore be computed by a standard convolutionrecursive procedure (see, for instance, Andersen and Sidenius [1]).

18
Remark 3.4 The linear number of terms in the sum of (32) is due to the nested structureof the groups Ij in (32). Note that a convolution recursion procedure is possible for anarbitrary structuring of the groups Ij . However, a general structuring of the m groups Ijwould imply 2m terms instead of m in the sum of (32), which in practice would only workfor very few groups m. The nested structure (32) of the Ij , or equivalently, the tranchedstructure of the Ij \ Ij−1, is also quite natural from the point of view of application to CDOtranches.
3.4 Random Recoveries
In this subsection we outline how to modify the Markov copula to include stochastic recover-ies. The implementation details are here omitted and we refer the readers to [5] for a morecomprehensive description of the methodology. Let L = (Li)1≤i≤n represent the [0, 1]n-valued vector process of the loss given defaults in the pool of names. The process L is amultivariate process where L0 ∈ 0, and where each component Li
t represents the fractionalloss that name i may have suffered due to default until time t. Assuming unit notional foreach name, the cumulative loss process for the entire portfolio is given by Lt = 1
n
∑ni=1 L
it.
We assume that all obligors i have i.i.d. distribution for the recovery. The default times aredefined as before, but at every time of jump of H, an independent recovery draw is madefor every newly defaulted name i, determining the recovery Ri of name i. In particular, therecovery rates resulting from a joint default are thus drawn independently for the affectednames.
Independent recoveries do not break the Markovian nor the Markovian copula struc-ture. However by introducing stochastic recoveries we can no longer use the exact convolu-tion recursion procedures of Subsection 3.3 for pricing CDO tranches. Instead we will hereuse an approximate procedure based on the exponential approximations of the so calledhockey stick function, as presented in Iscoe et al. [32], [33] and originally developed by [34].We now briefly outline how to use this method for computing the price of a CDO tranchein our Markov model conditionally on Ft.
Recall that the tranche-loss function La,bt for the tranche [a, b] as a function of the
portfolio credit loss Lt is given by La,bt = (Lt − a)+ − (Lt − b)+ . This function can in turn
be rewritten as (see e.g [32])
La,bt = b
(1 − h
(Lt
b
))− a
(1 − h
(Lt
a
))(37)
where h(x) is the so-called hockey stick function given by
h(x) =
1 − x if 0 ≤ x ≤ 1,0 if 1 < x.
(38)
Next, [34] shows that for any fixed ǫ > 0, the function h(x) can be approximated by afunction h(q)
exp(x) on [0, d] for any d > 0 so that |h(x) − h(q)exp(x)| ≤ ǫ for all x ∈ [0, d] where
q = q(ǫ) is positive integer and h(q)exp(x) is given by
h(q)exp(x) =
q∑
ℓ=1
ωℓ exp(γℓx
d
). (39)
Here (ωℓ)qℓ=1 and (γℓ)
qℓ=1 are complex numbers obtained as roots of polynomials whose
coefficients can be computed numerically in a straightforward way. Figure 2 visualizes the

19
approximation h(q)exp(x) of h(x) for d = 2 on x ∈ [0, 10] with q = 5 and q = 50 as well as
the approximation error |h(x) − h(q)exp(x)| for the same q. As can be seen in Figure 2, the
approximation is fairly good already for small values values of q and also works well outsidethe interval [0, d] = [0, 2], that is on the interval (2, 10].
0 2 4 6 8 10−0.2
0
0.2
0.4
0.6
0.8
1
1.2
x
App
rox.
of h
(x)
Approx. of h(x) with q =5
0 2 4 6 8 10−0.2
0
0.2
0.4
0.6
0.8
1
1.2
x
App
rox.
of h
(x)
Approx. of h(x) with q =50
0 2 4 6 8 100
0.005
0.01
0.015
0.02
0.025
0.03
x
App
rox.
err
or
Error with q =5
0 2 4 6 8 100
1
2
3
4x 10
−3
x
App
rox.
err
or
Error with q =50
Figure 2: The function h(q)exp(x) as approximation of h(x) for x ∈ [0, 10] with q = 5 and
q = 50 (top) and the corresponding approximation errors (bottom).
In [32], [33] the authors chooses d = 2 for (39) in all their numerical implementations,see also [5]. In the rest of this paper we will use d = 2 in (39).
In view of (37)-(39) for any two time points θ > t, the conditional pricing of a CDOtranche given the information Ft at any time t, boils down to computation of conditionalexpectations of the form
E
(eγℓ
Lθ2c | Ft
)(40)
for ℓ = 1, 2, . . . , q and different attachment points c and time horizons θ > t. Note that thecase t = 0 is used in the calibration, while the case t > 0 with θ > t is needed for pricing thecredit valuation adjustment (CVA) on a CDO tranche in a counterparty risky environment,a topical issue since the 2007-09 credit crisis (see [19]). Since the algorithm for computing
E
(eγℓ
Lθ2c | Ft
)is the same for each ℓ = 1, 2, . . . , q and any attachment point c, we will below
for notational convenience simply write E(eγLθ | Ft
)instead of E
(eγℓ
Lθ2c | Ft
).
Now, by the common shock model interpretation as in Subsection 3.3 (and using the

20
same notation that was introduced there), one has much like in Proposition 2.11(ii) thatfor every Z ∈ Nn
1suppc(Lt)=ZE(eγLθ | Ft
)= 1suppc(Lt)=ZE
(eγLθ(t,Z) |Xt
)(41)
where Lθ(t, Z) :=∑
i/∈Z Lit+∑
i∈Z(1−Ri)Hiθ(t) andH i
θ(t) is defined as in (35). Furthermore,Ri is a random recovery with values in [0, 1]. One then has as in (32) that
E(eγLθ(t,Z) |Xt
)=
∑
0≤j≤m
E(eγLθ(t,Z) |Ωj
θ(t),Xt
)P(Ωj
θ(t) |Xt
)(42)
where P(Ωj
θ(t) |Xt
)is given by (33). Moreover by conditional independence one has on
1suppc(Lt)=Z that
E(eγLθ(t,Z) |Ωj
θ(t),Xt
)
= eγ∑
i/∈Z LitE(eγ∑
i∈Z(1−Ri)Hiθ(t) |Ωj
θ(t),Xt
)
= eγ∑
i/∈Z Lit
∏
i∈Z
E(eγ(1−Ri)Hi
θ(t) |Ωjθ(t),Xt
).
Now observe that for every i
E(eγ(1−Ri)Hi
θ(t) |Ωjθ(t),Xt
)=
E(eγ(1−Ri)
), i ∈ Ij ,
E(eγ(1−Ri)H
iθ (t) |Xi
t
), else
(43)
in which by independence of Ri and H iθ(t) implies that
E(eγ(1−Ri)H
iθ (t) |Xi
t
)= 1 − p
i,jθ (t)
(1 − Eeγ(1−Ri)
)(44)
where pi,jθ (t) was defined in (36).
In Subsection 4.2 we will give an explicitly example of the recovery rate Ri which willbe used with the above hockey-stick method when calibrating the Markov copula againstmarket data on CDO tranches. As will be seen in Subsection 4.3, using stochastic recoverieswill for some data sets render much better calibration results compared with the case ofusing constant recoveries.
4 Numerical Results
In this section we briefly discuss the calibration of the model and some few numerical resultsconnected to the loss-distributions and the min-variance hedging. Subsection 4.1 outlinesthe calibration methodology with piecewise constant default intensities and constant recov-eries while Subsection 4.2 describes the calibration procedure with stochastic recoveries andpiecewise constant default intensities. Then Subsection 4.3 presents the numerical calibra-tion of the Markov copula model against market data both with constant and stochasticrecoveries. We also study the implied loss-distributions in our fitted model for the casewith constant recoveries. Furthermore, in Subsection 4.4, we consider that individual andjoint defaults are driven by stochastic default intensities and we describe the calibrationmethodology and results for a particular model specification. Finally, Subsection 4.5 dis-cusses min-variance hedging sensitivities in the calibrated models using constant recoveries.A more extensive numerical study of the model can be found in the paper [5].

21
4.1 Calibration Methodology with Piecewise Constant Default Intensities
and Constant Recoveries
In this subsection we discuss one of the calibration methodologies that will be used when fit-ting the Markov copula model against CDO tranches on the iTraxx Europe and CDX.NA.IGseries in Subsection 4.3. This first calibration methodology will use piecewise constant de-fault intensities and constant recoveries in the convolution pricing algorithm of Subsection3.3.
The first step is to calibrate the single-name CDS for every obligor. Given the T -yearmarket CDS spread S∗
i for obligor we want to find the individual default parameters forobligor i so that P i
0(S∗i ) = 0, or in view of Proposition 3.1(i),
S∗i =
(1 −Ri)P (τi < T )
h∑
0<tj≤T P (τi > tj)(45)
where we used the facts that interest rate is zero and that the recovery Ri is constant.Hence, the first step is to extract the implied hazard function Γ∗
i (t) in (20) from the CDScurve of every obligor i by using a standard bootstrapping procedure based on (45).
Given the marginal hazard functions, the law of the total number of defaults N ata fixed time t is a function of the joint default intensity functions λI(t), as described bythe recursive algorithm of Subsection 3.3. The second step is therefore to calibrate thecommon-shock intensities λI(t) so that the model CDO tranche spreads coincide with thecorresponding market spreads. This is done by using the recursive algorithm of Subsection3.3, for λI(t)-s parameterized as non-negative and piecewise constant functions of time.Moreover, in view of (20), for every obligor i and at each time t we impose the constraint
∑
I∈I; i∈I
λI(t) ≤ λ∗i (t) (46)
where λ∗i :=dΓ∗
idt denotes the hazard rate (or hazard intensity) of name i. For constant joint
default intensities λI(t) = λI the constraints (46) reduce to
∑
I∋i
λI ≤ λi := inft∈[0,T ]
λ∗i (t) for every obligor i.
Given the nested structure of the groups Ij-s specified in (31), this is equivalent to
m∑
j=l
λIj ≤ λIl:= min
i∈Il\Il−1
λi for every group l. (47)
Furthermore, for piecewise constant common shock intensities on a time grid (Tk), thecondition (47) extends to the following constraint
m∑
j=l
λkIj
≤ λkIl
:= mini∈Il\Il−1
λki for every l, k where λk
i := inft∈[Tk−1,Tk]
λ∗i (t). (48)
We remark that insisting on calibrating all CDS names in the portfolio, including the safestones, implies via (47) or (48) a very constrained region for the common shock parameters.This region can be expanded by relaxing the system of constraints for the joint defaultintensities, by excluding the safest CDSs from the calibration.

22
In this paper we will use a time grid consisting of two maturities T1 and T2. Hence,the single-name CDSs constituting the entities in the credit portfolio are bootstrappedfrom their market spreads for T = T1 and T = T2. This is done by using piecewise constantindividual default intensity λi-s on the time intervals [0, T1] and [T1, T2].
Before we leave this subsection, we give some few more details on the calibration ofthe common shock intensities for the m groups in the second calibration step. From now onwe assume that the joint default intensities λIj (t)m
j=1 are piecewise constant functions of
time, so that λIj(t) = λ(1)Ij
for t ∈ [0, T1] and λIj(t) = λ(2)Ij
for t ∈ [T1, T2] and for every group
j. Next, the joint default intensities λ = (λ(k)Ij
)j,k = λ(k)Ij
: j = 1, . . . ,m and k = 1, 2 are
then calibrated so that the five-year model spread Sal,bl(λ) =: Sl(λ) will coincide with the
corresponding market spread S∗l for each tranche l. To be more specific, the parameters
λ = (λ(k)Ij
)j,k are obtained according to
λ = argminλ
∑
l
(Sl(λ) − S∗
l
S∗l
)2
(49)
under the constraints that all elements in λ are nonnegative and that λ satisfies the in-equalities (48) for every group Il and in each time interval [Tk−1, Tk] where T0 = 0. In Sl(λ)
we have emphasized that the model spread for tranche l is a function of λ = (λ(k)Ij
)j,k but wesuppressed the dependence in other parameters like interest rate, payment frequency or λi,i = 1, . . . , n. In the calibration we used an interest rate of 3%, the payments in the premiumleg were quarterly and the integral in the default leg was discretized on a quarterly mesh.For each data-set we use a constant recovery of 40%. We use MatLab in our numericalcalculations and the objective function (49) is minimized by using the built in optimizationroutine fmincon together with the constraints given by equations on the form (48).
In Subsection 4.3 we use the above setting for our two data-set and perform a calibra-tion with constant recovery of 40%.
4.2 Calibration Methodology with Piecewise Constant Default Intensities
and Stochastic Recoveries
In this subsection we discuss the second calibration methodology used when fitting theMarkov copula model against CDO tranches on the iTraxx Europe and CDX.NA.IG seriesin Subsection 4.3. This method relies on piecewise constant default intensities and stochas-tic recoveries. Recall that compared with constant recoveries, using stochastic recoveriesrequires a more sophisticated method in order to compute the tranche loss distribution,as was explained in Subsection 3.4. The methodology and constraints connected to thepiecewise constant default intensities are the same as in Subsection 4.1. Therefore we willin this subsection only discuss the distribution for the individual stochastic recoveries Ri aswell as accompanying constraints used in the calibration. This distribution will determinethe quantity E
(eγ(1−Ri)
)in (44) which is needed to compute the tranche loss distribution.
We assume that the individual recoveries Ri are i.i.d and have a binomial mixturedistribution on the following form
Ri ∼1
KBin (K,R∗(p0 + (1 − Θ)p1)) where Θ ∈ 0, 1 and P [Θ = 1] = q (50)
where R∗, q p0 and p1 are positive constants and K is an integer (in this paper we let

23
K = 10). As a result, the recovery rate distribution function is given by
P
[Ri =
k
K
]=
1∑
ξ=0
µ(ξ)
(K
k
)p(ξ)k(1 − p(ξ))K−k where p(ξ) = R∗ (p0 + (1 − ξ)p1) (51)
for ξ ∈ 0, 1 and µ(1) = q, µ(0) = 1 − q. Let the constant R∗ in (50) represent theaverage recovery for each obligor in the portfolio, which we assume to be the same forall obligors. We next impose the constraint E [Ri] = R∗ which is necessary in order tohave a calibration of the single-name CDSs that is separate from the calibration of thecommon-shock parameters. The condition E [Ri] = R∗ leads to the following constraint onthe parameters q (see in [5] for a detailed derivation)
q < min
(1,
1
p0,
1 −R∗
1 −R∗p0
). (52)
Furthermore, the constraint E [Ri] = R∗ also implies that p1 = 1−p0
1−q so p1 can be seen asa function of q and p0. The constraints (52) will be used in our calibration of the CDOtranches simultaneously with the other constraints for the common shock intensities. Inour calibrations the parameters p0 and R∗ will be treated as exogenously given parameterswhere we set R∗ = 40% while p0 can be any positive scalar satisfying p0 <
1R∗ . The scalar
p0 will give us some freedom to fine-tune our calibrations. A more detailed description ofthe constraints for p0, q and p1 are given in [5].
In this subsection we thus combine the stochastic recoveries in (50) with piecewiseconstant default intensities as described in Subsection 4.1 so the parameters to be calibratedwill be on the form θ = (λ, q) where λ are the same as in Subsection 4.1. Consequently, usingthe same notation as in Subsection 4.1 the parameters θ = (λ, q) are obtained according to
θ = argminθ
∑
l
(Sl(θ) − S∗
l
S∗l
)2
(53)
where λ must satisfies the same constraints as in Subsection 4.1 while q must obey (52).The rest of the notation in (53) are defined as in Subsection 4.1. In Subsection 4.3 weuse the above setting with stochastic recoveries when calibrating this model against twodifferent CDO data-sets.
Finally, note that if the i.i.d recoveries Ri would follow other distributions than (50)we simply modify Eeγ(1−Ri) in (44) in Subsection 3.4 but the rest of the computations arethe same. Of course, changing (50) will also imply that the constraints in (52) will no longerbe relevant.
4.3 Calibration Results with Piecewise Constant Default Intensities
In this subsection we calibrate our model against CDO tranches on the iTraxx Europeand CDX.NA.IG series with maturity of five years. We use the calibration methodologydescribed in Subsection 4.1 and Subsection 4.2.

24
0 20 40 60 80 100 120 1400
200
400
600
800
1000
1200
obligors
CD
S s
prea
ds
3−year CDS spreads: iTraxx March 31, 20085−year CDS spreads: iTraxx March 31, 20083−year CDS spreads: CDX Dec 17, 20075−year CDS spreads: CDX Dec 17, 2007
Figure 3: The 3 and 5-year market CDS spreads for the 125 obligors used in the single-namebootstrapping, for the two portfolios CDX.NA.IG sampled on December 17, 2007 and theiTraxx Europe series sampled on March 31, 2008. The CDS spreads are sorted in decreasingorder.
Hence, the 125 single-name CDSs constituting the entities in these series are boot-strapped from their market spreads for T1 = 3 and T2 = 5 using piecewise constant indi-vidual default intensities on the time intervals [0, 3] and [3, 5]. Figure 3 displays the 3 and5-year market CDS spreads for the 125 obligors used in the single-name bootstrapping, forthe two portfolios CDX.NA.IG sampled on December 17, 2007 and the iTraxx Europe seriessampled on March 31, 2008. The CDS spreads are sorted in decreasing order.
When calibrating the joint default intensities λ = (λ(k)Ij
)j,k for the CDX.NA.IG Se-
ries 9, December 17, 2007 we used 5 groups I1, I2, . . . , I5 where Ij = 1, . . . , ij for ij =6, 19, 25, 61, 125. Recall that we label the obligors by decreasing level of riskiness. We usethe average over 3-year and 5-year CDS spreads as a measure of riskiness. Consequently,obligor 1 has the highest average CDS spread while company 125 has the lowest averageCDS spread. Moreover, the obligors in the set I5 \ I4 consisting of the 64 safest companiesare assumed to never default individually, and the corresponding CDSs are excluded fromthe calibration, which in turn relaxes the constraints for λ in (48). Hence, the obligorsin I5 \ I4 can only bankrupt due to a simultaneous default of the companies in the groupI5 = 1, . . . , 125, i.e., in an Armageddon event. With this structure the calibration againstthe December 17, 2007 data-set is very good as can be seen in Table 1. By using stochas-tic recoveries specified as in (50) and (51) we get a perfect fit of the same data-set. Thecalibrated common shock intensities λ for the 5 groups in the December 17, 2007 data-set,both for constant and stochastic recoveries, are displayed in the left subplot in Figure 4.
Note that the shock intensities λ(1)Ij
for the first pillar (i.e. on the interval [0, 3]) follows thesame trends both in the constant and stochastic recovery case, while the shock intensities
λ(2)Ij
for the second pillar (i.e. on the interval [3, 5]) has less common trend.

25
The calibration of the joint default intensities λ = (λ(k)Ij
)j,k for the data sampledat March 31, 2008 is more demanding. This time we use 18 groups I1, I2, . . . , I18 whereIj = 1, . . . , ij for ij = 1, 2, . . . , 11, 13, 14, 15, 19, 25, 79, 125. In order to improve the fit, asin the 2007-case, we relax the constraints for λ in (48) by excluding from the calibrationthe CDSs corresponding to the obligors in I18 \ I17. Hence, we assume that the obligors inI18 \ I17 never default individually, but can only bankrupt due to an simultaneous defaultof all companies in the group I18 = 1, . . . , 125. In this setting, the calibration of the2008 data-set with constant recoveries yields an acceptable fit except for the [3, 6] tranche,as can be seen in Table 1. However, by including stochastic recoveries (50), (51) the fitis substantially improved as seen in Table 1. Furthermore, in both recovery versions, themore groups added the better the fit, which explain why we use as many as 18 groups.
Table 1: CDX.NA.IG Series 9, December 17, 2007 and iTraxx Europe Series 9, March 31,2008. The market and model spreads and the corresponding absolute errors, both in bpand in percent of the market spread. The [0, 3] spread is quoted in %. All maturities arefor five years.
CDX 2007-12-17: Calibration with constant recovery
Tranche [0, 3] [3, 7] [7, 10] [10, 15] [15, 30]
Market spread 48.07 254.0 124.0 61.00 41.00Model spread 48.07 254.0 124.0 61.00 38.94
Absolute error in bp 0.010 0.000 0.000 0.000 2.061Relative error in % 0.0001 0.000 0.000 0.000 5.027
CDX 2007-12-17: Calibration with stochastic recovery
Tranche [0, 3] [3, 7] [7, 10] [10, 15] [15, 30]
Market spread 48.07 254.0 124.0 61.00 41.00Model spread 48.07 254.0 124.0 61.00 41.00
Absolute error in bp 0.000 0.000 0.000 0.000 0.000Relative error in % 0.000 0.000 0.000 0.000 0.000
iTraxx Europe 2008-03-31: Calibration with constant recovery
Tranche [0, 3] [3, 6] [6, 9] [9, 12] [12, 22]
Market spread 40.15 479.5 309.5 215.1 109.4Model spread 41.68 429.7 309.4 215.1 103.7
Absolute error in bp 153.1 49.81 0.0441 0.0331 5.711Relative error in % 3.812 10.39 0.0142 0.0154 5.218
iTraxx Europe 2008-03-31: Calibration with stochastic recovery
Tranche [0, 3] [3, 6] [6, 9] [9, 12] [12, 22]
Market spread 40.15 479.5 309.5 215.1 109.4Model spread 40.54 463.6 307.8 215.7 108.3
Absolute error in bp 39.69 15.90 1.676 0.5905 1.153Relative error in % 0.9886 3.316 0.5414 0.2745 1.053

26
1 2 3 4 50
0.01
0.02
0.03
0.04
0.05
0.06
Com
mon
sho
ck in
tens
ities
Group nr.
Common shock intensities for CDX.NA.IG, 2007−12−17
λIj(1), const. recovery
λIj(2), const. recovery
λIj(1), stoch. recovery
λIj(2), stoch. recovery
0 5 10 150
0.005
0.01
0.015
0.02
0.025
Com
mon
sho
ck in
tens
ities
Group nr.
Common shock intensities for iTraxx Europe, 2008−03−31
λIj(1), const. recovery
λIj(2), const. recovery
λIj(1), stoch. recovery
λIj(2), stoch. recovery
Figure 4: The calibrated common shock intensities (λ(k)Ij
)j,k both in the constant andstochastic recovery case for the two portfolios CDX.NA.IG sampled on December 17, 2007(left) and the iTraxx Europe series sampled on March 31, 2008 (right).
The calibrated common shock intensities λ for the 18 groups in the March 2008 data-set, both for constant and stochastic recoveries, are displayed in the right subplot in Figure 4.In this subplot we note that for the 13 first groups I1, . . . , I13, the common shock intensities
λ(1)Ij
for the first pillar are identical in the constant and stochastic recovery case, and thendiverge quite a lot on the last five groups I14, . . . , I18, except for group I16. Similarly, in the
same subplot we also see that for the 11 first groups I1, . . . , I11, the shock intensities λ(2)Ij
for the second pillar are identical in the constant and stochastic recovery case, and thendiffer quite a lot on the last seven groups, except for group I13. The optimal parameters qand p0 used in the stochastic recovery model was given by q = 0.4405 and p0 = 0.4 for the2007 data set and q = 0.6002 and p0 = 0.4 for the 2008 case.
Let us finally discuss the choice of the groupings I1 ⊂ I2 ⊂ . . . ⊂ Im in our calibrations.First, for the CDX.NA.IG Series 9, December 17, 2007 data set, we used m = 5 groupswith as always im = n. For j = 1, 2 and 4 the choice of ij corresponds to the numberof defaults needed for the loss process with constant recovery of 40% to reach the j-thattachment points. Hence, ij · 1−R
n with R = 40% and n = 125 then approximates theattachment points 3%, 10%, 30% which explains the choice i1 = 6, i2 = 19, i4 = 61. Thechoice of i3 = 25 implies a loss of 12% and gave a better fit than choosing i3 to exactly match15%. Finally, no group was chosen to match the attachment point of 7% since this madethe calibration worse off for all groupings we tried. With the above grouping structurewe got almost perfect fits in the constant recovery case, and perfect fit with stochasticrecovery, as was seen in Table 1. Unfortunately, using the same technique on the marketCDO data from the iTraxx Europe series sampled on March 31, 2008 was not enough toachieve good calibrations. Instead more groups had to be added and we tried differentgroupings which led to the optimal choice rendering the calibration in Table 1. To this end,it is of interest to study the sensitivity of the calibrations with respect to the choice of the

27
groupings on the form I1 ⊂ I2 ⊂ . . . ⊂ Im where Ij = 1, . . . , ij for ij ∈ 1, 2, . . . ,m andi1 < . . . < im = 125 on the March 31, 2008, data set. Three such groupings are displayed inTable 2 and the corresponding calibration results on the 2008 data set is showed in Table3.
Table 2: Three different groupings (denoted A,B and C) consisting of m = 7, 9, 13 groupshaving the structure I1 ⊂ I2 ⊂ . . . ⊂ Im where Ij = 1, . . . , ij for ij ∈ 1, 2, . . . ,m andi1 < . . . < im = 125.
Three different groupings
ij i1 i2 i3 i4 i5 i6 i7 i8 i9 i10 i11 i12 i13Grouping A 6 14 15 19 25 79 125Grouping B 2 4 6 14 15 19 25 79 125Grouping C 2 4 6 8 9 10 11 14 15 19 25 79 125
Table 3: The relative calibration error in percent of the market spread, for the threedifferent groupings A, B and C in Table 2, when calibrated against CDO tranche on iTraxxEurope Series 9, March 31, 2008 (see also in Table 1).
Relative calibration error in % (constant recovery)
Tranche [0, 3] [3, 6] [6, 9] [9, 12] [12, 22]
Error for grouping A 6.875 18.33 0.0606 0.0235 4.8411Error for grouping B 6.622 16.05 0.0499 0.0206 5.5676Error for grouping C 4.107 11.76 0.0458 0.0319 3.3076
Relative calibration error in % (stochastic recovery)
Tranche [0, 3] [3, 6] [6, 9] [9, 12] [12, 22]
Error for grouping A 3.929 9.174 2.902 1.053 2.109Error for grouping B 2.962 7.381 2.807 1.002 1.982Error for grouping C 1.439 4.402 0.5094 0.2907 1.235
From Table 3 we see that in the case with constant recovery the relative calibrationerror in percent of the market spread decreased monotonically for the first three thranchesas the number of groups increased. Furthermore, in the case with stochastic recovery therelative calibration error decreased monotonically for all five tranches as the number ofgroups increased in each grouping. The rest of the parameters in the calibration where thesame as in the optimal calibration in Table 1.
Finally, we remark that the two optimal groupings used in Table 1 in the two differentdata sets CDX.NA.IG Series 9, December 17, 2007 and iTraxx Europe Series 9, March 31,2008 differ quite a lot. However, the CDX.NA.IG Series is composed by North Americanobligors while the iTraxx Europe Series is formed by European companies. Thus, there is nomodel risk or inconsistency created by using different groupings for these two different datasets, coming from two disjoint markets. If on the other hand the same series is calibratedand assessed (e.g. for hedging) at different time points in a short time span, it is of coursedesirable to use the same grouping in order to avoid model risk.

28
4.3.1 The Implied Loss Distribution
After the fit of the model against market spreads we can use the calibrated portfolio param-
eters λ = (λ(k)Ij
)j,k together with the calibrated individual default intensities, to study thecredit-loss distribution in the portfolio. In this paper we only focus on some few examplesderived from the loss distribution with constant recoveries evaluated at T = 5 years.
0 20 40 60 80 100 120 1400
0.02
0.04
0.06
0.08
0.1
0.12
0.14
0.16
0.18
Number of defaults
prob
abili
ty
Implied probabilty P[N5=k] for k=0,1,...,125
P[N5=k], 2007−12−17
P[N5=k], 2008−03−31
0 5 10 15 20 25 30 350
0.02
0.04
0.06
0.08
0.1
0.12
0.14
0.16
0.18
Number of defaults
prob
abili
ty
Implied probabilty P[N5=k] for k=0,1,...,35
P[N5=k], 2007−12−17
P[N5=k], 2008−03−31
Figure 5: The implied distribution P [N5 = k] on 0, 1, . . . , ℓ where ℓ = 125 (top) andℓ = 35 (bottom) when the model is calibrated against CDX.NA.IG Series 9, December 17,2007 and iTraxx Europe Series 9, March 31, 2008.
The allowance of joint defaults of the obligors in the groups Ij together with therestriction of the most safest obligors not being able to default individually, will lead to

29
some interesting effects of the loss distribution, as can be seen in Figures 5 and 6. Forexample, we clearly see that the support of the loss-distributions will in practice be limitedto a rather compact set. To be more specific, the upper and lower graphs in Figure 5indicate that P [N5 = k] roughly has support on the set 1, . . . , 35 ∪ 61 ∪ 125 for the2007 case and on 1, . . . , 40 ∪ 79 ∪ 125 for the 2008 data-set. This becomes even moreclear in a log-loss distribution, as is seen in the upper and lower graphs in Figure 6.
0 20 40 60 80 100 120 14010
−70
10−60
10−50
10−40
10−30
10−20
10−10
100
Number of defaults
prob
abili
ty in
log−
scal
e
Implied log(P[N5=k]) for k=0,1,...,125
P[N5=k], 2007−12−17
P[N5=k], 2008−03−31
0 5 10 15 20 25 30 3510
−10
10−8
10−6
10−4
10−2
100
Number of defaults
prob
abili
ty in
log−
scal
e
Implied log(P[N5=k]) for k=0,1,...,35
P[N5=k], 2007−12−17
P[N5=k], 2008−03−31
Figure 6: The implied log distribution ln(P [N5 = k]) on 0, 1, . . . , ℓ where ℓ = 125 (top)and ℓ = 35 (bottom) when the model is calibrated against CDX.NA.IG Series 9, December17, 2007 and iTraxx Europe Series 9, March 31, 2008.
From the upper graph in Figure 6 we see that the default-distribution is nonzero on

30
36, . . . , 61 in the 2007-case and nonzero on 41, . . . , 79 for the 2008-sample, but theactual size of the loss-probabilities are in the range 10−10 to 10−70. Such low values willobviously be treated as zero in any practically relevant computation. Furthermore, thereasons for the empty gap in the upper graph in Figure 6 on the interval 62, . . . , 124 forthe 2007-case is due to the fact that we forced the obligors in the set I5 \ I4 to never defaultindividually, but only due to an simultaneous common shock default of the companies inthe group I5 = 1, . . . , 125. This Armageddon event is displayed as an isolated nonzero‘dot’ at default nr 125 in the upper graph of Figure 6. The gap on 80, . . . , 124 in the 2008case is explained similarly due to our assumption on the companies in the set I19 \I18. Alsonote that the two ‘dots’ at default nr 125 in the top plot of Figure 6 are manifested as spikesin the upper graph displayed in Figure 5. The shape of the multimodal loss distributionspresented in Figure 5 and Figure 6 are typical for models allowing simultaneous defaults,see for example Figure 2, page 59 in [13] and Figure 2, page 710 in [22].
4.4 Calibration Methodology and Results with Stochastic Intensities
We now consider that pre-specified group intensities are stochastic CIR processes given as inExample 2.7. For simplicity, a and c are fixed a priori and we assume a piecewise-constantparameterization of every mean-reversion function bY (t) (see expression (13)), so for everyk = 1 . . .M,
bY (t) = b(k)Y , t ∈ [Tk−1, Tk).
where T0 = 0. The time grid (Tk) is the same than the one used in the previous section,i.e., M = 2, T1 = 3, T2 = 5. It corresponds to the set of standard CDS maturities whichare lower or equal to the maturity of the fitted CDO tranches. In order to reduce thenumber of parameters at hands, we consider that, for every group Y ∈ Y, the starting pointof the corresponding intensity process is given by its first-pillar mean-reversion parameter,
i.e., XY0 = b
(1)Y . This specification guarantees that there are exactly the same number
of parameters to fit than in Subsection 4.1 (piecewise-constant intensities and constantrecovery). All other aspects of the model are the same as in Subsection 4.1. So, wereproduce the same calibration methodology except that now individual mean-reversion
parameters b(k)i : i = 1, . . . , n and k = 1, 2 play the role of former parameters λ(k)
i : i =
1, . . . , n and k = 1, 2 and shock parameters b(k)Ij
: j = 1, . . . ,m and k = 1, 2 play the role
of former parameters λ(k)Ij
: j = 1, . . . ,m and k = 1, 2.In order to construct a tractable CDS and CDO pricer, the “building blocks” survival
group probabilities
E
[exp
(−∫ t
0XY
u du
)]
have to be computed very efficiently. Fortunately, for CIR processes XY , the latter quan-tities are solution of related ODEs which can be solved analytically.
We now study the calibration performance of this model specification. Playing withdifferent values of parameters a (speed of mean-reversion) and c (volatility) may slightlyaffect the quality of the fit. We consider thereafter that a = 3 and c = 0.5 which render ourbest results.

31
Table 4: CDX.NA.IG Series 9, December 17, 2007. The market and model spreads and thecorresponding absolute errors, both in bp and in percent of the market spread. The [0, 3]spread is quoted in %. All maturities are for five years.
CDX 2007-12-17: Calibration with constant recovery
Tranche [0, 3] [3, 7] [7, 10] [10, 15] [15, 30]
Market spread 48.07 254.0 124.0 61.00 41.00Model spread 50.37 258.01 124.68 61.32 41.91
Absolute error in bp 2.301 4.016 0.684 0.327 0.912Relative error in % 4.787 1.581 0.552 0.536 2.225
As can be seen in Table 4, we obtain a correct fit for CDX 2007-12-17 even in thecase where no name is removed from the calibration constraints. Here, we use 5 groupsI1, I2, . . . , I5 where Ij = 1, . . . , ij for ij = 8, 19, 27, 102, 125. Note that when the lastgroup I5 is retrieved from the calibration constraints, we are able to obtain a perfect fit asobserved with the piecewise constant intensity model with stochastic recovery.
For iTraxx Europe 2008-03-31, the calibration results are not improved with respectto the piecewise-constant intensity model with constant recovery.
4.5 Min-Variance Hedging Deltas
In this subsection we present some numerical results illustrating performance of the min-variance hedging strategies given in Proposition 3.2. We here only focus on hedging strate-gies for the data of CDX.NA.IG Series 9 on December 17, 2007 calibrated in the constantrecovery model presented in Subsection 4.1.
The aim of this subsection is to analyze the composition of the hedging portfolio attime t = 0 (the calibration date) when standardized CDO tranches are hedged with a groupof d single-name CDSs, which are included in the underlying CDS index. Since no spreadfactor X is used in the model, Proposition 3.2 then implies that the min-variance hedgingratios at time t = 0 is given by ζva(0,H0) = (u,v)(v,v)−1(0,H0) where
(u,v) =∑
Y ∈Y
λY (0)∆uY (∆vY )T and (v,v) =∑
Y ∈Y
λY (0)∆vY (∆vY )T.
Hence, computing the min-variance hedging ratios involves a summation of the “jump differ-entials” λY (0)∆uY (∆vY )T and λY (0)∆vY (∆vY )T over all possible triggering events Y ∈ Ywhere Y = 1, . . . , n, I1, . . . , Im.
In the calibration of the CDX.NA.IG Series 9, we usedm = 5 groups I1, I2, . . . , I5 whereIj = 1, . . . , ij for ij = 6, 19, 25, 61, 125 and the obligors have been labeled by decreasinglevel of riskiness. At the calibration date t = 0 associated with December 17, 2007, no namehas defaulted in CDX Series 9 so we set H0 = 0. In our empirical framework, the intensitiesλY (0), Y ∈ Y are computed from the constant default intensities λi that fit market spreadsof 3-year maturity CDSs and from the 3-year horizon joint default intensities λIj calibratedto CDO tranche quotes. The terms ∆uY (0,H0) and ∆vY (0,H0) corresponds to the changein value of the tranche and the single-name CDSs, at the arrival of the triggering eventaffecting all names in group Y . Recall that the cumulative change in value of the trancheis equal to
∆uY (0,H0) = La,b(HY0 ) − La,b(H0) + u(0,HY
0 ) − u(0,H0)

32
where HY0 is the vector of 0, 1n such that only the components i ∈ Y are equal to one.
Hence, the tranche sensitivity ∆uY (0,H0) includes both the protection payment on thetranche associated with the default of group Y and the change in the ex-dividend priceu of the tranche. Note that the price sensitivity is obtained by computing the change inthe present value of the default leg and the premium leg. The latter quantity involves thecontractual spread that defines cash-flows on the premium leg. As for CDX.NA.IG Series9, the contractual spreads were equal to 500 bps, 130 bps, 45 bps, 25 bps and 15 bps forthe tranches [0-3%], [3-7%], [7-10%], [10-15%] and [15-30%]. We use the common-shockinterpretation to compute u(0,HY
0 ) and u(0,H0) with the convolution recursion pricingscheme detailed in Subsection 3.3. More precisely, using the same notation as in Subsec-tion 3.3, the CDO tranche price u(0,HY
0 ) (resp. u(0,H0)) is computed using the recursionprocedure with Z = Nn \ Y (resp. Z = Nn). We let i1, . . . id be the CDSs used in themin-variance hedging and assume that they all are initiated at time t = 0. Hence, themarket value at t = 0 for these CDSs are zero. As a result, when group Y defaults simul-taneously, the change in value ∆vY (0,H0) for buy-protection positions on these CDSs isonly due to protection payment associated with names in group Y . Hence, for one unitof nominal exposure on hedging CDSs, the corresponding vector of sensitivities is equal to∆vY (0,H0) = ((1 − R)1i1∈Y , . . . , (1 − R)1id∈Y )T where the recovery rate R is assumed tobe constant and equal to 40%.
Table 5: The names and CDS spreads (in bp) of the six riskiest obligors used in the hedgingstrategy displayed by Figure 7.
Company (Ticker) CCR-HomeLoans RDN LEN SFI PHM CTX
3-year CDS spread 1190 723 624 414 404 393
Figure 7 displays the nominal exposure for the d most riskiest CDSs when hedging oneunit of nominal exposure in a CDO by using the min-variance hedging strategy in Proposi-tion 3.2. We use d = 3, 4, 5 and d = 6 in our computations. Furthermore, Table 5 displaysthe names and sizes of the 3-year CDS spreads used in the hedging strategy. Each plot inFigure 7 should be interpreted as follows: in every pair (x, y) the x-component representsthe size of the 3-year CDS spread at the hedging time t = 0 while the y-component isthe corresponding nominal CDS-exposure computed via Proposition 3.2 using the d riskiestCDSs. The graphs are ordered from top to bottom, where the top panel corresponds tohedging with the d = 3 riskiest CDS and the bottom panel corresponds to hedging with thed = 6 riskiest names. Note that the x-axes are displayed from the riskiest obligor to thesafest. Thus, hedge-sizes y for riskier CDSs are aligned to the left in each plot while y-valuesfor safer CDSs are consequently displayed more to the right. In doing this, going from thetop to the bottom panel consists in observing the effect of including new safer names fromthe right part of the graphs. We have connected the pairs (x, y) with lines forming graphsthat visualizes possible trends of the min-variance hedging strategies for the d most riskiestCDSs. For example, when the three riskiest names are used for hedging (top panel), weobserve that the amount of nominal exposure in hedging instruments decreases with thedegree of subordination, i.e., the [0-3%] equity tranche requires more nominal exposure inCDSs than the upper tranches.

33
6007008009001000110012000
0.05
0.1
0.15
0.2
0.25
0.3
0.35
0.40.4Hedging with the 3 riskiest names
3−year CDS spread
CDS
nom
inal e
xpos
ure
[0−3%] tranche[3−7%] tranche[7−10%] tranche[10−15%] tranche[15−30%] tranche
4005006007008009001000110012000
0.05
0.1
0.15
0.2
0.25
0.3
0.35
0.4Hedging with the 4 riskiest names
3−year CDS spread
CDS
nom
inal e
xpos
ure
[0−3%] tranche[3−7%] tranche[7−10%] tranche[10−15%] tranche[15−30%] tranche
4005006007008009001000110012000
0.05
0.1
0.15
0.2
0.25Hedging with the 5 riskiest names
3−year CDS spread
CDS
nom
inal e
xpos
ure
[0−3%] tranche[3−7%] tranche[7−10%] tranche[10−15%] tranche[15−30%] tranche
4005006007008009001000110012000
0.05
0.1
0.15
0.2Hedging with the 6 riskiest names (group 1)
3−year CDS spread
CDS
nom
inal e
xpos
ure
[0−3%] tranche[3−7%] tranche[7−10%] tranche[10−15%] tranche[15−30%] tranche
Figure 7: Min-variance hedging strategies associated with the d riskiest CDSs, d = 3, 4, 5, 6for one unit of nominal exposure of different CDO tranches in a model calibrated to marketspreads of CDX.NA.IG Series 9 on December 17, 2007.

34
Note moreover that the min-variance hedging portfolio contains more CDSs on nameswith lower spreads. When lower-spread CDSs are added in the portfolio, the picture remainsalmost the same for the 3 riskiest names. For the remaining safer names however, the picturedepends on the characteristics of the tranche. For the [0-3%] equity tranche, the quantityof the remaining CDSs required for hedging sharply decrease as additional safer names areadded. One possible explanation is that adding too many names in the hedging strategywill be useless when hedging the equity tranche. This is intuitively clear since one expectsthat the most riskiest obligors will default first and consequently reduce the equity tranchesubstantially, explaining the higher hedge-ratios for riskier names, while it is less likely thatthe more safer names will default first and thus incur losses on the first tranche whichexplains the lower hedge ratios for the safer names. We observe the opposite trend forthe senior (safer) tranches: adding new (safer) names in the hedging portfolio seems tobe useful for “non equity” tranches since the nominal exposure required for these namesincreases when they are successively added.
Figure 8 and 9 display min-variance hedging strategies when hedging a standardtranche with the 61 riskiest names, i.e., all names excepted names in group I5 \I4. Contraryto Figure 7, these graphs allow to visualize the effect of the “grouping structure” on thecomposition of the hedging portfolio. In this respect, we use different marker styles in orderto distinguish names in the different disjoint groups I1, I2\I1, I3\I2, I4 \I3. As one can see,the min-variance hedging strategies are quite different among tranches. Moreover, whereasnominal exposures required for hedging are clearly monotone for names belonging to thesame disjoint group, this tendency is broken when we consider names in different groups.This suggests that the grouping structure has a substantial impact on the distribution ofnames in the hedging portfolio. For the equity tranche, we observe in Figure 7 that lesssafer-names are required for hedging. This feature is retained in Figure 8 when we look atnames in specific disjoint groups. Indeed, names in a given disjoint group are affected bythe same common-shocks which in turn affect the equity tranche with the same severity.The only effect that may explain differences in nominal exposure among names in the samedisjoint group is spontaneous defaults: names with wider spreads are more likely to defaultfirst, then we need them in greater quantity for hedging than names with tighter spreads.
Note that nominal exposure in hedging CDS even becomes negative for names withingroups I2 \ I1 and I4 \ I3 when spreads are low. However, in Figure 8 we observe that,for the equity tranche, some of the riskiest names in I4 \ I3 are more useful in the hedgingthan some of the safest names in group I1, which may sound strange at a first glance, giventhat the credit spread of the latter is much larger than the credit spread of the former.Recall that the equity tranche triggers protection payments corresponding to the few firstdefaults, if these occur before maturity. Even if names in group I4\I3 have a very low defaultprobability, the fact that they can affect the tranche at the arrival of common-shocks I4 orI5 makes these names appealing for hedging because they are less costly (they require lesspremium payments) than names in I1.
Figure 8 suggests that names with the lowest spreads should be ineffective to hedgethe [0-3%] and the [3-7%] tranches. As can be seen in Figure 9, this is the contrary for theother tranches, i.e., the amount of low-spread names in the hedging portfolio increases asthe tranche becomes less and less risky. For the [15-30%] super-senior tranche, we can seeon the lowest graph of Figure 9 that the safer a name is, the larger the quantity which isrequired for hedging. Furthermore, Figure 9 also shows that in a consistent dynamic modelof portfolio credit risk calibrated to a real data set, the [15-30%] super-senior tranche hassignificant (in fact, most of its) sensitivity to very safe names with spreads less than a few

35
dozens of bp-s. For this tranche it is actually likely that one could improve the hedge byinclusion of even safer names to the set of hedging instruments, provided these additionalnames could also be calibrated to. Recall that on the data of CDX.NA.IG Series 9 onDecember 17, 2007, we calibrated our model to the 64 safest names in the portfolio.
020040060080010001200−0.2
−0.15
−0.1
−0.05
0
0.05
0.1
0.15
0.2
3−year CDS spread
CD
S n
omin
al e
xpos
ure
Hedging [0−3%] equity tranche with the 61 riskiest names (all names in I4)
Names in group I1Names in group I2\I1Names in group I3\I2Names in group I4\I3
020040060080010001200−0.04
−0.02
0
0.02
0.04
0.06
0.08
0.1
0.12
0.14
3−year CDS spread
CD
S n
omin
al e
xpos
ure
Hedging [3−7%] mezzanine tranche with the 61 riskiest names (all names in group 4)
Names in group I1Names in group I2\I1Names in group I3\I2Names in group I4\I3
Figure 8: Min-variance hedging strategies when hedging one unit of nominal exposure inthe [0-3%] equity tranche (top) and the [3-7%] mezzanine tranche (bottom) using the driskiest CDSs, d = 61 (all names excepted names in group I5 \ I4) for one unit of nominalexposure.

36
0200400600800100012000
0.02
0.04
0.06
0.08
0.1
0.12
0.14
0.16
0.18
3−year CDS spread
CD
S n
omin
al e
xpos
ure
Hedging [7−10%] tranche with the 61 riskiest names (all names in group 4)
Names in group I1Names in group I2\I1Names in group I3\I2Names in group I4\I3
0200400600800100012000
0.01
0.02
0.03
0.04
0.05
0.06
3−year CDS spread
CD
S n
omin
al e
xpos
ure
Hedging [10−15%] tranche with the 61 riskiest names (all names in group 4)
Names in group I1Names in group I2\I1Names in group I3\I2Names in group I4\I3
0200400600800100012000
0.01
0.02
0.03
0.04
0.05
0.06
0.07
3−year CDS spread
CD
S n
omin
al e
xpos
ure
Hedging [15−30%] tranche with the 61 riskiest names (all names in group 4)
Names in group I1Names in group I2\I1Names in group I3\I2Names in group I4\I3
Figure 9: Min-variance hedging strategies when hedging one unit of nominal exposure inthe [7-10%] tranche (top), the [10-15%] tranche (middle) and the [15-30%] tranche (bottom)with the d riskiest CDSs, d = 61 (all names excepted names in group I5 \ I4).
37
A Appendix
A.1 Model Construction
The point process H with intensity depending on the factor process X in (3), is constructedby an X-related change of probability measure, starting from an independent continuous-time Markov chain. So, given a factor process X as in (1), let H denote a continuous-timeMarkov chain with P-intensity one of transition from k to l, for every l 6= k. Let then theP-martingale9 Γ be defined by Γ0 = 1 and, for t ∈ [0, T ],
dΓt
Γt−=
∑
l∈0,1n
(λ(t,Xt,Ht−, l) − 1)(dNt(Ht−, l) − 1l 6=Ht−dt
)
=∑
l 6=Ht−
(λ(t,Xt,Ht−, l) − 1) (dNt(Ht−, l) − dt),
where the functions λ(t,x,k, l) are those of (3), and where Nt(k, l) is the point process withP-intensity 1k=Ht−,l 6=k counting the transitions of H from k to l, for every k, l ∈ 0, 1n.
Defining the measure P by dP
dP= ΓT , it is then standard to check10 that the point process H
has intensity (3) under P. To be precise the intensity of Nt(k, l) is given by (3), with respectto the model filtration F = F (W,H), and the probability measure P. Moreover, process Wremains a Brownian motion under P, the measure-change preserves Markov property of Xwith respect to filtration F , and the generator of X under the new measure is still At.
Note that since martingale representation holds under P,11 martingale representationalso holds under the equivalent measure P.
Remark A.1 The prevailing risk neutral probability measure in the paper is P, whereasthe auxiliary measure P is only a mathematical tool used for constructing the model, withno particular financial interpretation.
A.1.1 Proof of Lemma 2.2
By definition of the set-event indicator process HZ , where Z ∈ Nn, one has in our model,for t ∈ [0, T ],
dHZt =
∑
k,l∈0,1n ; supp(l)\supp(k)=Z
dNt(k, l).
9Under suitable regularity and growth assumptions on the model coefficients, see Ethier and Kurtz [23]or Crepey [18].
10See for instance the proof of Lemma 8 in Crepey [18], or Lemma 7.5 in the online pre-print version of[18].
11In virtue of standard arguments, see for instance Chapter 10 of [30].

38
So, by (3),
ℓZt =∑
k,l∈0,1n ; supp(l)\supp(k)=Z
1Ht−=k
∑
Y ∈Y ;kY =l
λY (t,XYt )
=∑
l∈0,1n ; supp(l)\supp(Ht−)=Z
∑
Y ∈Y ;HYt−=l
λY (t,XYt )
=∑
Y ∈Y ;supp(HYt−)\supp(Ht−)=Z
λY (t,XYt )
=∑
Y ∈Y ;Yt=Z
λY (t,XYt ).
A.1.2 Proof of Proposition 2.3
Observe that [MY ,MZ ] = 0 for Y 6= Z. One thus has the following Ito formula (see forinstance Theorem 3.89 page 109 of Jacod [29] or Crepey [18])
du(t,Xt,Ht) =(∂t + Ac
t
)u(t,Xt,Ht)dt +∇u(t,Xt,Ht)σ(t,Xt)dWt
+∑
Z∈Nn
δuZ(t,Xt,Ht−)dHZt
(54)
where
Actu(t,x,k) =
∑
Y ∈Y
(bY (t, xY )∂xY
u(t,x,k) +1
2σ2
Y (t, xY )∂2x2
Yu(t,x,k)
). (55)
Moreover, the structure (4) of the set intensities implies that∑
Z∈Nn
δuZ(t,Xt,Ht−)dHZt =
∑
Z∈Zt
δuZ(t,Xt,Ht−)dHZt ,
which we may further rewrite as∑
Z∈Zt
ℓZ(t,Xt,Ht−)δuZ(t,Xt,Ht−)dt
+∑
Z∈Zt
(δuZ(t,Xt,Ht−)dHZ
t − ℓZ(t,Xt,Ht)δuZ(t,Xt,Ht)dt
).
Here the second term is∑
Z∈ZtδuZ(t,Xt,Ht−)dMZ
t , whereas one has by (4) in the firstterm:
∑
Z∈Zt
ℓZ(t,Xt,Ht−)δuZ(t,Xt,Ht−)
=∑
Z∈Zt
∑
Y ∈Y ;Yt=Z
λY (t,XYt )δuZ(t,Xt,Ht−)
=∑
Y ∈Y
λY (t,XYt )δuY (t,Xt,Ht−)
using in the last identity that
δuZ(t,x,k) = δuY (t,x,k),
for every t,x,k, Y and Z such that Yt = Z. Thus (54) indeed reduces to (6).

39
A.2 Markov Properties
Let us first recall the following local martingale characterization of a Markov process withgenerator L. We work under the standing assumption that uniqueness holds for the solutionof the martingale problem defined by L.
Lemma A.2 (See, e.g., Ethier and Kurtz [23]) Let X be a right-continuous process
with Euclidean state space E, adapted to some filtration F . For X to be an F- Markov
process with infinitesimal generator L, it is necessary and sufficient that, for every real-
valued function ϕ in the domain of L,
ϕ(t,Xt) −∫ t
0
(∂s + Ls
)ϕ(s,Xs)ds (56)
is an F- local martingale.
We shall use this characterization informally in this paper, ignoring the technicalities relatedto the notion of domain of an operator. Furthermore, throughout the paper we workunder the standing assumption that the valuation equation associated to any infinitesimalgenerator that we use, is well posed in an appropriate functional space. Finally, we assumethat uniqueness holds for the solution of the related martingale problem. The reader isreferred to Ethier and Kurtz [23] for more details and for specific conditions which can bepostulated in these regards.
A.2.1 Proof of Proposition 2.9
(i) In view of the Ito formula (6), (X,H) solves the martingale problem with generator Ain the filtration F , and is thus an F-Markov process.(ii) By application of the local martingale characterization of an F-Markov process (X,H)with generator A to test-functions of the form u(t,x,k) = vi(t, xi, ki), we get the localmartingale characterization of an F- Markov process with generator Ai for (Xi,H i). Con-sidering vi(t, xi, ki) = 1ki=1 therein yields that M i in (16) is an F-local martingale.(iii) We denote tZ = maxi∈Z ti, for every Z ∈ Nn. Formula (17) follows directly fromLemma A.3 below since one has, for every t, t1, . . . , tn ≥ 0,
P (τ1 > t1, . . . , τn > tn | Ft) =∑
Z∈Nn
1suppc(Ht)=ZP (τ1 > t1, . . . , τn > tn | Ft)
=∑
Z∈Nn
(∏
i/∈Z
1ti<τi≤t
)
E
∏
i∈Z
1τi>ti∨t
∣∣∣Ft
and
1ti<τi , i∈supp(Ht)E
exp
(−∑
Y ∈Y
ΛYt,θY
t
) ∣∣∣Xt
=∑
Z∈Nn
1suppc(Ht)=Z1ti<τi , i/∈ZE
exp(−∑
Y ∈Y
ΛYt,θY
t
) ∣∣∣Xt
=∑
Z∈Nn
(∏
i/∈Z
1ti<τi≤t
)(∏
i∈Z
1τi>t
)
E
exp(−∑
Y ∈Y
ΛYt,tY ∩Z
) ∣∣∣Xt
.
Given (17), the other formulas of part (iii) in Proposition 2.9 are straightforward.
40
Lemma A.3 For every t, t1, . . . , tn ≥ 0, and for every Z ∈ Nn, one has,
E
∏i∈Z 1τi>ti∨t
∣∣∣Ft
=(∏
i∈Z 1τi>t
)E
exp
(−∑Y ∈Y ; Y ∩Z 6=∅ ΛY
t,tY
) ∣∣∣Xt
. (57)
Proof. It is enough to prove that for ti ≥ t one has, for every Z ∈ Nn,
E
∏
i∈Z
1τi>ti
∣∣∣Ft
=
(∏
i∈Z
1τi>t
)
E
exp(−∑
Y ∈Y
ΛYt,tY ∩Z
) ∣∣∣Xt
. (58)
Indeed, for general ti, applying (58) to the ti ∨ t yields
E
∏
i∈Z
1τi>ti∨t
∣∣∣Ft
=
(∏
i∈Z
1τi>t
)E
exp
(−∑
Y ∈Y
ΛYt,maxi∈Y ∩Z ti∨t
) ∣∣∣Xt
=
(∏
i∈Z
1τi>t
)E
exp
−∑
Y ∈Y ; Y ∩Z 6=∅
ΛYt,maxi∈Z ti
∣∣∣Xt
,
which is (57). Let us thus show (58) for ti ≥ t, by induction on the cardinality d of Z. Ford = 0, the result is trivial. Assuming the result at rank d− 1 ≥ 0, let us show the result atrank d. Let us suppose, without loss of generality, that Z = Nd and t1 ≥ t2 ≥ · · · ≥ td ≥ t.
One then needs to prove that, using the notation J l = 1 −H l for every l ∈ Nd,
E(
d∏
l=1
J ltl| Ft) =
( d∏
l=1
J lt
)E
exp
(−∑
Y ∈Y
ΛYt,tNd∩Y
) ∣∣∣Xt
. (59)
To establish (59) one first observes that
E(∏d
l=1 Jltl| Ft) = E
Jd
tdE
∏d−1l=1 J
ltl
∣∣∣Ftd
∣∣∣Ft
, (60)
where by the induction hypothesis at rank d − 1 the inner conditional expectation can berepresented as
(∏d−1l=1 J
ltd
)E
exp
(−∑Y ∈Y ΛY
td,tNd−1∩Y
) ∣∣∣Xtd
=(∏d−1
l=1 Jltd
)v(td,Xtd) (61)
for a suitable function v = v(t,x) over [0, td−1] × RY , by the Markov property of X. Here
the upper bound td−1 for the domain of definition of the function v follows from the factthat td ≤ td−1 ≤ tNd−1∩Y , for every Y ∈ Y with Nd−1 ∩ Y 6= ∅. Inserting (61) into (60)yields by the Markov property of (X,H) that
E(
d∏
l=1
J ltl| Ft) = E
( d∏
l=1
J ltd
)v(td,Xtd)
∣∣∣Ft
= u(t,Xt,Ht),
for a function u = u(t,x,k) over [0, td] × RY × 0, 1n characterized by:
u(td,x,k) =( d∏
l=1
(1 − kl))v(td,x), x = (xY )Y ∈Y , k = (k1, . . . , kn) ∈ 0, 1n
(∂t + At
)u(t,x,k) = 0, t < td, x = (xY )Y ∈Y , k ∈ 0, 1n.
(62)

41
One finally shows that the RHS in (59) admits a representation of the form(∏d
l=1 Jlt
)w(t,Xt),
where the function u(t,x,k) =(∏d
l=1(1− kl))w(t,x) solves (62). By our standing assump-
tion in this paper equation (62) has a unique solution. Thus u = u, which proves (59).Since X is Markov with generator A (cf. (i)), the conditional expectation in the RHS
of (59) can be represented as w(t,Xt), for a deterministic function w = w(t,x) over thedomain [0, td] × R
Y . In order to get the analytic characterization of w, first note that forevery Y ∈ Y, one has:
ΛYtd,tNd−1∩Y
= ΛYtd,tNd∩Y
= ΛYtd,tNd∩Y
.
This yields the terminal condition w(td,x) = v(td,x), x = (xY )Y ∈Y . One further has by anapplication of the Feynman-Kac formula that (see, e.g., Jeanblanc et al. [30])
(∂t +At
)w(t,x) =
( ∑
Y ∈Y ; Y ∩Z 6=∅
λY (t, xY ))w(t,x), t < td, x = (xY )Y ∈Y .
As a result the function w = w(t,x) is the solution on [0, td] × RY to the following Kol-
mogorov pricing PDE:
w(td,x) = v(td,x), x = (xY )Y ∈Y(∂t +At
)w(t,x) =
( ∑
Y ∈Y ;Y ∩Z 6=∅
λY (t, xY ))w(t,x), t < td, x = (xY )Y ∈Y .
(63)
Denoting u(t,x,k) =(∏
l∈Nd(1−kl)
)w(t,x), an application of the operator At of (7) yields:
(∂t + At
)u(t,x,k) =
( ∏
l∈Nd
(1 − kl))(∂t +At
)w(t,x) + w(t,x) ×
×∑
Y ∈Y
λY (t, xY )(( ∏
l∈Nd
(1 − kYl ))−∏
l∈Nd
(1 − kl)), (64)
where we set, for Y ∈ Y and l ∈ Nd,
kYl =
1, Y ∋ l,
kl, else.
Therefore∑
Y ∈Y
λY (t, xY )(( ∏
l∈Nd
(1 − kYl ))−∏
l∈Nd
(1 − kl))
= −∏
l∈Nd
(1 − kl)∑
Y ∈Y ;Y ∩Nd 6=∅
λY (t, xY ). (65)
Plugging (63) and (65) in the RHS of (64) yields that(∂t + At
)u(t,x,k) = 0. Finally u
solves (62), which finishes the demonstration. 2
A.2.2 Proof of Proposition 3.1
Given a function f = f(t, y), let f(tj−, x) be a notation for the formal limit
lim(t,y)→(tj ,x) with t<tj
f(t, y). (66)
In view of the Markov properties of the model gathered in Proposition 2.9, the followinglemma holds in virtue of the Feynman-Kac formula.12
12See, e.g., Jeanblanc et al. [30].

42
Lemma A.4 (i) Given real numbers φi and ψi, one has E[φi
∑t<tj≤T (1−H i
tj )+ψiHiT |Ft] =
(1 −H it)vi(t,X
it) + ψiH
it , where the pre-default function vi(t, xi) solves the following Kol-
mogorov equation: vi(T, xi) = 0, xi ∈ R, and for j decreasing from p to 1:
• At t = tj,
vi(tj−, xi) = vi(tj, xi) + φi, xi ∈ R, (67)
• On the time interval [tj−1, tj),
(∂t +Ai
t
)vi(t, xi) + λi(t, xi)ψi = 0, xi ∈ R. (68)
(ii) Given real-valued functions φ(k) and ψ(k), one has E[∑
t<tj≤T φ(Htj ) + ψ(HT )|Ft] =
w(t,Xt,Ht) , where the function w(t,x,k) is the solution to the following Kolmogorov pric-
ing PDE system: w(T,x,k) = ψ(k), x = (xY )Y ∈Y , k ∈ 0, 1n, and for j decreasing from
p to 1:
• At t = tj,
w(tj−,x,k) = w(tj ,x,k) + φ(k), x = (xY )Y ∈Y , k ∈ 0, 1n, (69)
• On the time interval [tj−1, tj),
(∂t + At
)w(t,x,k) = 0, x = (xY )Y ∈Y , k ∈ 0, 1n. (70)
Applying this Lemma with
ψi = (1 −Ri), φi = −Sih
in part (i) and
ψ = La,b, φ = −Sh(b− a− La,b
)
in part (ii), establishes the first lines in identities (24) and (25). Regarding the latter, notethat the ex-dividend pricing function u(t,k,x) in (25), is provided by w(t,k,x) − La,b(k)here.
Moreover, in the filtration F = FW,H, a martingale can only jump at totally unpre-dictable stopping times. In particular, the cumulative value processes cannot jump at thefixed times tj . Given the first lines in (24) and (25), the second lines then readily followusing the Ito formula (6).
References
[1] Andersen, L. and Sidenius, J.: Extensions to the Gaussian Copula: Random Re-covery and Random Factor Loadings, Journal of Credit Risk, Vol. 1, No. 1 (Winter2004), p. 29–70.
[2] Assefa, S., Bielecki, T.R., Crepey, S. and Jeanblanc, M.: CVA computationfor counterparty risk assessment in credit portfolios. Credit Risk Frontiers, Bielecki,T.R., Brigo, D. and Patras, F., eds., Wiley/Bloomberg-Press, 2011.
[3] Basel Committee on Banking Supervision: Revisions to the Basel II market riskframework, December 2010.

43
[4] Bielecki, T.R., Crepey, S. and Jeanblanc, M.: Up and Down CreditRisk.Quantitative Finance, p. 1-15, April 2010.
[5] Bielecki, T.R., Cousin, A., Crepey, S., Herbertsson, A.: A Markov CopulaModel of Portfolio Credit Risk with Stochastic Intensities and Random Recoveries.Submitted 2012.
[6] Bielecki, T. R. and Crepey, S.: Dynamic Hedging of Counterparty Exposure.Forthcoming in The Musiela Festschrift, Zariphopoulou, T., Rutkowski, M. and Ka-banov, Y., eds, Springer.
[7] Bielecki, T.R., Crepey, S., Jeanblanc, M. and Zargari, B.: Valuation andHedging of CDS Counterparty Exposure in a Markov Copula Model. Forthcoming inInternational Journal of Theoretical and Applied Finance.
[8] Bielecki, T. R. and Jakubowski, J. and Nieweglowski, M.: Dynamic Modelingof Dependence in Finance via Copulae Between Stochastic Processes, Copula Theory
and Its Applications, Lecture Notes in Statistics, Vol.198, Part 1, 33–76, 2010.
[9] Bielecki, T.R. and Rutkowski, M.: Credit Risk: Modeling, Valuation and Hedg-
ing. Springer-Verlag, Berlin, 2002.
[10] Bielecki, T.R., Cialenco, I. and Iyigunler, I.: Collateralized CVA Valuationwith Rating Triggers and Credit Migrations, submitted, 2012.
[11] Bielecki, T.R., Vidozzi, A. and Vidozzi, L.: A Markov Copulae Approach toPricing and Hedging of Credit Index Derivatives and Ratings Triggered Step–Up Bonds,J. of Credit Risk, 2008.
[12] Brigo, D., Pallavicini, A., Torresetti, R.: Calibration of CDO Tranches withthe dynamical Generalized-Poisson Loss model. Risk Magazine, May 2007
[13] Brigo, D., Pallavicini, A., Torresetti, R. Credit models and the crisis: defaultcluster dynamics and the generalized Poisson loss model, Journal of Credit Risk, 6(4),39–81, 2010.
[14] Brigo, D., Pallavicini, A., Torresetti, R. Cluster-based extension of the gener-alized poisson loss dynamics and consistency with single names. International Journal
of Theoretical and Applied Finance, Vol 10, n. 4, 607-632, 2007.
[15] Cont, R. and Kan, Y.H.: Dynamic Hedging of Portfolio Credit Derivatives, SIAM
Journal on Financial Mathematics, 2, p. 112-140, 2011.
[16] Cont, R., Minca, A.: Recovering Portfolio Default Intensities Implied by CDOQuotes, Working Paper, 2008.
[17] Cousin, A., Crepey, S. and Kan, Y.H.: Delta-hedging Correlation Risk? Review
of Derivatives Research, June 2011.
[18] Crepey, S.: About the pricing equations in finance. Paris-Princeton Lectures in Math-
ematical Finance 2010, Lecture Notes in Mathematics, Springer, p.63-203, 2011.
[19] Crepey, S. and Rahal, A.: Simulation/Regression Pricing Schemes for CVA Com-putations on CDO Tranches. Working Paper, 2012.

44
[20] Cont, R., Deguest, R. and Kan, Y. H.: Recovering Default Intensity from CDOSpreads: Inversion Formula and Model Calibration, SIAM Journal on Financial Math-
ematics, 1, p. 555-585, 2010.
[21] Duffie, D. and Garleanu, N.: Risk and the valuation of collateralized debt obli-gations, Financial Analysts Journal, 57, 41-62, 2001.
[22] Elouerkhaoui, Y.: Pricing and Hedging in a Dynamic Credit Model. International
Journal of Theoretical and Applied Finance, Vol. 10, Issue 4, 703–731, 2007.
[23] Ethier, H.J. and Kurtz, T.G.: Markov Processes. Characterization and Conver-
gence. Wiley, 1986.
[24] Frey, R., Backhaus, J. Dynamic hedging of synthetic CDO tranches with spread-and contagion risk, Journal of Economic Dynamics and Control, 34(4), 710–724, 2010.
[25] Giesecke, K., Goldberg, L.: A Top Down Approach to Multi-Name Credit. Work-
ing Paper, 2007.
[26] Herbertsson, A. (2008). Pricing synthetic CDO tranches in a model with DefaultContagion using the Matrix-Analytic approach, The Journal of Credit Risk 4(4), 3–35.
[27] Herbertsson, A. (2011) Modelling default contagion using Multivariate Phase-Typedistributions, Review of Derivatives Research 14(1), 1–36.
[28] Herbertsson, A. and Rootzen, H. (2008) Pricing kth-to-default swaps underdefault contagion:the matrix-analytic approach, The Journal of Computational Finance
12(1), 49–78.
[29] Jacod, J.: Calcul Stochastique et Problemes de Martingales. Springer, 2nd edition,2003.
[30] Jeanblanc, M., Yor, M. and Chesney, M.: Mathematical methods for Financial
Markets. Springer, 2009.
[31] Laurent, J.-P., Cousin, A. and Fermanian, J-D.: Hedging default risks of CDOsin Markovian contagion models. Quantitative Finance, 1469-7696, April 2010.
[32] Iscoe, I., Jackson, K., Kreinin, A. and Ma, X.: On Exponential Approxima-tion to the Hockey Stick Function. Working Paper, Department of Computer Science,
University of Toronto, 2010.
[33] Iscoe, I., Jackson, K., Kreinin, A. and Ma, X.: Pricing correlation-dependentderivatives based on exponential approximations to the hockey stick function. Forth-coming in Journal of Computational Finance.
[34] Beylkin, G. and Monzon, L. On approximation of functions by exponential sums,Applied and Computational Harmonic Analysis, 19(1): 17-48, 2005.
[35] Lindskog, F. and McNeil, A. J.: Common Poisson shock models: applications toinsurance and credit risk modelling. ASTIN Bulletin, 33(2), 209-238, 2003
[36] Marshall, A. & Olkin, I.: A multivariate exponential distribution, J. Amer.
Statist. Assoc., 2, 84-98, 1967.
45
[37] Patton, A.: Modelling Time-varying exchange rate dependence using the conditionalcopula, Working Paper 2001-09, University of California, San Diego, 2001.
[38] Protter, P.E.: Stochastic Integration and Differential Equations, Second Edition,
Version 2.1. Springer, 2005.
[39] Rogers, L.C.G. and Pitman J.W.: Markov functions, Ann. of Prob., 9, 578-582,1981.
[40] Schweizer, M.: A Guided Tour through Quadratic Hedging Approaches. In Option
Pricing, Interest Rates and Risk Management, E. Jouini, J. Cvitanic and M. Musiela,eds., Cambridge University Press, 538–574, 2001.