Embed Size (px)
Citation preview

Ph.D. Thesis
Dynamic Force Measurement in Preformulation of Solid Dosage Forms
András Kelemen
Szeged 2012
University of Szeged
Faculty of Pharmacy
Department of Pharmaceutical Technology
PhD Thesis
Dynamic Force Measurements in Preformulation of
Solid Dosage Forms
By
András Kelemen
Supervisor:
Prof. Dr. Habil Klára Pintye-Hódi DSc
Szeged
2012
I
Publications related to the thesis:
1. Kelemen, A., Szöllösi, A., Zsótér, A., Pintye-Hódi, K., Török, C., and Erős, I.
(2002): Measurement of the swelling force of some sodium strach glycolate
products with new software. Hung. J. Ind. Chem. Vol. 30 pp. 73-76
IF: 0,084
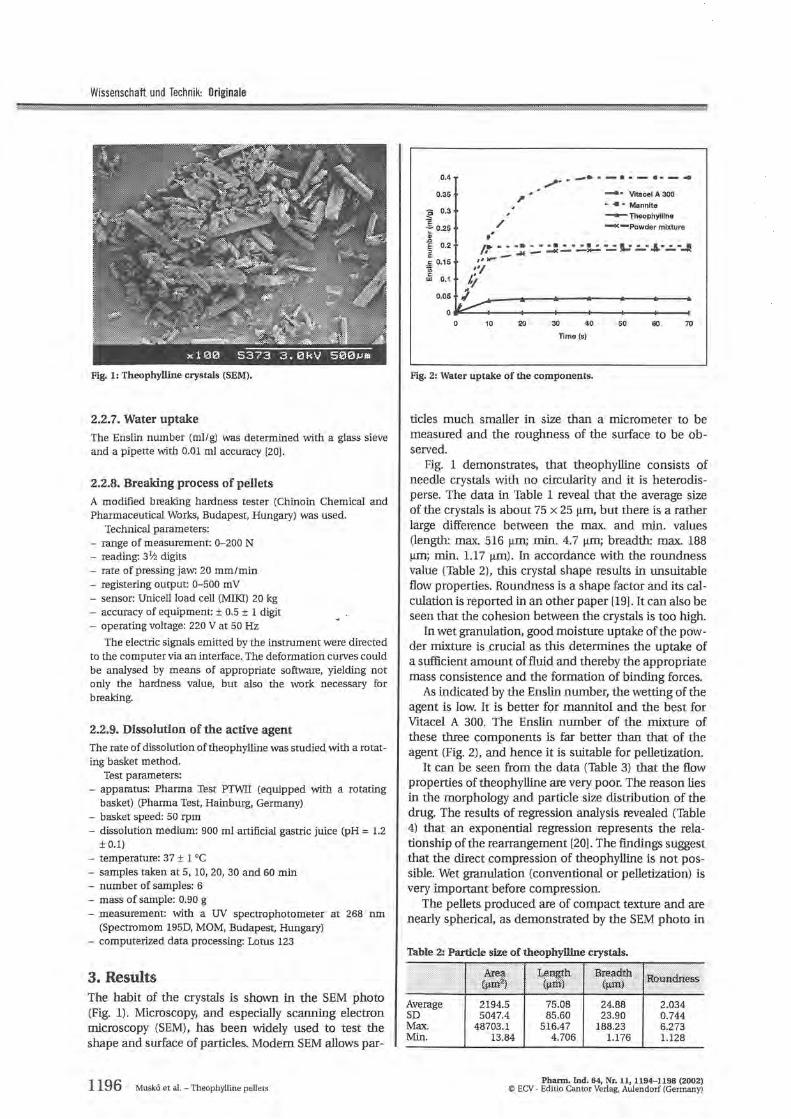
2. Muskó, ZS., Bajdik, J., Pintye-Hódi, K.,Szabó-Révész, P., Kelemen, A. and Erős,
I. (2002).: Preparation of pellets containing theophylline. Pharm. Ind. 64. Nr.11.
1194-1198.
IF:0,279
3. Bajdik, J., Pintye-Hódi, K., Novák, Cs., Kelemen, A.., Regdon Jr, G. and Erős, I.
(2002): Indirect methods for determination of the protective effects of coating
films on the surface of crystals. J. Therm. Anal. Calorim., Vol 68 613-627.
IF:0,598
4. Kása Jr, P., Jójárt, I., Kelemen .A. and Pintye-Hódi, K. (2011): Formulation study
of directly compressible chewable polymers containing ascorbic acid. Pharm.
Dev. Tech. (DOI: 10.3109/10837450.2011.646426)
IF: 1,107
Other publications
5. Kelemen András, Pintye-Hódi Klára, Erős István (2004): Mérés-adatgyűjtő és
jelfeldolgozó szoftverek fejlesztése a szilárd gyógyszerformák preformulációs
vizsgálataiban. Acta Pharm. Hung. 74. 177-186.
6. Szalay, A., Kelemen, A., Kása Jr, P., Erős, I. and Pintye-Hódi, K. (2005): Effect
of the particle size and shape parameters on the flow properties of sorbit. Eur. J.
Pharm . Sci. 25; Suppl. 1. , S192 - S194.
7. Bajdik, J., Bölcskei, É., Kelemen, A. and Pintye-Hódi, K. (2007): Rapid method
to study the sedimentation of a pigment suspension prepared for coating fluids. J.
Pharm. Biomed. Anal. 44. 1159-1162.
IF:2,76

II
8. Bajdik, J., Baki, G., Kelemen,A. and Pintye-Hódi, K.: (2007): Formulation of
longacting solid intravaginal matrix systems containing laxtic acid. Eur. J. Pharm.
Sci. 32, Issue 1, Suppl. 1, 35.
9. Bajdik, J., Baki, G., Kelemen,A. and Pintye-Hódi, K.:(2008): The effect of
wetting of powder mixture on the preparation of hydrophillic matrix granules with
high-shear granulator. Chem. Eng. Res. Des. 86 1-7.
IF:0,989
10. Baki, G., Bajdik, J. Kelemen, A. and Pintye-Hódi, K. (2009): Formulation of a
solid intravaginal matrix system to prolong the pH-decreasing effect of lactic acid.
J. Drug. Del. Sci. Tech. 19 (2) 133-137.
IF:0,508
Presentations
1. J. Bajdik, É. Bölcskei, A. Kelemen, P. Szabó-Révész, K. Pintye-Hódi:
Technological opportunities to improve the stability of a pigment suspension
prepared for coating fluids. 5th World Meeting on Pharmaceutics
Biopharmaceutics and Pharmaceutical Technology, Geneva, 27-30 March, 2006
PO 53 (March 30)
2. J. Bajdik, G. Baki, A. Kelemen, K. Pintye-Hódi: Formulation of longacting solid
intravaginal matrix systems containing lactic acid. 2nd BBBB Conference on
Pharmaceutical Sciences, Tallin-Tartu, Estonia, 2007
1
Contents
1. INTRODUCTION .......................................................................................................... 2
2. AIMS............................................................................................................................... 3
3. LITERATURE REVIEW OF BASIC CONCEPTS ..................................................... 4
3.1. Computer–based data acquisition system ........................................................... 4
3.2. Characterization of tablet compaction data ........................................................ 5 3.2.1. Force–time compression profiles...................................................................... 5 3.2.2. Force–displacement compression profiles ....................................................... 6
3.3. Characterization of tablet swelling....................................................................... 8
3.4. Deformation behaviour of solid dosage forms..................................................... 9
4. HARDWARE AND SOFTWARE ............................................................................... 10
4.1. Tablet machine..................................................................................................... 10 4.1.1. Hardware and embedded software ................................................................. 10 4.1.2. PC side software ............................................................................................. 14
4.2. Swelling force tester............................................................................................. 18 4.2.1. Hardware and embedded software ................................................................. 18 4.2.2. PC side software ............................................................................................. 20
4.3. Hardness tester..................................................................................................... 21 4.3.1. Hardware and embedded software ................................................................. 21 4.3.2 PC side software .............................................................................................. 24
5. RESULTS AND DISCUSSION .................................................................................. 28
5.1. Study of the deformability process during loading........................................... 28 5.1.1. Deformability of medicated chewable polymers............................................. 28 5.1.2. Deformability of coated crystals ..................................................................... 33
5.2. Study of swelling force profiles........................................................................... 36 5.2.1. Swelling forces of some superdisintegrants .................................................... 36 5.2.2. Swelling forces of swellable matrices ............................................................. 40
5.3. Measurement of breaking process of smaller particles .................................... 41
6. SUMMARY .................................................................................................................. 43
7. PRACTICAL USEFULNESS...................................................................................... 45
8. REFERENCES ............................................................................................................ 46
2
1. INTRODUCTION
Solid dosage forms, currently the most common dosage forms in pharmacy,
contain not only the active pharmaceutical ingredient (API), but also various ingredients
such as fillers, sweeteners, etc. During the manufacturing of tablets, application of the
appropriate pressure is very important, as it influences the quality of the comprimates.
Knowledge of the elasticity of polymer films used in the coating process and the
deformability of granules and pellets is very important during tablet manufacturing. In
the case of conventional tablets, the swelling behaviour influences the rate of
disintegration, which determines the rate of dissolution of the API from the tablet.
Knowledge of the swelling behaviour of swellable matrices is also important, for this
plays a role in prediction of the dissolution profile.
Determination of the above mentioned physical parameters of solid dosage forms
is based on the measurement of dynamic forces. In consequence of the nature of the task,
computer–aided measurement and evaluation technology is required.
This dissertation focuses on force measurements involving the use of a digital
computer. Such work demands the collaboration of a team consisting of a pharmacist, an
electrical engineer, who prepares the equipment, and a software engineer, who connects
the equipment to the computer and produces the appropriate software.
3
2. AIMS
The overall aim of the work reported in this dissertation was the development of
measurement and analysis systems with which to study the effects of forces during drug
powder compaction, and also the deformation process and swelling behaviour of solid
dosage forms, through use of a digital computer. The specific aims were:
to develop a software system relating to the use of an instrumented tablet
machine to measure punch forces and displacement during compression;
to develop algorithms with which to evaluate compaction data profiles;
to develop a software system to be used in conjuction with a swelling
force tester in order to study the swelling behaviour of comprimates and
tablets;
to develop a software system with which to study the deformation
behaviour of solid dosage forms during loading.
4
3. LITERATURE REVIEW OF BASIC CONCEPTS
3.1. Computer–based data acquisition system
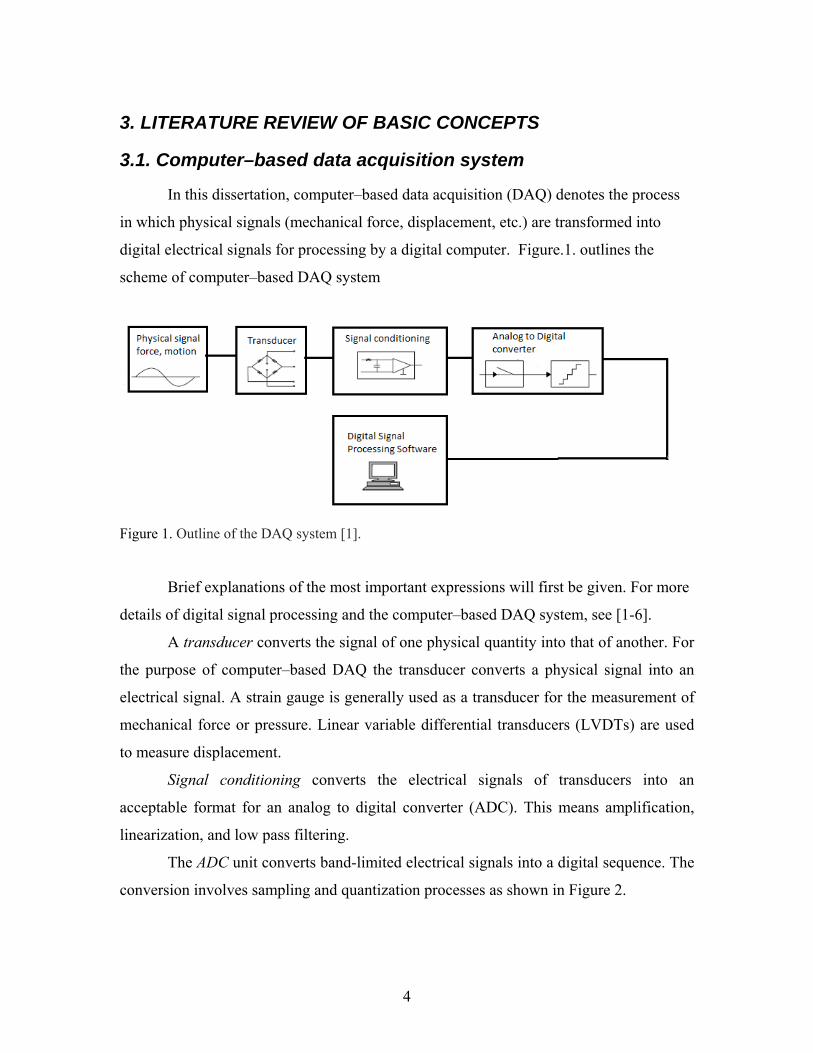
In this dissertation, computer–based data acquisition (DAQ) denotes the process
in which physical signals (mechanical force, displacement, etc.) are transformed into
digital electrical signals for processing by a digital computer. Figure.1. outlines the
scheme of computer–based DAQ system
Figure 1. Outline of the DAQ system [1].
Brief explanations of the most important expressions will first be given. For more
details of digital signal processing and the computer–based DAQ system, see [1-6].
A transducer converts the signal of one physical quantity into that of another. For
the purpose of computer–based DAQ the transducer converts a physical signal into an
electrical signal. A strain gauge is generally used as a transducer for the measurement of
mechanical force or pressure. Linear variable differential transducers (LVDTs) are used
to measure displacement.
Signal conditioning converts the electrical signals of transducers into an
acceptable format for an analog to digital converter (ADC). This means amplification,
linearization, and low pass filtering.
The ADC unit converts band-limited electrical signals into a digital sequence. The
conversion involves sampling and quantization processes as shown in Figure 2.

5
Figure 2. Block diagram for AD converter [2].
The sampling process produces a sequence of values from a continuously varying analog
signal. The quantization process assigns a number to each sample from a sequence of
values. The original analog signal is perfectly recoverable from the digital sequence if the
Shannon sampling theory is satisfied [1, 2].
A digital signal processing unit stores and displays the digital sequence and
applies signal-processing algorithms, which calculate the desired parameters from the
digital sequence through different methods.
3.2. Characterization of tablet compaction data
Instrumented eccentric tablet machine is a suitable means of studying to the
compression behaviour of various pharmaceutical powders. The main goal of such
studies is to determine the plasticity of comprimates and the work or energy necessary for
tableting. As concerns the instrumentation means the upper and lower punches are
equipped with strain gauges and LVDTs. For details and a brief history of the
instrumentation of tablet machines see [7, 8]
3.2.1. Force–time compression profiles
Many parameters can be calculated from force–time profiles: the time when the
punch impacts into the die, the maximum compression force, the residual force, the ejection
force, the ejection time, the time for compression or decompression, the time to reach the
maximum force, etc. For details, see Figure 11.
6
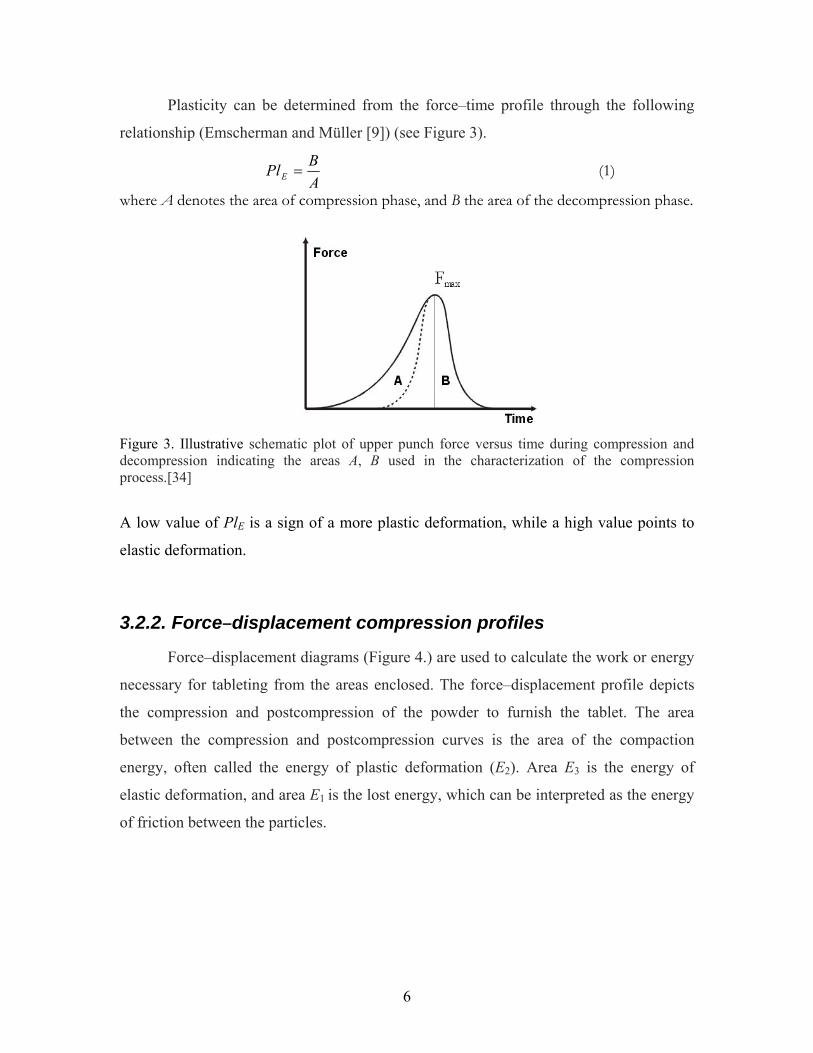
Plasticity can be determined from the force–time profile through the following
relationship (Emscherman and Müller [9]) (see Figure 3).
A
BPlE (1)
where A denotes the area of compression phase, and B the area of the decompression phase.
Figure 3. Illustrative schematic plot of upper punch force versus time during compression and decompression indicating the areas A, B used in the characterization of the compression process.[34]
A low value of PlE is a sign of a more plastic deformation, while a high value points to
elastic deformation.
3.2.2. Force–displacement compression profiles
Force–displacement diagrams (Figure 4.) are used to calculate the work or energy
necessary for tableting from the areas enclosed. The force–displacement profile depicts
the compression and postcompression of the powder to furnish the tablet. The area
between the compression and postcompression curves is the area of the compaction
energy, often called the energy of plastic deformation (E2). Area E3 is the energy of
elastic deformation, and area E1 is the lost energy, which can be interpreted as the energy
of friction between the particles.

7
Figure 4. Illustrative plot of upper punch force versus upper punch displacement during compression and decompression indicating the different areas (E1-E3) used in the characterization of the compression process [10].
The sum of all three energies is the total energy of tableting. From these values the
plasticity PlSM (Stamm-Mathis [11]) is calculated as
%10032
2
EE
EPlSM
(2)
The die wall friction influences the compaction of the powder. Since the frictional
coefficient between the powder and the die wall is often not known, Järvinen and Juslin
[12] developed Eq. 3 for determination of the work of friction.
C
A
lpuplpupupf dsFFFFFW )}/ln(/)({ (3)
where Fup is the upper punch force, and Flp is the lower punch force.
8
3.3. Characterization of tablet swelling
When conventional tablets are applied, the rapid disintegration is very important.
Various forces play roles in this process, the main one being the swelling force Fs formed
in the tablet during the uptake of water [13-17].
Conventional tablets always contain disintegrants which promote rapid disintegration of
the tablets. The swelling kinetics of these disintegrants can most commonly be described
with the RRSBW (Rosin-Rammler-Sperling-Bennett-Weibull) distribution (Eq. 4.) [18,
19].
)1()()(
a
Tt
eFtF
(4)
where F(t) is the swelling force as a function of time t, F is the maximum value of the
swelling force, T is the lag time, a is a scale parameter that describes the time
dependence, and β describes the shape of the curve.
For β = 1, the shape of the curve corresponds exactly to the shape of an exponential
profile with constant k = 1/a. This implies first-order kinetics in the swelling process:
)1()( )( TtkeFtF (5)
For β = 0, the equation is
)1()(1
aeFtF
(6)
For β < 1, this fast swelling is observed at the beginning of the process, followed by a
slower process.
For aTt , the equation is
632.011)( 1
eeF
tF a
a
(7)
where a = t63.2% is a characteristic swelling time.
Another type of tablets, swelling matrix tablets, often exhibit swelling kinetics profiles
that can not be described with the RRSBW distribution.
9
3.4. Deformation behaviour of solid dosage forms
The hardness of a tablet is determined by the force required to break it in a diametrical
compression test. The tensile strength x of a tablet is defined by the Newton-Fell
equation [20]:
tD
Fx
2 (8)
where D is the diameter, F is the force and t is the thickness of the tablet.
10
4. HARDWARE AND SOFTWARE
4.1. Tablet machine
4.1.1. Hardware and embedded software
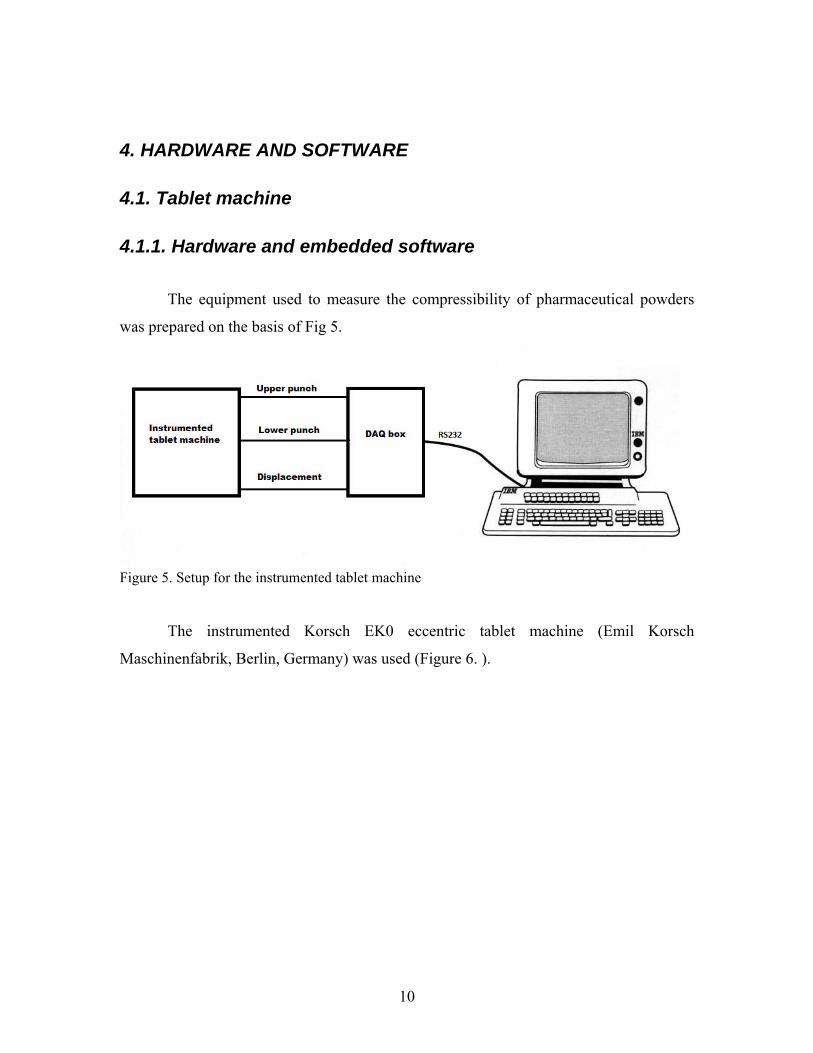
The equipment used to measure the compressibility of pharmaceutical powders
was prepared on the basis of Fig 5.
Figure 5. Setup for the instrumented tablet machine
The instrumented Korsch EK0 eccentric tablet machine (Emil Korsch
Maschinenfabrik, Berlin, Germany) was used (Figure 6. ).
11
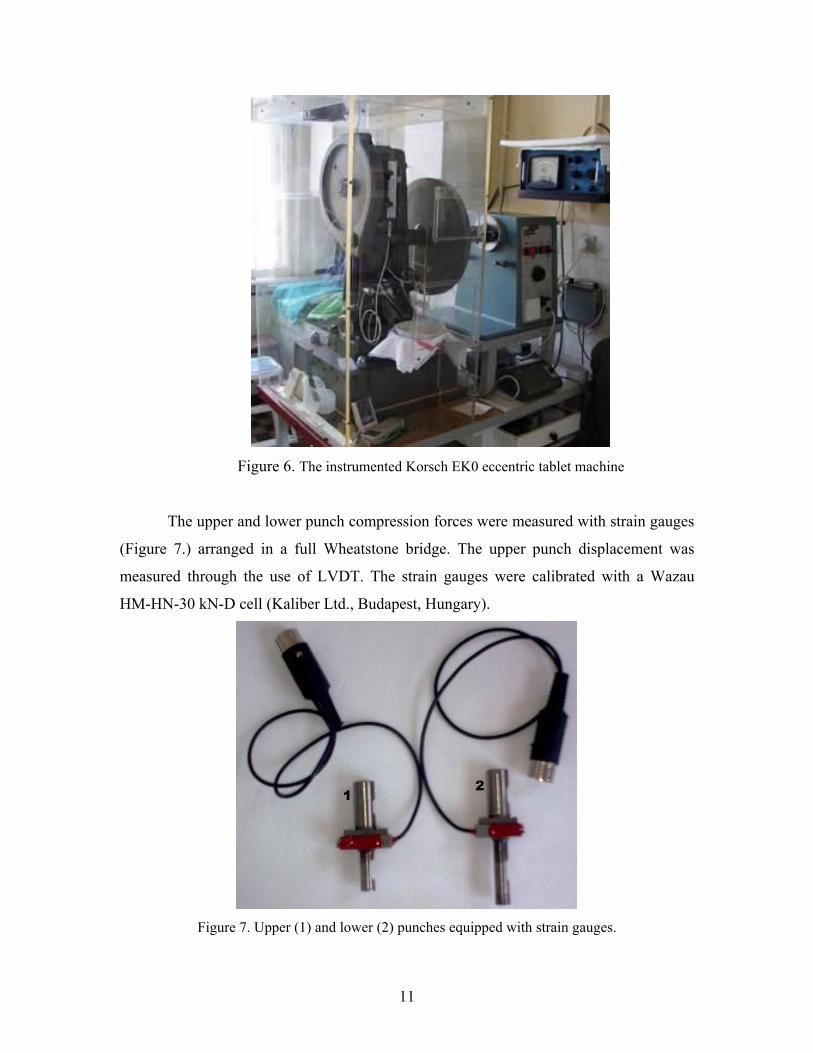
Figure 6. The instrumented Korsch EK0 eccentric tablet machine
The upper and lower punch compression forces were measured with strain gauges
(Figure 7.) arranged in a full Wheatstone bridge. The upper punch displacement was
measured through the use of LVDT. The strain gauges were calibrated with a Wazau
HM-HN-30 kN-D cell (Kaliber Ltd., Budapest, Hungary).
Figure 7. Upper (1) and lower (2) punches equipped with strain gauges.
12
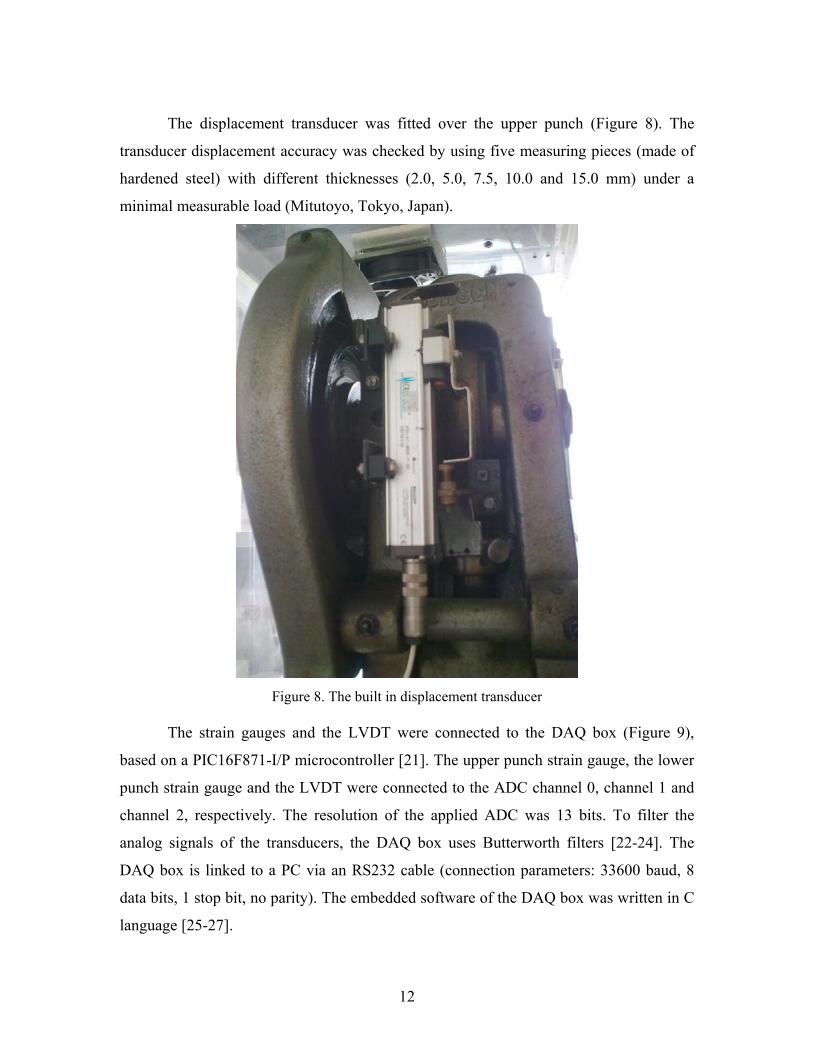
The displacement transducer was fitted over the upper punch (Figure 8). The
transducer displacement accuracy was checked by using five measuring pieces (made of
hardened steel) with different thicknesses (2.0, 5.0, 7.5, 10.0 and 15.0 mm) under a
minimal measurable load (Mitutoyo, Tokyo, Japan).
Figure 8. The built in displacement transducer
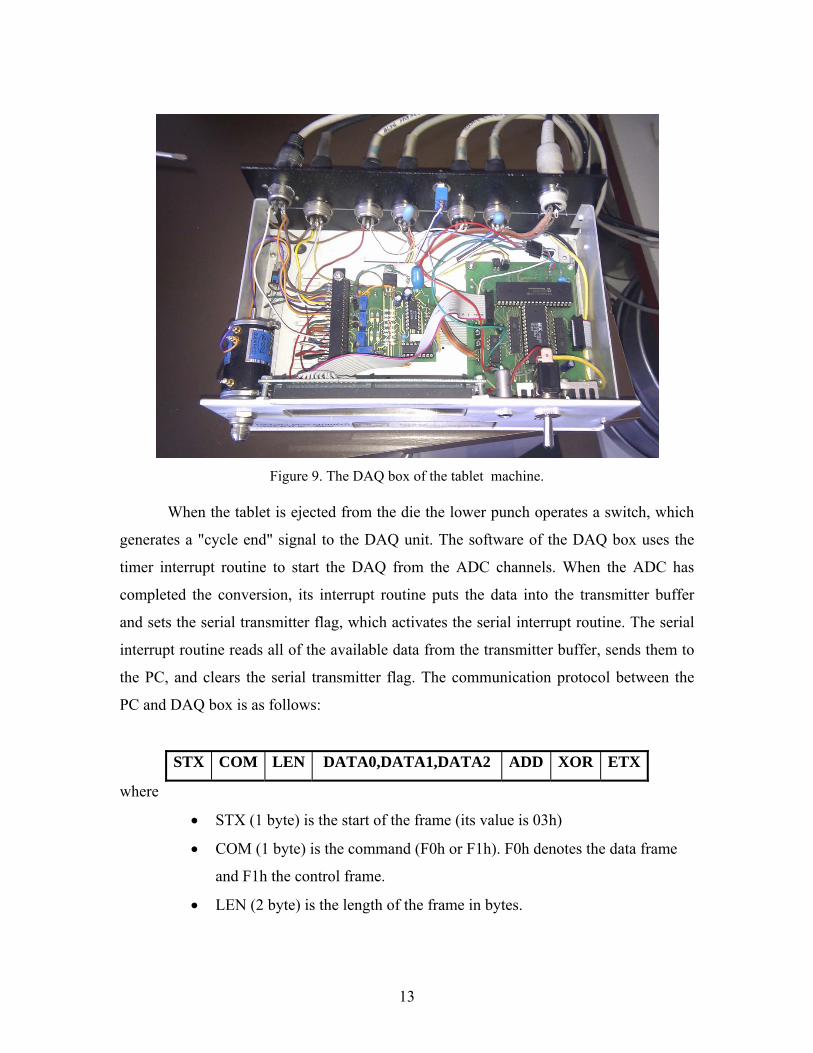
The strain gauges and the LVDT were connected to the DAQ box (Figure 9),
based on a PIC16F871-I/P microcontroller [21]. The upper punch strain gauge, the lower
punch strain gauge and the LVDT were connected to the ADC channel 0, channel 1 and
channel 2, respectively. The resolution of the applied ADC was 13 bits. To filter the
analog signals of the transducers, the DAQ box uses Butterworth filters [22-24]. The
DAQ box is linked to a PC via an RS232 cable (connection parameters: 33600 baud, 8
data bits, 1 stop bit, no parity). The embedded software of the DAQ box was written in C
language [25-27].
13
Figure 9. The DAQ box of the tablet machine.
When the tablet is ejected from the die the lower punch operates a switch, which
generates a "cycle end" signal to the DAQ unit. The software of the DAQ box uses the
timer interrupt routine to start the DAQ from the ADC channels. When the ADC has
completed the conversion, its interrupt routine puts the data into the transmitter buffer
and sets the serial transmitter flag, which activates the serial interrupt routine. The serial
interrupt routine reads all of the available data from the transmitter buffer, sends them to
the PC, and clears the serial transmitter flag. The communication protocol between the
PC and DAQ box is as follows:
STX COM LEN DATA0,DATA1,DATA2 ADD XOR ETX
where
STX (1 byte) is the start of the frame (its value is 03h)
COM (1 byte) is the command (F0h or F1h). F0h denotes the data frame
and F1h the control frame.
LEN (2 byte) is the length of the frame in bytes.

14
DATA0, DATA1 and DATA2 are the values of the upper punch, lower
punch and displacement, respectively.
ADD (2 bytes) is the control summa.
XOR (2byte) is the control xor (exclusive or) value.
ETX (1 byte) is the end of the frame (its value is 02h)
The structure of the control frame is as follows:
STX COM ADD XOR ETX
When the DAQ box detects "cycle end" signal during the measurement process, it
sends control frame to PC; otherwise, it sends data frames.
4.1.2. PC side software
The PC side software was written in C++ [28]. During the DAQ, the PC side
software displays and saves data. Its DAQ algorithm reads the frames from the serial
port. If the frame is the control frame, the routine saves the data to disk, initializes the
buffers and drawing controls; otherwise, it displays and adds the data to the storing
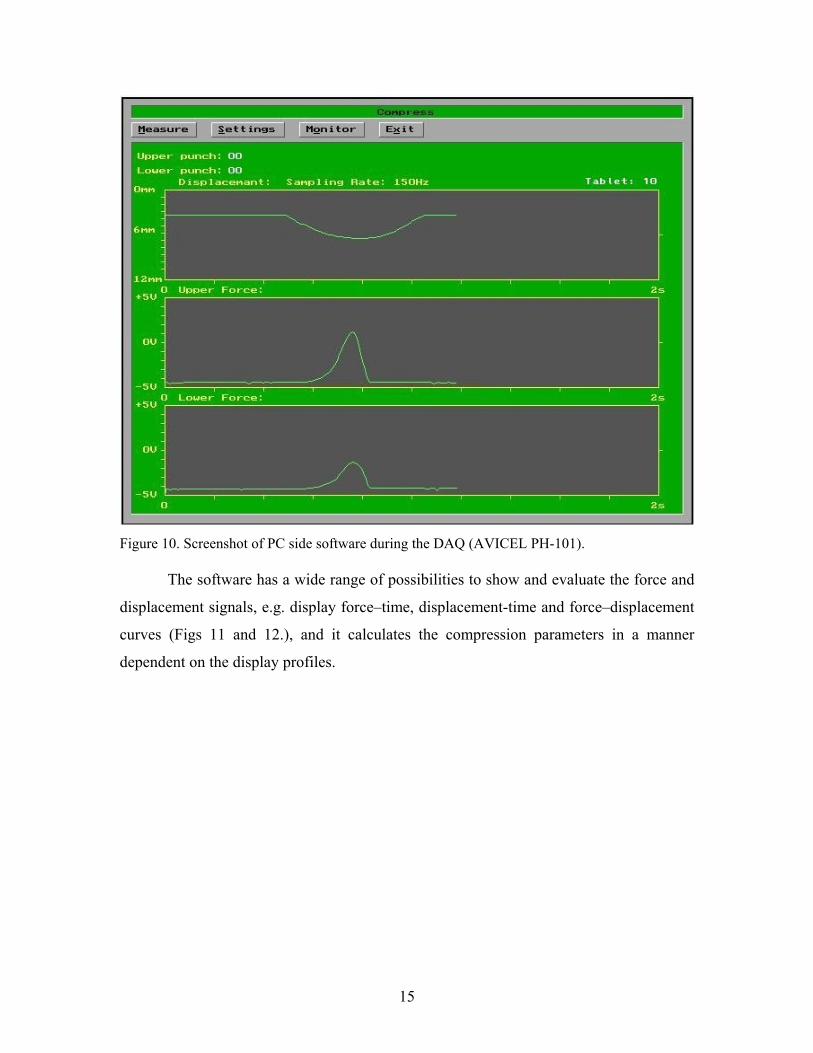
buffer. Figure 10 displays upper punch displacement, upper punch force and lower punch
force curves during the DAQ.
15
Figure 10. Screenshot of PC side software during the DAQ (AVICEL PH-101).
The software has a wide range of possibilities to show and evaluate the force and
displacement signals, e.g. display force–time, displacement-time and force–displacement
curves (Figs 11 and 12.), and it calculates the compression parameters in a manner
dependent on the display profiles.
16
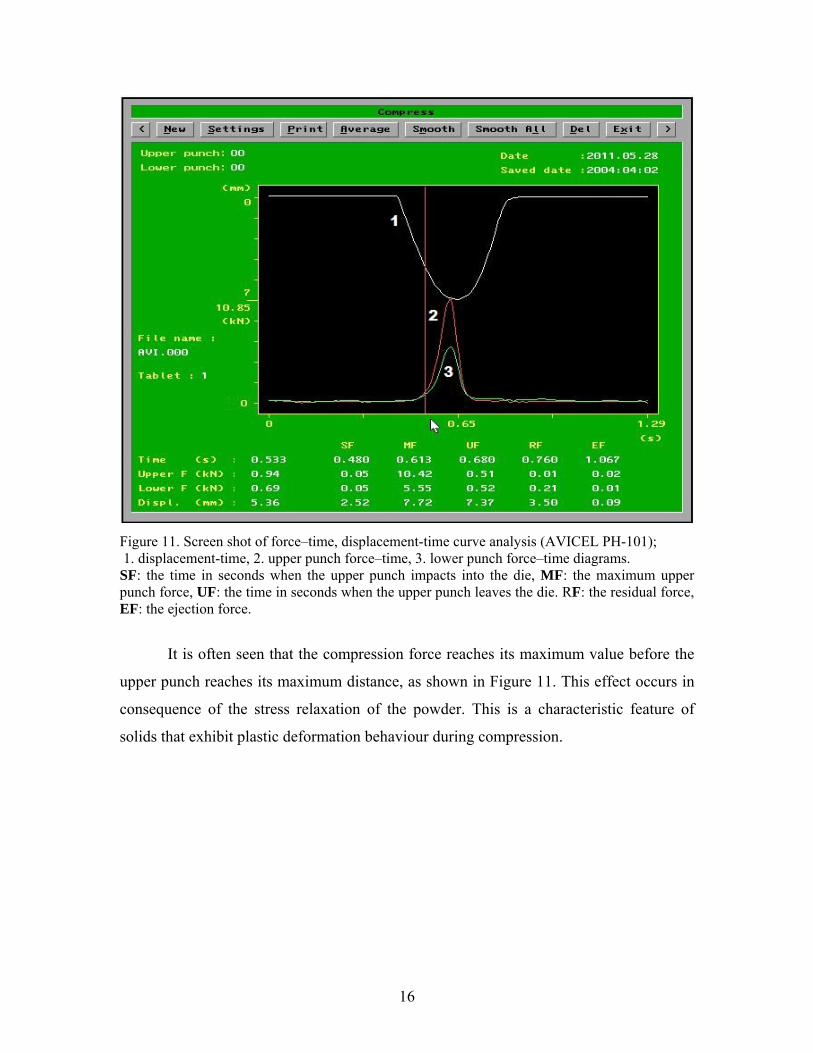
Figure 11. Screen shot of force–time, displacement-time curve analysis (AVICEL PH-101); 1. displacement-time, 2. upper punch force–time, 3. lower punch force–time diagrams. SF: the time in seconds when the upper punch impacts into the die, MF: the maximum upper punch force, UF: the time in seconds when the upper punch leaves the die. RF: the residual force, EF: the ejection force.
It is often seen that the compression force reaches its maximum value before the
upper punch reaches its maximum distance, as shown in Figure 11. This effect occurs in
consequence of the stress relaxation of the powder. This is a characteristic feature of
solids that exhibit plastic deformation behaviour during compression.
17
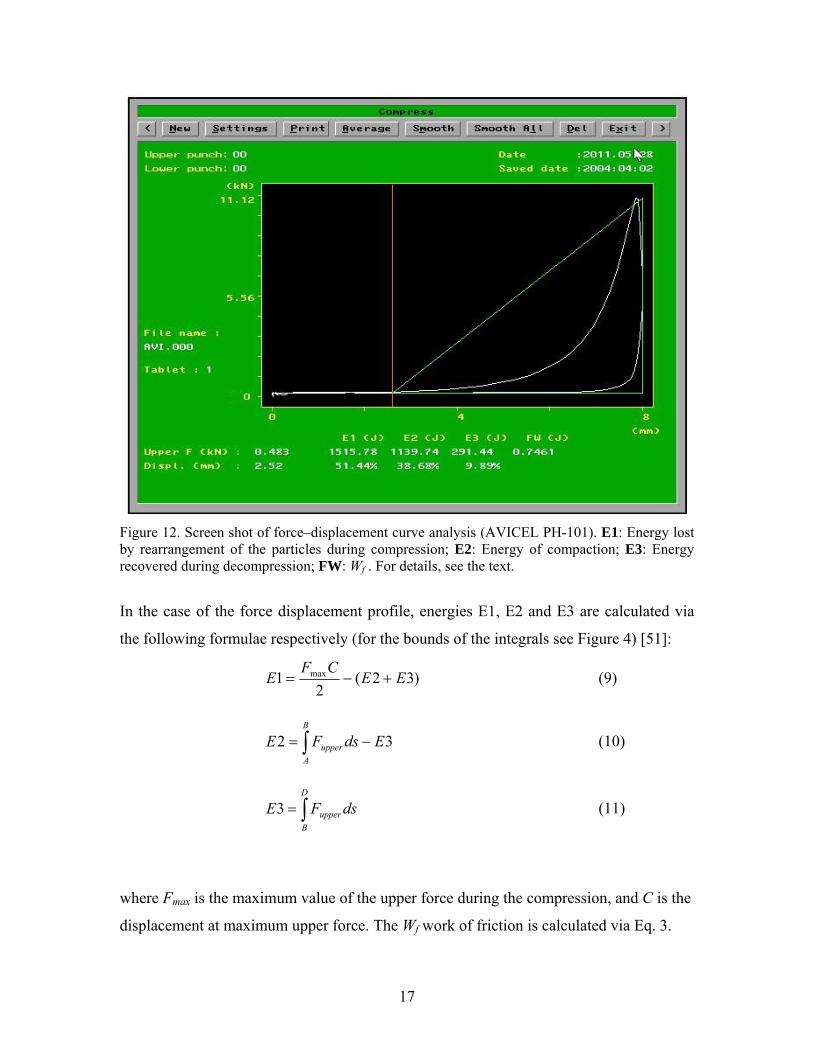
Figure 12. Screen shot of force–displacement curve analysis (AVICEL PH-101). E1: Energy lost by rearrangement of the particles during compression; E2: Energy of compaction; E3: Energy recovered during decompression; FW: Wf . For details, see the text.
In the case of the force displacement profile, energies E1, E2 and E3 are calculated via
the following formulae respectively (for the bounds of the integrals see Figure 4) [51]:
)32(2
1 max EECF
E (9)
B
A
upper EdsFE 32 (10)
D
B
upper dsFE3 (11)
where Fmax is the maximum value of the upper force during the compression, and C is the
displacement at maximum upper force. The Wf work of friction is calculated via Eq. 3.
18
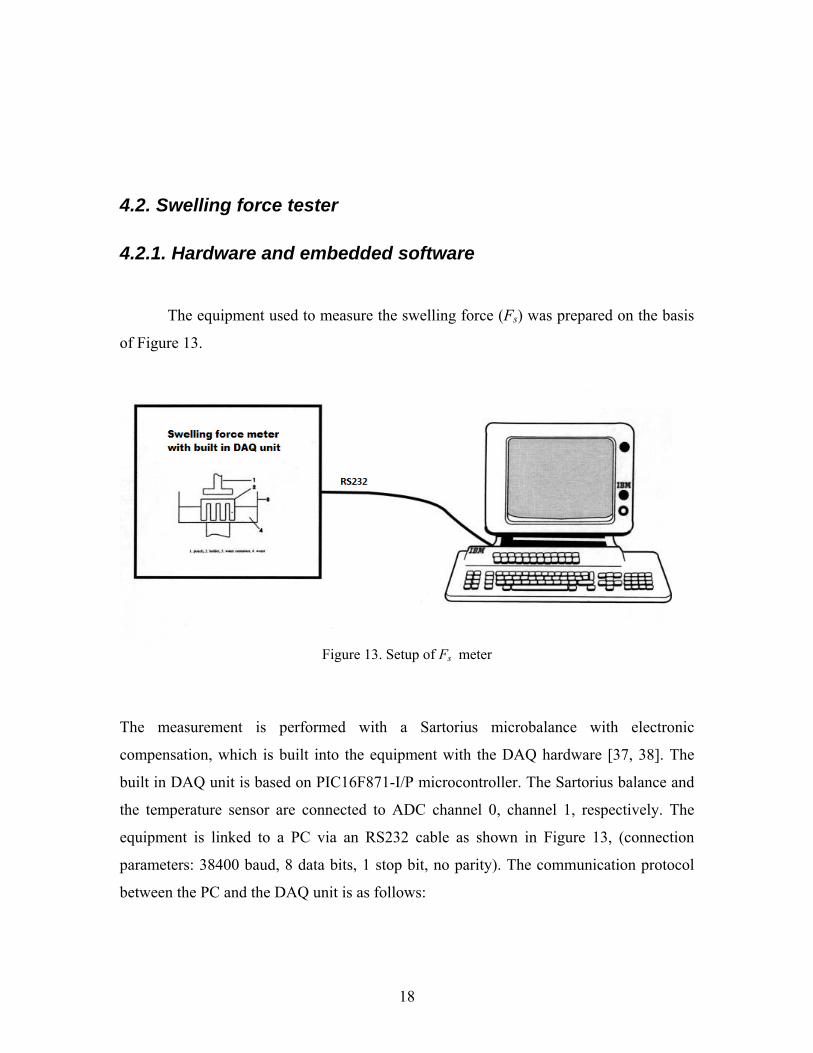
4.2. Swelling force tester
4.2.1. Hardware and embedded software
The equipment used to measure the swelling force (Fs) was prepared on the basis
of Figure 13.
Figure 13. Setup of Fs meter
The measurement is performed with a Sartorius microbalance with electronic
compensation, which is built into the equipment with the DAQ hardware [37, 38]. The
built in DAQ unit is based on PIC16F871-I/P microcontroller. The Sartorius balance and
the temperature sensor are connected to ADC channel 0, channel 1, respectively. The
equipment is linked to a PC via an RS232 cable as shown in Figure 13, (connection
parameters: 38400 baud, 8 data bits, 1 stop bit, no parity). The communication protocol
between the PC and the DAQ unit is as follows:
19
STX DATA0,DATA1,DATA2 ETX
where
STX (1 byte) is the start of the frame (its value is 55h).
DATA0 is the baseline value.
DATA1 is the value of Fs.
DATA2 is the temperature.
ETX (1 byte) is the end of the frame (its value is 41h).
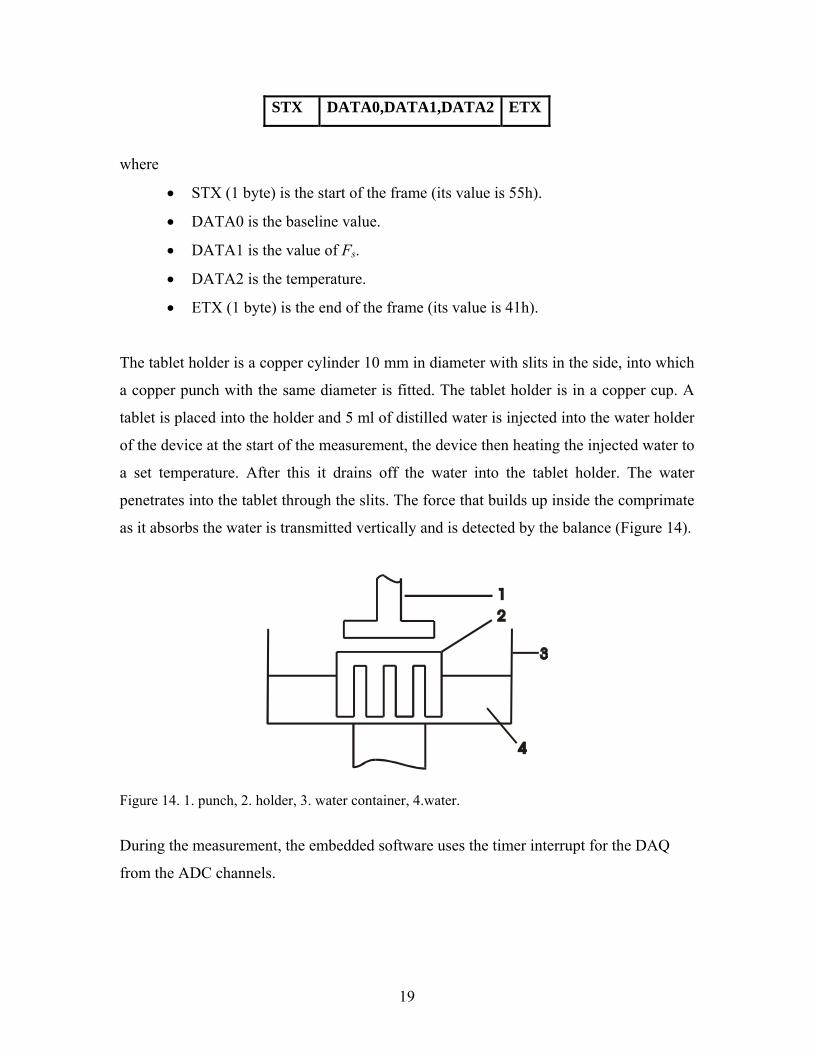
The tablet holder is a copper cylinder 10 mm in diameter with slits in the side, into which
a copper punch with the same diameter is fitted. The tablet holder is in a copper cup. A
tablet is placed into the holder and 5 ml of distilled water is injected into the water holder
of the device at the start of the measurement, the device then heating the injected water to
a set temperature. After this it drains off the water into the tablet holder. The water
penetrates into the tablet through the slits. The force that builds up inside the comprimate
as it absorbs the water is transmitted vertically and is detected by the balance (Figure 14).
Figure 14. 1. punch, 2. holder, 3. water container, 4.water.
During the measurement, the embedded software uses the timer interrupt for the DAQ
from the ADC channels.
20
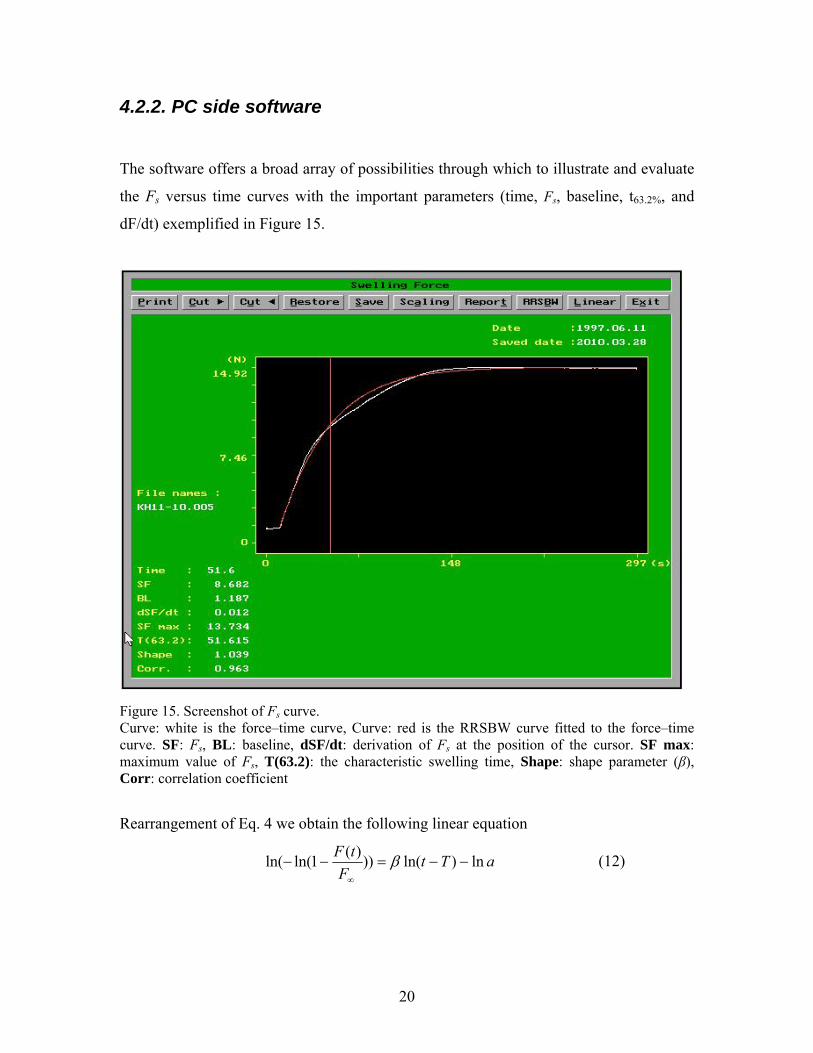
4.2.2. PC side software
The software offers a broad array of possibilities through which to illustrate and evaluate
the Fs versus time curves with the important parameters (time, Fs, baseline, t63.2%, and
dF/dt) exemplified in Figure 15.
Figure 15. Screenshot of Fs curve. Curve: white is the force–time curve, Curve: red is the RRSBW curve fitted to the force–time curve. SF: Fs, BL: baseline, dSF/dt: derivation of Fs at the position of the cursor. SF max: maximum value of Fs, T(63.2): the characteristic swelling time, Shape: shape parameter (β), Corr: correlation coefficient
Rearrangement of Eq. 4 we obtain the following linear equation
aTtF
tFln)ln())
)(1ln(ln(
(12)
21
where the shape parameter β is obtained from the slope of the line and the scale
parameter a estimated from the ordinate value. The characteristic swelling time (t63.2%)
and shape parameter are calculated from Eq. 12. by linear fitting.
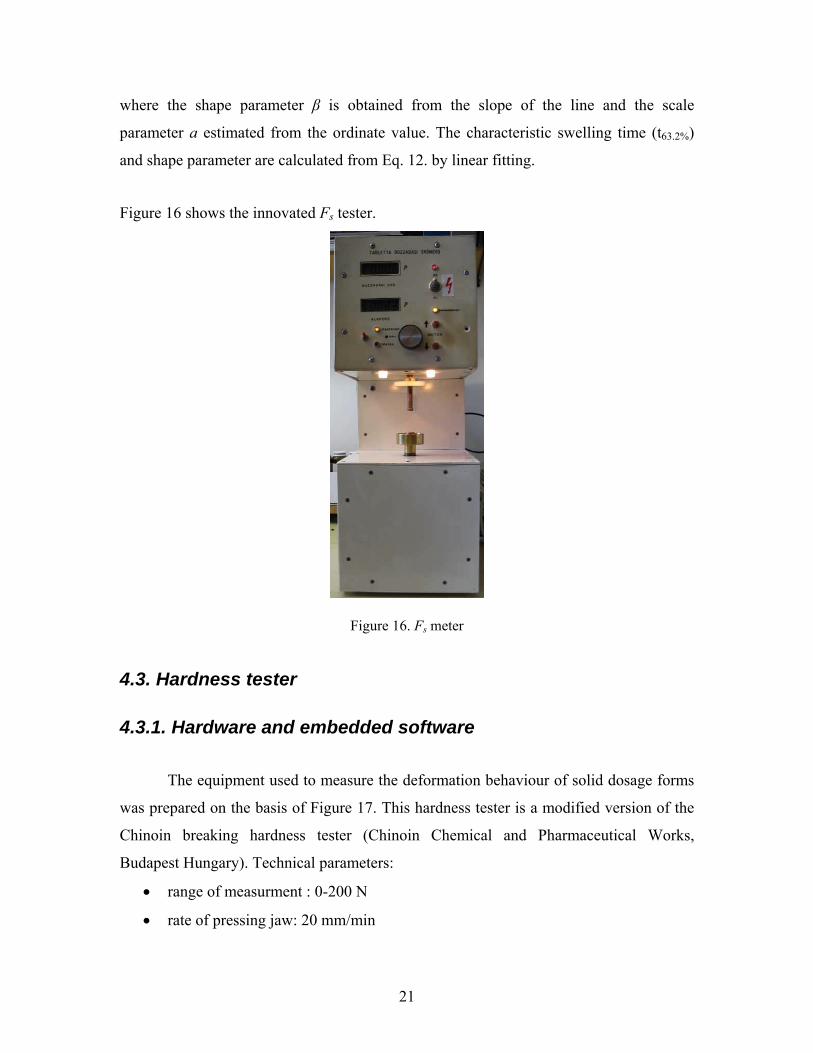
Figure 16 shows the innovated Fs tester.
Figure 16. Fs meter
4.3. Hardness tester
4.3.1. Hardware and embedded software
The equipment used to measure the deformation behaviour of solid dosage forms
was prepared on the basis of Figure 17. This hardness tester is a modified version of the
Chinoin breaking hardness tester (Chinoin Chemical and Pharmaceutical Works,
Budapest Hungary). Technical parameters:
range of measurment : 0-200 N
rate of pressing jaw: 20 mm/min
22
registering output: 0-500 mV
force sensor: Unicell load cell (MIKI) 20 kg
With change of the pressure jowl and the sampling holder, the equipment is appropriate
for measurements of the hardness of pellets and the tensile strength of films. With this
equipment, the start of the DAQ is controlled manually, because the pressure jowl must
be positioned exactly to the surface of the material. The end of DAQ is also controlled
manually too, because the breaking point of the more elastic materials (e.g. films), can
not be detected exactly.
2.55N
2.55N
1.
2.
5.
6.
2.55
2.55
N
N
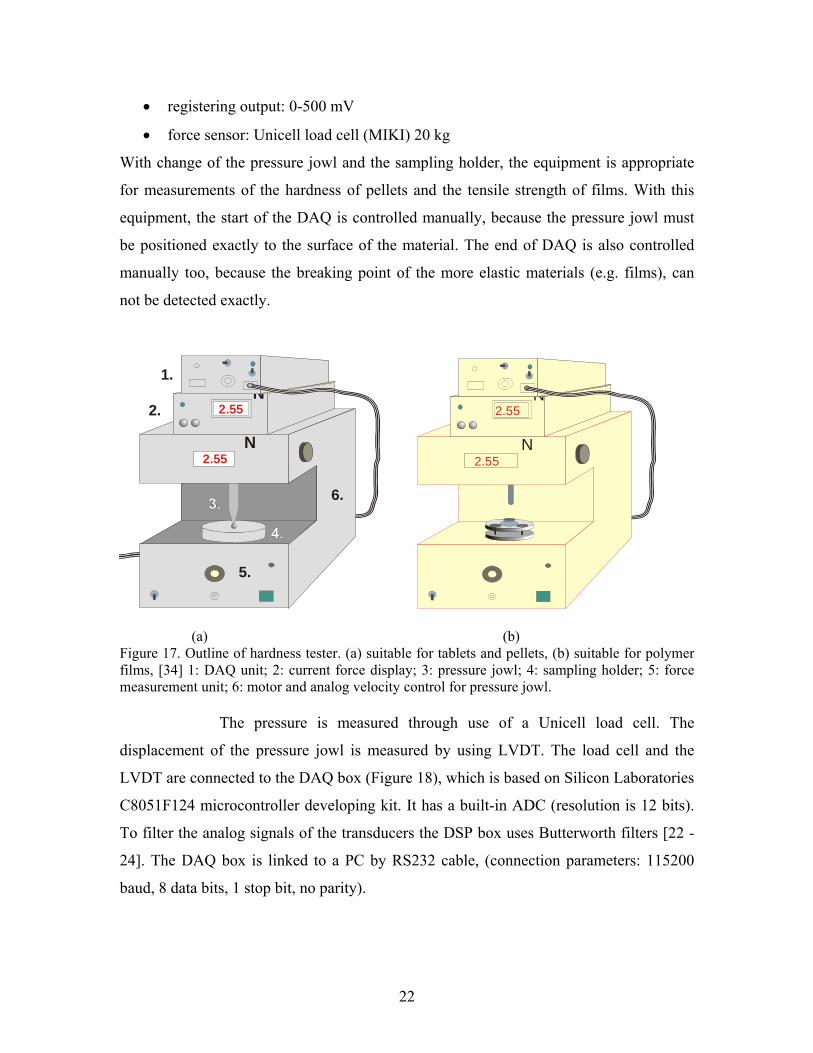
(a) (b) Figure 17. Outline of hardness tester. (a) suitable for tablets and pellets, (b) suitable for polymer films, [34] 1: DAQ unit; 2: current force display; 3: pressure jowl; 4: sampling holder; 5: force measurement unit; 6: motor and analog velocity control for pressure jowl.
The pressure is measured through use of a Unicell load cell. The
displacement of the pressure jowl is measured by using LVDT. The load cell and the
LVDT are connected to the DAQ box (Figure 18), which is based on Silicon Laboratories
C8051F124 microcontroller developing kit. It has a built-in ADC (resolution is 12 bits).
To filter the analog signals of the transducers the DSP box uses Butterworth filters [22 -
24]. The DAQ box is linked to a PC by RS232 cable, (connection parameters: 115200
baud, 8 data bits, 1 stop bit, no parity).
23
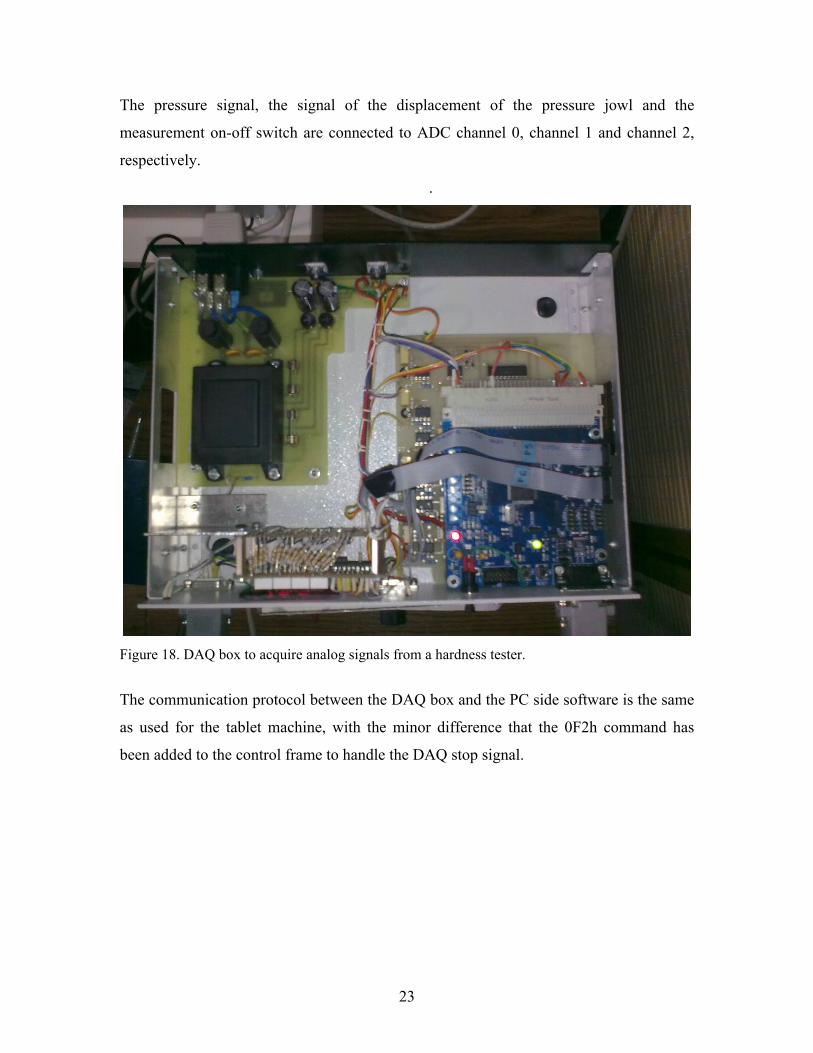
The pressure signal, the signal of the displacement of the pressure jowl and the
measurement on-off switch are connected to ADC channel 0, channel 1 and channel 2,
respectively.
.
Figure 18. DAQ box to acquire analog signals from a hardness tester.
The communication protocol between the DAQ box and the PC side software is the same
as used for the tablet machine, with the minor difference that the 0F2h command has
been added to the control frame to handle the DAQ stop signal.
24
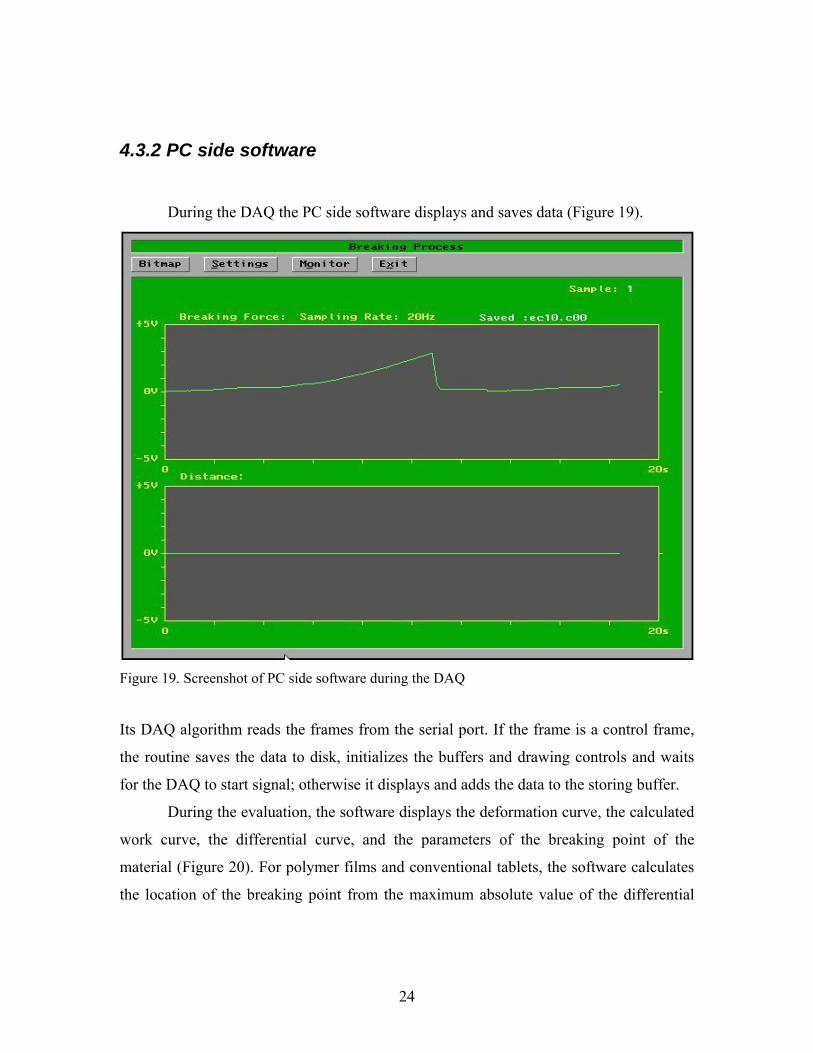
4.3.2 PC side software
During the DAQ the PC side software displays and saves data (Figure 19).
Figure 19. Screenshot of PC side software during the DAQ
Its DAQ algorithm reads the frames from the serial port. If the frame is a control frame,
the routine saves the data to disk, initializes the buffers and drawing controls and waits
for the DAQ to start signal; otherwise it displays and adds the data to the storing buffer.
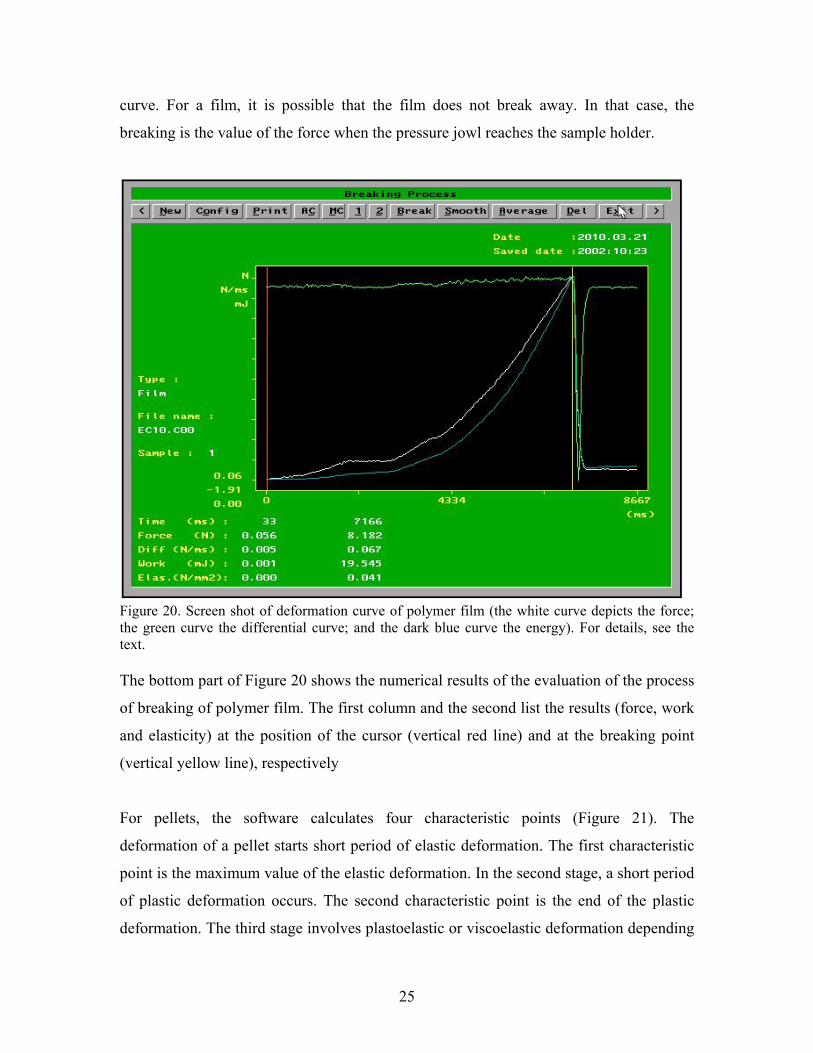
During the evaluation, the software displays the deformation curve, the calculated
work curve, the differential curve, and the parameters of the breaking point of the
material (Figure 20). For polymer films and conventional tablets, the software calculates
the location of the breaking point from the maximum absolute value of the differential
25
curve. For a film, it is possible that the film does not break away. In that case, the
breaking is the value of the force when the pressure jowl reaches the sample holder.
Figure 20. Screen shot of deformation curve of polymer film (the white curve depicts the force; the green curve the differential curve; and the dark blue curve the energy). For details, see the text. The bottom part of Figure 20 shows the numerical results of the evaluation of the process
of breaking of polymer film. The first column and the second list the results (force, work
and elasticity) at the position of the cursor (vertical red line) and at the breaking point
(vertical yellow line), respectively
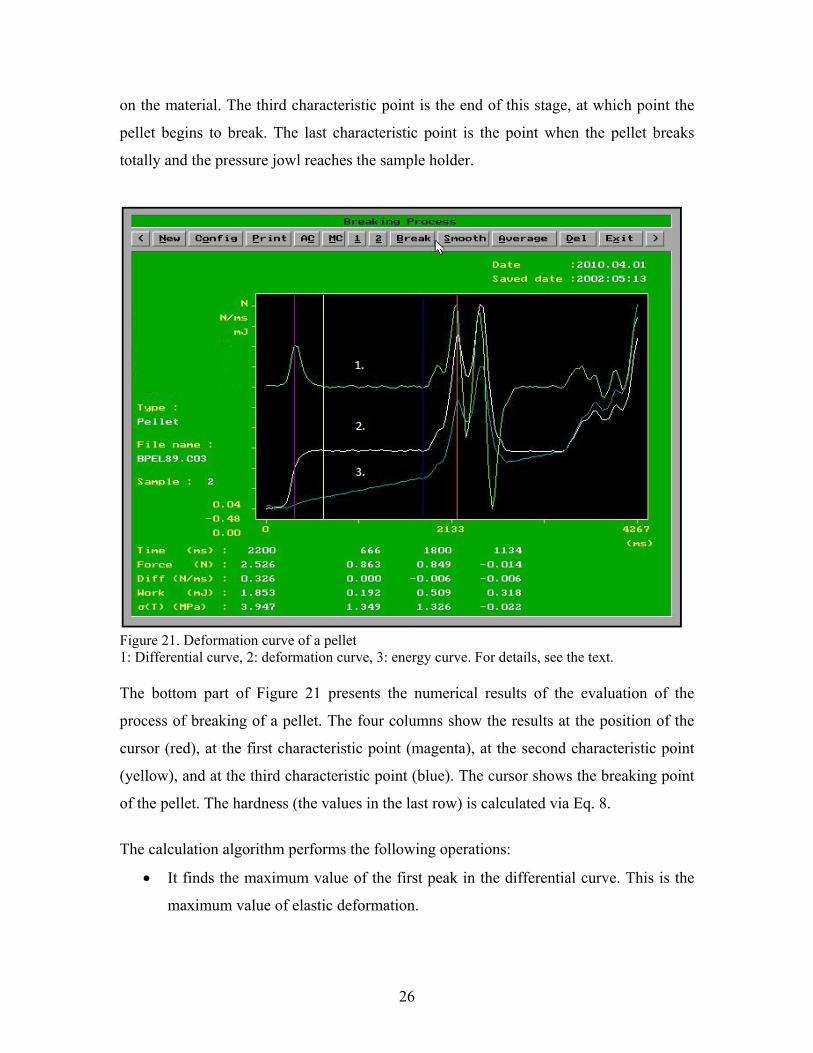
For pellets, the software calculates four characteristic points (Figure 21). The
deformation of a pellet starts short period of elastic deformation. The first characteristic
point is the maximum value of the elastic deformation. In the second stage, a short period
of plastic deformation occurs. The second characteristic point is the end of the plastic
deformation. The third stage involves plastoelastic or viscoelastic deformation depending
26
on the material. The third characteristic point is the end of this stage, at which point the
pellet begins to break. The last characteristic point is the point when the pellet breaks
totally and the pressure jowl reaches the sample holder.
Figure 21. Deformation curve of a pellet 1: Differential curve, 2: deformation curve, 3: energy curve. For details, see the text. The bottom part of Figure 21 presents the numerical results of the evaluation of the
process of breaking of a pellet. The four columns show the results at the position of the
cursor (red), at the first characteristic point (magenta), at the second characteristic point
(yellow), and at the third characteristic point (blue). The cursor shows the breaking point
of the pellet. The hardness (the values in the last row) is calculated via Eq. 8.
The calculation algorithm performs the following operations:
It finds the maximum value of the first peak in the differential curve. This is the
maximum value of elastic deformation.

27
It finds the starting point of the first horizontal section after the first peak in the
differential curve. This is the end-point of plastic deformation.
It finds the end-point of this section. This is the end of plasto- or viscoelastic
deformation.
It starts from this point to find the maximum value in the differential curve. This
is the breaking point of the pellet.
Figure 22 illustrates the hardness tester with the DAQ box. The sample holder and
pressure jowl are suitable for polymer films.
Figure 22. The hardness tester with the DAQ box.
28
5. RESULTS AND DISCUSSION
This section presents some practical applications of the above-mentioned measurement systems.
5.1. Study of the deformability process during loading
5.1.1. Deformability of medicated chewable polymers
The topic of one of my studies was the compression physics of different gum
bases, which can be used to prepare medicated chewing gum tablets [51].
Medicated chewing gum is a single-dose preparation that is to be chewed, but not
swallowed. It contains one or more APIs. These ingredients are released by chewing [29].
Chewing gums have recently been produced by direct compression [32]. With this
compression technology, these chewing gums can include higher levels of APIs than in
traditional extruded gums, the lower temperature protects sensitive components, and the
lower moisture content improves the shelf-life of active molecules. However, the most
common drawback in the direct compression of a gum base is its tendency to stick to the
punches of the tableting equipment, because of the adhesive nature of the gum, the main
component of the formulation. For this reason, the procedure is difficult and demands a
lower production speed and cooling operations in order to prevent to the damage
tableting machine. The tableting tools are kept at temperatures below 18 °C; however, it
should be noted that the temperature should not be so low as to interfere with the
handling of the medicated gums and the tableting process. Thus, the temperature should
be above 10–12 °C. In this work we studied the compression and breaking process at
room temperature
Ascorbic acid was used as model API (Ph. Eur.), with Pharmagum C, M and S
(gifts from SPI Pharma) as gum bases. Pharmagum M contains a 50% greater gum base
than Pharmagum S, which consists primarily of gum base and sorbitol. Pharmagum M
contains gum base, mannitol and isomalt.
The data of the manufacturer indicate that, Pharmagum S is suitable for
formulations with low drug loading and, when incorporated into tablets, gives them a
29
chewable character. Pharmagum M is suggested for medium drug loading (<50%); it
improves the mouthfeel texture. Pharmagum C is suggested for high drug loading
(>50%); it has a real chewing gum character.
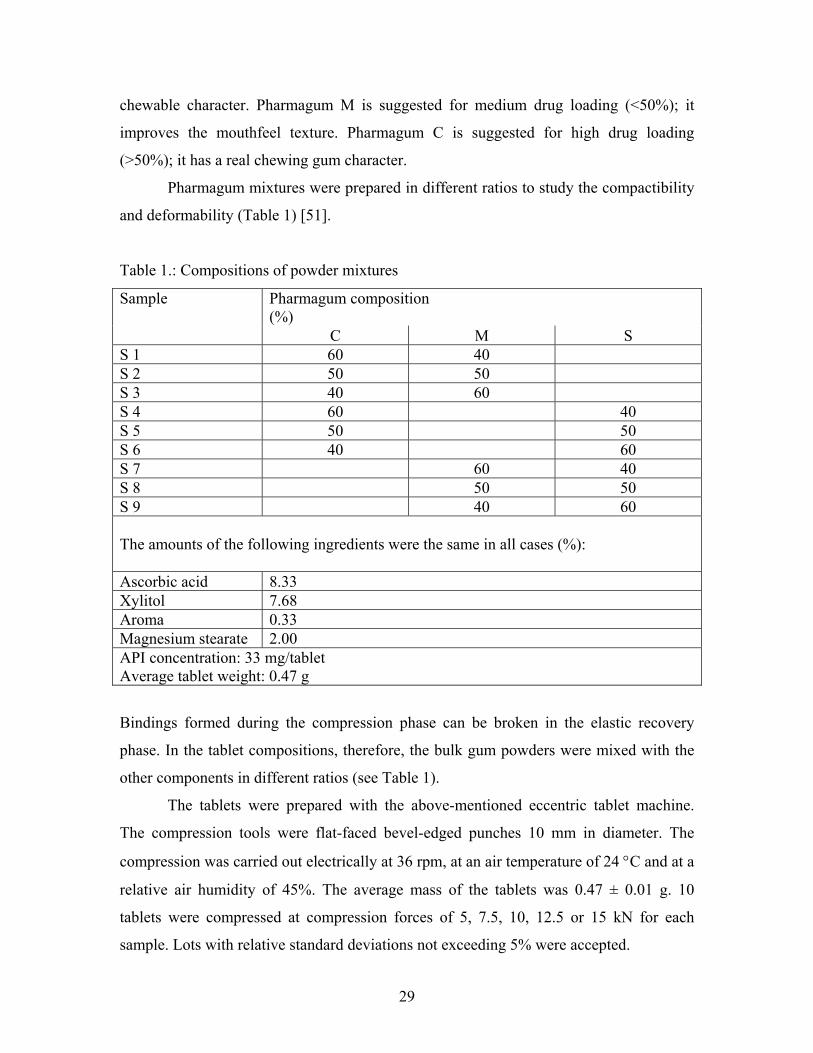
Pharmagum mixtures were prepared in different ratios to study the compactibility
and deformability (Table 1) [51].
Table 1.: Compositions of powder mixtures
Pharmagum composition (%)
Sample
C M S S 1 60 40 S 2 50 50 S 3 40 60 S 4 60 40 S 5 50 50 S 6 40 60 S 7 60 40 S 8 50 50 S 9 40 60 The amounts of the following ingredients were the same in all cases (%): Ascorbic acid 8.33 Xylitol 7.68 Aroma 0.33 Magnesium stearate 2.00 API concentration: 33 mg/tablet Average tablet weight: 0.47 g
Bindings formed during the compression phase can be broken in the elastic recovery
phase. In the tablet compositions, therefore, the bulk gum powders were mixed with the
other components in different ratios (see Table 1).
The tablets were prepared with the above-mentioned eccentric tablet machine.
The compression tools were flat-faced bevel-edged punches 10 mm in diameter. The
compression was carried out electrically at 36 rpm, at an air temperature of 24 C and at a
relative air humidity of 45%. The average mass of the tablets was 0.47 ± 0.01 g. 10
tablets were compressed at compression forces of 5, 7.5, 10, 12.5 or 15 kN for each
sample. Lots with relative standard deviations not exceeding 5% were accepted.

30
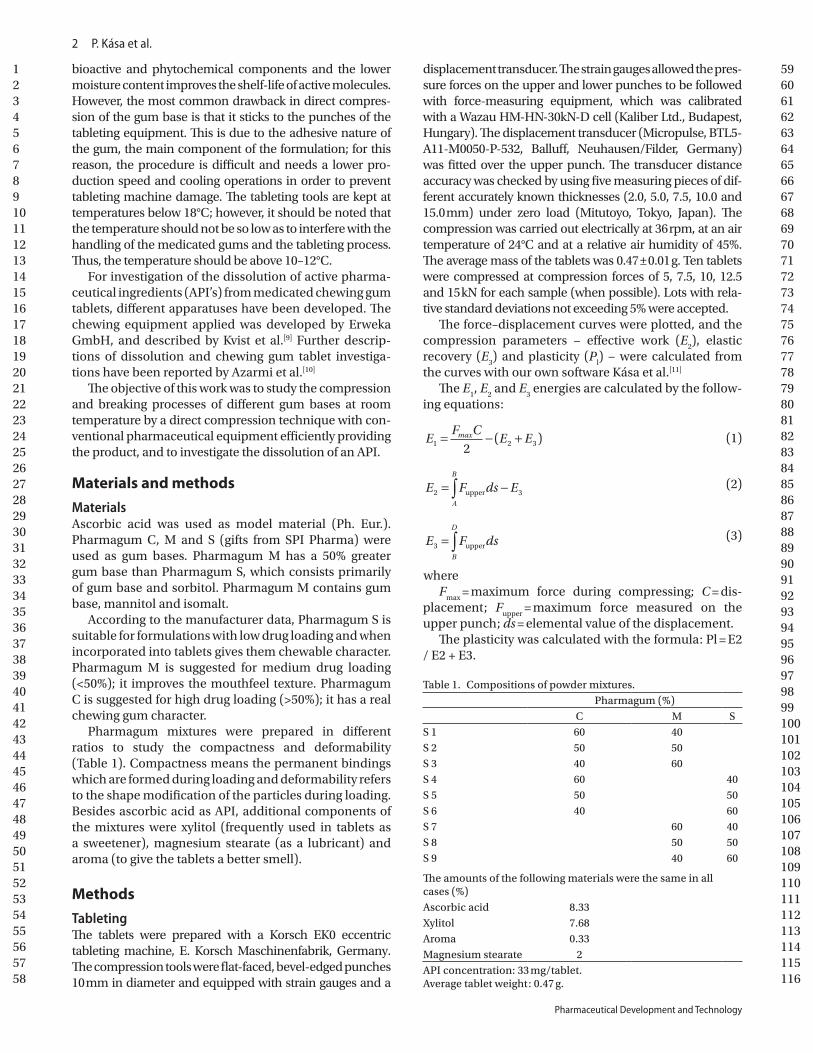
The force–displacement curves were plotted, and the compression parameters
effective work (E2), elastic recovery (E3) and plasticity (Pl) were calculated from the
curves with our software developed for the tablet machine with use of Eq. 9-11 [51]. The
plasticity was calculated with the Stamm-Mathis equtaion (Eq. 2) based on the force–
displacement diagram (Figure 23.; Sample S1), where the E1 = 44.58 %, the E2 =46.22 %,
and the E3 = 9.21 %.
Figure 23. Recorded force–displacement diagram of sample S1 [51].
31
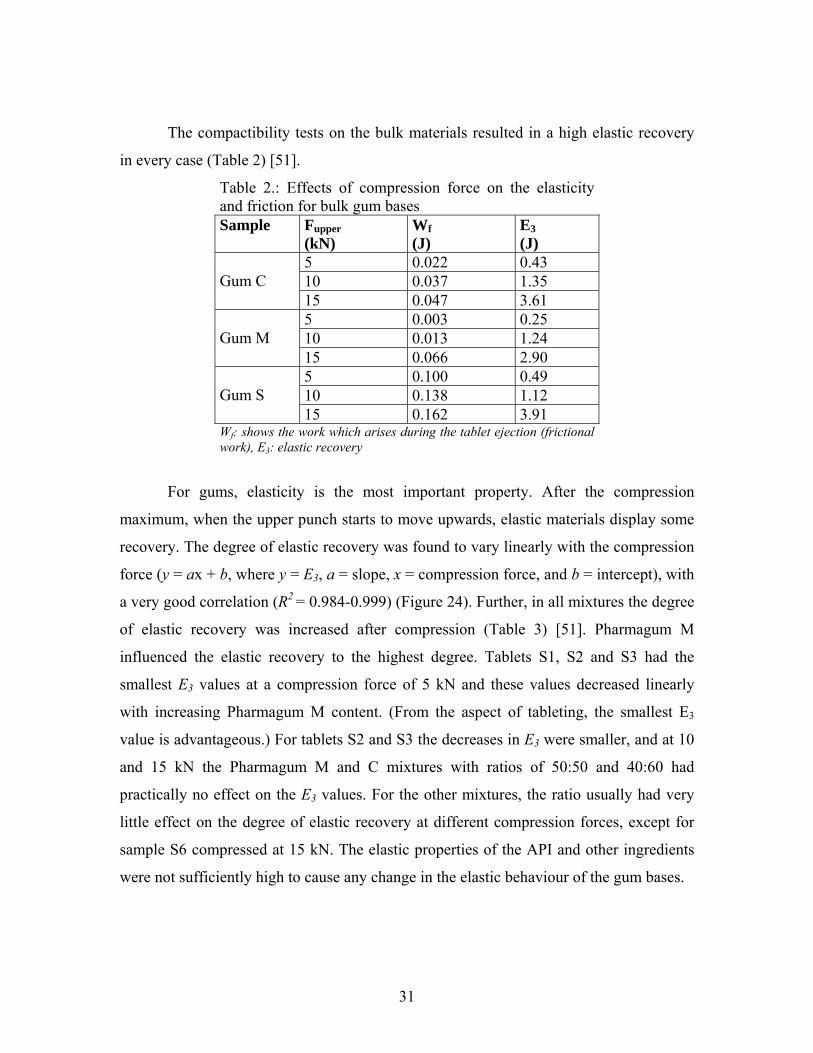
The compactibility tests on the bulk materials resulted in a high elastic recovery
in every case (Table 2) [51].
Table 2.: Effects of compression force on the elasticity and friction for bulk gum bases Sample Fupper
(kN) Wf
(J) E3
(J) 5 0.022 0.43 10 0.037 1.35 Gum C 15 0.047 3.61 5 0.003 0.25 10 0.013 1.24 Gum M 15 0.066 2.90 5 0.100 0.49 10 0.138 1.12 Gum S 15 0.162 3.91
Wf: shows the work which arises during the tablet ejection (frictional work), E3: elastic recovery
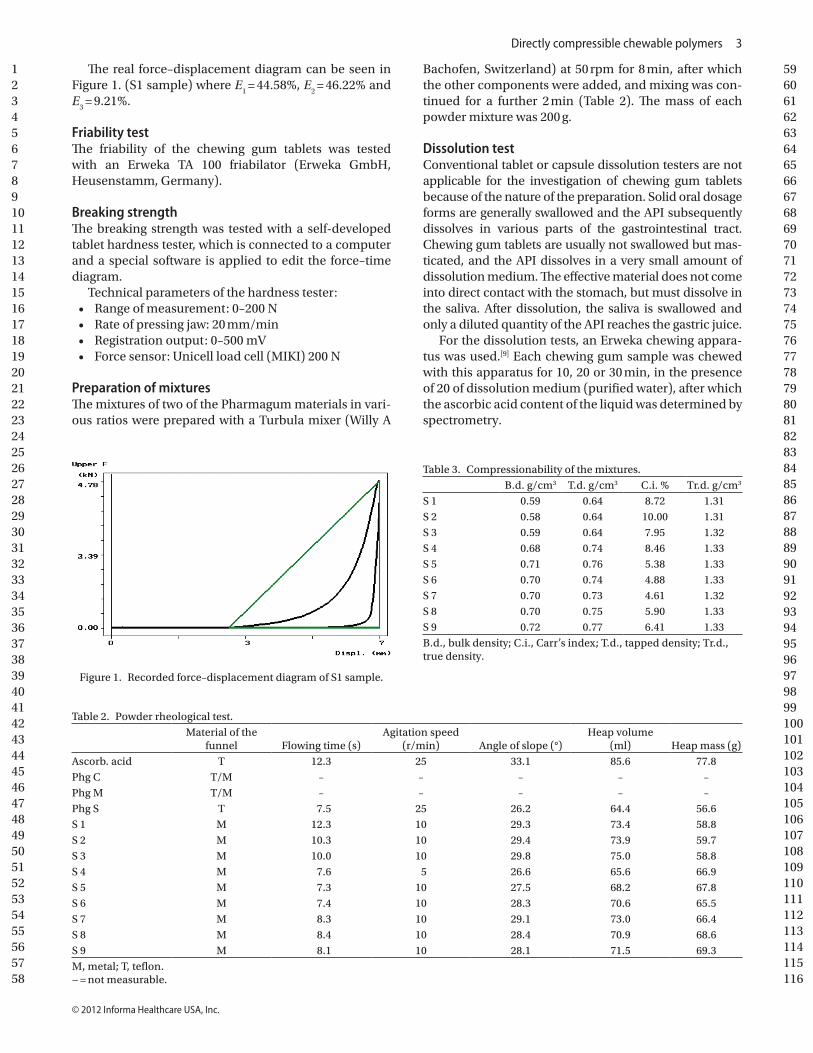
For gums, elasticity is the most important property. After the compression
maximum, when the upper punch starts to move upwards, elastic materials display some
recovery. The degree of elastic recovery was found to vary linearly with the compression
force (y = ax + b, where y = E3, a = slope, x = compression force, and b = intercept), with
a very good correlation (R2 = 0.984-0.999) (Figure 24). Further, in all mixtures the degree
of elastic recovery was increased after compression (Table 3) [51]. Pharmagum M
influenced the elastic recovery to the highest degree. Tablets S1, S2 and S3 had the
smallest E3 values at a compression force of 5 kN and these values decreased linearly
with increasing Pharmagum M content. (From the aspect of tableting, the smallest E3
value is advantageous.) For tablets S2 and S3 the decreases in E3 were smaller, and at 10
and 15 kN the Pharmagum M and C mixtures with ratios of 50:50 and 40:60 had
practically no effect on the E3 values. For the other mixtures, the ratio usually had very
little effect on the degree of elastic recovery at different compression forces, except for
sample S6 compressed at 15 kN. The elastic properties of the API and other ingredients
were not sufficiently high to cause any change in the elastic behaviour of the gum bases.

32
Figure 24. Relationship between the pressure and elastic recovery [51].
Table 3: Relationship between compositions and E3 areas
Composition (Gum base)
Compression forces (kN) E3 (J)
Sample
C M S 5 7.5 10 12.5 15 S 1 60 40 - 0.48 1.07 1.69 2.51 3.36 S 2 50 50 - 0.42 1.10 1.76 2.16 2.59 S 3 40 60 - 0.36 0.98 1.56 2.04 2.60 S 4 60 - 40 0.70 1.30 1.84 2.30 2.72 S 5 50 - 50 0.62 1.07 1.52 2.26 2.89 S 6 40 - 60 0.67 1.05 1.49 2.19 3.05 S 7 - 60 40 0.56 1.03 1.55 2.36 3.01 S 8 - 50 50 0.61 1.05 1.55 2.27 3.02 S 9 - 40 60 0.58 1.06 1.56 2.29 3.02
33
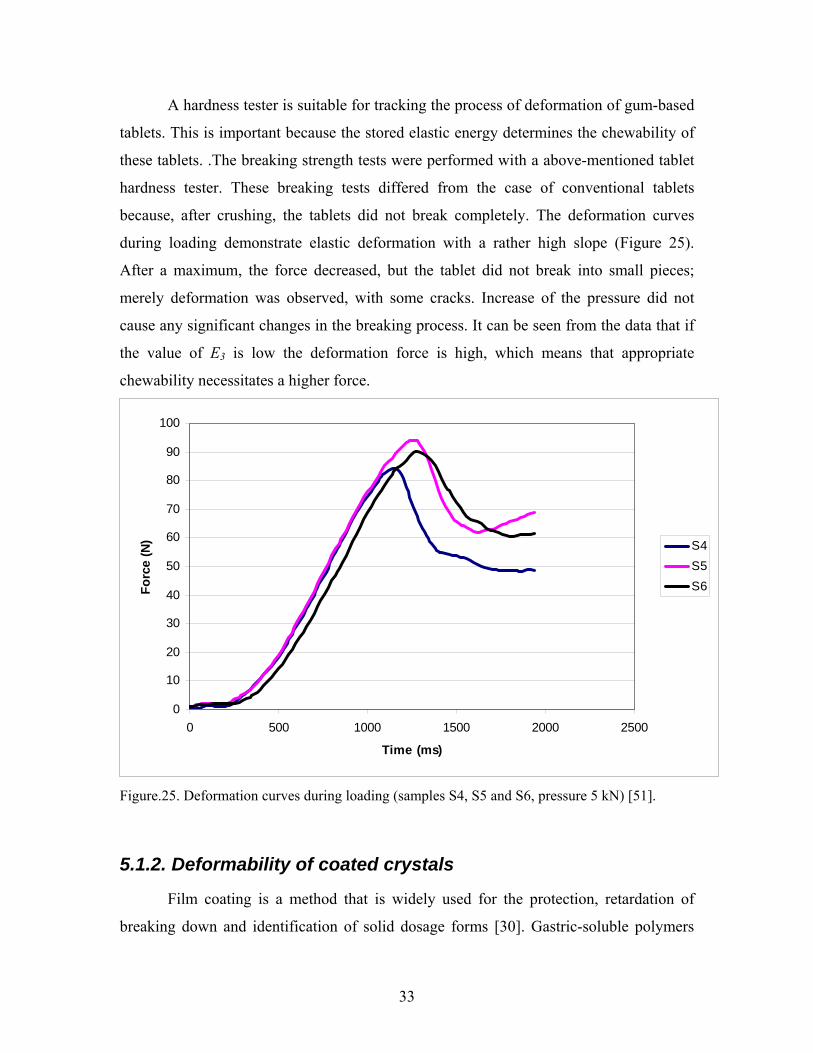
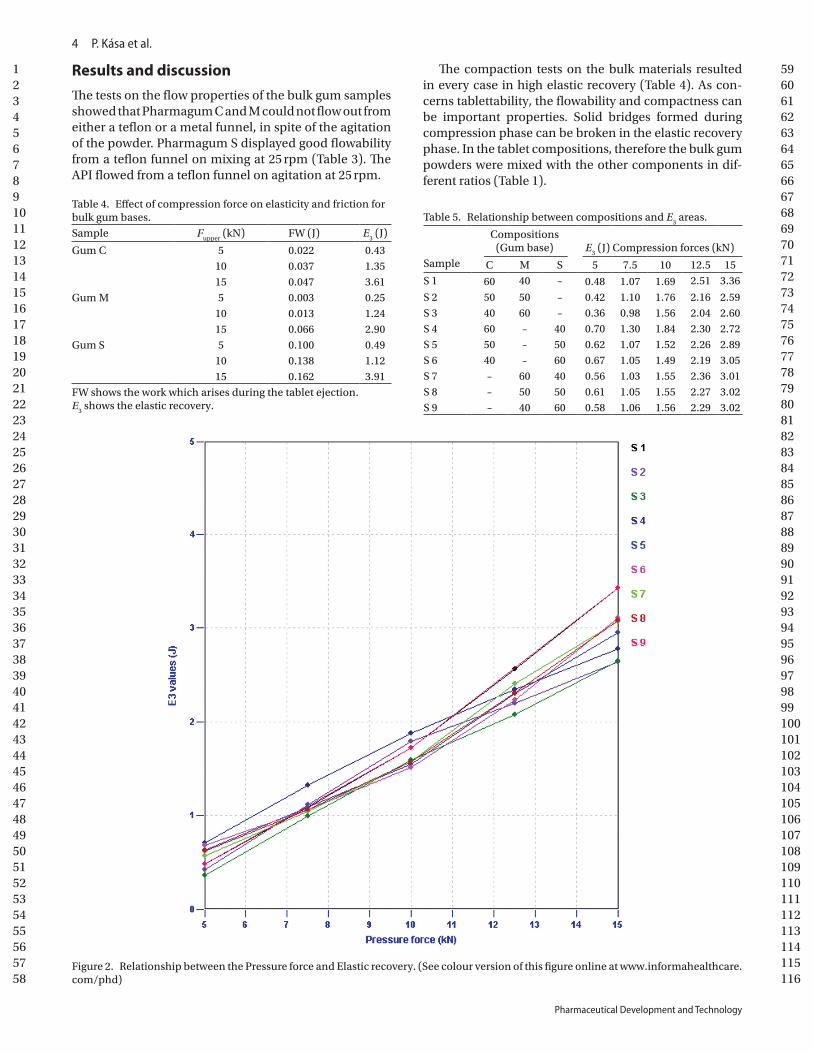
A hardness tester is suitable for tracking the process of deformation of gum-based
tablets. This is important because the stored elastic energy determines the chewability of
these tablets. .The breaking strength tests were performed with a above-mentioned tablet
hardness tester. These breaking tests differed from the case of conventional tablets
because, after crushing, the tablets did not break completely. The deformation curves
during loading demonstrate elastic deformation with a rather high slope (Figure 25).
After a maximum, the force decreased, but the tablet did not break into small pieces;
merely deformation was observed, with some cracks. Increase of the pressure did not
cause any significant changes in the breaking process. It can be seen from the data that if
the value of E3 is low the deformation force is high, which means that appropriate
chewability necessitates a higher force.
0
10
20
30
40
50
60
70
80
90
100
0 500 1000 1500 2000 2500
Time (ms)
Fo
rce
(N) S4
S5
S6
Figure.25. Deformation curves during loading (samples S4, S5 and S6, pressure 5 kN) [51].
5.1.2. Deformability of coated crystals
Film coating is a method that is widely used for the protection, retardation of
breaking down and identification of solid dosage forms [30]. Gastric-soluble polymers
34
are used to protect ingredients from light, moisture and oxygen, and for identification.
Several types of gastric-soluble films (cellulose derivatives, poly(methacrylates),
poly(ethylene -glycols), etc.) have been used for protection. The film smoothness and
thickness determine the protective effect of the coating film. These parameters are well
measurable on the surface of tablets or pellets by means of image analysis [40]. The film
coating of fine particles can be a useful procedure in tablet making, but the adherence of
these particles disturbs the determination of film thickness. It is difficult to avoid this
sticking effect [41]. It is important to know whether the protective effect is modified or
not by the quantity of coating material applied. One very important property of slid
dosage forms is the compressibility. This was investigated with the above-mentioned
instrumented tablet machine and software [49].
The model API used was dimenhydrinate (Ph. Eur. 3, B.No.:280-69-015), which
is an ethanolamine derivative antihistamine used for the treatment of motion sickness,
nausea and vomiting [30]. The film-forming agent was hydroxypropyl-methylcellulose
(Sepifilm LP 010®, B.No.: 80741) (Seppic, Paris, France), which was applied in a 10%
aqueous dispersion, containing binder, pigment and plasticizer [42].
The samples were compressed into tablets. The compression was carried out electrically
at 36 rpm at an air temperature of 24 °C and a relative humidity of 45%. The compressed
volume was 100 mm3 for each sample. 10 tablets were compressed for each sample. The
compression force on the upper punch was 18±1.8 kN. The deviation of the compression
force for uncoated crystals was higher because of the uneven filling.
The force–displacement curve was determined and the plasticity was calculated.
The force–displacement curve of the uncoated crystals may be seen in Figure 26. The
coating did not influence the shape of the force–displacement curve significantly. The
smooth line is the measured curve, while the dotted lines are lines facilitating the
calculation. The plasticity (Pl) was calculated according to the Stamm and Mathis
equation (Eq. 2). This parameter relates to the behaviour of a material under a load. If Pl
is close to 100%, the material deforms well under a load.

35
Figure 26. Force–displacement curve of uncoated crystals [49]. E1 is the energy lost by
rearrangement of the particles, E2 is the useful energy and E3 is the energy lost by elastic recovery.
The uncoated dimenhydrinate crystals exhibited the highest plasticity (Table 3).
The coating caused a decrease in plasticity. This can be explained by the film between the
crystals. The interactions between the crystals were influenced by the film. The free
coating film exhibited elastic properties, which was supported by other experimental
findings.
Not only the quantity of coating material influenced the plasticity: the uniform
distribution on the surface also played an important part, for there was a relationship
between the continuity and the elastic behaviour of the film, i.e. between the film
uniformity and the plasticity. Sample Dim 2 exhibited the poorest plasticity, which can be
explained in terms of the best protective effect of the coating film.
Table 3: Plasticity data (Stamm-Mathis) on samples [49].
Dimenhydrinate Dim1 Dim2 Dim3
Pl (%) 69.66 59.61 43.77 52.93
SD 6.61 2.32 2.01 3.07
36
Despite the decreased plasticity, the tabletability of dimenhydrinate was not appreciably
decreased by the coating because the tableting process is influenced by many parameters
(the flow rate of material, the rearrangement of particles, the lubrication, etc. [32]). Some
parameters even improved the tabletability (uniform filling, better lubrication, a smaller
proportion of friction, etc.).
On the basis of the results, it can be concluded that the instrumented tablet machine with
the developed software is suitable for the study of the deformability and compressibility
of different materials. It is a very useful tool in the development of pharmaceutical solid
dosage forms.
5.2. Study of swelling force profiles
5.2.1. Swelling forces of some superdisintegrants
The swelling properties of several experimental superdisintegrants (e.g. sodium
starch glycolates (SSGs)) were investigated with the above-mentioned Fs tester [48]. The
SSG samples were based on the sodium salts of the partially substituted carboxymethyl
ethers of potato starch. They have a moisture content that is lower than that of starches
(<10%). The sodium chloride content is less than 1%. Different types are produced as
regards the degree of crosslinking. The degree of substitution is the same.
Some tablets were prepared from the SSG products with the aim of a study of the
swelling. Dicalcium phosphate dihydrate was used as binder. It was necessary to apply a
lubricant as well (magnesium stearate). These materials do not swell in aqueous medium.
After sieving (0.8 mm wire distance), the components were blended at 50 rpm for 10 min
in a Turbula mixer. The moisture contents of the powder mixtures were determined
gravimetrically, through water removal with an IR lamp mounted on a quick dryer. The
moisture content was 0.3-0.45 in every case.
Compression was carried out with the tablet press equipment described above. The
parameters of compression were as follows (Table 4):
Table 4: Technical parameters of compression
Punches: flat, 10 mm in diameter Pressure force: 5, 10 or 15 ± 1 kN Air temperature: 23 ºC Rate of pressing 36 tablets/min
37
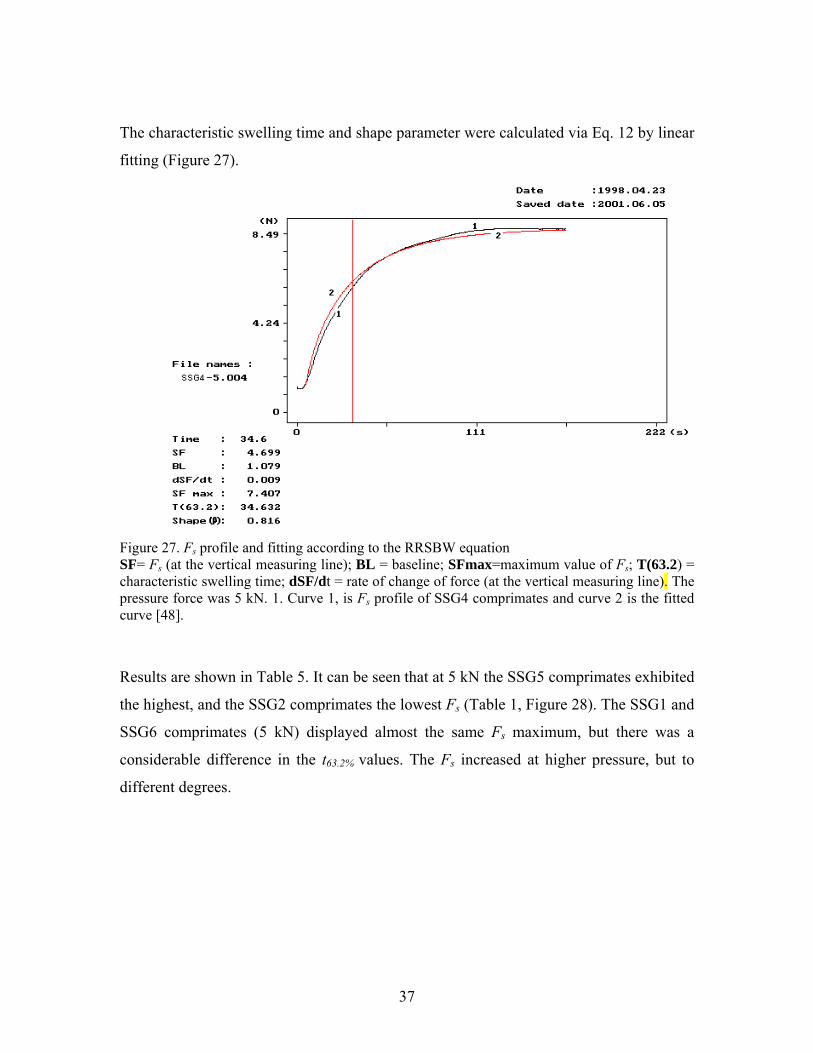
The characteristic swelling time and shape parameter were calculated via Eq. 12 by linear
fitting (Figure 27).
Figure 27. Fs profile and fitting according to the RRSBW equation SF= Fs (at the vertical measuring line); BL = baseline; SFmax=maximum value of Fs; T(63.2) = characteristic swelling time; dSF/dt = rate of change of force (at the vertical measuring line). The pressure force was 5 kN. 1. Curve 1, is Fs profile of SSG4 comprimates and curve 2 is the fitted curve [48].
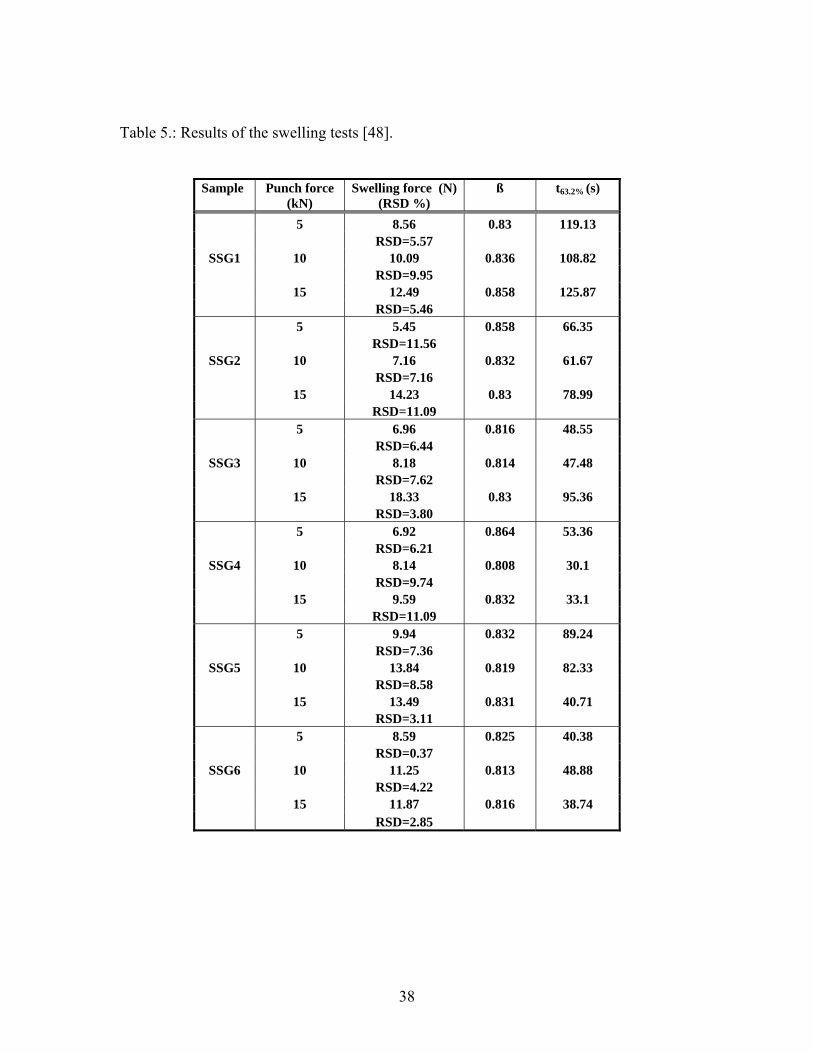
Results are shown in Table 5. It can be seen that at 5 kN the SSG5 comprimates exhibited
the highest, and the SSG2 comprimates the lowest Fs (Table 1, Figure 28). The SSG1 and
SSG6 comprimates (5 kN) displayed almost the same Fs maximum, but there was a
considerable difference in the t63.2% values. The Fs increased at higher pressure, but to
different degrees.
38
Table 5.: Results of the swelling tests [48].
Sample
Punch force (kN)
Swelling force (N)(RSD %)
ß
t63.2% (s)
5 8.56 0.83 119.13 RSD=5.57
SSG1 10 10.09 0.836 108.82 RSD=9.95 15 12.49 0.858 125.87 RSD=5.46 5 5.45 0.858 66.35 RSD=11.56
SSG2 10 7.16 0.832 61.67 RSD=7.16 15 14.23 0.83 78.99 RSD=11.09 5 6.96 0.816 48.55 RSD=6.44
SSG3 10 8.18 0.814 47.48 RSD=7.62 15 18.33 0.83 95.36 RSD=3.80 5 6.92 0.864 53.36 RSD=6.21
SSG4 10 8.14 0.808 30.1 RSD=9.74 15 9.59 0.832 33.1 RSD=11.09 5 9.94 0.832 89.24 RSD=7.36
SSG5 10 13.84 0.819 82.33 RSD=8.58 15 13.49 0.831 40.71 RSD=3.11 5 8.59 0.825 40.38 RSD=0.37
SSG6 10 11.25 0.813 48.88 RSD=4.22 15 11.87 0.816 38.74 RSD=2.85
39
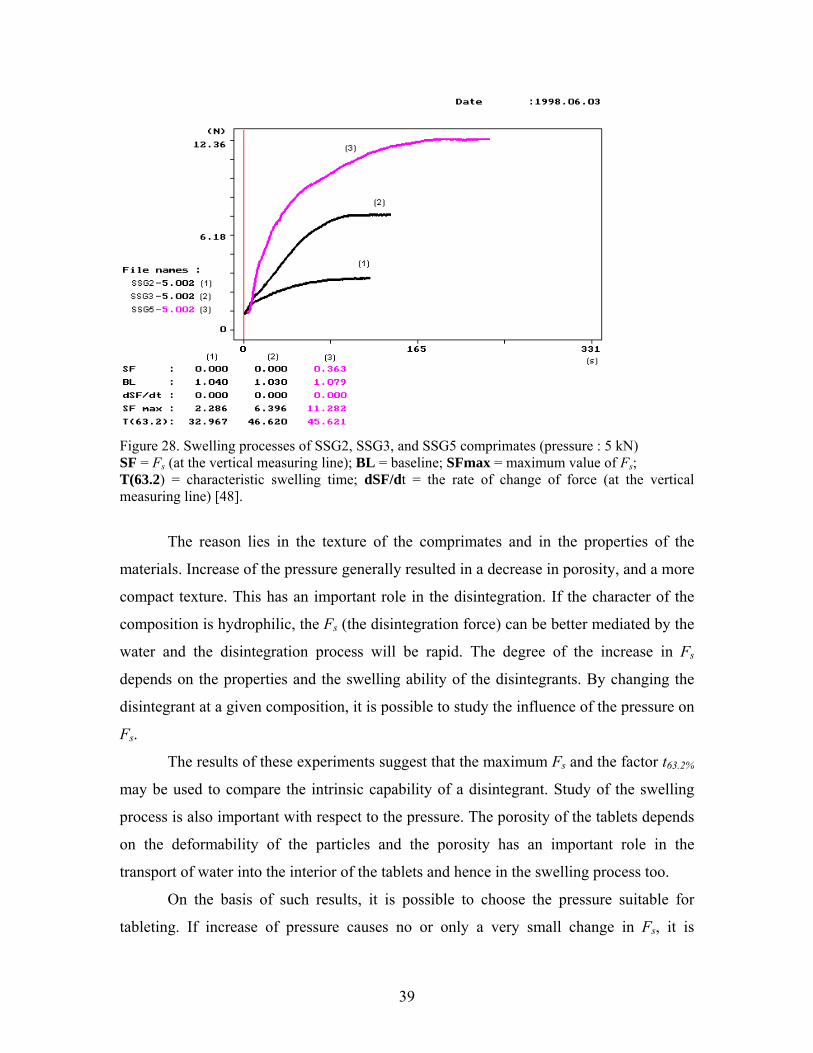
Figure 28. Swelling processes of SSG2, SSG3, and SSG5 comprimates (pressure : 5 kN) SF = Fs (at the vertical measuring line); BL = baseline; SFmax = maximum value of Fs; T(63.2) = characteristic swelling time; dSF/dt = the rate of change of force (at the vertical measuring line) [48].
The reason lies in the texture of the comprimates and in the properties of the
materials. Increase of the pressure generally resulted in a decrease in porosity, and a more
compact texture. This has an important role in the disintegration. If the character of the
composition is hydrophilic, the Fs (the disintegration force) can be better mediated by the
water and the disintegration process will be rapid. The degree of the increase in Fs
depends on the properties and the swelling ability of the disintegrants. By changing the
disintegrant at a given composition, it is possible to study the influence of the pressure on
Fs.
The results of these experiments suggest that the maximum Fs and the factor t63.2%
may be used to compare the intrinsic capability of a disintegrant. Study of the swelling
process is also important with respect to the pressure. The porosity of the tablets depends
on the deformability of the particles and the porosity has an important role in the
transport of water into the interior of the tablets and hence in the swelling process too.
On the basis of such results, it is possible to choose the pressure suitable for
tableting. If increase of pressure causes no or only a very small change in Fs, it is
40
unnecessary to use a high pressure during tableting. The other advantage is the choise of
suitable disintegrants in the tablet composition.
5.2.2. Swelling forces of swellable matrices
In the past decade, swellable matrix systems have become very popular solid
dosage forms for controlled-release API delivery systems. The study of the swelling
behaviour of these matrices plays an important role in prediction of the API release
profile. In this study, the model matrices were based on kappa-carrageenan. Its Fs profile
is not described by with RRBSW distribution as for conventional tablets. The
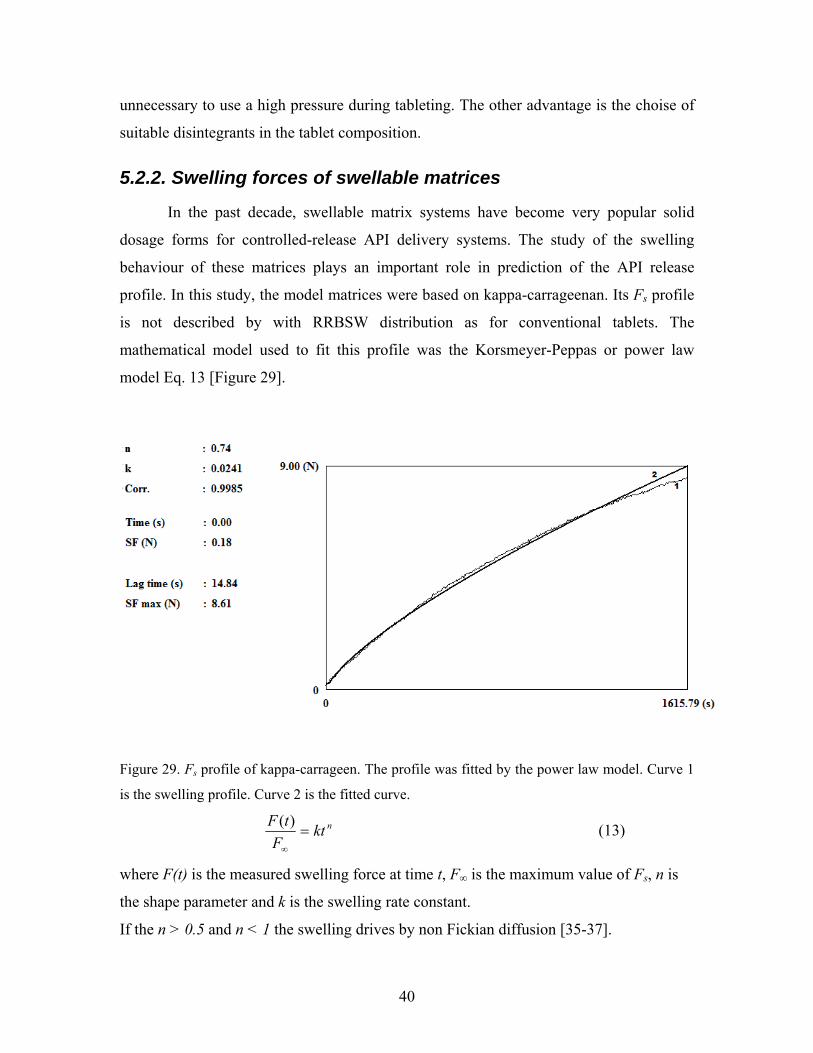
mathematical model used to fit this profile was the Korsmeyer-Peppas or power law
model Eq. 13 [Figure 29].
Figure 29. Fs profile of kappa-carrageen. The profile was fitted by the power law model. Curve 1
is the swelling profile. Curve 2 is the fitted curve.
nktF
tF
)( (13)
where F(t) is the measured swelling force at time t, F∞ is the maximum value of Fs, n is
the shape parameter and k is the swelling rate constant.
If the n > 0.5 and n < 1 the swelling drives by non Fickian diffusion [35-37].

41
At the end of the measurement the measured curve differs from the fitted curve. The
reason is the partial erosion of the sample. This effect is small, but detectable.
5.3. Measurement of breaking process of smaller particles
Breaking is a very important parameter in the qualification of a solid dosage form
(granule, pellet, tablet or polymer film). Different instruments are available for tablet
hardness testing, but in the case of smaller particles (granules or pellets) only the
friability test is described in the pharmacopeia. The mechanical resistance of pellets can
be characterized in terms of the friability, but the individual breaking strength can not be
shown. With the developed equipment, it is possible to test the granules and pellets too. It
is also possible to determine breaking points of the particles and to follow the
deformation processes.
A pellet is an agglomerate with nearly spherical symmetry and usually a diameter
of 0.5-1.5 mm, though this can vary with the production technology [43]. As compared
with classical granules, pellets not only differ in shape, but also have a more compact
texture, resulting in better flow characteristics.
In this work the hardness of the pellets was studied with the above-mentioned
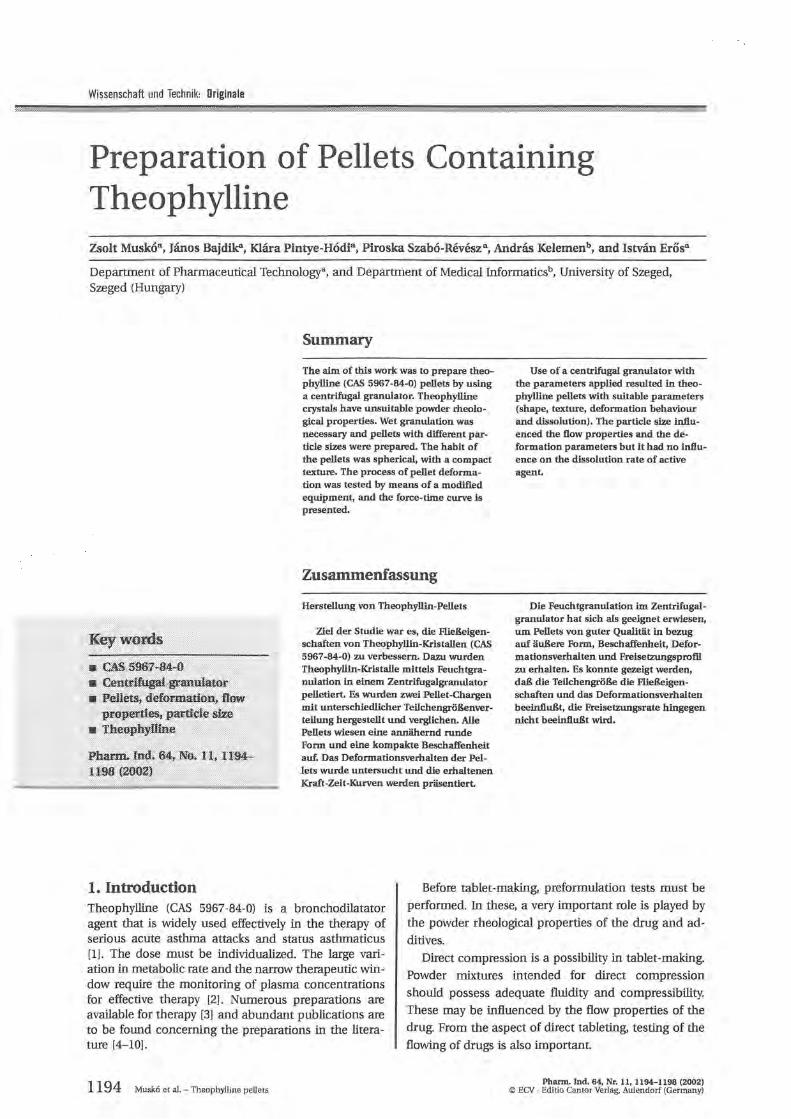
breaking hardness tester [50]. Figure 30 depicts the pellet deformation behaviour.
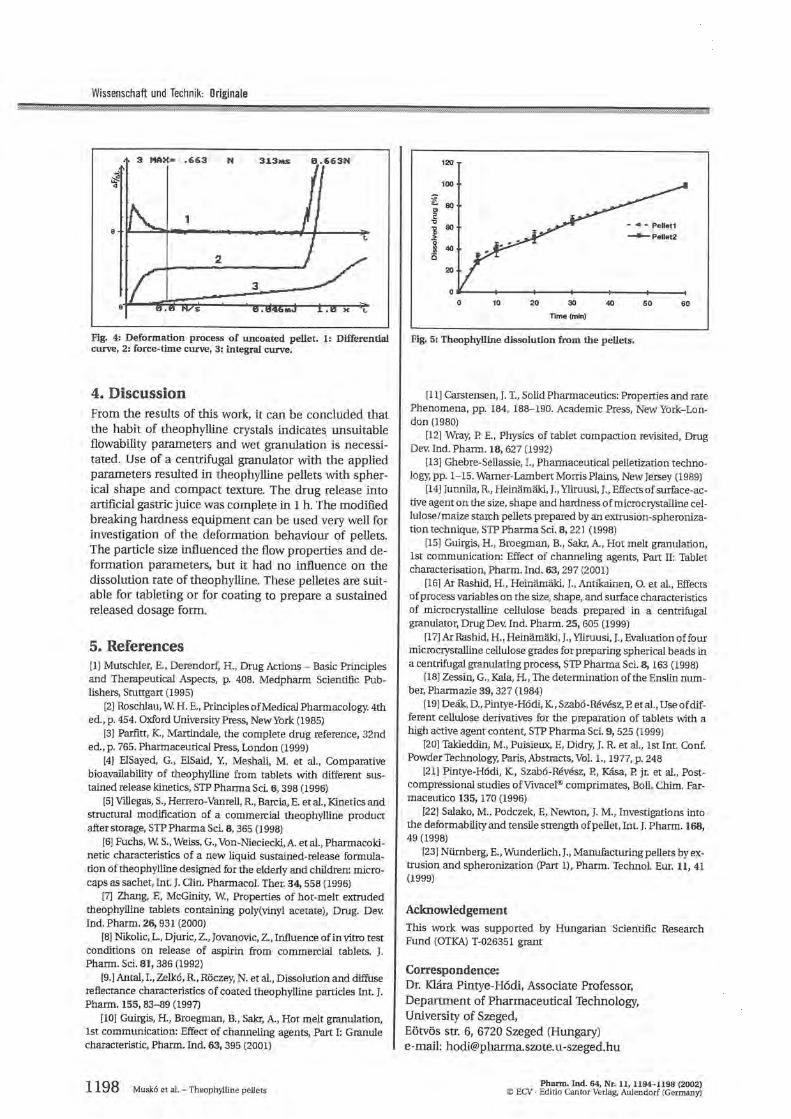
Figure 30. Deformation process of an uncoated pellet. 1: differential curve, 2: force–time curve. 3: integral curve [50].
42
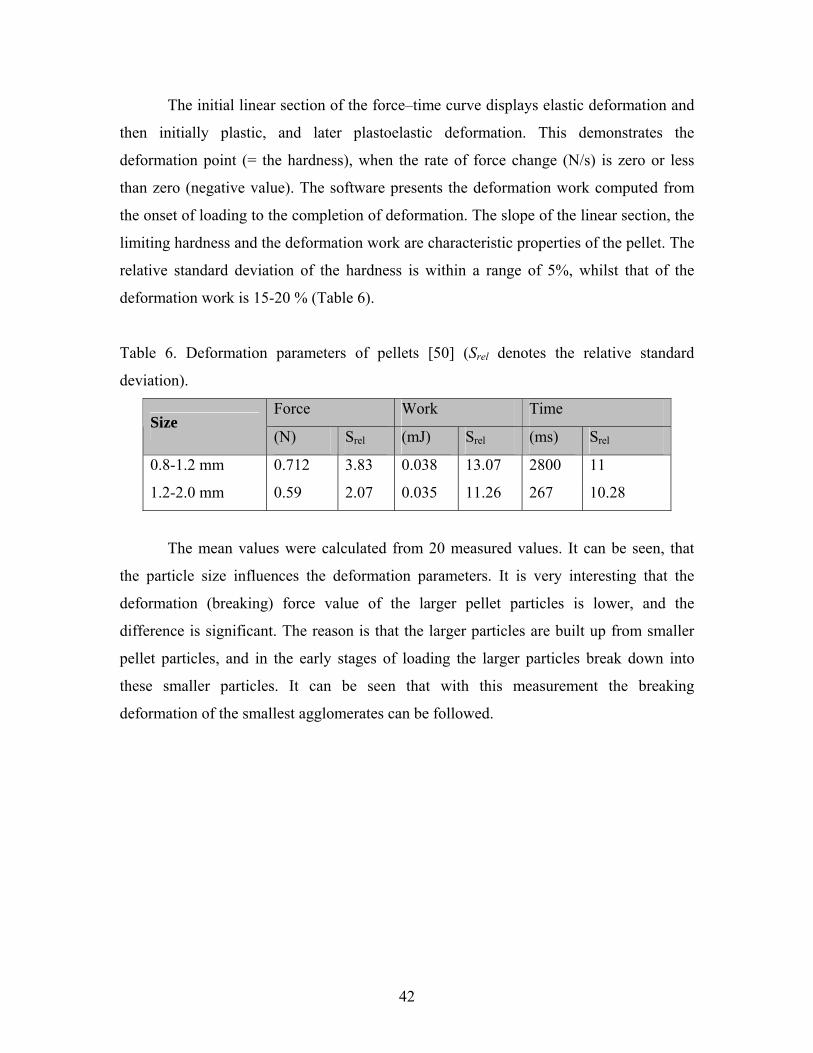
The initial linear section of the force–time curve displays elastic deformation and
then initially plastic, and later plastoelastic deformation. This demonstrates the
deformation point (= the hardness), when the rate of force change (N/s) is zero or less
than zero (negative value). The software presents the deformation work computed from
the onset of loading to the completion of deformation. The slope of the linear section, the
limiting hardness and the deformation work are characteristic properties of the pellet. The
relative standard deviation of the hardness is within a range of 5%, whilst that of the
deformation work is 15-20 % (Table 6).
Table 6. Deformation parameters of pellets [50] (Srel denotes the relative standard
deviation).
Force Work Time Size
(N) Srel (mJ) Srel (ms) Srel
0.8-1.2 mm 0.712 3.83 0.038 13.07 2800 11
1.2-2.0 mm 0.59 2.07 0.035 11.26 267 10.28
The mean values were calculated from 20 measured values. It can be seen, that
the particle size influences the deformation parameters. It is very interesting that the
deformation (breaking) force value of the larger pellet particles is lower, and the
difference is significant. The reason is that the larger particles are built up from smaller
pellet particles, and in the early stages of loading the larger particles break down into
these smaller particles. It can be seen that with this measurement the breaking
deformation of the smallest agglomerates can be followed.

43
6. SUMMARY
The main aim of the research work described in this dissertation was to develop
measurement equipment with which to study the mechanical force effects in
preformulation studies.
A DAQ box (device and embedded software) was developed for digitalization of
the strain gauge and LDTV signals of instrumented tablet machine and the
hardness tester.
Software and hardware were developed to suitable study of the deformability and
compactibility of pharmaceutical powders with on instrumented eccentric tablet
machine. The software acquires the upper punch force, the lower punch force and
the upper punch displacement. It has a wide range of possibilities to display and
evaluate the different force profiles (force–time, displacement-time, force–
displacement). The standard profile parameters, the work of friction and the
plasticity were automatically calculated.
Software was developed to evaluate the swelling force of conventional tablets. As
swelling follows second-order kinetics in the most common cases, the software
uses the RRSBW distribution to fit the swelling force curve and to calculate the
characteristic swelling time (t63.2%) and shape parameter β.
The software of a swelling tester was improved to allow study of swellable
matrices.
Software was developed for studies of the hardness and deformation behaviour of
solid dosage forms. The software acquires the signals of the load cell and the
displacement of the pressure jowl. During evaluation, it displays the deformation
curve and the calculated work curve, and calculates the hardness of the material.
These instruments were validated and widely tested on well-known materials in
practice.
The main findings were as follows:
44
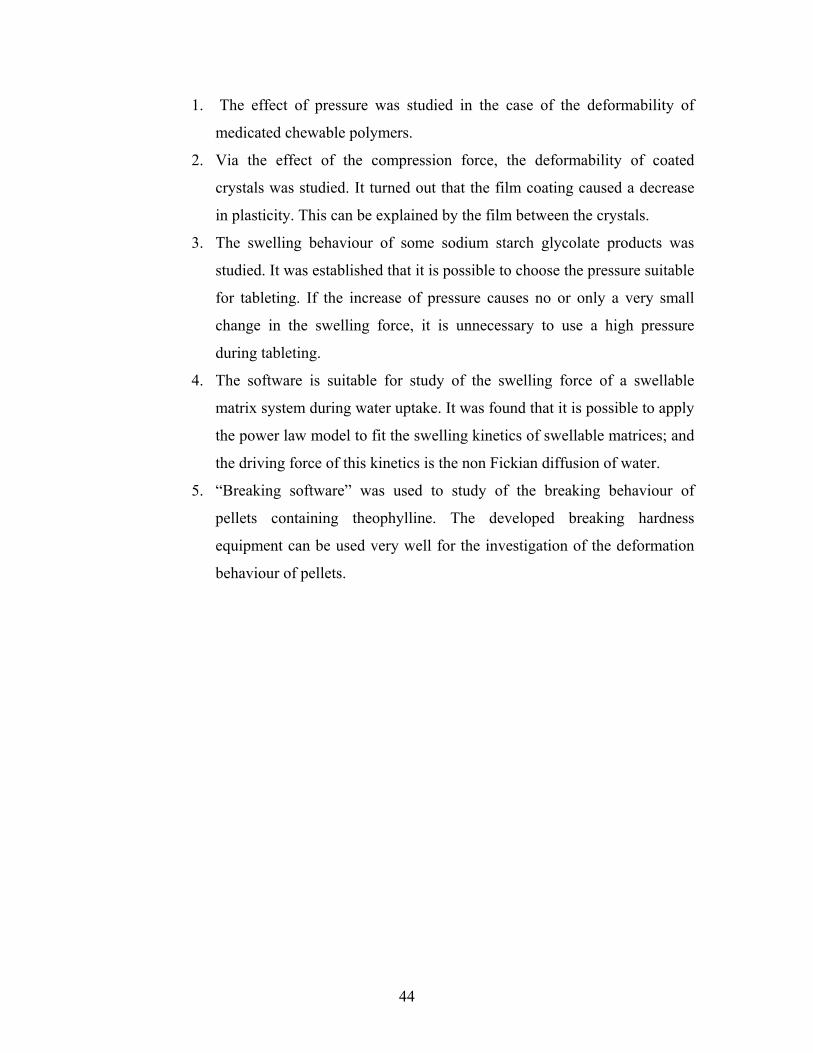
1. The effect of pressure was studied in the case of the deformability of
medicated chewable polymers.
2. Via the effect of the compression force, the deformability of coated
crystals was studied. It turned out that the film coating caused a decrease
in plasticity. This can be explained by the film between the crystals.
3. The swelling behaviour of some sodium starch glycolate products was
studied. It was established that it is possible to choose the pressure suitable
for tableting. If the increase of pressure causes no or only a very small
change in the swelling force, it is unnecessary to use a high pressure
during tableting.
4. The software is suitable for study of the swelling force of a swellable
matrix system during water uptake. It was found that it is possible to apply
the power law model to fit the swelling kinetics of swellable matrices; and
the driving force of this kinetics is the non Fickian diffusion of water.
5. “Breaking software” was used to study of the breaking behaviour of
pellets containing theophylline. The developed breaking hardness
equipment can be used very well for the investigation of the deformation
behaviour of pellets.
45
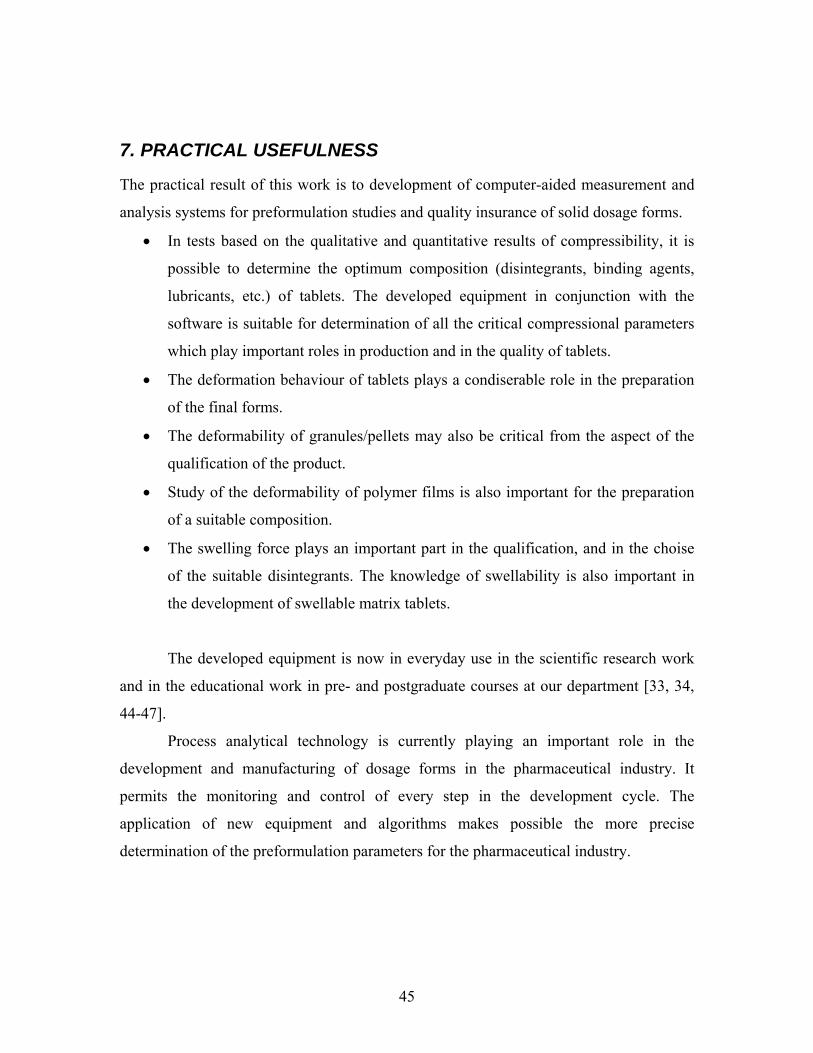
7. PRACTICAL USEFULNESS
The practical result of this work is to development of computer-aided measurement and
analysis systems for preformulation studies and quality insurance of solid dosage forms.
In tests based on the qualitative and quantitative results of compressibility, it is
possible to determine the optimum composition (disintegrants, binding agents,
lubricants, etc.) of tablets. The developed equipment in conjunction with the
software is suitable for determination of all the critical compressional parameters
which play important roles in production and in the quality of tablets.
The deformation behaviour of tablets plays a condiserable role in the preparation
of the final forms.
The deformability of granules/pellets may also be critical from the aspect of the
qualification of the product.
Study of the deformability of polymer films is also important for the preparation
of a suitable composition.
The swelling force plays an important part in the qualification, and in the choise
of the suitable disintegrants. The knowledge of swellability is also important in
the development of swellable matrix tablets.
The developed equipment is now in everyday use in the scientific research work
and in the educational work in pre- and postgraduate courses at our department [33, 34,
44-47].
Process analytical technology is currently playing an important role in the
development and manufacturing of dosage forms in the pharmaceutical industry. It
permits the monitoring and control of every step in the development cycle. The
application of new equipment and algorithms makes possible the more precise
determination of the preformulation parameters for the pharmaceutical industry.
46
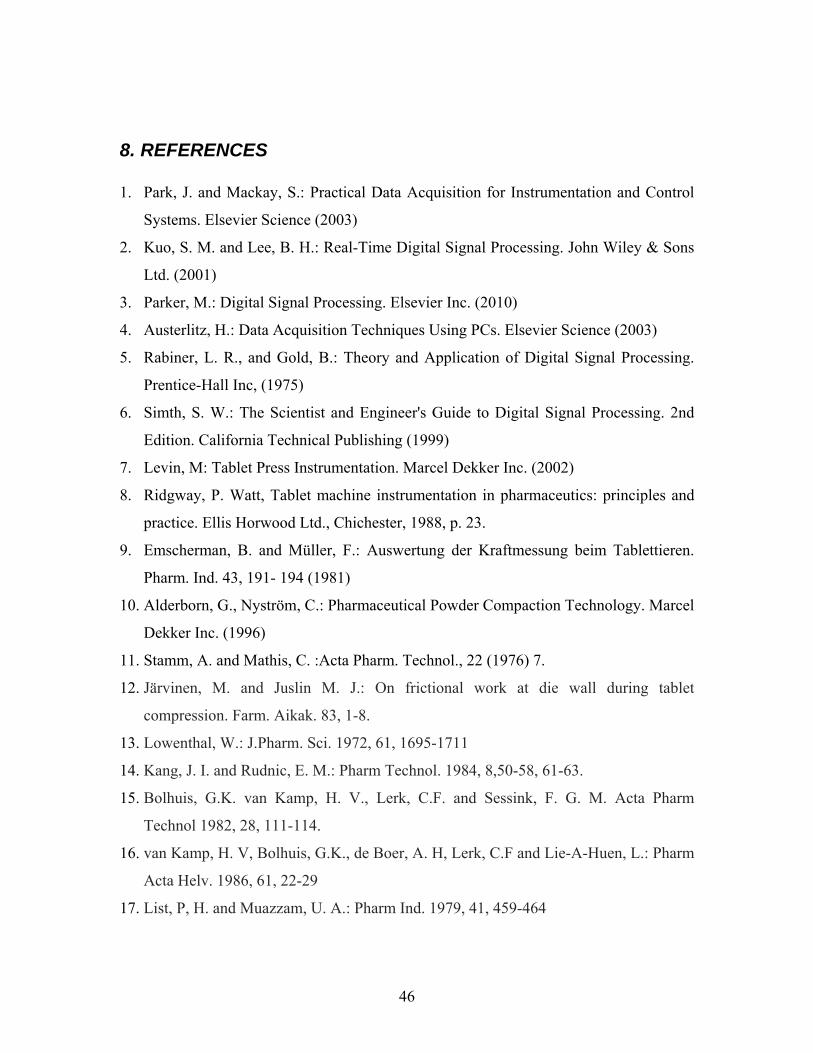
8. REFERENCES 1. Park, J. and Mackay, S.: Practical Data Acquisition for Instrumentation and Control
Systems. Elsevier Science (2003)
2. Kuo, S. M. and Lee, B. H.: Real-Time Digital Signal Processing. John Wiley & Sons
Ltd. (2001)
3. Parker, M.: Digital Signal Processing. Elsevier Inc. (2010)
4. Austerlitz, H.: Data Acquisition Techniques Using PCs. Elsevier Science (2003)
5. Rabiner, L. R., and Gold, B.: Theory and Application of Digital Signal Processing.
Prentice-Hall Inc, (1975)
6. Simth, S. W.: The Scientist and Engineer's Guide to Digital Signal Processing. 2nd
Edition. California Technical Publishing (1999)
7. Levin, M: Tablet Press Instrumentation. Marcel Dekker Inc. (2002)
8. Ridgway, P. Watt, Tablet machine instrumentation in pharmaceutics: principles and
practice. Ellis Horwood Ltd., Chichester, 1988, p. 23.
9. Emscherman, B. and Müller, F.: Auswertung der Kraftmessung beim Tablettieren.
Pharm. Ind. 43, 191- 194 (1981)
10. Alderborn, G., Nyström, C.: Pharmaceutical Powder Compaction Technology. Marcel
Dekker Inc. (1996)
11. Stamm, A. and Mathis, C. :Acta Pharm. Technol., 22 (1976) 7.
12. Järvinen, M. and Juslin M. J.: On frictional work at die wall during tablet
compression. Farm. Aikak. 83, 1-8.
13. Lowenthal, W.: J.Pharm. Sci. 1972, 61, 1695-1711
14. Kang, J. I. and Rudnic, E. M.: Pharm Technol. 1984, 8,50-58, 61-63.
15. Bolhuis, G.K. van Kamp, H. V., Lerk, C.F. and Sessink, F. G. M. Acta Pharm
Technol 1982, 28, 111-114.
16. van Kamp, H. V, Bolhuis, G.K., de Boer, A. H, Lerk, C.F and Lie-A-Huen, L.: Pharm
Acta Helv. 1986, 61, 22-29
17. List, P, H. and Muazzam, U. A.: Pharm Ind. 1979, 41, 459-464
47
18. Langenbucher, F. : Parametric representation of Dissolution-Rate Curves by the
RRSBW Distribution. Pharm Ind. 38. Nr. 5 (1976)
19. Xie, M. and Jiang, R.: Weibull Models. John Wiley & Sons, Inc. (2004)
20. Fell, J. T. and Newton, J. M.: Determination of tablet strength by the diametrical –
compression test. J. Pharm. Sci. 59, 688-691.
21. Arnold, K.: Embedded Controller Hardware Design. LLH Technology Publishing.
(2000)
22. Johnson, D. E. and Moore, H. P.: A Handbook of Active Filters. Prentice-Hall Inc.
(1980)
23. Robinson, E.A. and Silvia, M.T.: Digital Dignal Processing and Time series Analysis.
Holden-Day Inc. 1978.
24. Simonyi, E: Digitális Szűrők. Műszaki Könyvkiadó Budapest 1984.
25. Zurell, K.: C Programming for Embedded Systems. R&D Books Lawrence. (2000)
26. Kernighan, B. W., Ritchie, D.: The C Programming Language Prentice-Hall Inc.
(1978)
27. Barr, M.: Programming Embedded Systems in C and C++. O'Reilly (1999)
28. Stroustrup, B.: The C++ Programming Language. 3th Edition. Addison-Wesley Inc.
(1997)
29. Barabolak, R., Hoerman, K., Kroll, N. and Record, D. :Gum chewing profiles in the
U.S. population. Commun. Dent. Oral Epidemiol. 1991; 19:125-6.
30. Rider, J.N., Brunson, E.L., Chambliss, W.G., Cleary, R.W., Hikal, A.M., Rider, P.H.,
Walker, L.A., Wyandt, C.M. and Jones, A.B. Development and Evaluation of a Novel
Dissolution Apparatus for Medicated Chewing Gum Products. Pharm. Res. 1992; 9:
255–259.
31. Rassing M.R.: Chewing gum as a drug delivery system. Adv Drug Del Rev (1994);
13:89-21
32. Testa, E.S., U.S. Patent 1999;5:866,179
33. Kása, P., Bajdik J., Zsigmond Zs. and Pintye-Hódi K. Study of the compaction
behaviour and compressibility of binary mixtures of some pharmaceutical excipients
during direct compression. Chem. Eng. Process. (2009); 48:859-863.
48
34. Hódi K.: Korszerű vizsgáló módszerek alkalmazása a szilárd gyógyszerformák
fejlesztésében és minőségbiztosításában. DSC dissertation, Szeged, 2004
35. Crank, J.: The mathematics of diffusion. 2nd Edition.Oxford University Press (1975).
36. Korsmeyer, R.W., Gurny, R.,Doelker E.M., Buri P.and Peppas N.A.: Mechanism of
solute release from porous hydrophilic polymers. Int J Pharm. (1983).15:25-35
37. Peppas, N.A.: Analysis of Fickian and non-Fickian drug rlelase from polymers.
Pharm acta Helv. (1985) 60: 110-111
38. Yuasa, H., Nakano, T. and Kanaya, Y.: Int. J. Pharm., 178 (1999) 1.
39. Muskó, Zs., Pintye-Hódi, K., Szabó-Révész, P., Kása Jr, P., Erős I. and Deák, D.
Pharmazie, 55 (2000) 465.
40. Seppic brochure, Seppic INC. Paris 1994
41. Prafitt, K.: Martindale, the Complete Drug Reference, 34th Edition, Pharmaceutical
Press, London 1999, p.408.
42. Cartensen, J. T,: Solid Pharmacetics:Mechanical Properties and Rate Phenomena,
Academic Press, New York 1980, p. 184.
43. Ghebre-Sellassie, I.: Pharmacetical Pelletization Technology, pp. 1-15. Warner-
Lambert Morris Plains, New Jersey (1989)
44. Pintye-Hódi, K., Regdon Jr., G., Erős, I., Süvegh, I., Marek, T., Kéry, I. and Zelkó, R.
: Metolose–PEG interaction as seen by positron annihilation spectroscopy, Int. J.
Pharm. 2006, 313, 66-71
45. Bajdik, J. and Pintye-Hódi, K.: Study of deformation process of stored
polymethacrylate free films, Pharmazie, 2006, 61, 887-888
46. Hamedelniel E. I., Bajdik J. and Pintye-Hódi K.: Optimization of preparation of
matrix pellets containing ethylcellulose, Chem. Eng. Process. 2010, 49, 120-124
47. Sovány T., Kása P. jr. and Pintye-Hódi K.: Comparison of the halving of tablets
prepared with eccentric and rotary tablet presses, AAPS, 2009, 10, 430-436
Related publication of author
48. Kelemen, A., Szöllösi, A., Zsótér, A., Pintye-Hódi, K., Török, C. and Erős, I.:
Measurement of the swelling force of some sodium strach glycolate products with
new software. Hung. J. Ind. Chem. Vol. 30 pp. 73-76 (2002)
49
49. Bajdik, J., Pintye-Hódi, K., Novák, Cs., Kelemen A., Regdon Jr, G. and Erős. I,:
Indirect methods for determination of the protective effects of coating films on the
surface of crystals. J. Therm. Anal. Calorim., Vol 68 (2002) 613-627.
50. Muskó, Zs., Bajdik, J., Pintye-Hódi, K., Szabó-Révész, P., Kelemen, A. and Erős, I.:
Preparation of pellets containing theophylline. Pharm. Ind. 64. Nr.11. 1194-1198.
(2002).
51. Kása Jr, P., Jójárt, I., Kelemen, A. and Pintye-Hódi, K. (2011): Formulation study of
directly compressible chewable polymers containing ascorbic acid. Pharm. Dev.
Tech. (DOI: 10.3109/10837450.2011.646426) IF: 1,107

Acknowledgements
I am very grateful to my supervisor
Professor Dr. Klára Pintye-Hódi
for her support. I greatly appreciate her continuous help during the preparation of my
thesis and for providing the excellent facilities for this study. I owe my warm
gratitude to her for criticism, encouragement and numerous discussions during my
Ph.D. work.
I would like to thank
Professor Dr. Erős István
Head of the Ph.D. programme Pharmaceutical Technology for providing me with the
possibility to complete my work.
My warmest thanks go to Professor Dr. Piroska Szabó-Révész, present Head of the
Department of Pharmaceutical Technology for her support.
I express my kindest thanks to all my co-authors for their collaboration in this work.
I thank all members of the department for their help and friendship.
I owe my thanks to my family for their support, encouragement and understanding
attitude during these years.

ANNEX
Related articles

I.
12345678910111213141516171819202122232425262728293031323334353637383940414243444546474849505152535455565758
5960616263646566676869707172737475767778798081828384858687888990919293949596979899
100101102103104105106107108109
110111112113114115116
1
Introduction
Chewing gum has been used world-wide since ancient times when man experienced the pleasure of chewing a variety of gum-like substances, such as tree resins, leaves, waxes and animal skins.
The dosage form or delivery system is critical for the success of a pharmaceutical or a food product. Today, chewing gum is undergoing new consideration as a drug delivery system; it provides patient benefit and compli-ance, and has new competitive advantages from the technological and marketing aspects. Medicated chewing gums are solid, single-dose preparations that have to be chewed but not swallowed. Chewing gums contain one or more active pharmaceutical ingredients (APIs) that are released by chewing (Ph.Eur.).[1] A medicated chew-ing gum is intended to be chewed for a certain period of time, required to deliver the dose, after which the remain-ing mass is discarded.[2, 3] During the chewing process, the drug contained in the gum product is released from the mass into the saliva and can be absorbed through the oral mucosa or swallowed, reaching the stomach for gas-trointestinal absorption.
Chewing gum consists basically of a neutral and taste-less masticatory gumbase and several non-masticatory
ingredients, such as fillers, softeners, sweeteners, favoring and texture regulating agents.[1, 4] The gum bases currently used are mostly of synthetic origin and comprised of elasto-mers, resins, waxes, fats and emulsifiers. The elastomers are styrene–butadiene copolymers mixed with polyisobutene. The addition of rosin esters and polyvinyl acetate improves the texture, allows longer-lasting flavor and reduces the ten-dency of the gum to stick to the teeth. Other agents, such as glycerol monostearate and lecithin, act as emulsifiers and promote the uptake of saliva during chewing.[5]
Powdered sugar and corn syrup were originally used as bulk sweeteners; nowadays, a mixture of sorbitol, xylitol, mannitol and aspartame is more commonly used in sug-ar-free, non-cariogenic gums and medicinal products.[6]
Unfortunately, the thermal instability of many active ingredients (vitamins, vegetable extracts, etc.) precludes traditional chewing gum production methods because the temperature profiles associated with this type of pro-duction may reach 90°C.[7]
Recently, chewing gums produced by direct compres-sion have been proposed.[8] With this conventional tablet compression technology, these chewing gums can include higher levels of active ingredients than in traditional extruded gums; the lower temperature protects sensitive
RESEARCH ARTICLE
Formulation study of directly compressible chewable polymers containing ascorbic acid
P. Kása1, I. Jójárt1, A. Kelemen2, and K. Pintye-Hódi1
1Department of Pharmaceutical Technology and 2Department of Applied Informatics, University of Szeged, Szeged, Hungary
AbstractThe topic of this article is the compression physics of different gum bases which can be used to prepare chewing gum tablets by direct compression. Three different gum bases, Pharmagum® C, M and S, were tested alone and in different combinations. The preparations were compressed with a Korsch EK0 eccentric tableting machine at compression forces of 5, 7.5, 10, 12.5 and 15 kN. The compression and breaking processes and the physical parameters of the tablets were investigated. The results revealed that increase of the compression force did not significantly change the studied parameters of the tablets.
Keywords: Chewing gum, direct compression, deformation, dissolution, Pharmagum, ascorbic acid
Address for Correspondence: Prof. Klára Pintye-Hódi, Department of Pharmaceutical Technology, University of Szeged, H-6720 Szeged, Eötvös u. 6, Hungary. Tel: +36/62545576. Fax: +36/62545571. E-mail: [email protected]
(Received 21 October 2011; revised 29 November 2011; accepted 29 November 2011)
Pharmaceutical Development and Technology, 2012; 00(00): 000–000© 2012 Informa Healthcare USA, Inc.ISSN 1083-7450 print/ISSN 1097-9867 onlineDOI: 10.3109/10837450.2011.646426
Pharmaceutical Development and Technology
2012
00
00
000
000
21 October 2011
29 November 2011
29 November 2011
1083-7450
1097-9867
© 2012 Informa Healthcare USA, Inc.
10.3109/10837450.2011.646426
LPDT
646426
12345678910111213141516171819202122232425262728293031323334353637383940414243444546474849505152535455565758
5960616263646566676869707172737475767778798081828384858687888990919293949596979899100101102103104105106107108109110111112113114115116
2 P. Kása et al.
Pharmaceutical Development and Technology
bioactive and phytochemical components and the lower moisture content improves the shelf-life of active molecules. However, the most common drawback in direct compres-sion of the gum base is that it sticks to the punches of the tableting equipment. This is due to the adhesive nature of the gum, the main component of the formulation; for this reason, the procedure is difficult and needs a lower pro-duction speed and cooling operations in order to prevent tableting machine damage. The tableting tools are kept at temperatures below 18°C; however, it should be noted that the temperature should not be so low as to interfere with the handling of the medicated gums and the tableting process. Thus, the temperature should be above 10–12°C.
For investigation of the dissolution of active pharma-ceutical ingredients (API’s) from medicated chewing gum tablets, different apparatuses have been developed. The chewing equipment applied was developed by Erweka GmbH, and described by Kvist et al.[9] Further descrip-tions of dissolution and chewing gum tablet investiga-tions have been reported by Azarmi et al.[10]
The objective of this work was to study the compression and breaking processes of different gum bases at room temperature by a direct compression technique with con-ventional pharmaceutical equipment efficiently providing the product, and to investigate the dissolution of an API.
Materials and methods
MaterialsAscorbic acid was used as model material (Ph. Eur.). Pharmagum C, M and S (gifts from SPI Pharma) were used as gum bases. Pharmagum M has a 50% greater gum base than Pharmagum S, which consists primarily of gum base and sorbitol. Pharmagum M contains gum base, mannitol and isomalt.
According to the manufacturer data, Pharmagum S is suitable for formulations with low drug loading and when incorporated into tablets gives them chewable character. Pharmagum M is suggested for medium drug loading (<50%); it improves the mouthfeel texture. Pharmagum C is suggested for high drug loading (>50%); it has a real chewing gum character.
Pharmagum mixtures were prepared in different ratios to study the compactness and deformability (Table 1). Compactness means the permanent bindings which are formed during loading and deformability refers to the shape modification of the particles during loading. Besides ascorbic acid as API, additional components of the mixtures were xylitol (frequently used in tablets as a sweetener), magnesium stearate (as a lubricant) and aroma (to give the tablets a better smell).
Methods
TabletingThe tablets were prepared with a Korsch EK0 eccentric tableting machine, E. Korsch Maschinenfabrik, Germany. The compression tools were flat-faced, bevel-edged punches 10 mm in diameter and equipped with strain gauges and a
displacement transducer. The strain gauges allowed the pres-sure forces on the upper and lower punches to be followed with force-measuring equipment, which was calibrated with a Wazau HM-HN-30kN-D cell (Kaliber Ltd., Budapest, Hungary). The displacement transducer (Micropulse, BTL5-A11-M0050-P-532, Balluff, Neuhausen/Filder, Germany) was fitted over the upper punch. The transducer distance accuracy was checked by using five measuring pieces of dif-ferent accurately known thicknesses (2.0, 5.0, 7.5, 10.0 and 15.0 mm) under zero load (Mitutoyo, Tokyo, Japan). The compression was carried out electrically at 36 rpm, at an air temperature of 24°C and at a relative air humidity of 45%. The average mass of the tablets was 0.47 ± 0.01 g. Ten tablets were compressed at compression forces of 5, 7.5, 10, 12.5 and 15 kN for each sample (when possible). Lots with rela-tive standard deviations not exceeding 5% were accepted.
The force–displacement curves were plotted, and the compression parameters − effective work (E
2), elastic
recovery (E3) and plasticity (P
l) − were calculated from
the curves with our own software Kása et al.[11]
The E1, E
2 and E
3 energies are calculated by the follow-
ing equations:
EF C
E E1 2 32= − +max ( ) (1)
E F ds EA
B
2 3= −∫ upper (2)
E F dsB
D
3 = ∫ upper (3)
whereF
max = maximum force during compressing; C = dis-
placement; Fupper
= maximum force measured on the upper punch; ds = elemental value of the displacement.
The plasticity was calculated with the formula: Pl = E2 / E2 + E3.
Table 1. Compositions of powder mixtures. Pharmagum (%) C M SS 1 60 40 S 2 50 50 S 3 40 60 S 4 60 40S 5 50 50S 6 40 60S 7 60 40S 8 50 50S 9 40 60
The amounts of the following materials were the same in all cases (%)Ascorbic acid 8.33 Xylitol 7.68 Aroma 0.33 Magnesium stearate 2 API concentration: 33 mg/tablet.Average tablet weight: 0.47 g.
12345678910111213141516171819202122232425262728293031323334353637383940414243444546474849505152535455565758
5960616263646566676869707172737475767778798081828384858687888990919293949596979899100101102103104105106107108109110111112113114115116
Directly compressible chewable polymers 3
© 2012 Informa Healthcare USA, Inc.
The real force–displacement diagram can be seen in Figure 1. (S1 sample) where E
1 = 44.58%, E
2 = 46.22% and
E3 = 9.21%.
Friability testThe friability of the chewing gum tablets was tested with an Erweka TA 100 friabilator (Erweka GmbH, Heusenstamm, Germany).
Breaking strengthThe breaking strength was tested with a self-developed tablet hardness tester, which is connected to a computer and a special software is applied to edit the force–time diagram.
Technical parameters of the hardness tester:Range of measurement: 0–200 N•Rate of pressing jaw: 20 mm/min•Registration output: 0–500 mV•Force sensor: Unicell load cell (MIKI) 200 N•
Preparation of mixturesThe mixtures of two of the Pharmagum materials in vari-ous ratios were prepared with a Turbula mixer (Willy A
Bachofen, Switzerland) at 50 rpm for 8 min, after which the other components were added, and mixing was con-tinued for a further 2 min (Table 2). The mass of each powder mixture was 200 g.
Dissolution testConventional tablet or capsule dissolution testers are not applicable for the investigation of chewing gum tablets because of the nature of the preparation. Solid oral dosage forms are generally swallowed and the API subsequently dissolves in various parts of the gastrointestinal tract. Chewing gum tablets are usually not swallowed but mas-ticated, and the API dissolves in a very small amount of dissolution medium. The effective material does not come into direct contact with the stomach, but must dissolve in the saliva. After dissolution, the saliva is swallowed and only a diluted quantity of the API reaches the gastric juice.
For the dissolution tests, an Erweka chewing appara-tus was used.[9] Each chewing gum sample was chewed with this apparatus for 10, 20 or 30 min, in the presence of 20 of dissolution medium (purified water), after which the ascorbic acid content of the liquid was determined by spectrometry.
Figure 1. Recorded force–displacement diagram of S1 sample.
Table 2. Powder rheological test.
Material of the
funnel Flowing time (s)Agitation speed
(r/min) Angle of slope (°)Heap volume
(ml) Heap mass (g)Ascorb. acid T 12.3 25 33.1 85.6 77.8Phg C T/M – – – – –Phg M T/M – – – – –Phg S T 7.5 25 26.2 64.4 56.6S 1 M 12.3 10 29.3 73.4 58.8S 2 M 10.3 10 29.4 73.9 59.7S 3 M 10.0 10 29.8 75.0 58.8S 4 M 7.6 5 26.6 65.6 66.9S 5 M 7.3 10 27.5 68.2 67.8S 6 M 7.4 10 28.3 70.6 65.5S 7 M 8.3 10 29.1 73.0 66.4S 8 M 8.4 10 28.4 70.9 68.6S 9 M 8.1 10 28.1 71.5 69.3M, metal; T, teflon.− = not measurable.
Table 3. Compressionability of the mixtures. B.d. g/cm3 T.d. g/cm3 C.i. % Tr.d. g/cm3
S 1 0.59 0.64 8.72 1.31S 2 0.58 0.64 10.00 1.31S 3 0.59 0.64 7.95 1.32S 4 0.68 0.74 8.46 1.33S 5 0.71 0.76 5.38 1.33S 6 0.70 0.74 4.88 1.33S 7 0.70 0.73 4.61 1.32S 8 0.70 0.75 5.90 1.33S 9 0.72 0.77 6.41 1.33B.d., bulk density; C.i., Carr’s index; T.d., tapped density; Tr.d., true density.
12345678910111213141516171819202122232425262728293031323334353637383940414243444546474849505152535455565758
5960616263646566676869707172737475767778798081828384858687888990919293949596979899100101102103104105106107108109110111112113114115116
4 P. Kása et al.
Pharmaceutical Development and Technology
Results and discussion
The tests on the flow properties of the bulk gum samples showed that Pharmagum C and M could not flow out from either a teflon or a metal funnel, in spite of the agitation of the powder. Pharmagum S displayed good flowability from a teflon funnel on mixing at 25 rpm (Table 3). The API flowed from a teflon funnel on agitation at 25 rpm.
The compaction tests on the bulk materials resulted in every case in high elastic recovery (Table 4). As con-cerns tablettability, the flowability and compactness can be important properties. Solid bridges formed during compression phase can be broken in the elastic recovery phase. In the tablet compositions, therefore the bulk gum powders were mixed with the other components in dif-ferent ratios (Table 1).
Table 4. Effect of compression force on elasticity and friction for bulk gum bases.Sample F
upper (kN) FW (J) E
3 (J)
Gum C 5 0.022 0.4310 0.037 1.3515 0.047 3.61
Gum M 5 0.003 0.2510 0.013 1.2415 0.066 2.90
Gum S 5 0.100 0.4910 0.138 1.1215 0.162 3.91
FW shows the work which arises during the tablet ejection.E
3 shows the elastic recovery.
Figure 2. Relationship between the Pressure force and Elastic recovery. (See colour version of this figure online at www.informahealthcare.com/phd)
Table 5. Relationship between compositions and E3 areas.
Sample
Compositions (Gum base) E
3 (J) Compression forces (kN)
C M S 5 7.5 10 12.5 15S 1 60 40 – 0.48 1.07 1.69 2.51 3.36
S 2 50 50 – 0.42 1.10 1.76 2.16 2.59S 3 40 60 – 0.36 0.98 1.56 2.04 2.60S 4 60 – 40 0.70 1.30 1.84 2.30 2.72S 5 50 – 50 0.62 1.07 1.52 2.26 2.89S 6 40 – 60 0.67 1.05 1.49 2.19 3.05S 7 – 60 40 0.56 1.03 1.55 2.36 3.01S 8 – 50 50 0.61 1.05 1.55 2.27 3.02S 9 – 40 60 0.58 1.06 1.56 2.29 3.02
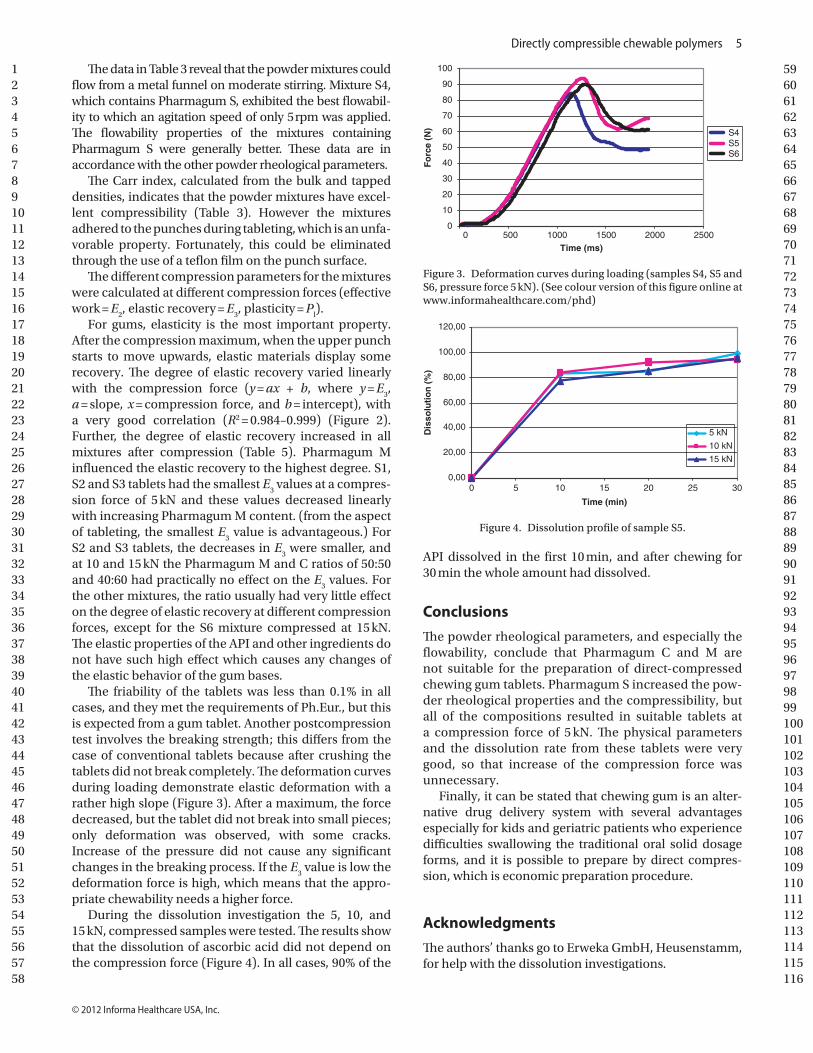
12345678910111213141516171819202122232425262728293031323334353637383940414243444546474849505152535455565758
5960616263646566676869707172737475767778798081828384858687888990919293949596979899100101102103104105106107108109110111112113114115116
Directly compressible chewable polymers 5
© 2012 Informa Healthcare USA, Inc.
The data in Table 3 reveal that the powder mixtures could flow from a metal funnel on moderate stirring. Mixture S4, which contains Pharmagum S, exhibited the best flowabil-ity to which an agitation speed of only 5 rpm was applied. The flowability properties of the mixtures containing Pharmagum S were generally better. These data are in accordance with the other powder rheological parameters.
The Carr index, calculated from the bulk and tapped densities, indicates that the powder mixtures have excel-lent compressibility (Table 3). However the mixtures adhered to the punches during tableting, which is an unfa-vorable property. Fortunately, this could be eliminated through the use of a teflon film on the punch surface.
The different compression parameters for the mixtures were calculated at different compression forces (effective work = E
2, elastic recovery = E
3, plasticity = P
l).
For gums, elasticity is the most important property. After the compression maximum, when the upper punch starts to move upwards, elastic materials display some recovery. The degree of elastic recovery varied linearly with the compression force (y = ax + b, where y = E
3,
a = slope, x = compression force, and b = intercept), with a very good correlation (R2 = 0.984–0.999) (Figure 2). Further, the degree of elastic recovery increased in all mixtures after compression (Table 5). Pharmagum M influenced the elastic recovery to the highest degree. S1, S2 and S3 tablets had the smallest E
3 values at a compres-
sion force of 5 kN and these values decreased linearly with increasing Pharmagum M content. (from the aspect of tableting, the smallest E
3 value is advantageous.) For
S2 and S3 tablets, the decreases in E3 were smaller, and
at 10 and 15 kN the Pharmagum M and C ratios of 50:50 and 40:60 had practically no effect on the E
3 values. For
the other mixtures, the ratio usually had very little effect on the degree of elastic recovery at different compression forces, except for the S6 mixture compressed at 15 kN. The elastic properties of the API and other ingredients do not have such high effect which causes any changes of the elastic behavior of the gum bases.
The friability of the tablets was less than 0.1% in all cases, and they met the requirements of Ph.Eur., but this is expected from a gum tablet. Another postcompression test involves the breaking strength; this differs from the case of conventional tablets because after crushing the tablets did not break completely. The deformation curves during loading demonstrate elastic deformation with a rather high slope (Figure 3). After a maximum, the force decreased, but the tablet did not break into small pieces; only deformation was observed, with some cracks. Increase of the pressure did not cause any significant changes in the breaking process. If the E
3 value is low the
deformation force is high, which means that the appro-priate chewability needs a higher force.
During the dissolution investigation the 5, 10, and 15 kN, compressed samples were tested. The results show that the dissolution of ascorbic acid did not depend on the compression force (Figure 4). In all cases, 90% of the
API dissolved in the first 10 min, and after chewing for 30 min the whole amount had dissolved.
Conclusions
The powder rheological parameters, and especially the flowability, conclude that Pharmagum C and M are not suitable for the preparation of direct-compressed chewing gum tablets. Pharmagum S increased the pow-der rheological properties and the compressibility, but all of the compositions resulted in suitable tablets at a compression force of 5 kN. The physical parameters and the dissolution rate from these tablets were very good, so that increase of the compression force was unnecessary.
Finally, it can be stated that chewing gum is an alter-native drug delivery system with several advantages especially for kids and geriatric patients who experience difficulties swallowing the traditional oral solid dosage forms, and it is possible to prepare by direct compres-sion, which is economic preparation procedure.
Acknowledgments
The authors’ thanks go to Erweka GmbH, Heusenstamm, for help with the dissolution investigations.
0
10
20
30
40
50
60
70
80
90
100
0 500 1000 1500 2000 2500
Time (ms)
Fo
rce
(N) S4
S5S6
Figure 3. Deformation curves during loading (samples S4, S5 and S6, pressure force 5 kN). (See colour version of this figure online at www.informahealthcare.com/phd)
0,00
20,00
40,00
60,00
80,00
100,00
120,00
0 5 10 15 20 25 30
Time (min)
Dis
solu
tio
n (
%)
5 kN
10 kN
15 kN
Figure 4. Dissolution profile of sample S5.
12345678910111213141516171819202122232425262728293031323334353637383940414243444546474849505152535455565758
5960616263646566676869707172737475767778798081828384858687888990919293949596979899100101102103104105106107108109110111112113114115116
6 P. Kása et al.
Pharmaceutical Development and Technology
Declaration of interest
The project named TÁMOP-4.2.1/B-09/1/Konv-2010-0005− Creating the Center of Excellence at the University of Szeged” is supported by the European Union and co-financed by the European Regional Fund.
References 1. Barabolak R, Hoerman K, Kroll B, Record D. Gum chewing
profiles in the U.S. population. Community Dent Oral Epidemiol 1991;19:125–126.
2. Rider JN, Brunson EL, Chambliss WG, Cleary RW, Hikal AH, Rider PH et al. Development and evaluation of a novel dissolution apparatus for medicated chewing gum products. Pharm Res 1992;9:255–259.
3. Rassing MR. Chewing gum as a drug delivery system. Adv Drug Del Rev 1994;13:89–121.
4. Eisenstadt B, Cash PA, Bakal AI. US Patent 1998;5:846,557.
5. Pedersen M, Rassing MR. Chewing gum as a drug delivery system for nystatin influence of solubilising agents upon the release of water insoluble drugs. Drug Dev Ind Pharm 1990;16: 2015–2030.
6. Rowe RC. By gum–a buccal delivery system. Drug Discov Today 2003;8:617–618.
7. Zyck DJ, Greenberg MJ, Barkalow DG, Marske SW, Schnell PG, Mazzone P, Witkewits DL. US Patent 1999;6:541,048.
8. Testa ES. US Patent 1999;5:866,179. 9. Kvist C, Andersson SB, Fors S, Wennergren B, Berglund J. Apparatus
for studying in vitro drug release from medicated chewing gums. Int J Pharm 1999;189:57–65.
10. Azarmi S, Roa W, Löbenberg R. Current perspectives in dissolution testing of conventional and novel dosage forms. Int J Pharm 2007;328:12–21.
11. Kása P, Bajdik J, Zsigmond ZS, Pintye-Hódi K. Study of the compaction behaviour and compressibility of binary mixtures of some pharmaceutical excipients during direct compression. Chem Eng Process 2009;48:859–863.

II.
Journal of Thermal Analysis and Calorimetry, Vol. 68 (2002) 613–627
INDIRECT METHODS FOR DETERMINATION OFTHE PROTECTIVE EFFECTS OF COATING FILMS ONTHE SURFACE OF CRYSTALS
J. Bajdik1, K. Pintye-Hódi1, Cs. Novák2, A. Kelemen3, G. Regdon Jr.1
and I. Erõs1
1Department of Pharmaceutical Technology, University of Szeged, Eötvös u. 6, H-6720 Szeged,Hungary2Research Group for Technical Analytical Chemistry of the Hungarian Academy of Sciences &Institute of General and Analytical Chemistry, Budapest University of Technology and Economics,Szent Gellért tér 4, H-1111 Budapest, Hungary3Department of Medical Informatics, University of Szeged, Korányi fasor 9, H-6720 Szeged,Hungary
Abstract
The extents of the protective effects of coating films on the surface of crystals were determined. Three
different samples were made with different quantities of coating fluid (Sepifilm LP 010 in 10% aque-
ous solution). Since the atomizing rate was constant, the coating time increased in parallel with the vol-
ume of coating fluid applied. The direct measurement of film thickness and smoothness is very diffi-
cult, and therefore indirect methods were used. Dimenhydrinate was chosen as model drug; this is a
heat-sensitive antihistamine with a low melting point. This temperature can be reached during the
tableting process. The behaviour of samples on exposure to heat was examined by differential scanning
calorimetry. The water uptakes of the samples were determined with an Enslin apparatus. Plasticity
was studied with an instrumented tablet machine. These indirect methods (thermal conductivity, water
uptake and plasticity measurements) revealed connections between the results of the various experi-
ments. An overlong coating time decreased the protective effect of the coating film.
Keywords: dimenhydrinate, DSC, film coating, HPMC, plasticity, thermal conductivity, water uptake
Introduction
Film coating is a method that is widely used for protection, retardation and identifica-
tion. Gastric-soluble polymers are used to protect ingredients from light, moisture
and oxygen, and for identification. Intestine-soluble polymers or permeable polymers
which provide drug diffusion are utilized for retardation [1]. Several types of gas-
tric-soluble films (cellulose derivatives, poly(methacrylates), poly(ethylene-glycols),
etc.) have been used for protection. The film smoothness and thickness determine the
protective effect of the coating film. These parameters are well measurable on the
surface of tablets or pellets by means of image analysis [2]. The film coating of fine
particles can be a useful procedure in tablet making but the sticking of these particles
1418–2874/2002/ $ 5.00
© 2002 Akadémiai Kiadó, Budapest
Akadémiai Kiadó, Budapest
Kluwer Academic Publishers, Dordrecht
disturbs the determination of film thickness. It is difficult to avoid this sticking effect
[3]. It is important to know whether the protective effect is modified or not by the
quantity of coating material applied. The film coating of fine crystals could possibly
be more widely used if the film smoothness and thickness can be determined.
Knowledge of the process of compression is very important in the technology of
tablet making. Compression during tableting is a complex and irreversible dynamic pro-
cess [4]. The behaviour of powders during such processes may be followed well with in-
strumented tablet machines or other indirect methods. Modern instrumented tablet ma-
chines measure the pre-compression and main compression forces on the upper and
lower punches, the punch displacements, the ejection force, etc. [5]. A number of meth-
ods can be used to study compressibility from different determined data [6–8].
The determination of temperature is very important because the melting points
of many organic materials are low, and are readily reached during the process of com-
pression, e.g. busulfan 115–118, hyoscyamine 106–109, phenylbutazone 104–107 or
dimenhydrinate 102–105°C [9]. It is well known that, if crystals are arranged side by
side with a high thermal conductivity axis, this promotes the attainment of a higher
temperature in a very small volume. This increased temperature can be higher than
the melting point of the material and accordingly the crystals melt. Since melted ma-
terials recrystallize after compression, the particles lose their individuality. Such sites
in the texture are called hot spots [10–12]. If a material decomposes at the melting
point, hot spots must be avoided. This problem can arise with hormones (betametha-
zone or spironolactone), carbohydrates, enzymes (pancreatin [13, 14]), etc.
Direct measurement of the heat originating in the texture of tablets during com-
pression is very difficult. Indirect methods such as ‘compaction calorimetry’ [15], or
differential scanning calorimetry (DSC) [16] (temperature modulated or conven-
tional) are used to learn the behaviour of materials exposed to compression and heat.
Indirect experiments demonstrated that the energy distribution and therefore the heat
produced in the texture are not even [17]. A thermoanalytical method (DSC) has been
used as an indirect method to establish the changes in material properties at elevated
temperature.
The water uptake (wetting) is also an important characteristic because it can in-
fluence the disintegration of tablets [18]. The bioavailability of a tablet therefore can
be influenced by methods which modify the water uptake.
The aim of this study was to determine the protective effect of films on the sur-
face of crystals. It was examined how the protective effect of a coating film is modi-
fied when the quantity of coating fluid is increased. The above-mentioned parameters
(thermal conductivity, water uptake and compressibilty) were examined with regard
to the prediction of the smoothness and thickness of films.
J. Therm. Anal. Cal., 68, 2002
614 BAJDIK et al.: FILM COATING
Experimental
Materials
The model drug used was dimenhydrinate (Ph. Eur. 3rd, B.No.:280-69-015), which is an
ethanolamine derivative antihistamine used for the treatment of motion sickness, nausea
and vomiting [19]. This material is sensitive to heat: it decomposes at the melting point,
as indicated by industrial experience and a previous study [16]. The drug is well absorbed
from the gastrointestinal tract. In the event of oral administration, the onset of the effect
occurs after about 15 min [20]. A gastric-soluble polymer was therefore used. The
film-forming agent was hydroxypropyl-methylcellulose (HPMC) (Sepifilm LP 010®,
B.No.: 80741) (Seppic, Paris, France). Sepifilm LP 010® was applied in a 10% aqueous
dispersion, containing binder, pigment and plasticizer [21].
Coating
A Strea-1 apparatus (Niro-Aeromatic AG., Switzerland) was applied with the top
spray method. The coating material was a 10% aqueous dispersion of Sepifilm LP
010®.
Parameters: nozzle diameter: 0.8 mm, inlet temperature: 45°C, outlet tempera-
ture: 30°C, blow-out pressure: 5.6 bar, atomizing pressure: 2 bar, peripump:
10 ml min–1, air volume: 30–40 m3 h–1, yield of the coating experiment: 75�80%.
Sample 1 (Dim 1) – A 40 g aqueous dispersion was used for 100 g dimen-
hydrinate.
Sample 2 (Dim 2) – A 55 g aqueous dispersion was used for 100 g dimen-
hydrinate.
Sample 3 (Dim 3) – A 70 g aqueous dispersion was used for 100 g dimen-
hydrinate.
The experiments were made three times.
Morphological study
Microscopy, and especially scanning electron microscopy (SEM), has been widely
used to test the shape and surface of particles. Modern SEM allows particles much
smaller in size than a micrometre to be measured and the roughness of the surface to
be observed. A Hitachi S 2400 (Hitachi Scientific Instruments Ltd., Tokyo, Japan)
scanning electron microscope was utilized. A sputter coating apparatus (Bio-Rad SC
502, VG Microtech, UK) was applied to induce electric conductivity on the surface of
the sample. The air pressure was 1.3–13 mPa.
Particle size distribution
A Laborlux S light microscope and a Quantimet 500 (Q500MC) image processing
and analysis system (Leica Cambridge Ltd., Cambridge, UK) were used. 500 parti-
cles were measured. Before the tests, the dimenhydrinate crystals were dispersed in
J. Therm. Anal. Cal., 68, 2002
BAJDIK et al.: FILM COATING 615
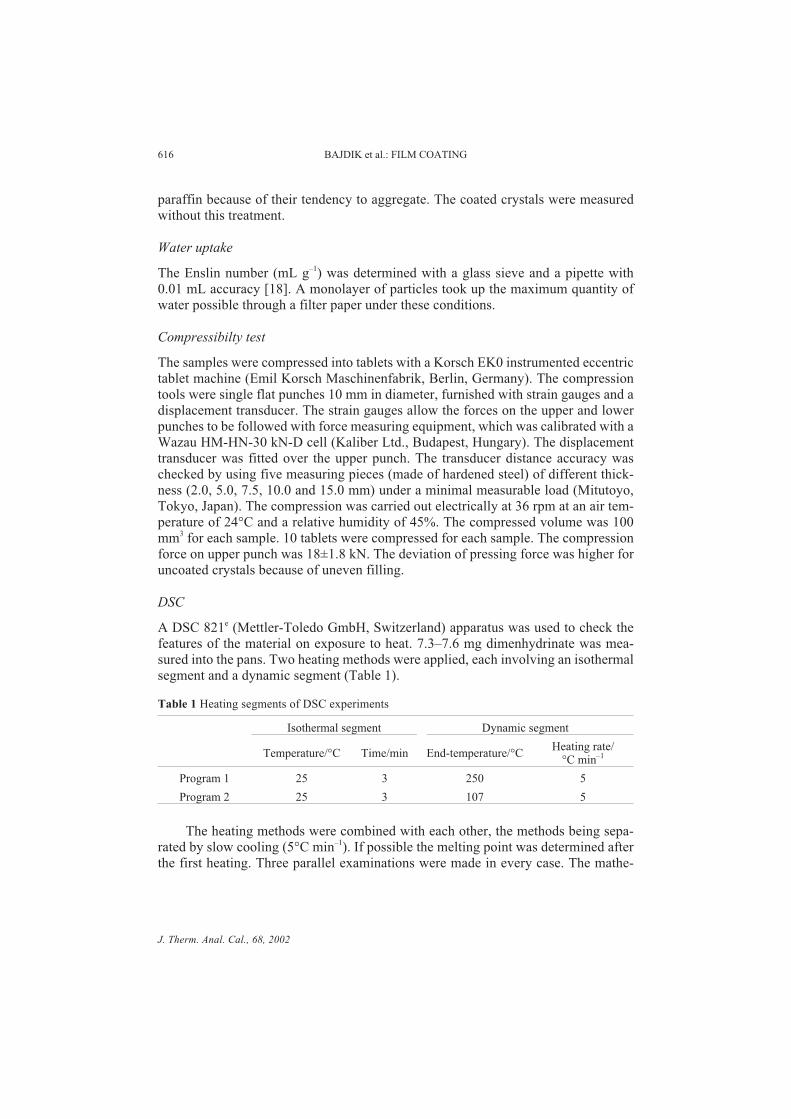
paraffin because of their tendency to aggregate. The coated crystals were measured
without this treatment.
Water uptake
The Enslin number (mL g–1) was determined with a glass sieve and a pipette with
0.01 mL accuracy [18]. A monolayer of particles took up the maximum quantity of
water possible through a filter paper under these conditions.
Compressibilty test
The samples were compressed into tablets with a Korsch EK0 instrumented eccentric
tablet machine (Emil Korsch Maschinenfabrik, Berlin, Germany). The compression
tools were single flat punches 10 mm in diameter, furnished with strain gauges and a
displacement transducer. The strain gauges allow the forces on the upper and lower
punches to be followed with force measuring equipment, which was calibrated with a
Wazau HM-HN-30 kN-D cell (Kaliber Ltd., Budapest, Hungary). The displacement
transducer was fitted over the upper punch. The transducer distance accuracy was
checked by using five measuring pieces (made of hardened steel) of different thick-
ness (2.0, 5.0, 7.5, 10.0 and 15.0 mm) under a minimal measurable load (Mitutoyo,
Tokyo, Japan). The compression was carried out electrically at 36 rpm at an air tem-
perature of 24°C and a relative humidity of 45%. The compressed volume was 100
mm3 for each sample. 10 tablets were compressed for each sample. The compression
force on upper punch was 18±1.8 kN. The deviation of pressing force was higher for
uncoated crystals because of uneven filling.
DSC
A DSC 821e (Mettler-Toledo GmbH, Switzerland) apparatus was used to check the
features of the material on exposure to heat. 7.3–7.6 mg dimenhydrinate was mea-
sured into the pans. Two heating methods were applied, each involving an isothermal
segment and a dynamic segment (Table 1).
Table 1 Heating segments of DSC experiments
Isothermal segment Dynamic segment
Temperature/°C Time/min End-temperature/°CHeating rate/
°C min–1
Program 1 25 3 250 5
Program 2 25 3 107 5
The heating methods were combined with each other, the methods being sepa-
rated by slow cooling (5°C min–1). If possible the melting point was determined after
the first heating. Three parallel examinations were made in every case. The mathe-
J. Therm. Anal. Cal., 68, 2002
616 BAJDIK et al.: FILM COATING
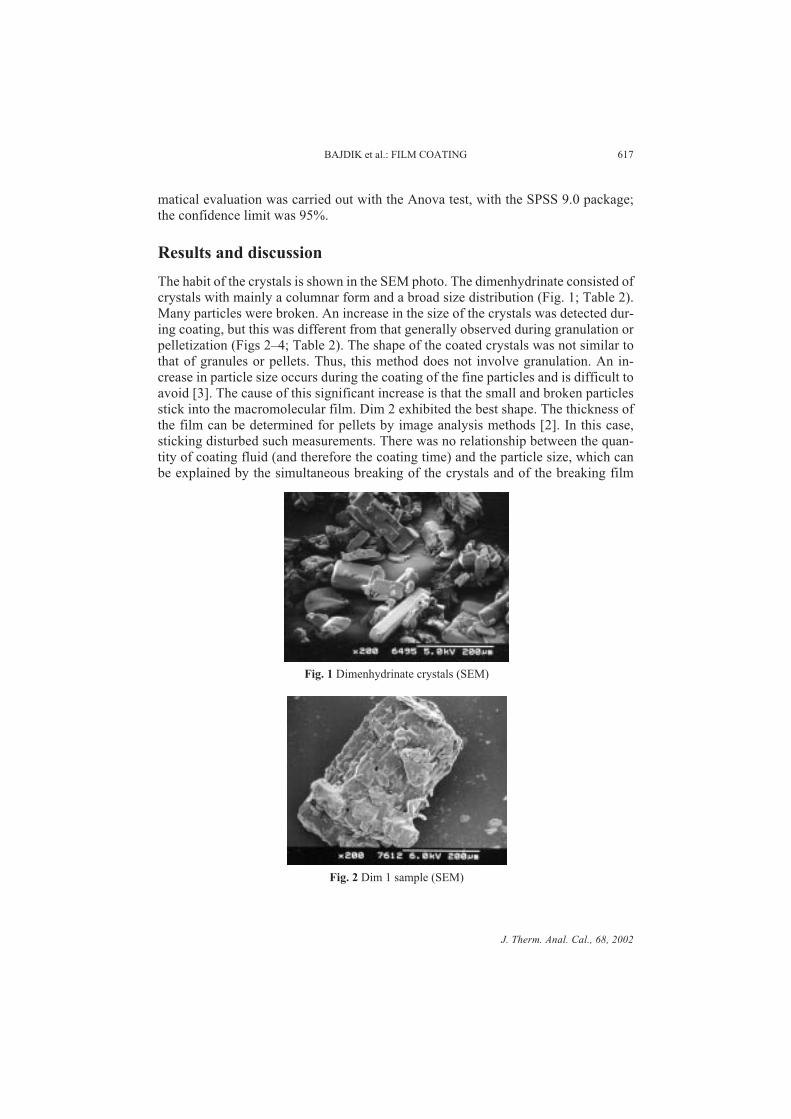
matical evaluation was carried out with the Anova test, with the SPSS 9.0 package;
the confidence limit was 95%.
Results and discussion
The habit of the crystals is shown in the SEM photo. The dimenhydrinate consisted of
crystals with mainly a columnar form and a broad size distribution (Fig. 1; Table 2).
Many particles were broken. An increase in the size of the crystals was detected dur-
ing coating, but this was different from that generally observed during granulation or
pelletization (Figs 2–4; Table 2). The shape of the coated crystals was not similar to
that of granules or pellets. Thus, this method does not involve granulation. An in-
crease in particle size occurs during the coating of the fine particles and is difficult to
avoid [3]. The cause of this significant increase is that the small and broken particles
stick into the macromolecular film. Dim 2 exhibited the best shape. The thickness of
the film can be determined for pellets by image analysis methods [2]. In this case,
sticking disturbed such measurements. There was no relationship between the quan-
tity of coating fluid (and therefore the coating time) and the particle size, which can
be explained by the simultaneous breaking of the crystals and of the breaking film
J. Therm. Anal. Cal., 68, 2002
BAJDIK et al.: FILM COATING 617
Fig. 1 Dimenhydrinate crystals (SEM)
Fig. 2 Dim 1 sample (SEM)
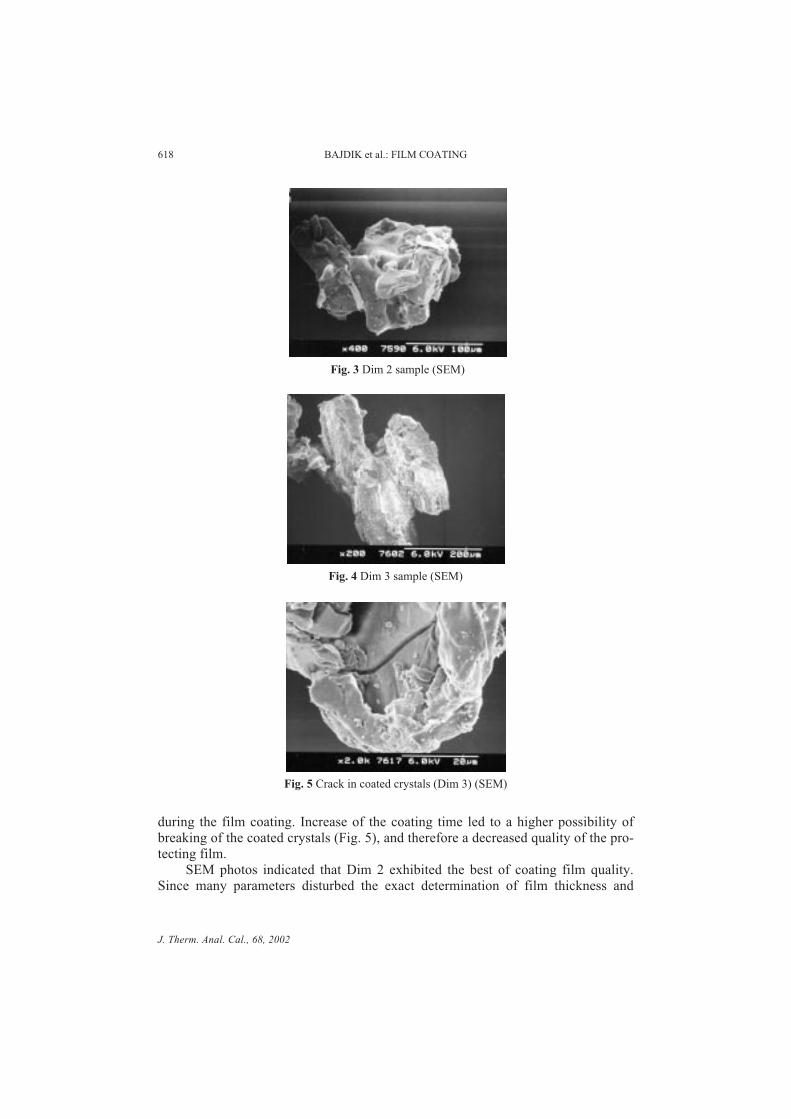
during the film coating. Increase of the coating time led to a higher possibility of
breaking of the coated crystals (Fig. 5), and therefore a decreased quality of the pro-
tecting film.
SEM photos indicated that Dim 2 exhibited the best of coating film quality.
Since many parameters disturbed the exact determination of film thickness and
J. Therm. Anal. Cal., 68, 2002
618 BAJDIK et al.: FILM COATING
Fig. 3 Dim 2 sample (SEM)
Fig. 4 Dim 3 sample (SEM)
Fig. 5 Crack in coated crystals (Dim 3) (SEM)
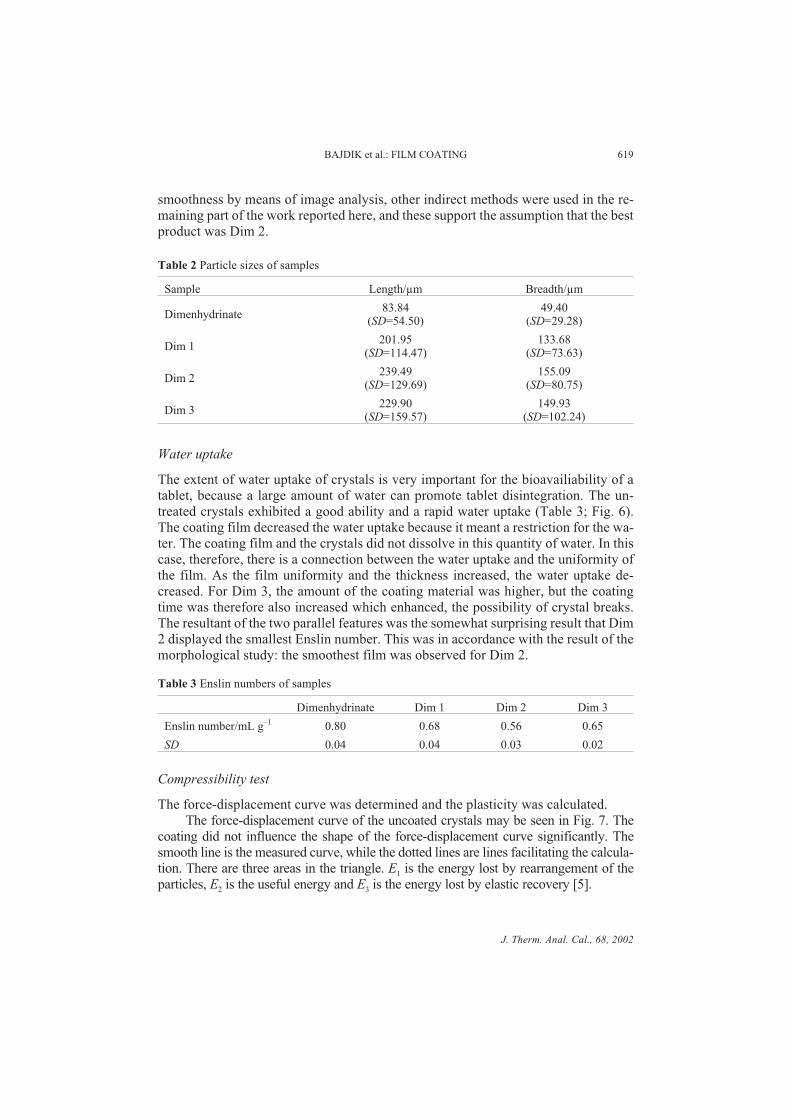
smoothness by means of image analysis, other indirect methods were used in the re-
maining part of the work reported here, and these support the assumption that the best
product was Dim 2.
Table 2 Particle sizes of samples
Sample Length/µm Breadth/µm
Dimenhydrinate83.84
(SD=54.50)49.40
(SD=29.28)
Dim 1201.95
(SD=114.47)133.68
(SD=73.63)
Dim 2239.49
(SD=129.69)155.09
(SD=80.75)
Dim 3229.90
(SD=159.57)149.93
(SD=102.24)
Water uptake
The extent of water uptake of crystals is very important for the bioavailiability of a
tablet, because a large amount of water can promote tablet disintegration. The un-
treated crystals exhibited a good ability and a rapid water uptake (Table 3; Fig. 6).
The coating film decreased the water uptake because it meant a restriction for the wa-
ter. The coating film and the crystals did not dissolve in this quantity of water. In this
case, therefore, there is a connection between the water uptake and the uniformity of
the film. As the film uniformity and the thickness increased, the water uptake de-
creased. For Dim 3, the amount of the coating material was higher, but the coating
time was therefore also increased which enhanced, the possibility of crystal breaks.
The resultant of the two parallel features was the somewhat surprising result that Dim
2 displayed the smallest Enslin number. This was in accordance with the result of the
morphological study: the smoothest film was observed for Dim 2.
Table 3 Enslin numbers of samples
Dimenhydrinate Dim 1 Dim 2 Dim 3
Enslin number/mL g–1 0.80 0.68 0.56 0.65
SD 0.04 0.04 0.03 0.02
Compressibility test
The force-displacement curve was determined and the plasticity was calculated.
The force-displacement curve of the uncoated crystals may be seen in Fig. 7. The
coating did not influence the shape of the force-displacement curve significantly. The
smooth line is the measured curve, while the dotted lines are lines facilitating the calcula-
tion. There are three areas in the triangle. E1 is the energy lost by rearrangement of the
particles, E2 is the useful energy and E3 is the energy lost by elastic recovery [5].
J. Therm. Anal. Cal., 68, 2002
BAJDIK et al.: FILM COATING 619
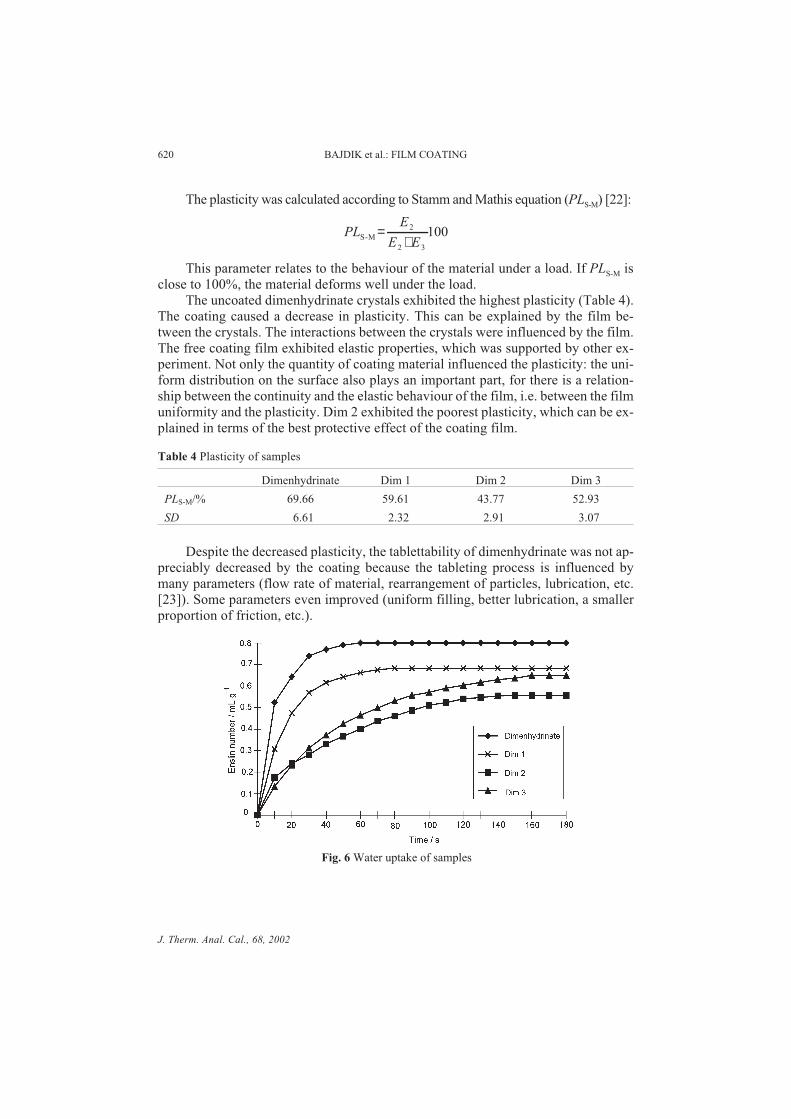
The plasticity was calculated according to Stamm and Mathis equation (PLS-M) [22]:
PLE
E ES-M
=+
2
2 3
100
This parameter relates to the behaviour of the material under a load. If PLS-M is
close to 100%, the material deforms well under the load.
The uncoated dimenhydrinate crystals exhibited the highest plasticity (Table 4).
The coating caused a decrease in plasticity. This can be explained by the film be-
tween the crystals. The interactions between the crystals were influenced by the film.
The free coating film exhibited elastic properties, which was supported by other ex-
periment. Not only the quantity of coating material influenced the plasticity: the uni-
form distribution on the surface also plays an important part, for there is a relation-
ship between the continuity and the elastic behaviour of the film, i.e. between the film
uniformity and the plasticity. Dim 2 exhibited the poorest plasticity, which can be ex-
plained in terms of the best protective effect of the coating film.
Table 4 Plasticity of samples
Dimenhydrinate Dim 1 Dim 2 Dim 3
PLS-M/% 69.66 59.61 43.77 52.93
SD 6.61 2.32 2.91 3.07
Despite the decreased plasticity, the tablettability of dimenhydrinate was not ap-
preciably decreased by the coating because the tableting process is influenced by
many parameters (flow rate of material, rearrangement of particles, lubrication, etc.
[23]). Some parameters even improved (uniform filling, better lubrication, a smaller
proportion of friction, etc.).
J. Therm. Anal. Cal., 68, 2002
620 BAJDIK et al.: FILM COATING
Fig. 6 Water uptake of samples
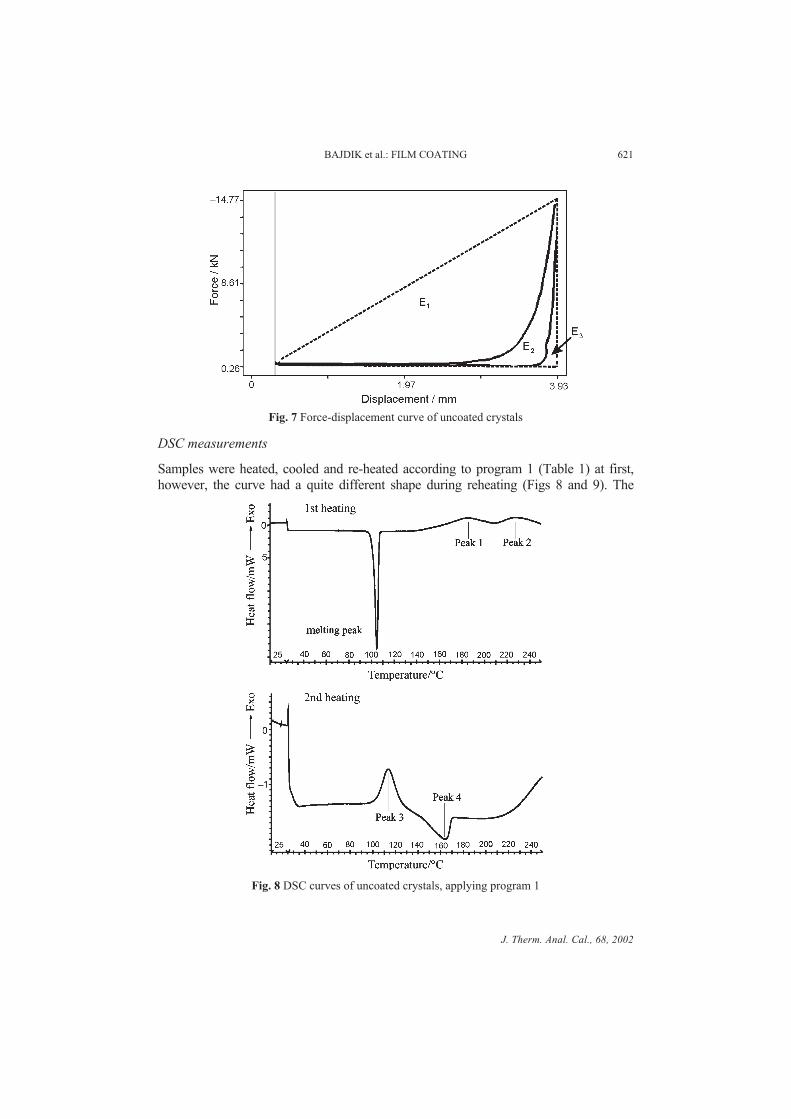
DSC measurements
Samples were heated, cooled and re-heated according to program 1 (Table 1) at first,
however, the curve had a quite different shape during reheating (Figs 8 and 9). The
J. Therm. Anal. Cal., 68, 2002
BAJDIK et al.: FILM COATING 621
Fig. 7 Force-displacement curve of uncoated crystals
Fig. 8 DSC curves of uncoated crystals, applying program 1
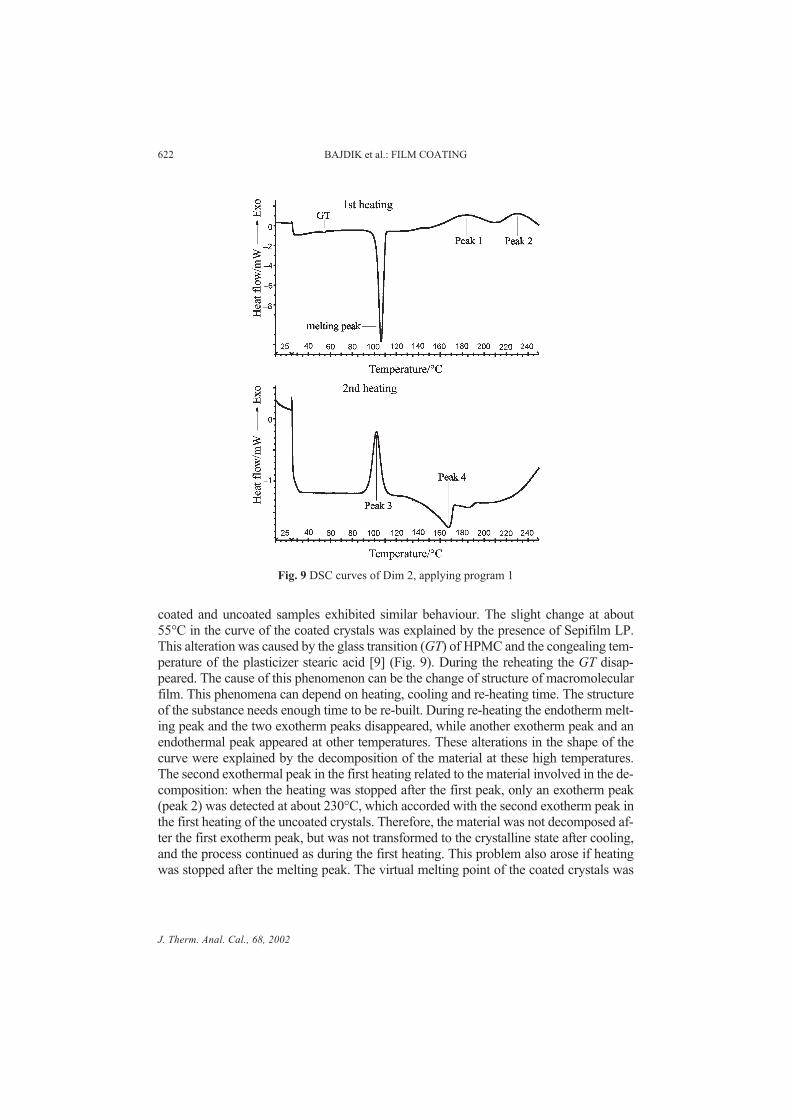
coated and uncoated samples exhibited similar behaviour. The slight change at about
55°C in the curve of the coated crystals was explained by the presence of Sepifilm LP.
This alteration was caused by the glass transition (GT) of HPMC and the congealing tem-
perature of the plasticizer stearic acid [9] (Fig. 9). During the reheating the GT disap-
peared. The cause of this phenomenon can be the change of structure of macromolecular
film. This phenomena can depend on heating, cooling and re-heating time. The structure
of the substance needs enough time to be re-built. During re-heating the endotherm melt-
ing peak and the two exotherm peaks disappeared, while another exotherm peak and an
endothermal peak appeared at other temperatures. These alterations in the shape of the
curve were explained by the decomposition of the material at these high temperatures.
The second exothermal peak in the first heating related to the material involved in the de-
composition: when the heating was stopped after the first peak, only an exotherm peak
(peak 2) was detected at about 230°C, which accorded with the second exotherm peak in
the first heating of the uncoated crystals. Therefore, the material was not decomposed af-
ter the first exotherm peak, but was not transformed to the crystalline state after cooling,
and the process continued as during the first heating. This problem also arose if heating
was stopped after the melting peak. The virtual melting point of the coated crystals was
J. Therm. Anal. Cal., 68, 2002
622 BAJDIK et al.: FILM COATING
Fig. 9 DSC curves of Dim 2, applying program 1

higher; this could be caused by reduction of the thermal conductivity of the crystals by a
macromolecular film (Table 5).
Table 5 Virtual melting points of samples, applying program 1
Dimenhydrinate Dim 1 Dim 2 Dim 3
Melting point/°C 103.35 105.24 105.98 105.44
SD 0.65 0.50 0.66 0.56
Applying program 2, heating was interrupted during the rising part of the
endotherm melting peak (Table 1) and, after cooling, the effect of heating to 250°C
was examined (Figs 10 and 11). The melting peak in the first period was not evalu-
ated statistically, because the peak was not complete. There was no significant differ-
ence in the melting point in the second heating period (Table 6). There was a differ-
ence in the shapes of the curves on re-heating. A lower melting enthalpy value has
been obtained during the second heating for the melting of uncoated crystals than for
the coated samples. The change was significant (p<0.05) (Table 7). This alteration
was explained by the differing thermal conductivities of the crystals. Since a thin
macromolecular film separates the coated crystals, this can impede the transport of
the heat from crystals to crystals. As the time of heat transport above the melting
point was short (about 20 s) and the heat transport was restricted, a smaller fraction of
the dimenhydrinate decomposed than in the case of the uncoated crystals. This differ-
ence was observed if exactly the same mass of crystals was measured. The more the
active ingredient remaining in the given volume, higher melting enthalpies have been
calculated. In the remainder of this paper the values of heat of fusion will be com-
pared with regarded to the result of water uptake and the plasticity of the material.
Table 6 Virtual melting points of samples in re-heating part, applying program 2
Dimenhydrinate Dim 1 Dim 2 Dim 3
Melting peak/°C 104.20 104.50 104.89 104.84
SD 0.37 0.11 0.09 0.41
Table 7 Comparison of heat of fusion of melting peaks in re-heating parts, applying program 2
Dimenhydrinate Dim 1 Dim 2 Dim 3
Heat of fusion/J g–1 3.51 9.78 25.45 9.76
SD 4.72 3.83 10.62 1.77
Comparative studies
The different indirect methods of determining the protective effect of the film were
compared mathematically by linear regression (the t-test was significant (p<0.05)).
J. Therm. Anal. Cal., 68, 2002
BAJDIK et al.: FILM COATING 623
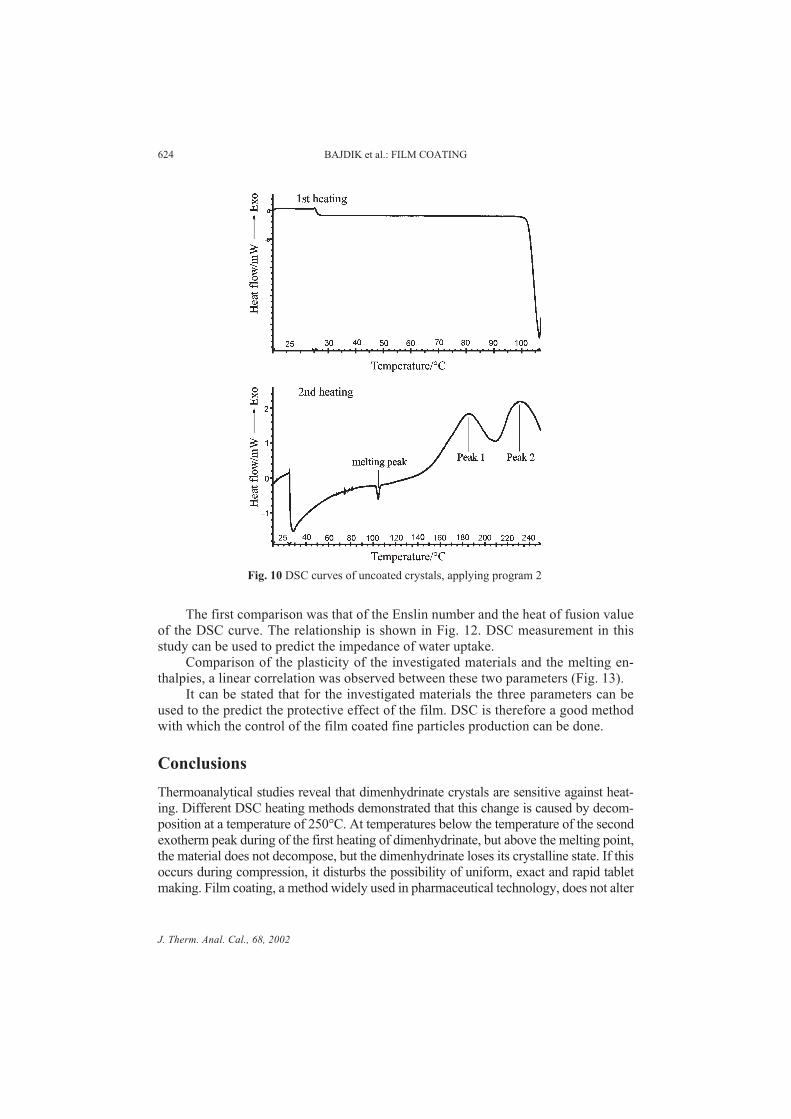
The first comparison was that of the Enslin number and the heat of fusion value
of the DSC curve. The relationship is shown in Fig. 12. DSC measurement in this
study can be used to predict the impedance of water uptake.
Comparison of the plasticity of the investigated materials and the melting en-
thalpies, a linear correlation was observed between these two parameters (Fig. 13).
It can be stated that for the investigated materials the three parameters can be
used to the predict the protective effect of the film. DSC is therefore a good method
with which the control of the film coated fine particles production can be done.
Conclusions
Thermoanalytical studies reveal that dimenhydrinate crystals are sensitive against heat-
ing. Different DSC heating methods demonstrated that this change is caused by decom-
position at a temperature of 250°C. At temperatures below the temperature of the second
exotherm peak during of the first heating of dimenhydrinate, but above the melting point,
the material does not decompose, but the dimenhydrinate loses its crystalline state. If this
occurs during compression, it disturbs the possibility of uniform, exact and rapid tablet
making. Film coating, a method widely used in pharmaceutical technology, does not alter
J. Therm. Anal. Cal., 68, 2002
624 BAJDIK et al.: FILM COATING
Fig. 10 DSC curves of uncoated crystals, applying program 2
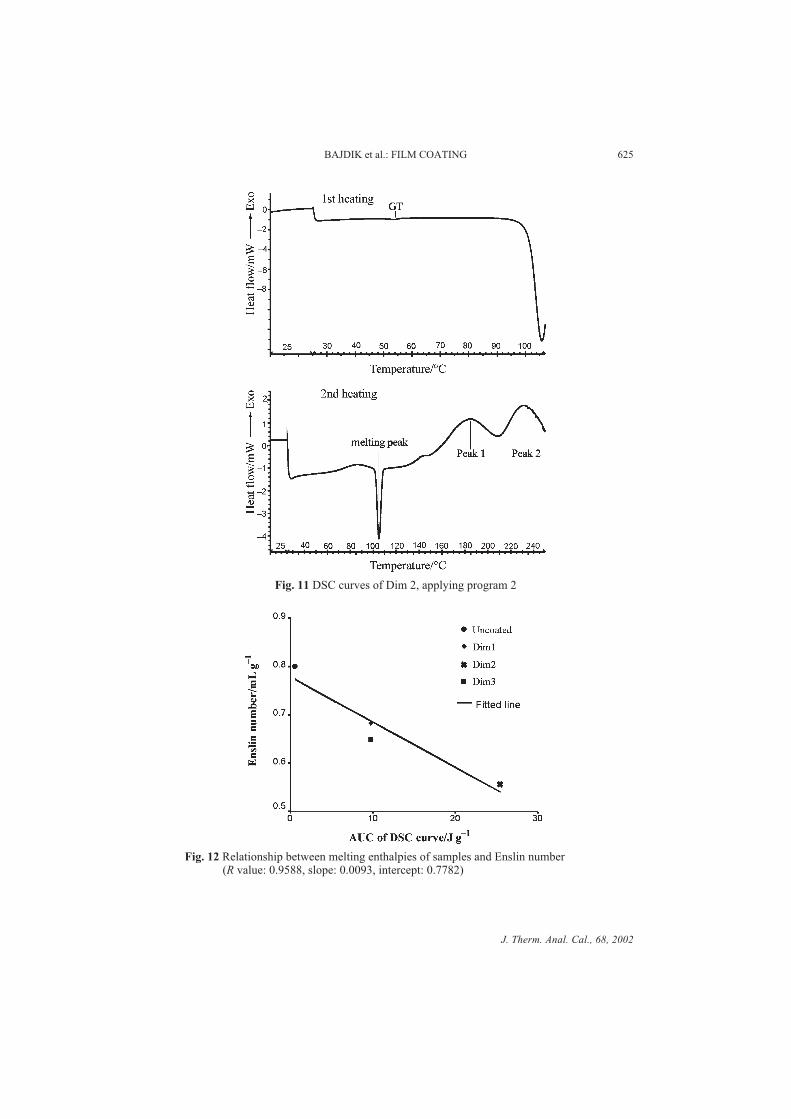
J. Therm. Anal. Cal., 68, 2002
BAJDIK et al.: FILM COATING 625
Fig. 11 DSC curves of Dim 2, applying program 2
Fig. 12 Relationship between melting enthalpies of samples and Enslin number(R value: 0.9588, slope: 0.0093, intercept: 0.7782)
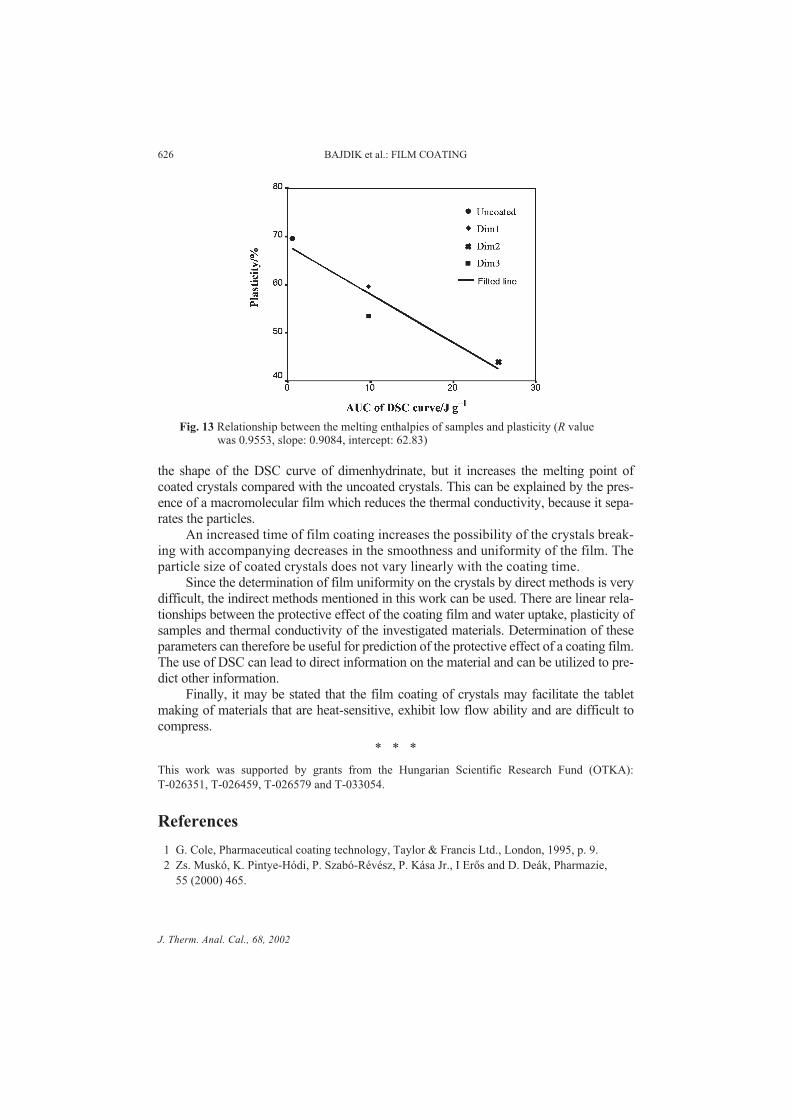
the shape of the DSC curve of dimenhydrinate, but it increases the melting point of
coated crystals compared with the uncoated crystals. This can be explained by the pres-
ence of a macromolecular film which reduces the thermal conductivity, because it sepa-
rates the particles.
An increased time of film coating increases the possibility of the crystals break-
ing with accompanying decreases in the smoothness and uniformity of the film. The
particle size of coated crystals does not vary linearly with the coating time.
Since the determination of film uniformity on the crystals by direct methods is very
difficult, the indirect methods mentioned in this work can be used. There are linear rela-
tionships between the protective effect of the coating film and water uptake, plasticity of
samples and thermal conductivity of the investigated materials. Determination of these
parameters can therefore be useful for prediction of the protective effect of a coating film.
The use of DSC can lead to direct information on the material and can be utilized to pre-
dict other information.
Finally, it may be stated that the film coating of crystals may facilitate the tablet
making of materials that are heat-sensitive, exhibit low flow ability and are difficult to
compress.
* * *
This work was supported by grants from the Hungarian Scientific Research Fund (OTKA):
T-026351, T-026459, T-026579 and T-033054.
References
1 G. Cole, Pharmaceutical coating technology, Taylor & Francis Ltd., London, 1995, p. 9.
2 Zs. Muskó, K. Pintye-Hódi, P. Szabó-Révész, P. Kása Jr., I Erõs and D. Deák, Pharmazie,
55 (2000) 465.
J. Therm. Anal. Cal., 68, 2002
626 BAJDIK et al.: FILM COATING
Fig. 13 Relationship between the melting enthalpies of samples and plasticity (R valuewas 0.9553, slope: 0.9084, intercept: 62.83)
3 H. Yuasa, T. Nakano and Y. Kanaya, Int. J. Pharm., 178 (1999) 1.
4 E. G. Rippie and D. W. Danielson, J. Pharm. Sci., 70 (1981) 476.
5 P. Ridgway, Watt, Tablet machine instrumentation in pharmaceutics: principles and practice,
Ellis Horwood Ltd., Chichester, 1988, p. 23.
6 G. Ragnarsson and J. Sjögren, J. Pharm. Pharmacol., 37 (1985) 145.
7 M. Celik and K. Marshall, Drug. Dev. Ind. Pharm., 15 (1989) 759.
8 M. Siaan, K. Pintye-Hódi, P. Szabó-Révész, P. Kása, Jr. and I. Erõs, Drug. Dev. Ind. Pharm.,
26 (2000) 1013.
9 USP 23, United States Pharmacopeial Convention Inc,. Rockville, 1994, pp. 228., 781., 1210.,
526.
10 G. Kedvessy and M. Garamvölgyi-Horvát, Pharmazie, 28 (1973) 748.
11 C. Fuhrer and W. Parmentier, Acta Pharm. Technol., 23 (1977) 205.
12 U. Bogs and E. Lenhardt, Pharm. Ind., 33 (1971) 850.
13 E. Graf and A. Sahr, Pharm. Ind., 41 (1979) 86.
14 K. Thoma and K. Bechtold, Eur. J. Pharm. Biopharm., 47 (1999) 39.
15 M. T. DeCrosta, J. B. Schwartz, R. J. Wigent and K. Marshall, Int. J. Pharm., 198 (2000) 113.
16 J. Bajdik, K. Pintye-Hódi, Cs. Novák, P. Szabó-Révész, G. Regdon Jr., I. Erõs and G. Pokol,
J. Therm. Anal. Cal., 62 (2000) 797.
17 K. Pintye-Hódi, P. Szabó-Révész, M. Miseta and B. Selmeczi, Acta Pharm. Hung.,
54 (1984) 127.
18 M. Abdou, Dissolution, Bioavailability & Bioequivalence, MACK Publishing Co., Easton
1989, p. 37.
19 K. Parfitt, Martindale, the Complete Drug Reference, Thirty-second edition, Pharmaceutical
Press, London, 1999, p. 408.
20 L. Hendeles, M. Massanari and M. Weinberger, Dimenhydrinate in: Gilman, A. G., Goodman,
L. S., & Gilman, A. (Eds) Goodman & Gilman�s The Pharmacological Basis of Therapeutics,
6th ed. MacMillan Publishing Co., New York 1980 in Micromedex, Inc., Englewood, Co.,
Vol. 97 Exp. 30/09/98 Topic: Dimenhydrinate.
21 Seppic brochure, Seppic INC, Paris 1994.
22 A. Stamm and C. Mathis, Acta Pharm. Technol., 22 (1976) 7.
23 J. T. Carstensen, Solid Pharmaceutics: Mechanical Properties and Rate Phenomena, Academic
Press, New York, 1980, p. 184.
J. Therm. Anal. Cal., 68, 2002
BAJDIK et al.: FILM COATING 627

III.

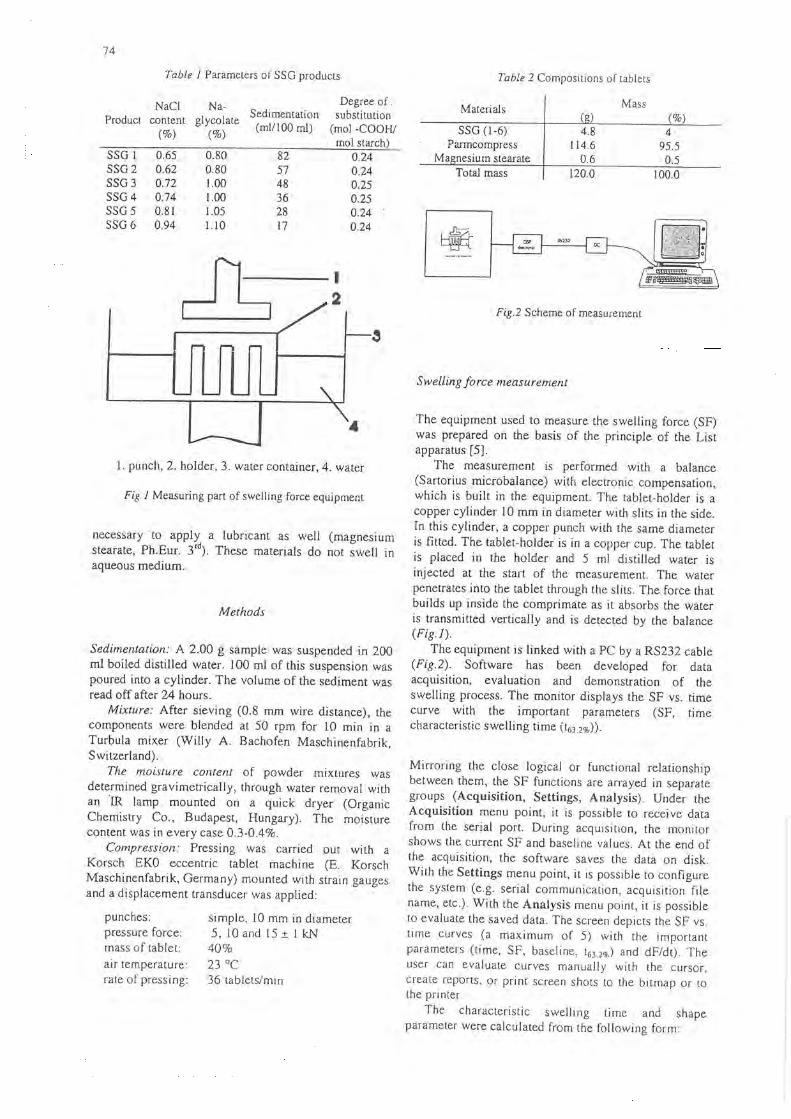
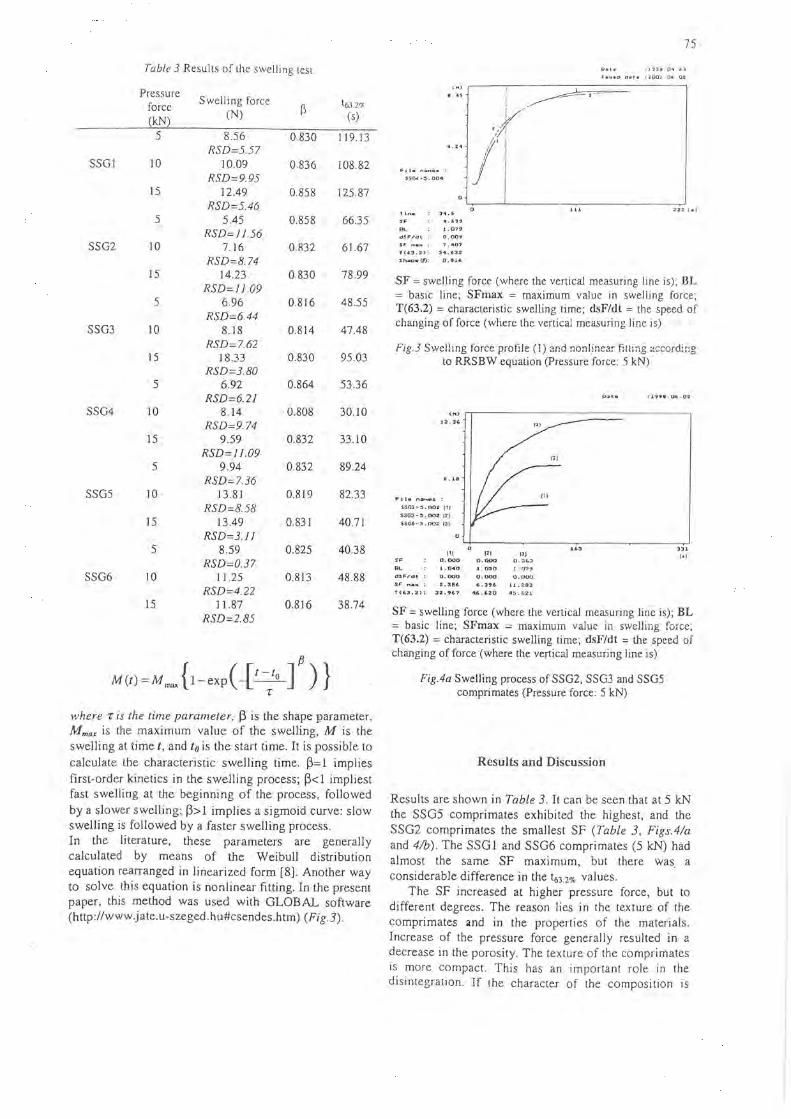
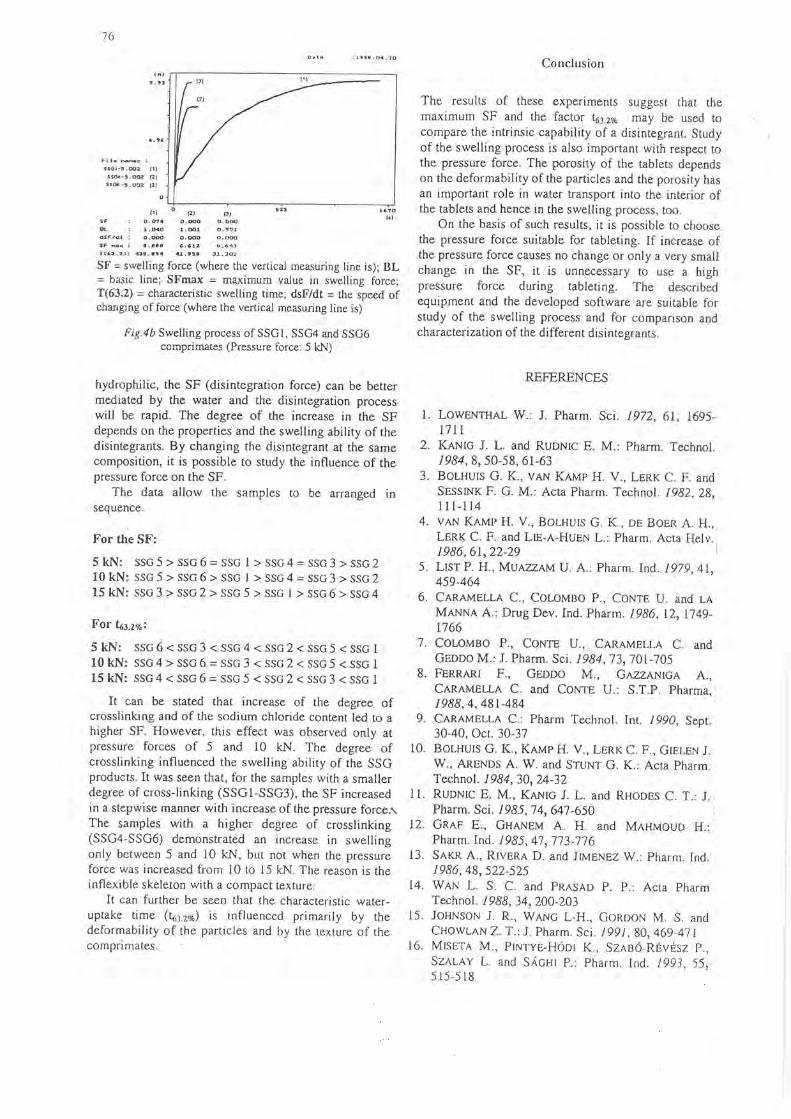

IV.