Embed Size (px)
Citation preview
Dynamic Field Activity Case Study: Soil and Sediment Cleanup, Loring Air Force Base

Office of Solid Waste andEmergency Response (5201G)
EPA/540/R-02/006OSWER No. 9200.1-44
April 2003
Dynamic Field Activity Case Study: Soil and Sediment Cleanup,
Loring Air Force Base


Notice This document has been funded by the United States Environmental Protection Agency (EPA)under Contract 68-W-02-033. The document was subjected to the Agency’s administrative and expert review and was approved for publication as an EPA document. Mention of trade names or commercial products does not constitute endorsement or recommendation for use.
iii

iv
Acknowledgments The Office of Emergency and Remedial Response would like to acknowledge and thank the individuals who reviewed and provided comments on draft documents. The reviewers include EPA headquarters and regional offices, state environmental programs, United States Departmentof Defense, United States Department of Energy, and representatives from the private sector.
v

vi
Contents
Notice . . . . . . . . . . . . . . . . . . . . . . . . . . . . . . . . . . . . . . . . . . . . . . . . . . . . . . . . . . . . . . iii
Acknowledgments . . . . . . . . . . . . . . . . . . . . . . . . . . . . . . . . . . . . . . . . . . . . . . . . . . . . v
Exhibits . . . . . . . . . . . . . . . . . . . . . . . . . . . . . . . . . . . . . . . . . . . . . . . . . . . . . . . . . . . . viii
Abbreviations . . . . . . . . . . . . . . . . . . . . . . . . . . . . . . . . . . . . . . . . . . . . . . . . . . . . . . . . ix
Abstract . . . . . . . . . . . . . . . . . . . . . . . . . . . . . . . . . . . . . . . . . . . . . . . . . . . . . . . . . . . . 1
Background . . . . . . . . . . . . . . . . . . . . . . . . . . . . . . . . . . . . . . . . . . . . . . . . . . . . . . . . . 1
Using a Systematic Planning Process . . . . . . . . . . . . . . . . . . . . . . . . . . . . . . . . . . . . . 1Reviewing Existing Site Information . . . . . . . . . . . . . . . . . . . . . . . . . . . . . . . . . . 4Selecting the Project Personnel . . . . . . . . . . . . . . . . . . . . . . . . . . . . . . . . . . . . . 4Identifying the Remedial Objectives . . . . . . . . . . . . . . . . . . . . . . . . . . . . . . . . . . 6Refining the Conceptual Site Model . . . . . . . . . . . . . . . . . . . . . . . . . . . . . . . . . . 6Preparing Sampling and Measurement Strategies . . . . . . . . . . . . . . . . . . . . . . 7
Screening Sampling Strategy . . . . . . . . . . . . . . . . . . . . . . . . . . . . . . . . . 7Initial Removal Strategy . . . . . . . . . . . . . . . . . . . . . . . . . . . . . . . . . . . . . 7Confirmation Sampling Strategy . . . . . . . . . . . . . . . . . . . . . . . . . . . . . . . 8Final Removal Strategy . . . . . . . . . . . . . . . . . . . . . . . . . . . . . . . . . . . . . . 8Disposition Strategy . . . . . . . . . . . . . . . . . . . . . . . . . . . . . . . . . . . . . . . . 8
Selection of Appropriate Equipment and Contractors . . . . . . . . . . . . . . . . . . . . 9
Writing a Dynamic Work Plan . . . . . . . . . . . . . . . . . . . . . . . . . . . . . . . . . . . . . . . . . . . . 9
Conducting the Dynamic Field Activity . . . . . . . . . . . . . . . . . . . . . . . . . . . . . . . . . . . . 10
Writing a Final Report . . . . . . . . . . . . . . . . . . . . . . . . . . . . . . . . . . . . . . . . . . . . . . . . . 17
Estimated Cost and Time Savings . . . . . . . . . . . . . . . . . . . . . . . . . . . . . . . . . . . . . . . 17
Lessons Learned . . . . . . . . . . . . . . . . . . . . . . . . . . . . . . . . . . . . . . . . . . . . . . . . . . . . 18Coordination of Team Members . . . . . . . . . . . . . . . . . . . . . . . . . . . . . . . . . . . 18On-Site Data Generation . . . . . . . . . . . . . . . . . . . . . . . . . . . . . . . . . . . . . . . . . 19
References . . . . . . . . . . . . . . . . . . . . . . . . . . . . . . . . . . . . . . . . . . . . . . . . . . . . . . . . . 20
Appendix A: Data Management Plan Summary . . . . . . . . . . . . . . . . . . . . . . . . . . . . A-1
Appendix B: Quality Assurance Project Plan Summary . . . . . . . . . . . . . . . . . . . . . . B-1
vii
Exhibits
Number Title Page
1 Operable Unit 13—Basewide Surface Water Sediment . . . . . . . . . . . . . . . . . . 22 Flight Line Drainage Ditch Wetland . . . . . . . . . . . . . . . . . . . . . . . . . . . . . . . . . . 33 Flightline Drainage Ditch Wetlands Remediation Goals For Constituents of
Concern . . . . . . . . . . . . . . . . . . . . . . . . . . . . . . . . . . . . . . . . . . . . . . . . . . . . . . . 54 Fish Tissue Remediation Goals for Constituents of Concern . . . . . . . . . . . . . . 55 Screening Sampling Decision Tree . . . . . . . . . . . . . . . . . . . . . . . . . . . . . . . . . 116 Confirmation Sampling Decision Tree . . . . . . . . . . . . . . . . . . . . . . . . . . . . . . . 127 Excavation Decision Tree . . . . . . . . . . . . . . . . . . . . . . . . . . . . . . . . . . . . . . . . 138 Screening Sampling Data Management Flow Diagram . . . . . . . . . . . . . . . . . . 149 Screening Sample Locations for FLDD Wetlands . . . . . . . . . . . . . . . . . . . . . . 1610 Analytical Cost Comparison for Flightline Drainage Ditch Wetlands
(Soils/Sediments) . . . . . . . . . . . . . . . . . . . . . . . . . . . . . . . . . . . . . . . . . . . . . . . 18
viii
Abbreviations
BCT BRAC Cleanup TeamBRAC Base Realignment and ClosureCERCLA Comprehensive Environmental Response, Compensation, and Liability ActDDD dichlorodiphenyldichloroethaneDDE dichlorodiphenyldichloroetheneDDT dichlorodiphenyltrichloroethaneDEP Department of Environmental ProtectionDQO data quality objectiveECD electron capture detectorEPA U.S. Environmental Protection AgencyFID flame ionization detectorGC gas chromatographGPS global positioning systemIT information technologyOU operable unitPAH polyaromatic hydrocarbonPCB polychlorinated biphenylQA quality assuranceQAPP quality assurance project planQC quality controlRI remedial investigationTCLP toxicity characteristic leaching procedureTSCA Toxic Substances Control ActXRF x-ray fluorescence
ix

x
Dynamic Field Activity Case Study: Soil and Sediment Cleanup, Loring Air Force Base
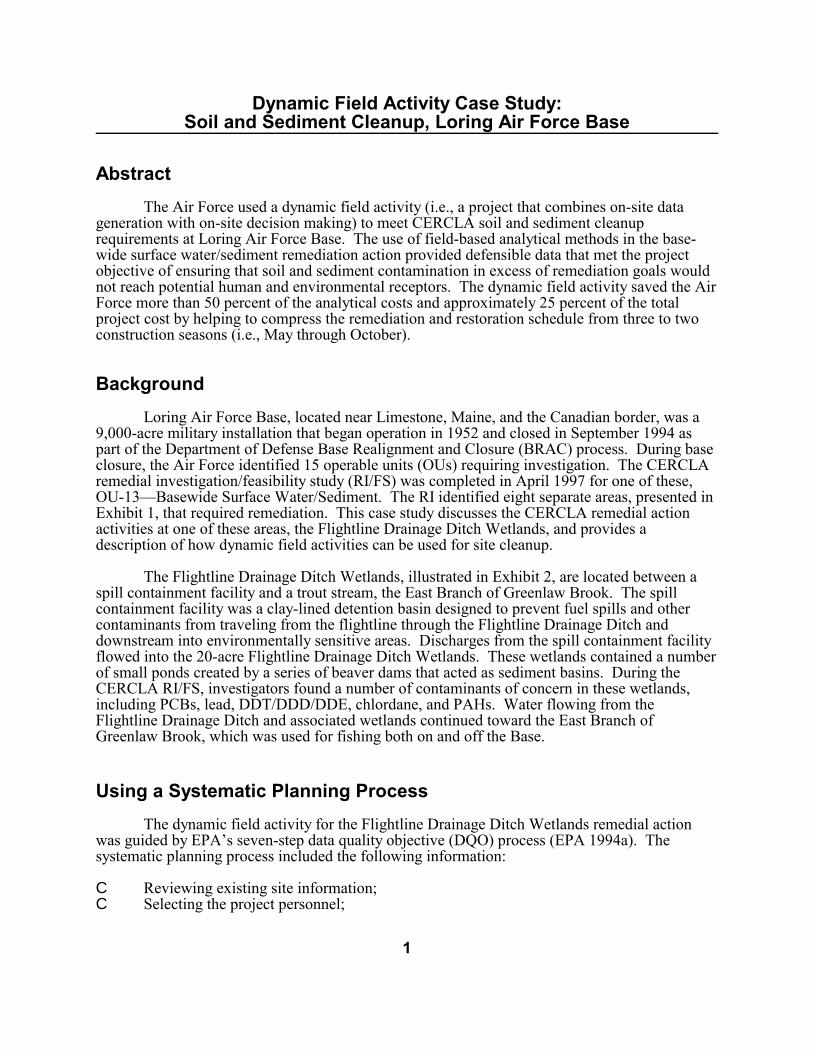
Abstract The Air Force used a dynamic field activity (i.e., a project that combines on-site data
generation with on-site decision making) to meet CERCLA soil and sediment cleanuprequirements at Loring Air Force Base. The use of field-based analytical methods in the base-wide surface water/sediment remediation action provided defensible data that met the project objective of ensuring that soil and sediment contamination in excess of remediation goals would not reach potential human and environmental receptors. The dynamic field activity saved the Air Force more than 50 percent of the analytical costs and approximately 25 percent of the totalproject cost by helping to compress the remediation and restoration schedule from three to two construction seasons (i.e., May through October).
Background Loring Air Force Base, located near Limestone, Maine, and the Canadian border, was a
9,000-acre military installation that began operation in 1952 and closed in September 1994 aspart of the Department of Defense Base Realignment and Closure (BRAC) process. During base closure, the Air Force identified 15 operable units (OUs) requiring investigation. The CERCLA remedial investigation/feasibility study (RI/FS) was completed in April 1997 for one of these,OU-13—Basewide Surface Water/Sediment. The RI identified eight separate areas, presented inExhibit 1, that required remediation. This case study discusses the CERCLA remedial action activities at one of these areas, the Flightline Drainage Ditch Wetlands, and provides a description of how dynamic field activities can be used for site cleanup.
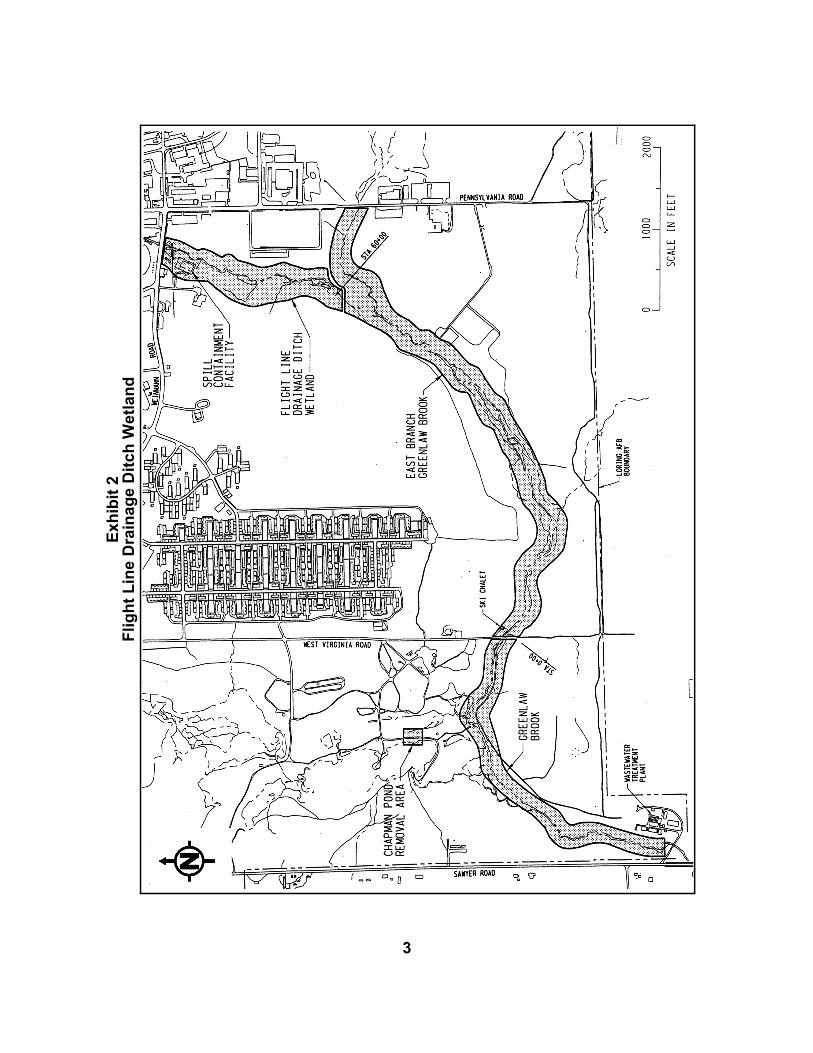
The Flightline Drainage Ditch Wetlands, illustrated in Exhibit 2, are located between a spill containment facility and a trout stream, the East Branch of Greenlaw Brook. The spill containment facility was a clay-lined detention basin designed to prevent fuel spills and other contaminants from traveling from the flightline through the Flightline Drainage Ditch and downstream into environmentally sensitive areas. Discharges from the spill containment facilityflowed into the 20-acre Flightline Drainage Ditch Wetlands. These wetlands contained a number of small ponds created by a series of beaver dams that acted as sediment basins. During the CERCLA RI/FS, investigators found a number of contaminants of concern in these wetlands, including PCBs, lead, DDT/DDD/DDE, chlordane, and PAHs. Water flowing from the Flightline Drainage Ditch and associated wetlands continued toward the East Branch of Greenlaw Brook, which was used for fishing both on and off the Base.
Using a Systematic Planning Process The dynamic field activity for the Flightline Drainage Ditch Wetlands remedial action
was guided by EPA’s seven-step data quality objective (DQO) process (EPA 1994a). The systematic planning process included the following information:
C Reviewing existing site information; C Selecting the project personnel;
1
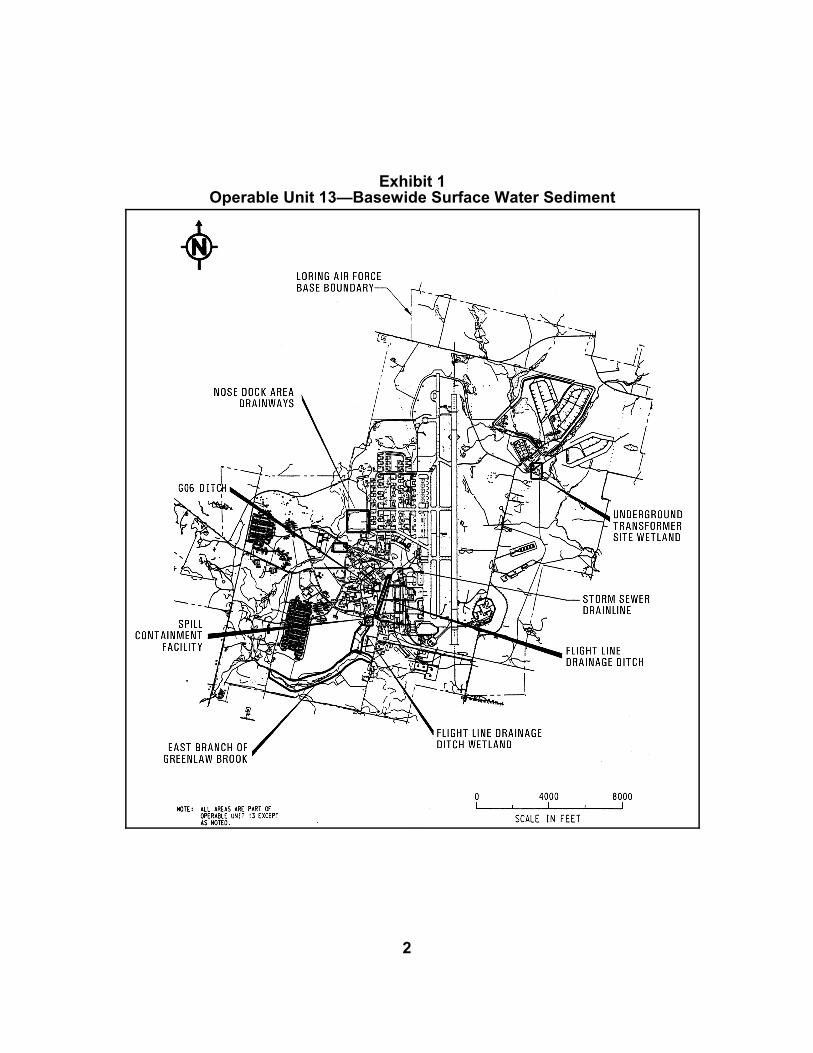
Exhibit 1Operable Unit 13—Basewide Surface Water Sediment
2
Exhi
bit 2
Fl
ight
Lin
e D
rain
age
Ditc
h W
etla
nd
3
C Identifying the objectives;C Refining the conceptual site model;C Preparing sampling and measurement strategies; andC Selecting appropriate analytical methods, equipment, and contractors.
Reviewing Existing Site Information
Based on the RI, the BRAC Cleanup Team knew:
C The Flightline Drainage Ditch Wetlands consisted of a drainage ditch that was below the watertable and an accompanying floodplain;
C The contaminants of concern included PCBs, lead, chlordane, PAHs, and 4,4-DDT/DDD/DDE (see Exhibit 3); and
C The concentrations of a number of constituents of concern were elevated in fish tissue. Exhibit 4 indicates that PCB concentrations (derived from Aroclor-1260) in fish tissuewere almost 1,000 times the remediation goal which was based on human health effects from the consumption of fish and almost 70 times higher than a level at which there would be an observable effect in the fish themselves.
Selecting the Project Personnel
The BRAC Cleanup Team consisted of remedial project managers and supporting staff from the Air Force, EPA, and State of Maine, as well as the Air Force contractor. This groupestablished a mutually agreed upon decision-making chain-of-command for the oversight of the work. Since the approach to this remediation was dynamic, the Air Force’s prime contractorproposed a planning team whose members were very qualified and experienced in their areas ofresponsibility. The positions and qualifications of the team included:
Project manager: A civil engineer with more than 20 years of engineering and management experience. His primary functions were providing client relations, management oversight of site activities, and ensuring that adequate resources were available to the remediation team. He functioned out of the home office.
Project engineer/technical team leader: A civil engineer with more than 20 years of engineering and environmental management experience. He filled the role of a technical team leader by ensuring implementation of the work plan and overseeing the work. Since the decision-making process for the soil removal project was not as complicated as other dynamic field activities (e.g., complex characterization activities), he was able to spend part of his time in the home office and part in the field. While he was off-site, he used the project’s website for real-time data management, while a very experienced construction engineer oversaw the field activities.
Project geologist: A geologist with more than 10 years of experience in environmentalwork. His primary responsibility was to oversee the collection of environmental and geotechnical soil and sediment samples. He was on site for the entire length of the remedial action.
4
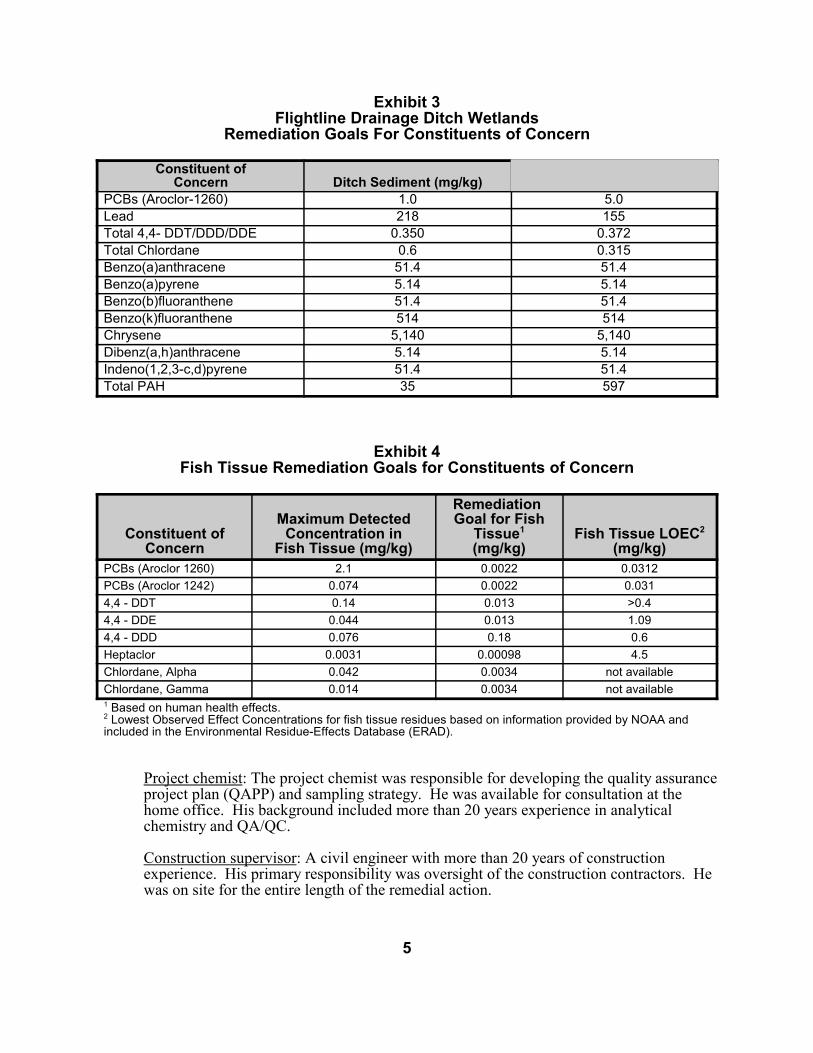
Exhibit 3Flightline Drainage Ditch Wetlands
Remediation Goals For Constituents of Concern
Constituent of Concern Ditch Sediment (mg/kg) Floodplain Soil (mg/kg)
PCBs (Aroclor-1260) 1.0 5.0 Lead 218 155 Total 4,4- DDT/DDD/DDE 0.350 0.372 Total Chlordane 0.6 0.315 Benzo(a)anthracene 51.4 51.4 Benzo(a)pyrene 5.14 5.14 Benzo(b)fluoranthene 51.4 51.4 Benzo(k)fluoranthene 514 514 Chrysene 5,140 5,140 Dibenz(a,h)anthracene 5.14 5.14 Indeno(1,2,3-c,d)pyrene 51.4 51.4 Total PAH 35 597
Exhibit 4Fish Tissue Remediation Goals for Constituents of Concern
Constituent of Concern
Maximum Detected Concentration in
Fish Tissue (mg/kg)
Remediation Goal for Fish
Tissue1
(mg/kg) Fish Tissue LOEC2
(mg/kg) PCBs (Aroclor 1260) 2.1 0.0022 0.0312 PCBs (Aroclor 1242) 0.074 0.0022 0.031 4,4 - DDT 0.14 0.013 >0.4 4,4 - DDE 0.044 0.013 1.09 4,4 - DDD 0.076 0.18 0.6 Heptaclor 0.0031 0.00098 4.5 Chlordane, Alpha 0.042 0.0034 not available Chlordane, Gamma 0.014 0.0034 not available 1 Based on human health effects.2 Lowest Observed Effect Concentrations for fish tissue residues based on information provided by NOAA andincluded in the Environmental Residue-Effects Database (ERAD).
Project chemist: The project chemist was responsible for developing the quality assurance project plan (QAPP) and sampling strategy. He was available for consultation at the home office. His background included more than 20 years experience in analytical chemistry and QA/QC.
Construction supervisor: A civil engineer with more than 20 years of construction experience. His primary responsibility was oversight of the construction contractors. He was on site for the entire length of the remedial action.
5
Data management: A data manager worked full time on the project. He was a chemist, supported by information technology (IT) staff, and had more than 20 years experience in analytical chemistry and data management. He divided his time between the site and home office.
Identifying the Remedial Objectives
Because the RI/FS identified consumption of contaminated fish as a major route of human exposure, the BRAC Cleanup Team’s goals included the need to eliminate contaminated sediment transport from the Flightline Drainage Ditch into the adjoining wetland and the East Branch of Greenlaw Brook, including its associated wetlands. As a result, the BRAC CleanupTeam developed a number of DQOs to ensure that the remedial action would prevent soils andsediments with contamination levels in excess of their remediation goals from reaching potential human and environmental receptors, particularly through elimination of PCB exposure to thefood chain. The DQOs included:
C Analytical data will be of sufficient quality and quantity to guide site activities. To meet this objective, screening results will be compared with applicable site-specific remediation goals to determine the remediation boundaries for each site and to define areas that may exceed Toxic Substances Control Act (TSCA) criteria and the toxicitycharacteristic leaching procedure (TCLP) hazardous waste criteria. In addition, confirmatory analysis will be of sufficient quality to demonstrate that soils remainingafter remediation do not contain target analytes above remediation goals.
C Disposition analysis (i.e., analysis of removed soil and sediments for waste characterization and disposal) will be of sufficient quality to be compared with TSCA criteria, including the disposition of PCBs, and TCLP criteria, which controls the disposition of metals or pesticides.
C Data on soil and sediment classification will be of sufficient quality and quantity to recreate the stream and wetland to its pre-contaminated condition.
Refining the Conceptual Site Model
The conceptual site model presented in the RI for the Flightline Drainage Ditch Wetlands described two deposition scenarios that were known to have occurred based on Air Force Base records and personnel interviews. The first deposition scenario was that contaminants of concern had been released or disposed of into the Flightline Drainage Ditch and were transported downstream during high water events (e.g., snow melts, excessive precipitation). When the ditch overflowed its banks, these contaminants were distributed and deposited into the wetlands.
The second deposition scenario involved direct application of insecticide to controlblackflies and mosquitos. In addition, this scenario proposed that insecticides were mixed and handled in the area upstream from the Flightline Drainage Ditch Wetlands. Upstream spills and releases would then follow the first deposition scenario described above.
Both deposition scenarios included ongoing toxic exposure to flora and fauna in thestream and wetlands. The RI had determined that the contaminants, especially PCBs, had entered the food chain and were present in trout used for human consumption. In addition to the
6
risk posed by fish consumption, the contaminants also presented a risk through direct dermal contact and ingestion.
The BRAC Cleanup Team found the RI data inadequate for understanding the depth andareal extent of sedimentation in the flood plain area. In addition, they could not determine whether any stratification of contaminants existed within the sediment column. Consequently, they planned to seek this information during the remedial design to ensure adequate cleanup.
Preparing Sampling and Measurement Strategies
The feasibility study called for the removal and disposal of soils and sediments with contaminants of concern above the remediation goals (refer to Exhibit 3). In order to determine which soils or sediments met these criteria, the BRAC Cleanup Team developed three strategic sampling steps to identify contamination: screening sampling, confirmation sampling, and disposition sampling. Because PCBs constituted 90 percent of the risk at the site, the strategyfocused on this contaminant in particular.
Screening Sampling Strategy
Before implementing the full screening program, the BRAC Cleanup Team decided tosample obvious depositional areas for stratification of PCB contamination to determine if specific layers of sediments were more likely to be contaminated. To do this, the field team planned to collect samples at 6-inch intervals to a depth of two feet or until they reached the bottom of the sediment layer, whichever was less. The BRAC Cleanup Team intended to usethis information to decide whether to implement a simple random or a stratified sampling strategy.
The field team would select screening samples by first dividing the drainage ditch into transects every 100 feet. At each transect they would use their professional judgement to select nearby sample locations that are likely areas of sedimentation. If the ditch was six feet across or less, they would collect only one sample. If it was wider, they would collect as many as three samples. They would also use known hot spot locations, found by this sampling event or previous investigations, to select additional sampling locations that are half the distance to adjacent samples.
They would then sample the floodplain by extending the transects into the wetlands. The field team would decide the number and location of samples on these transects based on inputfrom the project wetlands specialist and the regulatory agencies. Exhibit 5 presents the decision tree used for taking screening samples. Originally, the BRAC Cleanup Team planned to analyze screening samples on site and send 10 percent off site for confirmation. However, during the field work, modifications were made that increased the use of on-site analysis.
Initial Removal Strategy
If the analytical results of the screening sampling indicate that an area contained soil/sediment above the remediation goals, the field team would remove an initial two feet of soils/sediments.
7
Confirmation Sampling Strategy
Once the field team completes the initial removal, they would implement a confirmation sampling strategy over the same area to ensure that the remaining soil met established cleanupcriteria with a 90 percent confidence level for identifying hot spots. To do this they planned to collect confirmation samples:
C Every 50 feet within the ditch;C Where they suspected addition contamination; andC Within the flood plain based on the statistical method recommended by EPA guidance
(U.S. EPA, 1989).
All of the confirmation samples would be analyzed at an off-site laboratory using SW-846 methods with 24- to 48-hour turnaround. Exhibit 6 shows the decision tree used for confirmation sampling data. Note that this was the initial plan as it was approved. During the field work the BRAC Cleanup Team made modifications to the plan that increased the use of on-site analysis.
Final Removal Strategy
If the analytical results from confirmation sampling indicate that cleanup criteria were notmet, the field team would remove two additional feet of soil and collect followup samples according to EPA statistical sampling guidance (U.S. EPA, 1989). If the followup samplingindicates that cleanup criteria still were not met, then they would place a geotextile layer over the contaminated soil and cover it with clean soil (Exhibit 7 presents the decision logic on excavation and remediation).
Disposition Strategy
The field team would consolidate all removed contaminated soils at a staging area where they would perform disposition sampling in accordance with EPA solid waste sampling guidance (U.S. EPA, 1997) and Maine DEP requirements. The original work plan called for the samples to be analyzed by an off-site laboratory by the TCLP for metals and pesticides and by SW-846 method 8081 for PCBs. However, the BRAC Cleanup Team modified the planning documents once the field laboratory demonstrated its ability to provide sufficient data quality.
After determining contaminant concentrations for the removed soil/sediment, the field team planned to implement the disposal criteria described in the work plan. By taking advantage of a base-operated landfill, the Air Force could save substantial resources on the less contaminated waste. The disposal criteria, in accordance with EPA regulations, stated that the field team would:
C Dispose of soil in the base landfill if the soil did not exhibit the RCRA characteristic for toxicity based on TCLP analysis (for the metals and pesticides) and contained below 50 ppm of PCBs, as provided for in TSCA;
C Dispose of soil in a specially constructed cell within the base landfill if the soil did not fail the TCLP but had greater than 50 ppm and less than 1,000 ppm of PCBs; and
C Dispose of soil at an off-site licensed hazardous waste landfill if it failed the TCLP and could not be treated on site to universal treatment standards, or contained more than 1,000 ppm of PCBs.
8
Selection of Appropriate Equipment and Contractors
The BRAC Cleanup Team selected the equipment and subcontractors needed toimplement this remedial action based on suggestions from the prime contractor. As a federal project, the prime contractor competitively bid each contracting element and awarded them on a time-and-materials basis with mobilization, demobilization, and standby charge provisions,depending upon the service being contracted.
The prime contractor negotiated a contract with a local analytical company to provide transportable GCs for on-site analysis of PCBs, pesticides, and PAHs as well as an XRFinstrument for on-site analysis of metals. In addition, the prime contractor retained two off-site laboratories for confirmatory analysis of the on-site methods and for analysis of the confirmation and disposition samples. The contracts included provision for both regular and quick turn-around analysis (24 to 48 hours). These were indefinite quantity contracts which specified abasic number of analyses and throughput with a provision for more up to a stated maximum (ifneeded).
Note that the project used the term “confirmation” for two separate activities. The first context refers to a sample that was split between the off-site and on-site laboratories to “confirm” that field-based analytical methods were providing acceptable results. In the second context, “confirmation” refers to a sample that was collected to determine if a discrete area met clean-up criteria. These samples were not splits but they did have a high level of QA/QC applied to them.
Writing a Dynamic Work Plan The BRAC Cleanup Team chose a dynamic approach because they believed it would
offer substantial cost savings by increasing the speed of decision making, thereby reducing the time needed for site remediation and restoration. Because the cost savings depended on reducingdelays in decision making, there needed to be a significant amount of planning and pre-agreement among the BRAC Cleanup Team members on how to handle potential problems.
In addition, the BRAC Cleanup Team worked closely with an organization of local citizens, the Restoration Advisory Board, to ensure that the citizens understood the remediation plan and how the remediation would reduce or eliminate risk of contaminant exposure, and that they were comfortable with the decision-making process. Meetings were scheduled about everyother month and an open door policy was put in place so that community members could meet with the Air Force remedial project manager to express concerns or ideas on an “as needed” basis.
The overall quality assurance project plan for Loring Air Force Base provided for the option of using either immunoassay test kits or transportable GCs for analysis of PAHs and PCBs. However, in the year prior to the work on the Flightline Drainage Ditch Wetlands the field team had used immunoassays for these analyses and encountered several problems,including:
C The need to conduct numerous analyses of the same sample due to multiple decisioncriteria for PCBs (i.e., less than 50 ppm, 50 to 1,000 ppm, greater than1,000 ppm);
C Difficulty in achieving consistent results because field chemists were required to performnumerous dilutions; and
C Clogged filters during extraction for some kits due to clayey soils.
9
Consequently, the cost of analysis per sample location was higher than expected, and an excessive number of samples were being sent off-site during the screening stage. Therefore the BRAC Cleanup Team decided to exercise the option in the QAPP for using transportable GCsinstead of immunoassay test kits.
Based on discussions with the BRAC Cleanup Team and the Restoration Advisory Board, and through the completion of the systematic planning process, the prime contractor developed adynamic work plan and associated field planning documents. These documents described the following activities:
C On-site analysis of screening samples for PAHs, PCBs, and total petroleum hydrocarbons (TPH) using transportable GCs. Note that use of on-site analysis expanded during field work to include confirmation and no-further-action samples.
C Sampling, analytical, and excavation decisions by the field team according to decision trees developed by the BRAC Cleanup Team (refer to Exhibits 5, 6, and 7) .
C Selection of initial sampling locations based on professional understanding of sedimentation zones. Probabilistic sampling would then be used to confirm removal of contamination.
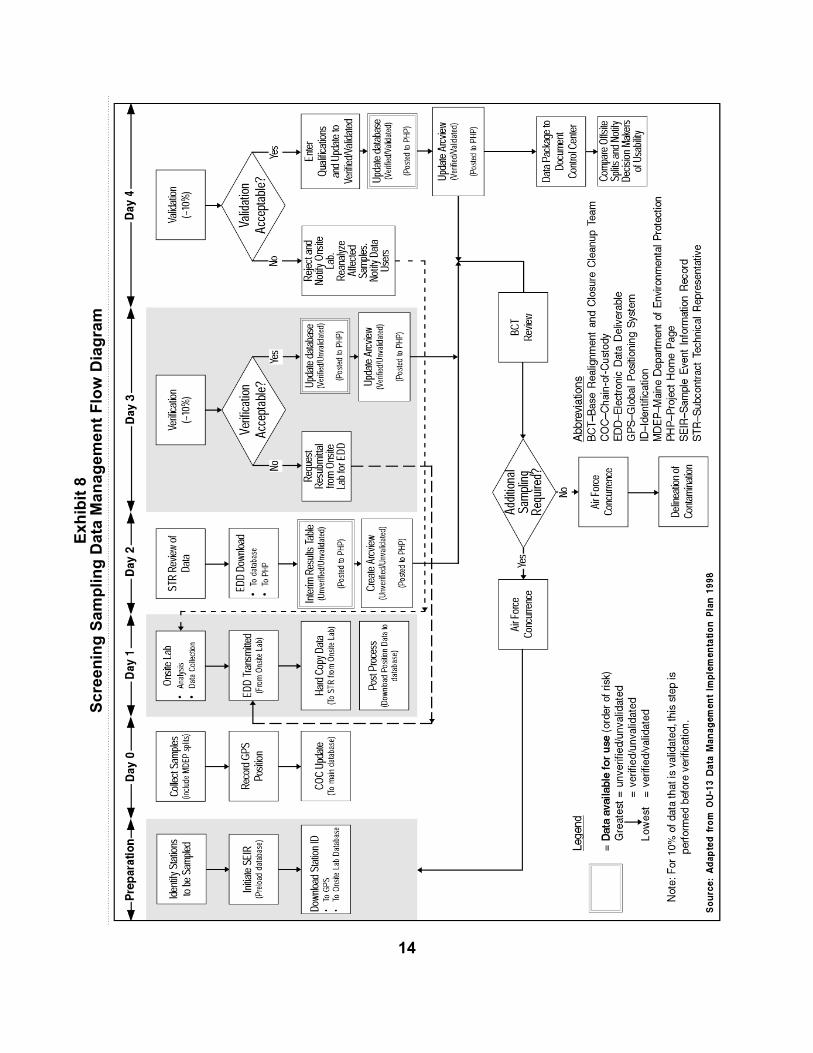
C Expedited distribution of all analytical data to stakeholders. During the second construction season, the BRAC Cleanup Team would use a password protected websitefor displaying data. The data management flow-chart used for determining which data were added to the website is shown in Exhibit 8. In addition, Appendix A providesdetailed information on the approved data management plan.
After the BRAC Cleanup Team reviewed the plans, they made some minor modifications. For instance, the State of Maine requested splitting a percentage of samples for analysis by their laboratory in addition to any sent to an off-site commercial laboratory. Once the changes were in place, they accepted the plans.
Conducting the Dynamic Field Activity After the field team demonstrated it could achieve a high level of data quality with the
on-site GCs, the BRAC Cleanup Team allowed their use for analysis of confirmatory sampleswith the stipulation that the off-site laboratory QA/QC protocols, provided in Appendix B, be used. This decision changed the number of off-site analyses of samples used to determine if an area met the cleanup criteria from the originally planned 100 percent to zero. However, the field team still split 5 to 7 percent of the cleanup confirmation samples with the State of Maine to verify that the on-site GCs were producing acceptable data. In addition, the BRAC CleanupTeam changed the confirmatory analysis of screening samples from 10 percent to 5 to 7 percent using the more stringent QC protocols at the on-site laboratory, and they allowed dispositionanalysis for PCBs on-site using the more stringent QC protocols.
The field team selected the screening sampling locations as described in the dynamic work plan. By the end of the Flightline Drainage Ditch Wetlands dynamic field activity, the field team had collected screening samples at 271 locations in two stages. The first stage consisted of a three-day period in late May 1997 when the field team collected 236 samples for on-site analysis. Based on the results of these samples, they collected 35 additional samples at locations
10
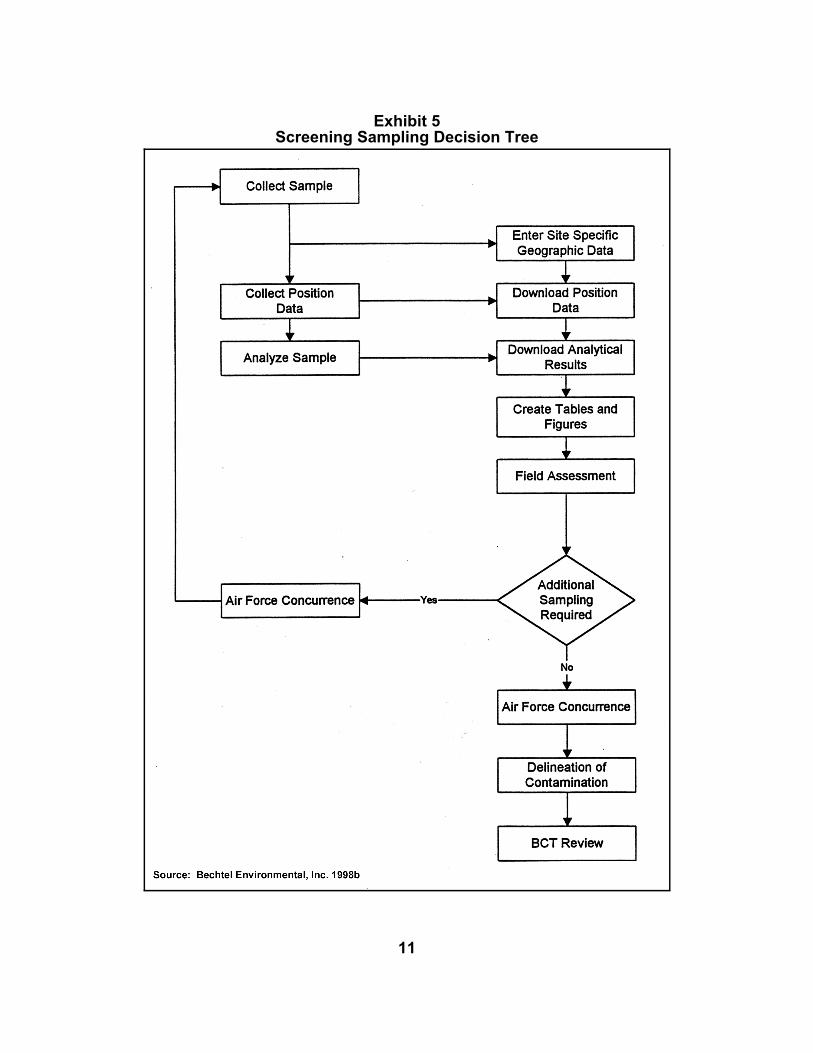
Exhibit 5Screening Sampling Decision Tree
11
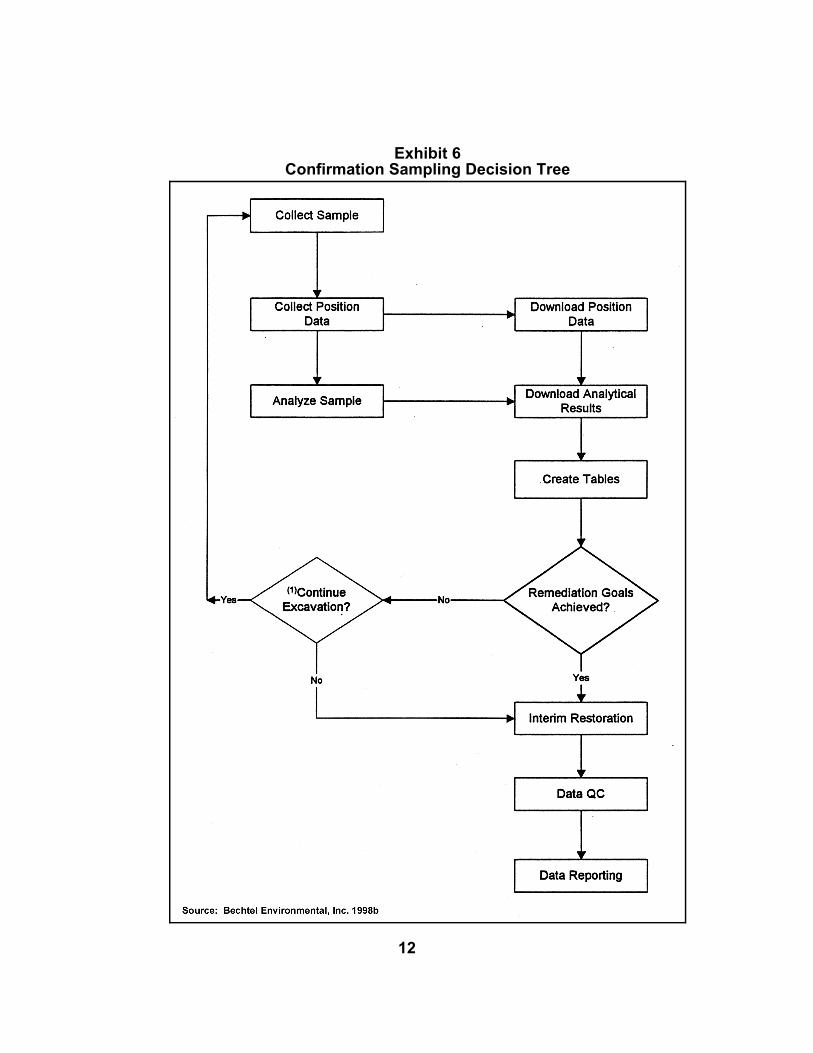
Exhibit 6Confirmation Sampling Decision Tree
12
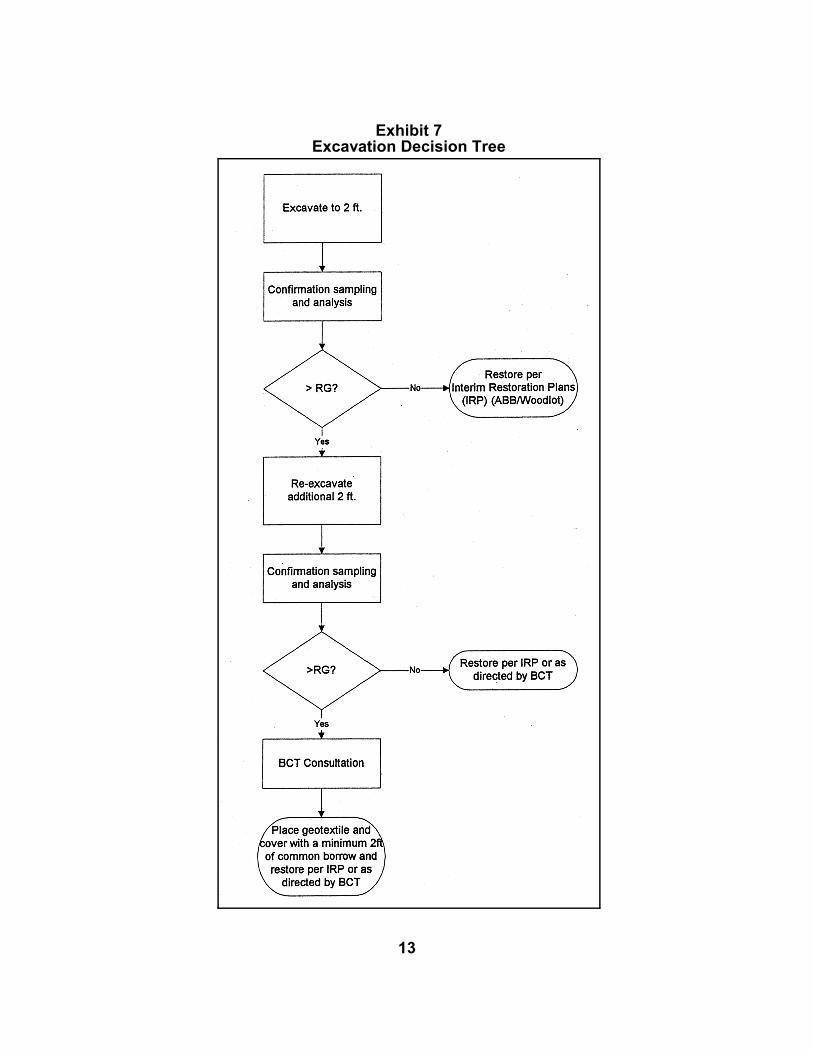
Exhibit 7Excavation Decision Tree
13
Exhi
bit 8
Sc
reen
ing
Sam
plin
g D
ata
Man
agem
ent F
low
Dia
gram
14
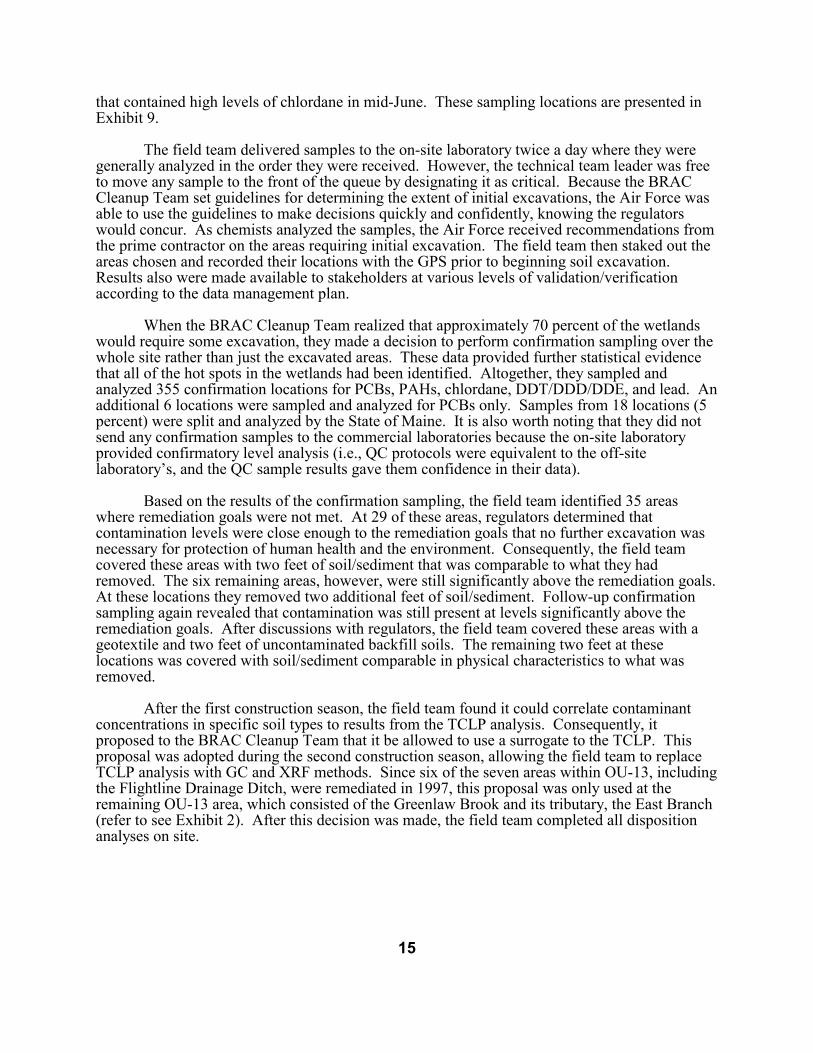
that contained high levels of chlordane in mid-June. These sampling locations are presented in Exhibit 9.
The field team delivered samples to the on-site laboratory twice a day where they were generally analyzed in the order they were received. However, the technical team leader was free to move any sample to the front of the queue by designating it as critical. Because the BRAC Cleanup Team set guidelines for determining the extent of initial excavations, the Air Force was able to use the guidelines to make decisions quickly and confidently, knowing the regulators would concur. As chemists analyzed the samples, the Air Force received recommendations from the prime contractor on the areas requiring initial excavation. The field team then staked out the areas chosen and recorded their locations with the GPS prior to beginning soil excavation. Results also were made available to stakeholders at various levels of validation/verificationaccording to the data management plan.
When the BRAC Cleanup Team realized that approximately 70 percent of the wetlands would require some excavation, they made a decision to perform confirmation sampling over the whole site rather than just the excavated areas. These data provided further statistical evidence that all of the hot spots in the wetlands had been identified. Altogether, they sampled and analyzed 355 confirmation locations for PCBs, PAHs, chlordane, DDT/DDD/DDE, and lead. An additional 6 locations were sampled and analyzed for PCBs only. Samples from 18 locations (5 percent) were split and analyzed by the State of Maine. It is also worth noting that they did not send any confirmation samples to the commercial laboratories because the on-site laboratoryprovided confirmatory level analysis (i.e., QC protocols were equivalent to the off-site laboratory’s, and the QC sample results gave them confidence in their data).
Based on the results of the confirmation sampling, the field team identified 35 areas where remediation goals were not met. At 29 of these areas, regulators determined that contamination levels were close enough to the remediation goals that no further excavation was necessary for protection of human health and the environment. Consequently, the field team covered these areas with two feet of soil/sediment that was comparable to what they had removed. The six remaining areas, however, were still significantly above the remediation goals. At these locations they removed two additional feet of soil/sediment. Follow-up confirmation sampling again revealed that contamination was still present at levels significantly above the remediation goals. After discussions with regulators, the field team covered these areas with a geotextile and two feet of uncontaminated backfill soils. The remaining two feet at these locations was covered with soil/sediment comparable in physical characteristics to what was removed.
After the first construction season, the field team found it could correlate contaminant concentrations in specific soil types to results from the TCLP analysis. Consequently, it proposed to the BRAC Cleanup Team that it be allowed to use a surrogate to the TCLP. This proposal was adopted during the second construction season, allowing the field team to replaceTCLP analysis with GC and XRF methods. Since six of the seven areas within OU-13, includingthe Flightline Drainage Ditch, were remediated in 1997, this proposal was only used at the remaining OU-13 area, which consisted of the Greenlaw Brook and its tributary, the East Branch (refer to see Exhibit 2). After this decision was made, the field team completed all dispositionanalyses on site.
15
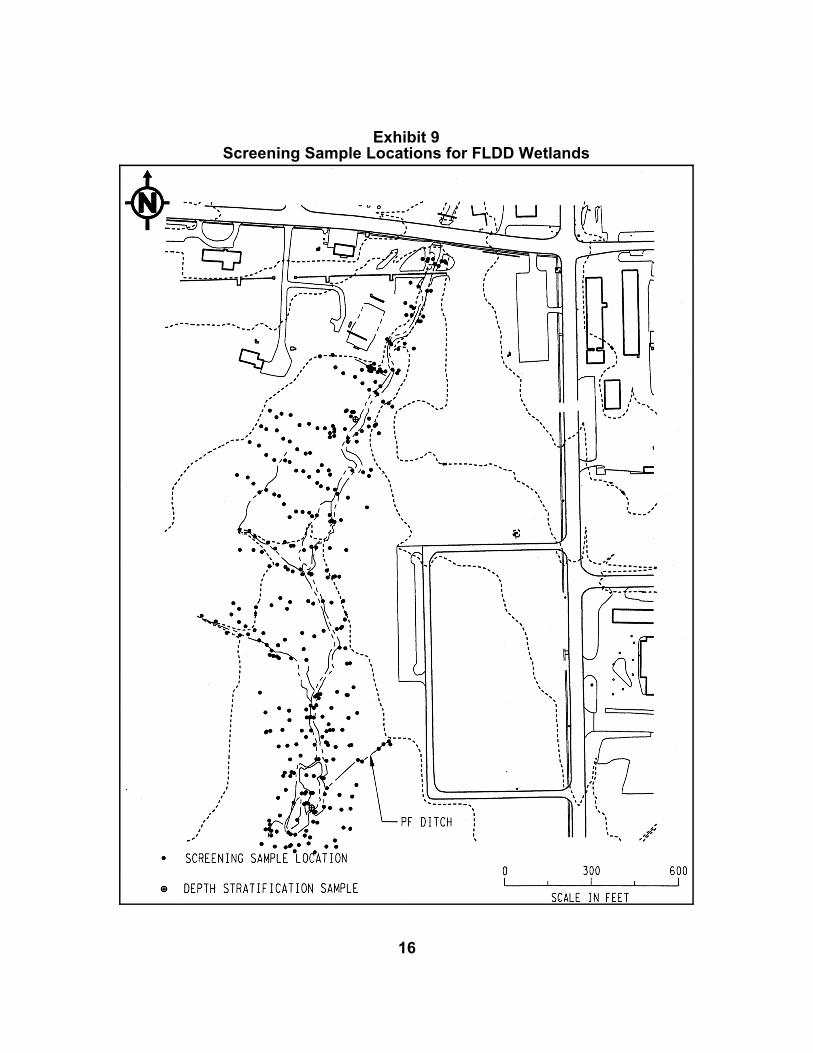
Exhibit 9Screening Sample Locations for FLDD Wetlands
16
Writing a Final Report The Air Force submitted a final Remedial Action Report for OU-13 in August 1999. The
remedial action at OU-13 required only eight months of field work spanning two construction seasons (1997 and 1998). The Flightline Drainage Ditch Wetlands area, in particular, wascompletely remediated in only three months of the 1997 season, and restoration activities were concluded during the 1998 construction season. The Flightline Drainage Ditch Wetlands action resulted in the removal and disposal of approximately 44,940 cubic yards of contaminated sediment and soils. For all of OU-13, 152,328 cubic yards were excavated and disposed.
At the conclusion of the field work, the prime contractor conducted an evaluation of the on-site versus off-site analytical results to determine whether an action would have been different if off-site data were used instead of on-site data. They compared the on-site and off-site laboratory results on 591 confirmation analyses from 112 split samples collected during the 1997 and 1998 construction seasons for the whole OU-13 (e.g., multiple analyses on each split mayhave included lead, total chlordanes, total DDT/DDD/DDE, PCBs, and total PAHs). As expected, the on-site laboratory GCs had higher detection limits than the off-site due to the smaller extraction sample size of the on-site method. However, the evaluation found that the same action would have occurred in 92.7 percent of the samples (548). In 6.4 percent (38 samples), the on-site laboratory indicated a false positive decision error with respect to the action level (i.e., an action was taken that could have been avoided if the off-site data had been used).In 0.9 percent (5 samples), the on-site laboratory indicated false negatives (i.e., an action shouldhave been taken but was not). This review indicated that the on-site laboratory operated within the acceptable decision error rates specified in the QAPP. Consequently, the results of the off-site laboratories and those of the on-site laboratory generally agreed, and the actions taken based on these results were technically defensible.
Estimated Cost and Time Savings Based on financial data obtained from the Loring Air Force Base remedial action, the use
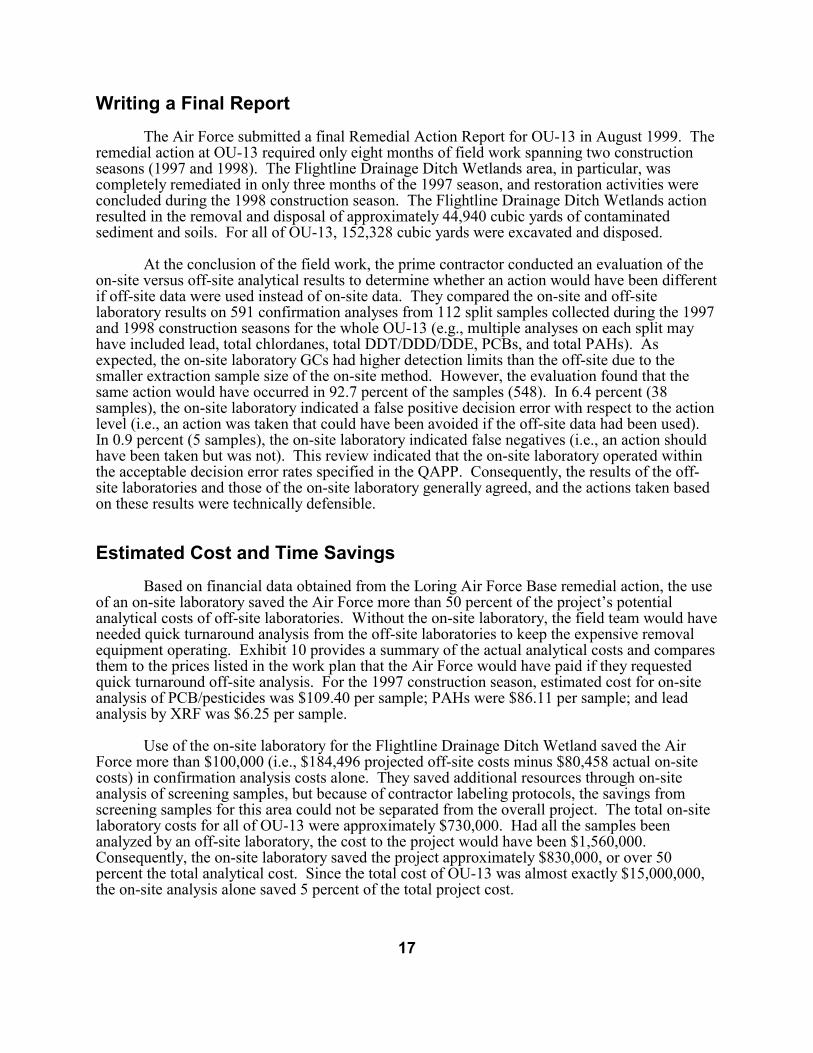
of an on-site laboratory saved the Air Force more than 50 percent of the project’s potentialanalytical costs of off-site laboratories. Without the on-site laboratory, the field team would have needed quick turnaround analysis from the off-site laboratories to keep the expensive removalequipment operating. Exhibit 10 provides a summary of the actual analytical costs and compares them to the prices listed in the work plan that the Air Force would have paid if they requestedquick turnaround off-site analysis. For the 1997 construction season, estimated cost for on-site analysis of PCB/pesticides was $109.40 per sample; PAHs were $86.11 per sample; and leadanalysis by XRF was $6.25 per sample.
Use of the on-site laboratory for the Flightline Drainage Ditch Wetland saved the Air Force more than $100,000 (i.e., $184,496 projected off-site costs minus $80,458 actual on-site costs) in confirmation analysis costs alone. They saved additional resources through on-site analysis of screening samples, but because of contractor labeling protocols, the savings from screening samples for this area could not be separated from the overall project. The total on-site laboratory costs for all of OU-13 were approximately $730,000. Had all the samples beenanalyzed by an off-site laboratory, the cost to the project would have been $1,560,000.Consequently, the on-site laboratory saved the project approximately $830,000, or over 50 percent the total analytical cost. Since the total cost of OU-13 was almost exactly $15,000,000, the on-site analysis alone saved 5 percent of the total project cost.
17
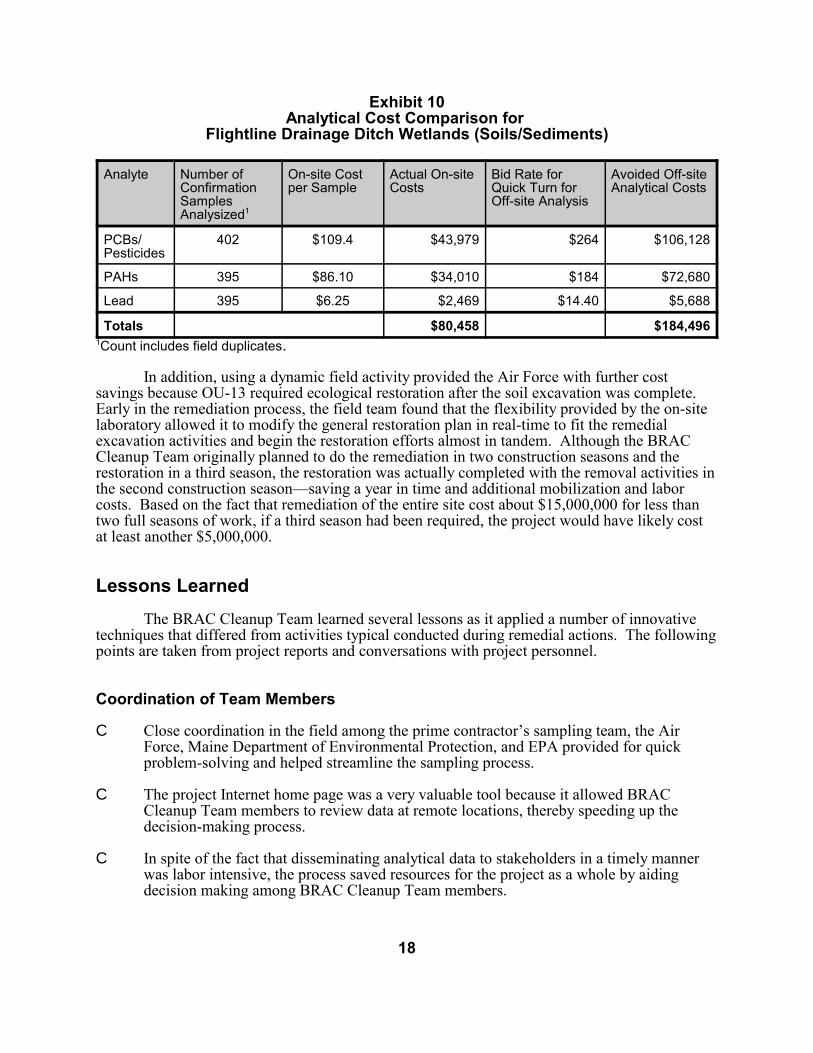
Exhibit 10Analytical Cost Comparison for
Flightline Drainage Ditch Wetlands (Soils/Sediments)
1Count includes field duplicates.
In addition, using a dynamic field activity provided the Air Force with further cost savings because OU-13 required ecological restoration after the soil excavation was complete. Early in the remediation process, the field team found that the flexibility provided by the on-site laboratory allowed it to modify the general restoration plan in real-time to fit the remedial excavation activities and begin the restoration efforts almost in tandem. Although the BRAC Cleanup Team originally planned to do the remediation in two construction seasons and the restoration in a third season, the restoration was actually completed with the removal activities in the second construction season—saving a year in time and additional mobilization and labor costs. Based on the fact that remediation of the entire site cost about $15,000,000 for less than two full seasons of work, if a third season had been required, the project would have likely cost at least another $5,000,000.
Lessons Learned The BRAC Cleanup Team learned several lessons as it applied a number of innovative
techniques that differed from activities typical conducted during remedial actions. The followingpoints are taken from project reports and conversations with project personnel.
Coordination of Team Members
C Close coordination in the field among the prime contractor’s sampling team, the Air Force, Maine Department of Environmental Protection, and EPA provided for quick problem-solving and helped streamline the sampling process.
C The project Internet home page was a very valuable tool because it allowed BRAC Cleanup Team members to review data at remote locations, thereby speeding up thedecision-making process.
C In spite of the fact that disseminating analytical data to stakeholders in a timely manner was labor intensive, the process saved resources for the project as a whole by aidingdecision making among BRAC Cleanup Team members.
Analyte Number of Confirmation Samples Analysized1
On-site Cost per Sample
Actual On-site Costs
Bid Rate for Quick Turn for Off-site Analysis
Avoided Off-site Analytical Costs
PCBs/Pesticides
402 $109.4 $43,979 $264 $106,128
PAHs 395 $86.10 $34,010 $184 $72,680
Lead 395 $6.25 $2,469 $14.40 $5,688
Totals $80,458 $184,496
18
On-Site Data Generation
C On-site analysis enabled an expedited decision-making process which resulted in substantial cost savings.
C The field team had difficulty using immunoassay test kits because these kits were designed for targeting concentration ranges that did not match the project decisioncriteria. The lesson from this experience was that while immunoassays do have their place in dynamic field activities, their intended use should be scrutinized carefully before choosing them over other available field-based analytical methods. In addition, a method applicability study should be run on a few samples with site-specific matrices beforeimplementing an analytical program.
C Project planners can negotiate much lower prices on immunoassay test kits if they buylarge quantities directly from the manufacturer.
19
References
Bechtel Environmental, Inc. 1997. Loring Air Force Base. Technical Memorandum:Confirmation Analysis by On-site Laboratory. U.S. Air Force Center for Environmental Excellence (AFCEE), Brooks Air Force Base, Texas.
Bechtel Environmental, Inc. 1998a. Loring Air Force Base, Remediation of Basewide SurfaceWater/Sediment (OU-13) and Removal at Base Exchange Service Station Wetland (OU-5), Quality Assurance Project Plan, Revision 1. U.S. Air Force Center for Environmental Excellence (AFCEE), Brooks Air Force Base, Texas.
Bechtel Environmental, Inc. 1998b. Loring Air Force Base, Remediation of Basewide SurfaceWater/Sediment (OU-13) and Removal at Base Exchange Service Station Wetland (OU-5), Field Sampling Plan, Revision 1. U.S. Air Force Center for Environmental Excellence (AFCEE),Brooks Air Force Base, Texas.
Bechtel Environmental, Inc. 1998c. Loring Air Force Base, Remediation of Basewide SurfaceWater/Sediment (OU-13) and Removal at Base Exchange Service Station Wetland (OU-5), Remedial Action Work Plan, Revision 1. U.S. Air Force Center for Environmental Excellence (AFCEE), Brooks Air Force Base, Texas.
Bechtel Environmental, Inc. 1998d. Loring Air Force Base, Remediation of Basewide SurfaceWater/Sediment (OU-13) and Removal at Base Exchange Service Station Wetland (OU-5), Remedial Action Interim Report for 1997 Construction Season. U.S. Air Force Center for Environmental Excellence (AFCEE), Brooks Air Force Base, Texas.
Bechtel Environmental, Inc. 1998e. Loring Air Force Base, Remediation of Basewide SurfaceWater/Sediment (OU-13) and Removal at Base Exchange Service Station Wetland (OU-5), Remedial Action Work Plan, Addendum 1, April 1998. U.S. Air Force Center for Environmental Excellence (AFCEE), Brooks Air Force Base, Texas.
Bechtel Environmental, Inc. 1998f. Loring Air Force Base. OU-13 Data ManagementImplementation Plan. U.S. Air Force Center for Environmental Excellence (AFCEE), Brooks Air Force Base, Texas.
Bechtel Environmental, Inc. 1999. Loring Air Force Base, Remedial Action Report forFlightline Drainage Ditch Wetlands, East Branch Greenlaw Brook Wetlands, Greenlaw Brook, and Chapman Pit Manganese Sediment Removal Area, 1997 and 1998 Construction Seasons. U.S. Air Force Center for Environmental Excellence (AFCEE), Brooks Air Force Base, Texas.
USEPA. 1989. Methods for Evaluating the Attainment of Cleanup Standards, Volume 1: Soilsand Solid Media, EPA/230/02-89/042.
USEPA. 1994. QA/G-4 Guidance for the Data Quality Objectives Process, EPA/600/R-96/055.
USEPA, 1997. Test Methods for Evaluating Solid Waste, SW-846. Office of Solid Waste, Washington, DC.
20
Appendix AData Management Plan Summary
Introduction This summary is intended to provide the reader with an understanding of the structure of
a data management system (hardware/software), the personnel specifically required to operate it, and the actual process used to ensure timely and reliable outputs. The goal of the process at Loring Air Force Base was to provide raw data tables and visual aids within two days of data collection, verify the data within three days, and verify the validated data within four days with electronic posting at each stage for remote computer viewing by stakeholders.
Database Management Hardware Overview The prime contractor used a server for storing the project data. The server consisted of
two computer systems capable of supporting GIS: one was in the prime contractor’s home officeand the other on site. Supporting computers also were set up at the site office. Contractor staff at the home office processed data that came from the site and off-site laboratory. The processeddata could be accessed directly from the site or other remote computers. The data also were loaded on a website that was created to allow more convenient viewing by the Air Force and other stakeholders.
Data Management Software Overview The main data processing software included a relational database that contained several
boiler-plate formats for viewing data. The data were accessed directly by other compatible software and were transferred into compatible software spreadsheet tables. In addition, the Air Force used data visualization software that was compatible with a number of other data visualization systems (e.g., ArcInfo®, ArcView®, Intergraph® MGE).
Staffing
Laboratory Liaison. The individual who tracked all data transmittal packages and maintained communications with the on- and off-site laboratory facilities that were concerned with samplingmethods and testing controls.
Field Team. One or more individuals who ensured that field data (such as GPS surveying, well construction, soil texture logging, soil testing for borrow) were properly recorded; field activities were carried out according to procedures; and data quality was checked before the data were transmitted to the home office for entry into the central database.
Data Management Coordinator. The individual who gave direction to the data management specialist and ensured that the requirements of the Data Management Plan were met; that hardcopy records were processed according to project requirements; and that verification/ validation activities occurred as planned.
A-1
Data Management Specialist. The individual who ensured that all project information was entered into the central database and that entered data were accurately processed. This individual also assisted in the output of standard reports, pre-printed sample labels, and chain-of-custodyforms.
Data Verifier/Validator. Since turnaround time was important, this position required at leasttwo individuals (the number of individuals normally required varies depending on the site). The verifier ensured that analytical and field measurement data fulfilled the requested laboratoryanalyses and were verified as complete, within known ranges. The verifier performed a 10percent completeness check on electronic deliverable data versus hardcopy and a 100 percentcheck on review qualifiers. The validator determined whether the data were complete within known ranges, the analyses were performed per method, and identified any problems. The validator also qualified data that did not meet criteria.
GIS/Data Visualization Specialist. The individual(s) who: maintained consistent spatial data across all the geographic study areas; developed interfaces between the spatial data component ofthe maps and the associated data in the main database; and assisted in producing the visualization products for the project field team, home office, and stakeholders. (At some sites, a GIS/DataVisualization Specialist may be required in both the home office and in the field.)
Sample Data Management Work Processes The following section describes the project team’s actions that made the semi-real time
system work. Exhibit 8 presents a decision-tree flow diagram of the process.
Preplanning
Preplanning included designing a database. This activity involved identifying the data to be collected and their associated data fields; then developing data flow regimes to identified potential bottle-necks. In going through this process, the prime contractor discovered that it was able to meet the project requirements with a pre-existing database structure, genericallydeveloped for other projects.
Sample Information Flow
Day 0. On day 0 the sample team collected the samples and completed the chain-of-custodyforms. Concurrent with the sampling, the sampling team collected GPS position data. (Generally, if the number of sampling locations and their identification numbers are known before the sampling takes place, this information can be entered into the main database and the GPS before the sampling begins.) Samples were taken to the laboratory at noon and at the end of the day (around 1700 hours). The drop-off times were shortened or lengthened depending uponthe distance to the on-site laboratory and other factors. Information on the chain-of-custodydocuments was hand entered into the main database. The GPS data were returned to the field office only at the end of the day.
Day 1. The Day 0 GPS data were post-processed to correct for signal degradation introduced bythe Department of Defense. (This no longer occurs.) The location data were then checked and downloaded to the main database. The on-site laboratory completed analysis of the samples and submitted an electronic data document and hardcopy to the laboratory liaison at the home office
A-2
by the end of the day. (The liaison may be on site depending upon the costs of locating one there.)
Day 2. After the laboratory liaison reviewed the data received at the end of Day 1 for any gross errors, the electronic data document was downloaded to the main database and posted on theproject homepage in an Interim Results Table as unverified and unvalidated data. (Hadimmunoassay results been involved, an electronic data document would have been created from the field analytical logbook, since these measurements are not electronically generated.) By the end of the day, a visualization software plot of the unverified and unvalidated data was created and posted to the project homepage. To produce three-dimensional displays, the geologist’s subsurface soil descriptions were taken electronically in the field or transcribed at the home office from hardcopy into software that was compatible for downloading with the main database.
Day 3. Screening data verification was performed on approximately 10 percent of the unverifiedand unvalidated data posted on Day 2. Unacceptable data were resubmitted to the on-site laboratory for rework. Acceptable data, classified as verified/unvalidated, were used to updatethe main database. The verified/unvalidated results were posted to the project homepage, replacing the unverified and unvalidated results posted on Day 2. The verified/unvalidatedresults were then used to update the visualization software plot created on Day 2. The updatedplot was posted to the project homepage. Decisions made using the unverified and unvalidated data were verified, and confirmation sampling data was 100 percent verified.
Day 4. Validation was performed on approximately 10 percent of the screening data posted onDay 3 (100 percent of the confirmation sampling data was validated). Unacceptable data was resubmitted to the on-site laboratory for rework and were reported as rejected in the main database. After validation, the database was updated with the validation qualifiers, and the datawere noted as verified/validated. The updated visualization was posted to the project homepage. Decisions made using the verified and unvalidated data were checked.
Data Access
The project set up several remote access methods to the data and GIS generated maps andprovided local access at the site and the home office. The project homepage allowed direct access to the information via the Internet. A “Desk Top to Web Top” application was created. Data owners who generated project information, such as database reports or maps, accessed fileson the project server. The project homepage contained hyperlinks to these files in their native file format. When owners entered their desk top environment and performed their normal workprocesses, project staff accessing the “web top” saw the latest information automatically. Data were stored in one location only, thereby minimizing data processing and updating.
Three options were considered to supplement the project homepage and provide access todata. One option would have provided access to the database and all standard prime home office computing applications using a dial-up remote server access. The end user would have needed a modem and a prime contractor remote server access software kit to utilize this option. Another option would have provided access via a virtual private network, which is an extranet that allows secure access to external users wanting to browse information within the prime’s corporate firewall. This option would have been more expensive than the first option because it requires the user to have a hardware server with virtual private network client software installed. A third option for accessing the database would have involved an intranet web account that was secured within the prime’s corporate firewall. The third option was chosen for this project because it did not require the user to have any special hardware or software.
A-3
Issues and Concerns
Data Entry. The majority of the data were generated electronically. Had field generated data (e.g., analytical, geological, hydrogeological) not been produced electronically and thus hand keyed, the level of effort required to produce the proposed turnaround times would have been greater. (Although all field-generated data eventually have to be reduced to an electronic format, costs increase when it has to be done within an expedited time frame.)
Data Verification and Validation. The prime contractor maintained its own relatively large chemistry group that was capable of doing data validation and verification in-house. Hence it had control of the process from start to finish. In many cases, this type of work is subcontracted.(Involving a subcontractor presents a logistics and cost problem, since the subcontractor has to maintain staff at the prime’s home office or have the hardcopy data shipped to the prime, creating an extra step. In addition, 24-hour turnaround times may increase the subcontractor’s costs because they make management of overall client workload more difficult.)
As noted above, this project did not require a large geology/hydrogeology effort. However, the non-chemistry data required verification and validation in the same timeframe to ensure that field decisions were based on accurate depictions of subsurface conditions.
A-4
Appendix B Quality Assurance Project Plan Summary
Introduction The quality assurance project plan (QAPP) developed for Loring Air Force Base
addressed on-site and off-site performance requirements for the analysis of soil and sediment samples. This summary emphasizes several details of the on-site activities that were called for in the QAPP.
Off-Site Laboratory SW-846 methods were used to conduct off-site laboratory analyses. The method
detection limits for the analyses were capable of detecting the contaminants of concern at the remediation goal levels established for them (see Exhibit 3). State of Maine methods 4.1.25 (diesel range organics) and 4.2.17 (gasoline range organics) also were used. The QAPP set forth precision, accuracy, completeness, representativeness, and comparability requirements for the sampling and analysis. It also covered sampling and handling, number and type of QC samples,and surrogate and control sample recovery requirements from the various applicable methods.
On-Site Laboratory and Analysis In keeping with the structure of most dynamic work plans, the QAPP outlined the QA and
QC requirements for a variety of potential methods. While not all of them were used, pre-approval was obtained from the regulators for them. The methods chosen for the field analysis were:
C Soil Screening for PCBs by Immunoassay (Draft EPA Method 4020).C Soil Screening for PAHs by Immunoassay (Draft EPA Method 4035).C Soil Screening for Petroleum Hydrocarbons by Immunoassay (Draft EPA Method 4030).C Soil Screening for Pesticides/PCBs by Gas Chromatography (Modified EPA Method
8081). C Soil Screening for Petroleum Hydrocarbons by Gas Chromatography (Modified Maine
Methods 4.1.25 and 4.2.17). C Soil Screening for PAHs by Gas Chromatography (Modified EPA Method 8100). C Soil Screening for Lead and Zinc by X-Ray Fluorescence (EPA Field Analytical Support
Method F100.001). C On-Site Confirmation Analysis for PAHs by Gas Chromatography (Modified EPA
Method 8100). Added in July 1997. C On-Site Confirmation Analysis for Pesticides/PCBs by Gas Chromatography (Modified
EPA Method 8081). Added in July 1997.
The PCB and PAH immunoassay calibration instructions required standards to equilibrate to ambient temperature before use. The calibration instructions also allowed users to follow the instructions of any given test kit, since these are frequently revised, and to maintain all records pertaining to calibration for review and assessment.
B-1
For the two metals of concern (lead and zinc), the XRF calibration curves were generated according to the manufacturer’s instructions. The lowest standard was less than or equal to one-half the associated remediation goal. The instrument was energy calibrated a minimum of once per day with a pure copper standard or a standard recommended by the manufacturer. Calibration curves were verified initially and at a 10 percent frequency on a continuing basis. Samples from the field were ground to pass a pre-set sieve size.
The requirements for calibrating the on-site gas chromatographs reflected the qualityneeded for the decision. For screening purposes, the following calibration steps were required:
C Initial calibration consisted of at least three standards for each target analyte. The lowest standard was less than or equal to one-half the associated remediation goal.
C Acceptable calibration was achieved when the correlation coefficient of the curve (r) was>0.995, or r2 was >0.9899, or the relative percent difference of calibration factors was less than 30 percent.
C Continuing calibration was verified each day prior to sample analysis and for every 20 samples analyzed. The difference had to be within 20 percent.
For the GC, the project used a micro-extraction technique (Modified Spittler Extraction)for obtaining samples for analysis rather than full volume extraction generally used in fixed laboratories.
Since confirmation samples were used to determine if an area met the project’s remediation standards, their QC requirements were higher and consisted of the following:
C Calibration curves developed from a minimum of five standards. The relative percent difference of the calibration factors had to be less than or equal to 20 percent or thecorrelation coefficient (r) >0 .998.
C A daily calibration check standard was analyzed at the beginning of each day, and for the analysis to continue, the percent difference (%D) was required to be less than or equal to 15 percent.
C Continuing and closing calibration checks were analyzed after every 10 injections/analyses and at the end of the day. The acceptance criteria for the %D was less than or equal to 15 percent.
In addition to the above, the on-site laboratory prepared and analyzed the following for confirmation samples:
Method Blank. Method blanks were run at a frequency of one per preparation batch,where a batch did not exceed 20 samples. If target analytes exceeded the practical quantitation limit in the method blank then corrective actions were performed, whichincluded (but were not limited to) determining the source of contamination, reanalyzingfor the failed analytes and re-extracting/reanalyzing all associated samples.
Surrogate. Surrogates were added to each standard, blank, and sample. The laboratorydetermined control limits for surrogate recovery on a matrix-specific basis and conformed to the following requirements:
B-2
Modified Method 8081 Organochlorine Pesticides and PCBs: Suggested surrogates tetrachloro-m-xylene and decachlorobiphenyl with recovery limits in soils of between 30 and 150 percent.
Modified Method 8100 PAHs: Suggested surrogates 2-fluorobiphenyl and 1-fluoronaphthalene with control limits in soil that were laboratory-derived.
Matrix Spike/Matrix Spike Duplicate. MS/MSD pairs were prepared at a frequency of 1 per 20 samples per matrix. The recovery of the MS analyte had to meet the criteria of the LCS for that analyte. (Had the recovery been outside the established limit, the MS would have been analyzed again for that analyte. If the reanalysis also was out of control for that analyte, then all affected samples would be qualified for that analyte.)
Laboratory Control Samples. LCS was prepared at a frequency of 1 per preparationbatch. A batch was not to exceed 20 samples. The laboratory determined control limits for the LCS on an analyte-specific basis. The laboratory-determined limits fell within the EPA established multi-laboratory control limits for the LCS. (Had the recovery of the LCS been outside control limits, all samples associated with the LCS would have been reanalyzed. If the recovery was still outside control limits, the entire batch would be re-extracted and reanalyzed.)
Confirmation Sampling Grid Calculations The following equations were used to calculate the number of samples and grid spacing:
C long axis (L) = [hot spot area/B x hot spot shape]0.5
C grid interval (Gx) = L/(L/G) where (L/G) = 0.78C number of samples (n) = A/Gx
2
C grid interval (G o) = 0.866 x Gx
Based on the total excavation area, a hot spot size (described as a percent of the total excavated area) was estimated, and the number of confirmation samples and maximum grid spacing were calculated. The following conditions and parameters were assumed:
C A = the excavated area as measured at ground surface
C triangular grid is used
C expected shape (ES) of hot spot = 0.5 (ES = S/L, S is short axis length and L is long axis length)
C area of hot spot ellipse = (3.14)(S)(L)
C L/G = 0.78 where G = grid interval (x-axis) and the tolerable false positive decision errorrate is 10 percent
C grid interval (y-axis) = (G)(.866) to account for the 30 degree angle (e.g., cos 30 = .866)
C grid nodes are offset by one half the x axis grid spacing (triangular grid)
B-3