Embed Size (px)
Citation preview

1
Fiducia TGReliability Life Cycle Management (RLCM)
May 26th 2016
Jim Bartos

2
Introduction
About Fiducia TG
1. Fiducia TG is Headquartered in Cincinnati, Ohio USA
A. Reliability Benchmarking based on Reliability Life Cycle Maturity Index (RLCMI)
B. Reliability Life Cycle Management (RLCM)
C. Reliability Methods
About Presentation
1. Review Reliability Life Cycle Maturity Index for Complex Systems
2. Show Details of Reliability Life Cycle Management Index
A. Review Basic Steps of Level 3
B. Review some of the details of several steps
3
Agenda
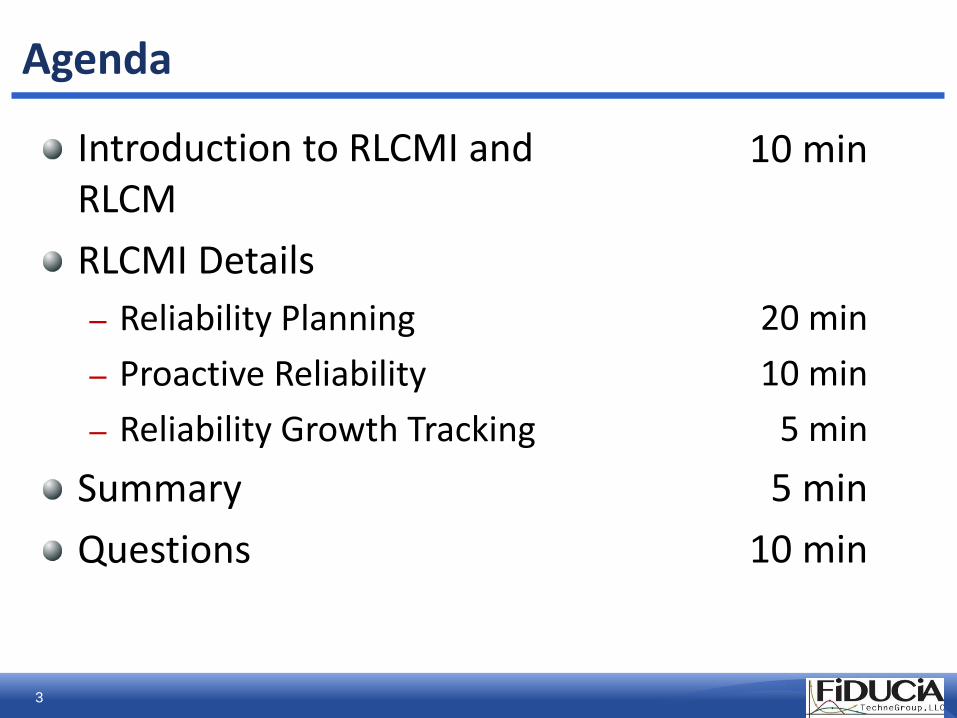
Introduction to RLCMI and RLCM
RLCMI Details
– Reliability Planning
– Proactive Reliability
– Reliability Growth Tracking
Summary
Questions
10 min
20 min
10 min
5 min
5 min
10 min
4
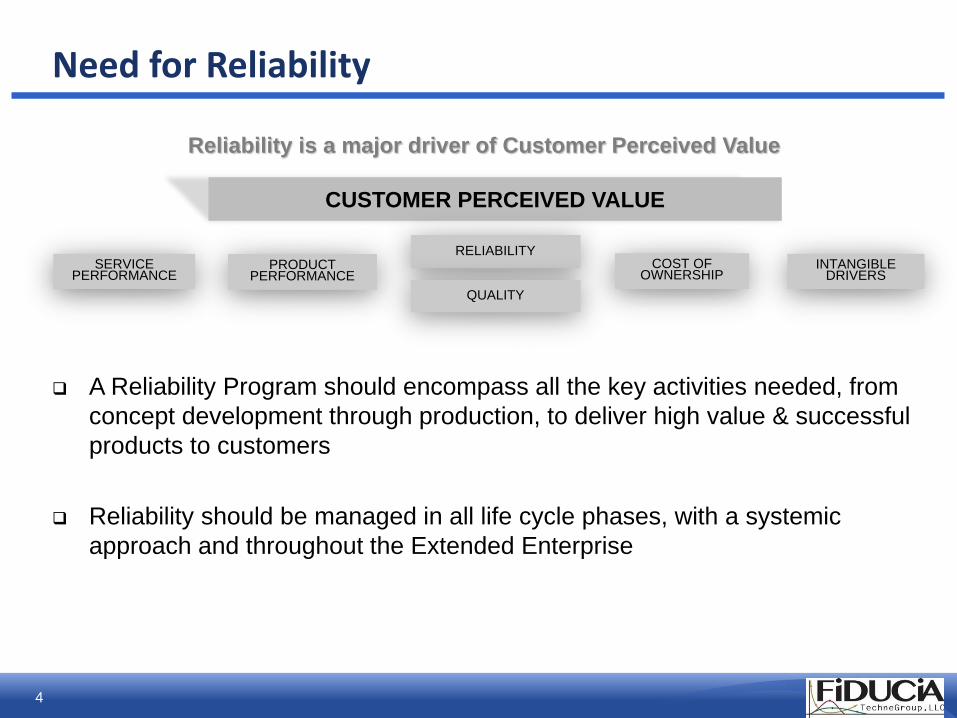
Need for Reliability
A Reliability Program should encompass all the key activities needed, from
concept development through production, to deliver high value & successful
products to customers
Reliability should be managed in all life cycle phases, with a systemic
approach and throughout the Extended Enterprise
CUSTOMER PERCEIVED VALUE
SERVICE PERFORMANCE
COST OF OWNERSHIP
PRODUCT PERFORMANCE
INTANGIBLE DRIVERS
RELIABILITY
Reliability is a major driver of Customer Perceived Value
QUALITY

5
Each level represents a breakthrough in the effectiveness of the reliability process and the results achieved
Reliability Life Cycle Maturity Index (RLCMI)
Is a index of different Reliability Life Cycle Management Levels (RLCM)How can RLCMI bring value to your organization and Customers? Companies who achieved higher RLCMI level experienced:
– Lower the product development cost and time to market.
– More upfront reliability planning and activities are realized
– Fewer prototypes are necessary to achieve reliability targets
– More accurate the reliability predictions

6
Reliability Life Cycle Maturity Index (RLCMI)
The RLCMI positioning and benchmark activities will evaluate the Customer’s reliability maturity and help them advance to the next level
Key Steps to Growing your Reliability Maturity:– Establish current Reliability Maturity level within your
organization– Conduct benchmark at all levels of a
company – Conduct a gap analysis between
your company’s process and your industries best practices
Fiducia TG uses its RLCMI approach to benchmark a company’s reliability processes against the industry ‘s best practices

7
RLCMI Process Map for Reliability Maturity Improvement Planning
Reliability Methods
and Tools
Project #1
Project Objectives
Project
Tasks
Task
Dates
Task
Lead
Project Deliverables and
Measurables
Reliability Process
Implementation
Project #2
Project Objectives
Project
Tasks
Task
Dates
Task
Lead
Project Deliverables and
Measurables
Reliability
Management
Project #1
Project Objectives
Project
Tasks
Task
Dates
Task
Lead
Project Deliverables and
Measurables
Reliability Methods
and Tools
Project #2
Project Objectives
Project
Tasks
Task
Dates
Task
Lead
Project Deliverables and
Measurables
Reliability Planning
Project #1
Project Objectives
Project
Tasks
Task
Dates
Task
Lead
Project Deliverables and
Measurables
Reliability Process
Implementation
Project #3
Project Objectives
Project
Tasks
Task
Dates
Task
Lead
Project Deliverables and
Measurables
Reliability Process
Implementation
Project #3
Project Objectives
Project
Tasks
Task
Dates
Task
Lead
Project Deliverables and
Measurables
Reliability
Management
Project #2
Project Objectives
Project
Tasks
Task
Dates
Task
Lead
Project Deliverables and
Measurables
Reliability
Management
Project #3
Project Objectives
Project
Tasks
Task
Dates
Task
Lead
Project Deliverables and
Measurables
Reliability Planning
Project #2
Project Objectives
Project
Tasks
Task
Dates
Task
Lead
Project Deliverables and
Measurables
Project Planning for Maturity Growth
Positioning and Reliability Maturity
Gap Analysis
Team Workshops– Kick-off and Planning
Individual Interviews and Discussions
3
Benchmark Recently Closed Project
1
2
2aFiducia TG
Benchmarking Data
8
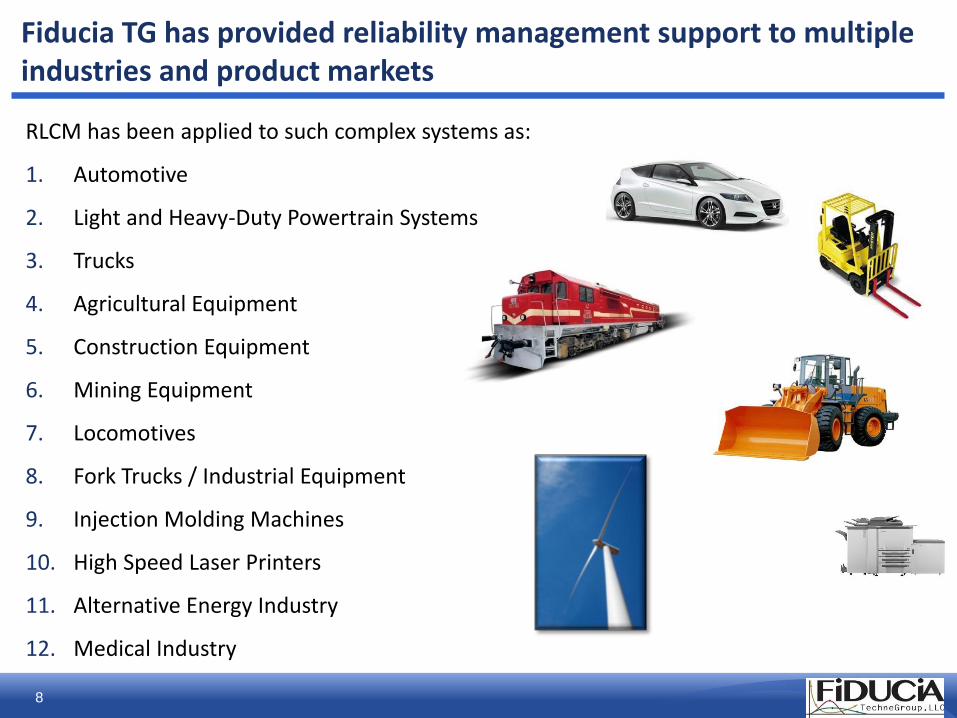
Fiducia TG has provided reliability management support to multiple industries and product markets
RLCM has been applied to such complex systems as:
1. Automotive
2. Light and Heavy-Duty Powertrain Systems
3. Trucks
4. Agricultural Equipment
5. Construction Equipment
6. Mining Equipment
7. Locomotives
8. Fork Trucks / Industrial Equipment
9. Injection Molding Machines
10. High Speed Laser Printers
11. Alternative Energy Industry
12. Medical Industry

9
Reliability Life Cycle Management (RLCM) Level 3
Set
Reliability
Growth
Target
Analyze
Product New
Content
Plan Detailed
Proactive
Activities
Develop &
Evaluate
Alternative
RG Plans
Select and
Optimize RG
Plan
Execute RG
Test
Program
Track and
Manage RG
Status vs,
Plan
Adjust RG
Plan as
required
Product
Launch
Planning
RG Testing
Plan Detailed
RG Activities
Execute
Proactive
Activities
Track &
Manage
Proactive
Effort
Adjust RG
Plan as
required
Final
Evaluation of
Proactive
Effort
Analyze
Warranty
Data
Reliability
Capability
Analysis
Carry-Over
Failure Mode
Analysis
Proactive

10
RLCM Details

11
Warranty Data Analysis

12
Warranty Data Analysis
Current product Reliability performance baseline based on latest warranty data from the field. This includes the results below.
1. Customer Usage Distributions (usage time per year)
2. Failure Rates (Failures per Unit) during the base warranty period and other periods of customer ownership as required
3. Failure Cost (Warranty Repair Cost per Unit) During the Base Warranty Period and other periods of customer ownership as required
4. Infant Mortality and Useful Life reliability levels
13
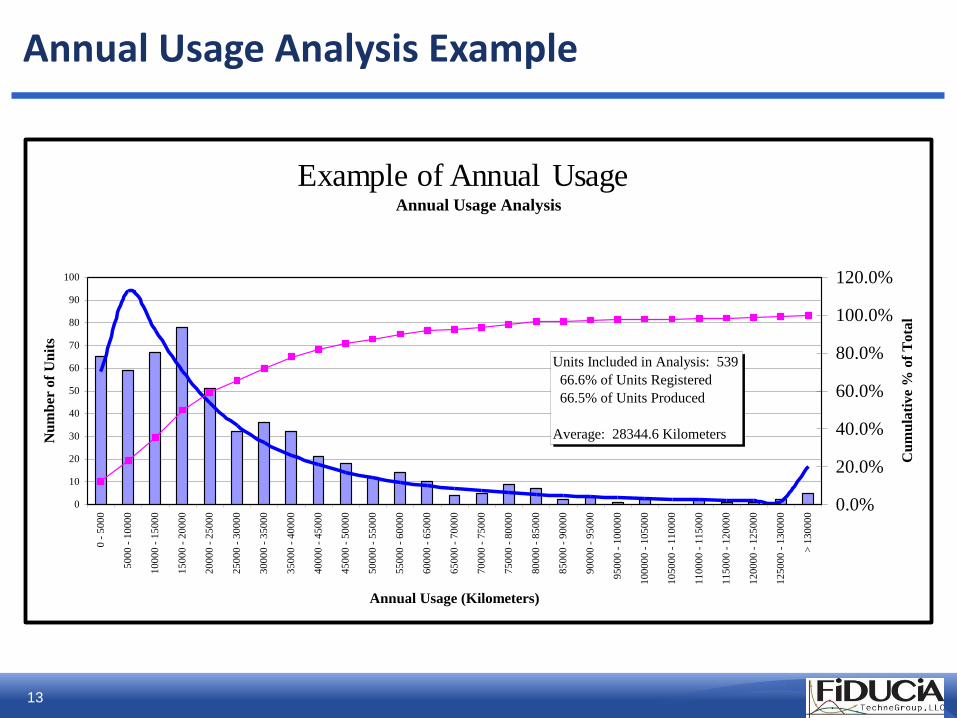
Annual Usage Analysis Example
TB
TB Warranty Data 1999 7/1 to 12/31
Annual Usage Analysis
Model = FG (Excluding the Dump Truck and 4D33 Engine)
0
10
20
30
40
50
60
70
80
90
100
0 -
50
00
50
00
- 1
00
00
10
00
0 -
15
00
0
15
00
0 -
20
00
0
20
00
0 -
25
00
0
25
00
0 -
30
00
0
30
00
0 -
35
00
0
35
00
0 -
40
00
0
40
00
0 -
45
00
0
45
00
0 -
50
00
0
50
00
0 -
55
00
0
55
00
0 -
60
00
0
60
00
0 -
65
00
0
65
00
0 -
70
00
0
70
00
0 -
75
00
0
75
00
0 -
80
00
0
80
00
0 -
85
00
0
85
00
0 -
90
00
0
90
00
0 -
95
00
0
95
00
0 -
10
00
00
10
00
00
- 1
05
00
0
10
50
00
- 1
10
00
0
11
00
00
- 1
15
00
0
11
50
00
- 1
20
00
0
12
00
00
- 1
25
00
0
12
50
00
- 1
30
00
0
> 1
30
00
0
Annual Usage (Kilometers)
Nu
mb
er o
f U
nit
s
0.0%
20.0%
40.0%
60.0%
80.0%
100.0%
120.0%
Cu
mu
lati
ve
% o
f T
ota
l
Units Included in Analysis: 539
66.6% of Units Registered
66.5% of Units Produced
Average: 28344.6 Kilometers
Example of Annual Usage

14
Failure Rate Example – First Year of Use
TB Canter
Warranty Data from year 2000 8/1 to 12/31, Japanese Market
Failures per Unit during First Years
Model = FG (Excluding the Dump Truck and 4D33 Engine)
0
50
100
150
200
250
300
350
0 1 2 3 4 5 >=6
Failures per Unit
Nu
mb
er o
f U
nit
s
0.0%
20.0%
40.0%
60.0%
80.0%
100.0%
120.0%
Cu
mu
lati
ve
% o
f T
ota
l
Units Included in Analysis: 538
100.0% of Units Registered
99.8% of Units Produced
Number of Failures: 399
Average: 0.742 Failures per Unit
90% Confidence Interval: [0.657, 0.827]

15
Infant Mortality and Useful Life MTBF’s
TB Canter
Warranty Data from year 2000 8/1 to 12/31, Japanese Market
Failures per Unit vs. Operating Time (First 30,000 Km)
Model = FG (Excluding Dump Truck and 4D33 Engine)
0.00
0.20
0.40
0.60
0.80
1.00
1.20
1.40
1.60
1.80
2.00
0 5000 10000 15000 20000 25000 30000 35000 40000 45000
Operating Time (Kilometers)
Cu
mu
lati
ve
Fa
ilu
res
per
Un
it Units Included in Analysis: 189
35.1% of Units Registered
35.1% of Units Produced
Warranty Period:
100000 Kilometers Usage
21112 Mean Kilometers Between Failures
Useful Life:
20217 Mean Kilometers Between Failures
23112 Average Cost per Failure
Infant Mortality:
19354 Mean Kilometers Between Failures
1.045 X (Useful Life Failure Rate)
23818 Average Cost per Failure

16
Reliability Capability Analysis

17
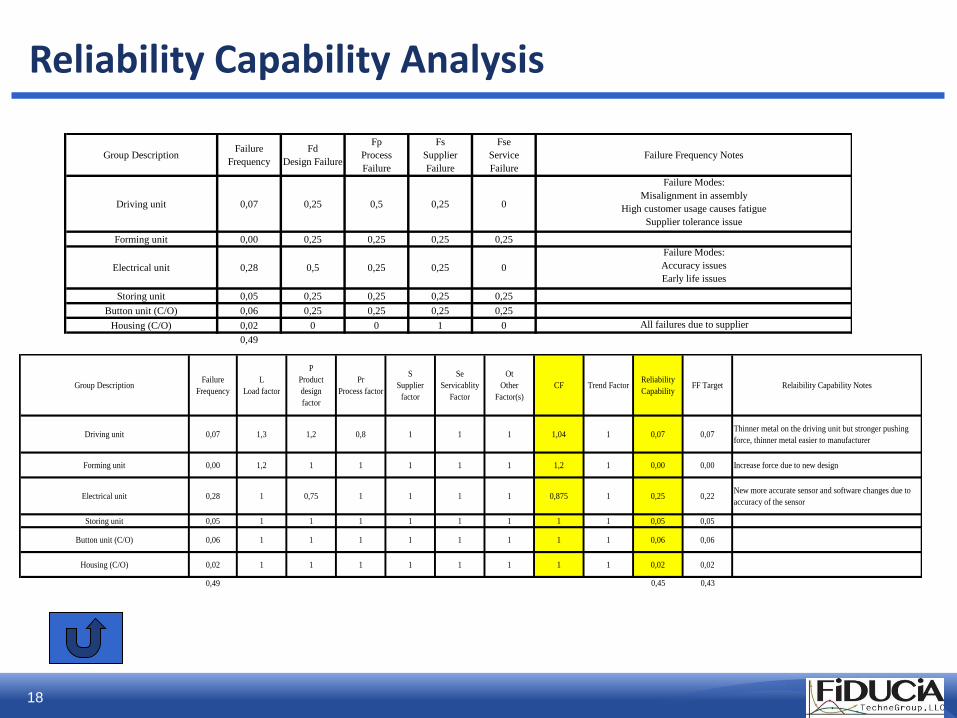
Reliability Capability Analysis
Reliability Capability
This is the best value of the reliability measure that the product can attain. It should take into consideration the following:
1. The complexity and nature of the product
2. The previous and new design concept
3. Historic product reliability levels for the company
4. Best-in-class and World class Reliability levels
For an aggressive program, the target will equal the Product Capability, but the target should never exceed the capability.
Reliability Capability provides a “Baseline” or “Benchmark” for what is realistically achievable. The higher the baseline, the higher the staring point will be.
18
Reliability Capability Analysis
Group DescriptionFailure
Frequency
L
Load factor
P
Product
design
factor
Pr
Process factor
S
Supplier
factor
Se
Servicablity
Factor
Ot
Other
Factor(s)
CF Trend FactorReliability
CapabilityFF Target Relaibility Capability Notes
Driving unit 0,07 1,3 1,2 0,8 1 1 1 1,04 1 0,07 0,07Thinner metal on the driving unit but stronger pushing
force, thinner metal easier to manufacturer
Forming unit 0,00 1,2 1 1 1 1 1 1,2 1 0,00 0,00 Increase force due to new design
Electrical unit 0,28 1 0,75 1 1 1 1 0,875 1 0,25 0,22New more accurate sensor and software changes due to
accuracy of the sensor
Storing unit 0,05 1 1 1 1 1 1 1 1 0,05 0,05
Button unit (C/O) 0,06 1 1 1 1 1 1 1 1 0,06 0,06
Housing (C/O) 0,02 1 1 1 1 1 1 1 1 0,02 0,02
0,49 0,45 0,43
Group DescriptionFailure
Frequency
Fd
Design Failure
Fp
Process
Failure
Fs
Supplier
Failure
Fse
Service
Failure
Failure Frequency Notes
Driving unit 0,07 0,25 0,5 0,25 0
Failure Modes:
Misalignment in assembly
High customer usage causes fatigue
Supplier tolerance issue
Forming unit 0,00 0,25 0,25 0,25 0,25
Electrical unit 0,28 0,5 0,25 0,25 0
Failure Modes:
Accuracy issues
Early life issues
Storing unit 0,05 0,25 0,25 0,25 0,25
Button unit (C/O) 0,06 0,25 0,25 0,25 0,25
Housing (C/O) 0,02 0 0 1 0 All failures due to supplier
0,49

19
New Content Analysis

20
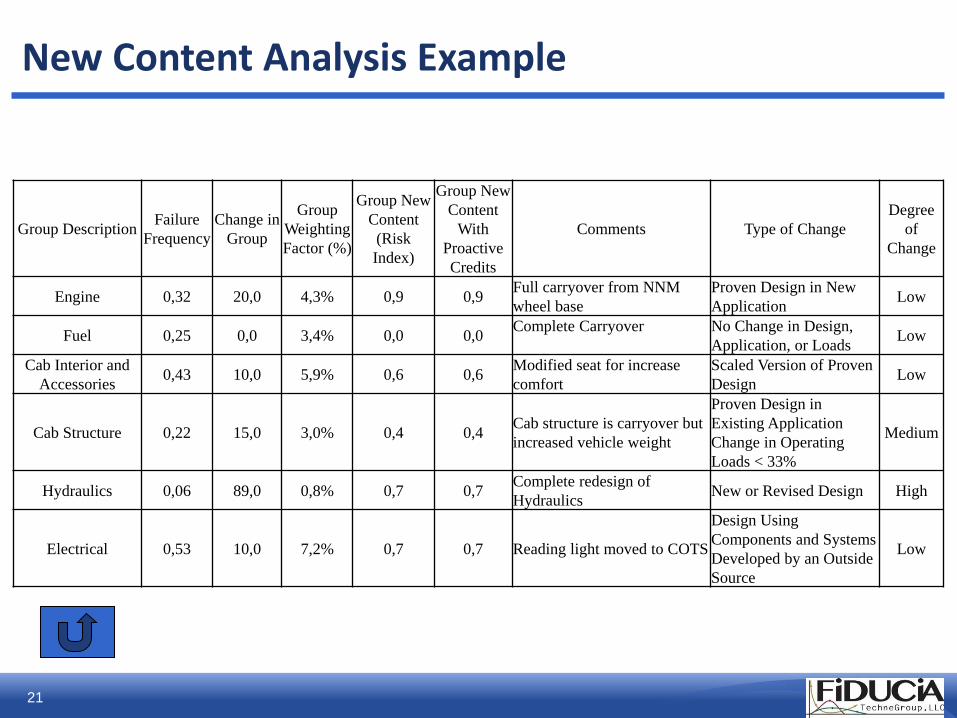
New Content Analysis
The objectives are:
1. Quantitatively evaluate the newness of the product design using a consistent method
2. Plan proactive reliability activities and the impact of the activities have on reliability risk reduction
3. Use the New Content result to empirically predict the starting reliability (or unreliability) of the first prototypes
4. Use the starting point prediction to proactively plan a Reliability Growth program for the new product
The larger the “New Content”:
1. The more untested and unproven the product design is
2. The more reliability risk associated with the new product
3. The more new, unforeseen, and unanticipated failure modes we expect
4. The higher our estimate for unreliability for the first prototypes produced
21
New Content Analysis Example
Group DescriptionFailure
Frequency
Change in
Group
Group
Weighting
Factor (%)
Group New
Content
(Risk
Index)
Group New
Content
With
Proactive
Credits
Comments Type of Change
Degree
of
Change
Engine 0,32 20,0 4,3% 0,9 0,9Full carryover from NNM
wheel base
Proven Design in New
ApplicationLow
Fuel 0,25 0,0 3,4% 0,0 0,0Complete Carryover No Change in Design,
Application, or LoadsLow
Cab Interior and
Accessories0,43 10,0 5,9% 0,6 0,6
Modified seat for increase
comfort
Scaled Version of Proven
DesignLow
Cab Structure 0,22 15,0 3,0% 0,4 0,4Cab structure is carryover but
increased vehicle weight
Proven Design in
Existing Application
Change in Operating
Loads < 33%
Medium
Hydraulics 0,06 89,0 0,8% 0,7 0,7Complete redesign of
HydraulicsNew or Revised Design High
Electrical 0,53 10,0 7,2% 0,7 0,7 Reading light moved to COTS
Design Using
Components and Systems
Developed by an Outside
Source
Low

22
Target Setting

23
Target Setting
System Reliability
Target
Reliability Capability
Analysis
Adjust Target
and/or Redesign
RC >= Target
Finalize System
Reliability Target
Cascade Targets
YesNo

24
Definitions Bathtub Curve
BATHTUB CURVE
Life of Product
Failu
re R
ate
Infant Mortality Useful Life Wearout
Reliability Durability
Warranty time
Constant Failure Rate
during the Useful Life
RG Testing

25
Infant Mortality vs. Useful Life Reliability Growth
Level 3 addresses mostly Useful Life Reliability
But IM and UL cannot be effectively addressed simultaneously by a single Reliability Growth program. Separate RG programs are required.
Fa
ilu
re R
ate
Infant
Mortality
Useful Life Growth
Useful Life
Fa
ilu
re R
ate
Infant
Mortality
Infant Mortality Growth
Useful Life
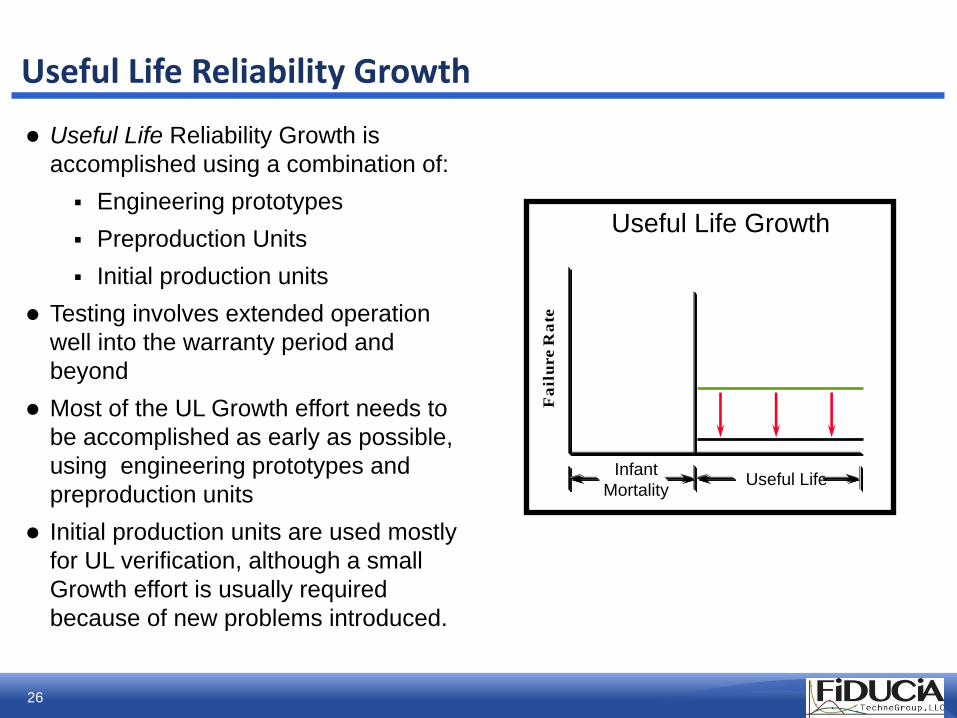
26
Useful Life Reliability Growth is
accomplished using a combination of:
Engineering prototypes
Preproduction Units
Initial production units
Testing involves extended operation
well into the warranty period and
beyond
Most of the UL Growth effort needs to
be accomplished as early as possible,
using engineering prototypes and
preproduction units
Initial production units are used mostly
for UL verification, although a small
Growth effort is usually required
because of new problems introduced.
Useful Life Reliability Growth
Fa
ilu
re R
ate
Infant
Mortality
Useful Life Growth
Useful Life
27
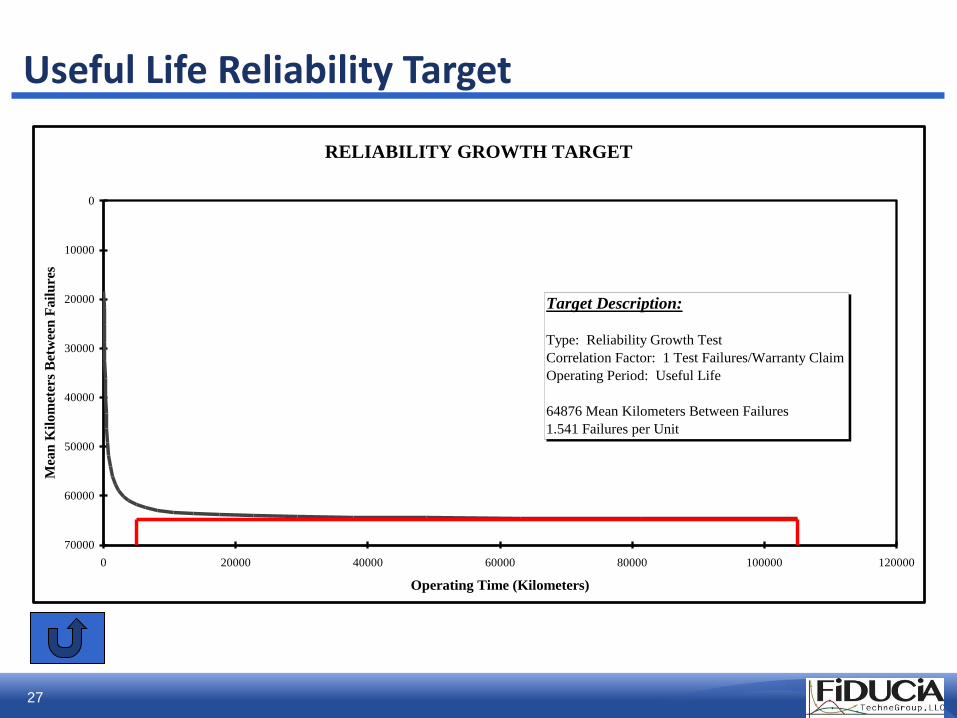
Useful Life Reliability Target
RELIABILITY GROWTH TARGET
Canter TD
0
10000
20000
30000
40000
50000
60000
70000
0 20000 40000 60000 80000 100000 120000
Operating Time (Kilometers)
Mea
n K
ilo
met
ers
Bet
wee
n F
ail
ure
s
Target Description:
Type: Reliability Growth Test
Correlation Factor: 1 Test Failures/Warranty Claim
Operating Period: Useful Life
64876 Mean Kilometers Between Failures
1.541 Failures per Unit

28
Proactive Reliability Planning

29
Proactive Reliability
Objective is to reduce reliability risk of product in concept and design phases Increase reliability of first prototypes
Reduce development costs
Reduced testing time to reach reliability targets
Optimize Proactive Activities Concentrate proactive activities on high new content items
Leverage existing knowledge
Concentrate on most likely failure modes
Plan and Track proactive reliability Plan each proactive reliability task and its effectiveness as it relates to
reliability.
Track each activity and evaluate the actual effectiveness of the activity

30
Proactive Reliability Activities
Activities that reduce the probability or risk of failures to occur for the chosen design (Does not include reliability validation testing)
Basic Proactive Reliability Methods1. Failure Modes and Effect Analysis (FMEA)
2. Fault Tree Analysis (FTA)
3. Component and Subsystem Testing (Life Testing)
4. Technical Risk Analysis
Advanced Proactive Reliability Methods1. Accelerated Life Testing (ALT)
2. Highly Accelerated Life Testing (HALT)
3. Probabilistic Design (Stress and Strength analysis)
4. Design for Assembly (DFA)
5. Software Reliability Process
6. Design of Experiments (DOE)/ Robust Design
7. Design for Six Sigma
Highly Advanced Proactive Reliability Methods1. Monte Carlo Simulation
2. System Engineering and Analysis Leads to Reliability of Design (SEALrD)
3. Reliability Prediction Model
31
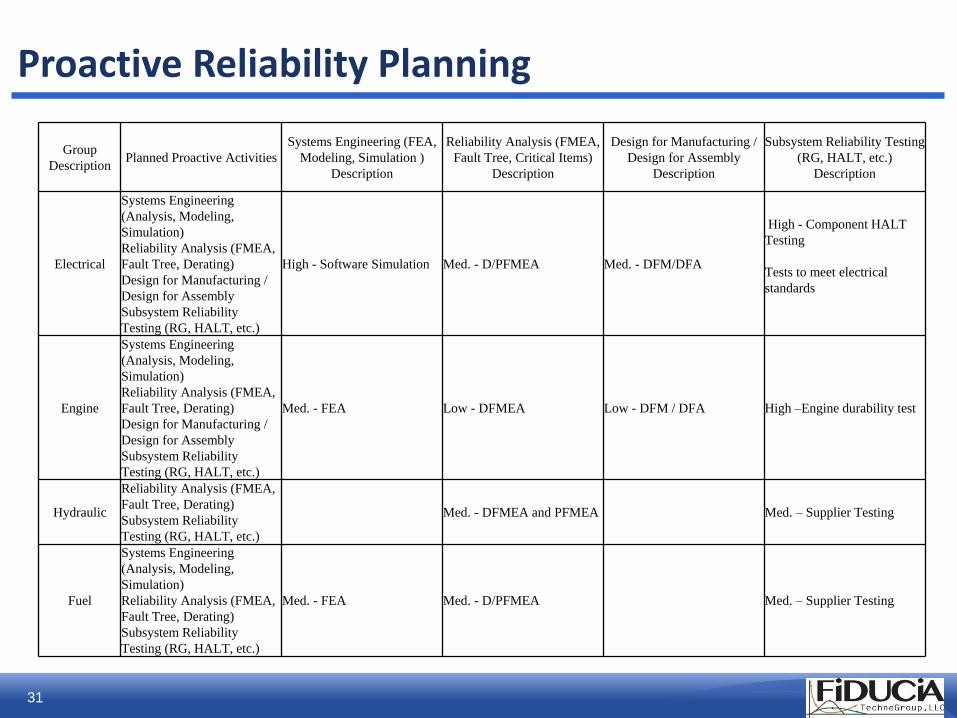
Proactive Reliability Planning
Group
DescriptionPlanned Proactive Activities
Systems Engineering (FEA,
Modeling, Simulation )
Description
Reliability Analysis (FMEA,
Fault Tree, Critical Items)
Description
Design for Manufacturing /
Design for Assembly
Description
Subsystem Reliability Testing
(RG, HALT, etc.)
Description
Electrical
Systems Engineering
(Analysis, Modeling,
Simulation)
Reliability Analysis (FMEA,
Fault Tree, Derating)
Design for Manufacturing /
Design for Assembly
Subsystem Reliability
Testing (RG, HALT, etc.)
High - Software Simulation Med. - D/PFMEA Med. - DFM/DFA
High - Component HALT
Testing
Tests to meet electrical
standards
Engine
Systems Engineering
(Analysis, Modeling,
Simulation)
Reliability Analysis (FMEA,
Fault Tree, Derating)
Design for Manufacturing /
Design for Assembly
Subsystem Reliability
Testing (RG, HALT, etc.)
Med. - FEA Low - DFMEA Low - DFM / DFA High –Engine durability test
Hydraulic
Reliability Analysis (FMEA,
Fault Tree, Derating)
Subsystem Reliability
Testing (RG, HALT, etc.)
Med. - DFMEA and PFMEA Med. – Supplier Testing
Fuel
Systems Engineering
(Analysis, Modeling,
Simulation)
Reliability Analysis (FMEA,
Fault Tree, Derating)
Subsystem Reliability
Testing (RG, HALT, etc.)
Med. - FEA Med. - D/PFMEA Med. – Supplier Testing
32
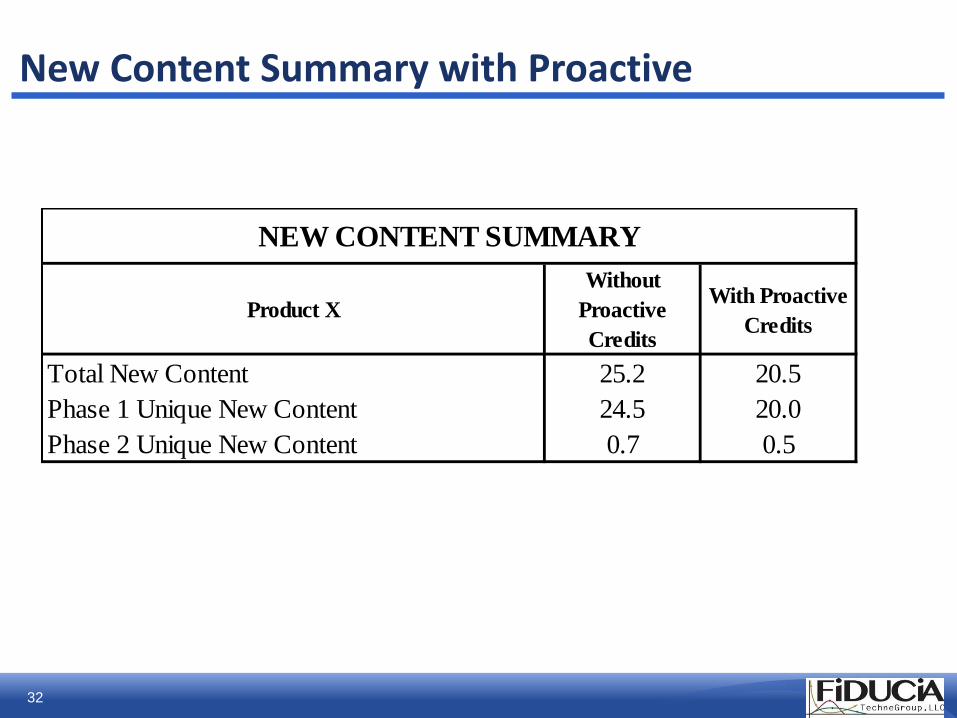
New Content Summary with Proactive
Product X
Without
Proactive
Credits
With Proactive
Credits
Total New Content 25.2 20.5
Phase 1 Unique New Content 24.5 20.0
Phase 2 Unique New Content 0.7 0.5
NEW CONTENT SUMMARY
33
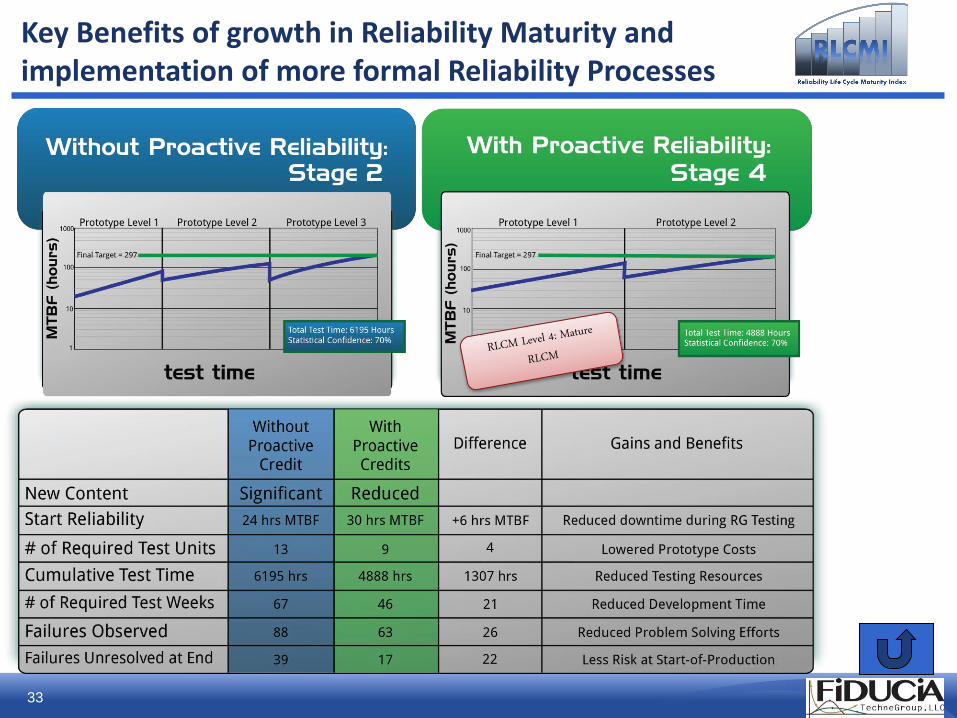
Key Benefits of growth in Reliability Maturity and implementation of more formal Reliability Processes

34
Reliability Growth Planning

35
Initial Product X Plan
1266
30767
1340
55347Final Target = 64900
Phase 1255000 Kilometers
6 Test Units7/18/2000 - 6/30/2001
Phase 2406567 Kilometers
6 Test Units7/30/2001 - 1/31/2002
1
10
100
1000
10000
100000
Mea
n K
ilo
met
ers
Bet
wee
n F
ail
ure
s
Test Time
RELIABILITY GROWTH PLAN
RG Test Plan Product X
Total Test Time: 661567 KilometersStatistical Confidence: 50.0%Total Test Time 661567 Kilometer
Statistical Confidence 75%
36
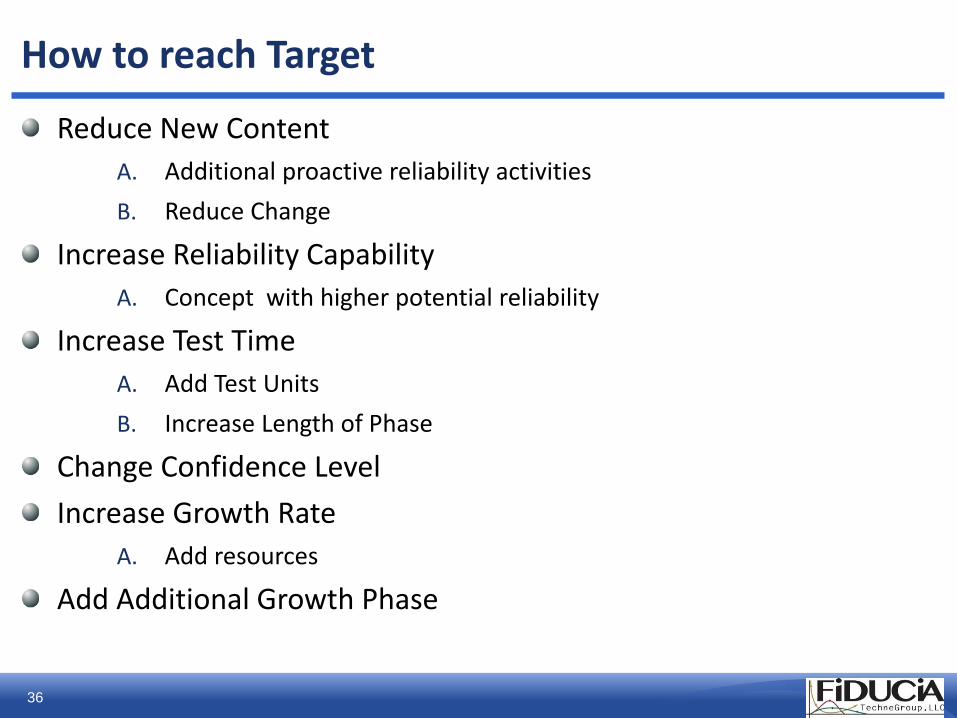
How to reach Target
Reduce New Content
A. Additional proactive reliability activities
B. Reduce Change
Increase Reliability Capability
A. Concept with higher potential reliability
Increase Test Time
A. Add Test Units
B. Increase Length of Phase
Change Confidence Level
Increase Growth Rate
A. Add resources
Add Additional Growth Phase

37
Updated Growth Plan
1280
33597
1353
64903Final Target = 64900
Phase 1255000 Kilometers
6 Test Units7/18/2000 - 6/30/2001
Phase 2556567 Kilometers
8 Test Units7/30/2001 - 1/31/2002
1
10
100
1000
10000
100000
Mea
n K
ilo
met
ers
Bet
wee
n F
ail
ure
s
Test Time
RELIABILITY GROWTH PLAN
RG Test Plan Product X
Total Test Time: 811567 KilometersStatistical Confidence: 50.0%
Added 2 Additional Test Units
Remove a High Risk Item
Added Proactive Activities
Total Test Time 811567 Kilometer
Statistical Confidence 75%

38
Feasibility Analysis
39
Proactive Reliability Tracking
Verifying the Risk Mitigation Plan

40
Proactive Details Sheet with Added Tasks
Functional Group Proactive Activity Task
Begin
Date End Date
Percent
Complete Task NC Score
Electrical - Components System FMEA 2-Jan-06 6-Mar-06 0.0% 0.856
Electrical - Components DFMEA 2-Jan-06 6-Mar-06 0.0% 0.543
Electrical - Wiring Transmission FMEA 17-May-06 28-Jul-06 54.0% 0.048
Electrical - Wiring DFMEA 17-May-06 28-Jul-06 65.0% 0.035
Hydraulic - Components System FMEA 17-May-06 28-Jul-06 54.0% 0.163
Hydraulic - Components SKID Test 2-Jan-06 6-Mar-06 0.0% 0.406
Hydraulic System System FMEA 17-May-06 28-Jul-06 25.0% 0.041
Hydraulic System SKID test 2-Jan-06 6-Mar-06 0.0% 0.103
Hydraulic System 3D model of system 2-Jan-06 6-Mar-06 100.0% 0.000
Operator Controls FMEA on ICM 2-Jan-06 6-Mar-06 0.0% 0.117

41
Tracking NC Status
New Content Chart for Product Y
Target = 16.9
NC = 17.1
Failures = 49.6
Final MTBF = 64717
NC = 19.4
Failures = 50
Final MTBF = 59382
NC = 20.2
Failures = 55.7
Final MTBF = 54912
NC = 21.3
Failures = 61.3
Final MTBF = 49945
Target = 16.9
16
17
18
19
20
21
22
10/11/1998 12/28/1998 3/15/1999 6/1/1999 8/17/1999 11/3/1999 1/19/2000
Date
Ne
w C
on
ten
t
Planned New Content
Current New Content
Target
New Content Summary
Starting New Content: 21.3
Target New Content: 16.9
Planned New Content: 19.6
Current New Content: 19.7

42
Reliability Growth Testing
Monitoring and Managing Reliability Growth During the Vehicle Test Phases

43
Identify previously unknown and unforeseen product reliability problems through testing
Eliminate failure modes using an intensive and disciplined problem solving process
Achieve reliability levels in the engineering prototypes and first production-built units that are:
1. Acceptable for market introduction
2. Consistent with the reliability objectives for the mature product
Ensure that reliability improvement proceeds as planned and on schedule
Dramatic improvements must be made in a minimum amount of
time, using a limited number of test units
What are the Objectives of a RG Program?
44
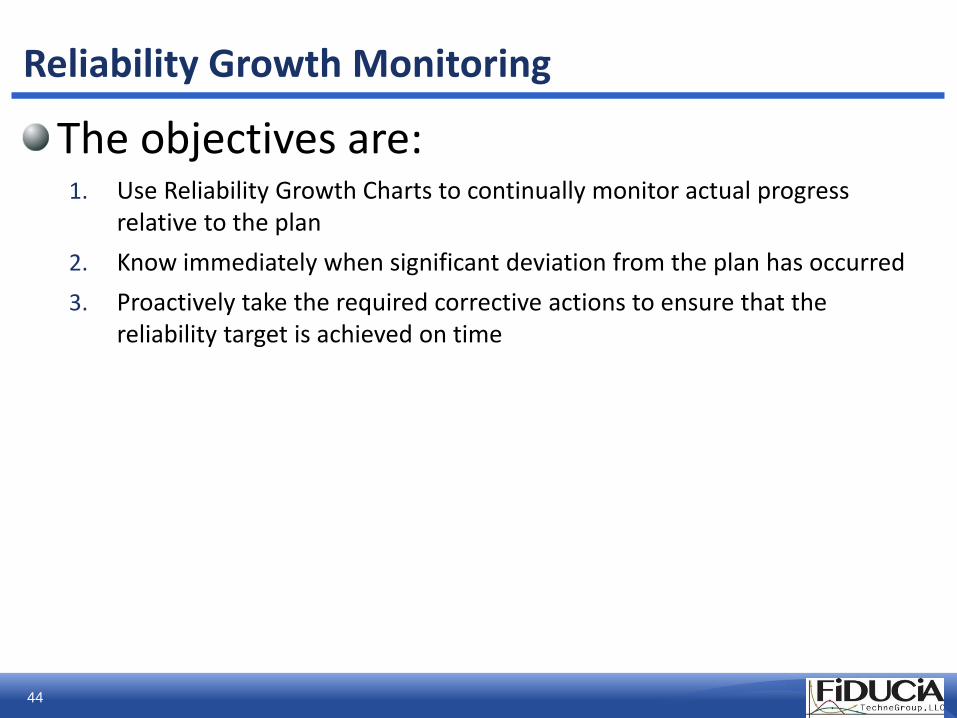
Reliability Growth Monitoring
The objectives are:1. Use Reliability Growth Charts to continually monitor actual progress
relative to the plan
2. Know immediately when significant deviation from the plan has occurred
3. Proactively take the required corrective actions to ensure that the reliability target is achieved on time

45
Sample Reliability Growth Chart
Target = 32398
Final Target = 64900
1000
10000
100000
1000 10000 100000 1000000
Mea
n K
ilo
met
ers
Bet
wee
n F
ail
ure
s
Total Test Time (Kilometers)
RELIABILITY GROWTH CHART
RG Test Plan for Product X Final - Phase 1
Current Status:
Total Test Time: 255500 Kilometers
Mean Kilometers Between Failures: 29473
Statistical Confidence: 50%
Total Failures Reported: 24
Total Failures Resolved: 16
Actual Unresolved Failures: 8
Planned Unresolved Failures: 7
46
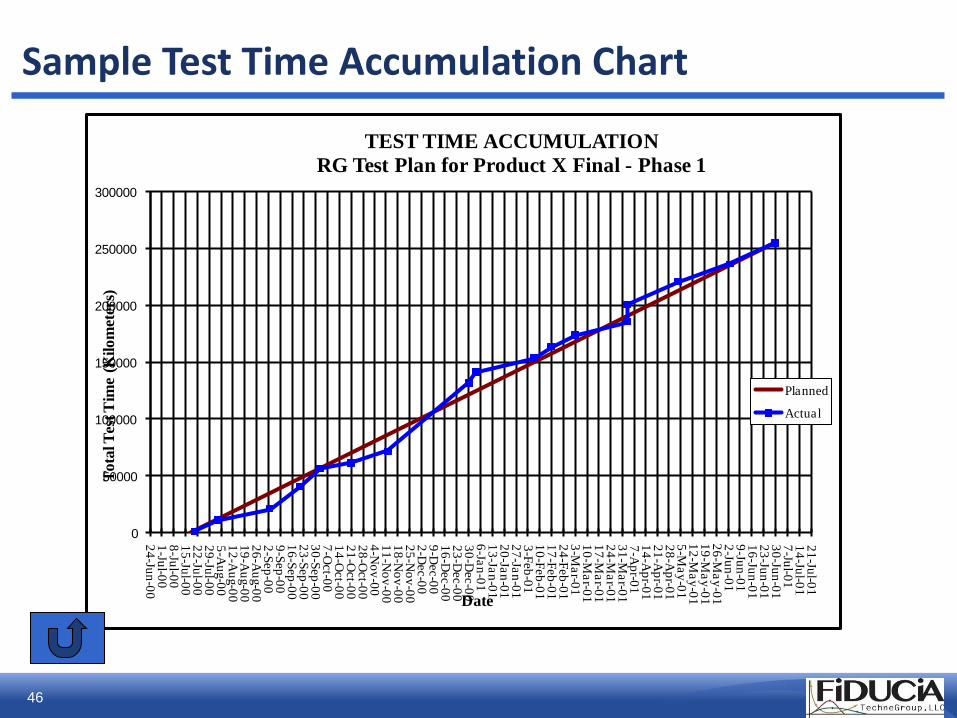
Sample Test Time Accumulation Chart
0
50000
100000
150000
200000
250000
300000
24
-Jun
-00
1-Ju
l-00
8-Ju
l-00
15
-Jul-0
02
2-Ju
l-00
29
-Jul-0
05
-Au
g-0
01
2-A
ug-0
01
9-A
ug-0
02
6-A
ug-0
02
-Sep
-00
9-S
ep
-00
16
-Sep
-00
23
-Sep
-00
30
-Sep
-00
7-O
ct-0
01
4-O
ct-0
02
1-O
ct-0
02
8-O
ct-0
04
-No
v-0
01
1-N
ov
-00
18
-No
v-0
02
5-N
ov
-00
2-D
ec-0
09
-Dec-0
01
6-D
ec-0
02
3-D
ec-0
03
0-D
ec-0
06
-Jan
-01
13
-Jan
-01
20
-Jan
-01
27
-Jan
-01
3-F
eb
-01
10
-Feb
-01
17
-Feb
-01
24
-Feb
-01
3-M
ar-0
11
0-M
ar-0
11
7-M
ar-0
12
4-M
ar-0
13
1-M
ar-0
17
-Ap
r-01
14
-Ap
r-01
21
-Ap
r-01
28
-Ap
r-01
5-M
ay
-01
12
-Ma
y-0
11
9-M
ay
-01
26
-Ma
y-0
12
-Jun
-01
9-Ju
n-0
11
6-Ju
n-0
12
3-Ju
n-0
13
0-Ju
n-0
17
-Jul-0
11
4-Ju
l-01
21
-Jul-0
1
To
tal T
est T
ime
(Kil
om
eter
s)
Date
TEST TIME ACCUMULATION
RG Test Plan for Product X Final - Phase 1
Planned
Actual

47
Summary and Benefits of the Methodology
RLCM
48
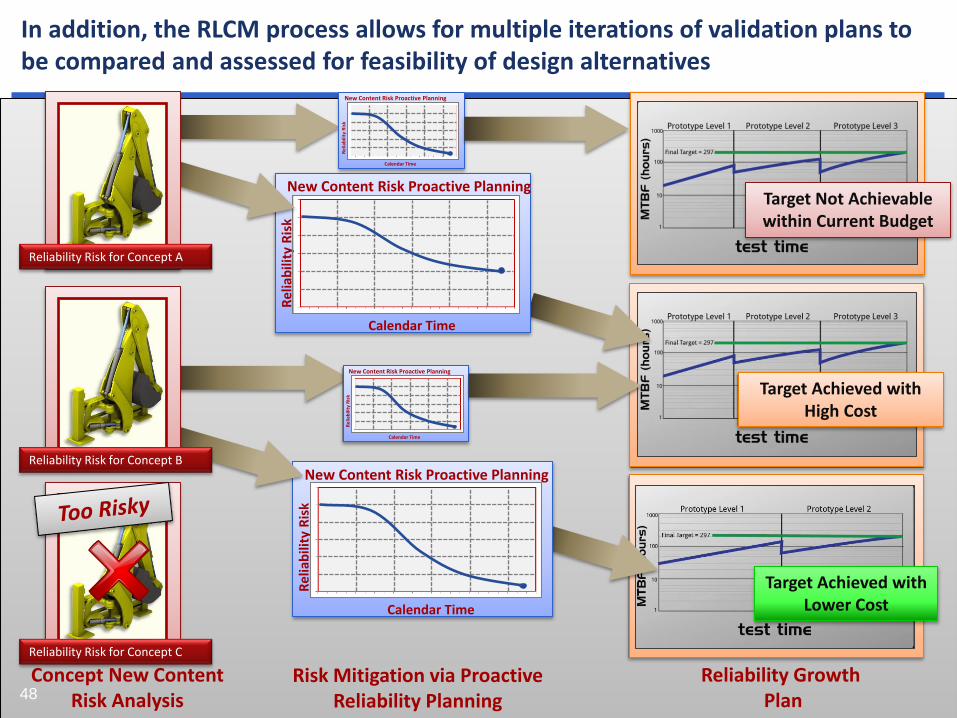
In addition, the RLCM process allows for multiple iterations of validation plans to be compared and assessed for feasibility of design alternatives
Risk Mitigation via Proactive Reliability Planning
Reliability Growth Plan
Concept New ContentRisk Analysis
Target not AchievedWithin Budget
Target Achieved with High Cost
Target Achieved with Lower Cost
Target Not Achievable within Current Budget
Calendar Time
Re
liab
ility
Ris
k
New Content Risk Proactive Planning
Calendar Time
Re
liab
ility
Ris
k
New Content Risk Proactive Planning
Reliability Risk for Concept A
Reliability Risk for Concept B
Reliability Risk for Concept C
Calendar Time
Re
liab
ility
Ris
k
New Content Risk Proactive Planning
Calendar Time
Re
liab
ility
Ris
k
New Content Risk Proactive Planning
48

49
Benefits of the RLCM Methodology
Each RLCMI level is breakthrough in reliability achievement
Provides a comprehensive and proven approach to Reliability Management
Emphasizes proactively planning the program and managing product development activities relative to the plan
Assists in prioritizing and planning proactive (preventative) activities and planning for the benefits of those efforts in terms of reduced RG testing and/or warranty costs.
Supports the transition and maturation of the product development process over time
1. From TAAF (Test Analyze And Fix) to failure prevention
2. From vehicle testing for Growth to vehicle testing for verification
50
Contact Information
Jim Bartos
Fiducia TechneGroup LLCNPD Reliability ManagerE-mail: [email protected]: +1 513.309.5191

51
Let us prove it… with YOUR data!
Raising the Value of Your
Product Development Efforts