Embed Size (px)
Citation preview
Vietnam Journal of Mechanics, VAST, Vol. 42, No. 3 (2020), pp. 293 – 305DOI: https://doi.org/10.15625/0866-7136/15512
Dedicated to Professor J.N. Reddy on the Occasion of His 75th Birthday
DYNAMIC CRACK PROPAGATION IN SPECIMENS WITH A SURFACEIRREGULARITY
Ali Hassanirad1, Vahid Vaziri1, Ko-Choong Woo2, Marian Wiercigroch1,∗1Centre for Applied Dynamics Research, School of Engineering, University of Aberdeen, Aberdeen AB24 3UE, UK
2Department of Mechanical, Materials and Manufacturing Engineering, University of Nottingham Malaysia,Semenyih, Selangor Darul Ehsan, Malaysia
∗E-mail: [email protected]
Received: 15 September 2020 / Published online: 27 September 2020
Abstract. Initiation of cracks and their propagation in prescribed orientations on tubular specimenshas been made possible on a dynamic fatigue testing rig developed at the University of Aberdeen. Thisrig was originally designed to perform experiments on single edge notched beams (SENB) [1,2]. Modi-fications have recently been made so as to accommodate experimental tests on tubular specimens witha range of sizes and other cross sections. Crack initiation at grooves on such specimens has been fol-lowed by crack growth. At the same time, lateral oscillations of cracked specimen have been measured,as well as accelerations of base excitation, masses above and below cracked specimen. Forces on thesetwo masses have been observed by two load cells attached at positions close to specimen. These loadcells facilitated the measurement of stresses in experiment. Crack length time histories have also beenconstructed by applying an alternating current potential difference (ACPD) method. Fatigue crackswere initiated at the pre-cut grooves in aluminium tubular specimens. Three specimens with differentgroove sizes were tested in fifteen individual experiments. A three-dimensional Finite Element modelwas established for each specimen so as to calculate the stress concentration factor (SCF). This formedthe basis of determining the amplitude of forcing input made possible by an electromechanical shaker.The phase shifts of acquired time histories has provided some indication of energy transfer mechanismduring fatigue and system dynamic response. Observations of cracked specimen displacement duringexperiments was compared against calculated displacement from elastic theory. Nonlinear responseswere observed, suggesting nonlinear stiffness characteristics of the specimen due to discontinuities in-troduced by crack growth and plasticity effects. Comparison of damage combinations in experimentalobservation was made with predictions from BS EN 1999-1-3. All experimental observations of totaldamage combination were higher than predicted values by the latter code.
Keywords: fatigue crack, dynamics loading, FEM, experiments.
1. INTRODUCTION
Estimation of fatigue life of mechanical or structural components under cyclic and random loadingis a key issue in the design of mechanical components in machinery or assessment of offshore structuresfor suitability of the service to ensure adequate fatigue life. Design standards and codes such as DNVGL-RP-C203 [3] are updated regularly to reflect the advances and findings in the field of fatigue tests andfracture mechanics, ensuring code-compliant fatigue life in structures, such as offshore jackets and windturbine structures.
Accurate prediction of fatigue life can save costs by extending the life of an offshore asset so thattargeted subsea inspections are less frequent. Fatigue experiments can minimise the safety factors andthe closer the experiment condition is to the real condition the better the fatigue life estimation wouldbe. The S-N curves in the codes are typically conservative and specific fatigue experiments can result indeveloping more refined and accurate S-N curves.
© 2020 Vietnam Academy of Science and Technology
294 Ali Hassanirad, Vahid Vaziri, Ko-Choong Woo, Marian Wiercigroch
A motivation behind this research is to enable fatigue testing on tubular specimens and increase theaccuracy of the real life fatigue testing. Tubular sections are the most common sections used in makingthe offshore structural jacket members such as legs and braces. A number of current researches focusof on fatigue performance of pipe sections in different usages such as in pipelines [4], caissons [5] andrisers [6]. The cyclic loads on pipe elements induced by wave, current and wind cause fatigue damageand the design for fatigue and prediction of the life is of paramount importance. Tubular specimens withdifferent causes of stress raisers such as groove or hole can be tested using the proposed experimentalfatigue rig.
Demonstrating higher fatigue life or improve fatigue performance of metals can be done throughstandard mechanical process in practice such as peening or toe grinding in welds or innovative methodslike surface rolling treatment as studied by Carneiro et al. [7]. In the current study the aim is to min-imise uncertainties in fatigue experiments with monitoring loads, displacements and crack propagationwhich can result in optimum fatigue design. The use of aluminium alloys in structural engineering is in-creasing due to the light weight and high corrosion resistance properties. Xiang et al. [8] studied 6061-T6aluminium alloy under ultra-low cycle fatigue scenario which is mainly practical in use of aluminiumin seismic prone regions. This study focuses on low and high cycle fatigue which covers a wider rangeindustry usage.
Fatigue starts with nucleation of microcracks followed by coalescence and growth of microcracks[9]. The final stages involve long crack growth and final fracture. Crack start at high stress concentrationlocation, which is normally in the region of geometry change, welding, connection points, inclusions,porosity, defects or discontinuities.
New fatigue rigs are being developed to perform fatigue experiments for practical purposes suchas the fatigue rig developed by Okeke et al. [10] or Nagabhooshanam et al. [11]. Although, none ofthese rigs enable direct measurement of forces applied on the specimens during the course of fatigueexperiments. Many fatigue experiment use servohydraulic machines such as the experiment carried outby Wei et al. [12]. Foong et al. [1] designed a novel fatigue rig in the University of Aberdeen and laterstudied parameter identification [2]. This rig was used in subsequent research on nonlinear vibrationcaused by fatigue [13] and chaos caused by fatigue crack growth [14].
This fatigue rig enables fatigue experiments on specimens under bending. The modifications allowthe rig to perform tests on different section sizes while monitoring the exact dynamic force applied to thespecimens using newly designed load cells. In this research ACPD technique was used to monitor theinitiation and propagation of the crack. This technique was also used in fatigue experiment researchessuch as [15] and [16]. Mikulski et al. [17] showed that the ACPD system is sensitive to early crack growth.Measuring the crack in the experiment without interruption during the test is one of the advantages ofACPD system.
The main purpose of the present work is to modify and enhance the existing fatigue rig which canbe used to perform fatigue experiments on different sections including pipe sections. The structure ofthis paper is as follows. Section 2 describes the experimental setup used for the fatigue rig, describingthe original design and current modifications which includes introducing two new load cells, plasticrollers and sliding flexible jaws to accommodate wide range of section sizes and shapes. Then we de-scribe the instrumentation and data acquisition. The calculation of system mechanical parameters andcalibration of load cells, ACPD, and Eddy current proximity sensors are detailed. Next the propertiesof tubular sections are presented followed by the finite element (FE) model of specimens to derive thestress concentration factors (SCF). Experimental results are presented in Section 3. Harmonic test resultsare demonstrated initially and then results of fifteen fatigue experiments including achieved numberof cycles and crack growth from ACPD reading in the fatigue experiments are presented. The mon-itored displacement is compared against the calculated elastic displacement to identify the transitionfrom elastic to nonlinear as a result of crack formation in the specimen and change of stiffness. Finally,the conclusion and discussion of the main results and suggestions for future research are presented inSection 4.
Dynamic crack propagation in specimens with a surface irregularity 295
2. EXPERIMENTAL SETUP
To facilitate the experimental testing of tubular specimens which have surface discontinuities, mod-ifications to an existing experimental rig are described, which enable this geometry to be held securely.Specific information pertaining to the size and geometry of specimen are provided, as well as the irreg-ularity on the surface which induces stress concentration. The experimental setup is also described toinclude instrumentation and data acquisition system. The amplitude of forcing input was quantifiedby numerically solving the geometry of specimen in consideration in finite element analysis so as tocompute stress concentration factors. These, in turn, allow for the calculation of force values, whichconstitute an input to the cracked specimens during the experiment.
2.1. Rig description
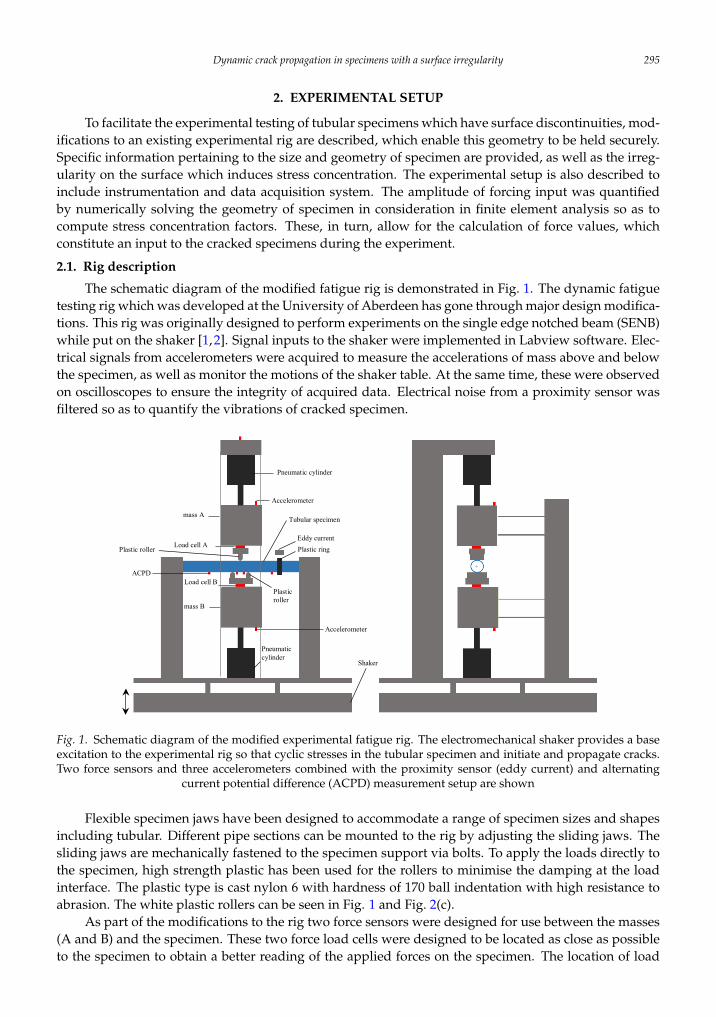
The schematic diagram of the modified fatigue rig is demonstrated in Fig. 1. The dynamic fatiguetesting rig which was developed at the University of Aberdeen has gone through major design modifica-tions. This rig was originally designed to perform experiments on the single edge notched beam (SENB)while put on the shaker [1,2]. Signal inputs to the shaker were implemented in Labview software. Elec-trical signals from accelerometers were acquired to measure the accelerations of mass above and belowthe specimen, as well as monitor the motions of the shaker table. At the same time, these were observedon oscilloscopes to ensure the integrity of acquired data. Electrical noise from a proximity sensor wasfiltered so as to quantify the vibrations of cracked specimen.
4
Figure 1: Schematic diagram of the modified experimental fatigue rig. The electromechanical shaker provides a base excitation to the experimental rig so that cyclic stresses in the tubular specimen and initiate and propagate cracks. Two force sensors and three accelerometers combined with the proximity sensor (eddy current) and alternating current potential difference (ACPD) measurement setup are shown.
Flexible specimen jaws have been designed to accommodate a range of specimen sizes including tubular
diameters. Different pipe sections can be mounted to the rig by adjusting the sliding jaws. The sliding
jaws are mechanically fastened to the specimen support via bolts. To apply the loads directly to the
specimen, high strength plastic has been used for the rollers to minimise the damping at the load interface.
The plastic type is cast nylon 6 with hardness of 170 ball indentation with high resistance to abrasion. The
white plastic rollers can be seen in Figure 1 and Figure 2(c).
As part of the modifications to the rig two force sensors were designed for use between the masses (A
and B) and the specimen. These two force load cells were designed to be located as close as possible to
the specimen to obtain a better reading of the applied forces on the specimen. The location of load cell A
and load cell B are shown in Figure 1, Figure 2(b) and Figure 2(c). The vertical displacement of the tubular
specimen is monitored by the eddy current probe. The eddy current probe is facing a flat metal plate
attached to a plastic ring under the eddy current probe for the deflection measurement. The plastic ring and
the flat plate is designed to enable eddy current reading in tubular specimens. The nonlinearity of the
specimen displacement under force which is caused by the crack can be monitored from the eddy current
prob. The crack propagation during the experiment is monitored using an ACPD (Alternative Current
Potential Drop) device. Four ACPD cables, two for current and two for voltage, are screwed and tightened
to the specimen. As part of the modification the ACPD cables where changed to solid core (single strand)
wires to minimise the noise in the recorded data. In addition, a stand was designed and fitted to the rig to
fix the wire slots. The accelerations of mass A, mass B and the base are recorded using the three
accelerometers connected to them similar to [1].
Load cell A
Load cell B
mass A
mass B
Plastic ring
Pneumatic cylinder
Pneumatic cylinder
Tubular specimen
Eddy current
ACPD
Accelerometer
Accelerometer
Shaker
Plastic roller
Plastic roller
+
Fig. 1. Schematic diagram of the modified experimental fatigue rig. The electromechanical shaker provides a baseexcitation to the experimental rig so that cyclic stresses in the tubular specimen and initiate and propagate cracks.Two force sensors and three accelerometers combined with the proximity sensor (eddy current) and alternating
current potential difference (ACPD) measurement setup are shown
Flexible specimen jaws have been designed to accommodate a range of specimen sizes and shapesincluding tubular. Different pipe sections can be mounted to the rig by adjusting the sliding jaws. Thesliding jaws are mechanically fastened to the specimen support via bolts. To apply the loads directly tothe specimen, high strength plastic has been used for the rollers to minimise the damping at the loadinterface. The plastic type is cast nylon 6 with hardness of 170 ball indentation with high resistance toabrasion. The white plastic rollers can be seen in Fig. 1 and Fig. 2(c).
As part of the modifications to the rig two force sensors were designed for use between the masses(A and B) and the specimen. These two force load cells were designed to be located as close as possibleto the specimen to obtain a better reading of the applied forces on the specimen. The location of load
296 Ali Hassanirad, Vahid Vaziri, Ko-Choong Woo, Marian Wiercigroch
cell A and load cell B are shown in Fig. 1, Fig. 2(b) and Fig. 2(c). The vertical displacement of the tubularspecimen is monitored by the eddy current probe. The eddy current probe is facing a flat metal plateattached to a plastic ring under the eddy current probe for the deflection measurement. The plastic ringand the flat plate is designed to enable eddy current reading in tubular specimens. The nonlinearity ofthe specimen displacement under force which is caused by the crack can be monitored from the eddycurrent prob. The crack propagation during the experiment is monitored using an ACPD (AlternativeCurrent Potential Drop) device. Four ACPD cables, two for current and two for voltage, are screwedand tightened to the specimen. As part of the modification the ACPD cables where changed to solidcore (single strand) wires to minimise the noise in the recorded data. In addition, a stand was designedand fitted to the rig to fix the wire slots. The accelerations of mass A, mass B and the base are recordedusing the three accelerometers connected to them similar to [1].
5
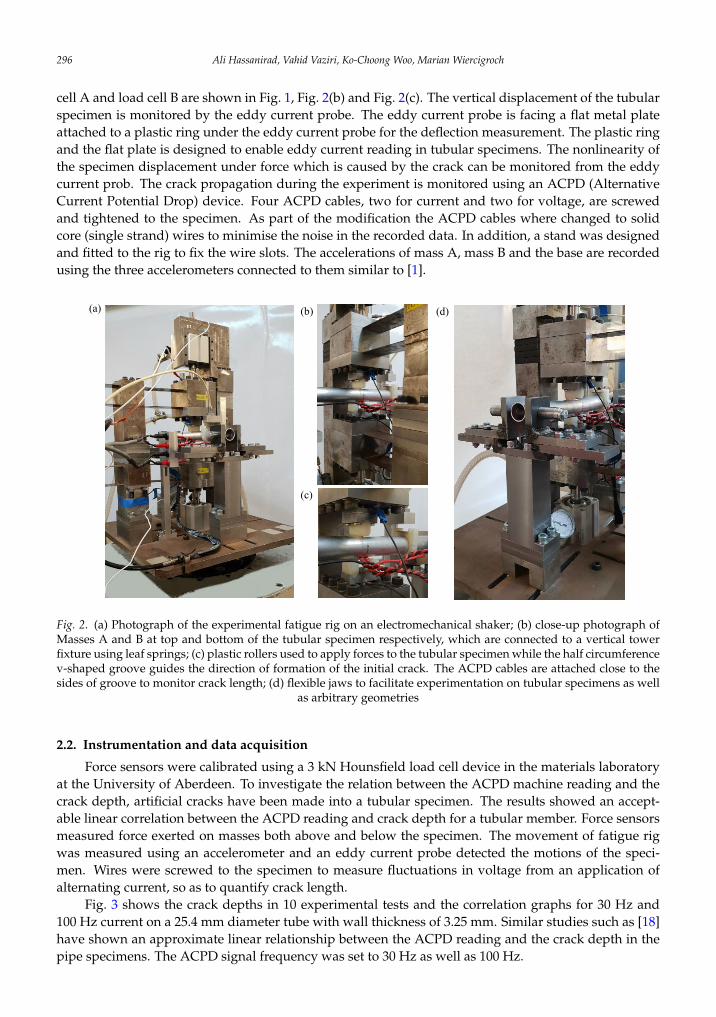
Figure 2: (a) Photograph of the experimental fatigue rig on an electromechanical shaker; (b) close-up photograph of Masses A and B at top and bottom of the tubular specimen respectively, which are connected to a vertical tower fixture using leaf springs; (c) plastic rollers used to apply forces to the tubular specimen while the half circumference v-shaped groove guides the direction of formation of the initial crack. The ACPD cables are attached close to the sides of groove to monitor crack length; (d) flexible jaws to facilitate experimentation on tubular specimens as well as arbitrary geometries.
2.2. Instrumentation and data acquisition
Force sensors were calibrated using a 3kN Hounsfield load cell device in the materials laboratory at the
University of Aberdeen. To investigate the relation between the ACPD machine reading and the crack
depth, artificial cracks have been made into a tubular specimen. The results showed an acceptable linear
correlation between the ACPD reading and crack depth for a tubular member. Force sensors measured
force exerted on masses both above and below the specimen. The movement of fatigue rig was measured
using an accelerometer and an eddy current probe detected the motions of the specimen. Wires were
screwed to the specimen to measure fluctuations in voltage from an application of alternating current, so as
to quantify crack length.
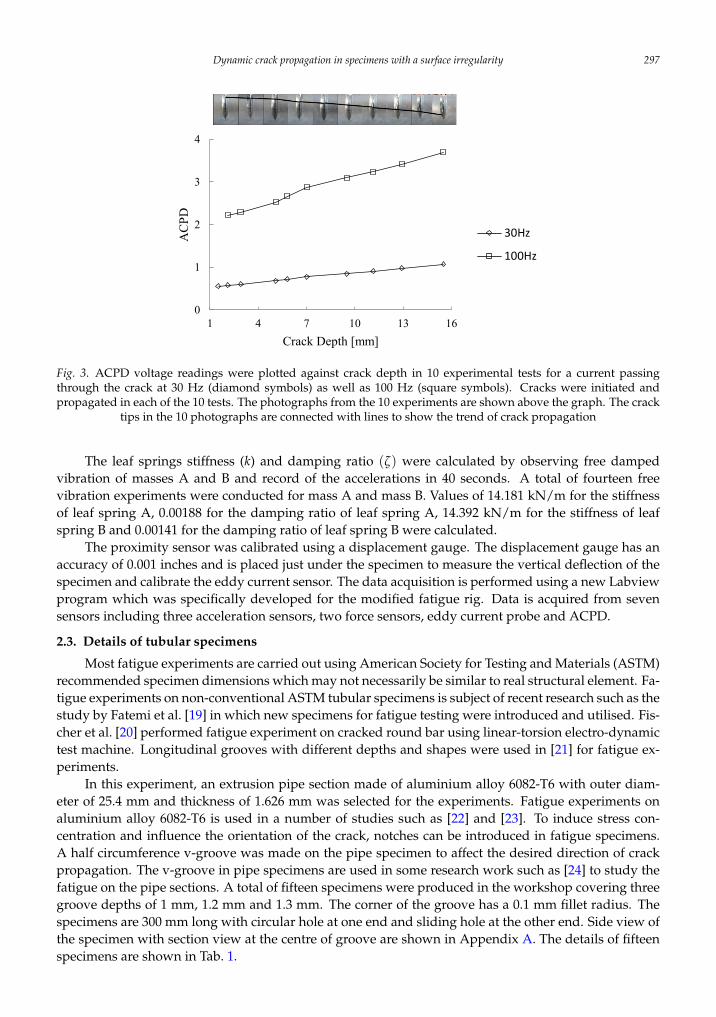
Figure 3 shows the crack depths in 10 experimental tests and the correlation graphs for 30 Hz and 100
Hz current on a 25.4 mm diameter tube with wall thickness of 3.25 mm. Similar studies such as [17F18] have
shown an approximate linear relationship between the ACPD reading and the crack depth in the pipe
specimens. The ACPD signal frequency was set to 30 Hz as well as 100 Hz.
(a) (b)
(c)
(d)
Fig. 2. (a) Photograph of the experimental fatigue rig on an electromechanical shaker; (b) close-up photograph ofMasses A and B at top and bottom of the tubular specimen respectively, which are connected to a vertical towerfixture using leaf springs; (c) plastic rollers used to apply forces to the tubular specimen while the half circumferencev-shaped groove guides the direction of formation of the initial crack. The ACPD cables are attached close to thesides of groove to monitor crack length; (d) flexible jaws to facilitate experimentation on tubular specimens as well
as arbitrary geometries
2.2. Instrumentation and data acquisition
Force sensors were calibrated using a 3 kN Hounsfield load cell device in the materials laboratoryat the University of Aberdeen. To investigate the relation between the ACPD machine reading and thecrack depth, artificial cracks have been made into a tubular specimen. The results showed an accept-able linear correlation between the ACPD reading and crack depth for a tubular member. Force sensorsmeasured force exerted on masses both above and below the specimen. The movement of fatigue rigwas measured using an accelerometer and an eddy current probe detected the motions of the speci-men. Wires were screwed to the specimen to measure fluctuations in voltage from an application ofalternating current, so as to quantify crack length.
Fig. 3 shows the crack depths in 10 experimental tests and the correlation graphs for 30 Hz and100 Hz current on a 25.4 mm diameter tube with wall thickness of 3.25 mm. Similar studies such as [18]have shown an approximate linear relationship between the ACPD reading and the crack depth in thepipe specimens. The ACPD signal frequency was set to 30 Hz as well as 100 Hz.
Dynamic crack propagation in specimens with a surface irregularity 297
6
Figure 3: ACPD voltage readings were plotted against crack depth in 10 experimental tests for a current passing through the crack at 30 Hz (diamond symbols) as well as 100 Hz (square symbols). Cracks were initiated and propagated in each of the 10 tests. The photographs from the 10 experiments are shown above the graph. The crack tips in the 10 photographs are connected with lines to show the trend of crack propagation.
The leaf springs stiffness (k) and damping ratio (ζ) were calculated by observing free damped vibration
of masses A and B and record of the accelerations in 40 seconds. A total of fourteen free vibration
experiments were conducted for mass A and mass B. Values of 14.181 kN/m for the stiffness of leaf spring
A, 0.00188 for the damping ratio of leaf spring A, 14.392 kN/m for the stiffness of leaf spring B and 0.00141
for the damping ratio of leaf spring B were calculated.
The proximity sensor was calibrated using a displacement gauge. The displacement gauge has an
accuracy of 0.001 inches and is placed just under the specimen to measure the vertical deflection of the
specimen and calibrate the eddy current sensor. The data acquisition is performed using a new Labview
program which was specifically developed for the modified fatigue rig. Data is acquired from seven sensors
including three acceleration sensors, two force sensors, eddy current probe and ACPD.
2.3. Details of tubular specimens
Most fatigue experiments are carried out using American Society for Testing and Materials (ASTM)
recommended specimen dimensions which may not necessarily be similar to real structural element.
Fatigue experiments on non-conventional ASTM tubular specimens is subject of recent research such as
the study by Fatemi et al. [18F19] in which new specimens for fatigue testing were introduced and utilised.
Fischer et al. [19F20] performed fatigue experiment on cracked round bar using linear-torsion electro-dynamic
test machine. Longitudinal grooves with different depths and shapes were used in [20F 21] for fatigue
experiments.
In this experiment, an extrusion pipe section made of aluminium alloy 6082-T6 with outer diameter of
25.4 mm and thickness of 1.626 mm was selected for the experiments. Fatigue experiments on aluminium
alloy 6082-T6 is used in a number of studies such as [21F22] and [22F23]. To induce stress concentration and
0
1
2
3
4
1 4 7 10 13 16
AC
PD
Crack Depth [mm]
30Hz
100Hz
Fig. 3. ACPD voltage readings were plotted against crack depth in 10 experimental tests for a current passingthrough the crack at 30 Hz (diamond symbols) as well as 100 Hz (square symbols). Cracks were initiated andpropagated in each of the 10 tests. The photographs from the 10 experiments are shown above the graph. The crack
tips in the 10 photographs are connected with lines to show the trend of crack propagation
The leaf springs stiffness (k) and damping ratio (ζ) were calculated by observing free dampedvibration of masses A and B and record of the accelerations in 40 seconds. A total of fourteen freevibration experiments were conducted for mass A and mass B. Values of 14.181 kN/m for the stiffnessof leaf spring A, 0.00188 for the damping ratio of leaf spring A, 14.392 kN/m for the stiffness of leafspring B and 0.00141 for the damping ratio of leaf spring B were calculated.
The proximity sensor was calibrated using a displacement gauge. The displacement gauge has anaccuracy of 0.001 inches and is placed just under the specimen to measure the vertical deflection of thespecimen and calibrate the eddy current sensor. The data acquisition is performed using a new Labviewprogram which was specifically developed for the modified fatigue rig. Data is acquired from sevensensors including three acceleration sensors, two force sensors, eddy current probe and ACPD.
2.3. Details of tubular specimens
Most fatigue experiments are carried out using American Society for Testing and Materials (ASTM)recommended specimen dimensions which may not necessarily be similar to real structural element. Fa-tigue experiments on non-conventional ASTM tubular specimens is subject of recent research such as thestudy by Fatemi et al. [19] in which new specimens for fatigue testing were introduced and utilised. Fis-cher et al. [20] performed fatigue experiment on cracked round bar using linear-torsion electro-dynamictest machine. Longitudinal grooves with different depths and shapes were used in [21] for fatigue ex-periments.
In this experiment, an extrusion pipe section made of aluminium alloy 6082-T6 with outer diam-eter of 25.4 mm and thickness of 1.626 mm was selected for the experiments. Fatigue experiments onaluminium alloy 6082-T6 is used in a number of studies such as [22] and [23]. To induce stress con-centration and influence the orientation of the crack, notches can be introduced in fatigue specimens.A half circumference v-groove was made on the pipe specimen to affect the desired direction of crackpropagation. The v-groove in pipe specimens are used in some research work such as [24] to study thefatigue on the pipe sections. A total of fifteen specimens were produced in the workshop covering threegroove depths of 1 mm, 1.2 mm and 1.3 mm. The corner of the groove has a 0.1 mm fillet radius. Thespecimens are 300 mm long with circular hole at one end and sliding hole at the other end. Side view ofthe specimen with section view at the centre of groove are shown in Appendix A. The details of fifteenspecimens are shown in Tab. 1.
298 Ali Hassanirad, Vahid Vaziri, Ko-Choong Woo, Marian Wiercigroch
Table 1. Experiment ID, specimen type and groove depth
Experiment ID Specimen Type Groove Depth (mm)
1-4 and 13-15 SP1 1.05-7 and 11-12 SP2 1.2
8-10 SP3 1.3
2.4. Finite Element model
Finite Element (FE) analysis was carried out to calculate stress concentration factors. The locationsand directions of crack are known to occur at places of maximum principal stress. This matter also hasexperimentally been demonstrated in research such as [25].
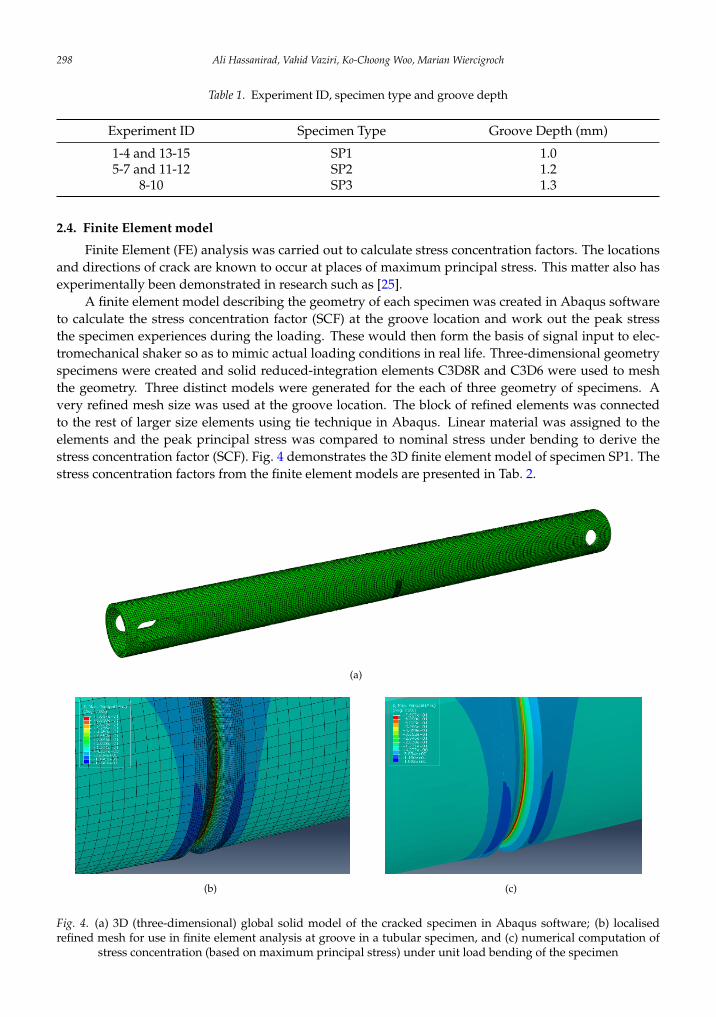
A finite element model describing the geometry of each specimen was created in Abaqus softwareto calculate the stress concentration factor (SCF) at the groove location and work out the peak stressthe specimen experiences during the loading. These would then form the basis of signal input to elec-tromechanical shaker so as to mimic actual loading conditions in real life. Three-dimensional geometryspecimens were created and solid reduced-integration elements C3D8R and C3D6 were used to meshthe geometry. Three distinct models were generated for the each of three geometry of specimens. Avery refined mesh size was used at the groove location. The block of refined elements was connectedto the rest of larger size elements using tie technique in Abaqus. Linear material was assigned to theelements and the peak principal stress was compared to nominal stress under bending to derive thestress concentration factor (SCF). Fig. 4 demonstrates the 3D finite element model of specimen SP1. Thestress concentration factors from the finite element models are presented in Tab. 2.
8
Figure 4: (a) 3D (three-dimensional) global solid model of the cracked specimen in Abaqus software; (b) localised refined mesh for use in finite element analysis at groove in a tubular specimen, and (c) numericalcomputation of stress concentration (based on maximum principal stress) under unit load bending of thespecimen.
Table 2: Stress Concentration Factor (SCF) as a function of the groove depth for the studied specimens (SP1, SP2 or SP3).
Specimen Groove Depth (mm) SCF
SP1 1.0 3.50
SP2 1.2 4.21
SP3 1.3 3.84
There is a peak value of stress at the bottom of the groove, and there is a heightened value of stress at the
lower half of the tubular section. The stress concentration factors were used to calibrate the signal
amplitude to the shaker and calculate the stress ranges in the specimen.
3. Experimental results
In this section the response of the fatigue rig under harmonic excitation is presented. Then the results of
fatigue experiments for fifteen specimens are detailed including the accumulated fatigue damage and the
comparison against design S-N curves from BS EN 1999-1-3 [27]. The specimen displacement from eddy
current and comparison with elastic beam theory at time of crack initiation is also shown.
Depending to the number of cycles the fatigue S-N curves can be categorised as low Cycle Fatigue
(LCF) for less than 105 cycles, High Cycle Fatigue (HCF) for above 105 and below 107, and Very High
(b) (c)
(a)
8
Figure 4: (a) 3D (three-dimensional) global solid model of the cracked specimen in Abaqus software; (b) localised refined mesh for use in finite element analysis at groove in a tubular specimen, and (c) numerical computation of stress concentration (based on maximum principal stress) under unit load bending of the specimen.
Table 2: Stress Concentration Factor (SCF) as a function of the groove depth for the studied specimens
(SP1, SP2 or SP3).
Specimen Groove Depth (mm) SCF
SP1 1.0 3.50
SP2 1.2 4.21
SP3 1.3 3.84
There is a peak value of stress at the bottom of the groove, and there is a heightened value of stress at the
lower half of the tubular section. The stress concentration factors were used to calibrate the signal
amplitude to the shaker and calculate the stress ranges in the specimen.
3. Experimental results
In this section the response of the fatigue rig under harmonic excitation is presented. Then the results of
fatigue experiments for fifteen specimens are detailed including the accumulated fatigue damage and the
comparison against design S-N curves from BS EN 1999-1-3 [27]. The specimen displacement from eddy
current and comparison with elastic beam theory at time of crack initiation is also shown.
Depending to the number of cycles the fatigue S-N curves can be categorised as low Cycle Fatigue
(LCF) for less than 105 cycles, High Cycle Fatigue (HCF) for above 105 and below 107, and Very High
(a)
(b) (c)
(b)
8
Figure 4: (a) 3D (three-dimensional) global solid model of the cracked specimen in Abaqus software; (b) localised refined mesh for use in finite element analysis at groove in a tubular specimen, and (c) numerical computation of stress concentration (based on maximum principal stress) under unit load bending of the specimen.
Table 2: Stress Concentration Factor (SCF) as a function of the groove depth for the studied specimens
(SP1, SP2 or SP3).
Specimen Groove Depth (mm) SCF
SP1 1.0 3.50
SP2 1.2 4.21
SP3 1.3 3.84
There is a peak value of stress at the bottom of the groove, and there is a heightened value of stress at the
lower half of the tubular section. The stress concentration factors were used to calibrate the signal
amplitude to the shaker and calculate the stress ranges in the specimen.
3. Experimental results
In this section the response of the fatigue rig under harmonic excitation is presented. Then the results of
fatigue experiments for fifteen specimens are detailed including the accumulated fatigue damage and the
comparison against design S-N curves from BS EN 1999-1-3 [27]. The specimen displacement from eddy
current and comparison with elastic beam theory at time of crack initiation is also shown.
Depending to the number of cycles the fatigue S-N curves can be categorised as low Cycle Fatigue
(LCF) for less than 105 cycles, High Cycle Fatigue (HCF) for above 105 and below 107, and Very High
(a)
(b) (c)
(c)
Fig. 4. (a) 3D (three-dimensional) global solid model of the cracked specimen in Abaqus software; (b) localisedrefined mesh for use in finite element analysis at groove in a tubular specimen, and (c) numerical computation of
stress concentration (based on maximum principal stress) under unit load bending of the specimen
Dynamic crack propagation in specimens with a surface irregularity 299
Table 2. Stress Concentration Factor (SCF) as a function of the groove depth for the studied specimens(SP1, SP2 or SP3)
Specimen Groove Depth (mm) SCF
SP1 1.0 3.50SP2 1.2 4.21SP3 1.3 3.84
There is a peak value of stress at the bottom of the groove, and there is a heightened value of stressat the lower half of the tubular section. The stress concentration factors were used to calibrate the signalamplitude to the shaker and calculate the stress ranges in the specimen.
3. EXPERIMENTAL RESULTS
In this section the response of the fatigue rig under harmonic excitation is presented. Then theresults of fatigue experiments for fifteen specimens are detailed including the accumulated fatiguedamage and the comparison against design S-N curves from BS EN 1999-1-3 [26]. The specimen dis-placement from eddy current and comparison with elastic beam theory at time of crack initiation isalso shown.
Depending to the number of cycles the fatigue S-N curves can be categorised as Low Cycle Fatigue(LCF) for less than 105 cycles, High Cycle Fatigue (HCF) for above 105 and below 107, and Very HighCycle Fatigue (VHCF) for above 107 cycles [27]. Other references such as BS EN 1999-1-3 [26] codesuggests a threshold of 105 cycles between low and high cycle fatigue.
3.1. Harmonic test
The modified fatigue rig was subject to harmonic excitation on an electromechanical shaker at afrequency of 20 Hz. A signal generator specifies the required amplitude and frequency, based on stressconcentration factors computed a priori. This acts as an input to the shaker so that it would move in
9
Cycle Fatigue (VHCF) for above 107 cycles [25F26]. Other references such as BS EN 1999-1-3 [27] code
suggests a threshold of 105 cycles between low and high cycle fatigue.
3.1. Harmonic test
The modified fatigue rig was subject to harmonic excitation on an electromechanical shaker at a frequency
of 20 Hz. A signal generator specifies the required amplitude and frequency, based on stress concentration
factors computed a priori. This acts as an input to the shaker so that it would move in accordance to it.
Force, acceleration, and specimen displacement are measured and observed. The Labview programme
records data pertaining to seven parameters and converts the readings to appropriate units at a sampling
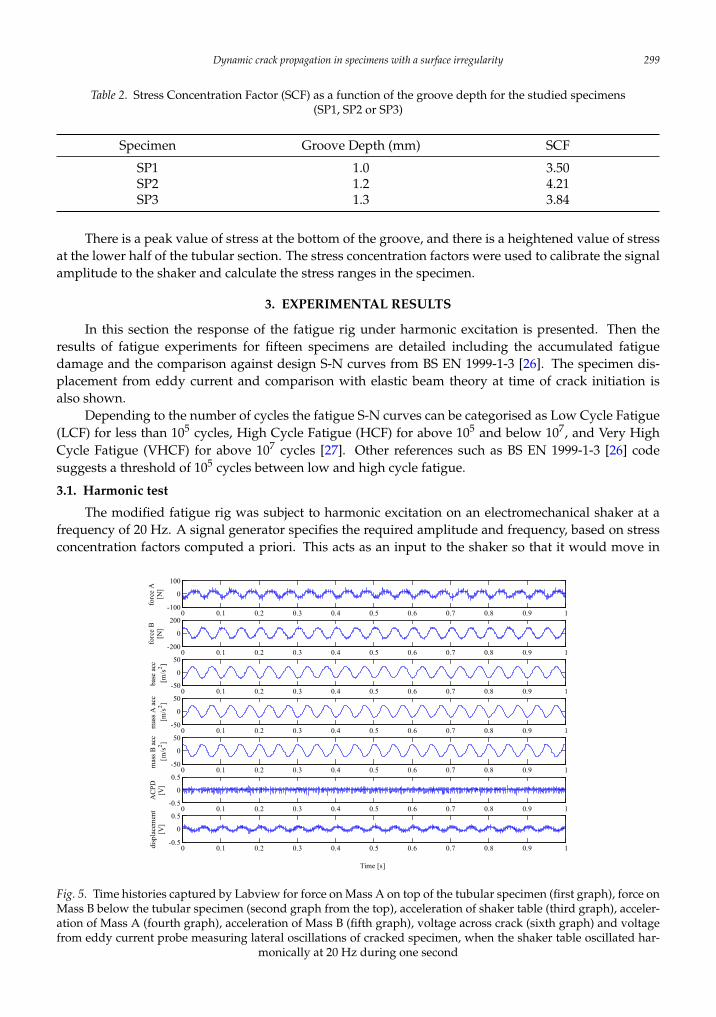
rate of 2000Hz. System dynamic responses are shown in Figure 5. The response from the two force
sensors, the three accelerometers are sinusoidal and proportional to the excitation form the shaker.
Similarly, the proximity sensor eddy current sensor shows a periodic deflection of the specimen. The
ACPD reading fluctuates slightly while averaging over a constant value, indicating no crack formation or
propagation in the one second of the measured data. Force B, which is the force on Mass B, is out of phase
to Force A (the force on Mass A), and the acceleration of Mass B is asynchronous to that for Mass A. The
displacement of the specimen is shown in the last graph of Figure 5 at the bottom. While the specimen
contributes to a stiffness characteristic, it also responds in accordance to the base excitation. There is
electrical noise in some of the signals from measurement which perhaps could be improved further with
shielding in future work.
Figure 5: Time histories captured by Labview for force on Mass A on top of the tubular specimen (first graph), force on Mass B below the tubular specimen (second graph from the top), acceleration of shaker table (third graph), acceleration of Mass A (fourth graph), acceleration of Mass B (fifth graph), voltage across crack (sixth graph) and voltage from eddy current probe measuring lateral oscillations of cracked specimen, when the shaker table oscillated harmonically at 20 Hz during one second.
0 0.1 0.2 0.3 0.4 0.5 0.6 0.7 0.8 0.9 1-100
0
100
forc
e A
[N]
0 0.1 0.2 0.3 0.4 0.5 0.6 0.7 0.8 0.9 1-200
0
200
forc
e B
[N]
0 0.1 0.2 0.3 0.4 0.5 0.6 0.7 0.8 0.9 1-50
0
50
base
acc
[m/s
2 ]
0 0.1 0.2 0.3 0.4 0.5 0.6 0.7 0.8 0.9 1-50
0
50
mas
s A a
cc[m
/s2 ]
0 0.1 0.2 0.3 0.4 0.5 0.6 0.7 0.8 0.9 1-50
0
50
mas
s B a
cc[m
/s2 ]
0 0.1 0.2 0.3 0.4 0.5 0.6 0.7 0.8 0.9 1-0.5
0
0.5
ACP
D[V
]
0 0.1 0.2 0.3 0.4 0.5 0.6 0.7 0.8 0.9 1-0.5
0
0.5
disp
lace
men
t[V
]
Time [s]
Fig. 5. Time histories captured by Labview for force on Mass A on top of the tubular specimen (first graph), force onMass B below the tubular specimen (second graph from the top), acceleration of shaker table (third graph), acceler-ation of Mass A (fourth graph), acceleration of Mass B (fifth graph), voltage across crack (sixth graph) and voltagefrom eddy current probe measuring lateral oscillations of cracked specimen, when the shaker table oscillated har-
monically at 20 Hz during one second
300 Ali Hassanirad, Vahid Vaziri, Ko-Choong Woo, Marian Wiercigroch
accordance to it. Force, acceleration, and specimen displacement are monitored and measured. TheLabview programme records data pertaining to seven parameters and converts the readings to appro-priate units at a sampling rate of 2000 Hz. System dynamic responses are shown in Fig. 5. The responsefrom the two force sensors, the three accelerometers are sinusoidal and proportional to the excitationform the shaker. Similarly, the proximity sensor eddy current sensor shows a periodic deflection of thespecimen. The ACPD reading fluctuates slightly while averaging over a constant value, indicating nocrack formation or propagation in the one second of the measured data. Force B, which is the force onMass B, is out of phase to Force A (the force on Mass A), and the acceleration of Mass B is asynchronousto that for Mass A. The displacement of the specimen is shown in the last graph of Fig. 5 at the bottom.While the specimen contributes to a stiffness characteristic, it also responds in accordance to the baseexcitation. There is electrical noise in some of the signals from measurement which perhaps could beimproved further with shielding in future work.
3.2. Fatigue experiments
A total of fifteen fatigue experiments were performed and the results were post processed. Ascan be seen in Fig. 1 and Fig. 2 the force from Mass A is applied on the specimen via a single plasticroller while the force from Mass B is applied on the specimen via two plastic rollers. These two forcesare available from the load cells data. The stress range at the groove location was calculated using thefindings of the finite element analysis.
The loading frequency of the experiments varied from 15 Hz to 30 Hz. The fatigue design rela-tionship in BS EN 1999-1-3 [26] code in range between 105 to 5 × 10⁶ cycles is shown in Eq. (1). ∆σcis the reference value of fatigue strength at 2 × 10⁶ cycles, depending on the detail category while ∆σiis the stress range for the principal stresses at the constructional detail. m1 is the inverse slope of the∆σ-N curve, depending on the detail category. γF f is the partial factor allowing for uncertainties in theloading spectrum and analysis of response and γM f is the partial factor for uncertainties in materialsand execution. The value of 1.0 for partial factors γF f and γM f offset the SN curves by a mean minustwo standard deviation from experimental data in BS EN 1999-1-3 [26]. A value of 1.0 is recommendedby BS EN 1999-1-3 for safe life design.
Ni = 2 × 10⁶
[∆σc
∆σi
1γF f · γM f
]m1
. (1)
In cases where a significant damage is caused by high stress ranges applied less than 105 times, thenominal S-N curves can be unnecessarily be conservative [26]. For low cycle fatigue in the range of 103
to 105 cycles, the fatigue design relationship is defined by Eq. (2) in BS EN 1999-1-3 [26], in which m0 isthe inverse logarithmic slope of the ∆σ-N curve in the range 103 and 105 cycles.
Ni =
[∆σc
∆σi
1γF f · γM f
]m0
× 20m0m1 × 105. (2)
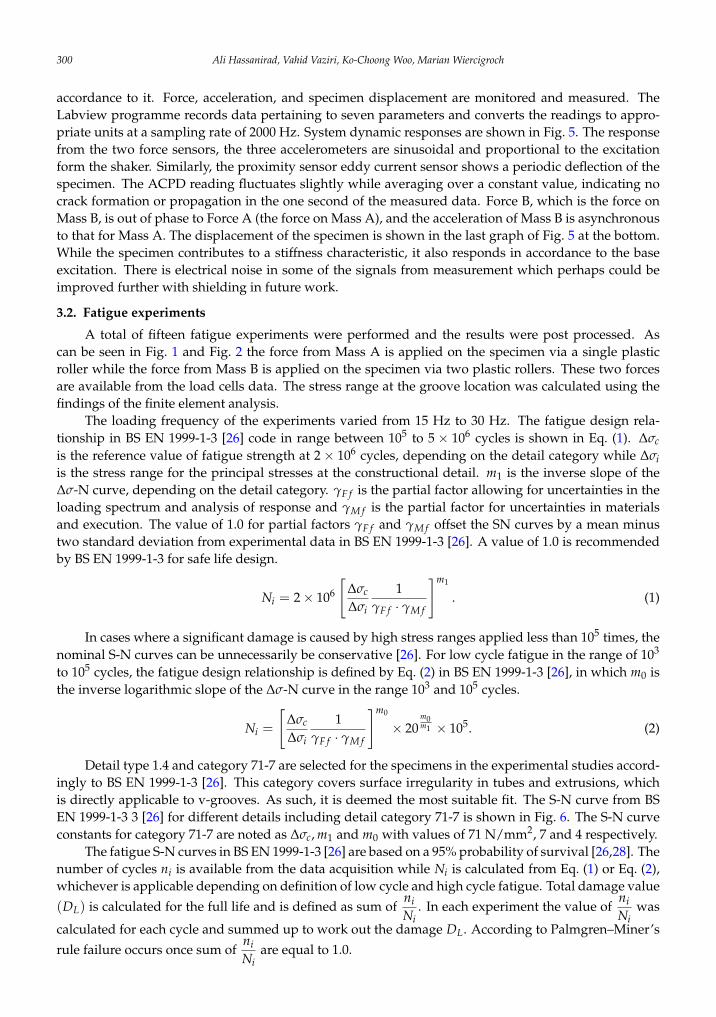
Detail type 1.4 and category 71-7 are selected for the specimens in the experimental studies accord-ingly to BS EN 1999-1-3 [26]. This category covers surface irregularity in tubes and extrusions, whichis directly applicable to v-grooves. As such, it is deemed the most suitable fit. The S-N curve from BSEN 1999-1-3 3 [26] for different details including detail category 71-7 is shown in Fig. 6. The S-N curveconstants for category 71-7 are noted as ∆σc, m1 and m0 with values of 71 N/mm2, 7 and 4 respectively.
The fatigue S-N curves in BS EN 1999-1-3 [26] are based on a 95% probability of survival [26,28]. Thenumber of cycles ni is available from the data acquisition while Ni is calculated from Eq. (1) or Eq. (2),whichever is applicable depending on definition of low cycle and high cycle fatigue. Total damage value
(DL) is calculated for the full life and is defined as sum ofniNi
. In each experiment the value ofniNi
was
calculated for each cycle and summed up to work out the damage DL. According to Palmgren–Miner’s
rule failure occurs once sum ofniNi
are equal to 1.0.
Dynamic crack propagation in specimens with a surface irregularity 301
11
Figure 6: BS EN 1999-1-3 [27] fatigue strength curves for detail categories 71-7, 80-7, 90-7, 100-7, 125-7 and 140-7. Detail category 71-7 pertains to product forms such as sheets, plates, extrusions, tubes and forgings such that there are surface notches on flat or tubular specimens. There is no requirement for a surface finish, which is applicable to the cracked specimens in this experiment.
The fatigue S-N curves in BS EN 1999-1-3 [27] are based on a 95% probability of survival [27, 27F28].
The number of cycles 𝑛𝑛𝑖𝑖 is available from the data acquisition while 𝑁𝑁𝑖𝑖 is calculated from Equation (1) or
Equation (2), whichever is applicable depending on definition of low cycle and high cycle fatigue. Total
damage value (𝐷𝐷𝐿𝐿) is calculated for the full life and is defined as sum of 𝑛𝑛𝑖𝑖𝑁𝑁𝑖𝑖
. In each experiment the value
of 𝑛𝑛𝑖𝑖𝑁𝑁𝑖𝑖
was calculated for each cycle and summed up to work out the damage 𝐷𝐷𝐿𝐿 . According to Palmgren-
Miner’s rule failure occurs once sum of 𝑛𝑛𝑖𝑖𝑁𝑁𝑖𝑖
are equal to 1.0.
Ultimate achieved cycles for each experiment are shown in Table 3. The total damage combination, 𝐷𝐷𝐿𝐿 ,
was calculated for each of fifteen experiments based on this data. The achieved 𝐷𝐷𝐿𝐿 exceeded the BS EN
1999-1-3 predicted a value of 1.0 in all fifteen experiments. This shows relatively high conservatism
referring to aluminium code BS EN 1999-1-3 design S-N curves. In addition, the code recommends a value
of 1.0 for partial factors 𝛾𝛾𝐹𝐹𝐹𝐹 and 𝛾𝛾𝑀𝑀𝐹𝐹. These point towards safe design and are likely to be very conservative
and generic.
Low cycle High cycle
Fig. 6. BS EN 1999-1-3 [26] fatigue strength curves for detail categories 71-7, 80-7, 90-7, 100-7, 125-7 and 140-7.Detail category 71-7 pertains to product forms such as sheets, plates, extrusions, tubes and forgings such that thereare surface notches on flat or tubular specimens. There is no requirement for a surface finish, which is applicable to
the cracked specimens in this experiment
Ultimate achieved cycles for each experiment are shown in Tab. 3. The total damage combination,DL, was calculated for each of fifteen experiments based on this data. The achieved DL exceeded the BSEN 1999-1-3 predicted a value of 1.0 in all fifteen experiments. This shows relatively high conservatismreferring to aluminium code BS EN 1999-1-3 design S-N curves. In addition, the code recommends avalue of 1.0 for partial factors γF f and γM f . These point towards safe design and are likely to be veryconservative and generic.
Table 3. Number of cycles to failure for each experiment corresponding to fifteen samples
Experiment ID Specimen Type Number of cycles
1 SP1 2542122 SP1 5434243 SP1 40434 SP1 1252845 SP2 1936536 SP2 864087 SP2 3001158 SP3 2459989 SP3 92692
10 SP3 22359511 SP2a 309612 SP2a 10356213 SP1a 27035814 SP1a 6353715 SP1a 159459
In further work based on periodic cyclic loading, Sun et al. in [29] performed statistical fatiguedamage model under constant and variable loading according to Miner’s damage criterion. This wouldhave taken an arbitrary loading case into consideration. They concluded that the Miner’s rule is sta-tistically inconsistent. This experiment showed that the damage accumulation based on Miner’s rule is
302 Ali Hassanirad, Vahid Vaziri, Ko-Choong Woo, Marian Wiercigroch
not consistent. However, in all experiments the total damage was greater than 1.0, verifying the implicitconservatism in BS EN 1999-1-3 [26]. Alternative damage accumulation methods have been developedand proposed such as nonlinear damage accumulation proposed by Zhu et al. [30] or Dias et al. [31].
3.3. Crack growth
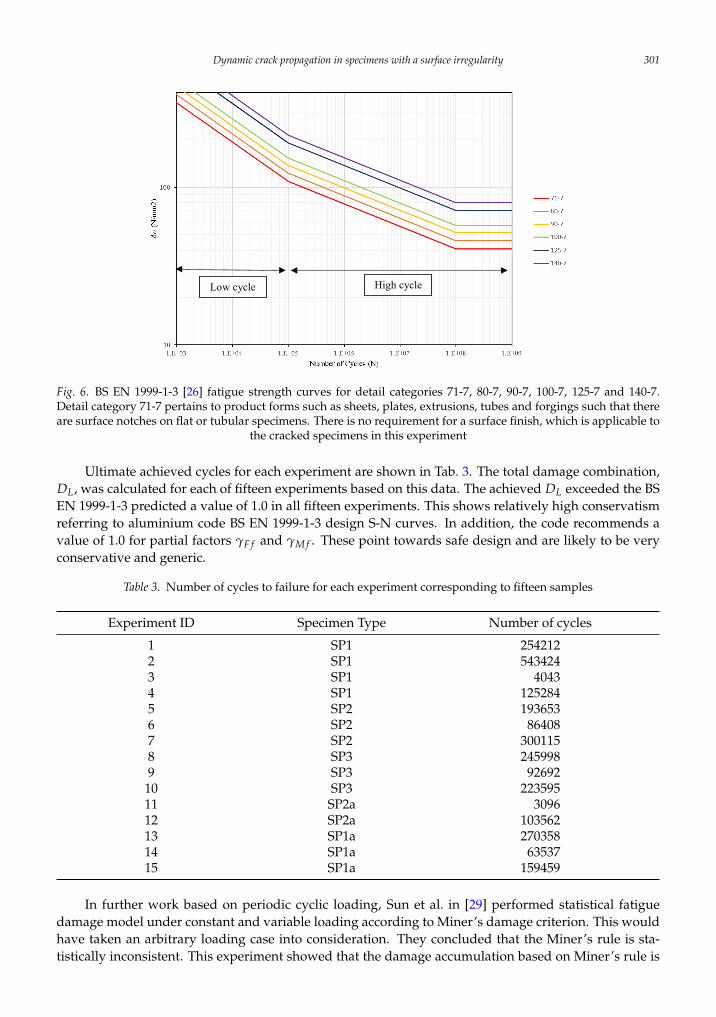
The crack propagation life of aluminium components is lower compared to steel due to the highercrack growth rate and the lower fracture toughness [28]. This phenomenon results in a rather smallfatigue crack at the moment of fracture [28]. Matelect ACPD machine used to read the ACPD readingsduring the course of the experiments. As explained and demonstrated in Fig. 3 the crack depth andACPD reading have a linear relationship. At each cycle of load the crack opens and closes. ACPDreaches maximum peak when the crack opens. The crack depth size at the end of each experiment wasused to calibrate the ACPD readings for each experiment.
13
comparison highlights the deviation from elastic displacement to nonlinear due to formation of the crack
and change of stiffness.
Figure 7: (a) Plot of crack depth against time, of which the former was measured using the alternating current potential difference (ACPD) method. Each line is drawn with a different colour, and the legend corresponds to the experiment numbers listed in Table 3; (b) measured crack length (in red) and prediction of crack length from linear elastic theory (in black) plotted against time in Experiment 6; (c) measured crack length (in red) and prediction of crack length from linear elastic theory (in black) plotted against timein Experiment 9; (d) measured crack length (in red) and prediction of crack length from linear elastic theory (in black) in Experiment 15 and (e) measured crack length (in red) and prediction of crack length from linear elastic theory in Experiment 8.
(a)
(b) (c)
(d) (e)
Fig. 7. (a) Plot of crack depth against time, of which the former was measured using the alternating current potentialdifference (ACPD) method. Each line is drawn with a different colour, and the legend corresponds to the experimentnumbers listed in Tab. 3; (b) measured crack length (in red) and prediction of crack length from linear elastic theory(in black) plotted against time in Experiment 6; (c) measured crack length (in red) and prediction of crack lengthfrom linear elastic theory (in black) plotted against time in Experiment 9; (d) measured crack length (in red) andprediction of crack length from linear elastic theory (in black) in Experiment 15 and (e) measured crack length
(in red) and prediction of crack length from linear elastic theory in Experiment 8
Dynamic crack propagation in specimens with a surface irregularity 303
Fig. 7(a) shows the crack growth in nine of the experiments. The ACPD reading was not availablefor 6 of the experiments due to the noise in the recorded data. The source of the noise could not bedetermined but anticipated to be from induction from other electrical equipment in the lab. As can beseen the crack is formed at the latter part of the experiments with fairly high propagation rate. The crackpropagation rate is higher in SP1 specimens while SP3 specimens exhibit a lower crack propagationrate. The proximity sensor shows actual displacements of the specimen. The displacement range (twicethe displacement amplitude) was compared against the elastic displacement calculated from recordedforces on the specimen. This comparison in shown in Fig. 7(b, c, d, e) for Experiments 6, 9, 15 and 8.The comparison highlights the deviation from elastic displacement to nonlinear due to formation of thecrack and change of stiffness.
In Fig. 7(a), a recurring trend in these experiments was that the rate of crack growth increasedsignificantly at specific instants in time, and this data would be useful in an analytical model of fatiguegrowth for future work. Figs. 7(b), 7(c), 7(d) and 7(e) highlight the nonlinear displacements of specimensfrom experimental measurement and the divergence at the crack formation point.
4. CONCLUSIONS
The main contribution from this work is the quantification of crack propagation in a specific geom-etry, namely tubular cross-sections. The specimen geometry was defined in finite element analysis soas to calculate stress concentration factors. These, in turn, facilitated an input signal to electromechan-ical shaker for subsequent experiments. The vibration, crack length and force are measured while timevaries. These provide insight to the energy input mechanism and how it influences the rate of crackpropagation in relation to system dynamic response.
The modified fatigue rig can be used to perform experiments on a variety of pipe sections to inves-tigate the fatigue life of specimens and crack propagations. Designing and implementing two loadcellsclose to the specimen resulted in the direct measurement of the loads to derive the stress and stressrange in the specimen and perform real condition fatigue testing. Finite element analysis was used tocalculate the stress concentration factor and used to amplify the stress in the calculations. Total damagewas summed up in each experiment. A total 15 experiments with 3 specimen types were performed.The results showed that in all 15 experiments, the calculated total damage exceeded BS EN 1999-1-3 [26]predictions, indicating the conservatism in design S-N curves. Groove depths of 1.0 mm, 1.2 mm and1.3 mm have been investigated.
The new fatigue rig enabled investigating the fatigue behaviour of the tubular specimens and per-formance of the cracked specimens. Harmonic and stochastic loading can also be applied in the tests.Different stress raisers such as grooves and holes on the tube specimens can be tested. Stress concen-tration factors of 3.50, 4.21 and 3.84 form the basis for signal input to an electromechanical shaker andcalculation of the stress range for fatigue life prediction.
The available S-N curves in the codes such as BS EN 1999-1-3 [26] can be generic and the partialfactors embedded in the codes to offset the S-N curves for design are broad with limited guidance forrefinement. The comparison between the calculated fatigue life from the S-N curves and the experimentcan potentially lead to develop new S-N curves for specific cases which are tailored for a configurationof interest. In addition the damage accumulation according to Miner’s rule shown to be conservativewhen used in conjunction with S-N curves in BS EN 1999-1-3 [26]. The newly developed fatigue rigcan be used to perform experiments on specimens with real details which result in modified and fit forpurpose S-N curves.
The ACPD readings enabled direct monitoring of the crack propagation in experiments. Compari-son of elastic displacement and the records from ACPD allows locating the transition from linear elasticto nonlinear phase, indicating the time in which a crack is formed. The onset of crack propagation isobserved from experimental time histories. The fatigue rig can be used for random and impact loadingin future. For this purpose, a signal generation activity is needed to define the required signals to excitethe shaker.
304 Ali Hassanirad, Vahid Vaziri, Ko-Choong Woo, Marian Wiercigroch
REFERENCES
[1] C. H. Foong, M. Wiercigroch, and W. F. Deans. Novel dynamic fatigue-testing device: design and mea-surements. Measurement Science and Technology, 17, (8), (2006), pp. 2218–2226. https://doi.org/10.1088/0957-0233/17/8/023.
[2] N. Jaksic, C. H. Foong, M. Wiercigroch, and M. Boltezar. Parameter identification of thefatigue-testing rig. International Journal of Mechanical Sciences, 50, (7), (2008), pp. 1142–1152.https://doi.org/10.1016/j.ijmecsci.2008.04.007.
[3] Fatigue design of offshore steel structures. DNV Recommended Practice DNV-RP-C203, (2016).[4] J. A. Ronevich, E. J. Song, Z. Feng, Y. Wang, C. D’Elia, and M. R. Hill. Fatigue crack growth rates in high
pressure hydrogen gas for multiple X100 pipeline welds accounting for crack location and residual stress.Engineering Fracture Mechanics, 228, (2020). https://doi.org/10.1016/j.engfracmech.2019.106846.
[5] M. J. Gam, B. S. Jang, and J. H. Park. A study on the fatigue analysis for a vertical cais-son on FPSO subjected to the nonlinear wave loading. Ocean Engineering, 137, (2017), pp. 151–165.https://doi.org/10.1016/j.oceaneng.2017.03.057.
[6] R. Shoghi and H. Shiri. Re-assessment of trench effect on fatigue performance of steel catenary risers in thetouchdown zone. Applied Ocean Research, 94, (2020). https://doi.org/10.1016/j.apor.2019.101989.
[7] L. Carneiro, X. Wang, and Y. Jiang. Cyclic deformation and fatigue behavior of 316L stainlesssteel processed by surface mechanical rolling treatment. International Journal of Fatigue, 134, (2020).https://doi.org/10.1016/j.ijfatigue.2019.105469.
[8] P. Xiang, L. J. Jia, M. Shi, and M. Wu. Ultra-low cycle fatigue life of aluminum alloy and its pre-diction using monotonic tension test results. Engineering Fracture Mechanics, 186, (2017), pp. 449–465.https://doi.org/10.1016/j.engfracmech.2017.11.006.
[9] W. Li, X. Xing, N. Gao, and P. Wang. Subsurface crack nucleation and growth behavior and energy-based lifeprediction of a titanium alloy in high-cycle and very-high-cycle regimes. Engineering Fracture Mechanics, 221,(2019). https://doi.org/10.1016/j.engfracmech.2019.106705.
[10] C. P. Okeke, A. N. Thite, J. F. Durodola, and M. T. Greenrod. A novel test rig for measur-ing bending fatigue using resonant behaviour. Procedia Structural Integrity, 13, (2018), pp. 1470–1475.https://doi.org/10.1016/j.prostr.2018.12.303.
[11] N. Nagabhooshanam, S. Baskar, and P. K. Nagarajan. Design and fabrication of fatigue test rig and pre-liminary investigation on flax composite beam. Materials Today: Proceedings, 5, (5), (2018), pp. 11771–11779.https://doi.org/10.1016/j.matpr.2018.02.146.
[12] H. Wei, P. Carrion, J. Chen, A. Imanian, N. Shamsaei, N. Iyyer, and Y. Liu. Multiaxial high-cyclefatigue life prediction under random spectrum loadings. International Journal of Fatigue, 134, (2020).https://doi.org/10.1016/j.ijfatigue.2019.105462.
[13] C. H. Foong, M. Wiercigroch, E. Pavlovskaia, and W. F. Deans. Nonlinear vibration caused by fatigue. Journalof Sound and Vibration, 303, (1-2), (2007), pp. 58–77. https://doi.org/10.1016/j.jsv.2006.12.008.
[14] C. H. Foong, E. Pavlovskaia, M. Wiercigroch, and W. F. Deans. Chaos caused by fatigue crack growth. Chaos,Solitons & Fractals, 16, (5), (2003), pp. 651–659. https://doi.org/10.1016/s0960-0779(02)00449-6.
[15] T. Li, S. T. Lie, and Y. B. Shao. Fatigue and fracture strength of a multi-planar circular hollow section TT-joint.Journal of Constructional Steel Research, 129, (2017), pp. 101–110. https://doi.org/10.1016/j.jcsr.2016.11.001.
[16] P. Arora, P. K. Singh, V. Bhasin, K. K. Vaze, A. K. Ghosh, D. M. Pukazhendhi, P. Gandhi, and G. Raghava.Predictions for fatigue crack growth life of cracked pipes and pipe welds using RMS SIF approach andexperimental validation. International Journal of Pressure Vessels and Piping, 88, (10), (2011), pp. 384–394.https://doi.org/10.1016/j.ijpvp.2011.07.003.
[17] Z. Mikulski and T. Lassen. Fatigue crack initiation and subsequent crack growth in fillet welded steel joints.International Journal of Fatigue, 120, (2019), pp. 303–318. https://doi.org/10.1016/j.ijfatigue.2018.11.014.
[18] P. Arora, P. K. Singh, V. Bhasin, K. K. Vaze, D. M. Pukazhendhi, P. Gandhi, and G. Raghava. Fatigue crackgrowth behavior in pipes and elbows of carbon steel and stainless steel materials. Procedia Engineering, 55,(2013), pp. 703–709. https://doi.org/10.1016/j.proeng.2013.03.318.
[19] A. Fatemi and R. Molaei. Novel specimen geometries for fatigue testing of additive manufactured met-als under axial, torsion, and combined axial-torsion loadings. International Journal of Fatigue, 130, (2020).https://doi.org/10.1016/j.ijfatigue.2019.105287.
[20] J. Fischer, P. J. Freudenthaler, P. R. Bradler, and R. W. Lang. Novel test system and test procedure for fa-tigue crack growth testing with cracked round bar (CRB) specimens. Polymer Testing, 78, (2019), p. 105998.https://doi.org/10.1016/j.polymertesting.2019.105998.
[21] X. Zheng, X. Zhang, L. Ma, W. Wang, and J. Yu. Mechanical characterization of notched high density polyethy-lene (HDPE) pipe: Testing and prediction. International Journal of Pressure Vessels and Piping, 173, (2019), pp. 11–19. https://doi.org/10.1016/j.ijpvp.2019.04.016.
Dynamic crack propagation in specimens with a surface irregularity 305
[22] D. Jısa, P. Liskutın, T. Kruml, and J. Polak. Small fatigue crack growth in aluminium alloy EN-AW 6082/T6.International Journal of Fatigue, 32, (12), (2010), pp. 1913–1920. https://doi.org/10.1016/j.ijfatigue.2010.06.003.
[23] K. Kluger. Fatigue life estimation for 2017A-T4 and 6082-T6 aluminium alloys subjectedto bending-torsion with mean stress. International Journal of Fatigue, 80, (2015), pp. 22–29.https://doi.org/10.1016/j.ijfatigue.2015.05.005.
[24] V. L. Neelakantha, T. Jayaraju, P. Naik, D. Kumar, and C. R. Rajashekar. Determination of fracture toughnessand fatigue crack growth rate using circumferentially cracked round bar specimens of Al2014T651. AerospaceScience and Technology, 47, (2015), pp. 92–97. https://doi.org/10.1016/j.ast.2015.09.023.
[25] V. Chaves, G. Beretta, J. A. Balbın, and A. Navarro. Fatigue life and crack growth direction in 7075-T6 alu-minium alloy specimens with a circular hole under biaxial loading. International Journal of Fatigue, 125, (2019),pp. 222–236. https://doi.org/10.1016/j.ijfatigue.2019.03.031.
[26] BS EN 1999-1-3:2007. Eurocode 9: Design of aluminum structures, Part 1-3: Structures susceptible to fatigue. BritishStandard.
[27] P. Schaumann and S. Steppeler. Fatigue tests of axially loaded butt welds up to very high cycles. ProcediaEngineering, 66, (2013), pp. 88–97. https://doi.org/10.1016/j.proeng.2013.12.065.
[28] J. Maljaars, M. Lukic, and F. Soetens. Comparison between the Eurocode for fatigue of steel structures, EN1993-1-9, and the Eurocode for fatigue of aluminium structures, EN 1999-1-3. In 5th International Conference onFatigue Design, Elsevier, (2013), pp. 34–48.
[29] Q. Sun, H. N. Dui, and X. L. Fan. A statistically consistent fatigue damage model based on Miner’s rule.International Journal of Fatigue, 69, (2014), pp. 16–21. https://doi.org/10.1016/j.ijfatigue.2013.04.006.
[30] S. P. Zhu, D. Liao, Q. Liu, J. A. F. O. Correia, and A. M. P. De Jesus. Nonlinear fatigue damage accumula-tion: isodamage curve-based model and life prediction aspects. International Journal of Fatigue, 128, (2019).https://doi.org/10.1016/j.ijfatigue.2019.105185.
[31] J. P. Dias, S. Ekwaro Osire, A. Cunha Jr, S. Dabetwar, A. Nispel, F. M. Alemayehu, and H. B. Endeshaw. Paramet-ric probabilistic approach for cumulative fatigue damage using double linear damage rule considering limiteddata. International Journal of Fatigue, 127, (2019), pp. 246–258. https://doi.org/10.1016/j.ijfatigue.2019.06.011.
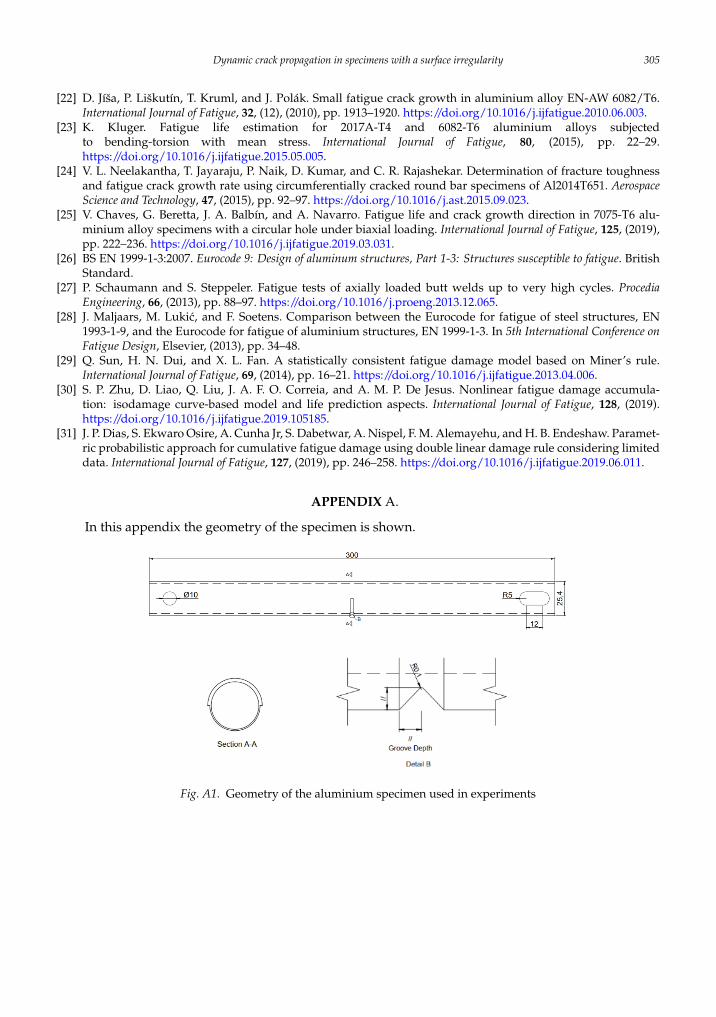
APPENDIX A.
In this appendix the geometry of the specimen is shown.
15
Appendix A
In this appendix the geometry of the specimen is shown.
Geometry of the aluminium specimen used in experiments.
Fig. A1. Geometry of the aluminium specimen used in experiments