Embed Size (px)
Citation preview
SANDIA REPORT
SAND2005-1510 Unlimited Release Printed April 2005 Dynamic Compaction of Tungsten Carbide Powder
Tracy J. Vogler, Jeffrey W. Gluth, Dennis E. Grady, and Clint A. Halll
Prepared by Sandia National Laboratories Albuquerque, New Mexico 87185 and Livermore, California 94550 Sandia is a multiprogram laboratory operated by Sandia Corporation, a Lockheed Martin Company, for the United States Department of Energy�s National Nuclear Security Administration under Contract DE-AC04-94AL85000. Approved for public release; further dissemination unlimited.
Issued by Sandia National Laboratories, operated for the United States Department of Energy by Sandia Corporation.
NOTICE: This report was prepared as an account of work sponsored by an agency of the United States Government. Neither the United States Government, nor any agency thereof, nor any of their employees, nor any of their contractors, subcontractors, or their employees, make any warranty, express or implied, or assume any legal liability or responsibility for the accuracy, completeness, or usefulness of any information, apparatus, product, or process disclosed, or represent that its use would not infringe privately owned rights. Reference herein to any specific commercial product, process, or service by trade name, trademark, manufacturer, or otherwise, does not necessarily constitute or imply its endorsement, recommendation, or favoring by the United States Government, any agency thereof, or any of their contractors or subcontractors. The views and opinions expressed herein do not necessarily state or reflect those of the United States Government, any agency thereof, or any of their contractors. Printed in the United States of America. This report has been reproduced directly from the best available copy. Available to DOE and DOE contractors from
U.S. Department of Energy Office of Scientific and Technical Information P.O. Box 62 Oak Ridge, TN 37831 Telephone: (865)576-8401 Facsimile: (865)576-5728 E-Mail: [email protected] Online ordering: http://www.osti.gov/bridge
Available to the public from
U.S. Department of Commerce National Technical Information Service 5285 Port Royal Rd Springfield, VA 22161 Telephone: (800)553-6847 Facsimile: (703)605-6900 E-Mail: [email protected] Online order: http://www.ntis.gov/help/ordermethods.asp?loc=7-4-0#online
ii

iii
SAND2005-1510 Unlimited Release Printed April 2005
Dynamic Compaction of Tungsten Carbide Powder
Tracy J. Vogler, Jeffrey W. Gluth, Dennis E. Grady Solid Dynamics and Energetic Materials Department
MS 1181
Clint A. Hall Shock and Z-Pinch Physics Department
MS 1168
Sandia National Laboratories P.O. Box 5800
Albuquerque NM 87185
Abstract The shock compaction behavior of a tungsten carbide powder was investigated using a new experimental design for gas-gun experiments. This design allows the Hugoniot properties to be measured with reasonably good accuracy despite the inherent difficulties involved with distended powders. The experiments also provide the first reshock state for the compacted powder. Experiments were conducted at impact velocities of 245, 500, and 711 m/s. A steady shock wave was observed for some of the sample thicknesses, but the remainder were attenuated due to release from the back of the impactor or the edge of the sample. The shock velocity for the powder was found to be quite low, and the propagating shock waves were seen to be very dispersive. The Hugoniot density for the 711 m/s experiment was close to ambient crystal density for tungsten carbide, indicating nearly complete compaction. When compared with quasi-static compaction results for the same material, the dynamic compaction data is seen to be significantly stiffer for the regime over which they overlap. Based on these initial results, recommendations are made for improving the experimental technique and for future work to improve our understanding of powder compaction.
iv
Acknowledgments The authors would like to thank Alberto Pirela for design of the test fixture, TMI and MPCL for manufacture of fixture parts, Heidi Anderson for assembly of the fixtures, and the STAR team for the execution of the experiments.
v
Table of Contents 1.0 Introduction ....................................................................................................... 1 2.0 Experimental Method......................................................................................... 2 2.1 Material ...................................................................................................... 2 2.2 Aztec pyramid test fixture........................................................................... 2 2.3 Gas gun setup ............................................................................................. 4 3.0 Experimental Results ......................................................................................... 5 3.1 Experiments I and V, impact at 250 m/s...................................................... 5 3.2 Experiments II and III, impact at 500 m/s ................................................... 6 3.3 Experiment IV, impact at 711 m/s............................................................... 6 4.0 Analysis of Experimental Results....................................................................... 8 4.1 Shock Hugoniot states ................................................................................. 8 4.2 WC reshock states ....................................................................................... 9 4.3 Uncertainty analysis for Hugoniot and reshock states ................................ 10 4.4 Wave attenuation issues ............................................................................ 11 5.0 Discussion ....................................................................................................... 13 5.1 Experimental technique............................................................................. 13 5.2 Compaction behavior of tungsten carbide.................................................. 15 5.3 Experimental improvements and future directions..................................... 16 6.0 Conclusions and Recommendations ................................................................. 18 6.1 Principal conclusions ................................................................................ 18 6.2 Recommendations .................................................................................... 18 7.0 References ....................................................................................................... 20
vi
List of Tables 1 Elemental composition of WC powder. 23
2 Hugoniot results for WC powder experiments. 24
3 Reshock conditions for WC powder. 25
4 Estimated arrival times for shock and release in the different levels of each WC powder experiment. Values in red indicate that release wave is expected to arrive before shock.
26

vii
List of Figures 1 SEM micrograph of unsifted Kennametal tungsten carbide powder used
in the current investigation. 27
2 Schematic of test setup showing (L to R) aluminum cover plate, PMMA fixture, and aluminum target plate. Aluminum sample plates are not shown. Fixture is filled with powder, cover plate is glued onto fixture, and fixture is then glued into target plate. Assembly is impacted from the left.
28
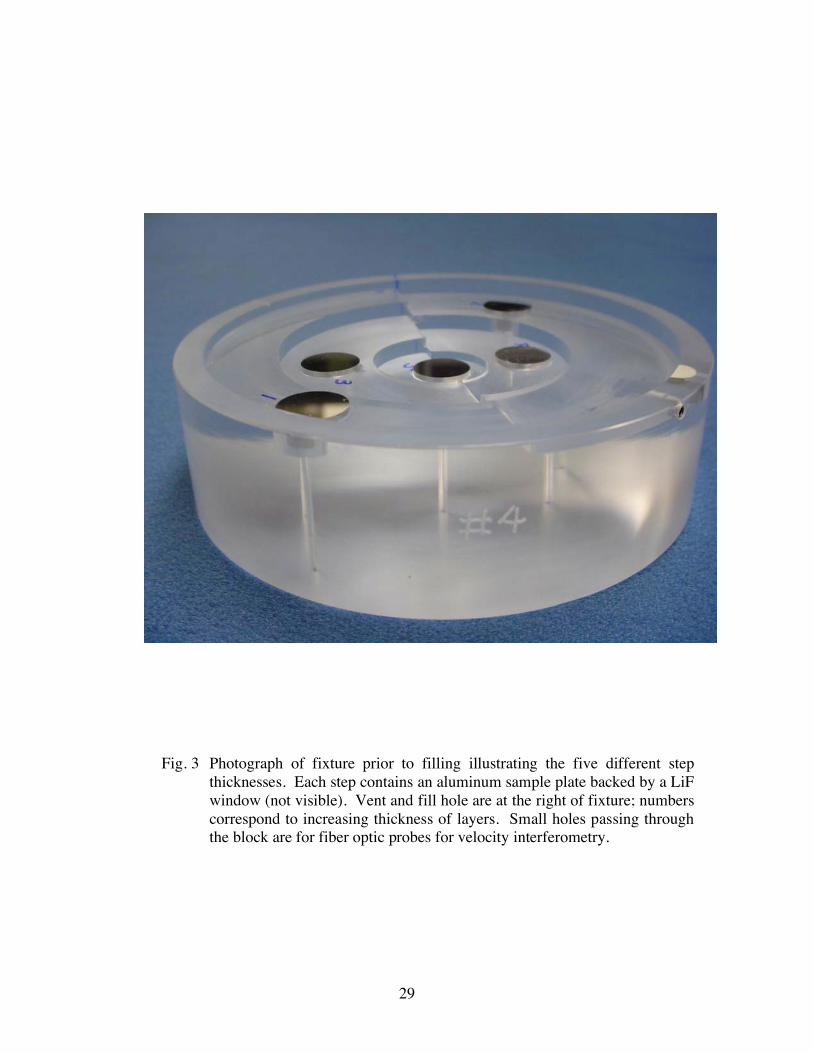
3 Photograph of fixture prior to filling illustrating the five different step thicknesses. Each step contains an aluminum sample plate backed by a LiF window (not visible). Vent and fill hole are at the right of fixture; numbers correspond to increasing thickness of layers. Small holes passing through the block are for fiber optic probes for velocity interferometry.
29
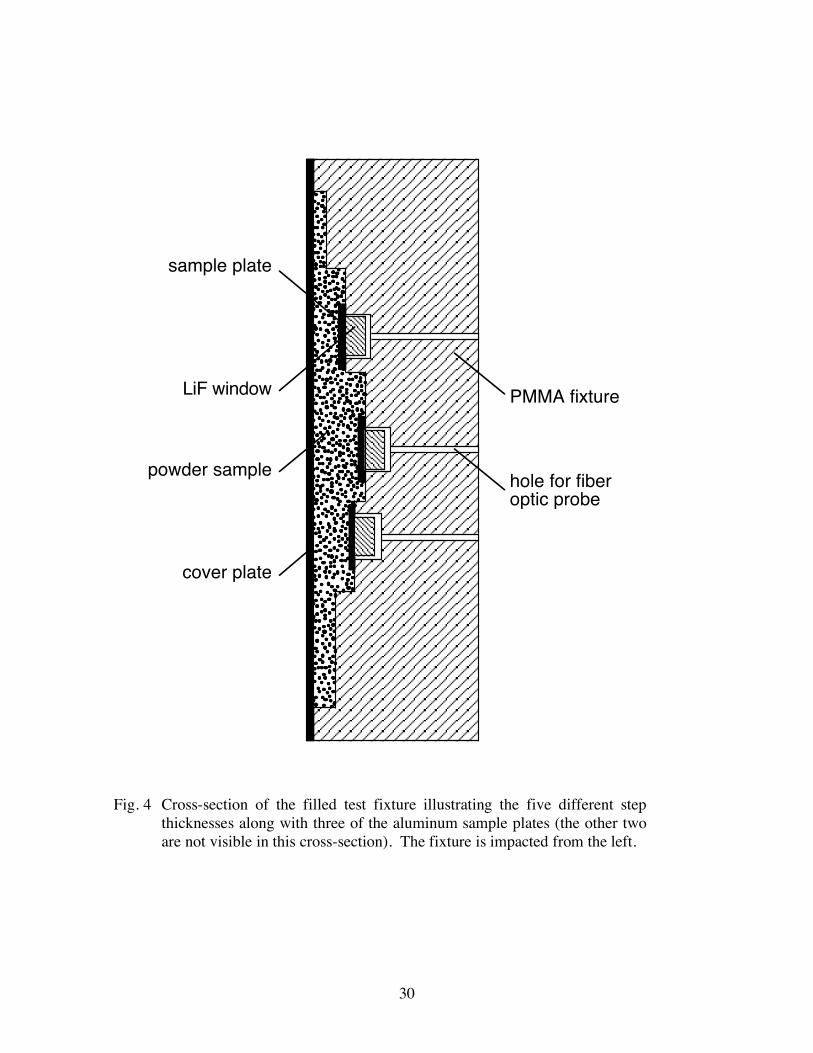
4 Cross-section of the filled test fixture illustrating the five different step thicknesses along with three of the aluminum sample plates (the other two are not visible in this cross-section). The fixture is impacted from the left.
30
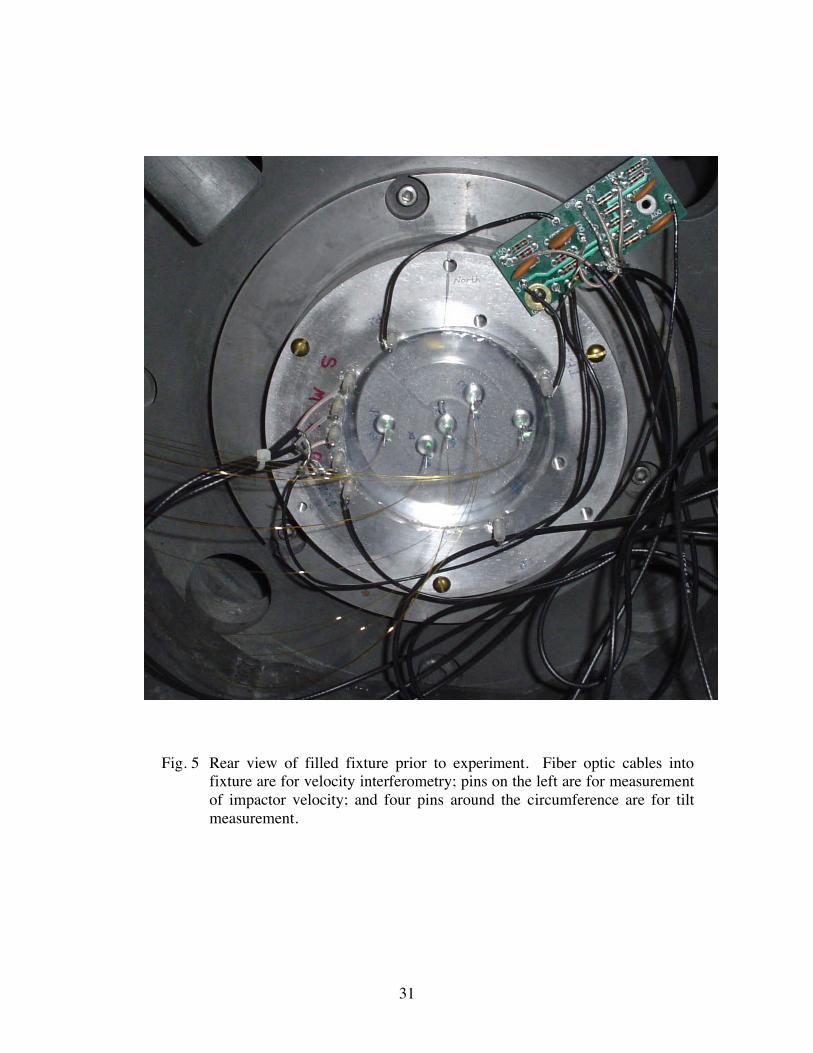
5 Rear view of filled fixture prior to experiment. Fiber optic cables into fixture are for velocity interferometry; pins on the left are for measurement of impactor velocity; and four pins around the circumference are for tilt measurement.
31
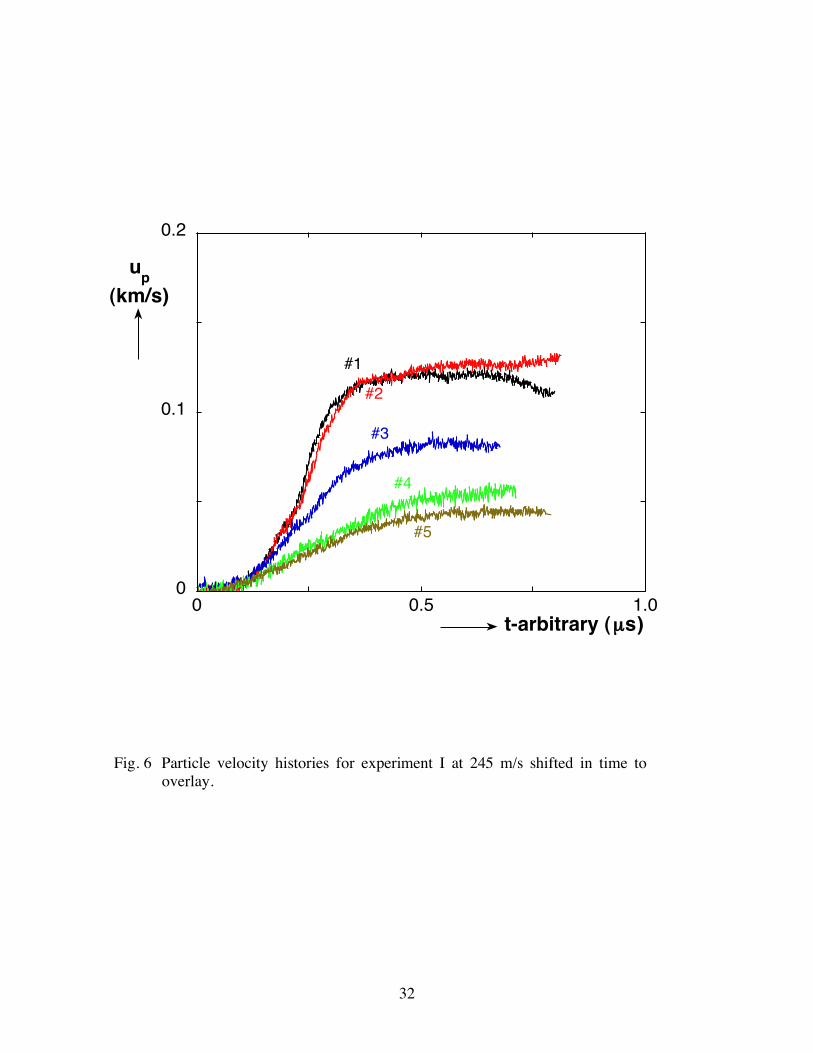
6 Particle velocity histories for experiment I at 245 m/s shifted in time to overlay.
32
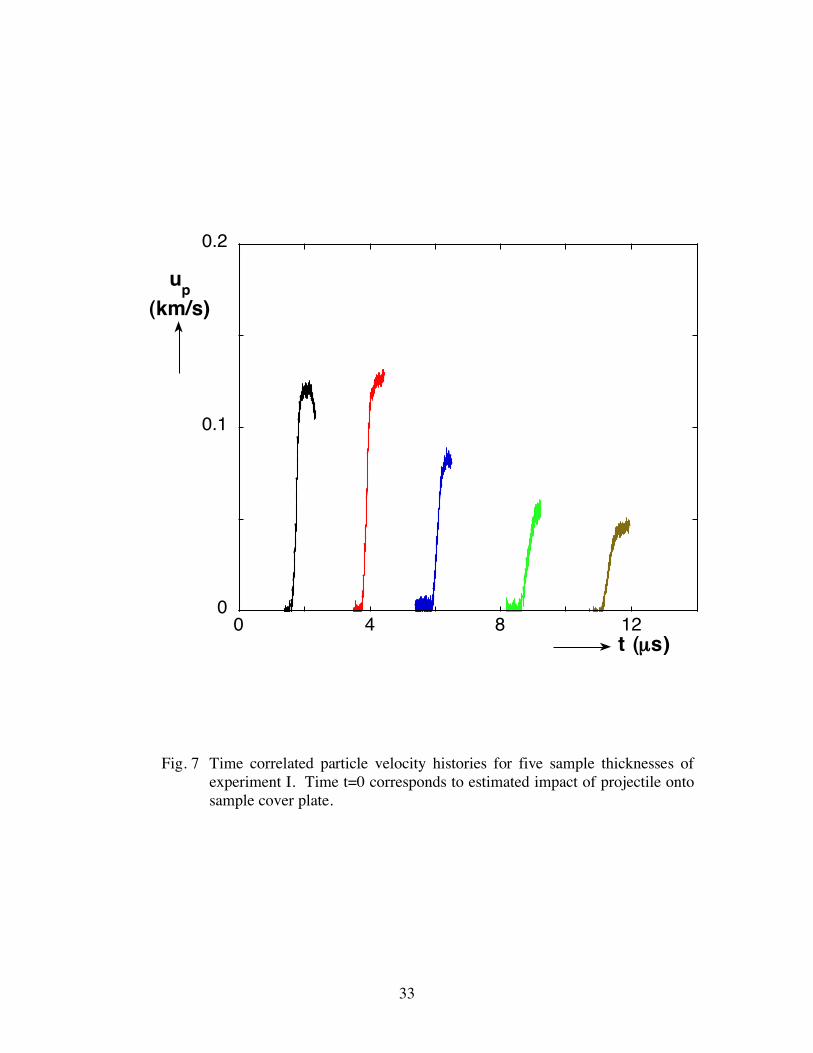
7 Time correlated particle velocity histories for five sample thicknesses of experiment I. Time t=0 corresponds to estimated impact of projectile onto sample cover plate.
33
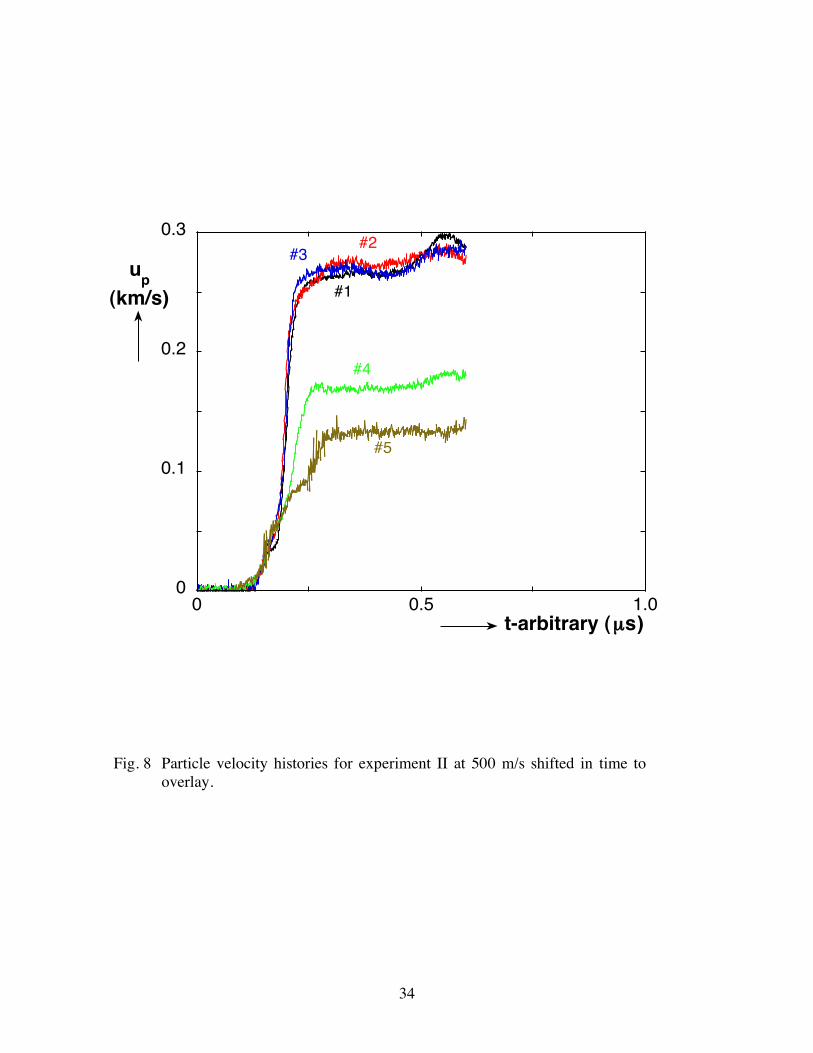
8 Particle velocity histories for experiment II at 500 m/s shifted in time to overlay.
34
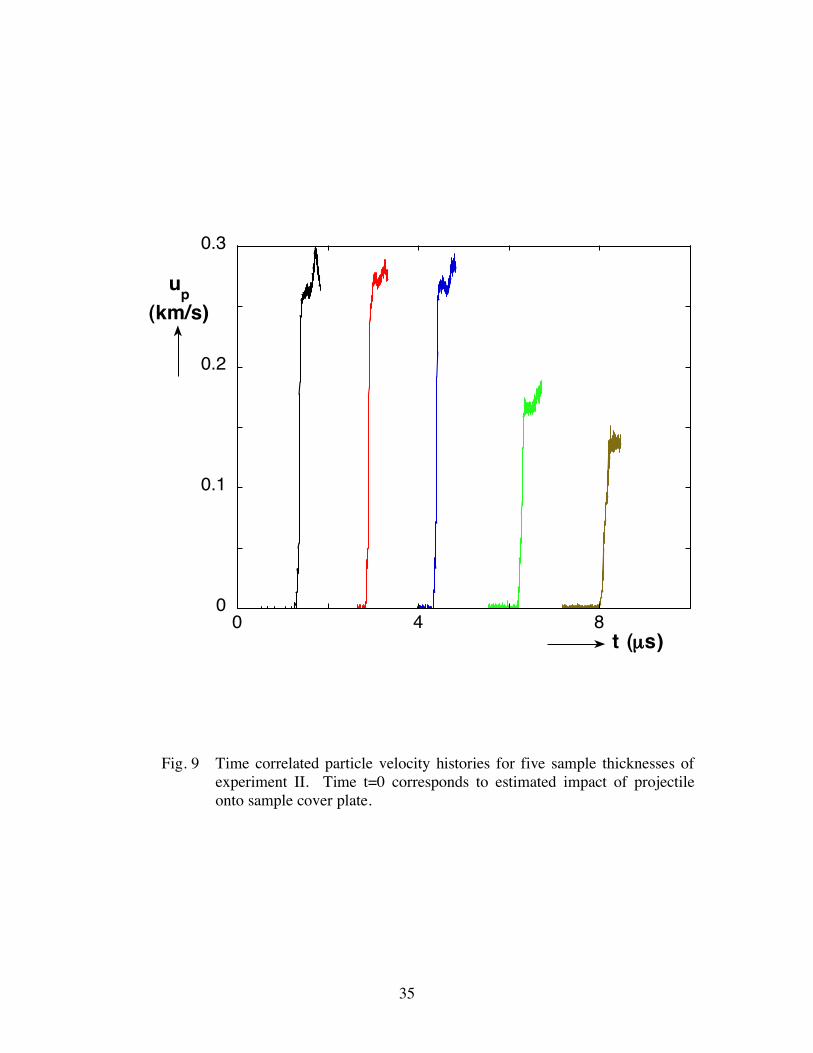
9 Time correlated particle velocity histories for five sample thicknesses of experiment II. Time t=0 corresponds to estimated impact of projectile onto sample cover plate.
35
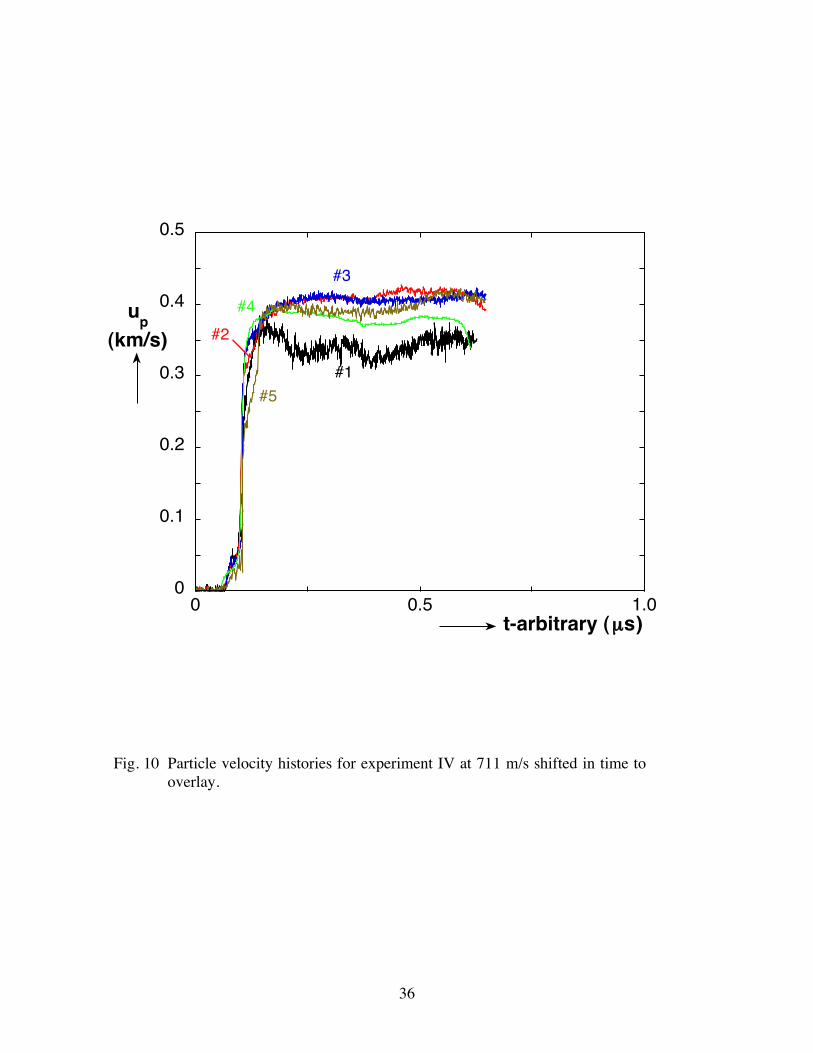
10 Particle velocity histories for experiment IV at 711 m/s shifted in time to overlay.
36
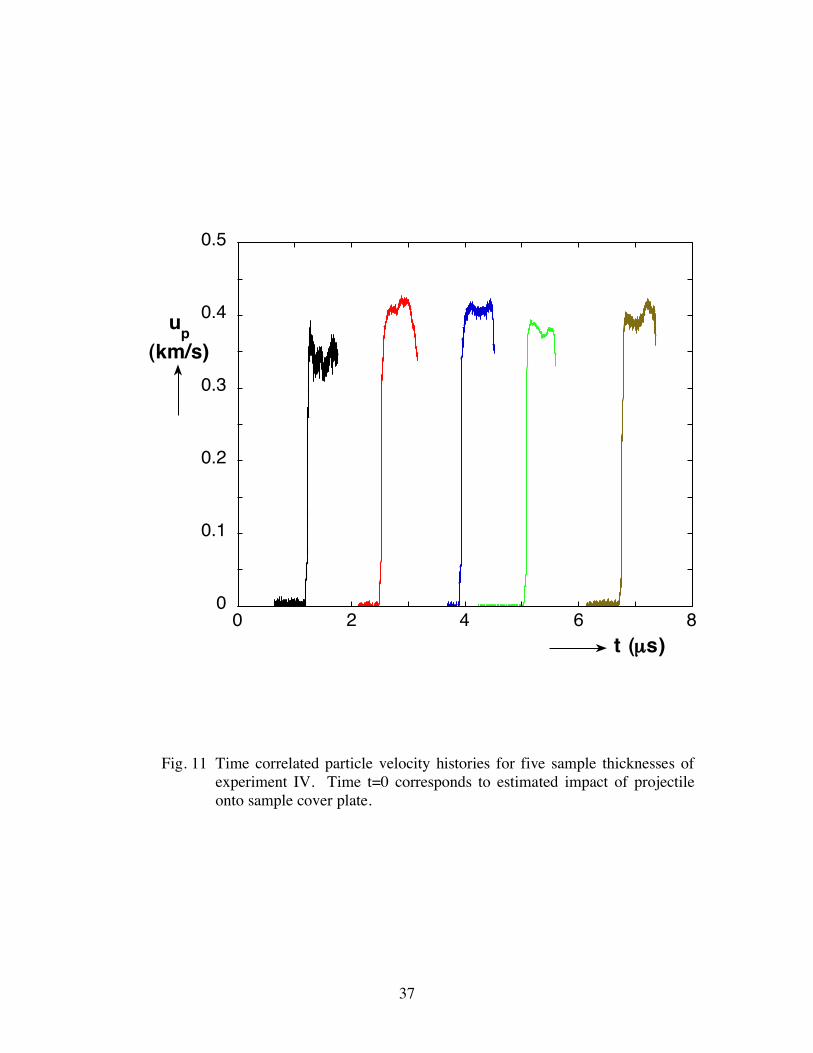
11 Time correlated particle velocity histories for five sample thicknesses of experiment IV. Time t=0 corresponds to estimated impact of projectile onto sample cover plate.
37
viii
12 Measured shock velocity in WC powder as a function of projectile velocity.
38
13 σ-up diagram illustrating impedance matching of aluminum cover plate and powder sample to determine Hugoniot state of the powder sample. The intersection of the Rayleigh line with the corresponding aluminum release path determines the Hugoniot particle velocity and stress state of the powder. Also shown are states of the LiF window as measured with velocity interferometry and the reshock states of the WC powder determined from these measurements.
39
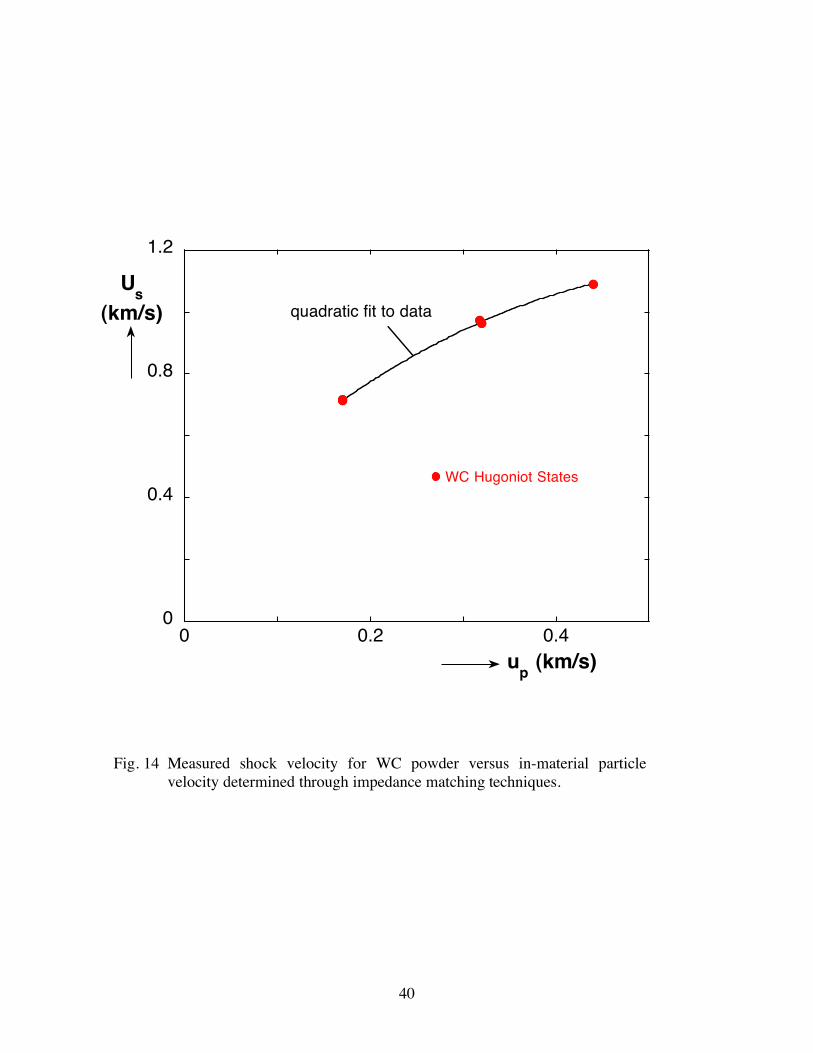
14 Measured shock velocity for WC powder versus in-material particle velocity determined through impedance matching techniques.
40
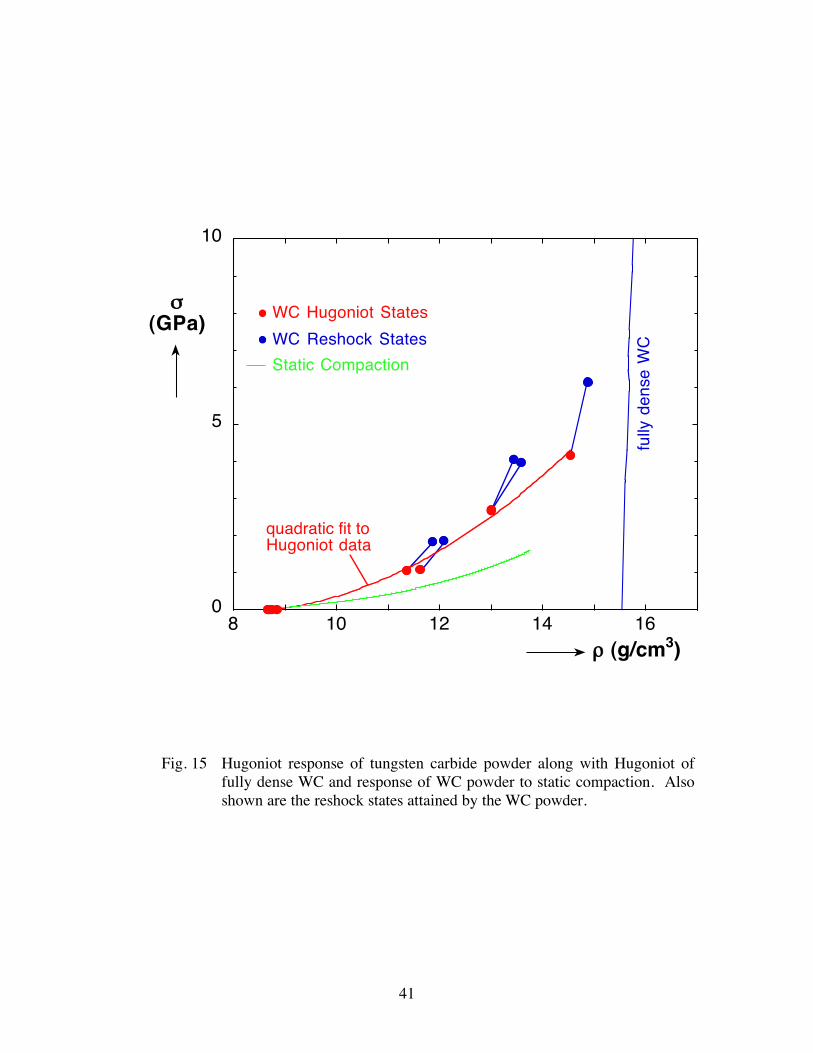
15 Hugoniot response of tungsten carbide powder along with Hugoniot of fully dense WC and response of WC powder to static compaction. Also shown are the reshock states attained by the WC powder.
41
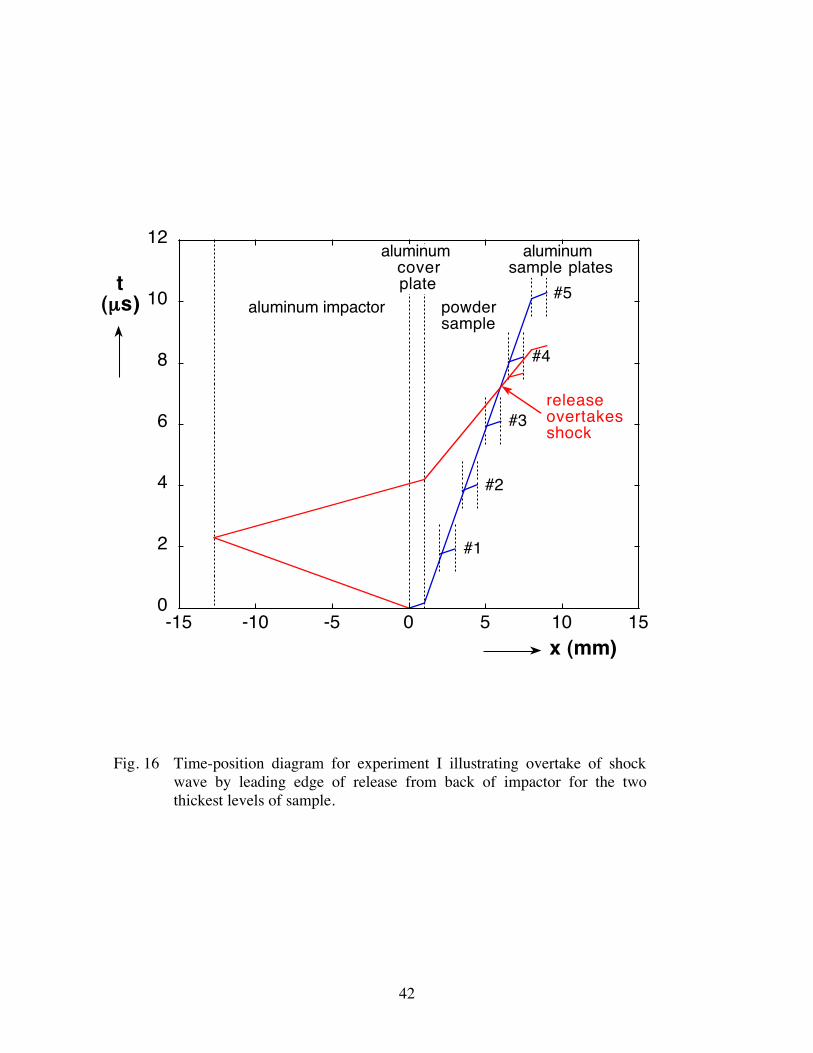
16 Time-position diagram for experiment I illustrating overtake of shock wave by leading edge of release from back of impactor for the two thickest levels of sample.
42
1
Dynamic Compaction of Tungsten Carbide Powder
1.0 Introduction The dynamic compaction of ceramic powders due to explosive loading or high-velocity impact is not well understood. These powders are typically highly distended, with porosities of 40% or more being typical, and the physical processes involved in removing this porosity during dynamic compaction are poorly understood. Unlike metals, ceramics can have very high dynamic yield strength that may play an important role in the crush up behavior of their powders. Because of their high distention, these materials can have very slow shock velocities while, at the same time, having much higher release velocities. As a result, attenuation and multidimensional effects can be quite important in applications involving these materials, necessitating the use of multidimensional computational modeling. In order to develop and calibrate material models for these powders, high quality experimental data is required under multiple conditions. A critical element in such a data set would necessarily be the response of the powder to uniaxial strain shock loading. The objectives of this report are to present a recently developed experimental setup for dynamic compaction of powders. The need for accurate data motivated implementation of a novel experimental design that allows shock and reshock loading of multiple thicknesses of powder, thus providing greater experimental accuracy. In addition, the setup was intended to permit attenuating waves in the ceramic powder to be studied at the same time as the shock measurement. Some recent results obtained for a tungsten carbide (WC) powder are presented for stresses sufficient to cause compaction nearly to full ambient density. These dynamic results are compared to quasi-static compaction results recently obtained for the same WC powder [Lee et al., 2004]. Based on the results of these experiments, recommendations are made for improvements to the experimental technique and for future work.
2
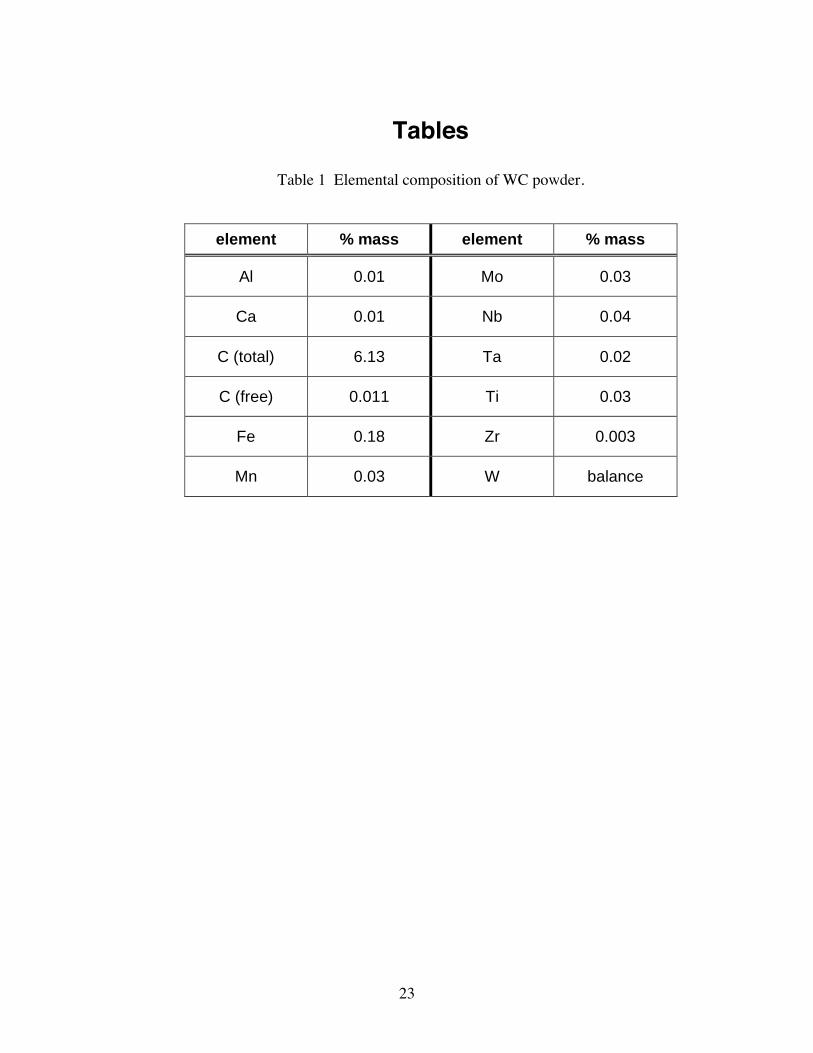
2.0 Experimental Methods In this section, the experimental technique for the shock loading of powders and the material used in initial experiments are described. This technique was developed in an attempt to overcome experimental difficulties associated with the testing of distended powders and obtain accurate, repeatable results. 2.1 Material The WC powder used in this investigation was manufactured by Kennametal Inc. of Latrobe, Pennsylvania. In contrast to traditional methods of producing WC, their process is one of crystal growth [Lassner & Schubert, 1999]. Concentrated tungsten ore is combined with iron oxide, calcium carbide and aluminum in a heated furnace which initiates a self-sustaining exothermic reaction of ~4500° F. In a molten pool of iron, the tungsten and carbon combine and grow a crystal that is stoichiometrically correct. The grains thus produced are individual single crystals of varying sizes and, as such, are largely free of internal subboundaries, thus greatly increasing the fracture strength of the grains. The chemical composition of the WC powder as provided by the manufacturer is given in Table 1. From the table, it can be seen that the tungsten carbide is relatively pure and that there is little, if any, W2C present. A low magnification SEM image of the unsifted WC powder is shown if Fig. 1. The sharp angular shape of the grains is due to their single-crystal nature. The WC crystal has a variant of the hexagonal close packed (HCP) structure. Prior to the experiments, the WC powder was sifted to provide grains between 20 and 32 µm in size. It should be pointed out that the sifting process can allow irregularly shaped grains with dimensions outside these limits to be included. To some extent, the sifting determines the initial dissention of the powder since unsifted material tends to give higher densities than sifted. Initial sample densities in the current experiments are approximately 56% of the theoretical density of 15.7 g/cm3. 2.2 Aztec pyramid test fixture In order to provide an accurate measurement of shock velocity for the porous material, a special fixture was developed. It is colloquially referred to as the “Aztec Pyramid” (AP) fixture due to its multiple steps. The fixture was designed for use on the single-stage compressed gas gun at Sandia’s STAR facility. This gun operates by the release of compressed gas and can achieve projectile velocities over 1 km/s. The AP fixture was machined from a block of PMMA (polymethyl methacrylate) using computer-controlled tooling by Technical Manufacturing Industries, Inc., of Albuquerque, NM. It was made of a polymer so that shock wave velocities in the fixture would be as low as possible [Carter & Marsh, 1995] to delay multi-dimensional effects [Thadhani & Aizawa, 1997]. Secondary considerations leading to the choice of PMMA include machinability and its compatibility with glue used to attach other pieces to the fixture. A drawing of the fixture and other experimental hardware is shown in Fig. 2, and a photograph of the empty fixture is shown in Fig. 3. The outer diameter of the PMMA
3
fixture is 89 mm, and the interior sample cavity has a maximal diameter of 80 mm. It can be seen that each sample has five discrete levels (sample thicknesses), which are shown in a cross-sectional view of the fixture in Fig. 4. Originally, it was hoped that attenuation of waves could be investigated using such a fixture. However, as discussed in Section 4, the current design of the fixture suffered from attenuation from the rear of the impactor and, perhaps, premature edge release. Each step of the AP fixture had a counterbore 7 mm in diameter and 4 mm deep. Each counterbore was covered with a 10 mm diameter 6061-T6 aluminum sample plate which was diamond turned to a mirror finish and a thickness of 1 mm before being glued in place. Glued onto the back of each aluminum plate was a LiF window [Wise & Chhabildas, 1986] with a diameter of 6 mm and a thickness of 3 mm. The side of the window toward the sample plate is vapor coated with a thin layer of aluminum to make it reflective. A small (0.9 mm) diameter hole in the bottom of the counterbore was made for insertion of a fiber optic probe to measure the interface particle velocity with the velocity interferometer system identified by its acronym VISAR [Barker & Hollenbach, 1972]. The cavity of the fixture (see Figs. 3 and 4) was filled with WC powder and a 1 mm thick diamond-turned 6061-T6 aluminum cover plate was glued onto the top of the AP fixture. The fixture was then oriented vertically and placed in a vacuum chamber. A vent hole in the top of the cavity (see Fig. 3) facilitates evacuation of the powder, while a piece of porous alumina placed in the vent hole prevents powder from being sucked out of the fixture. Evacuation leads to settling of the powder, so the fixture was preevacuated and additional powder added through a small screw hole. Density of the powder sample was calculated using the calculated volume of the cavity and the known mass of powder added to the fixture. It should be noted that the porous alumina piece and fill hole were added for the third experiment. Therefore, a small void was present in the fixture cavity during the first two experiments. The size of this void was measured in order to calculate sample density. Based on the variation in sample density amongst the different samples, random errors in the density are estimated to be 1-2%. Possible sources of systematic error include an inaccurate fixture volume due to assuming the fixture is machined perfectly according to the design or due to bulging of the cover plate. Nominal thicknesses for the fixture levels were 1, 2.5, 4, 5.5, and 7 mm. The actual thickness of each level was determined by optically measuring the height of each small aluminum sample plate in the empty fixture (see Fig. 3). After the sample was filled, the height of the aluminum cover plate in the same position was measured. Since the thicknesses of the sample plates and cover plates are precisely known, this measurement gives a thickness for the level that is accurate to better than 5 µm. It should be noted that these measurements were performed with the fixture lying flat, but the experiment was performed with the sample vertical. In the vertical position, the relatively dense WC powder will cause the thin aluminum cover plate to bulge outward somewhat. The maximum bulging due to this difference in orientation is estimated to be less than 10 µm based on a simple plate bending analysis. This would lead to a decrease in sample density of less than 0.2%. Since the particle velocity measurements used to determine
4
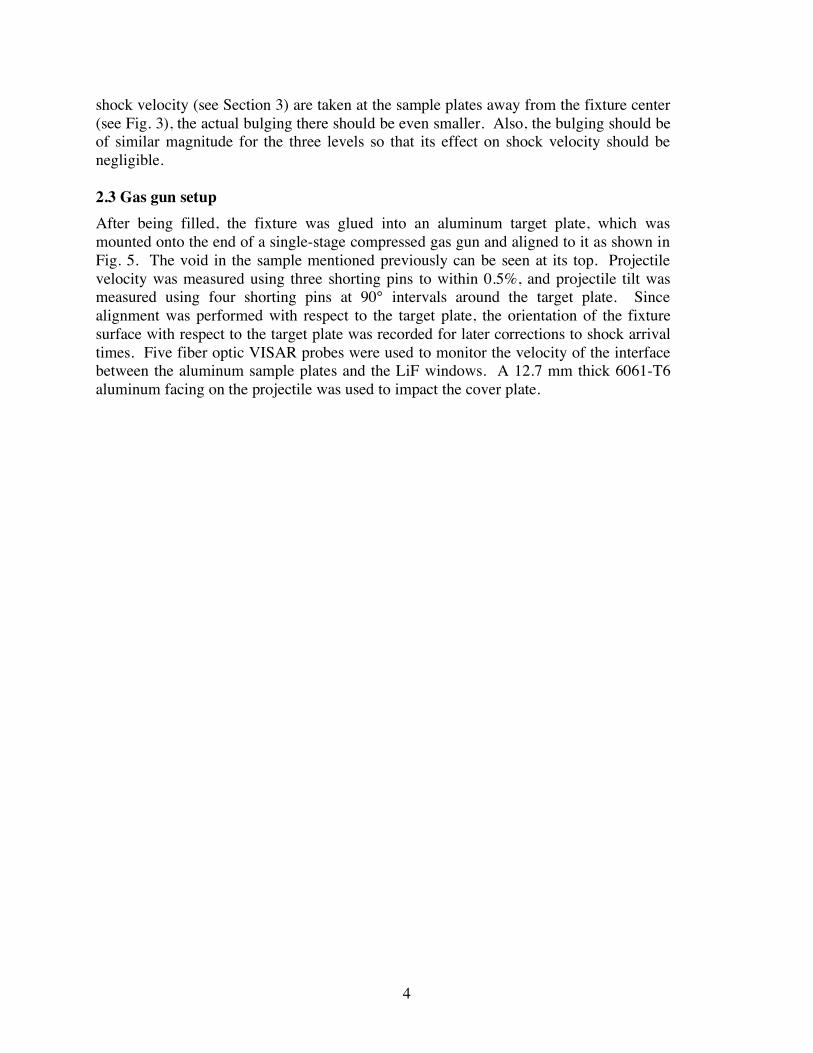
shock velocity (see Section 3) are taken at the sample plates away from the fixture center (see Fig. 3), the actual bulging there should be even smaller. Also, the bulging should be of similar magnitude for the three levels so that its effect on shock velocity should be negligible. 2.3 Gas gun setup After being filled, the fixture was glued into an aluminum target plate, which was mounted onto the end of a single-stage compressed gas gun and aligned to it as shown in Fig. 5. The void in the sample mentioned previously can be seen at its top. Projectile velocity was measured using three shorting pins to within 0.5%, and projectile tilt was measured using four shorting pins at 90° intervals around the target plate. Since alignment was performed with respect to the target plate, the orientation of the fixture surface with respect to the target plate was recorded for later corrections to shock arrival times. Five fiber optic VISAR probes were used to monitor the velocity of the interface between the aluminum sample plates and the LiF windows. A 12.7 mm thick 6061-T6 aluminum facing on the projectile was used to impact the cover plate.
5
3.0 Experimental Results Five experiments have been performed on WC powder at nominal velocities of 250, 500, and 700 m/s. The results, which consist of interface particle velocity measurements and calculated shock velocities, are given in this section; a detailed analysis of the results is given in Section 4. 3.1 Experiments I and V, impact at 250 m/s Two experiments were conducted at approximately 250 m/s. The first experiment (245 m/s) was conducted without the porous alumina in the vacuum vent hole and without the fill hole. A small amount of material was lost during initial evacuation of the fixture, resulting in a small void being present at the top of the fixture. This has been accounted for in the density calculation, which yielded a value of 8.67 g/cm3. Velocity measurements were made at the aluminum/LiF interface for five sample thicknesses. These results, shifted in time to overlay, are shown in Fig. 6. The velocity profiles for thicknesses #1 and #2 are very similar, indicating that a steady wave is propagating through the powder material. Both reach a peak particle velocity of about 125 m/s; i.e. very close to half the impact velocity. Even after propagation through 1 mm of aluminum, the wave has a rise time of approximately 300 ns, indicating a dispersive wave in the powder. However, about 50 ns of this rise time is due to elastic-plastic wave propagation in the aluminum sample plate. The wave profiles for thicknesses #3-#5 indicate a significantly attenuated wave; the reasons for this attenuation will be discussed in Section 4. Therefore, only the thinnest two levels are used to determine the shock velocity Us. Based on the size of the window, edge release waves are expected to perturb these measurements approximately 0.5 µs after shock arrival. Thus, only velocity histories to this time are shown. The velocity measurements of Fig. 6 were time correlated to one another based on a common fiducial mark in all records. The arrival times were then corrected for projectile tilt (as measured from the tilt pins) and sample tilt in the holder by a least-squares fit of a plane to each surface. Projectile tilt was 2.9 mrad, while sample tilt was 0.6 mrad. Because of the relatively slow projectile, correction times were fairly large even for the modest tilt seen. Timing shifts due to different fiber lengths have been ignored and are quite small. Velocity measurements that have been time correlated to one another, and to impact based on an assumed shock velocity of 5.5 km/s in the aluminum (the plastic shock velocity for aluminum), are shown in Fig. 7. Based on the first two profiles, a shock velocity of 0.718 km/s is calculated. Note that the behavior of the aluminum sample plates has no effect on the measured shock velocity because both waves pass through the same thickness of aluminum. Experiment V was conducted under essentially the same conditions as experiment I as seen in Table 2. Density was determined to be 8.85 g/cm3, while projectile and sample tilts were 0.7 and 1.8 mrad, respectively. There were, however, two notable differences between the two experiments. First, the venting and refilling was significantly improved for experiment V so that no significant void was present in the fixture. Despite this,

6
attenuation was still observed for levels three and thicker. Thus, the attenuation observed in experiment I was not due to the presence of the void in the fixture. Second, the particle velocity history of the fifth (7 mm) thickness was not measured. Despite these differences, the particle velocity histories for the first two thicknesses were very similar for the two experiments. The resulting shock velocities were also very similar: 0.718 and 0.714 km/s for experiments I and V, respectively. 3.2 Experiments II and III, impact at 500 m/s Two experiments were conducted at 500 m/s. Experiment II lacked the porous alumina and the fill hole; its density was 8.74 g/cm3. Particle velocity measurements for the five sample thicknesses, shifted in time so that they overlay, are shown in Fig. 8. The rise times and peak particle velocities for the thinnest three levels are essentially identical, indicating a steady wave. The three profiles have a rise time of about 100 ns, though about half of this rise seems to be due to the development of a two-wave structure in the aluminum associated with elastic-plastic effects. Peak velocities are approximately 270 m/s, again about half the impact velocity. The thickest two samples display significant attenuation; this will be discussed in Section 4. After correlating times for the five measurements to a common fiducial and correcting for projectile tilt of 0.16 mrad and sample tilt of 0.2 mrad, the velocity histories in Fig. 9 were obtained. Based on a least squares fit to the arrival times for the first three profiles, a shock velocity of 0.972 km/s was found. Experiment III was conducted under essentially the same conditions as experiment II as seen in Table 2. Density was determined to be 8.69 g/cm3, while projectile and sample tilts were found to be 0.8 and 0.1 mrad, respectively. The filling procedure for improved for III, so a uniform fill was achieved. The particle velocity histories for the first three thicknesses were very similar for the two experiments, and histories for the first three thicknesses were again used to determine the shock velocity of 0.963 km/s. This agrees remarkably well with the value of Us for experiment II. 3.3 Experiment IV, impact at 711 m/s One experiment was conducted at 711 m/s. Its density was 8.68 g/cm3. Interface particle velocity measurements for the five sample thicknesses, shifted in time so that they overlay, are shown in Fig. 10. The wave profiles show a significantly steeper rise than those for previous experiments due to the increased shock stress. The peak particle velocities for the five thicknesses also show more variability than is seen in the other experiments. The reason for this is not clear, but it may be due to new phenomena such as jetting occurring in the powder as it is compacted [Baer, 2002]. In light of the excellent agreement for wave profiles in lower velocity experiments (Figs. 6 and 8), it seems unlikely that the difference is due to local variations in powder density. Peak particle velocities are approximately 400 m/s, somewhat greater than half the impact velocity. After correlating times for the five measurements using the common fiducial and
7
correcting for projectile tilt of 3.2 mrad and sample tilt of 0.1 mrad, the particle velocity histories shown in Fig. 11 were obtained. Based on a least squares fit to the arrival times for all five profiles, all but the thickest level, and the three thinnest levels, the shock velocities are found to be 1.078, 1.137, and 1.092 km/s, respectively. As discussed in Section 4.4, there is reason to believe that the thickest level was affected by wave attenuation from the rear of the impactor. Thus, that level is discarded from consideration. Including the next thickest level in the fit gives a fit that is statistically not as good as if only the three thinnest levels are used, possibly due to wave attenuation or edge effects. Therefore, the value from a fit to the three thinnest levels, 1.092 km/s, is used for the shock velocity.
8
4.0 Analysis of Experimental Results Particle velocity profiles, detailed in the previous section, were used to determine the shock velocity in the tungsten carbide powder sample. The calculation of the Hugoniot state of the material using the shock velocity and impedance matching techniques with the known properties of the aluminum impactor and cover plate is described in this section. Additionally, the peak particle velocities measured are used to calculate a first reshock state for the WC powder. 4.1 Shock Hugoniot states Shock velocities for the five experiments on WC powder are shown as a function of projectile impact velocity in Fig. 12. A quadratic relationship between shock velocity and impact velocity represents the data well over the range of these experiments. The best fit is given by
!
Us = 0.35176 +1.6833Vimpact " 0.90412Vimpact2 . (1)
The shocked state in the aluminum impactor and cover plate is determined from the symmetry condition for particle velocity (up = 0.5 Vimpact) and the known Hugoniot for aluminum. When the shock wave passing through the cover plate reaches the WC powder, it releases to the Hugoniot for WC powder. The Hugoniot state for the powder is constrained to lie on this release path and along a Rayleigh line from the origin with slope given by
!
"#
"up= $oUs , (2)
where ρo is the initial density of WC powder and σ is the stress in the direction of shock propagation in the powder (positive in compression). This is illustrated graphically in Fig. 13 for all experiments. The Rayleigh lines shown are based upon the measured initial densities and shock velocities given in Table 2. For aluminum, the Hugoniot data obtained by Wallace [1980b] from unsteady wave propagation in 6061-T6 aluminum [Johnson & Barker, 1969] is used. For stresses somewhat above the Hugoniot elastic limit (HEL) but below about 10 GPa, these data can be represented extremely well using the quadratic form σ = 0.10387 + 14.203 up + 3.9024 up
2. (3) The unloading path of aluminum is constructed in the following manner. First, the Hugoniot described by Eqn. 3 is displaced downward by 4/3 Y, where Y is the yield stress of aluminum under uniaxial stress conditions. For the value of Y, the value obtained during release experiments [Asay & Chhabildas, 1981; Asay & Lipkin, 1978] on this material of 0.18 GPa is used. This value for Y represents a lower bound since the value at the HEL was found to be 0.26 GPa in those same experiments. Initial unloading is
9
assumed to be elastic at a slope given by Eqn. 2 with the wavespeed for an elastic precursor in aluminum of 6.5 km/s [Wallace, 1980a] used for Us. Elastic unloading is assumed to terminate when this line intersects the displaced curved from Eqn. 3, effectively assuming elastic-perfectly plastic unloading. This is known not to be entirely correct (see [Asay & Chhabildas, 1981]) but is sufficiently accurate for the current purposes. For all experiments in the current investigation, the intersection of the release path and the Rayleigh line for the WC powder occurs in the region of elastic unloading for aluminum. Errors associated with impedance matching are estimated to be less than 2% in σ and up and are due primarily to uncertainty in the aluminum Hugoniot in this stress regime. The shock velocities, Us, are plotted against the in-material particle velocities from impedance matching in Fig. 14. A quadratic fit given by
!
Us = 0.29239 + 2.909up " 2.4829up2 (4)
agrees very well with the data, as can be seen in the figure. Once the particle velocity is determined, the Hugoniot density can be calculated as:
!
" = "oUs
Us # up. (5)
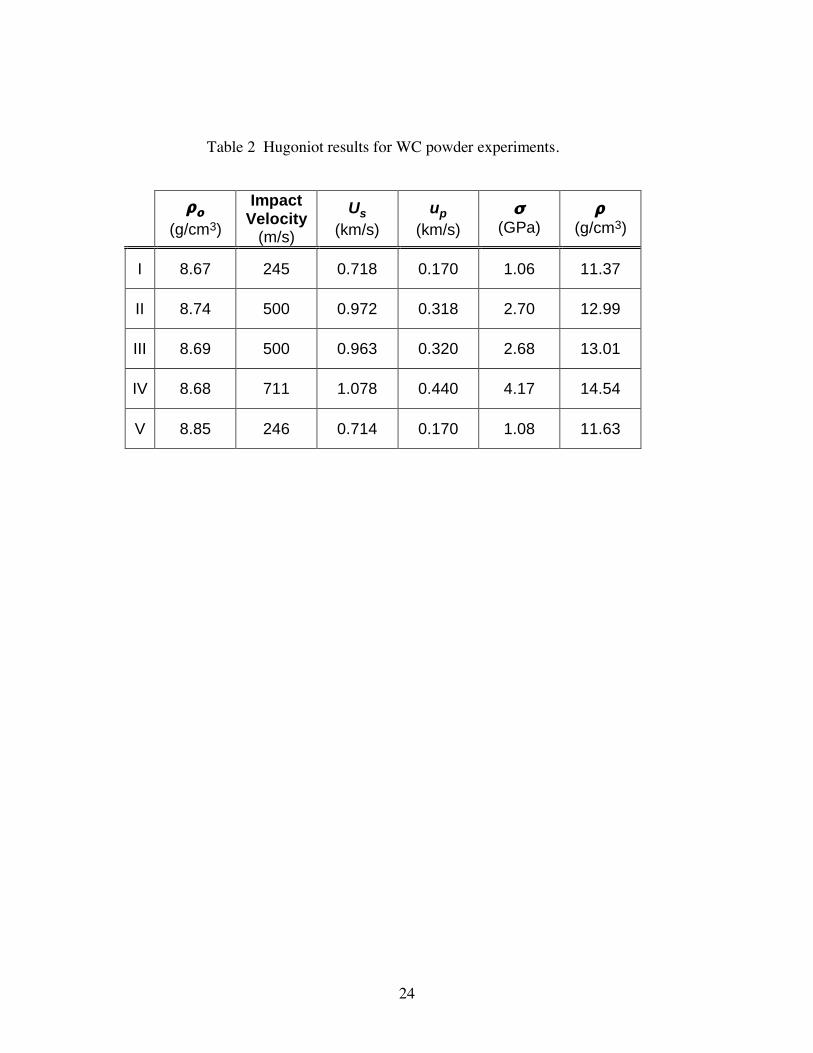
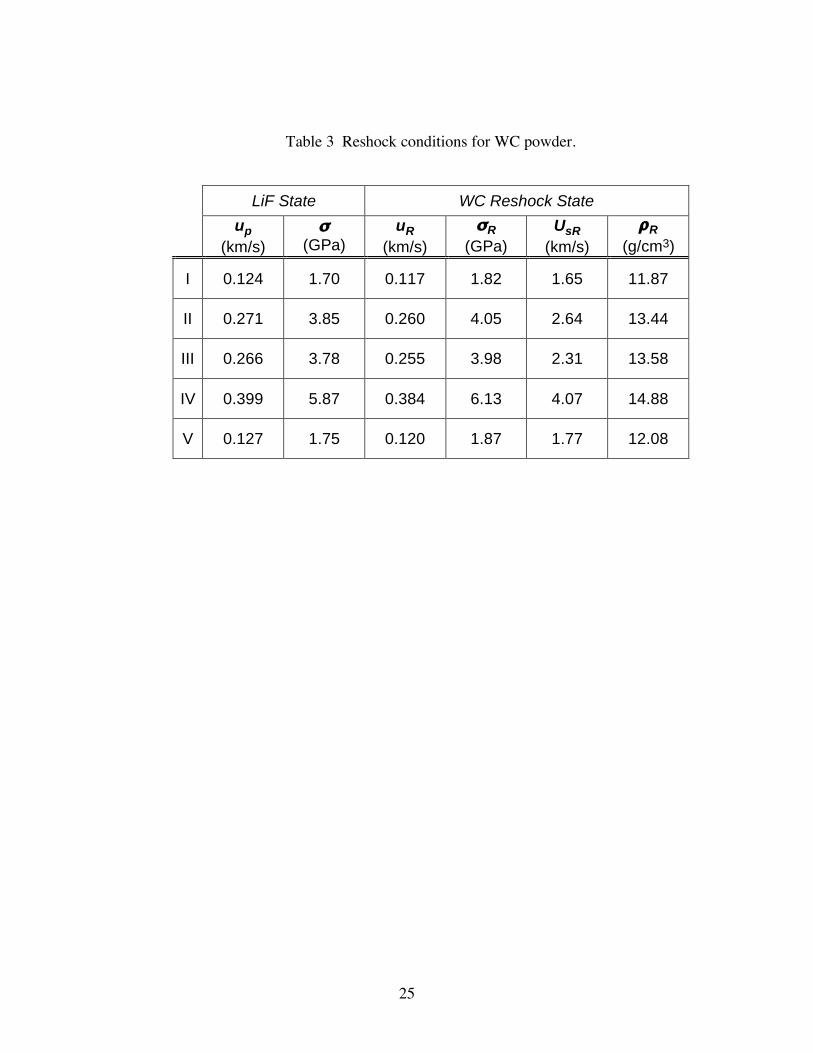
Experiment details and Hugoniot data for all experiments are given in Table 2. Hugoniot states are plotted in the σ-ρ plane in Fig. 15. Compaction is seen to increase with impact velocity until nearly full compaction is reached in experiment IV. Agreement between the pairs of experiments at 245 m/s and 500 m/s is excellent, though slightly different densities are calculated for those at 245 m/s. Also included in Fig. 15 are the measured shock data for nearly fully dense (15.5 g/cm3) WC [Dandekar & Grady, 2002]. For additional comparison, quasi-static uniaxial strain compaction data [Lee et al., 2004] obtained for the same WC powder are included. The shock experiments give stresses that are significantly higher than the static data. However, the static data reaches a stress of only 1.6 GPa, so the trend may be affected by the stress regime of interest. 4.2 WC reshock states Following impact, a shock wave traverses the cover plate and enters the WC powder sample, shocking it to its Hugoniot state. This state is calculated strictly from the measured shock velocity and the shock and release behavior of aluminum as described above. When the shock wave reaches the aluminum sample plate for each level, it shocks the aluminum and, shortly thereafter, the LiF window. Interaction with the sample plate causes the compressed WC powder to load to a new, higher stress state. This reshocked state provides further information about the dynamic behavior of WC powder. The peak particle velocities determine the state of the shocked LiF window. The averages of the peak velocities for unattenuated waves are shown along the LiF Hugoniot
10
[Carter, 1973] in Fig. 13. Impedance matching between the aluminum and LiF gives the shocked state in the aluminum sample plates. Since particle velocity and stress are continuous across the WC/aluminum interface, these are known for WC and are shown in Fig. 13. An “inferred” reshock velocity for the Lagrangian reference frame can then be calculated as
!
UsR ="R #"H
$o(uH # uR ), (6)
where the subscript “H” denotes the Hugoniot state and the subscript “R” denotes the reshock state. Similarly, the density in the reshock state can be calculated as
!
"R = "o"o"H
#uH # uRUsR
$
% &
'
( )
#1
. (7)
These reshock states are given in Table 3 for both the LiF window and the WC powder, and they are also included in Fig. 15. The reshock states for the 245 and 500 m/s experiments are somewhat stiffer than one would expect based on the Hugoniot results. 4.3 Uncertainty analysis for Hugoniot and reshock states Estimates have been made of the uncertainty associated with the Hugoniot and reshock states described above. Six sources of experimental uncertainty have been identified as affecting the Hugoniot state: 1) initial density, 2) impact velocity, 3) the Hugoniot response of aluminum, 4) the release response of aluminum from the Hugoniot state, 5) the thicknesses of various levels of the sample, and 6) relative timing of the VISAR signals. The last two of these are used in the calculation of the shock velocity. The estimated uncertainties for most of these quantities have been given previously but are reiterated here briefly. The initial density is estimated to be accurate to 2%, and the impact velocity is known from tilt pins to 0.5%. The Hugoniot stress for aluminum is known to within 2% (for example, the Hugoniot data from Wallace [Wallace, 1980b] differs by about differs by about 2% from another model for 6061-T6 based on aluminum by Feng & Gupta [Feng & Gupta, 1994]), while the release velocity of aluminum is estimated to be accurate for impedance matching purposes to 5%. Thicknesses of the sample are assumed to be known to within 5 µm, at least relative to one another. Timing uncertainties are conservatively, but somewhat arbitrarily, estimated to be on the order of 5 ns. From these uncertainties, the uncertainty in the shock velocity is estimated using the first order uncertainty expression [Coleman & Steele, 1989] for random errors
!
"Us =#Us
#xi"xi
$
% &
'
( )
2
+#Us
#ti"ti
$
% &
'
( )
2$
%
& &
'
(
) )
12
i=1
N
* , (8)

11
where xi and ti are the position and arrival time for the ith level of a sample, a delta (δ) before a quantity denotes its uncertainty, and N is 2 or 3 for the present experiments. The derivatives of Eqn. 8 were evaluated numerically for each experiment. Uncertainties in shock velocity of 0.6% are found for experiments I and V, while an uncertainty of 0.3-0.4% is seen for the other three. Experiments II-IV have a smaller uncertainty because those experiments have three sample levels instead of two. With this uncertainty in the shock velocity and the values for other variables described earlier, the overall uncertainty can be determined. Factors 3) and 4) above dealing with the behavior of aluminum are systematic errors, while the remainder are random errors. Random uncertainties affect quantities such as σh and ρh in a manner similar to Eqn. 8, while systematic errors are added directly onto the uncertainty [Mitchell & Nellis, 1981]. Uncertainties of 3-3.6% are found for σh and 2.5-2.7% for ρh. Error bars corresponding to these uncertainties are shown for the Hugoniot state in Fig. 15, though only those on density are large enough to be seen. While these are somewhat large uncertainties for Hugoniot data, they are considered to be excellent in light of the distended nature of these materials. Also, experiments at the same impact velocity are very consistent with one another, but the uncertainty of each experiment was considered separately. The uncertainty of the reshock state was based upon the uncertainty of the Hugoniot state and along with additional uncertainty associated with the peak particle velocity, ur, measured from interferometry. The uncertainty of this measurement is estimated to be on the order of 4% based on the inherent precision of the VISAR system, the non-constant particle velocities seen experimentally (see Figs. 6, 8, and 10), and the variability in particle velocity for different sample levels. The uncertainty of the EOS of aluminum and LiF is also included in this estimate. Uncertainty in the reshock stress, σr, is based entirely on this uncertainty. Uncertainty in the reshock density, ρr, depends upon this uncertainty plus those associated with the Hugoniot state as described above. As a result, uncertainties associated with ρr are somewhat larger than for ρH, 3-4%. 4.4 Wave attenuation issues The experiments on WC powder utilized a 12.7 mm thick aluminum impactor. Initially, it was thought that this impactor would be sufficiently thick to avoid attenuation of shock waves in the powder due to release from the rear of the impactor. However, because the shock velocities in the powder were slower than anticipated, subsequent analysis revealed that such release did occur. The susceptibility to attenuation at different thicknesses of the five experiments was determined as follows. All calculations described in this section were made for a Lagrangian (undeformed) frame of reference. The left- and right-going waves in the aluminum impactor and cover plates were estimated to travel at a shock velocity given by Us = 5.35 + 1.34up (9) following the data from Marsh [1980]. The effect of the elastic precursor was ignored, but this would be faster than the bulk wave for all five experiments and, presumably, lead
12
to earlier attenuation. The bulk sound speed (CB) is taken as the slope of the Hugoniot given by Eqn. 9, which gives CB = 5.35 + 2(1.34)up. (10) The leading edge of the release wave in the aluminum impactor is assumed to travel at an elastic longitudinal wave speed given by
!
CL = CB3 1"#( )1+ #
. (11)
The value of Poisson’s ratio is assumed to be constant at 0.3. The initial shock wave through the WC powder travels at the velocity shown in Table 2. The release wave speed in the precompressed WC powder is approximated by the effective reshock velocity given in Table 3. Finally, shock and release waves in the aluminum sample cover plates are based on Eqns. 9-11. Shock and release velocities are given in Table 4 along with the expected arrival times for shock waves and the leading edge of the release waves at the aluminum-LiF interface monitored with the interferometer. An x-t diagram, shown in Fig. 16, illustrates the attenuation of the initial shock for experiment 1. The shock traverses the aluminum impactor and reflects as a release much more rapidly than the initial shock traverses the powder. The release in the powder is more rapid as well, so that its leading edge overtakes the shock before the level 4 sample plate is reached. As can be seen in Table 3, one or two thicknesses in each experiment are expected to be attenuated by release from the back of the impactor. At 245 m/s, two thicknesses are estimated to be attenuated, but VISAR records indicate three are actually attenuated. Similarly, at 500 m/s, one is estimated and two are observed. For 711 m/s, the VISAR profiles do not definitively indicate attenuation. However, the arrival times for the thickest two levels are not linear with respect to the first three. Nevertheless, this analysis suggests that the wave attenuation observed is due to release from the rear of the impactor; there may also be attenuation due to the loss of one-dimensional conditions caused by edge release. The largest sources uncertainty in this analysis are likely to be the release wave speed of the compacted WC powder and neglecting elastic-plastic wave propagation in aluminum. Although it is impossible to tell if the fixture is affected by premature edge release without further experiments, there is some evidence that it is not. The particle velocities recorded for the attenuated waves (levels 4 and 5) of experiment II are slightly larger than those of the unattenuated waves (levels 1 and 2) of experiment I. Between levels 4 and 5 of experiment II, the wave travels at a velocity of 0.801 km/s, about 11% higher than the wavespeed of the unattenuated wave in experiment I. This suggests that the wave is decelerating due to attenuation from the rear of the impactor rather than due to edge attenuation.

13
5.0 Discussion The experimental results presented in Section 3 and analyzed in Section 4 provide the first Hugoniot data on distended WC powder. Close examination of these results reveals interesting insight into the dynamic compaction behavior of ceramic powders. These initial results also serve to illustrate the utility of the new experimental technique for obtaining accurate data on the shock behavior of highly distended ceramic powders. These initial results have suggested further improvements to the experimental technique and directions for future research. 5.1 Compaction behavior of tungsten carbide The dynamic compaction of ceramic powders has not been extensively studied, and the data that does exist [Marsh, 1980] is almost entirely for compactions above the ambient crystal density or the maximum compaction density. Exceptions to this are an extensive study of compaction of silicon dioxide at varying densities [Trunin et al., 2001], some results on MgO [Trofimov et al., 1968], and two studies of aluminum nitride powder [Gourdin & Weinland, 1985; Hoy et al., 1984]. In particular, the last two studies provide the only time-resolved data of the type necessary to promote an understanding of the crush-up behavior for ceramics. During the compaction process, there is likely some fracture of WC particles, but plastic flow may occur as well. Local melting and jetting are also possible. WC is generally considered a fairly ductile ceramic, so the relative importance of the various mechanisms may be different for other ceramics. Following compaction, high reshock wave speeds are observed, suggesting the material is behaving in an elastic manner. Elastic behavior during reshock has been seen for other fully dense ceramics such as B4C [Vogler et al., 2004] and Al2O3 [Reinhart & Chhabildas, 2003]. Given the very high strength of ceramics such as WC, and the presumably even higher strength of individual ceramic grains, it is quite possible that the compacted powder has sufficient stiffness to reload in an elastic manner. However, given the error bars associated with the Hugoniot and reshock states, which are just barely large enough for the reshock states to lie along the Hugoniot, this conclusion should be regarded as preliminary until supported by additional data. Shock waves in distended media have been observed to be dispersive previously from experimental results on copper [Tong & Ravichandran, 1994] and on HMX and sugar [Sheffield et al., 1997]. In HMX and sugar, the rise time was found to be dependent upon particle size with coarse material having a larger rise time. At higher stresses, though, the rise times essentially converged for the different particle size and apparently remained approximately constant over a fairly large stress regime. Rise time was not significantly affected by initial powder density, however, and the results for sugar and HMX were qualitatively similar indicating that chemical reactivity was not affecting the wave structure. From a modeling standpoint, direct numerical simulations of compaction of copper powder [Benson, 1995] dramatically demonstrated the wide shock width during the compaction process, and a comparison of models with and without both material rate dependence and inertia effects [Tong & Ravichandran, 1997] revealed a much stiffer
14
response when both effects were included. Waves which were quite dispersed were observed for four of the five dynamic experiments, despite traversal of the 1 mm thick aluminum sample plate before measurement. In traversing the sample plate, a wave transmitted from the WC powder will tend to steepen due to the non-linearity of the aluminum response but will tend to spread out due to material viscosity and dispersion [Johnson & Barker, 1969; Sheffield et al., 1997]. At stresses just above the elastic limit, material viscosity dominates, but non-linearity becomes more important as the stress increases as shown previously [Johnson & Barker, 1969]. At 2.1 GPa, viscosity was found to be more important, with 10’s of mm needed to achieve a steady wave where the two effects balance one another. By contrast, at 3.7 GPa, a steady rise was achieved in less than 6 mm. At 9 GPa, shock rise time was seen to be smaller than the resolution of the instrumentation, indicating that material non-linearity dominates at that level. For states of interest in the sample plates, the following effects are assumed: at 1.7 GPa (experiments I and V), the plastic part of the wave will become somewhat more dispersive, but the process is slow enough to be negligible over the 1 mm thickness; at 3.8 GPa (experiments II and III), the wave will tend to steepen so that the actual wave in the WC is more dispersive than that observed by interferometry; and at 5.9 GPa (experiment IV), the wave will steepen more rapidly. In fact, the shock rise time in experiment IV is smaller than the temporal response of the interferometer. However, it is possible that the wave in the WC powder has a finite rise time. To correct for the steepening anticipated to occur in experiments II and III, the backwards integration technique [Hayes, 2001; Hayes et al., 2001] was utilized to estimate the actual rise time at the WC/aluminum interface. A slightly more dispersive wave is found using this technique. The rise times of the waves from experiments without shocks are determined in the following manner. The slope of the particle velocity history above the elastic limit for aluminum is found (see Figs. 6 and 8). The average peak value of particle velocity measured, as shown in Table 3, is divided by this number to give an approximate rise time for the shock. For example, the linear slope of the histories for experiments I and V are between 0.75 and 0.85 km s-1/µs. Dividing value for particle velocity of 0.124-0.127 km/s, a rise time on the order of 150 ns is found. Similarly, a rise time on the order of 65 ns is seen for experiments II and III after backwards integration is performed. This is somewhat greater than the 50 ns observed with the interferometer, but not different enough to change the results qualitatively. Strains are calculated using
!
" =1#$o
$H
. (12)
where ε is engineering strain (positive in compression), ρo is the initial density of the powder, and ρH is its density in the Hugoniot state from Table II. Strain rates of approximately 1.6x10⁶ s-1 and 5.0x10⁶ s-1. For several fully dense solids, an empirical relationship has been found between strain rate and stress of the form
!
˙ " #$ n , where n is found to be approximately four [Swegle & Grady, 1985]. If a similar relationship is
15
assumed to hold for WC powder, a value of approximately 1.2 is found for the exponent n. Clearly, though, additional data are required before any conclusions can be drawn about shock rise times in the ceramic compaction. The material properties controlling the compaction process are not well understood. For example, WC powders with different grain morphologies and size distributions have been tested in quasi-static uniaxial compaction [Lee et al., 2004]. Grain morphology was found to affect compaction behavior only minimally, but grain size distribution had a more significant effect. The question of how these differences in microstructure affect dynamic compaction remains an open one. When compared to quasi-static results, the current results are significantly stiffer. Although comparisons between static and dynamic data are limited in the literature, experiments on HMX powders [Grady et al., 2000a] have shown a similar trend of a significantly stiffer dynamic response as does a comparison of shock [Trunin et al., 2001] and quasi-static compaction [Lee et al., 2004] data for SiO2. Conversely, data for aluminum nitride [Gourdin & Weinland, 1985] show approximately the same response for static and dynamic loading, though the uncertainty in their results makes that conclusion somewhat suspect. It seems likely that the stiffening under dynamic loading is related to the localized deformation that occurs in the shock front. For example, a shock rise time of 100 ns and a shock velocity of 1 km/s, which are close to the values for experiments II and III, imply a shock front about 100 µm thick. Such a shock front would be only about three-five grains thick, and higher stresses would result in an even narrower front. Dynamic deformation within a narrow front is necessarily different from that which can occur under static loading. Within the narrow shock front, grains probably deform locally at contact points, perhaps to the melting point (2870° C), and fracture. In contrast, under static loading, grains can move and rotate in cooperation with other grains over a long distance. If further investigation confirms that the trend of a stiffer dynamic response is generally applicable, it will need to be accounted for in order to accurately predict the dynamic response from quasi-static data. 5.2 Experimental technique Previous experimental data for the dynamic compaction of powders and porous materials tend to have more scatter than fully dense material due to factors such as sample-to-sample variations in initial density, nonuniform distribution of porosity within the sample, and the inherent sensitivity of the governing equations to small variations in the measured quantities [Simakov & Trunin, 1990]. The experimental technique described in this report was designed to reduce this variability in the experimental results. This effort was largely successful as can be seen in modest uncertainties in Fig. 15 and the good agreement in Hugoniot states between experiments I and V and between II and III. The analysis involved in extracting Hugoniot data from the velocity history results depends upon only three things: the initial density, the shock velocity, and the shock and release behavior of aluminum. As a result, the experimental uncertainties have been estimated, and their effect upon the calculated Hugoniot and reshock states have been rigorously determined. However, relatively minor changes to the experimental technique
16
and a modest amount of additional data could further improve these experimental uncertainties. For example, the density measurements could be made more accurate by the use of a thicker cover plate (to reduce bulging) and by measuring the level thicknesses with the fixture in the vertical position. The sample cavity volume could also be determined more accurately by filling with a fluid prior to filling with ceramic powder. The shock velocity measurement can be improved by ensuring that all levels of the sample measure unattenuated waves. In some cases, this can be done simply by using a thicker impactor, but in others a redesign of the fixture may be necessary. As it stands, the unattenuated VISAR profiles for different thicknesses of the same sample generally agree very well, indicating a steady wave traveling through a relatively uniform medium. Finally, the accuracy of the WC powder Hugoniot results depends upon the shock and release behavior of aluminum. These are known to an accuracy of about 2%, providing a limit on the accuracy of the WC results. The current experiments provide insight into difficulties that might be encountered when investigating porous materials. First, care must be taken to assure that the shock velocity is measured for a steady wave. In this investigation, steadiness is verified by multiple interferometry measurements, but configurations that include only a single gage or optical measurement for the propagating wave will not be able to confirm steadiness [Gourdin & Weinland, 1985; Sheffield et al., 1997]. Secondly, the wave must be unattenuated by release from the edge of the fixture or the rear of the impactor, and there should be some means to verify that the wave is unattenuated. Again, multiple gages will be required. The problems of attenuation and edge release are exacerbated by the very low sound speeds of the powder compared to metals that might be used to make a fixture. The use of PMMA in the current fixture partially ameliorates this problem. Finally, if the objective is to study wave attenuation, it is necessary to ensure the fixture produces steady waves for a very thick impactor before using a thinner impactor to obtain attenuation. 5.3 Experimental improvements and future directions The results reported herein demonstrate that the basic design of the experimental setup is a good one. By a few relatively minor modifications to the experimental technique, though, it may be possible to improve experimental accuracy and to gain a more complete picture of the compaction of WC powder. The addition of a stress gauge against the cover plate could provide the Hugoniot state directly, assuming the stress gauge operated with sufficiently high accuracy. It would provide a redundancy on the state calculated using the impedance matching method described in Section 4. A second gauge on the other side of the sample might provide a more accurate measurement of rise time for the dispersive waves seen in the powder, provided the gauge response was sufficiently fast and the reading was reliable despite contact with the powder. Finally, the addition of sample plates of lower (e.g. magnesium or plastic) and higher (e.g. steel or tantalum) impedance would allow probing of the compacted powder release and reshock behavior, an important part of a computational treatment of porous materials. For the WC powder studied, additional experiments at higher velocities would be valuable in determining at what stress level full compaction is reached, the crush strength

17
of the powder [Thadhani & Aizawa, 1997], and at what point thermal effects cause a significant deviation from the fully dense Hugoniot [Trunin, 2004]. It is possible that the crush strength of a ceramic powder is somehow related to the HEL of the fully dense ceramic, but there appears to be no detailed study of this issue. Perhaps even more interesting would be a systematic investigation of cross-material differences (e.g. WC versus Ta2O5 versus HfO2). Also of value would be an investigation of same-material variations such as sifted versus unsifted material or material from a crystal growth process versus a diffusion process. Such studies could help answer important questions about the role of powder morphology and the variation in compaction behavior for different ceramic powders. In order to gain a better understanding of the deformation processes occurring during compaction, the shocked powder should be recovered during these studies. When complemented with static compaction studies, they would provide an understanding of the relationship between static and dynamic response. Because of the many parameters that can affect dynamic compaction behavior and the expense of shock experiments, a computational modeling effort similar to that performed for copper [Benson, 1995]. In such an investigation, the relative importance of aspects such as particle size distribution, particle shape, fracture strength, flow stress, etc. could be determined relatively easily. While an Eulerian finite element code was suitable for the relatively soft grains of copper, though, another approach such as an ALE (arbitrary Lagrangian-Eulerian) formulation or the discrete element method (DEM) [Jensen et al., 2001] may be needed in order to account for granular sliding, strength, and fracture.
18
6.0 Conclusions and Recommendations In this report, results from recent planar impact experiments on a 56% dense WC powder are presented. These results are used to obtain the Hugoniot response of distended WC powder as well as a reshock state. Highlights of the experimental results are discussed in the next subsection, followed by recommendations to further enhance the test methodology and our understanding of the dynamic compaction of ceramic powders. 6.1 Principal conclusions
• A new experimental technique has been developed for the dynamic compaction of powders. Its design is an attempt to address difficulties inherent in the testing powders.
• The technique has been used to obtain the first Hugoniot results for WC powder. In addition, reshock states of the powder were determined. Stresses were sufficient to obtain compaction to nearly full density. These results are shown to be reasonably accurate, and excellent consistency was obtained for multiple experiments at the same impact velocity.
• The shock velocity for the powder is found to be very slow, and waves that are quite dispersive are observed. The dynamic response is found to be significantly stiffer than the static response.
• The reshock states are stiffer than expected so that the reshock state lies above the Hugoniot for the powder. This suggests that the precompacted powder displays elastic behavior upon reloading.
• This data can be used to calibrate or evaluate models for compaction such as the P-α [Herrmann, 1969] or P-λ [Grady & Winfree, 2001; Grady et al., 2000b] models.
6.2 Recommendations The following recommendations are offered to improve the understanding of dynamic compaction of ceramic powders. They include improvements to the experimental setup as well as recommendations for future work. • The cover plate for the fixture should be made thicker; doubling its thickness to 2 mm
will reduce bowing by a factor of four without detriment to the experimental results. • An accurate measurement of the fixture volume should be made prior to each
experiment by filling it with a fluid. • Tests should be conducted using very thick impactors to avoid attenuation from the
back of the impactor. If some levels are found to be affected by edge release, the fixture should be redesigned so that all levels provide valid measurements.
• Once the design has been verified to be free of premature edge release, the propagation of an attenuating wave in the powder should be investigated since it is an important aspect in modeling the compaction behavior of distended materials.
• The use of low and high impedance sample plates would probe the reshock and release
19
behavior from the initial Hugoniot state. Potentially, a wide range of reshock and release states could be accessed in a single experiment.
• A pressure gauge inside the cover plate could be used to provide independent verification of the pressures determined by impedance matching and, potentially, more accurate results.
• Soft-catch techniques should be utilized to recover WC powder for microscopic analysis and identification of deformation mechanisms.
• Experiments should be performed on ceramic powders using the powder gun to achieve higher stresses and to reach beyond the state of full or maximum compaction.
• One or more additional ceramic powders should be investigated to determine if trends observed for WC are generally true, especially the relationship between dynamic and static compaction responses. The study of different variations of WC would provide information on the importance of grain morphology, grain size distribution, etc. to the dynamic response.
• A meso-scale modeling effort that accurately resolved the grain level and the relevant deformation mechanisms for the grains would provide valuable insight into the compaction process.

20
7.0 References
Asay, J. R., and Chhabildas, L. C. (1981). "Determination of the shear strength of shock compressed 6061-T6 aluminum," in Shock Waves and High-Strain-Rate Phenomena in Metals, M. A. Meyers and L. E. Murr, Eds., N.Y., Plenum, 417-431.
Asay, J. R., and Lipkin, J. (1978). "A self-consistent technique for estimating the dynamic yield strength of a shock-loaded material," J. Appl. Phys. 49, 4242-4247.
Baer, M. R. (2002). "Modeling heterogeneous energetic materials at the mesoscale," Thermochim. Acta 284, 351-367.
Barker, L. M., and Hollenbach, R. E. (1972). "Laser interferometry for measuring high velocities for any reflecting surface," J. Appl. Phys. 43, 4669-4675.
Benson, D. J. (1995). "The calculation of the shock velocity - particle velocity relationship for a copper powder by direct numerical simulation," Wave Motion 21, 85-99.
Carter, W. J. (1973). "Hugoniot equation of state of some alkali halides," High Temp.-High Press. 5, 313-318.
Carter, W. J., and Marsh, S. P. (1995). "Hugoniot equation of state of polymers," Los Alamos National Laboratory report LA-13006-MS.
Coleman, H. W., and Steele, W. G. (1989). Experimentation and Uncertainty Analysis for Engineers, N.Y., Wiley.
Dandekar, D. P., and Grady, D. E. (2002). "Shock equation of state and dynamic strength of tungsten carbide," in Shock Compression of Condensed Matter - 2001, M. D. Furnish, N. N. Thadhani, and Y. Horie, Eds., 783-786.
Feng, R., and Gupta, Y. M. (1994). "Material model for 6061-T6 aluminum for use in shock wave experiments and calculations," Washington State University Shock Dynamics Center report 94-01.
Gourdin, W. H., and Weinland, S. L. (1985). "Dynamics compaction of aluminum nitride powder: Hugoniot measurement and comparison with static behavior," J. Am. Ceram. Soc. 68, 674-679.
Grady, D. E., Chhabildas, L. C., Reinhart, W. D., and Wilson, L. T. (2000a). "Dynamic equation of state and strength properties of unreacted PBXW-128 explosive," in 11th International Detonation Symposium, 1049-1057.
Grady, D. E., and Winfree, N. A. (2001). "A computational model for polyurethane

21
foam," in Fundamental Issues and Applications of Shock-Wave and High-Strain-Rate Phenomena, K. P. Staudhammer, L. E. Murr, and M. A. Meyers, Eds., 485-491.
Grady, D. E., Winfree, N. A., Kerley, G. I., Wilson, L. T., and Kuhns, L. D. (2000b). "Computational modeling and wave propagation in media with inelastic deforming microstructure," J. Phys. IV 10, 15-20.
Hayes, D. B. (2001). "Backward integration of the equations of motion to correct for free surface perturbations," Sandia National Laboratories report SAND 2001-1440.
Hayes, D. B., Vorthman, J. E., and Fritz, J. N. (2001). "Backward integration of a VISAR record: free-surface to the spall plane," Los Alamos National Laboratory report LA-13830-MS.
Herrmann, W. (1969). "Constitutive equations for the dynamic compaction of ductile porous materials," J. Appl. Phys. 40, 2490-2499.
Hoy, D. E. P., Akaishi, M., Park, J. K., Horie, Y., and Whitfield, J. K. (1984). "Shock compression of aluminum nitride powder," in Shock Waves in Condensed Matter - 1983, J. R. Asay, R. A. Graham, and G. K. Straub, Eds., 451-454.
Jensen, R. P., Edil, T. B., Bosscher, P. J., Plesha, M. E., and Kahla, N. B. (2001). "Effect of particle shape on interface behavior of DEM-simulated granular materials," Int. J. Geomech. 1, 1-19.
Johnson, J. N., and Barker, L. M. (1969). "Dislocation dynamics and steady plastic wave profiles in 6061-T6 aluminum," J. Appl. Phys. 40, 4321-4334.
Lassner, E., and Schubert, W.-D. (1999). Tungsten: Properties, Chemistry, Technology of the Element, Alloys, and Chemical Compounds, N.Y., Kluwer Academic / Plenum Publishers.
Lee, M. Y., Pfeifle, T. W., and Hardy, R. D. (2004). "Hydrostatic and uniaxial strain compaction of eight metal oxides and tungsten carbide," Sandia National Laboratories report SAND2004-5854.
Marsh, S. P. (1980). LASL Shock Hugoniot Data, Berkley, University of California Press.
Mitchell, A. C., and Nellis, W. J. (1981). "Shock compression of aluminum, copper, and tantalum," J. Appl. Phys. 52, 3363-3374.
Reinhart, W. D., and Chhabildas, L. C. (2003). "Strength properties of Coors AD995 alumina in the shocked state," Int. J. Impact Engng. 29, 601-619.
Sheffield, S. A., Gustavsen, R. L., and Anderson, M. U. (1997). "Shock Loading of Porous High Explosives," in High-Pressure Shock Compression of Solids IV: Response of Highly Porous Solids to Shock Loading, L. Davison, Y. Horie, and M. Shahinpoor, Eds., N.Y., Springer-Verlag, 23-61.
22
Simakov, G. V., and Trunin, R. F. (1990). "Shockwave compression of ultraporous silica," Izv. Acad. Sci. USSR, Phys. Solid Earth 26, 952-956.
Swegle, J. W., and Grady, D. E. (1985). "Shock viscosity and the prediction of shock wave rise times," J. Appl. Phys. 58, 692-701.
Thadhani, N. N., and Aizawa, T. (1997). "Materials Issues in Shock-Compression-Induced Chemical Reactions in Porous Solids," in High-Pressure Shock Compression of Solids IV: Response of Highly Porous Solids to Shock Loading, L. Davison, Y. Horie, and M. Shahinpoor, Eds., N.Y., Springer-Verlag, 257-287.
Tong, W., and Ravichandran, G. (1994). "Rise time in shock consolidation of materials," Appl. Phys. Lett. 65, 2783-2785.
Tong, W., and Ravichandran, G. (1997). "Recent Developments in Modeling Shock Compression of Porous Materials," in High-Pressure Shock Compression of Solids IV: Response of Highly Porous Solids to Shock Loading, L. Davison, Y. Horie, and M. Shahinpoor, Eds., N.Y., Springer-Verlag, 177-203.
Trofimov, V. S., Adadurov, G. A., Pershin, S. V., and Dremin, A. N. (1968). "Anomalous shock compressibility of porous materials," Combust. Explos. Shock Waves 4, 142-147.
Trunin, R. F. (2004). "Studies performed in Russia into the compressibility of metals in strong shock waves," High Temp. 42, 154-168.
Trunin, R. F., Gudarenko, L. F., Zhemokletov, M. V., and Smiakov, G. V. (2001). Experimental Data on Shock Compression and Adiabatic Expansion of Condensed Matter, Sarov, Russia, Russian Federal Nuclear Center - VNIIEF.
Vogler, T. J., Reinhart, W. D., and Chhabildas, L. C. (2004). "Dynamic behavior of boron carbide," J. Appl. Phys. 95, 4173-4183.
Wallace, D. C. (1980a). "Flow process of weak shocks in solids," Phys. Rev. B 22, 1487-1494.
Wallace, D. C. (1980b). "Equation of state from weak shocks in solids," Phys. Rev. B 22, 1495-1502.
Wise, J. L., and Chhabildas, L. C. (1986). "Laser interferometer measurements of refractive index in shock-compressed materials," in Shock Waves in Condensed Matter - 1985, Y. M. Gupta, Ed., 441-454.
23
Tables
Table 1 Elemental composition of WC powder.
element % mass element % mass
Al 0.01 Mo 0.03
Ca 0.01 Nb 0.04
C (total) 6.13 Ta 0.02
C (free) 0.011 Ti 0.03
Fe 0.18 Zr 0.003
Mn 0.03 W balance
24
Table 2 Hugoniot results for WC powder experiments.
ρο
(g/cm3)
Impact Velocity
(m/s)
Us (km/s)
up (km/s)
σ (GPa)
ρ (g/cm3)
I 8.67 245 0.718 0.170 1.06 11.37
II 8.74 500 0.972 0.318 2.70 12.99
III 8.69 500 0.963 0.320 2.68 13.01
IV 8.68 711 1.078 0.440 4.17 14.54
V 8.85 246 0.714 0.170 1.08 11.63
25
Table 3 Reshock conditions for WC powder.
LiF State WC Reshock State
up
(km/s) σ
(GPa) uR
(km/s) σR
(GPa) UsR
(km/s) ρR
(g/cm3)
I 0.124 1.70 0.117 1.82 1.65 11.87
II 0.271 3.85 0.260 4.05 2.64 13.44
III 0.266 3.78 0.255 3.98 2.31 13.58
IV 0.399 5.87 0.384 6.13 4.07 14.88
V 0.127 1.75 0.120 1.87 1.77 12.08

26
Table 4 Estimated arrival times for shock and release in the different levels of each
WC powder experiment. Values in red indicate that release wave is expected to arrive before shock.
Al
cover plate
Al sample plates
WC Estimated arrival times for shock at various thicknesses
Us
(km/s) Us
(km/s) Us
(km/s) #1
(µs) #2
(µs) #3
(µs) #4
(µs) #5
(µs)
I 5.51 5.51 0.718 1.76 3.85 5.93 8.02 10.11
II 5.69 5.70 0.972 1.38 2.92 4.47 6.01 7.55
III 5.69 5.70 0.963 1.39 2.95 4.51 6.06 7.62
IV 5.83 5.87 1.078 1.27 2.66 4.05 5.44 6.84
V 5.52 5.51 0.709 1.77 3.89 6.00 8.12 10.236
Al
cover plate
Al sample plates
WC Estimated arrival times for release at various thicknesses
!
CLR
(km/s)
!
CLR
(km/s) UsR
(km/s) #1
(µs) #2
(µs) #3
(µs) #4
(µs) #5
(µs)
I 7.22 7.21 1.65 4.95 5.85 6.76 7.67 8.58
II 7.65 7.69 2.64 4.53 5.10 5.67 6.24 6.81
III 7.65 7.68 2.31 4.59 5.24 5.89 6.54 7.18
IV 8.01 8.12 4.07 4.26 4.63 5.00 5.37 5.73
V 7.22 7.22 1.77 4.90 5.75 6.59 7.44 8.29

27
Fig. 1 SEM micrograph of unsifted Kennametal tungsten carbide powder used in the current investigation.

28
Fig. 2 Schematic of test setup showing (L to R) aluminum cover plate, PMMA fixture, and aluminum target plate. Aluminum sample plates are not shown. Fixture is filled with powder, cover plate is glued onto fixture, and fixture is then glued into target plate. Assembly is impacted from the left.
29
Fig. 3 Photograph of fixture prior to filling illustrating the five different step thicknesses. Each step contains an aluminum sample plate backed by a LiF window (not visible). Vent and fill hole are at the right of fixture; numbers correspond to increasing thickness of layers. Small holes passing through the block are for fiber optic probes for velocity interferometry.
30
cover plate
sample plate
LiF window
powder sample
PMMA fixture
hole for fiberoptic probe
Fig. 4 Cross-section of the filled test fixture illustrating the five different step thicknesses along with three of the aluminum sample plates (the other two are not visible in this cross-section). The fixture is impacted from the left.
31
Fig. 5 Rear view of filled fixture prior to experiment. Fiber optic cables into fixture are for velocity interferometry; pins on the left are for measurement of impactor velocity; and four pins around the circumference are for tilt measurement.
32
0
0.1
0.2
0 0.5 1.0
t-arbitrary (µs)
up
(km/s)
#1
#2
#3
#4
#5
Fig. 6 Particle velocity histories for experiment I at 245 m/s shifted in time to overlay.
33
0
0.1
0.2
0 4 8 12
t (µs)
up
(km/s)
Fig. 7 Time correlated particle velocity histories for five sample thicknesses of experiment I. Time t=0 corresponds to estimated impact of projectile onto sample cover plate.
34
up
(km/s)
0
0.1
0.2
0.3
0 0.5 1.0
#1
#2#3
#4
#5
t-arbitrary (µs)
Fig. 8 Particle velocity histories for experiment II at 500 m/s shifted in time to overlay.
35
0
0.1
0.2
0.3
0 4 8
t (µs)
up
(km/s)
Fig. 9 Time correlated particle velocity histories for five sample thicknesses of experiment II. Time t=0 corresponds to estimated impact of projectile onto sample cover plate.
36
0
0.1
0.2
0.3
0.4
0.5
0 0.5 1.0
up
(km/s)
#1
#2
#3
#4
#5
t-arbitrary (µs)
Fig. 10 Particle velocity histories for experiment IV at 711 m/s shifted in time to overlay.
37
up
(km/s)
0
0.1
0.2
0.3
0.4
0.5
0 2 4 6 8
t (µs)
Fig. 11 Time correlated particle velocity histories for five sample thicknesses of experiment IV. Time t=0 corresponds to estimated impact of projectile onto sample cover plate.

38
0
0.4
0.8
1.2
0 0.2 0.4 0.6 0.8
Vimpact
(km/s)
Us
(km/s)
WC Hugoniot States
quadratic fit to data
Fig. 12 Measured shock velocity in WC powder as a function of projectile velocity.

39
0
2
4
6
8
0 0.2 0.4 0.6 0.8
up (km/s)
!(GPa)
6061-T6 AluminumHugoniot
Rayleigh Lines for WC Powder
Aluminum release paths
LiF Hugoniot
LiF States
WC Hugoniot States
WC Reshock States
Fig. 13 σ-up diagram illustrating impedance matching of aluminum cover plate and powder sample to determine Hugoniot state of the powder sample. The intersection of the Rayleigh line with the corresponding aluminum release path determines the Hugoniot particle velocity and stress state of the powder. Also shown are states of the LiF window as measured with velocity interferometry and the reshock states of the WC powder determined from these measurements.
40
WC Hugoniot States
0
0.4
0.8
1.2
0 0.2 0.4
up (km/s)
Us
(km/s) quadratic fit to data
Fig. 14 Measured shock velocity for WC powder versus in-material particle velocity determined through impedance matching techniques.
41
0
5
10
8 10 12 14 16
! (g/cm3)
"(GPa)
fully
de
nse
WC
Static Compaction
quadratic fit to Hugoniot data
WC Hugoniot States
WC Reshock States
Fig. 15 Hugoniot response of tungsten carbide powder along with Hugoniot of fully dense WC and response of WC powder to static compaction. Also shown are the reshock states attained by the WC powder.
42
0
2
4
6
8
10
12
-15 -10 -5 0 5 10 15
x (mm)
t(µs) aluminum impactor
aluminumcoverplate
#1
powdersample
#2
#3
#4
#5
aluminumsample plates
releaseovertakesshock
Fig. 16 Time-position diagram for experiment I illustrating overtake of shock wave by leading edge of release from back of impactor for the two thickest levels of sample.
43
Distribution
External: 3 AFRL/MNMW
Attn: Tom Brantly Mark Green 2Lt. Matt Heinsler 101 W. Eglin Blvd, Suite 135 Eglin AFB, FL 32542-6810
5 Applied Research Associates, Inc
Attn: D. E. Grady 4300 San Mateo Blvd. NE, Suite A-220 Albuquerque, NM 87110
1 Applied Research Associates, Inc.
Attn: A. O. Frank 6320 Southwest Blvd., Suite 103 Fort Worth, TX 76109
1 AWE
Attn: J. R. Maw Bldg E3 Aldermaston Berks, RG7 4PR UK
1 California Institute of Technology
Graduate Aeronautical Laboratories Associate Professor of Aeronautics Attn: G. Ravichandran MS 105-50 Pasadena, CA 91125
1 CORVID Technologies
Attn: J. R. Cogar 149 Plantation Ridge Drive Suite 170 Mooresville, NC 28117
1 DSTL Porton Down
Attn: N.P. Robinson Bld 4 Salisbury SP4 0JQ
44
1 Lawrence Livermore National Lab
Attn: V. Georgevich P.O. Box 808 Livermore, CA 94551-0808
4 Los Alamos National Laboratory
Attn: W. Anderson R. L. Gustavsen, MS P952 R. S. Hixson, MS P952 S. Sheffield, MS P952 P.O. Box 1663 Los Alamos, NM 87545
1 University of Wisconsin - Madison
Dept. of Engineering Physics Attn: M. E. Plesha room 525 Engineering Research Bldg. 1500 Engineering Drive Madison, WI 53706-1687
1 U.S. Army Research Office
Attn: A. M. Rajendran P. O. Box 12211 Research Triangle Park, NC 27709
1 Washington State University
Institute for Shock Physics Attn: J.R. Asay Box 642816 Pullman, WA 99164-2816
1 Waterways Experiment Station
Attn: S. A. Akers CEERD-GM-I, Impact & Explosion Effects Branch Geotechnical & Structures Laboratory U.S. Army Engineer Research and Development Center 3909 Halls Ferry Rd. Vicksburg, MS 39180-6199
45
Internal:
1 MS 0521 S.T. Montgomery, 02561
1 MS 0751 R.M. Brannon, 6117 1 L.S. Costin, 6117 1 A.F. Fossum, 6117 1 M.Y. Lee, 6117 1 R.D. Hardy, 6117 1 T.W. Pfeifle, 6117
1 MS 0791 F.T. Harper, 0417
1 MS 0820 M.E. Kipp, 9232 1 P.A. Taylor, 9232
1 MS 0836 E.S. Hertel, 9116
1 MS 1033 J.L. Wise, 1646
1 MS 1168 C.A. Hall, 1646 1 C. Deeney, 1646 1 M.D. Furnish, 1647
1 MS 1181 J.P. Davis, 1646 1 D.H. Dolan, 1646 1 M.D. Knudson, 1646 1 A.R. Pirela, 1646 1 L.C. Chhabildas, 1647 1 J.W. Gluth, 1647 1 W.D. Reinhart, 1647 1 T.F. Thornhill, 1647 30 T.J. Vogler, 1647
1 MS 1186 R.J. Lawrence, 1674
1 MS 1190 K. M. Matzen, 1600
1 MS 1219 J.M. Taylor, 5915
1 MS 9018 Central Technical Files, 8945-1
1 MS 0899 Technical Library, 9616


![Tungsten and Selected Tungsten Compounds · Tungsten and Selected Tungsten Compounds Tungsten [7440-33-7] Sodium Tungstate [13472-45-2] Tungsten Trioxide [1314-35-8] Review of Toxicological](https://img.pdfslide.us/doc/110x75/5b4beb687f8b9afe4d8b49dd/tungsten-and-selected-tungsten-compounds-tungsten-and-selected-tungsten-compounds.jpg)