Embed Size (px)
Citation preview
NASA Technical Memorandum 87684
Dynamic Characteristics of Power-Tower Space Stations With IS-Foot Truss Bays
John T. Dorsey
JULY 1986
NASA-TM-87684 198()()() 1 ()885
-0- , .'
~- '_ ~ I' r- r-' ~ , ,,-" ~_ '~= f ~
NI\S/\ 1111111111111 1111 1111111111111111111111111111
NF01761
https://ntrs.nasa.gov/search.jsp?R=19860016885 2018-05-26T04:10:39+00:00Z
NASA Technical Memorandum 87684
Dynamic Characteristics of Power-Tower Space Stations
With IS-Foot Truss Bays
John T. Dorsey
Langley Research Center Hampton, Virginia
NI\S/\ National Aeronautics and Space Administration
Scientific and Technical Information Branch
1986
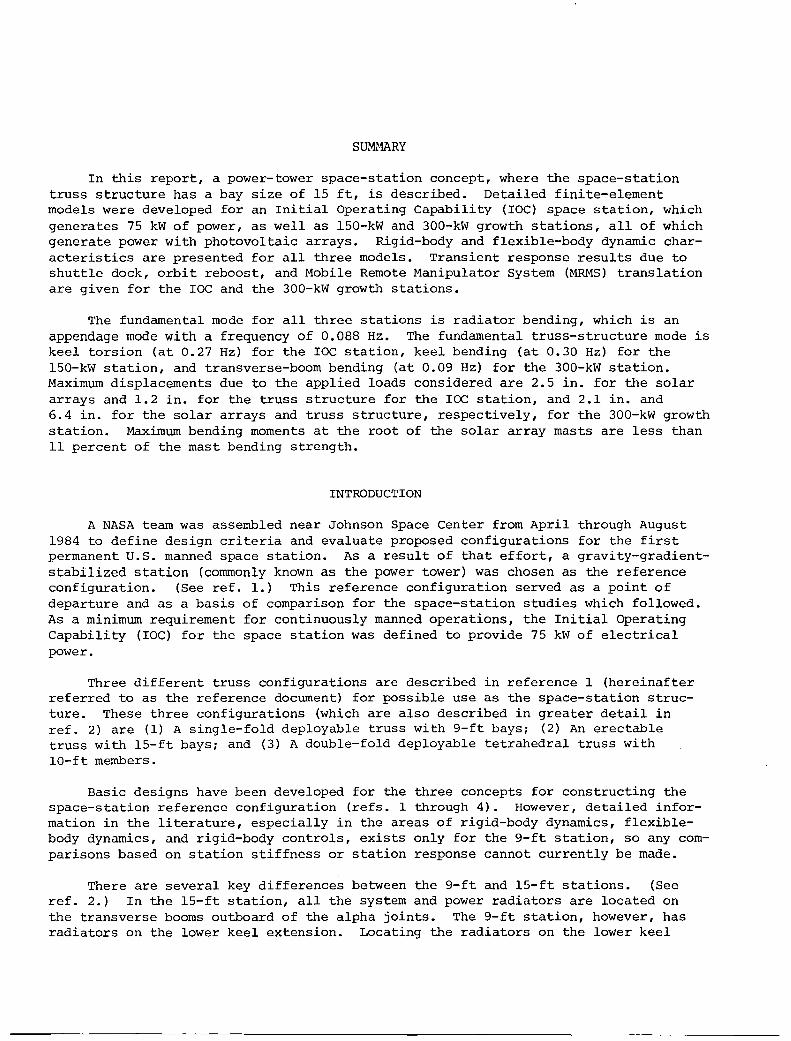
SUMMARY
In this report, a power-tower space-station concept, where the space-station truss structure has a bay size of 15 ft, is described. Detailed finite-element models were developed for an Initial Operating Capability (IOC) space station, which generates 75 kW of power, as well as lSO-kW and 300-kW growth stations, all of which generate power with photovoltaic arrays. Rigid-body and flexible-body dynamic characteristics are presented for all three models. Transient response results due to shuttle dock, orbit reboost, and Mobile Remote Manipulator System (MRMS) translation are given for the IOC and the 300-kW growth stations.
The fundamental mode for all three stations is radiator bending, which is an appendage mode with a frequency of 0.088 Hz. The fundamental truss-structure mode is keel torsion (at 0.27 Hz) for the IOC station, keel bending (at 0.30 Hz) for the lSO-kW station, and transverse-boom bending (at 0.09 Hz) for the 300-kW station. Maximum displacements due to the applied loads considered are 2.5 in. for the solar arrays and 1.2 in. for the truss structure for the IOC station, and 2.1 in. and 6.4 in. for the solar arrays and truss structure, respectively, for the 300-kW growth station. Maximum bending moments at the root of the solar array masts are less than 11 percent of the mast bending strength.
INTRODUCTION
A NASA team was assembled near Johnson Space Center from April through August 1984 to define design criteria and evaluate proposed configurations for the first permanent u.S. manned space station. As a result of that effort, a gravity-gradientstabilized station (commonly known as the power tower) was chosen as the reference configuration. (See ref. 1.) This reference configuration served as a point of departure and as a basis of comparison for the space-station studies which followed. As a minimum requirement for continuously manned operations, the Initial Operating Capability (IOC) for the space station was defined to provide 75 kW of electrical power.
Three different truss configurations are described in reference 1 (hereinafter referred to as the reference document) for possible use as the space-station structure. These three configurations (which are also described in greater detail in ref. 2) are (1) A single-fold deployable truss with 9-ft bays; (2) An erectable truss with lS-ft bays; and (3) A double-fold deployable tetrahedral truss with 10-ft members.
Basic designs have been developed for the three concepts for constructing the space-station reference configuration (refs. 1 through 4). However, detailed information in the literature, especially in the areas of rigid-body dynamics, flexiblebody dynamics, and rigid-body controls, exists only for the 9-ft station, so any comparisons based on station stiffness or station response cannot currently be made.
There are several key differences between the 9-ft and lS-ft stations. (See ref. 2.) In the lS-ft station, all the system and power radiators are located on the transverse booms outboard of the alpha joints. The 9-ft station, however, has radiators on the lower keel extension. Locating the radiators on the lower keel
could interfere with growth of the station, especially if a platform were constructed at the base of the keel. A second conceptual difference between the 9-ft and IS-ft stations is that there are two bays of transition structure associated with the alpha joints in the IS-ft station, whereas with the 9-ft station, the alpha joint is positioned in the middle of a truss bay.
This report presents the results of an analysis of the IS-ft space-station concept. Included are descriptions of the finite-element models, the resulting rigidbody and elastic dynamic characteristics, and the results of some structural dynamic studies. Models were created for a 7S-kW IOC and ISO-kW and 300-kW growth versions of the space station, all of which use photovoltaic solar arrays to generate power. Rigid-body and flexible-body dynamic characteristics are presented for all three models, and dynamic response data are given for the IOC and the 300-kW growth versions of the station.
FINITE-ELEMENT MODEL DESCRIPTIONS
Complete-Truss Versus Equivalent-Beam Models
Several factors contributed to the decision to model the IS-ft station truss structure in more fidelity than is provided by an equivalent-beam approach. First, by modeling the full truss, the equivalent-beam coefficients (coefficients which must be recalculated every time a different type of truss is used) no longer have to be calculated. Second, modeling the full truss also provides some benefits as to the types of structural responses which can be studied. In particular, the loads in individual truss members during a response can be studied, and the information can be used to construct allowable loading charts (ref. S) for many different spacestation loading conditions. The strength and stiffness degradation in the spacestation truss due to failure of selected individual struts can be studied, as was done in reference 6 for a model of the space-station transverse boom. Third, for the case of the orthogonal tetrahedral truss, modeling the full truss insures that the truss bending-torsion and axial-shear coupling will be included, something which is not easily done using equivalent beams. Fourth, detailed modeling of support structures for systems such as solar arrays, modules, alpha joints, and radiators insures that the support-structure flexibility is included in the model.
IOC Space Station
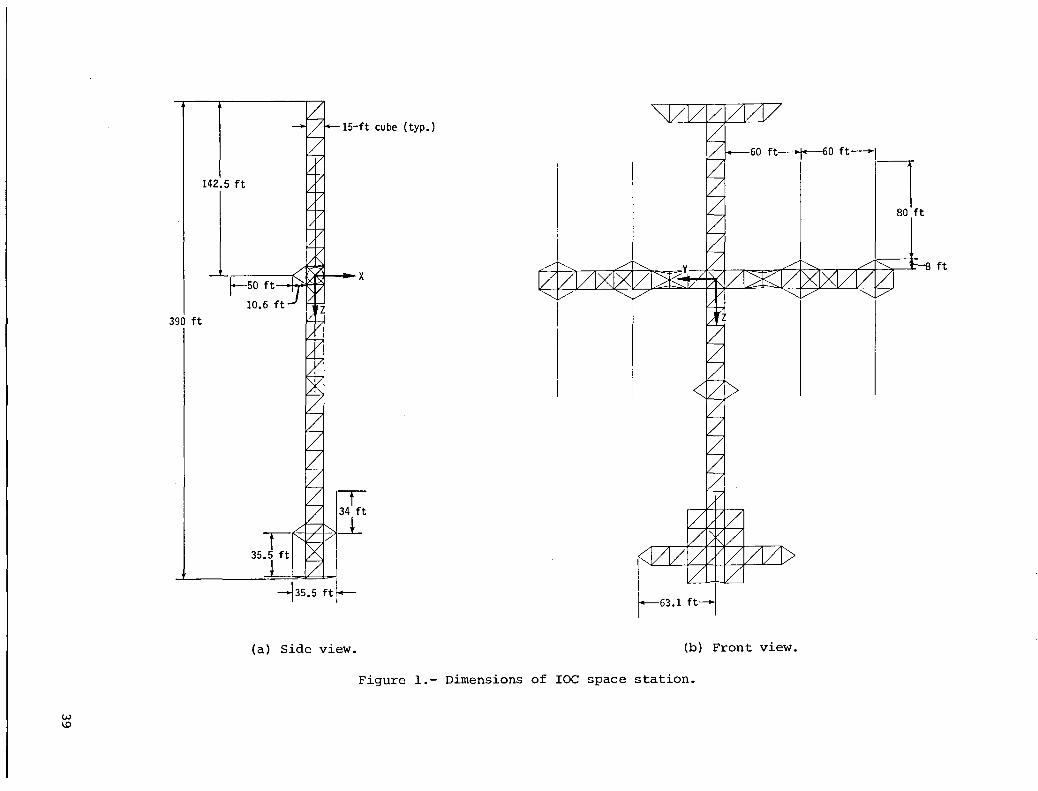
To calculate rigid-body and flexible-body dynamic characteristics of the IOC space station, a detailed finite-element model of the station was constructed. The finite-element program (ref. 7) Engineering Analysis Language (EAL) was used to form the space-station model and calculate all results. The model for the IOC station is shown with dimensions in figure 1. Because this space station has IS-ft bays, its overall dimensions are similar to, but not exactly the same as, the model with 9-ft bays described in the reference document. The IOC space station measures 390 ft along the keel and 28S ft across the transverse boom (compared with 396 ft and 261 ft, respectively, for the 9-ft-bay station). The axis system for the model is centered in the middle of the bay, which forms the keel/transverse-boom intersection, with X pointing in the direction of flight, Z pointing toward Earth, and Y pointing along the starboard transverse boom.
2
Truss Description
The support truss that forms the space-station keel, the keel extension, the transverse boom, the lower boom, and the upper boom is an orthogonal tetrahedral truss with a bay size of 15 ft. (See ref. 2.) In the finite-element model, the truss is modeled with axial or rod elements, where the elements represent graphiteepoxy tubes with an outside diameter of 2 in., a wall thickness of 0.06 in., a modulus of 40 x 106 Ib/in2, and a density of 0.063 Ib/in3• The total mass of the tubes that make up G~e truss structure (including solar-array supports, radiator supports, and reaction-control-system thruster supports) is 4045 Ibm. Each truss joint, which included the mass of the Mobile Remote Manipulator System (MRMS) guide pin (ref. 8), is assumed to have a mass of 3.5 Ibm. Also, the truss joints are assumed to be rigid~ therefore, they do not reduce the truss stiffness.
Subsystem Descriptions
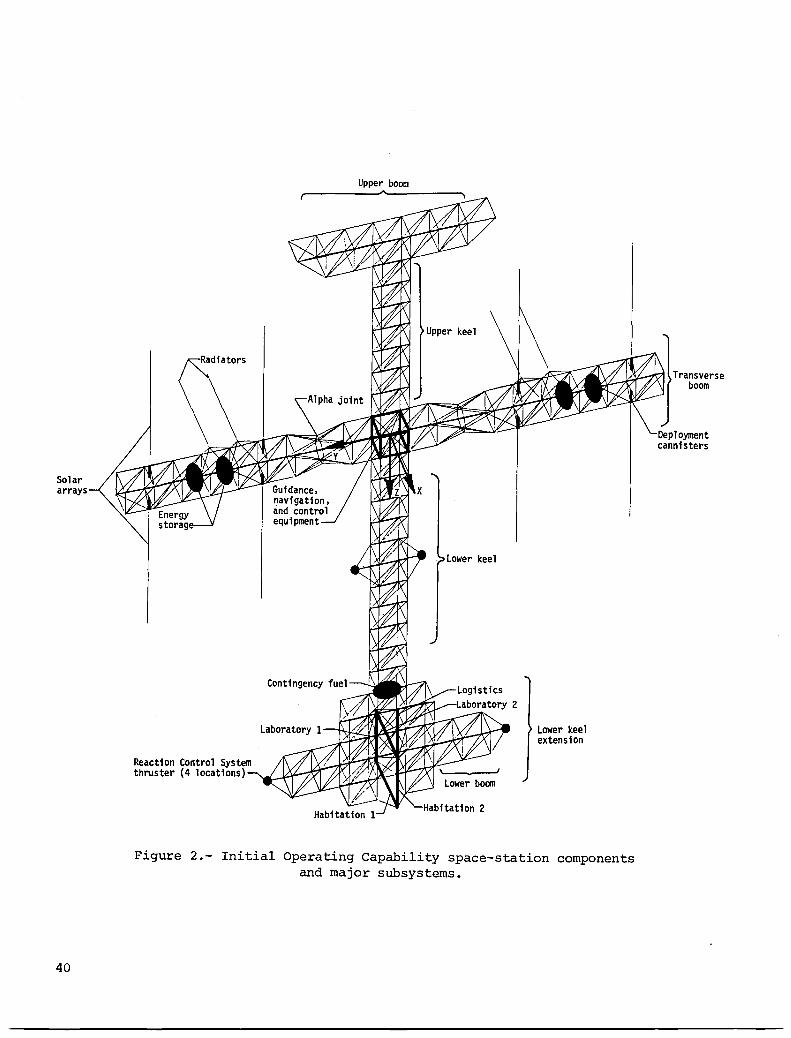
The location of some of the major subsystems on the space station are shown in figure 2. Data on subsystem locations and masses were taken from the reference document whenever possible~ otherwise, engineering judgment was used to place the subsystems and/or estimate their masses. Masses for each of the subsystems included in the finite-element model are summarized in table I. A description of each of the subsystems, how they were modeled, and how their respective masses were distributed on the station follows.
Solar arrays.- Eight solar arrays are located on the transverse boom of the IOC station to provide the required 75 kW of electrical power. These solar arrays consist of a central deployable mast to which are attached two hlankets covered on one side by solar cells. The central mast is assumed to be 80 ft long, and each of the blankets measures 15 by 80 ft. The blankets are assumed to have an areal mass density of 0.4 lbm/ft2, and the deployable mast has a lineal mass density of 0.192 Ibm/in. The mast bending and torsional stiffnesses are EI = 4.51 x 10⁸ Ib-in2 and GJ = 3.00 x 10⁷ lb-in2, respectively. As in reference 3, blanket dynamics were not included in the model, but the blanket mass was included by distributing it uniformly along the deployable mast.
Deployable-mast cannisters.- The deployable-mast cannisters are used to house the retracted mast during launch and to deploy the solar-array mast (and attached arrays) once in orbit. The cannister is assumed to be an aluminum cylinder 96 in. long, with a 30-in. outside diameter and a 0.25-in. wall thickness. The base of each cannister is attached to a batten on the transverse boom (fig. 2), and the cannister tip is held in place by four members that are also attached to the transverse boom. When the solar arrays are deployed, they are cantilevered out of the tip of the deployment cannister.
Radiators.- In this concept, the power system and the central radiators have been combined and located on the transverse boom as shown in figure 2. The total surface area required (5853 ft2 , as given in the reference document) has been divided among four radiators, each of which would be 15 ft wide (one truss bay width) and 50 ft long. The radiators, which were modeled as hollow aluminum box beams with outside cross-sectional dimensions of 180 in. by 1.4 in. and a wall thickness of 0.047 in., each have a structural mass of 1024 Ibm. A nonstructural mass of 0.488 Ibm/in. was also included for each radiator to account for the mass of the
3
coolant fluid in the heat pipes. The radiators are cantilevered from a pyramid arrangement of support members (similar to the arrangement used to support the cannisters) and a bay of the transverse-boom truss structure forms the base of the pyramid.
Modules.- A total of five modules are located on the IOC space station in a racetrack configuration on the lower keel extension. (See fig. 2.) There are two habitation modules, two laboratory modules, and one logistics module, total masses of which were obtained from the reference document. The modules were modeled as beams with the properties of an aluminum cylinder which is 427 in. long, has an outside diameter of 174 in., and has a wall thickness of 0.115 in. The structural mass of each module was 2682 Ibm. The total masses (structural mass plus interior component masses) were those listed in table I. A support structure consisting of 2-in. outside-diameter graphite-epoxy tubes (with the same properties as the truss tubes) connects the module racetrack to the lower keel extension.
Power management and distribution (PMAD).- The total mass of the PMAD equipment on the central structure (assumed to be the keel and transverse boom) is given in the reference document as 1983 Ibm. This mass was distributed evenly among the 232 joints of the truss structure, because most of this mass was assumed to represent the cabling that runs over the entire station.
Energy Storage System (ESS).- The ESS, which includes fuel cells, electrolysis units, and storage tanks, provides the space station with power during Earth eclipse and has a mass of 2643 Ibm (see reference document) per set of solar arrays. The mass for this equipment is located on the transverse booms (fig. 2) midway between the two sets of solar arrays.
Reaction Control System (RCS) thrusters •. - Four RCS thrusters are located on the IOC station for performing station-keeping and orbit reboost maneuvers. Two are located at the tips of the lower booms, and two are located on the lower keel, approximately midway between the transverse boom and the lower keel extension. A rigid mass of 54 Ibm was placed at the four locations shown in figure 2 to represent the thruster weight. The mass and locations of the RCS thrusters are taken from the reference document.
Contingency hydrazine.- The contingency hydrazine fuel has a wet mass of 6951 Ibm (see reference document). This mass was evenly distributed among the eight joints in the truss bay at the base of the keel, which is at the intersection of the lower keel and the keel extension. (See fig. 2.)
Thermal distribution.- The thermal distribution system transports heat energy generated by the modules to the radiators located on the transverse booms. The assumed mass of this system was 2252 Ibm, and the mass was evenly distributed among the joints on the space-station lower keel.
Rotary joints.- The alpha joint located on each of the transverse booms had a diameter of 14 ft and was modeled as an octagonal ring with the ring segments constructed from aluminum box beams with a hollow square cross section. The box beams had an outside dimension of 6.25 in. and a wall thickness of 0.25 in. (See ref. 8.) The structural mass of each alpha joint was 309 Ibm, and 1000 Ibm of nonstructural mass was distributed around each alpha joint to represent the mass of internal systems.
4
A beta joint, which is used to aid in sun tracking, exists for each solar array on the station and is assumed to have a mass of 200 Ibm. A rigid mass was placed at the base of each deployable-mast cannister to account for the beta joints.
Guidance, navigation, and control (GNC) equipment.- The GNC equipment, a package located in the interior of the bay at the keel/transverse-boom intersection, contains items such as control moment gyros (CMG) and star trackers. The total mass of this equipment is 3899 Ibm (see reference document), and it is distributed evenly among the eight joints at the corners of the central truss bay.
Mobile Remote Manipulator System (MRMS).- The MRMS is assumed to have an empty mass of 2000 Ibm and was assumed to be parked on the" space-station keel at the intersection of the lower keel and the lower keel extension.
Miscellaneous items.- The data handling equipment is a 1250 Ibm package assumed to be located on the lower keel extension truss between the modules. Antennas and associated cabling with a total mass of 1950 Ibm are placed at various locations on the space station. (See reference document.) A total of 658 Ibm of communications and tracking equipment is located on the space station, half on each transverse boom just inboard of the alpha joints.
Growth Space Stations
Truss Description
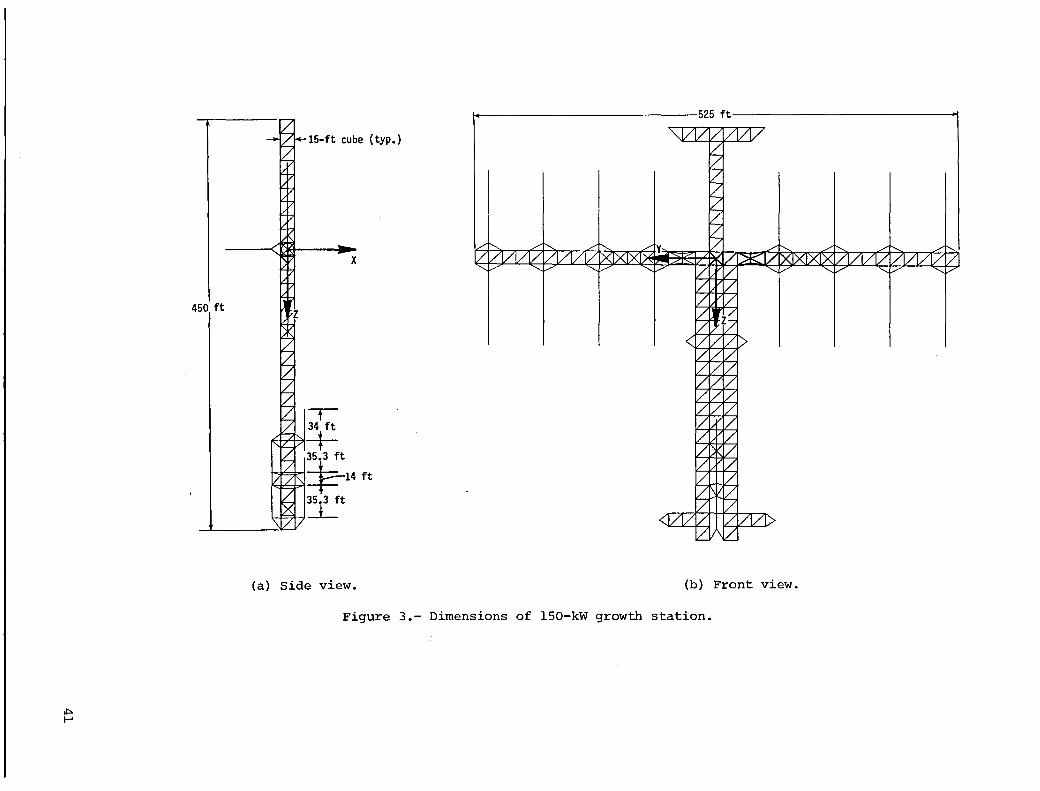
Finite-element models of the l50-kW and 300-kW growth space stations are shown in figures 3 and 4, respectively. A major difference between the IOC and growth stations is the addition of truss structure to the lower keel, which results in a continuous three-bay-wide lower keel for the growth stations. The primary reason for using the three-bay-wide keel is to provide increased structural redundancy between the manned modules and the power source (the solar arrays) and the control system. The four-longeron one-bay-wide keel can maintain a reduced structural integrity if one of its members fails, but it can no longer function as a load-carrying structure if it suffers the loss of one of its truss joints. The three-bay-wide keel, however, provides enough structural redundancy so that the loss of a truss joint will not cause a catastrophic structural failure. Another important advantage of the threebay-wide keel is that it provides an increased amount of truss area for mounting space-station payloads.
Another major difference in the growth versions of the space station is the addition of a second module racetrack, which brings the total number of modules to nine (four habitation, four laboratory, and one logistics). The second racetrack is added below the one already in place. As a consequence, four more bays are added to the keel length, which increases that dimension to 450 ft. The lower boom has also been moved down the keel, so that it still extends from the second bay from the bottom.
In the growth versions of the space station, provisions were also made in the finite-element models to distribute controllers along the transverse booms. Before any flexible-body dynamic results were obtained, it was thought that, with the increasing leng~~ of the transverse booms, flexibility problems might arise that would require some type of distributed control system to limit transverse boom
5
deflections, or to increase damping. As a result, rigid beams were used to connect the bases of each of the opposing solar-array deployment cannisters, and joints that defined controller locations were located at the midpoint of the rigid beams. If controllers did need to be added to the transverse boom, the capability thus existed of easily adding controller (CMG) masses at these joints and providing a place to input control torques and forces. For the studies described in this paper, however, no transverse boom controllers were assumed. Thus, no rigid masses were added to these joints.
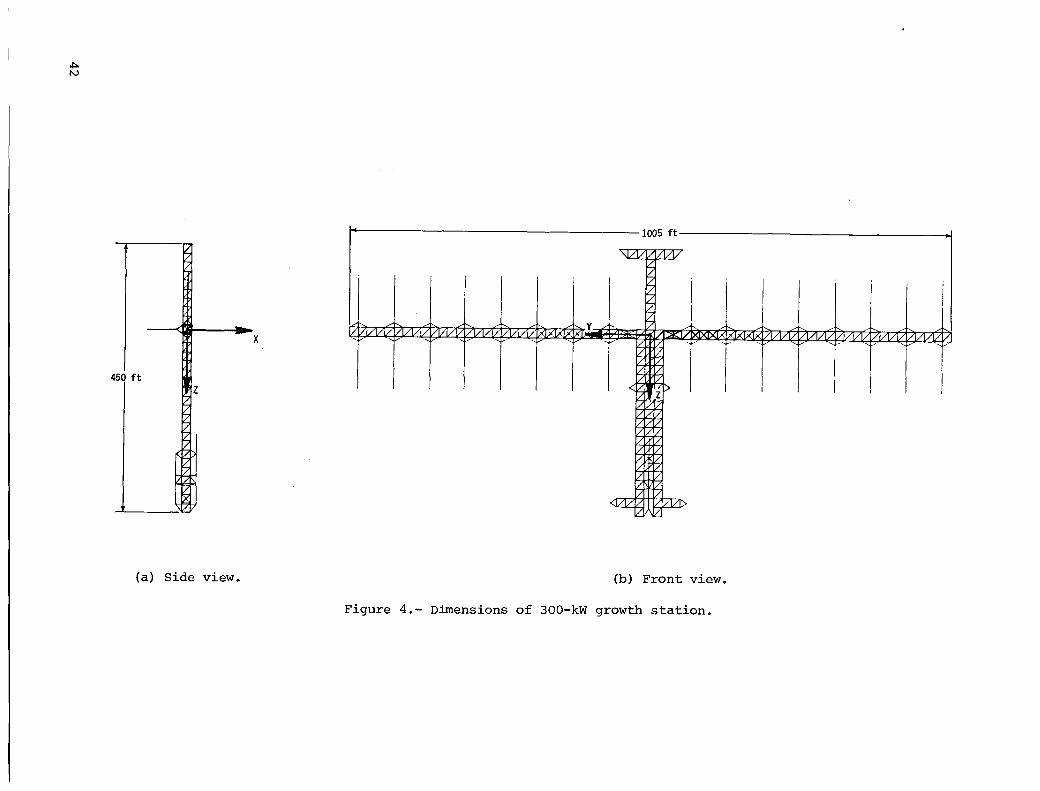
Both versions of the growth model included the changes described in the preceding three paragraphs. The principal differences between the 150-kW and the 300-kW growth stations were the length of the transverse boom and the number of solar arrays present. In going from the IOC station to the 300-kW growth station, four times the number of solar arrays were required; consequently the transverse boom, at 1005 ft, is four times as long. (See fig. 4.)
Subsystem Descriptions
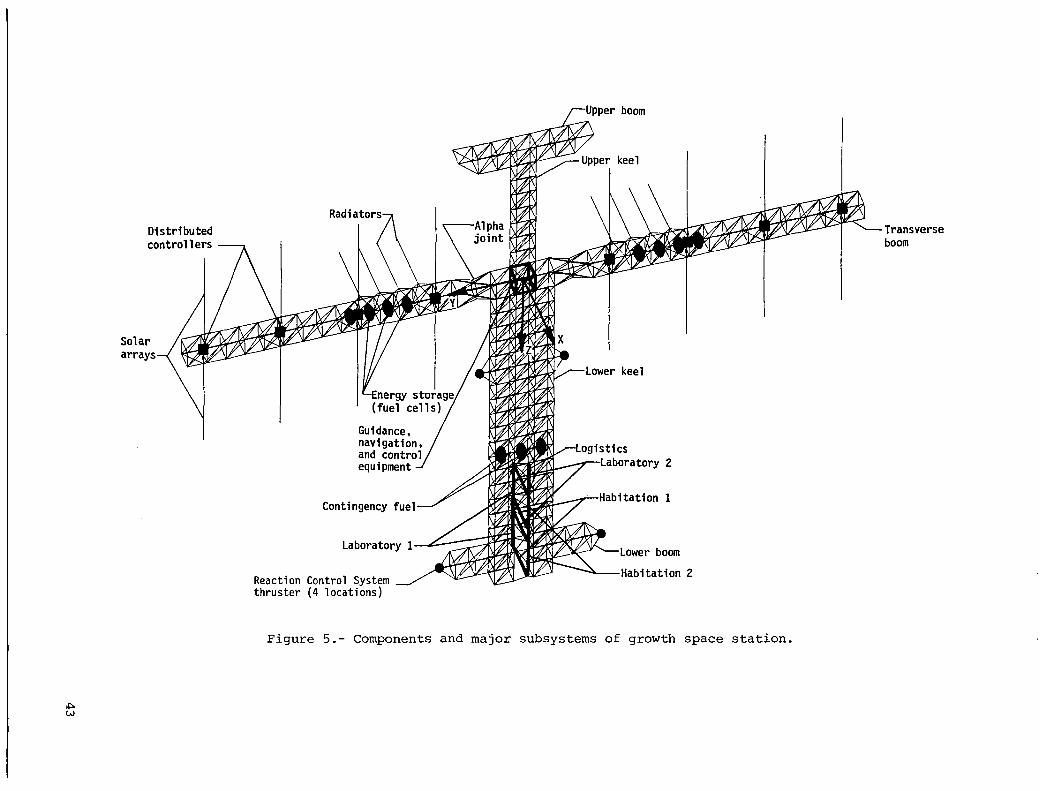
The structural configuration shown in figures 3 and 4 for the growth station represents one of many possible growth scenarios. The uncertainty associated with how the space station will accommodate growth also applies to the space-station subsystems, their masses, locations, and other factors during growth. All information offered herein is purely speculative on growth subsystems, since no information exists in the reference document. In some cases, subsystem masses have been proportionally scaled up from IOC with respect to the number of modules or the number of solar arrays. Also, the subsystems have been left exactly the same as on the IOC station in some cases. How each subsystem was treated for growth, however, was entirely at the discretion of the author. Only subsystems which changed on the growth stations are described in more detail. Any subsystems not mentioned herein can be assumed to be the same as on the IOC station.
For each set of solar arrays added to the growth station, a radiator, an Energy Storage System, a pair of beta joints, and a pair of deployable mast cannisters were added to the transverse boom. The Energy Storage Systems were added to successive bays outboard of the ESS location on the IOC station (fig. 5) in an effort to keep their mass as close as possible to the root of the transverse boom (and thus reduce the effect of ~~eir additional mass on lowering transverse-boom frequencies).
Both versions of the growth station (150 kW and 300 kW) have twice as many habitation and laboratory modules as the IOC station. Since the masses of the thermaldistribution and data-handling systems seemed to be a function of the number of modules, the masses of these two systems were doubled for both versions of the growth station. Also, since both versions of the growth station were assumed to have two module racetracks (with the modules representing a majority of the space-station mass), the growth stations had approximately twice the mass of the IOC station regardless of the power level. Thus, it was assumed that twice as much contingency hydrazine would be required for the growth stations.
Clearly, some important systems which have not been mentioned would require modifications for growth, with the two most obvious examples being the GNC equipment and the RCS thrusters. For the case of the GNC equipment, the number of CMG's located at the keel/transverse-boom intersection for the IOC station would be, at most, half the number required for the growth stations. Adding mass to the IOC GNC location to represent the additional CMG's required for growth would not be
6
realistic, since the IOC CMG's already completely fill that space. Additional CMG's would have to be located somewhere else on the station; since that location has not been determined, they were left out of the model. Similarly, the four 75-lbf RCS thrusters on the IOC station would not be adequate for a growth station with twice the mass if orbit reboost times were equal. At least four more thrusters would be required for the growth stations. Again, since it is not possible to locate these systems accurately without doing a more detailed analysis on station reboost, they were not included in the model. Because the mass of these systems would add less than 1 percent to the growth-station mass, and because their locations would most likely be on the stiff three-bay keel, neglecting them in the finite-element model should not decrease the accuracy of the results obtained.
SPACE-STATION DYNAMIC CHARACTERISTICS
Rigid Body
Rigid-body dynamics information consisting of total mass, mass moments of inertia, and center-of-gravity (c.g.) location are summarized for the IOC, l50-kW growth, and 300-kW growth space stations in table II. The total mass of each of the two growth stations is approximately twice that of the IOC station, mainly because of the addition of the second module racetrack. The location of the c.g. for all cases is on the Z-axis and relatively close to the modules.
For the power-tower space station to fly in its proper gravity-gradient stabilized attitude (i.e., Z-axis aligned with nadir), the mass moment of inertia about the Z-axis (IzZ ) must be smaller than the mass moments of inertia about either the X-axis or the Y-axis. For the case of the 300-kW growth version, however, Iyy is less than I ZZ; this would cause the station to be gravity-gradient stable with the transverse boom pointing towards Earth. This problem could be corrected on the space station, however, by judiciously locating the payloads. This change in the minimum moment-of-inertia axis is pointed out merely to illustrate that some care will have to be taken to maintain the desired gravity-gradient stability when locating payloads and subsystems on the growth station.
Flexible Body
IOC Space Station
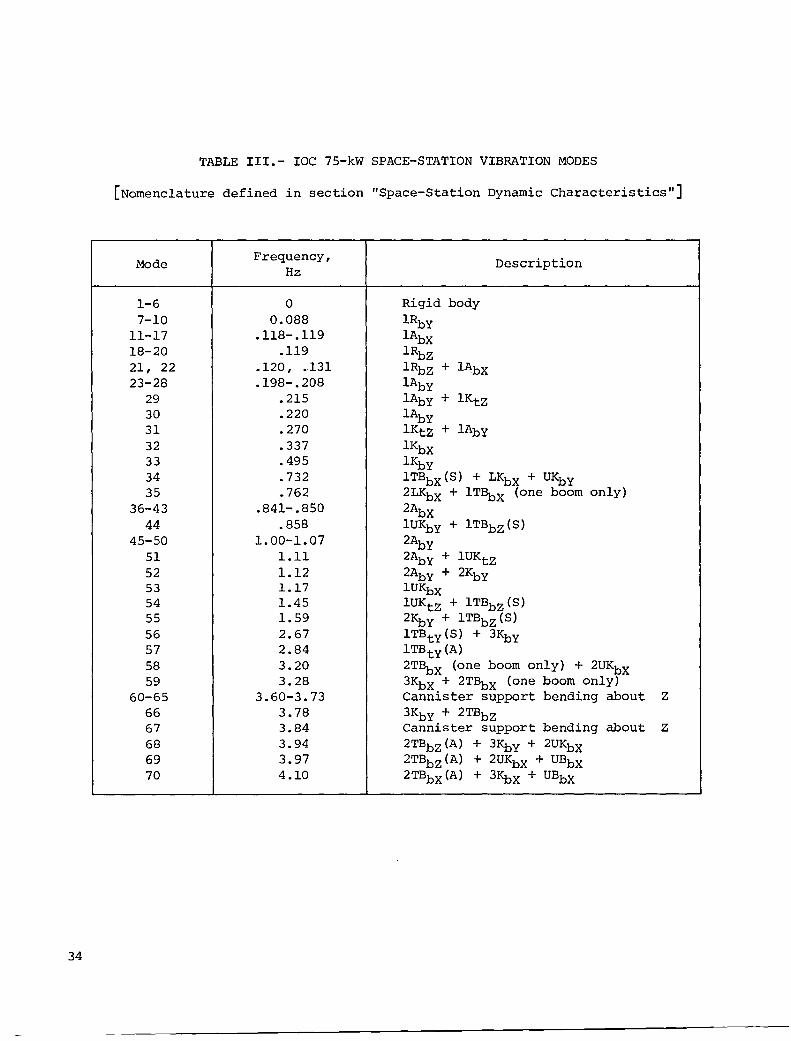
The IOC space-station finite-element model had 293 joints and 879 dynamic degrees of freedom. The first 70 vibration modes are listed in table III along with corresponding frequency and mode shape descriptions. It was found that there are a large number of appendage modes (solar arrays and radiators) interspersed among the primary structure modes. Thus, of the first 70 modes calculated, only 23 could be considered structural modes (41 were appendage modes and 6 were rigid-body modes). The method for describing mode shapes in tables III through V is as follows. The numbers 1 through 5 refer to first through fifth. The next element, one or two letters (capitalized), refers to parts of the space station as follows:
A - Solar array
R - Radiator
K - Keel
7
UK - Upper keel
LK - Lower keel
TB - Transverse boom
UB - Upper boom
These parts are defined for the IOC station in figure 2. The first subscript is ·either a lower case b (for bending) or t (for torsion). The next subscript (capital X, Y, or Z) refers to the axis about which the bending or torsion is taking place. Where appropriate, symmetric modes are indicated by (S), and antisymmetric modes are indicated by (A). For example, mode 11 (lAbX) is first-solararray bending about the X-axis, and mode 51 (2AbY + lUKtZ ) is second-array bending about the Y-axis plus first-upper-keel torsion about the Z-axis. When more than one component of the space station is listed for a mode description, the component with the largest contribution (in terms of strain energy) is listed first, and the other components are listed in decreasing order of contribution to the mode.
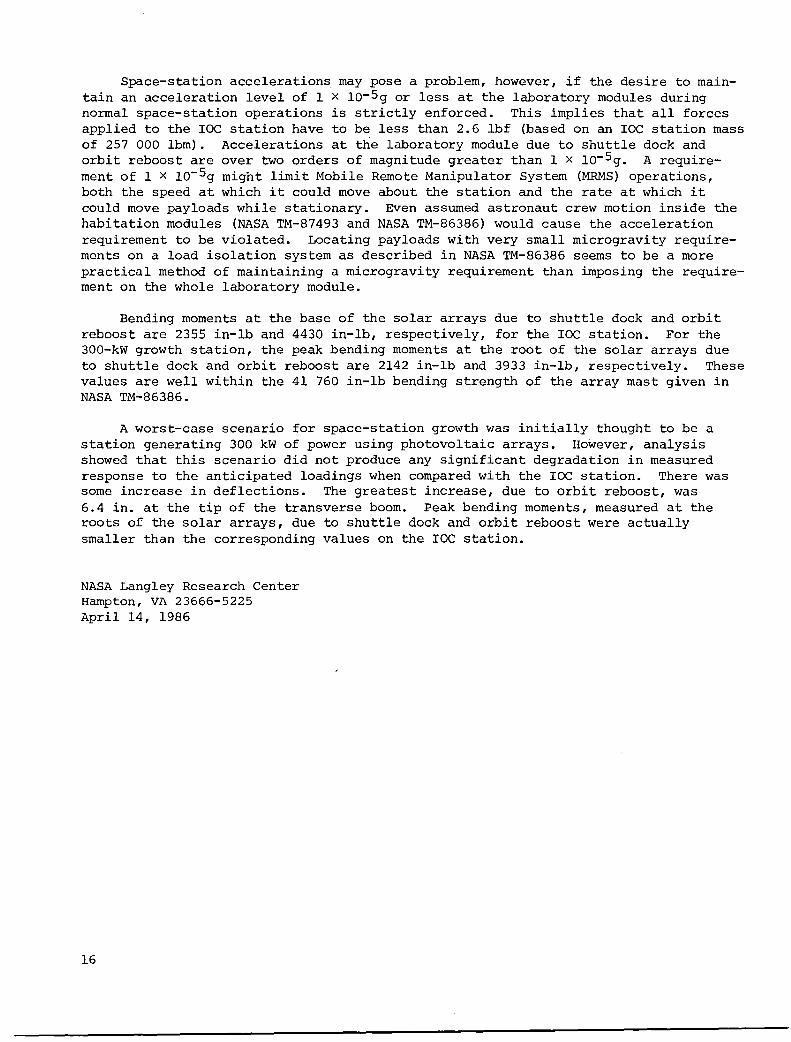
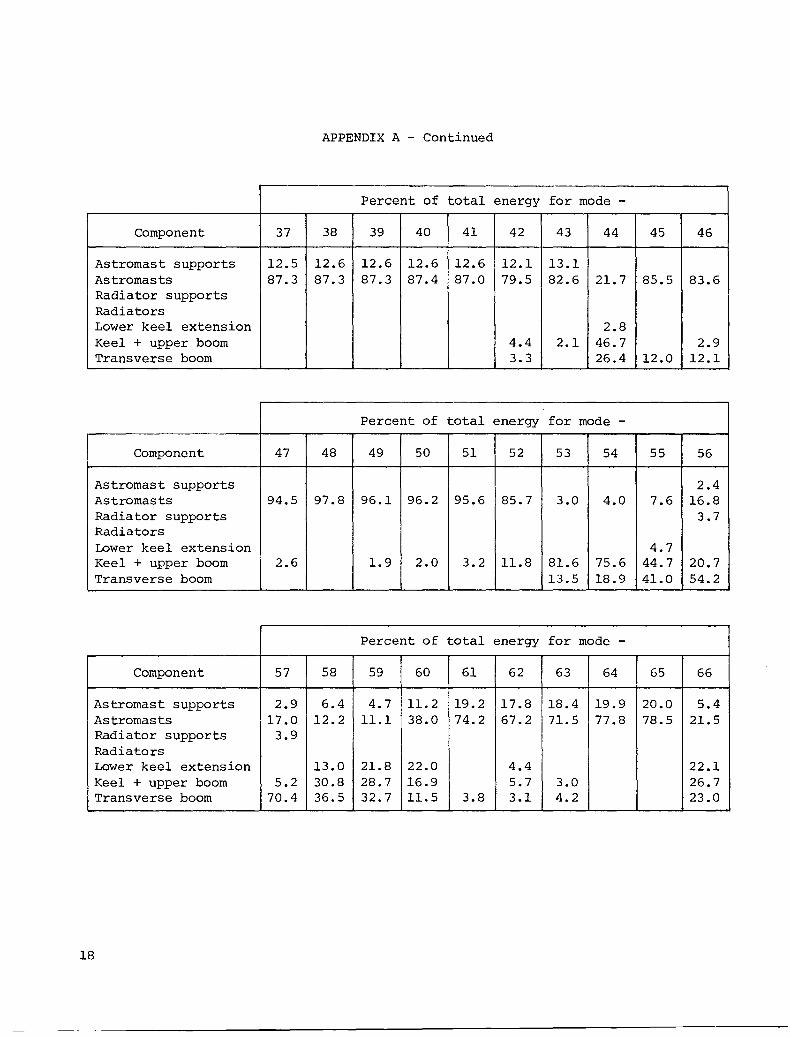
Appendix A lists the percentage of total strain energy in the various spacestation components for each of the modes listed in table III. (The strain energies in the first six rigid-body modes are zero; therefore, they are not listed.) The information contained in.appendix A, along with plots of the mode shapes, was used to determine the descriptors in table III. The strain energies were also used to determine the order of the descriptors if more than one component were involved in a mode. In mode 51 for example, 95.6 percent of the strain energy is in the solar arrays, and 3.2 percent of the strain energy is in the keel and upper boom; therefore, the array bending is listed first in the mode description.
In general, the space-station modes are of three types - appendage (which involves the solar arrays and radiators), appendage plus structure, and structure. First-radiator-bending modes, modes 7 through 10, occur at 0.0879 Hz and are bending about the Y-axis. Modes 18 through 20, although listed as radiator-bending modes, also include bending of the radiator supports. (See appendix A.) Table III shows a difference in frequency between the array first-bending modes about the X-axis and those about the Y-axis. This difference is attributed to the way the array cannister is attached to the transverse boom. The base of the deployable-mast cannister is attached to the middle of a batten; thus, for array bending about the X-axis, the cannister base only receives support stiffness as a result of the bending stiffness of the batten. For array bending about the Y-axis, however, the cannister base is supported by the axial stiffness of the batten, which is much greater than the bending stiffness. This difference in support stiffness explains the difference in the frequencies of the two array bending modes.
The frequency obtained for the array bending modes in this report is approximately 0.2 Hz, compared with about 0.165 Hz for the space station with 9-ft bays. (See ref. 3.) The difference in the two results is due to the way the array supports
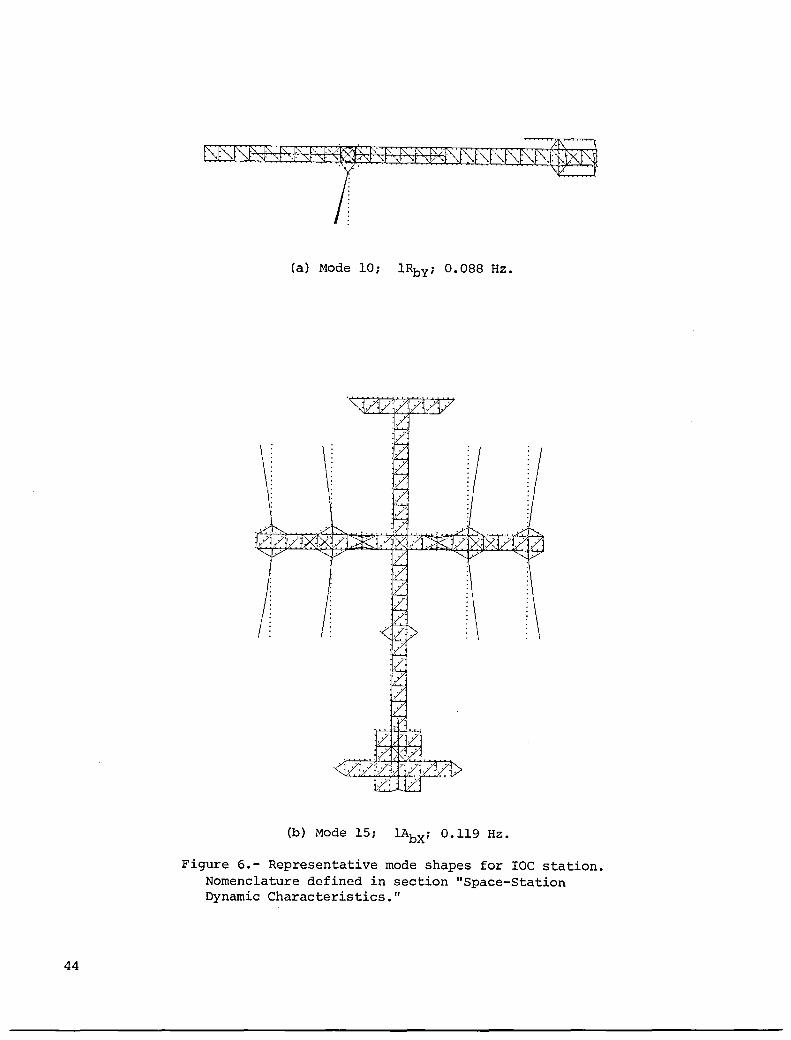
were modeled. Reference 3 used a blanket mass of 0.5 Ibm/ft2 and a mast length of 84.5 ft, compared with the values of 0.4 Ibm/ft2 and 80 ft used herein. Examples of radiator-bending and solar-array-bending mode shapes are given in figures 6(a) and 6(b), respectively.
The first structural frequency occurs at 0.270 Hz, and the mode is first-keel torsion about the Z-axis. There is also some array bending in this mode that is required for the station to maintain dynamic equilibrium. Mode 29, at 0.215 Hz,
8
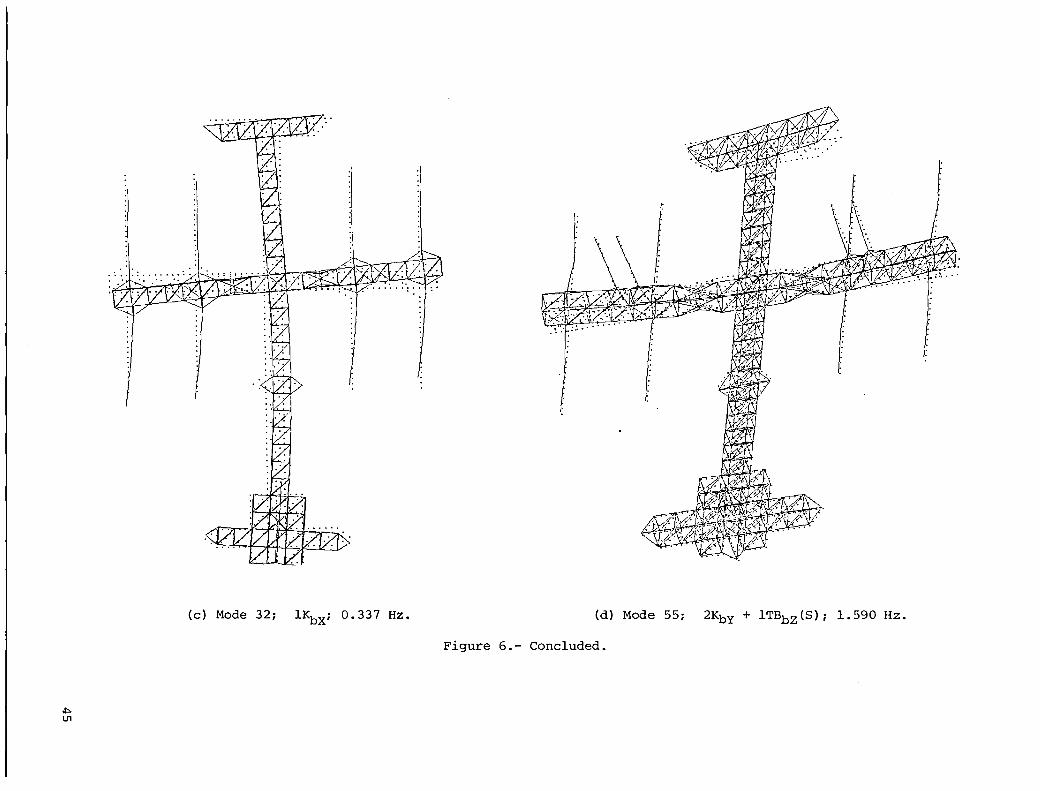
might be considered to be the first structural mode, because it also has some keel torsion. Mode 29, however, is primarily an array-bending mode, with the arrays on one transverse boom bending opposite from those on the other transverse boom. This conclusion is reinforced by the strain-energy information in appendix A, which shows that 77.2 percent of the strain energy is in the arrays and that only 20.7 percent is in the keel for mode 29. Mode 31, however, is the actual first-keel-torsion mode, because. it has 70.3 percent of the strain energy in the keel and only 24.0 percent in the sola.r arrays. First-keel-bending modes occur at 0.337 Hz (about the X-axis) and 0.495 Hz (about the Y-axis). Examples of structural modes are given in figures 6(c) and 6(d) for the IOC station.
Growth Space Stations
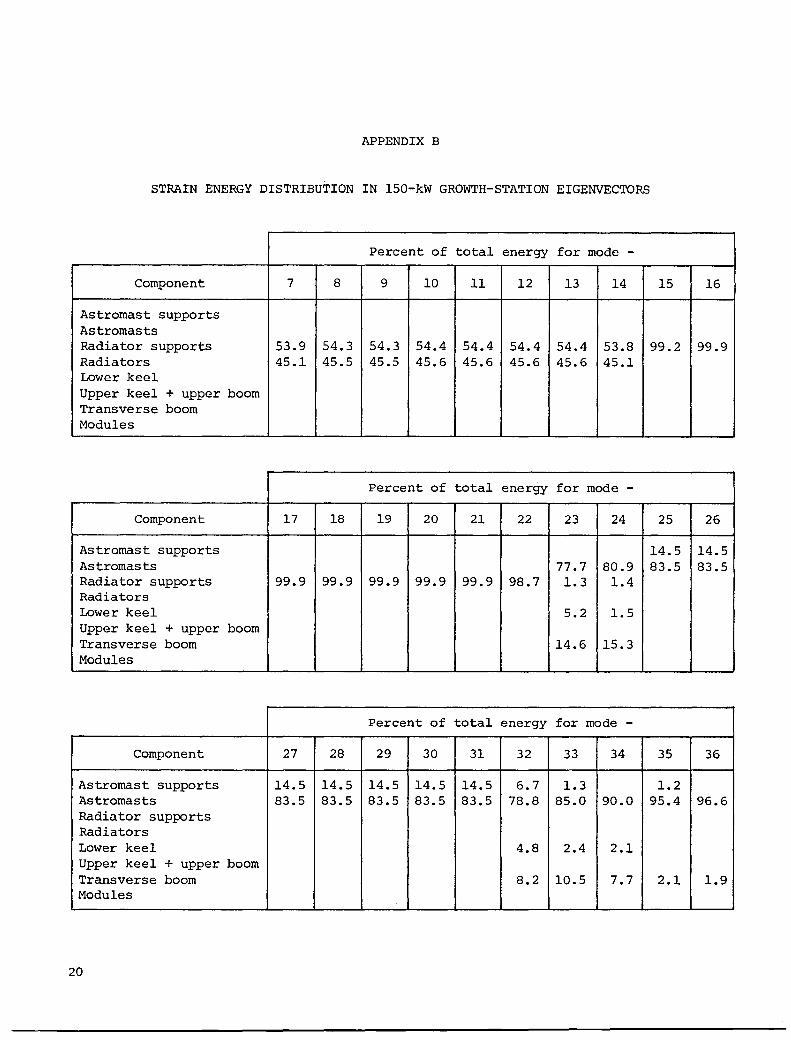
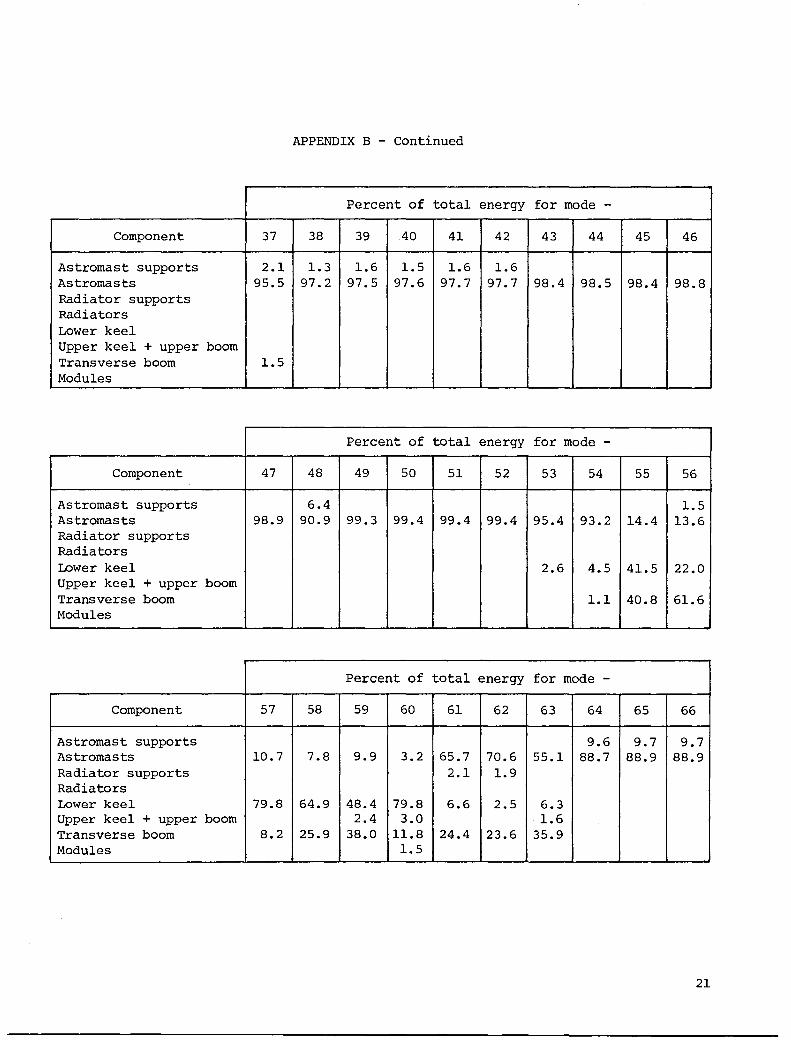
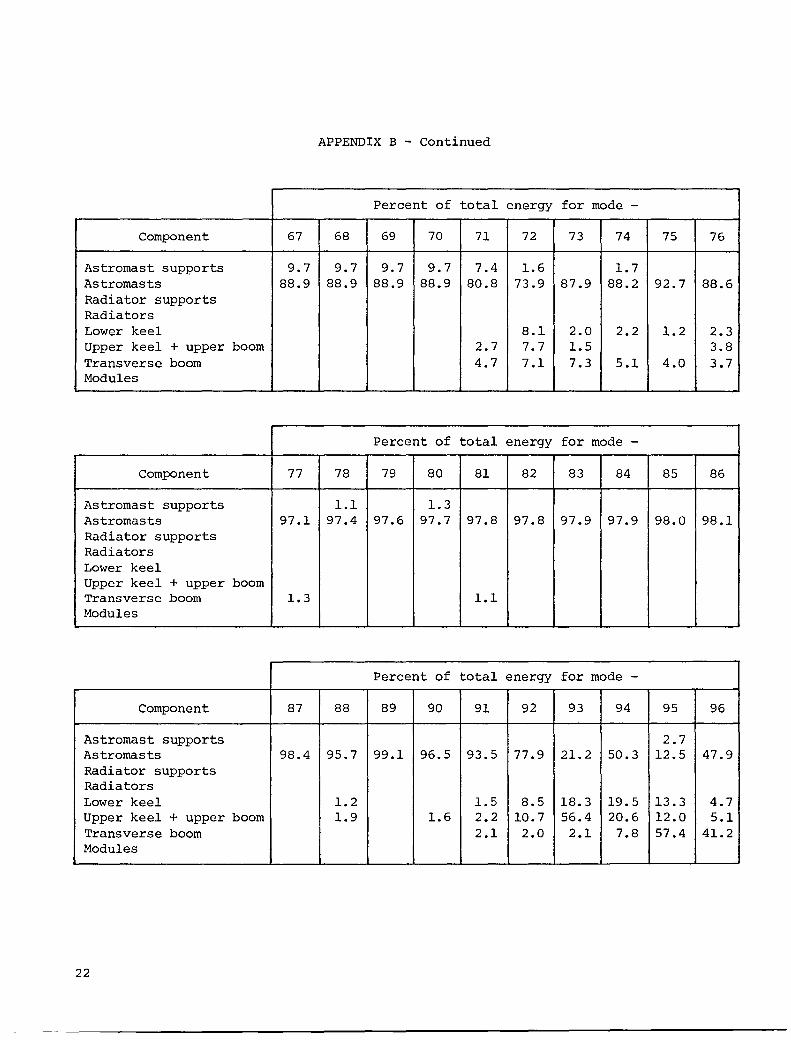
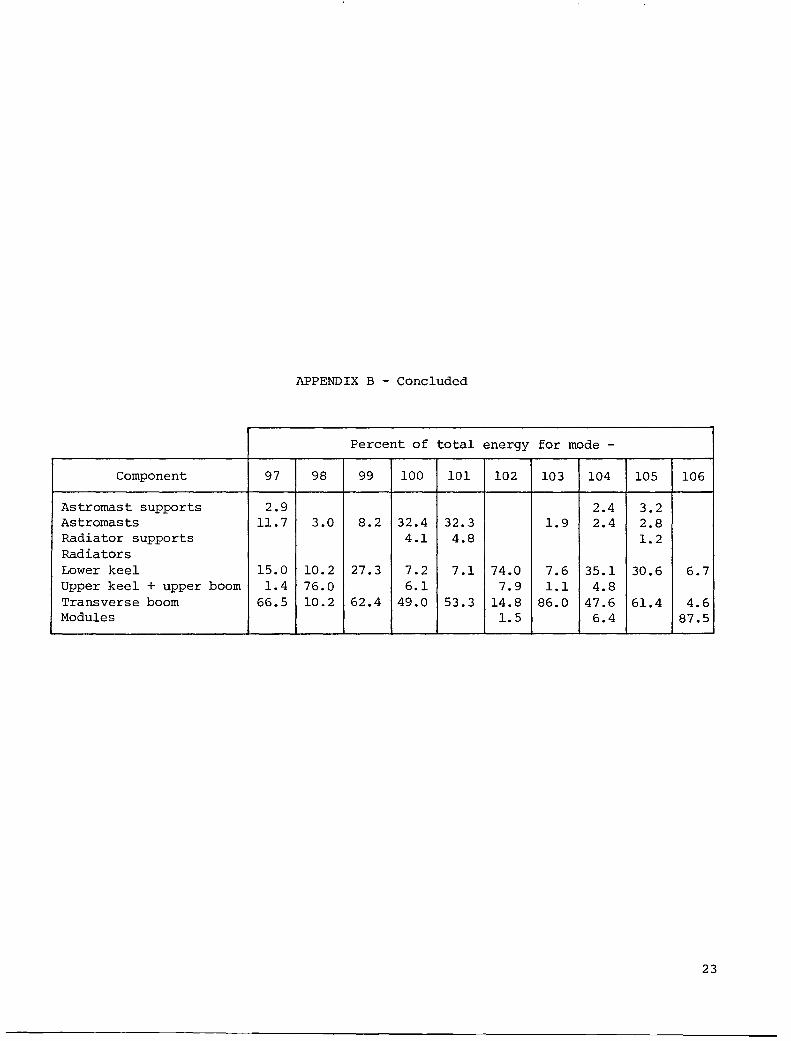
The 150-kW growth space-station finite-element model has 477 joints and 1431 dynamic degrees of freedom. The first 106 vibration modes are listed and described in table IV, and the corresponding modal strain energies are summarized in appendix B.
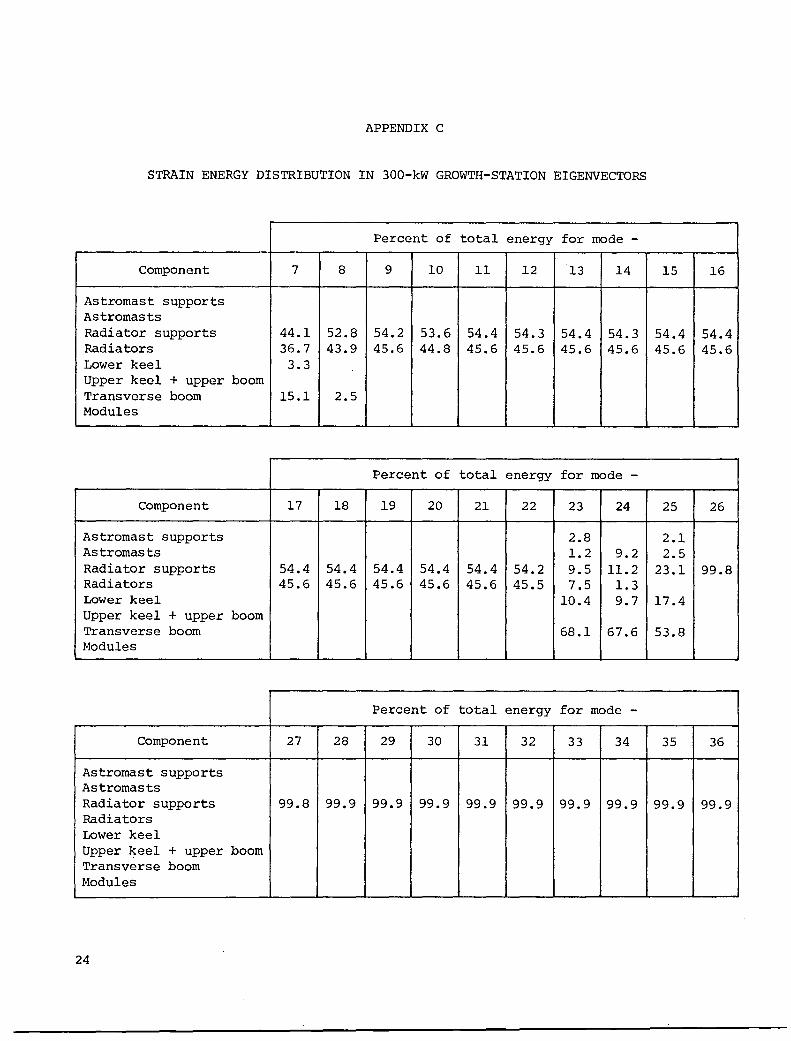
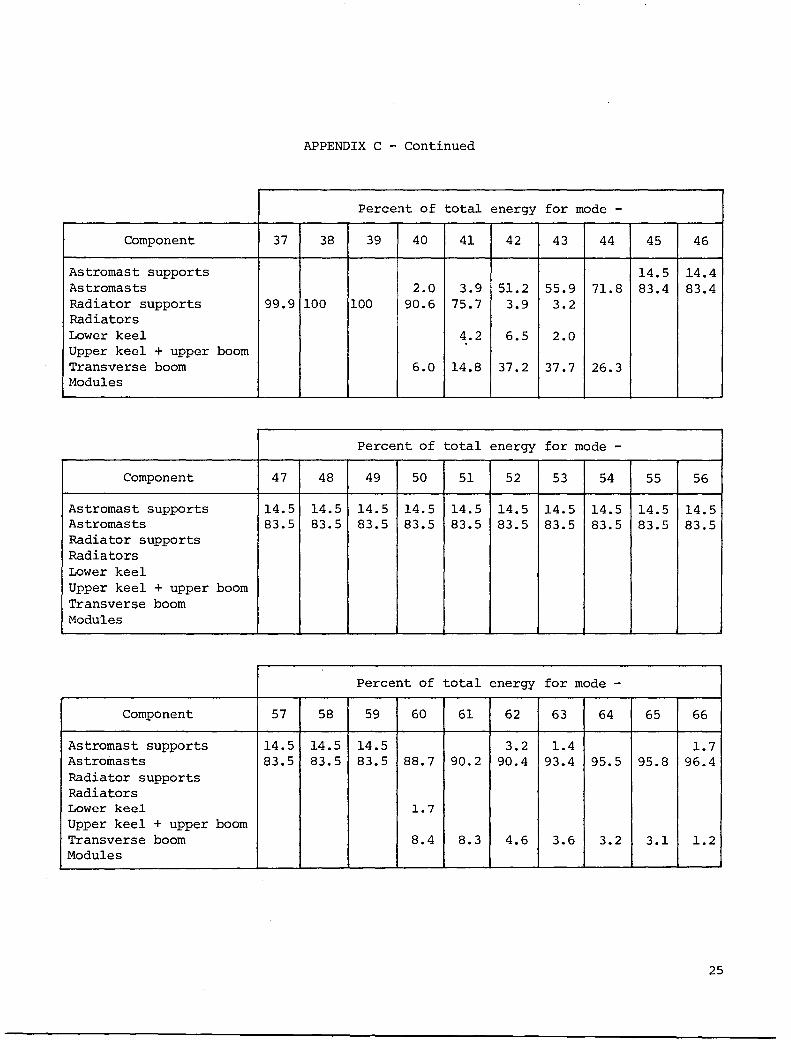
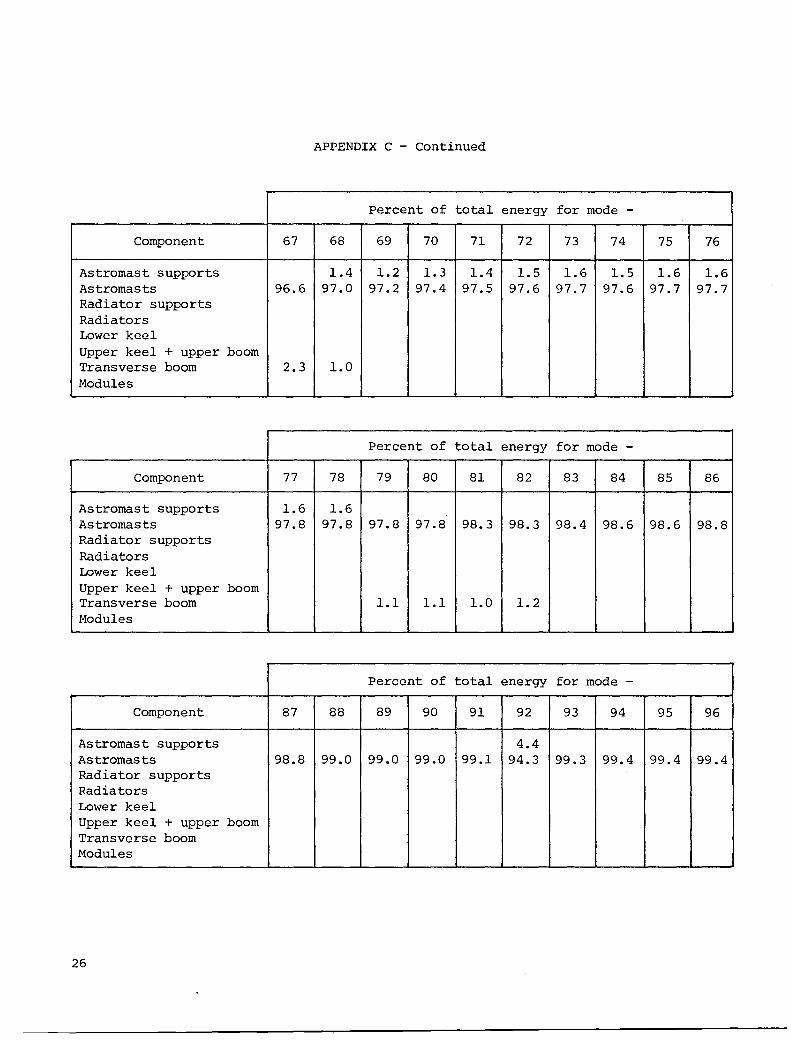
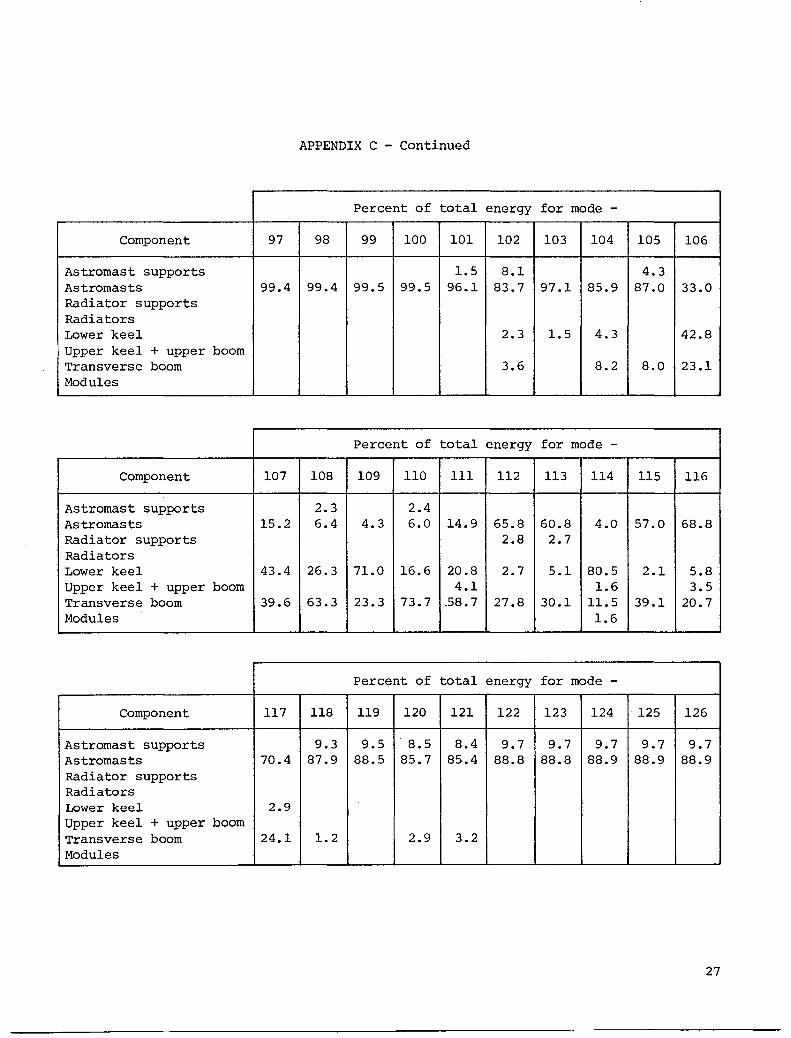
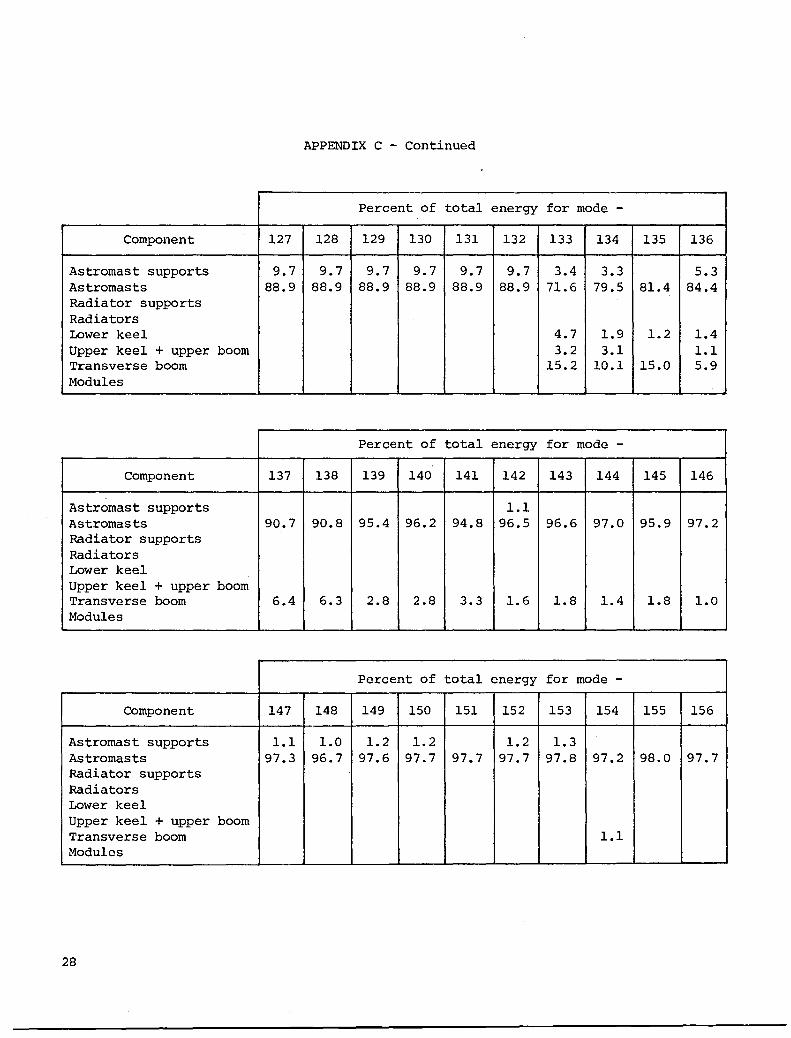
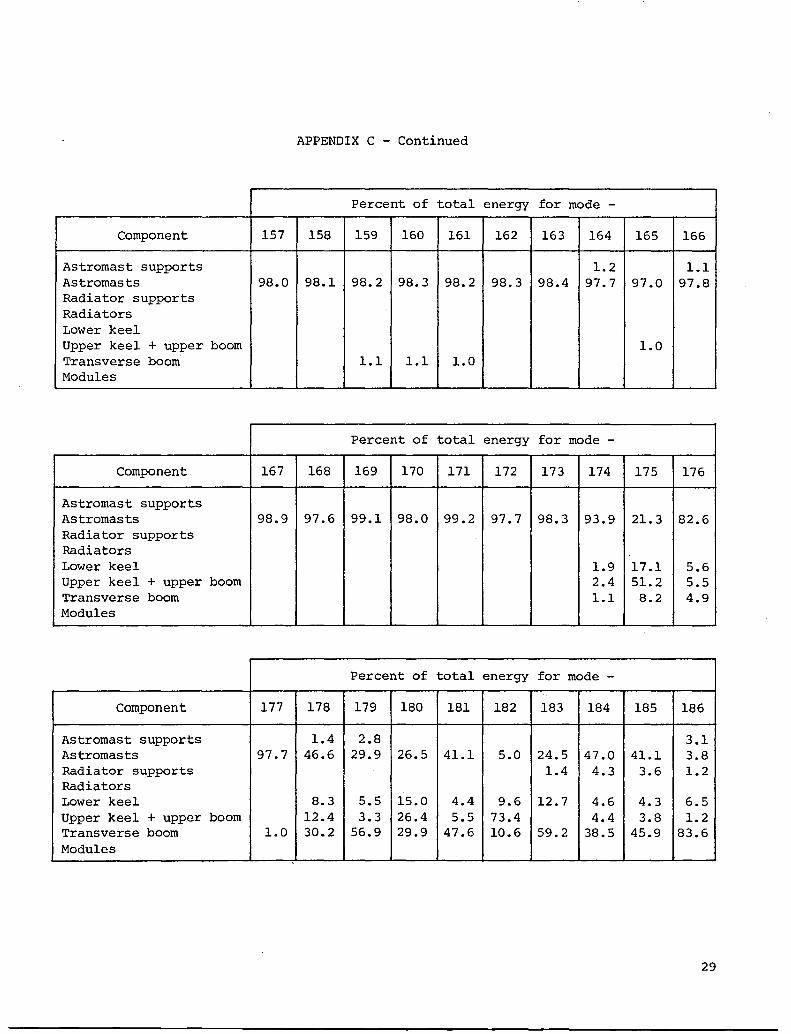
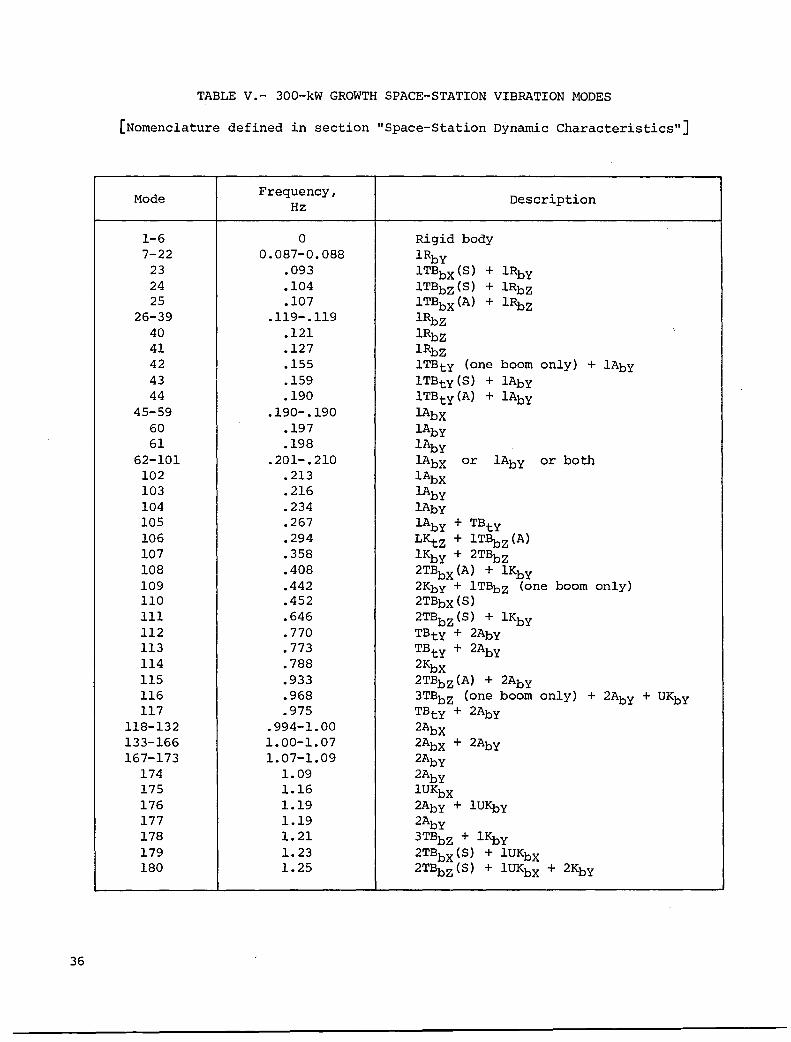
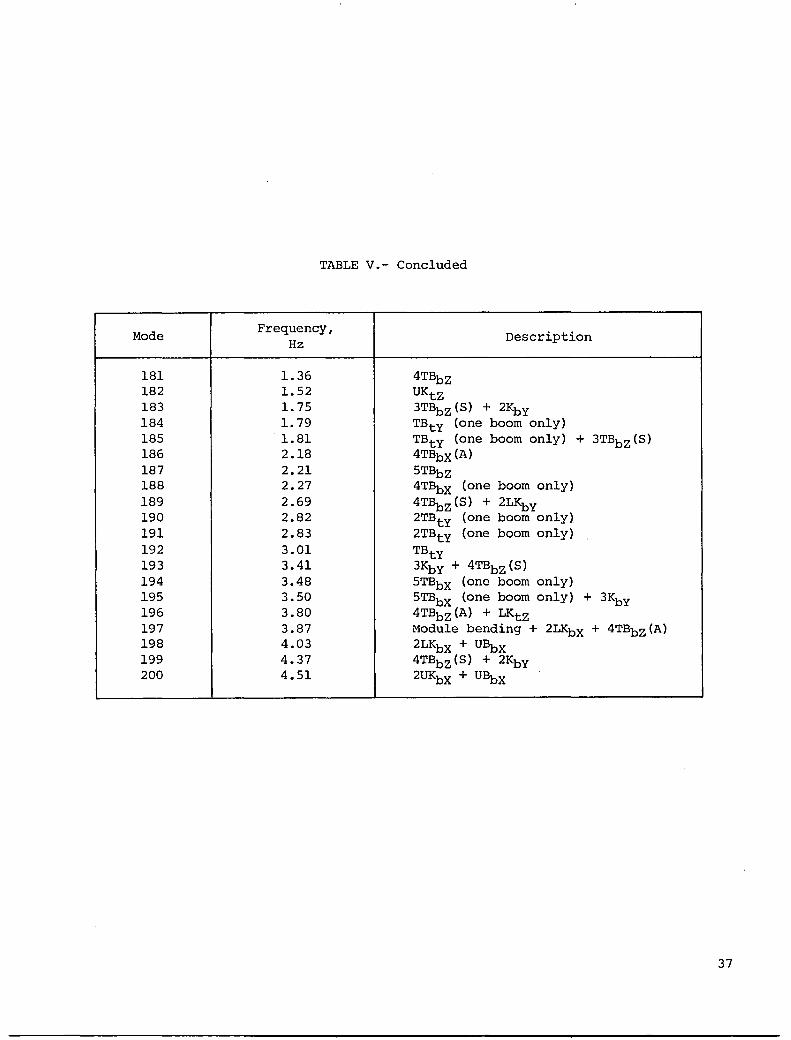
The 300-kW growth space-station model has 685 joints and 2055 dynamic degrees of freedom. The first 200 vibration modes for this station are listed in table V, and the corresponding modal strain energies are summarized in appendix C.
Except for array bending about the X-axis, all the appendage modes in the growth models occur at approximately the same frequencies as the corresponding modes in the IOC model. In the growth models, rigid beams were added to the transverse booms to provide for controller locations. These rigid beams add considerably to the batten bending stiffness at the cannister base; consequently, the lAbX frequencies are increased from 0.118 Hz on the IOC station to 0.190 on the growth stations.
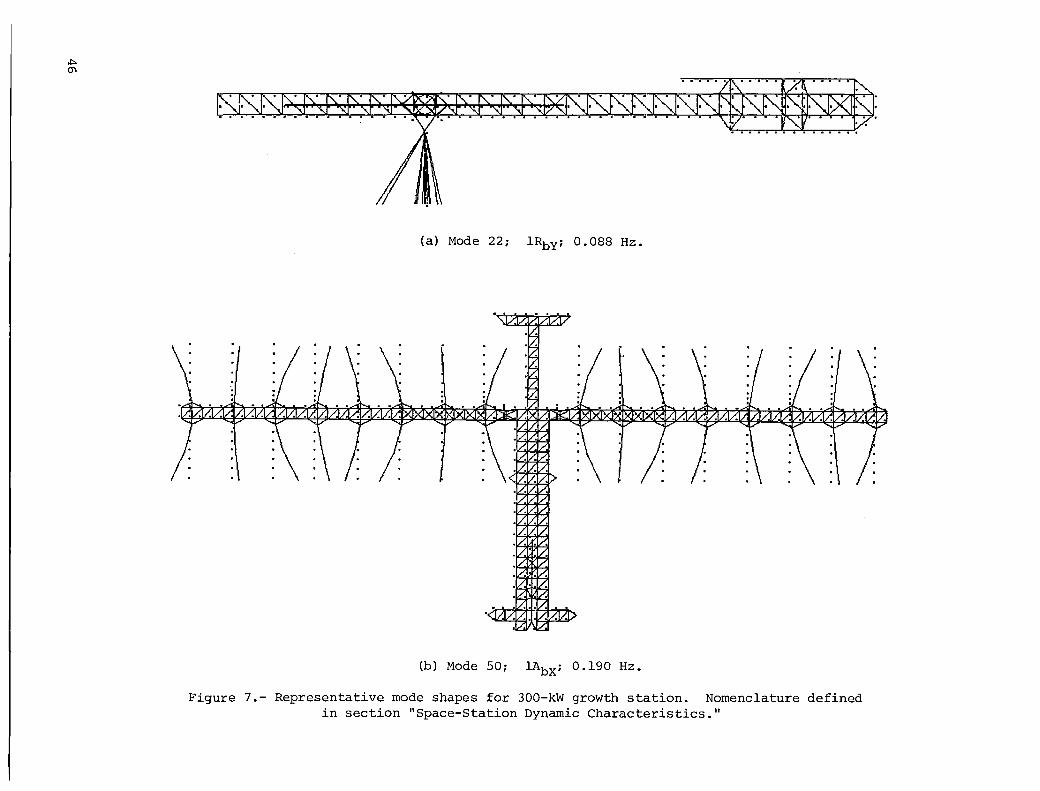
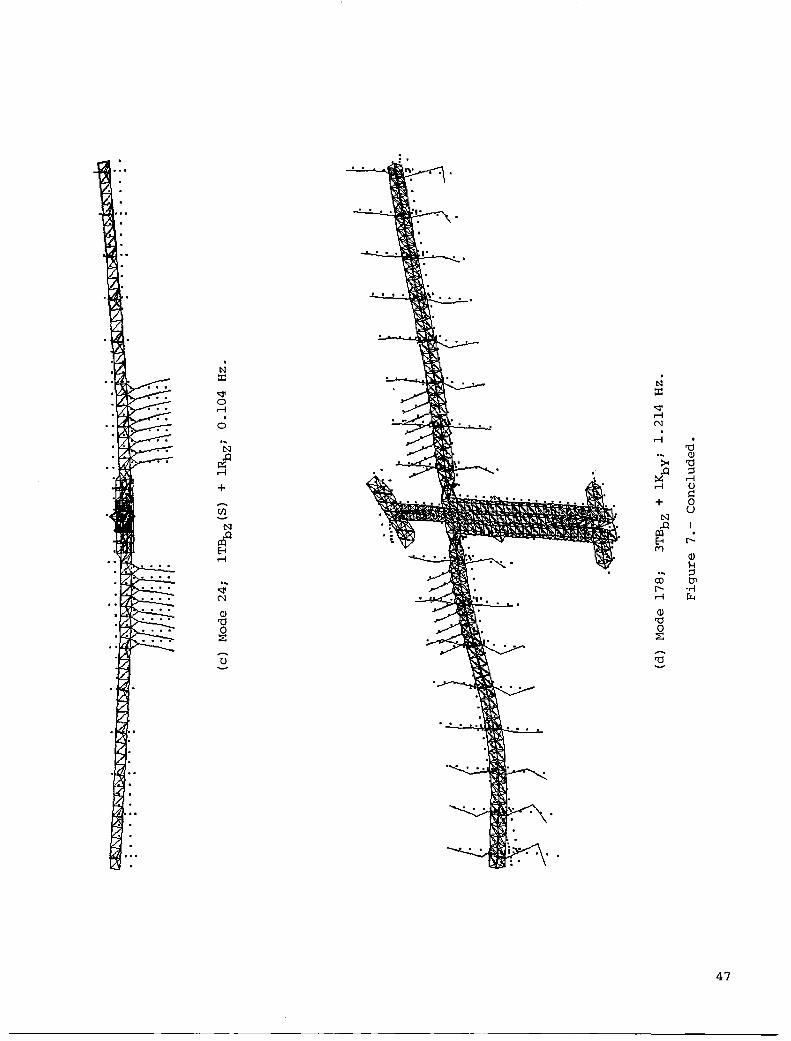
First-keel torsion at 0.270 Hz was the first structural mode for the IOC station. Because of the increased stiffness provided by the three-bay-wide keel, the frequency of this mode increases to 0.325 Hz (mode 57) for the l50-kW growth station. Since the longer transverse boom provides an increased moment of inertia, the firstkeel-torsion frequency falls to 0.294 Hz (mode 106) for the 300-kW station. Because of the difficulty in identifying some of the modes in the growth stations, and because the nature of some modes has changed from IOC, direct comparisons between the models is not always possible.' Tables III through V do show, however, that the lKbX mode decreased from 0.337 Hz in the IOC station to 0.302 Hz in the l50-kW station and that the lKbY mode decreased from 0.495 Hz in the IOC station to 0.358 Hz in the 300-kW station. The first structural mode for the l50-kW growth station (mode 55) has a higher frequency than the first structural mode (mode 31) for the IOC station. For the case of the 300-kW station, however, the firststructural mode (mode 23) is first transverse-boom bending about the X-axis and at 0.093 Hz is nestled among the radiator-bending modes. Representative mode shapes are shown for the 300-kW growth station in figures 7 (a) through 7 (d) .'
Many of the appendage modes which might exist on the actual space station were not generated by the finite-element models used here. For example, because of assumptions made in modeling the solar arrays, array torsion and array blanket modes could not be calculated. The radiators were modeled as one-piece beams, whereas, in reality, they would be built-up structures composed of many pieces (see the reference document). The aim here was to include the mass and inertia properties of the appendages, so that accurate structural modes would be calculated. It was felt that
9
the number and type of appendage modes generated were sufficient to study the desired response quantities for this study.
TRANSIENT RESPONSE RESULTS
Loading Conditions
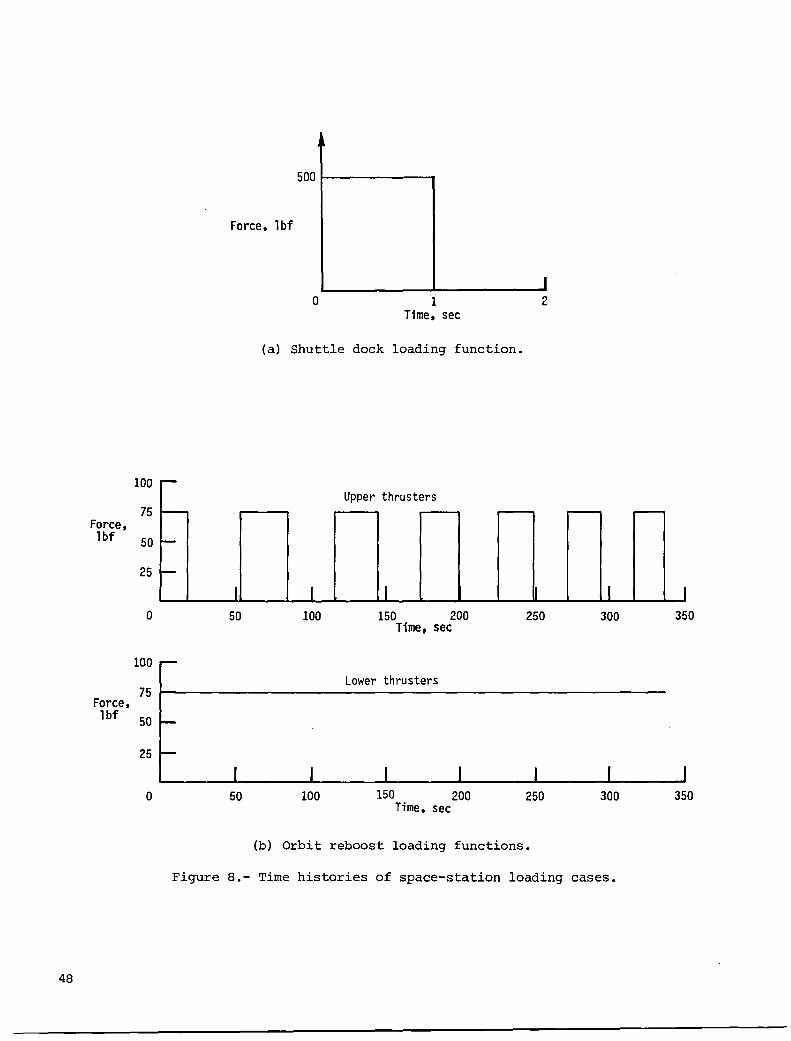
Three loading conditions were used as input for the space-station transient response studies. These conditions were shuttle dock, orbit reboost, and MRMS translation. The shuttle dock function is taken directly from the reference document and is a I-second, 500-lbf square pulse. (See fig. 8(a).) This force is applied at the docking port (located on a habitation module) in the negative X-direction. Since all response studies were conducted on stations without the orbiter attached, this could simulate a failed dock, in which the orbiter approached the station; made contact with the docking port, which would give the station the loading input; and failed in making the dock permanent, which would cause the station to respond without the attached orbiter mass.
In the orbit reboost maneuver, the four RCS thrusters (75 Ibf thrust each) are fired along the flight path (in the positive X-direction) to increase the orbital velocity and thus make up for altitude lost because of atmospheric drag. Since the upper and lower pairs of RCS thrusters are not located equidistant along the Z-axis from the space-station center of gravity, simultaneous firing of all four thrusters causes the station to rotate about its Y-axis. For the space station to maintain a 1 0 local vertical-attitude pointing requirement during reboost, the upper thrusters are fired continuously, and the lower thrusters are fired on and off with the time histories shown in figure 8(b). This thruster firing sequence is designed to maintain a 1 0 attitude constraint with a 0.05 0 hysteresis. (See reference document.) The actual orbit reboost maneuver would take several orbits to complete, but only 336 seconds were used for the studies done here. Although the reboost time history shown in figure 8(b) was derived for the IOC station based on its rigid-body dynamic characteristics, the same time history was used for transient response studies done on the 300-kW growth station.
The reboost firing sequence shown in figure 8(b) is different than that used in reference 3, because the lower thrusters are always on, and only the upper thrusters are cycled. In the orbit reboost maneuver described in reference 3, however, only one set of thrusters is on at anyone time. Thus, with the orbit reboost loading used here, twice as much force is being applied to the space station at certain times during the response. Therefore, results obtained using the two different loadings should not be directly compared.
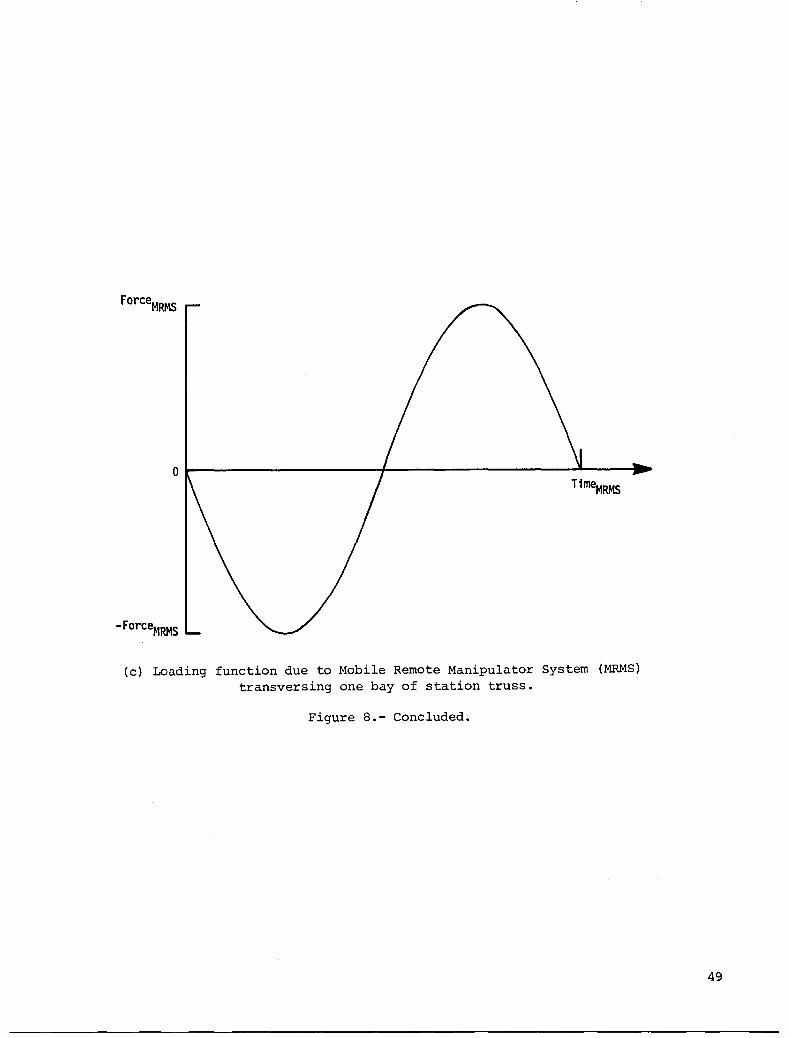
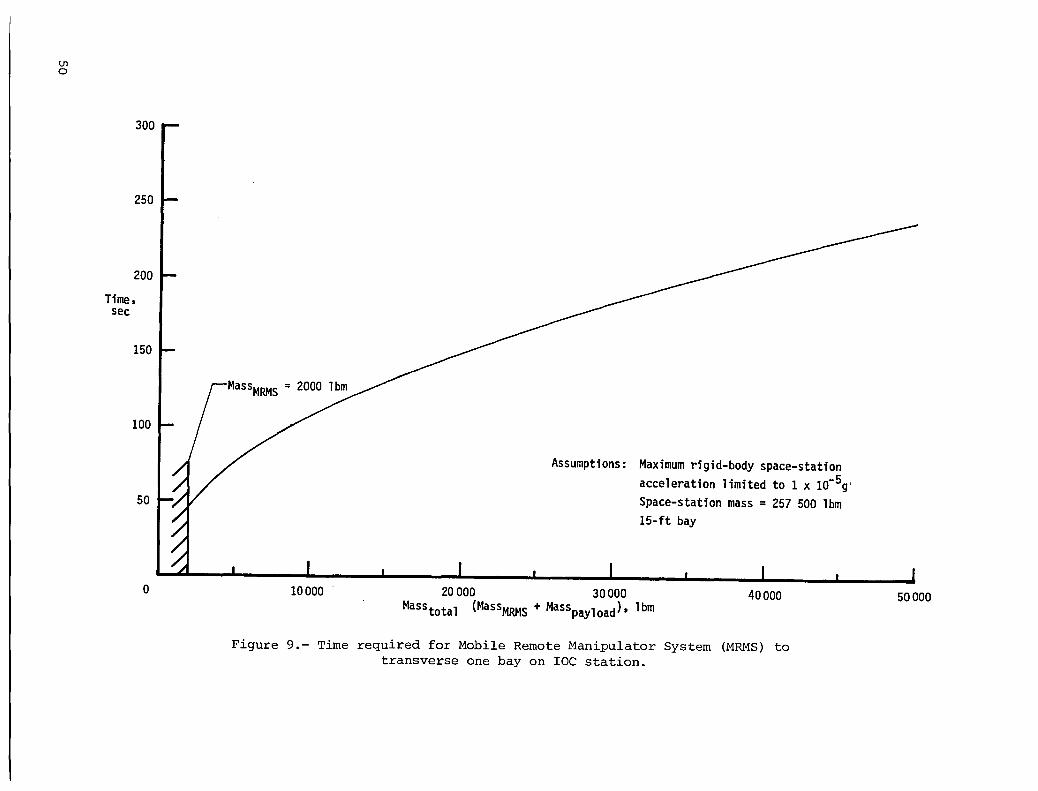
One of the operational demands that may be imposed on the space station is that it maintain a microgravity level less than or equal to 1 x 10⁻⁵g for many of the anticipated payloads. (lg = 386 in/sec2 .) On the IOC station, which has a mass of 257 000 Ibm, a force of 2.57 Ibf applied at the station center of gravity would give this maximum allowable acceleration; therefore, any net load on the IOC station during normal operations would have to be less than or equal to 2.57 Ibf. The MRMS loading function shown in figure 8(c) is based on an MRMS, such as that described in reference 9, using a push-pull drive mechanism for translation. Given that the maximum force applied by the MRMS (FMRMS ) to the IOC station is 2.57 Ibf, the period of the applied MRMS load (TMRMS ) is a function of the total MRMS mass. (See fig. 9.) For the case of an empty MRMS (which is assumed to have a mass of 2000 Ibm),
10
48 seconds are required to transverse one 15-ft bay. For the case of the MRMS with a 28 000 Ibm payload, the time to transverse one bay increases to 185 seconds.
IOC Space-Station Responses
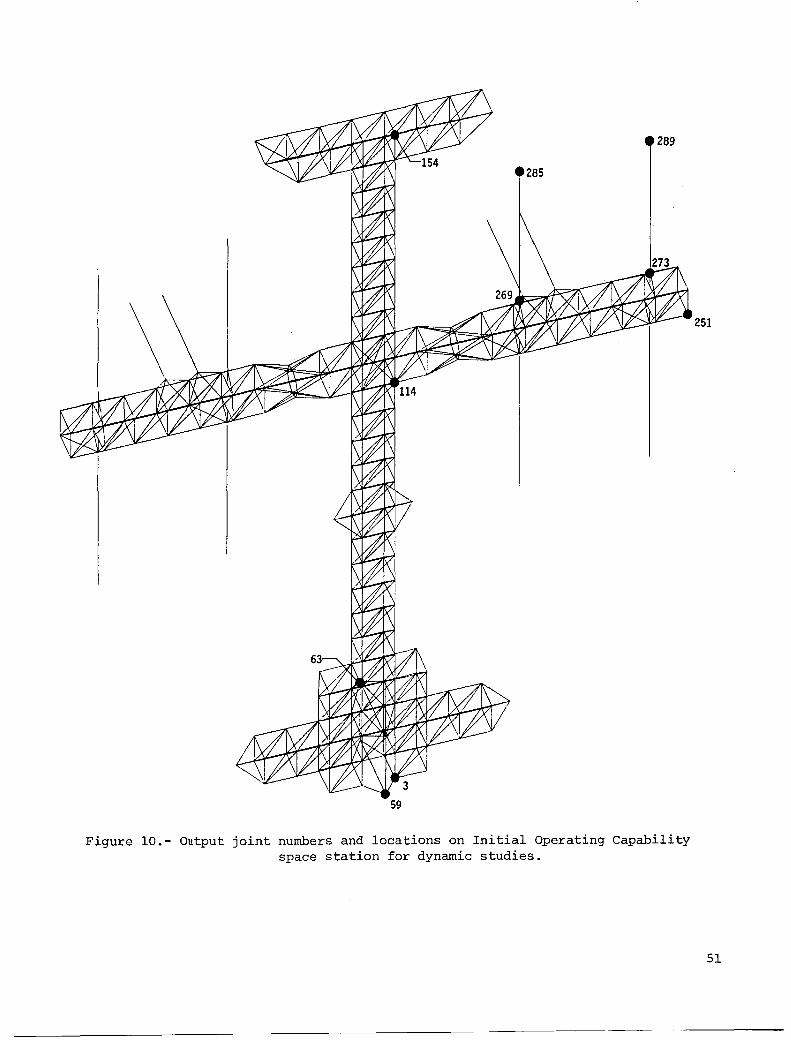
The four basic response quantities studied were displacements, accelerations, solar-array root-bending moments, and individual member loads. Figure 10 shows output locations on the IOC space station where the four types of quantities were measured. Joint 59, the location of the shuttle docking port, is at the intersection of habitation module 1 and habitation module 2 and is where the shuttle docking force is applied. Joint 63 is at the intersection of the two laboratory modules and is the location at which a microgravity environment is desirable. The three joints along the keel (3, 114, and 154) and the joint at the tip of the transverse boom (251) are used to monitor displacements of the space-station truss structure. The four joints on the solar arrays (269, 285, 273, and 289) are used to monitor array displacements and root-bending moments. For all transient response calculations, modes 1 through 70 were used and 0.5 percent damping was assumed for each mode.
Displacements
Both structural and appendage displacements were studied. In particular, for the solar arrays, the relative displacement between the base and the tip of the array due to shuttle dock and orbit reboost loads was measured. For the truss structure, relative displacements between the base of the keel and the keel/transverse-boom intersection, the base and top of the keel, and the keel/transverse-boom intersection and the tip of the transverse boom were measured. Again, these displacements were due to shuttle dock and orbit reboost. Since no displacement criteria currently exist for the space-station structure or its appendages, no assessment was made of the acceptability of the results. They are valuable, however, in that they give an indication of the amount and type of response which can be expected in the station.
The relative X-displacement between the root and the tip of the arrays is given in figure 11 for shuttle dock and in figure 12 for orbit reboost. For shuttle dock (fig. 11), the peak relative displacement is about 1.5 in. for both the inboard and outboard solar arrays and occurs for both arrays approximately 2 seconds after load application. For orbit reboost (fig. 12), the peak relative displacement increases to approximately 2.5 in. for both the inboard and outboard arrays and occurs about 225 seconds into the reboost firing. In both cases, the displacements are small compared with the 80-ft length of the solar arrays.
During some time periods in the responses shown in figure 12, the displacements are centered about zero; for other times, they are centered about a displacement of -0.75 in. The reason for this is found by comparing the response curves in figures 12(a) and 12(b) with the orbit reboost maneuver in figure 8(b). The displacements centered around a displacement of -0.75 in. coincide with both thrusters firing, while those centered about zero coincide with only the bottom thrusters firing.
The relative X-displacement due to shuttle dock and orbit reboost is shown for the base of the keel and the keel/transverse-boom intersection in figure 13, for the base and the top of the keel in figure 14, and for the keel/transverse-boom intersection and the tip of the port transverse boom in figure 15. The largest relative
11
structural displacement due to shuttle dock occurs between the base and the top of the keel and is approximately 0.6 in. (See fig. 14.) The maximum relative deflection between the keel/transverse-boom intersection and the tip of the transverse boom is only about 0.2 in. (fig. 15) for both the shuttle dock and the orbit reboost loading cases.
Accelerations at Laboratory Module
Accelerations due to shuttle dock, orbit reboost, and MRMS translation were measured at the laboratory module (joint 63 in fig. 10). In figure 16, the accelerations due to shuttle dock in the X-, Y-, and Z-directions at the laboratory module are shown. The largest acceleration occurs in the X-direction, at 1.0 second, and is -1.15 in/sec2 , or -3 x 10⁻³g • The accelerations due to the orbit reboost maneuver are shown in figure 17. The largest acceleration, at 0.9 in/sec2 , or 2.3 x 10⁻³ g , is again in the X-direction and is less than the maximum due to shuttle dock.
Figure 18 shows the X- and Z-accelerations, due to translation of the MRMS, measured at the laboratory module. In this case, the MRMS is on the second bay from the top of the keel and is pushing off in the negative Z-direction. The MRMS is assumed to carry a 30 000 Ibm payload and to apply a maximum force of 2.57 Ibf (derived previously from rigid-body considerations); the period of the force is approximately 191 seconds. The maximum acceleration at the laboratory module is ±3.86 x 10⁻³ in/sec2 , or 1.0 x 10⁻⁵g • Because of the large period of the MRMS loading input, no flexible-body modes were excited, and the acceleration response is purely rigid-body. (See fig. 18.)
Solar-Array Root Bending Moments
Solar-array root bending moments were measured at the base of the inboard (joint 269) and the outboard (joint 273) port-side arrays (see fig. 10) for both shuttle dock and orbit reboost. Since both the shuttle dock and the orbit reboost input forces are along the X-axis, any significant bending moment would be about the Y-axis for both arrays. The bending-moment time histories for the two solar arrays are shown in figure 19 for the case of shuttle dock. The peak moment of -2355 in-lb occurs at the root of the outboard solar array approximately 2 seconds into the response. The absolute value of this moment is only about half the peak moment of 4872 in-lb experienced at the root of an array for the IOC station with 9-ft bays. (See ref. 3.) The peak moment at the root of the inboard array (-2200 in-lb) was slightly less than that of the outboard solar array for the IOC station with 15-ft bays. The bending-moment time histories due to orbit reboost are shown in figure 20 for the two solar arrays. The peak bending moment caused by this maneuver is almost twice as large as that caused by shuttle dock for the two arrays; the peak occurs at -4430 in-lb for the outboard array and -4305 in-lb for the inboard array. Maximum absolute values of the IOC space-station response to docking and orbit reboost are summarized in table VI.
Maximum Allowable Load Due to Shuttle Dock
Currently, the loading inputs for the space station are not well defined. For the assumed shuttle docking load, for example, two questions which arise are as follows: (1) For the assumed load of 500 Ibf for 1 second, how close does the load
12
come to buckling a strut in the truss structure? (2) If the loading is not actually 1 second, but is 1/2 second or 2 seconds, what impact does that have on the amplitude of the force which can be applied with respect to truss strut buckling loads?
As a result of these questions, a study was done in which a unit rectangular pulse load was applied at the shuttle docking location, and the duration of the pulse was varied. The procedure described in reference 5 was followed; a transient response was performed for each load case, during which the maximum and minimum axial force was calculated in each truss strut. The strut which had the largest load relative to its Euler buckling load was then identified and defined to be the critical strut for each pulse duration. The allowable force for a given pulse duration was calculated to be that which would be required to buckle the critical member.
In figure 21, the allowable force which can be applied at the shuttle docking port (joint 59) is shown as a function of the rectangular pulse load duration. The shape of the loading function is the same as shown in figure 8(a) and defined in the sketch in figure 21. The critical member for all cases was a longeron at the base of the lower keel at the intersection of the keel and lower keel extension. The allowable-force magnitude drops off sharply as the pulse duration is increased from o to 1.0 second. Since a pulse of 1.0 second is half the period of the first-keel bending mode about the Y-axis (mode 33), this load duration should cause the greatest load in the truss members. Hence, a rectangular pulse load of this duration would have the smallest allowable-force magnitude (fig. 21) and is approximately 1800 lbf. For pulses longer than 1.0 second, the allowable-force magnitude remains constant at 1800 lbf. By examining figure 21, the two questions posed at the beginning of this section can be answered. First, the shuttle docking load as currently defined causes the load in the critical truss strut to reach 28 percent of its Euler buckling value. Second, if the shuttle force magnitude is correct at 500 lbf, changing its duration will not have an effect on the severity of loads experienced in the truss structure. In fact, for shorter pulse durations, higher docking loads could be absorbed by the truss structure.
300-kW Growth Space-Station Responses
A growth space station which generated 300 kW of power using photovoltaic arrays is anticipated to be a worst-case growth scenario in terms of the effect of increased transverse-boom flexibility on the overall space-station stiffness. It is desirable to determine whether a reduction in performance would occur in the 300-kW growth station compared with the IOC station. Although the growth station has transverse booms which are four times as long as the IOC station, it also has a stiffer three-bay keel and over twice the mass; thus, the increased stiffness of the threebay keel and the greater mass could conceivably compensate for the increased flexibility of the transverse booms.
In figure 22, output locations where displacements and solar-array root bending moments were measured are shown for the 300-kW growth station. The shuttle docking port is now located at the bottom of the second module racetrack at joint 19. The three joints on the keel (33, 201, and 246) and the one at the tip of the transverse boom (527) are used to monitor displacements of the truss structure. The joints at the bases of the eight solar arrays (539, 557, 575, 593, 611, 629, 647, and 665) are used to monitor root bending moments. For all transient response calculations, modes 1 through 200 were used and 0.5-percent damping was assumed for each mode.
13
Displacements
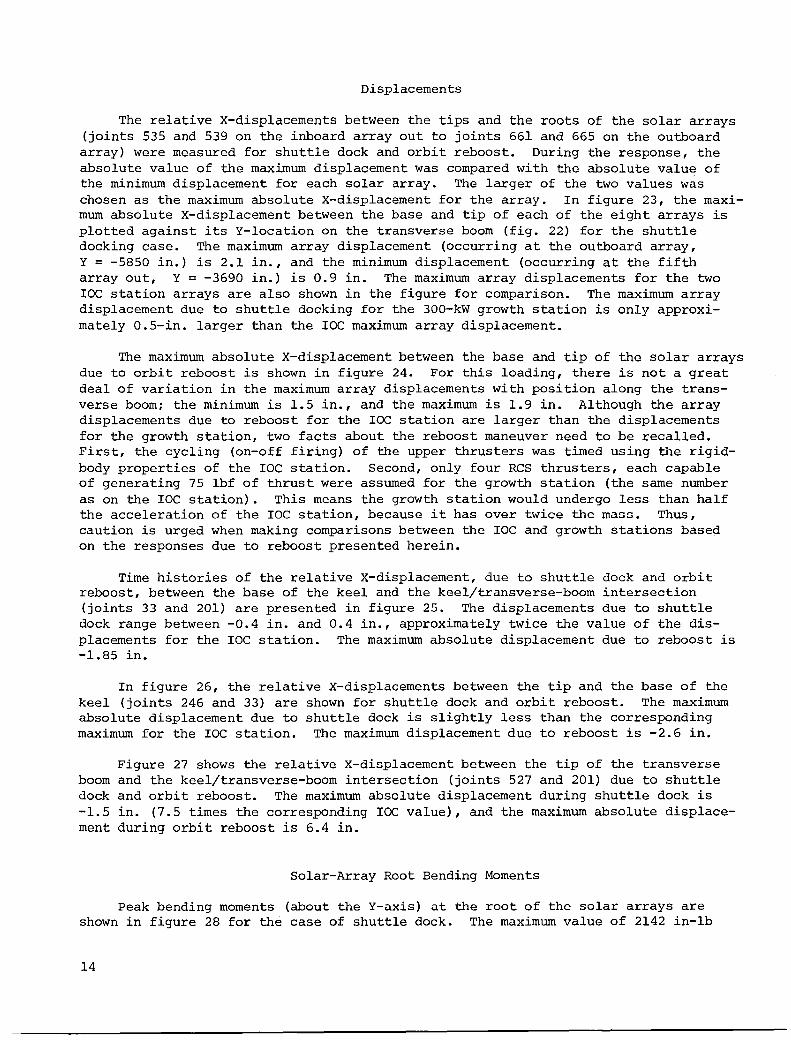
The relative X-displacements between the tips and the roots of the solar arrays (joints 535 and 539 on the inboard array out to joints 661 and 665 on the outboard array) were measured for shuttle dock and orbit reboost. During the response, the absolute value of the maximum displacement was compared with the absolute value of the minimum displacement for each solar array. The larger of the two values was chosen as the maximum absolute X-displacement for the array. rn figure 23, the maximum absolute X-displacement between the base and tip of each of the eight arrays is plotted against its Y-location on the transverse boom (fig. 22) for the shuttle docking case. The maximum array displacement (occurring at the outboard array, Y = -5850 in.) is 2.1 in., and the minimum displacement (occurring at the fifth array out, Y = -3690 in.) is 0.9 in. The maximum array displacements for the two roc station arrays are also shown in the figure for comparison. The maximum array displacement due to shuttle docking for the 300-kW growth station is only approximately 0.5-in. larger than the roc maximum array displacement.
The maximum absolute X-displacement between the base and tip of the solar arrays due to orbit reboost is shown in figure 24. For this loading, there is not a great deal of variation in the maximum array displacements with position along the transverse boomi the minimum is 1.5 in., and the maximum is 1.9 in. Although the array displacements due to reboost for the roc station are larger than the displacements for the growth station, two facts about the reboost maneuver need to be recalled. First, the cycling (on-off firing) of the upper thrusters was timed using the rigidbody properties of the roc station. Second, only four Res thrusters, each capable of generating 75 lbf of thrust were assumed for the growth station (the same number as on the roc station). This means the growth station would undergo less than half the acceleration of the roc station, because it has over twice the mass. Thus, caution is urged when making comparisons between the roc and growth stations based on the responses due to reboost presented herein.
Time histories of the relative X-displacement, due to shuttle dock and orbit reboost, between the base of the keel and the keel/transverse-boom intersection (joints 33 and 201) are presented in figure 25. The displacements due to shuttle dock range between -0.4 in. and 0.4 in., approximately twice the value of the displacements for the roc station. The maximum absolute displacement due to reboost is -1.85 in.
rn figure 26, the relative X-displacements between the tip and the base of the keel (joints 246 and 33) are shown for shuttle dock and orbit reboost. The maximum absolute displacement due to shuttle dock is slightly less than the corresponding maximum for the roc station. The maximum displacement due to reboost is -2.6 in.
Figure 27 shows the relative X-displacement between the tip of the transverse boom and the keel/transverse-boom intersection (joints 527 and 201) due to shuttle dock and orbit reboost. The maximum absolute displacement during shuttle dock is -1.5 in. (7.5 times the corresponding roc value), and the maximum absolute displacement during orbit reboost is 6.4 in.
Solar-Array Root Bending Moments
Peak bending moments (about the Y-axis) at the root of the solar arrays are shown in figure 28 for the case of shuttle dock. The maximum value of 2142 in-lb
14
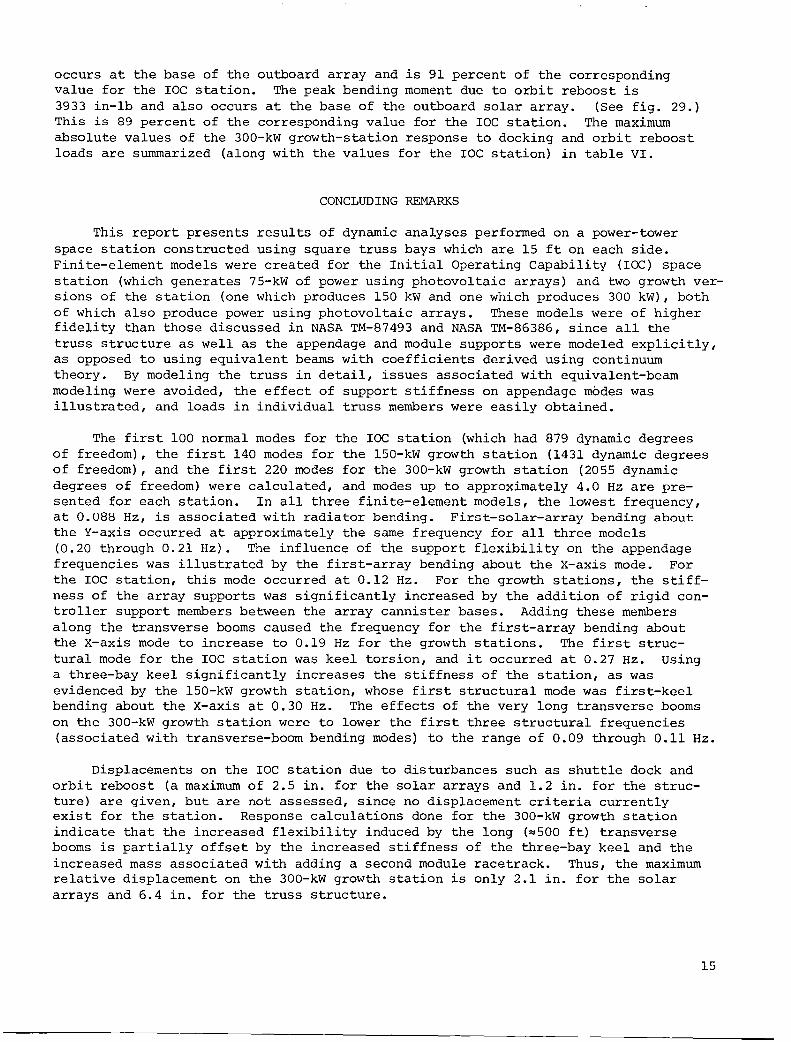
occurs at the base of the outboard array and is 91 percent of the corresponding value for the IOC station. The peak bending moment due to orbit reboost is 3933 in-lb and also occurs at the base of the outboard solar array. (See fig. 29.) This is 89 percent of the corresponding value for the IOC station. The maximum absolute values of the 300-kW growth-station response to docking and orbit reboost loads are summarized (along with the values for the IOC station) in table VI.
CONCLUDING REMARKS
This report presents results of dynamic analyses performed on a power-tower space station constructed using square truss bays which are 15 ft on each side. Finite-element models were created for the Initial Operating Capability (IOC) space station (which generates 75-kW of power using photovoltaic arrays) and two growth versions of the station (one which produces 150 kW and one which produces 300 kW), both of which also produce power using photovoltaic arrays. These models were of higher fidelity than those discussed in NASA TM-87493 and NASA TM-86386, since all the truss structure as well as the appendage and module supports were modeled explicitly, as opposed to using equivalent beams with coefficients derived using continuum theory. By modeling the truss in detail, issues associated with equivalent-beam modeling were avoided, the effect of support stiffness on appendage modes was illustrated, and loads in individual truss members were easily obtained.
The first 100 normal modes for the IOC station (which had 879 dynamic degrees of freedom), the first 140 modes for the l50-kW growth station (1431 dynamic degrees of freedom), and the first 220 modes for the 300-kW growth station (2055 dynamic degrees of freedom) were calculated, and modes up to approximately 4.0 Hz are presented for each station. In all three finite-element models, the lowest frequency, at 0.088 HZ, is associated with radiator bending. First-solar-array bending about the Y-axis occurred at approximately the same frequency for all three models (0.20 through 0.21 Hz). The influence of the support flexibility on the appendage frequencies was illustrated by the first-array bending about the X-axis mode. For the IOC station, this mode occurred at 0.12 Hz. For the growth stations, the stiffness of the array supports was significantly increased by the addition of rigid controller support members between the array cannister bases. Adding these members along the transverse booms caused the frequency for the first-array bending about the X-axis mode to increase to 0.19 Hz for the growth stations. The first structural mode for the IOC station was keel torsion, and it occurred at 0.27 Hz. Using a three-bay keel significantly increases the stiffness of the station, as was evidenced by the l50-kW growth station, whose first structural mode was first-keel bending about the X-axis at 0.30 Hz. The effects of the very long transverse booms on the 300-kW growth station were to lower the first three structural frequencies (associated with transverse-boom bending modes) to the range of 0.09 through 0.11 Hz.
Displacements on the IOC station due to disturbances such as shuttle dock and orbit reboost (a maximum of 2.5 in. for the solar arrays and 1.2 in. for the structure) are given, but are not assessed, since no displacement criteria currently exist for the station. Response calculations done for the 300-kW growth station indicate that the increased flexibility induced by the long (~500 ft) transverse booms is partially offset by the increased stiffness of the three-bay keel and the increased mass associated with adding a second module racetrack. Thus, the maximum relative displacement on the 300-kW growth station is only 2.1 in. for the solar arrays and 6.4 in. for the truss structure.
15
Space-station accelerations may pose a problem, however, if the desire to maintain an acceleration level of I x 10-5 g or less at the laboratory modules during normal space-station operations is strictly enforced. This implies that all forces applied to the IOC station have to be less than 2.6 lbf (based on an IOC station mass of 257 000 Ibm). Accelerations at the laboratory module due to shuttle dock and orbit reboost are over two orders of magnitude greater than I x 10-5g • A requirement of I x 10-5g might limit Mobile Remote Manipulator System (MRMS) operations, both the speed at which it could move about the station and the rate at which it could move payloads while stationary. Even assumed astronaut crew motion inside the habitation modules (NASA TM-87493 and NASA TM-86386) would cause the acceleration requirement to be violated. Locating payloads with very small microgravity requirements on a load isolation system as described in NASA TM-86386 seems to be a more practical method of maintaining a microgravity requirement than imposing the requirement on the whole laboratory module.
Bending moments at the base of the solar arrays due to shuttle dock and orbit reboost are 2355 in-Ib and 4430 in-Ib, respectively, for the IOC station. For the 300-kW growth station, the peak bending moments at the root of the solar arrays due to shuttle dock and orbit reboost are 2142 in-1b and 3933 in-Ib, respectively. These values are well within the 41 760 in-lb bending strength of the array mast given in NASA TM-86386.
A worst-case scenario for space-station growth was initially thought to be a station generating 300 kW of power using photovoltaic arrays. However, analysis showed that this scenario did not produce any significant degradation in measured response to the anticipated loadings when compared with the IOC station. There was some increase in deflections. The greatest increase, due to orbit reboost, was 6.4 in. at the tip of the transverse boom. Peak bending moments, measured at the roots of the solar arrays, due to shuttle dock and orbit reboost were actually smaller than the corresponding values on the IOC station.
NASA Langley Research Center Hampton, VA 23666-5225 April 14, 1986
16
APPENDIX A
STRAIN ENERGY DISTRIBUTION IN IOC SPACE-STATION EIGENVECTORS
Percent of total energy for mode -
Component 7 8 9 10 11 12 13 14 15 16
Astromast supports 66.3 67.4 67.9 67.9 67.9 67.8 Astromasts 31.2 31. 7 31.9 31.9 31.9 31.9 Radiator supports 53.9 54.4 54.4 54.0 Radiators 45.2 45.6 45.6 45.3 Lower keel extension Keel + upper boom Transverse boom
Percent of total energy for mode -
Component 17 18 19 20 21 22 23 24 25 26
Astromast supports 67.9 27.0 40.9 Astromasts 31.9 12.9 19.5 87.7 92.7 98.4 98.6 Radiator supports 99.4 99.9 99.8 59.9 39.4 Radiators LoWer keel extension Keel + upper boom 5.6 Transverse boom 5.6 6.0
-
Percent of total energy for mode -
Component 27 28 29 30 31 32 33 34 35 36
Astromast supports 12.5 Astromasts 99.1 99.4 77.2 98.3 24.0 1.3 2.4 4.1 5.0 87.3 Radiator supports Radiators Lower keel extension 2.8 21.6 6.1 25.5 Keel + upper boom 20.7 70.3 82.1 74.4 26.0 46.2 Transverse boom 9.3 62.2 22.0
17
APPENDIX A - Continued
Percent of total energy for mode -
Component 37 38 39 40 41 42 43 44 45 46
Astromast supports 12.5 12.6 12.6 12.6 12.6 12.1 13.1 Astromasts 87.3 87.3 87.3 87.4 87.0 79.5 82.6 21. 7 85.5 83.6 Radiator supports Radiators Lower keel extension 2.8 Keel + upper boom 4.4 2.1 46.7 2.9 Transverse boom 3.3 26.4 12.0 12.1
Percent of total energy for mode -
I Component 47 48 49 50 51 52 53 54 55 56
Astromast supports 2.4 Astromasts 94.5 97.8 96.1 96.2 95.6 85.7 3.0 4.0 7.6 16.8 Radiator supports 3.7 Radiators Lower keel extension 4.7 Keel + upper boom 2.6 1.9 2.0 3.2 11.8 81.6 75.6 44.7 20.7 Transverse boom 13.5 18.9 41.0 54.2
Percent of total energy for mode -
Component 57 58 59 60 61 62 63 64 65 66
Astromast supports 2.9 6.4 4.7 Ill. 2 19.2 17.8 18.4 19.9 20.0 5.4 Astromasts 17.0 12.2 11.1 38.0 74.2 67.2 71.5 77 .8 78.5 21.5 Radiator supports 3.9 I Radiators Lower keel extension 13.0 21.8 22.0 4.4 22.1 Keel + upper boom 5.2 30.8 28.7 16.9 5.7 3.0 26.7 Transverse boom 70.4 36.5 32.7 11.5 3.8 3.1 4.2 23.0
18
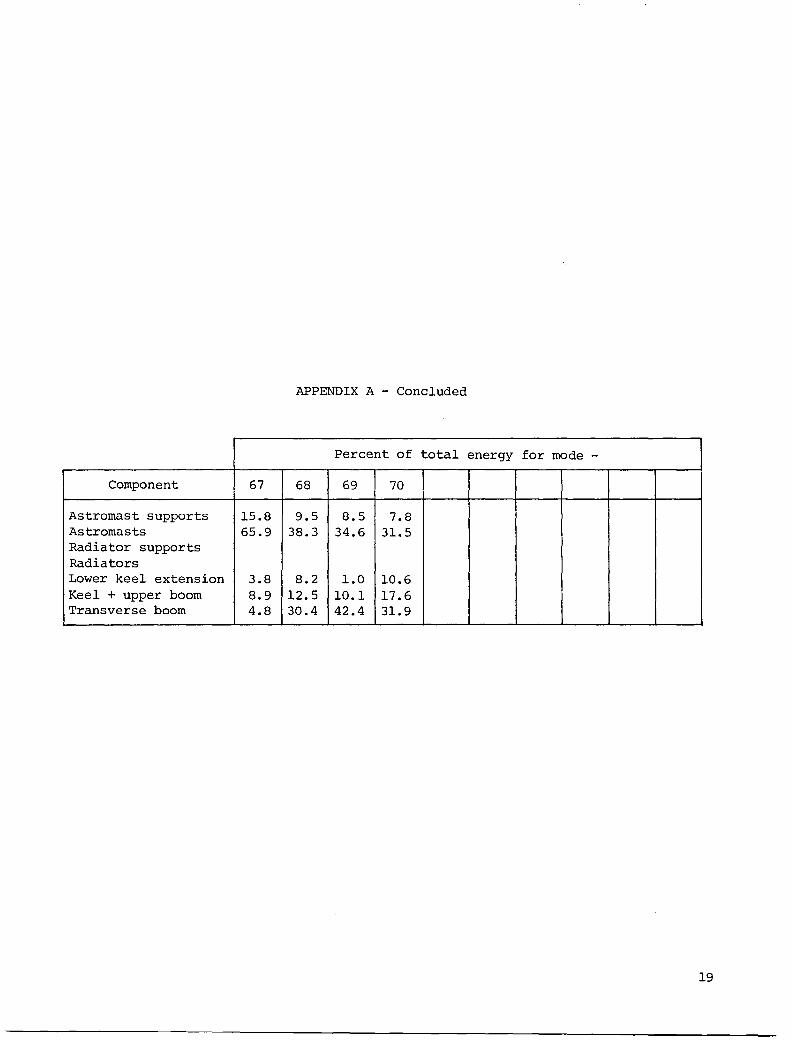
APPENDIX A - Concluded
Percent of total energy for mode -
Component 67 68 69 70
Astromast supports 15.8 9.5 8.5 7.8 Astromasts 65.9 38.3 34.6 31. 5 Radiator supports Radiators Lower keel extension 3.8 8.2 1.0 10.6 Keel + upper boom 8.9 12.5 10.1 17.6 Transverse boom 4.8 30.4 42.4 31.9
19
APPENDIX B
STRAIN ENERGY DISTRIBUTION IN 150-kW GROWTH-STATION EIGENVECTORS
Percent of total energy for mode -
Component 7 8 9 10 11 12 13 14 15 16
Astromast supports Astromasts Radiator supports 53.9 54.3 54.3 54.4 54.4 54.4 54.4 53.8 99.2 99.9 Radiators 45.1 45.5 45.5 45.6 45.6 45.6 45.6 45.1 Lower keel Upper keel + upper boom Transverse boom Modules
Percent of total energy for mode -
Component 17 18 19 20 21 22 23 24 25 26
Astromast supports l4.5 14.5 As tromasts 77.7 80.9 83.5 83.5 Radiator supports 99.9 99.9 99.9 99.9 99.9 98.7 1.3 1.4 Radiators Lower keel 5.2 1.5 Upper keel + upper boom Transverse boom 14.6 15.3 Modules
Percent of total energy for mode -
Component 27 28 29 30 31 32 33 34 35 36
Astromast supports 14.5 14.5 14.5 14.5 14.5 6.7 1.3 1.2 Astromasts 83.5 83.5 83.5 83.5 83.5 78.8 85.0 90.0 95.4 96.6 Radiator supports Radiators Lower keel 4.8 2.4 2.1 Upper keel + upper boom Transverse boom 8.2 10.5 7.7 2.1 1.9 Modules
20
APPENDIX B - Continued
Percent of total energy for mode -
Component 37 38 39 40 41 42 43 44 45 46
Astromast supports 2.1 1.3 1.6 1.5 1.6 1.6 Astromasts 95.5 97.2 97.5 97.6 97.7 97.7 98.4 98.5 98.4 98.8 Radiator supports Radiators Lower keel Upper keel + upper boom Transverse boom 1.5 Modules
Percent of total energy for mode -
Component 47 48 49 50 51 52 53 54 55 56
Astromast supports 6.4 1.5 Astromasts 98.9 90.9 99.3 99.4 99.4 99.4 95.4 93.2 14.4 13.6 Radiator supports Radiators Lower keel 2.6 4.5 41.5 22.0 Upper keel + upper boom Transverse boom 1.1 40.8 61.6 Modules
Percent of total energy for mode -
Component 57 58 59 60 61 62 63 64 65 66
Astromast supports 9.6 9.7 9.7 Astromasts 10.7 7.8 9.9 3.2 65.7 70.6 55.1 88.7 88.9 88.9 Radiator supports 2.1 1.9 Radiators Lower keel 79.8 64.9 48.4 79.8 6.6 2.5 6.3 Upper keel + upper boom 2.4 3.0 1.6 Transverse boom 8.2 25.9 38.0 11.8 24.4 23.6 35.9 Modules 1.5
21
APPENDIX B - Continued
Percent of total energy for mode -
Component 67 68 69 70 71 72 73 74 75 76
Astromast supports 9.7 9.7 9.7 9.7 7.4 1.6 1.7 Astromasts 88.9 88.9 88.9 88.9 80.8 73.9 87.9 88.2 92.7 88.6 Radiator supports Radiators Lower keel 8.1 2.0 2.2 1.2 2.3 Upper keel + upper boom 2.7 7.7 1.5 3.8 Transverse boom 4.7 7.1 7.3 5.1 4.0 3.7 Modules
Percent of total energy for mode -
Component 77 78 79 80 81 82 83 84 85 86
Astromast supports 1.1 1.3 Astromasts 97.1 97.4 97.6 97.7 97.8 97.8 97.9 97.9 98.0 98.1 Radiator supports Radiators Lower keel Upper keel + upper boom Transverse boom 1.3 1.1 Modules
Percent of total energy for mode -
Component 87 88 89 90 91 92 93 94 95 96
Astromast supports 2.7 Astromasts 98.4 95.7 99.1 96.5 93.5 77 .9 21.2 50.3 12.5 47.9 Radiator supports Radiators Lower keel 1.2 1.5 8.5 18.3 19.5 13.3 4.7 Upper keel + upper boom 1.9 1.6 2.2 10.7 56.4 20.6 12.0 5.1 Transverse boom 2.1 2.0 2.1 7.8 57.4 41.2 Modules
22
APPENDIX B - Concluded
Percent of total energy for mode -
Component 97 98 99 100 101 102 103 104 105 106
Astromast supports 2.9 2.4 3.2 Astromasts 11. 7 3.0 8.2 32.4 32.3 1.9 2.4 2.8 Radiator supports 4.1 4.8 1.2 Radiators Lower keel 15.0 10.2 27.3 7.2 7.1 74.0 7.6 35.1 30.6 6.7 Upper keel + upper boom 1.4 76.0 6.1 7.9 1.1 4.8 Transverse boom 66.5 10.2 62.4 49.0 53.3 14.8 86.0 47.6 61.4 4.6 Modules 1.5 6.4 87.5
23
APPENDIX C
STRAIN ENERGY DISTRIBUTION IN 300-kW GROWTH-STATION EIGENVECTORS
Percent of total energy for mode -
Component 7 8 9 10 11 12 13 14 15 16
Astromast supports Astromasts Radiator supports 44.1 52.8 54.2 53.6 54.4 54.3 54.4 54.3 54.4 54.4 Radiators 36.7 43.9 45.6 44.8 45.6 45.6 45.6 45.6 45.6 45.6 Lower keel 3.3 Upper keel + upper boom Transverse boom 15.1 2.5 Modules
Percent of total energy for mode -
Component 17 18 19 20 21 22 23 24 25 26
Astromast supports 2.8 2.1 As tromasts 1.2 9.2 2.5 Radiator supports 54.4 54.4 54.4 54.4 54.4 54.2 9.5 11.2 23.1 99.8 Radiators 45.6 45.6 45.6 45.6 45.6 45.5 7.5 1.3 Lower keel 10.4 9.7 17.4 Upper keel + upper boom Transverse boom 68.1 67.6 53.8 Modules
Percent of total energy for mode -
Component 27 28 29 30 31 32 33 34 35 36
Astromast supports Astromasts Radiator supports 99.8 99.9 99.9 99.9 99.9 99.9 99.9 99.9 99.9 99.9 Radiators Lower keel Upper keel + upper boom Transverse boom Modules
24
APPENDIX C - Continued
Percent of total energy for mode -
Component 37 38 39 40 41 42 43 44 45 46
Astromast supports 14.5 14.4 Astromasts 2.0 3.9 51.2 55.9 71.8 83.4 83.4 Radiator supports 99.9 100 100 90.6 75.7 3.9 3.2 Radiators Lower keel 4.2 6.5 2.0 Upper keel + upper boom Transverse boom 6.0 14.8 37.2 37.7 26.3 Modules
Percent of total energy for mode -
Component 47 48 49 50 51 52 53 54 55 56
Astromast supports 14.5 14.5 14.5 14.5 14.5 14.5 14.5 14.5 14.5 14.5 Astromasts 83.5 83.5 83.5 83.5 83.5 83.5 83.5 83.5 83.5 83.5 Radiator supports Radiators Lower keel Upper keel + upper boom Transverse boom Modules
Percent of total energy for mode -
Component 57 58 59 60 61 62 63 64 65 66
Astromast supports 14.5 14.5 14.5 3.2 1.4 1.7 Astromasts 83.5 83.5 83.5 88.7 90.2 90.4 93.4 95.5 95.8 96.4 Radiator supports Radiators Lower keel 1.7 Upper keel + upper boom Transverse boom 8.4 8.3 4.6 3.6 3.2 3.1 1.2 Modules
25
APPENDIX C - Continued
Percent of total energy for mode -
Component 67 68 69 70 71 72 73 74 75 76
Astromast supports 1.4 1.2 1.3 1.4 1.5 1.6 1.5 1.6 1.6 Astromasts 96.6 97.0 97.2 97.4 97.5 97.6 97.7 97.6 97.7 97.7 Radiator supports Radiators Lower keel Upper keel + upper boom Transverse boom 2.3 1.0 Modules
Percent of total energy for mode -
Component 77 78 79 80 81 82 83 84 85 86
Astromast supports 1.6 1.6 Astromasts 97.8 97.8 97.8 97.8 98.3 98.3 98.4 98.6 98.6 98.8 Radiator supports Radiators Lower keel Upper keel + upper boom Transverse boom 1.1 1.1 1.0 1.2 Modules
Percent of total energy for mode -
Component 87 88 89 90 91 92 93 94 95 96
Astromast supports 4.4 Astromasts 98.8 99.0 99.0 99.0 99.1 94.3 99.3 99.4 99.4 99.4 Radiator supports Radiators Lower keel Upper keel + upper boom Transverse boom Modules
26
APPENDIX C - Continued
Percent of total energy for mode -
Component 97 98 99 100 101 102 103 104 105 106
Astromast supports 1.5 8.1 4.3 Astromasts 99.4 99.4 99.5 99.5 96.1 83.7 97.1 85.9 87.0 33.0 Radiator supports Radiators Lower keel 2.3 1.5 4.3 42.8 Upper keel + upper boom Transverse boom 3.6 8.2 8.0 23.1 Modules
Percent of total energy for mode -
Component 107 108 109 110 111 112 113 114 115 116
Astromast supports 2.3 2.4 As tromasts 15.2 6.4 4.3 6.0 14.9 65.8 60.8 4.0 57.0 68.8 Radiator supports 2.8 2.7 Radiators Lower keel 43.4 26.3 71.0 16.6 20.8 2.7 5.1 80.5 2.1 5.8 Upper keel + upper boom 4.1 1.6 3.5 Transverse boom 39.6 63.3 23.3 73.7 .58.7 27.8 30.1 1l.5 39.1 20.7 Modules 1.6
Percent of total energy for mode -
Component 117 118 119 120 121 122 123 124 125 126
Astromast supports 9.3 9.5 8.5 8.4 9.7 9.7 9.7 9.7 9.7 Astromasts 70.4 87.9 88.5 85.7 85.4 88.8 88.8 88.9 88.9 88.9 Radiator supports Radiators Lower keel 2.9 Upper keel + upper boom Transverse boom 24.1 1.2 2.9 3.2 Modules
27
APPENDIX C - Continued
Percent of total energy for mode -
Component 127 128 129 130 131 132 133 134 135 136
Astromast supports 9.7 9.7 9.7 9.7 9.7 9.7 3.4 3.3 5.3 Astromasts 88.9 88.9 88.9 88.9 88.9 88.9 71.6 79.5 81.4 84.4 Radiator supports Radiators Lower keel 4.7 1.9 1.2 1.4 Upper keel + upper boom 3.2 3.1 1.1 Transverse boom 15.2 10.1 15.0 5.9 Modules
Percent of total energy for mode -
Component 137 138 139 140 141 142 143 144 145 146
Astromast supports 1.1 Astromasts 90.7 90.8 95.4 96.2 94.8 96.5 96.6 97.0 95.9 97.2 Radiator supports Radiators Lower keel Upper keel + upper boom Transverse boom 6.4 6.3 2.8 2.8 3.3 1.6 1.8 1.4 1.8 1.0 Modules
Percent of total energy for mode -
Component 147 148 149 150 151 152 153 154 155 156
Astromast supports 1.1 1.0 1.2 1.2 1.2 1.3 As tromasts 97.3 96.7 97.6 97.7 97.7 97.7 97.8 97.2 98.0 97.7 Radiator supports Radiators Lower keel Upper keel + upper boom Transverse boom 1.1 Modules
28
APPENDIX C - Continued
Percent of total energy for mode -
Component 157 158 159 160 161 162 163 164 165 166
Astromast supports 1.2 1.1 Astromasts 98.0 98.1 98.2 98.3 98.2 98.3 98.4 97.7 97.0 97.8 Radiator supports Radiators Lower keel Upper keel + upper boom 1.0 Transverse boom 1.1 1.1 1.0 Modules
Percent of total energy for mode -
Component 167 168 169 170 171 172 173 174 175 176
Astromast supports As tromasts 98.9 97.6 99.1 98.0 99.2 97.7 98.3 93.9 21.3 82.6 Radiator supports Radiators Lower keel 1.9 17.1 5.6 Upper keel + upper boom 2.4 51.2 5.5 Transverse boom 1.1 8.2 4.9 Modules
Percent of total energy for mode -.
Component 177 178 179 180 181 182 183 184 185 186
Astromast supports 1.4 2.8 3.1 Astromasts 97.7 46.6 29.9 26.5 41.1 5.0 24.5 47.0 41.1 3.8 Radiator supports 1.4 4.3 3.6 1.2 Radiators Lower keel 8.3 5.5 15.0 4.4 9.6 12.7 4.6 4.3 6.5 Upper keel + upper boom 12.4 3.3 26.4 5.5 73.4 4.4 3.8 1.2 Transverse boom 1.0 30.2 56.9 29.9 47.6 10.6 59.2 38.5 45.9 83.6 Modules
29
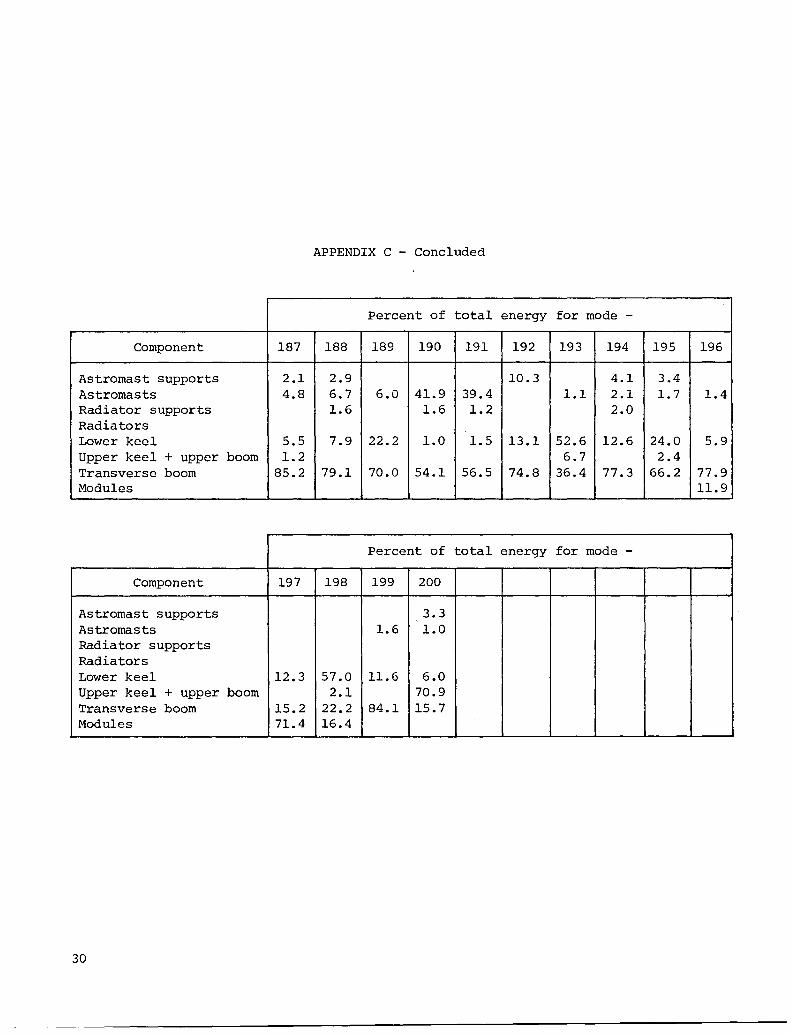
APPENDIX C - Concluded
Percent of total energy for mode -
Component 187 188 189 190 191 192 193 194 195 196
Astromast supports 2.1 2.9 10.3 4.1 3.4 Astromasts 4.8 6.7 6.0 41.9 39.4 1.1 2.1 1.7 1.4 Radiator supports 1.6 1.6 1.2 2.0 Radiators Lower keel 5.5 7.9 22.2 1.0 1.5 13.1 52.6 12.6 24.0 5.9 Upper keel + upper boom 1.2 6.7 2.4 Transverse boom 85.2 79.1 70.0 54.1 56.5 74.8 36.4 77.3 66.2 77.9 Modules 11.9
Percent of total energy for mode -
Component 197 198 199 200
Astromast supports 3.3 Astromasts 1.6 1.0 Radiator supports Radiators Lower keel 12.3 57.0 11.6 6.0 Upper keel + upper boom 2.1 70.9 Transverse boom 15.2 22.2 84.1 15.7 Modules 71.4 16.4
30
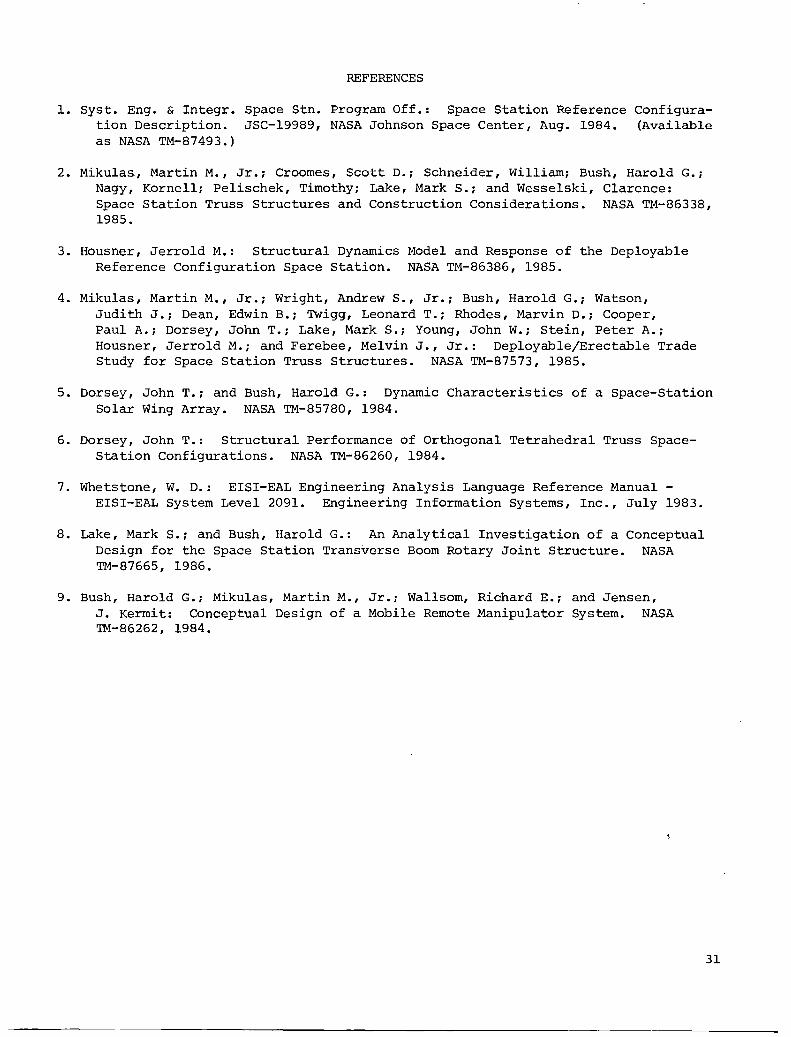
REFERENCES
1. Syst. Eng. & Integr. Space Stn. Program Off.: Space Station Reference Configuration Description. JSC-19989, NASA Johnson Space Center, Aug. 1984. (Available as NASA TM-87493.)
2. Mikulas, Martin M., Jr.; Croomes, Scott D.; Schneider, William; Bush, Harold G.; Nagy, Kornell; Pelischek, Timothy; Lake, Mark S.; and Wesselski, Clarence: Space Station Truss Structures and Construction Considerations. NASA TM-86338, 1985.
3. Housner, Jerrold M.: Structural Dynamics Model and Response of the Deployable Reference Configuration Space Station. NASA TM-86386, 1985.
4. Mikulas, Martin M., Jr.; Wright, AndrewS., Jr.; Bush, Harold G.; Watson, Judith J.; Dean, Edwin B.; Twigg, Leonard T.; Rhodes, Marvin D.; Cooper, Paul A.; Dorsey, John T.; Lake, Mark S.; Young, John W.; Stein, Peter A.; Housner, Jerrold M.; and Ferebee, Melvin J., Jr.: Deployable/Erectable Trade Study for Space Station Truss Structures. NASA TM-87573, 1985.
5. Dorsey, John T.; and Bush, Harold G.: Dynamic Characteristics of a Space-Station Solar Wing Array. NASA TM-85780, 1984.
6. Dorsey, John T.: Structural Performance of Orthogonal Tetrahedral Truss SpaceStation Configurations. NASA TM-86260, 1984.
7. Whetstone, W. D.: EISI-EAL Engineering Analysis Language Reference Manual -EISI-EAL System Level 2091. Engineering Information Systems, Inc., July 1983.
8. Lake, Mark S.; and Bush, Harold G.: An Analytical Investigation of a Conceptual Design for the Space Station Transverse Boom Rotary Joint Structure. NASA TM-87665, 1986.
9. Bush, Harold G.; Mikulas, Martin M., Jr.; Wallsom, Richard E.; and Jensen, J. Kermit: Conceptual Design of a Mobile Remote Manipulator System. NASA TM-86262, 1984.
31
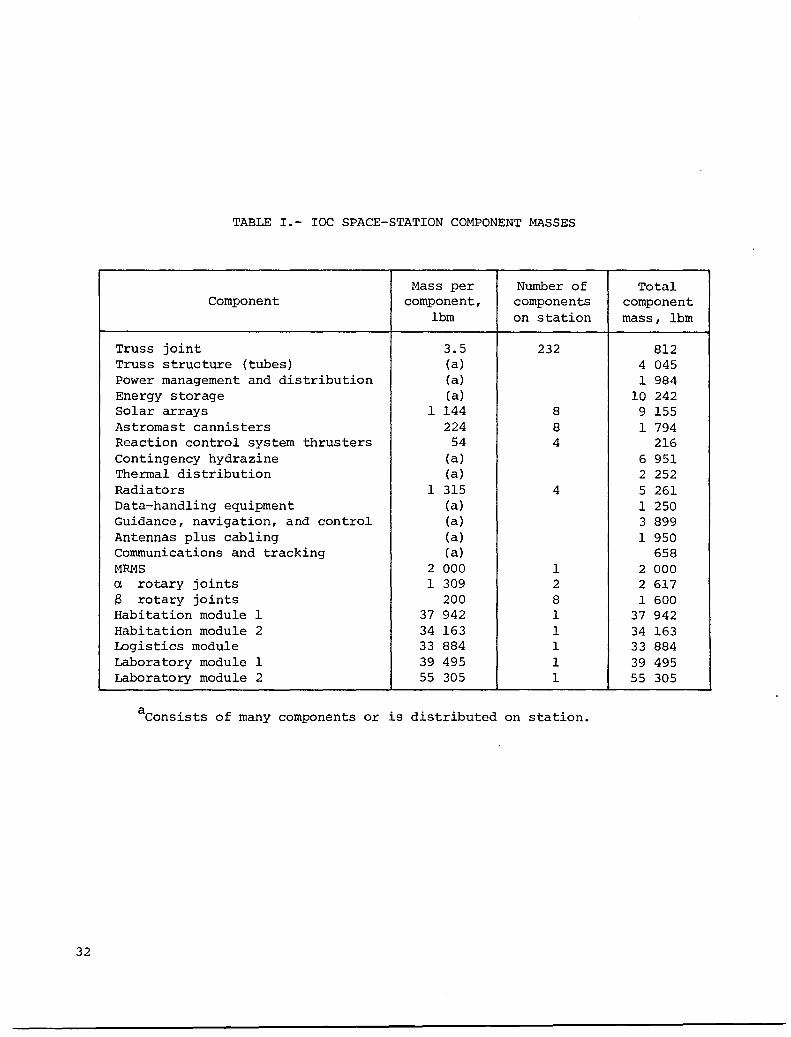
TABLE I.- IOC SPACE-STATION COMPONENT MASSES
Mass per Number of Total Component component, components component
Ibm on station mass, Ibm
Truss joint 3.5 232 812 Truss structure (tubes) (a) 4 045 Power management and distribution (a) 1 984 Energy storage (a) 10 242 Solar arrays 1 144 8 9 155 Astromast cannisters 224 8 1 794 Reaction control system thrusters 54 4 216 Contingency hydrazine (a) 6 951 Thermal distribution (a) 2 252 Radiators 1 315 4 5 261 Data-handling equipment (a) 1 250 Guidance, navigation, and control (a) 3 899 Antennas plus cabling (a) 1 950 Communications and tracking ( a) 658 MRMS 2 000 1 2 000 a. rotary joints 1 309 2 2 617 S rotary joints 200 8 1 600 Habitation module 1 37 942 1 37 942 Habitation module 2 34 163 1 34 163 Logistics module 33 884 1 33 884 Laboratory module 1 39 495 1 39 495 Laboratory module 2 55 305 1 55 305
aConsists of many components or is distributed on station.
32
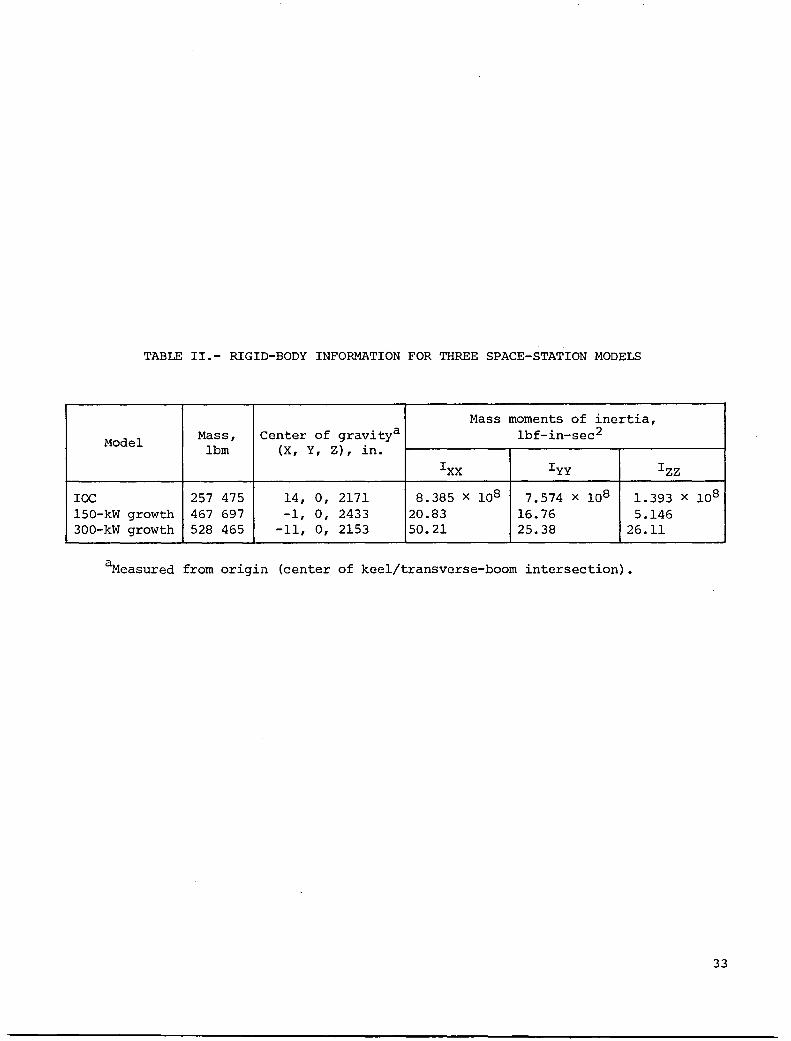
TABLE II.- RIGID-BODY INFORMATION FOR THREE SPACE-STATION MODELS
Mass moments of inertia,
Model Mass, Center of gravitya Ibf-in-sec2
Ibm (X, Y, Z), in.
IXX Iyy I ZZ
IOC 257 475 14, 0, 2171 8.385 x 10⁸ 7.574 x 10⁸ 1.393 x 10⁸
150-kW growth 467 697 -1, 0, 2433 20.83 16.76 5.146 300-kW growth 528 465 -11, 0, 2153 50.21 25.38 26.11
~easured from origin (center of keel/transverse-boom intersection).
33
34
TABLE III.- IOC 75-kW SPACE-STATION VIBRATION MODES
[Nomenclature defined in section "Space-Station Dynamic Characteristics"]
Mode
1-6 7-10
11-17 18-20 21, 22 23-28
29 30 31 32 33 34 35
36-43 44
45-50 51 52 53 54 55 56 57 58 59
60-65 66 67 68 69 70
Frequency, Hz
o 0.088
.118- .119 .119
.120, .131
.198-.208 .215 .220 .270 .337 .495 .732 .762
.841-.850 .858
1.00-1.07 1.11 1.12 1.17 1.45 1.59 2.67 2.84 3.20 3.28
3.60-3.73 3.78 3.84 3.94 3.97 4.10
Rigid body 1Rby 1AbX 1RbZ lRbZ + 1AbX 1AbY 1AbY + 1Kt Z 1Aby 1KtZ + 1AbY 1KbX lKt,y
Description
ITBbX(S) + LKbX + UKby 2LKbX + 1T~X (one boom only) 2AbX 1UKby + 1TBbZ (S) 2Aby 2Aby + lUKtz 2Aby + 2Kby 1UKbX lUKtZ + ITBbZ(S) 2Kby + ITBbZ (S) ITBty(S) + 3Kby ITBty(A) 2T~X (one boom only) + 2UKbX 3KbX + 2TBbX (one boom only) Cannister support bending about Z 3Kby + 2TBbZ Cannister support bending about Z 2TBbZ (A) + 3KbY + 2UKbX 2TBbZ (A) + 2UKbX + UBbX 2TBbX (A) + 3KbX + UBbX
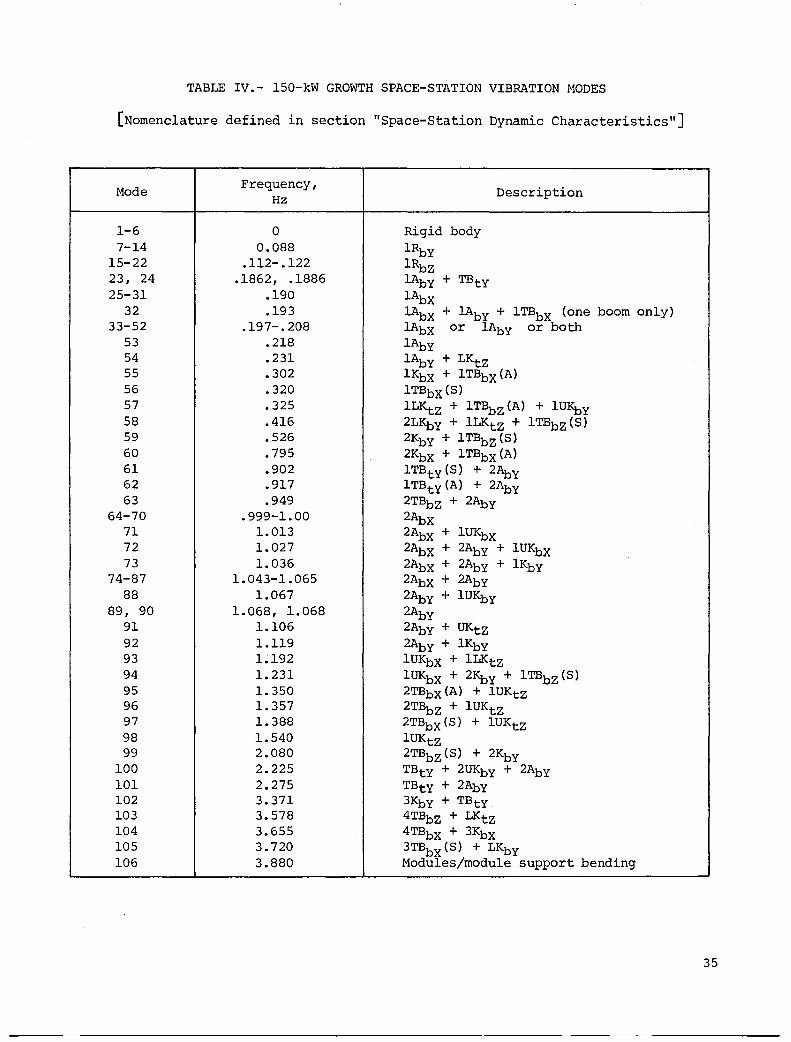
TABLE IV.- 150-kW GROWTH SPACE-STATION VIBRATION MODES
[Nomenclature defined in section "Space-Station Dynamic Characteristics"]
Mode
1-6 7-14
15-22 23, 24 25-31
32 33-52
53 54 55 56 57 58 59 60 61 62 63
64-70 71 72 73
74-87 88
89, 90 91 92 93 94 95 96 97 98 99
100 101 102 103 104 105 106
Frequency, Hz
o 0.088
.112-.122 .1862, .1886
.190
.193 .197-.208
.218
.231
.302
.320
.325
.416
.526
.795
.902
.917
.949 .999-1.00
1.013 1.027 1.036
1.043-1.065 1.067
1. 068, 1. 068 1.106 1.119 1.192 1.231 1.350 1.357 1.388 1.540 2.080 2.225 2.275 3.371 3.578 3.655 3.720 3.880
Rigid body lRby lRbZ 1AbY + TBty lAbX
Description
lAbX + lAby + ITBbX (one boom only) lAbX or 1AbY or both 1AbY lAby + LKtZ 1KbX + 1TBbX(A) 1TBbX(S) lLKtZ + IT~z(A) + lUKby 2LKbY + lLKtZ + 1TBbZ(S) 2KbY + IT~Z(S) 2KbX + 1TBbX(A) ITBty (S) + 2Aby ITBty (A) + 2AbY 2TBbZ + 2AbY 2AbX 2AbX + 2AbX + 2AbX + 2AbX + 2AbY + 2AbY
lUKbX 2AbY + 2AbY + 2AbY lUKbY
2AbY + UKtZ 2AbY + 1KbY 1UKbX + 1LKtz lUKbX + 2Kby + ITBbZ (S) 2TBbX(A) + 1UKtz 2T~z + lUKtZ 2TBbX (S) + lUKtZ lUKtZ 2TBbZ (S) + 2KbY TBty + 2UKbY + 2AbY TBtY + 2AbY 3KbY + TBtY. 4TBbZ + LKtz 4TBbX + 3KbX 3TBbx (S) + LKbY Modules/module support bending
35
36
TABLE V.- 300-kW GROWTH SPACE-STATION VIBRATION MODES
[Nomenclature defined in section "Space-Station Dynamic Characteristics"]
Mode
1-6 7-22
23 24 25
26-39 40 41 42 43 44
45-59 60 61
62-101 102 103 104 105 106 107 108 109 110 III 112 113 114 115 116 117
118-132 133-166 167-173
174 175 176 177 178 179 180
Frequency, Hz
o 0.087-0.088
.093
.104
.107 .1l9- .119
.121
.127
.155
.159
.190 .190-.190
.197
.198 .201-.210
.213
.216
.234
.267
.294
.358
.408
.442
.452
.646
.770
.773
.788
.933
.968
.975 .994-1.00 1.00-1.07 1.07-1.09
1.09 1.16 1.19 1.19 1.21 1.23 1.25
Rigid body lRby
Description
ITBbX (S) + lRbY ITBbZ(S) + lRbZ ITBbX (A) + lRbZ lRbZ lRbZ lRbZ ITBtY (one boom only) + lAbY ITBtY(S) + lAbY ITBty (A) + lAbY lAbX lAbY lAbY lAbX or lAbY or both lAbX lAby lAbY lAby + TBty LKtZ + ITBbZ (A) lKby + 2TBbZ 2TBbX (A) + lKby 2KbY + ITBbZ (one boom only) 2TBbX(S) 2TBbZ (S) + lKby TBtY + 2AbY TBty + 2AbY 2KbX 2TBbZ(A) + 2AbY 3TBbZ (one boom only) + 2AbY + UKbY TBty + 2AbY 2AbX 2AbX + 2AbY 2AbY 2Aby lUKbX 2AbY + lUKbY 2Aby 3TBbZ + lKbY 2TBbX (S) + lUKbX 2TBbZ (S) + lUKbX + 2KbY
Mode
181 182 183 184 185 186 187 188 189 190 191 192 193 194 195 196 197 198 199 200
TABLE V.- Concluded
Frequency, Hz
1.36 1.52 1. 75 1. 79 1.81 2.18 2.21 2.27 2.69 2.82 2.83 3.01 3.41 3.48 3.50 3.80 3.87 4.03 4.37 4.51
4TBbZ UKtZ
Description
3T~z(S) + 2KbY TBty (one boom only) TBty (one boom only) + 3TBbZ (S) 4TBbX(A) 5TBbZ 4TBbX (one boom only) 4TBbZ (S) + 2LKby 2TBty (one boom only) 2TBty (one boom only) TBty 3KbY + 4TBbZ (S) 5TBbX (one boom only) 5T~x (one boom only) + 3Kby 4TBbZ(A) + LKtZ Module bending + 2LKbX + 4TBbZ(A) 2LKbX + UBbX 4TBbZ (S) + 2KbY 2UKbX + U~X
37
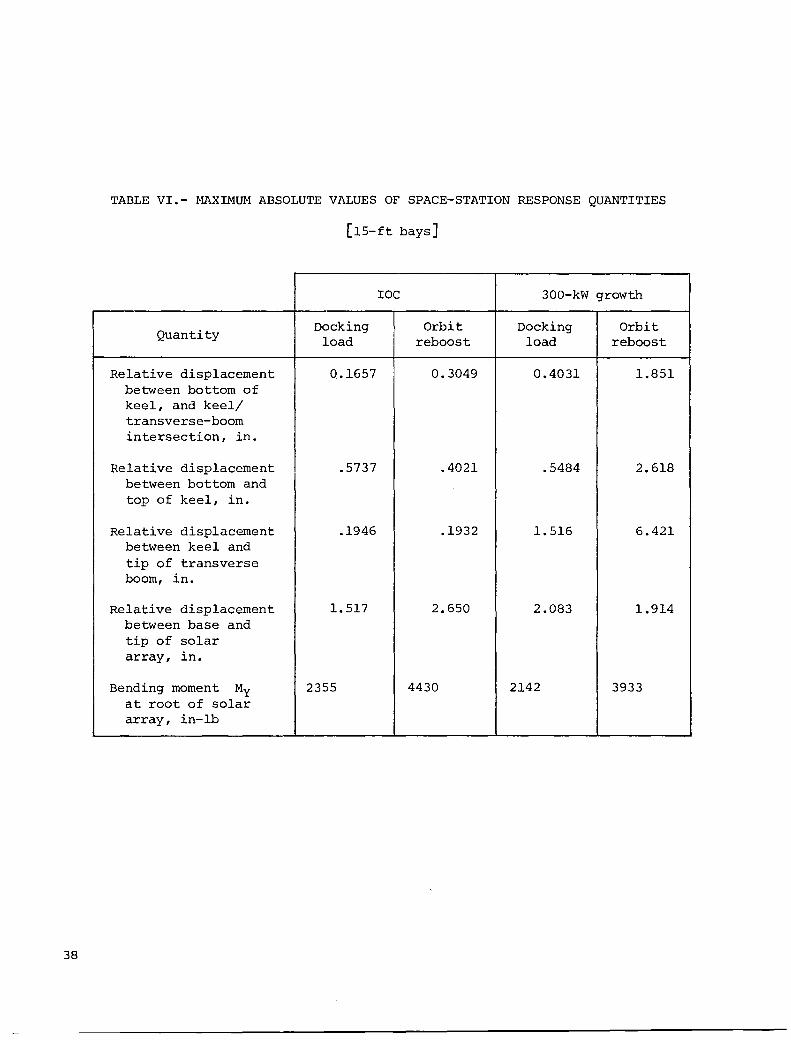
TABLE VI.- MAXIMUM ABSOLUTE VALUES OF SPACE-STATION RESPONSE QUANTITIES
[15-ft bays]
IOC 300-kW growth
Quantity Docking Orbit Docking Orbit
load reboost load reboost
Relative displacement 0.1657 0.3049 0.4031 1.851 between bottom of keel, and keel/ transverse-boom intersection, in.
Relative displacement .5737 .4021 .5484 2.618 between bottom and top of keel, in.
Relative displacement .1946 .1932 1.516 6.421 between keel and tip of transverse boom, in.
Relative displacement 1.517 2.650 2.083 1.914 between base and tip of solar array, in.
Bending moment My 2355 4430 2142 3933 at root of solar array, in-lb
38
W \0
390 ft
15-ft cube (tyP.)
142.5 ft
60 ft--jl T
80 ft
F-50 ft .I;'~ .. X ,,/,1 "-" "col """0,_ Y J( ~ ;i<::=+=:>('/"',~,)j /i'c,:'J"')j r--s ft
10.6 ft
1 35.5 ft
L -135.5 ftf--
\
(a) Side view. (b) Front view.
Figure 1.- Dimensions of IOC space station.
Solar
40
Upper boom r-________ ~A~ ________ ~
Contfngency fuel
Lower keel extensfon
Figure 2.- Initial Operating Capability space-station components and major subsystems.
Transverse boom
~ I-'
450 ft
I_ 525 ft '1
15-ft cube (tyP.)
x
(a) Side view. (b) Front view.
Figure 3.- Dimensions of lS0-kW growth station.
oj:>. N
~
x
450 ft z
~
(a) Side view.
1005 ft
'\171/ 1/1/1/
1 ~ I r7 ,
I i
I IL
k: VVl/I/ 1/1/1/ 'ILV 1/1/1/ i/V Ixlx
y ~I/ ~ Ixlxl~~I~/i~/ 1/1/
~ -- - ... ,
7 I
I s ~
<[2 8t> I Z
~L~ 4~
v 1/ IL
B [7
k:
~ t2~
(b) Front view.
Figure 4.- Dimensions of 300-kW growth station.
•
i ,
I I
1/ VV 17l7l7
I I
"'" w
Distributed controllers
Solar arrays
Contingency fuel
Laboratory 1
Reaction Control System thruster (4 locations)
~Habitation 2
Figure 5.- Components and major subsystems of growth space station.
Transverse boom
44
(a) Mode 10; lRby ; 0.088 Hz.
(b) Mode 15; 1AbX; 0.119 Hz.
Figure 6.- Representative mode shapes for IOC station. Nomenclature defined in section "Space-Station Dynamic Characteristics."
~ lJ1
~I \\
./
-:t~::r. f: : .. ": I : ... ,j
(c) Mode 32; lKbX; 0.337 Hz.
.1
\1
(d) Mode 55; 2KbY + lTBbZ(S); 1.590 Hz.
Figure 6.- Concluded.
"'" (j\
(a) Mode 22i lRbyi 0.088 Hz.
(b) Mode 50i lAbXi 0.190 Hz.
Figure 7.- Representative mode shapes for 300-kW growth station. Nomenclature defined in section "Space-Station Dynamic Characteristics."
. N :t:
N <:l' :t:
<:l' 0
r-f r-f . 0 N
r-f 'd (!)
N
>t 'd cf ~ ::l
r-f r-f
r-f U s:: +
+ 0 U
N (/)
..Q al
N
E-t r--..Q CV1
al (!)
E-t l-I
r-f
::l CO 01 r-- • .-1 r-f r.... <:l'
N
QJ 'd
(!)
0 'd
::E! 0
::E! .......
u 'd ~ ~
47
100
75 Force. lbf 50
25
0
100
75 Force. lbf 50
25
0
48
roo-
I--
'--
r--
500 t---------.
Force. lbf
I 50
50
o 1 Time. sec
J 2
(a) Shuttle dock loading function.
Upper thrusters r---
J I 100 150 200 250
Time, sec
Lower thrusters
100 150 200 250 Time. sec
(b) Orbit reboost loading functions.
-
I 300
300
Figure 8.- Time histories of space-station loading cases.
-
I 350
350
ForceMRMS
Or---------------------~--------------------1-----~
-ForceMRMS
(c) Loading function due to Mobile Remote Manipulator System (MRMS) transversing one bay of station truss.
Figure 8.- Concluded.
49
111 o
300
250
200
Time, sec
150
100
50
o 10000
Assumptions: Maximum rigid-body space-station acceleration limited to 1 x 10⁻⁵g' Space-station mass = 257 500 lbm 15-ft bay
20000 30000 Masstotal (MassMRMS + MaSSpayload)' lbm
40000
Figure 9.- Time required for Mobile Remote Manipulator System (MRMS) to transverse one bay on IOC station.
50000
59
Figure 10.- Output joint numbers and locations on Initial Operating Capability space station for dynamic studies.
251
51
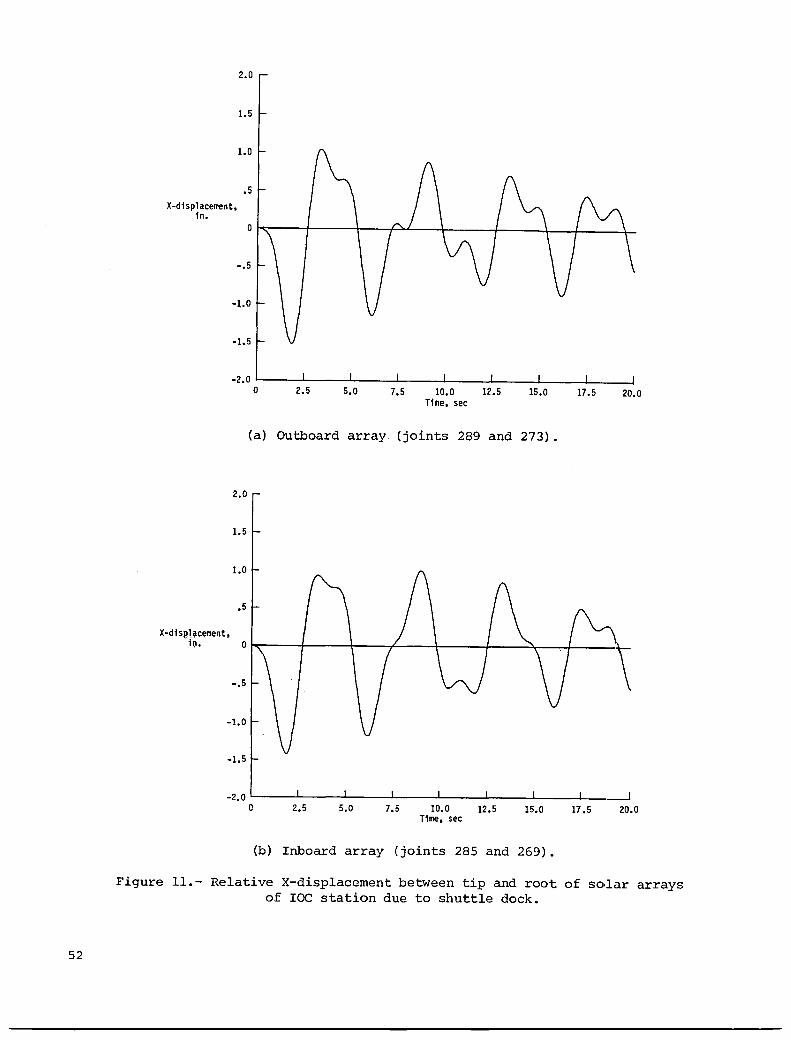
52
2.0
1.5
1.0
.5 X-dlsplacement.
In. O~----r-----r---~L---+-----~ ____ ~ __ +-____ +-
-.5
-1.0
-1.5
-2.0 ~----~----~----~----~----__ L-____ J-____ -L ____ ~
2.0
1.5
1.0
.5
o 2.5 5.0 7.5 10.0 Time. sec
12.5 15.0
(a) Outboard array (joints 289 and 273).
17.5 20.0
X-dls~~~cement.
lp. O~-----r----~~---f~---+------+-----~--~------
-.5
-1.0
-1.5
-2.0~----~----~----~----~------~----~----~---~ o 2.5 5.0 7.5 10.0 12.5 15.0 17.5 20.0
Tlme. sec
(b) Inboard array (joints 285 and 269).
Figure 11.- Relative X-displacement between tip and root of so,lar arrays of IOC station due to shuttle dock.
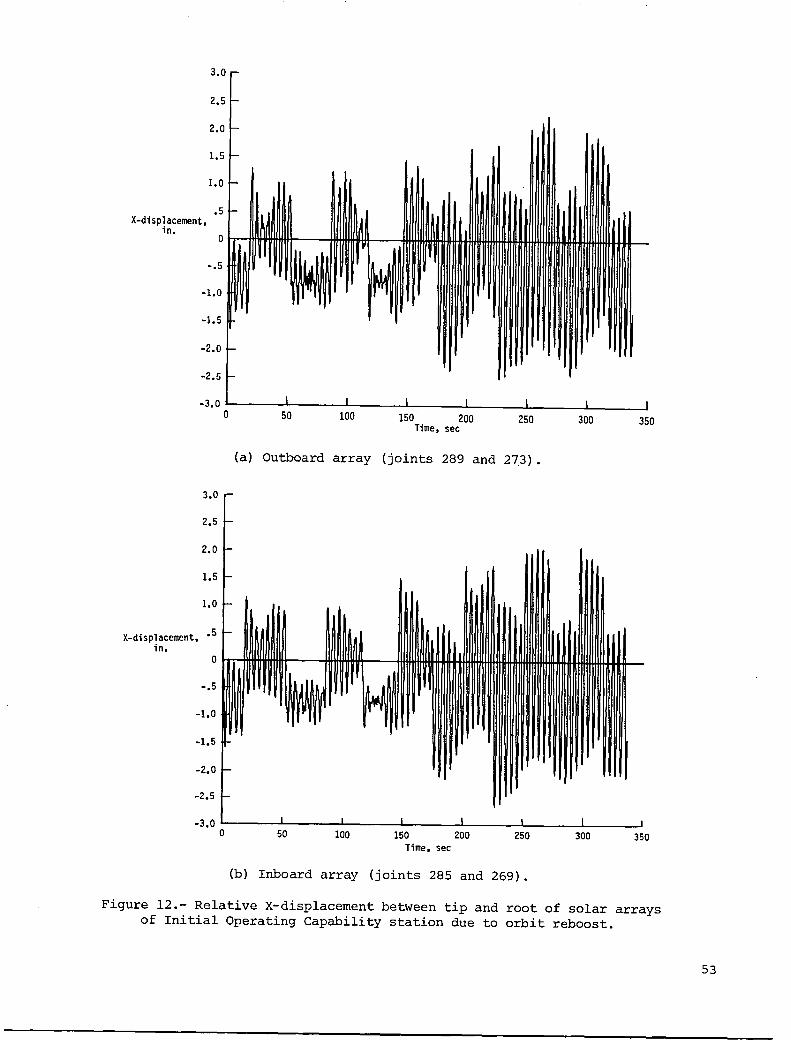
X-displacement. in.
3.0
2.5
2.0
1.5
1.0
-1.5
-2.0
-2.5
-3.0L-------L-----~~ ____ ~ ______ ~ ______ _i ______ _L ______ ~
o
3.0
2.5
2.0
1.5
1.0
X-displacement •• 5 in.
o
-.5
-1.0
-1.5
-2.0
-2.5
-3.0
50 100 150 200 Time. sec
250 300 350
(a) Outboard array (joints 289 and 273).
.--
r-
'-
-
I-
illll! I-
, 11111111
~
I-
-
I _I I J 1 1 ~ o 50 100 150 200 250 300 350
Time. sec
(b) Inboard array (joints 285 and 269).
Figure 12.- Relative X-displacement between tip and root of solar arrays of Initial Operating Capability station due to orbit reboost.
53
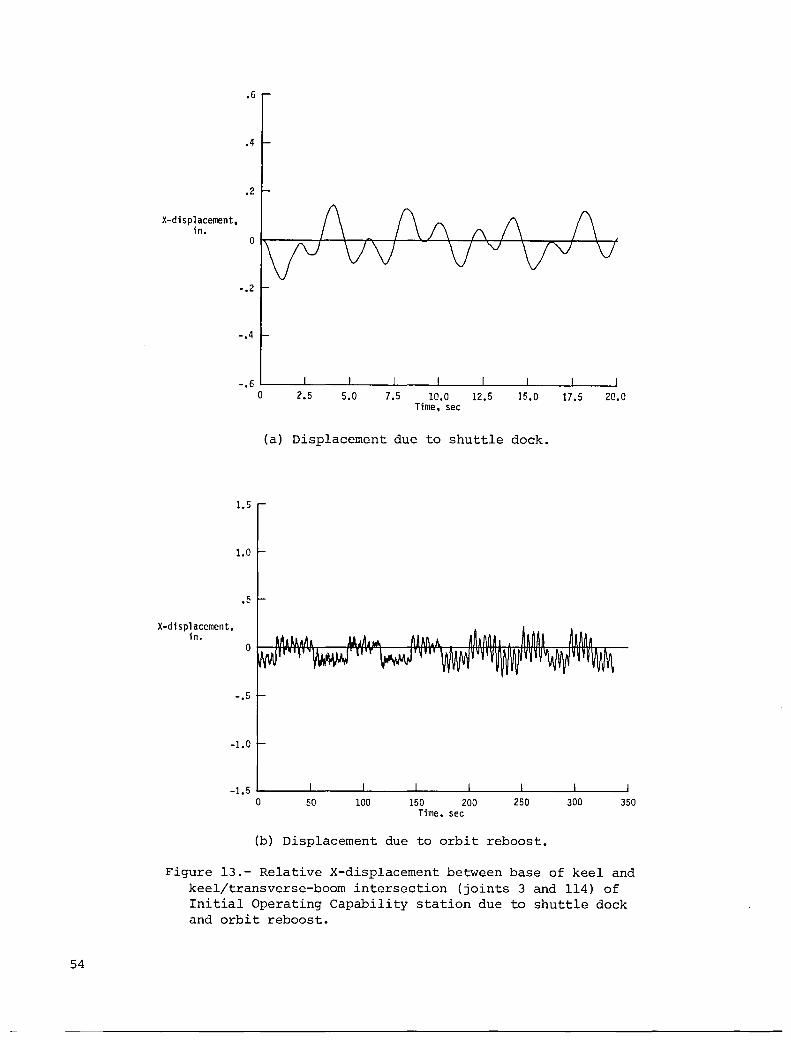
54
X-displacement, in.
.6
.4
.2
-.2
-.4
-.6 ~----~----~----~----~ ____ ~ ____ ~ ____ J-__ ~
X-displacement, in.
1.5
1.0
.5
-.5
-1.0
o 2.5 5.0 7.5 10.0 12.5 15.0 17.5 20.0 Time, sec
(a) Displacement due to shuttle dock.
-1.5 L-____ ~ ______ ~ ____ ~ ______ ~ ______ ~ ____ ~ ____ ~
o 50 100 150 200 250 300 350 Time. sec
(b) Displacement due to orbit reboost.
Figure 13.- Relative X-displacement between base of keel and keel/transverse-boom intersection (joints 3 and 114) of Initial Operating Capability station due to shuttle dock and orbit reboost.
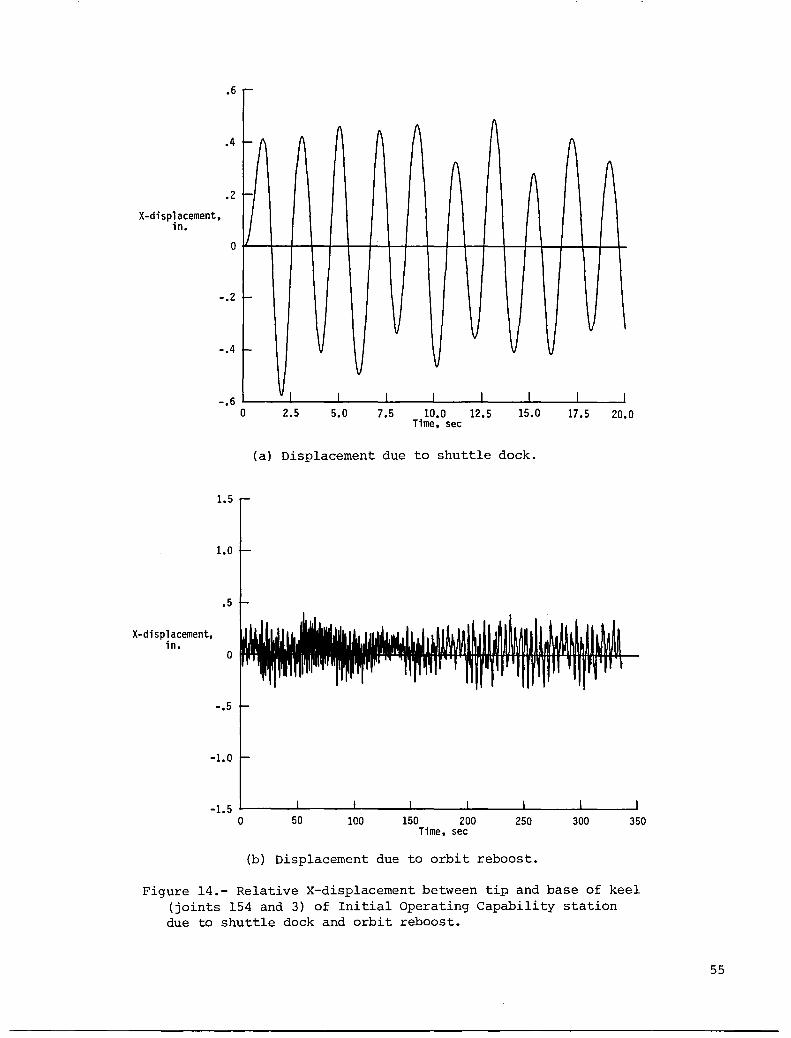
.6
.4
.2
X-displacement. in.
X-displacement. in.
o
-.2
-.4
-.6
1.5
1.0
.5
o
-.5
-1.0
.....
-~ f\ f\ f\ " A
f\ f\ A A -
J
'-
v v v V V v
~
v V
VI I I I I I I I
o 2.5 5.0 7.5 10.0 12.5 15.0 17.5 20.0 Time. sec
(a) Displacement due to shuttle dock.
-1.5 1--__ .....L.. __ ---l~ __ ...l.-__ ---l.. ___ L_ __ J... __ .__.J
o 50 100 150 200 250 300 350 Time. sec
(b) Displacement due to orbit reboost.
Figure 14.- Relative X-displacement between tip and base of keel (joints 154 and 3) of Initial Operating Capability station due to shuttle dock and orbit reboost.
55
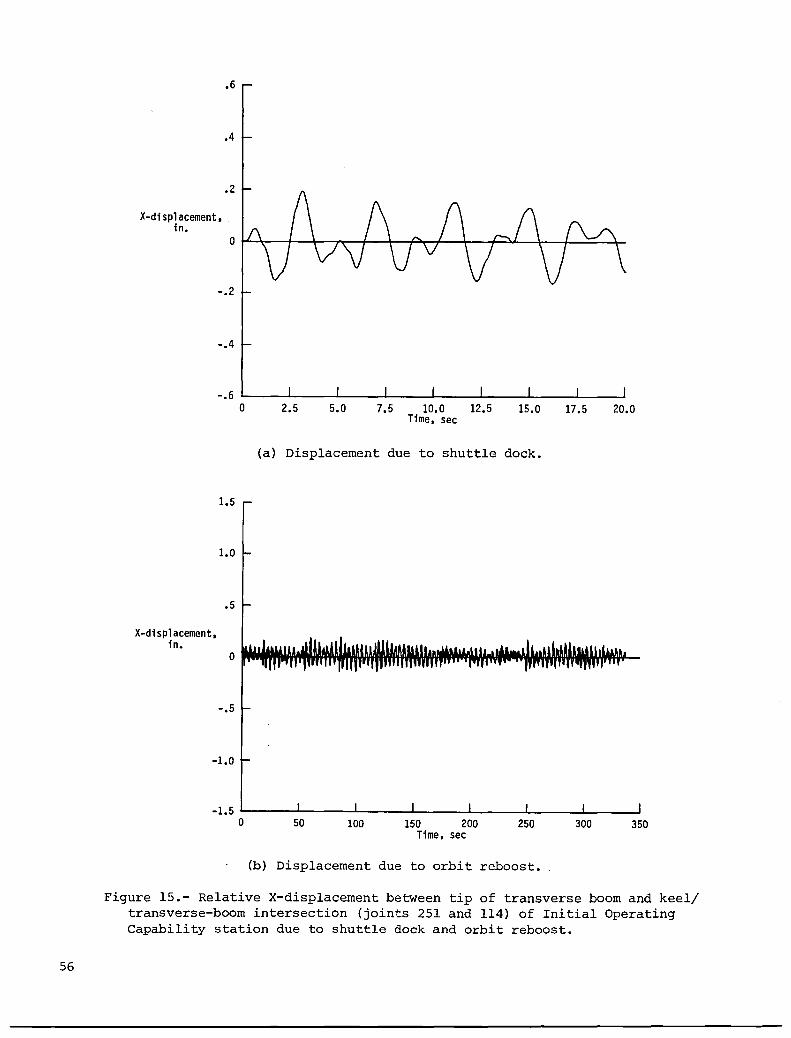
56
X-displacement, in.
.6
.4
.2
-.2
-.4
-.6 ~ ____ ~ ____ ~ ____ ~ ____ -L ____ ~ ____ ~ ______ ~ __ ~
X-displacement, in.
1.5
1.0
.5
-.5
-1.0
o 2.5 5.0 7.5 10.0 12.5 15.0 17 .5 20.0 Time, sec
(a) Displacement due to shuttle dock.
-1.5~----~------~----~----~------~----~----~ o 50 100 150 200 250 300 350
Time, sec
(b) Displacement due to orbit reboost.
Figure 15.- Relative X-displacement between tip of transverse boom and keel/ transverse-boom intersection (joints 251 and 114) of Initial Operating Capability station due to shuttle dock and orbit reboost.
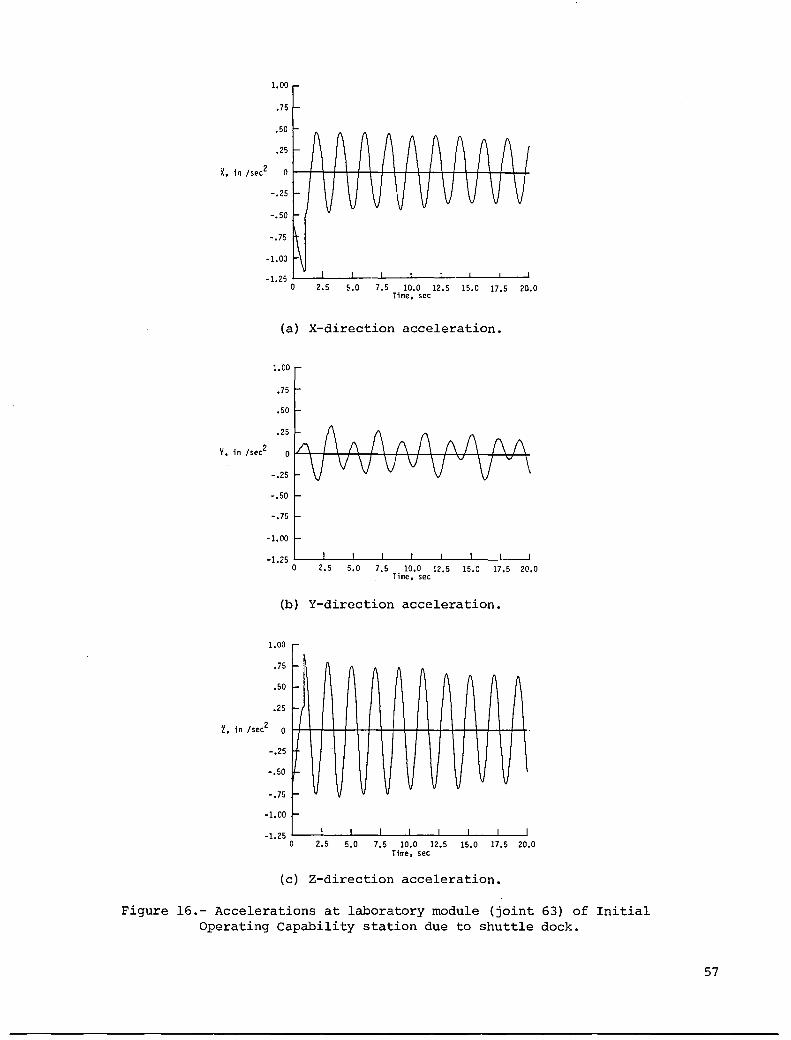
1.00
.75
.50
.25
X. in /sec2 0 r+-t--1H-+-+-+--\-Hrl-t--t-+-+-H~-+
-.25
-.50
-.75
-1.00
-1.25 l..-_.l.-_..I-_...l-_-l-_-L. __ -'-_--L_---'
o 2.5 5.0 7.5 10.0 12.5 15.0 17.5 20.0 Time, sec
(a) X-direction acceleration.
1.00
.75
.50
.25
V. in /sec2
-.25
-.50
-.75
-1.00
-1.25 L--_"'--_-'--_...l-_...l-_--'-_-'-_--L_---' o 2.5 5.0 7.5 10.0 12.5 15.0 17.5 20.0
Time, sec
(b) Y-direction acceleration.
1.00 -.75 A fI 1\ 1\
f\ A fI A -.50
.25
'to in /sec2 a -1
-.25
V v V V V - V v v
-.50
-.75
-1.00 --1.25 I I I I I I I
o 2.5 5.0 7.5 10.0 12.5 15.0 17.5 20.0 Time. sec
(c) Z-direction acceleration.
Figure 16.- Accelerations at laboratory module (joint 63) of Initial Operating Capability station due to shuttle dock.
57
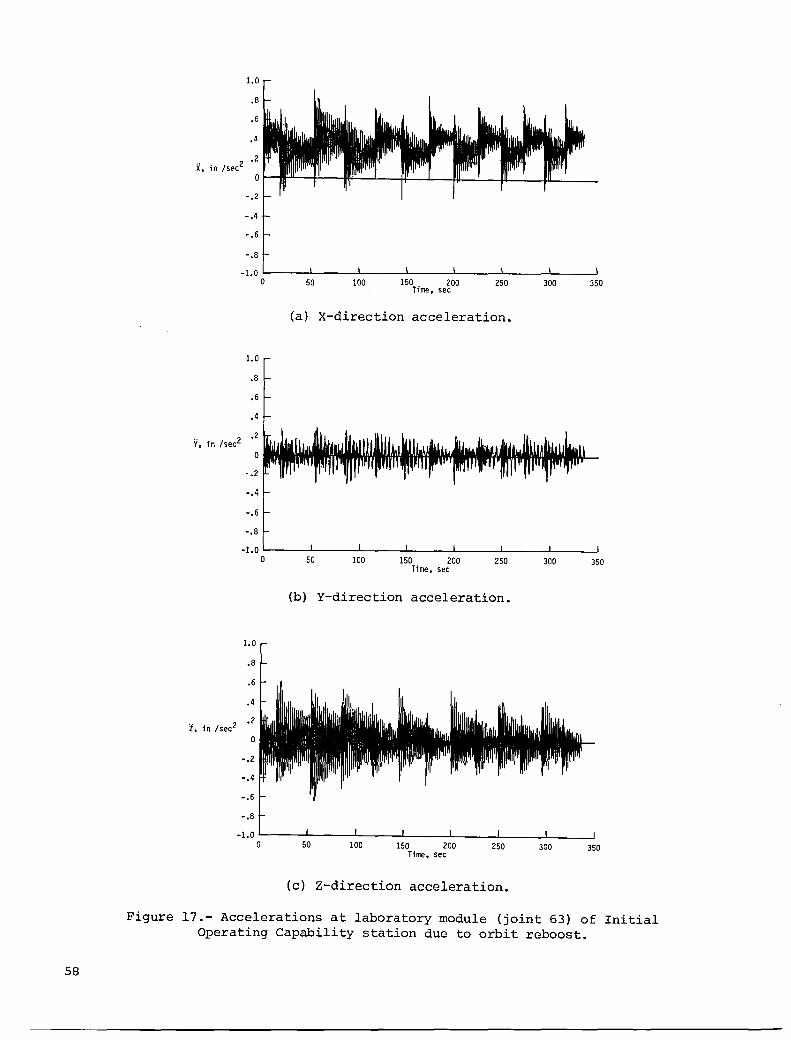
58
1.0
.8
.6
-.2
- .4
-.6
-.8
-1.0~-----L----~~----~----~--____ ~ ____ ~ ____ ~
1.0
.8
.6
.4
2 .2 Y. in /sec
o
-.2
o 50 100 150 200 Time, sec
250 300 350
(a) X-direction acceleration.
~:: ~ -.8 r
-1.0 '--____ --1.... ____ ----' ______ -'--____ --'--______ '--____ --'-____ ---'
1.0
.8
.6
.4
2 .2 t. in /sec
o
-.2
-.4
-.6
-.8
50 100 150 200 Time. sec
250 300 350
(b) Y-direction acceleration.
-1.0 '-------'-----~~-----'-----.....J.. ______ .l--____ -L ____ -.J
o 50 100 150 200 Time. sec
250 300 350
(c) Z-direction acceleration.
Figure 17.- Accelerations at laboratory module (joint 63) of Initial Operating Capability station due to orbit reboost.
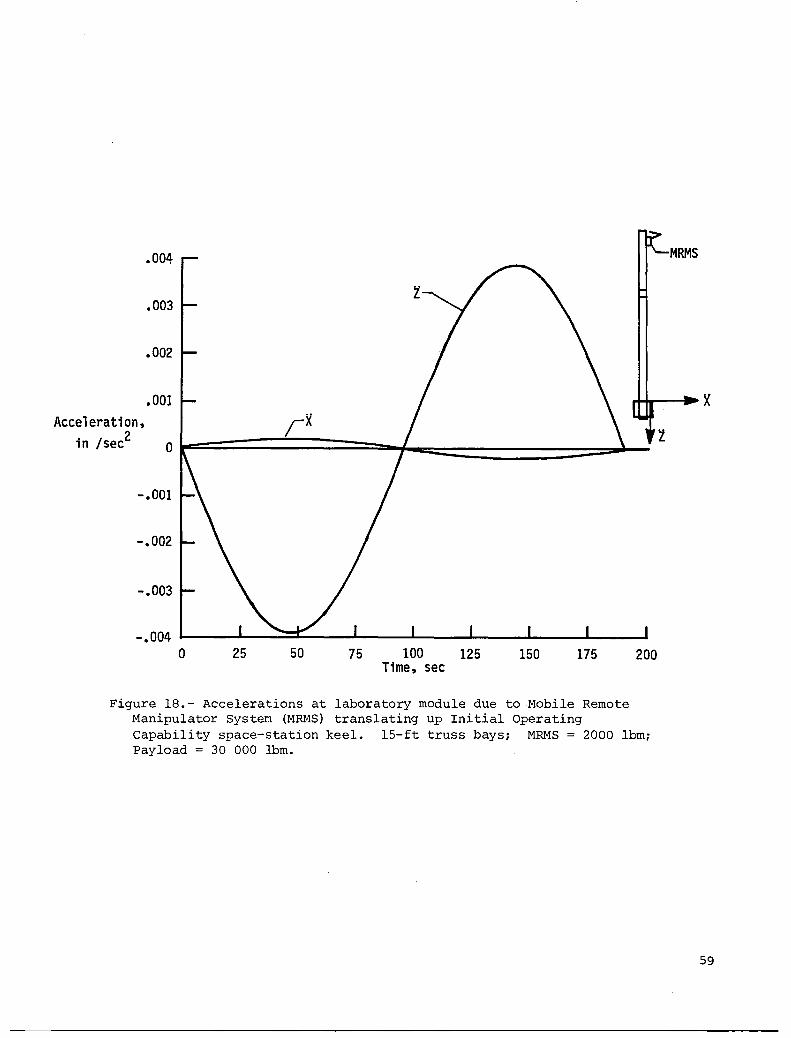
Acceleration, in /sec2
.004
.003
.002
.001
-.001
-.002
-.003
-.004 o 25 50 75 100 125 150 175 200
Time, sec
Figure 18.- Accelerations at laboratory module due to Mobile Remote Manipulator System (MRMS) translating up Initial Operating Capability space-station keel. lS-ft truss baysi MRMS = 2000 Ibm; Payload = 30 000 Ibm.
MRMS
59
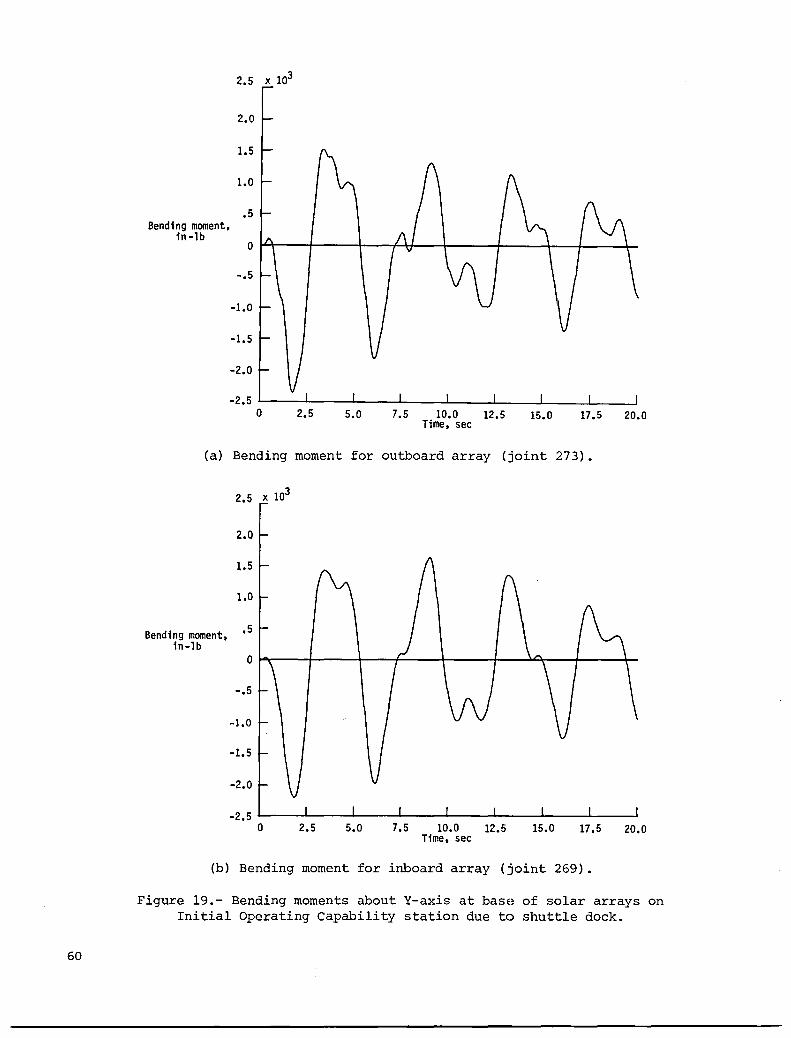
60
2.5 x 10³
2.0
1.5
1.0
.5 Bending moment,
in -lb 0
-.5
-1.0
-1.5
-2.0
-2.5 0 2.5 5.0 7.5 10.0 12.5
Time, sec 15.0 17.5 20.0
(a) Bending moment for outboard array (joint 273).
Bending moment, in-lb
2.0
1.5
1.0
.5
o ~----+-----+----r----~-----+--~~---;----~r-
-.5
-] .0
-1.5
-2.0
-2.5 ~----~----~--~~--~----~----~----~----~ o 2.5 5.0 7.5 10.0 12.5 15.0 17.5 20.0
Time, sec
(b) Bending moment for inboard array (joint 269).
Figure 19.- Bending moments about Y-axis at base of solar arrays on Initial Operating Capability station due to shuttle dock.
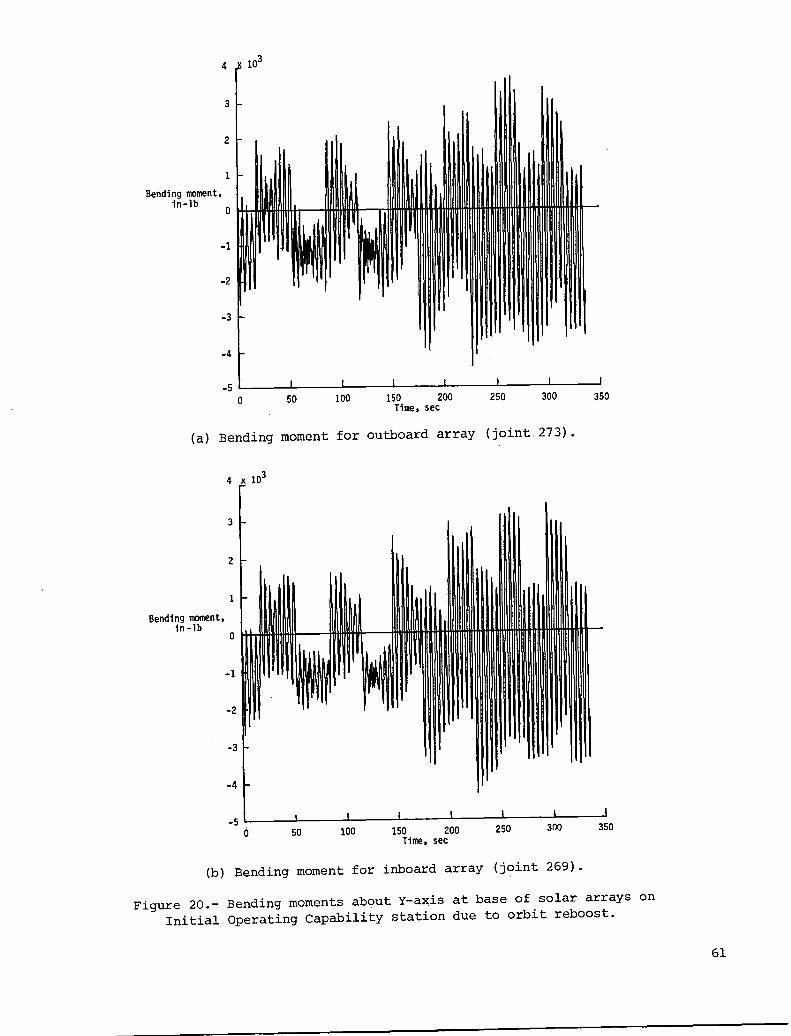
Bending moment. in-lb
4
3
2
1
o
-1
-2
-3
-4
-5 ~ ____ ~ ____ ~ ____ ~ ______ ~ ____ ~ ____ -L ____ ~
o 50 100 150 200 Time. sec
250 300
(a) Bending moment for outboard array (joint 273).
Bending moment. in -lb
3
2
-3
-4
350
_5~ ____ ~ ____ ~ ______ ~ ____ -L ____ ~~ ____ J-____ -J
250 300 350 6 50 100 150 200 Time. sec
(b) Bending moment for inboard array (joint 269).
Figure 20.- Bending moments about Y-a~is at base of solar arrays on Initial Operating Capability station due to orbit reboost.
61
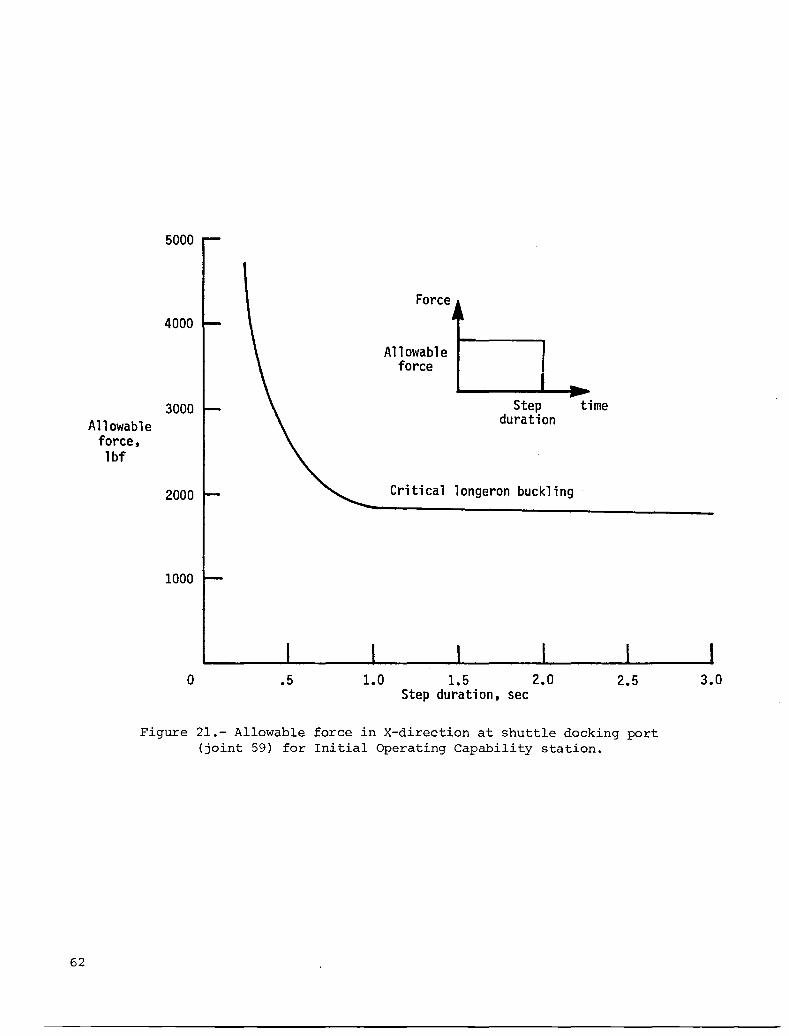
62
Allowable force, lbf
5000
4000
3000
2000
1000
o .5
Force
Allowable force
~~
--Step time duration
Critical longeron buckling
1.0 1.5 2.0 Step duration, sec
2.5
Figure 21.- Allowable force in X-direction at shuttle docking port (joint 59) for Initial Operating Capability station.
3.0
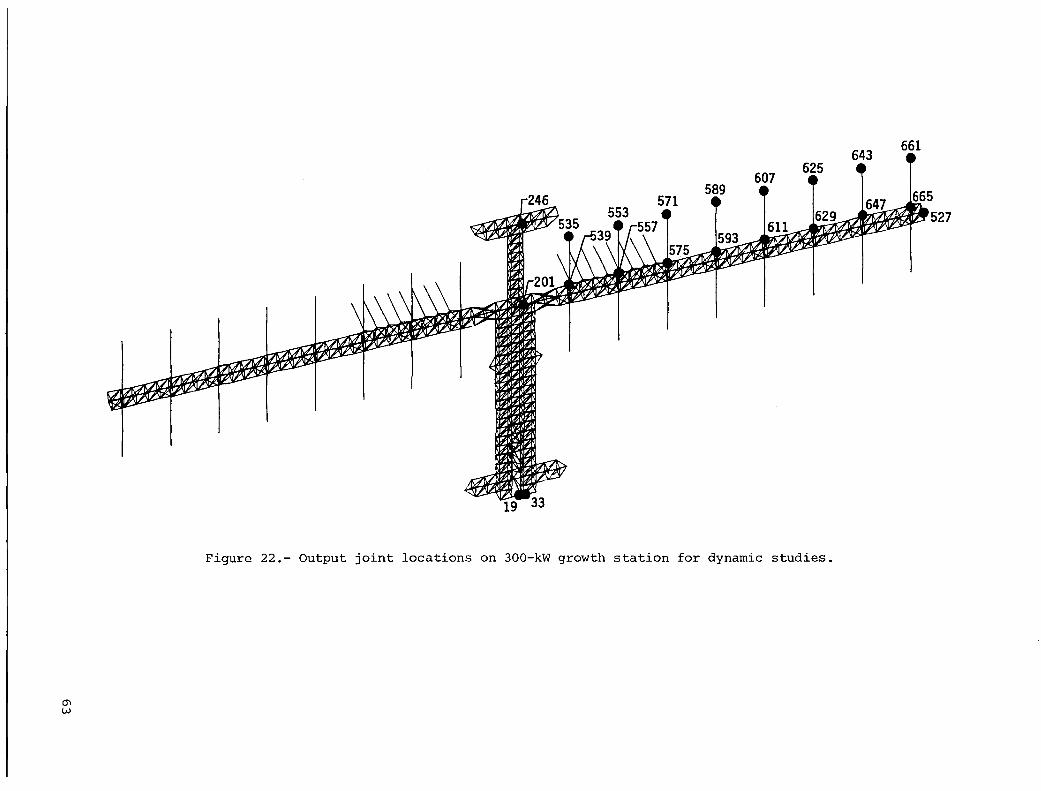
0"1 W
Figure 22.- Output joint locations on 300-kW growth station for dynamic studies.
661
~527
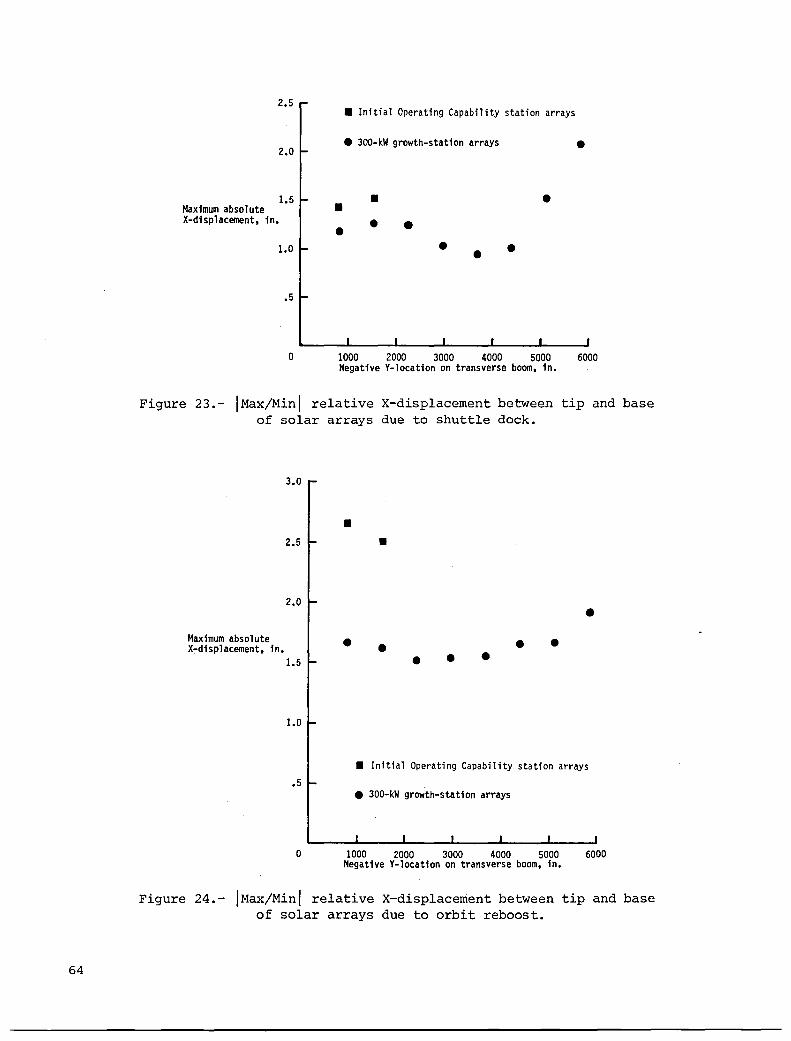
64
2.5
Maximum absolute X-displacement. in.
2.0
1.5
1.0
.5
o
• Initial Operating Capability station arrays
.. 300-kW growth-station arrays
• • •
1000 2000 3000 4000 5000 6000 Negative V-location on transverse boom. in.
Figure 23.- I Max/Mini relative X-displacement between tip and base of solar arrays due to shuttle dock.
Maximum absolute X-displacement. in.
3.0
2.5
2.0
1.5
1.0
.5
o
• •
•
• Initial Operating Capability station arrays
.. 300-kW growth-station arrays
1000 2000 3000 4000 5000 Negative V-location on transverse boom. in.
6000
Figure 24.- I Max/Min I relative X-displacement between tip and base of solar arrays due to orbit reboost.
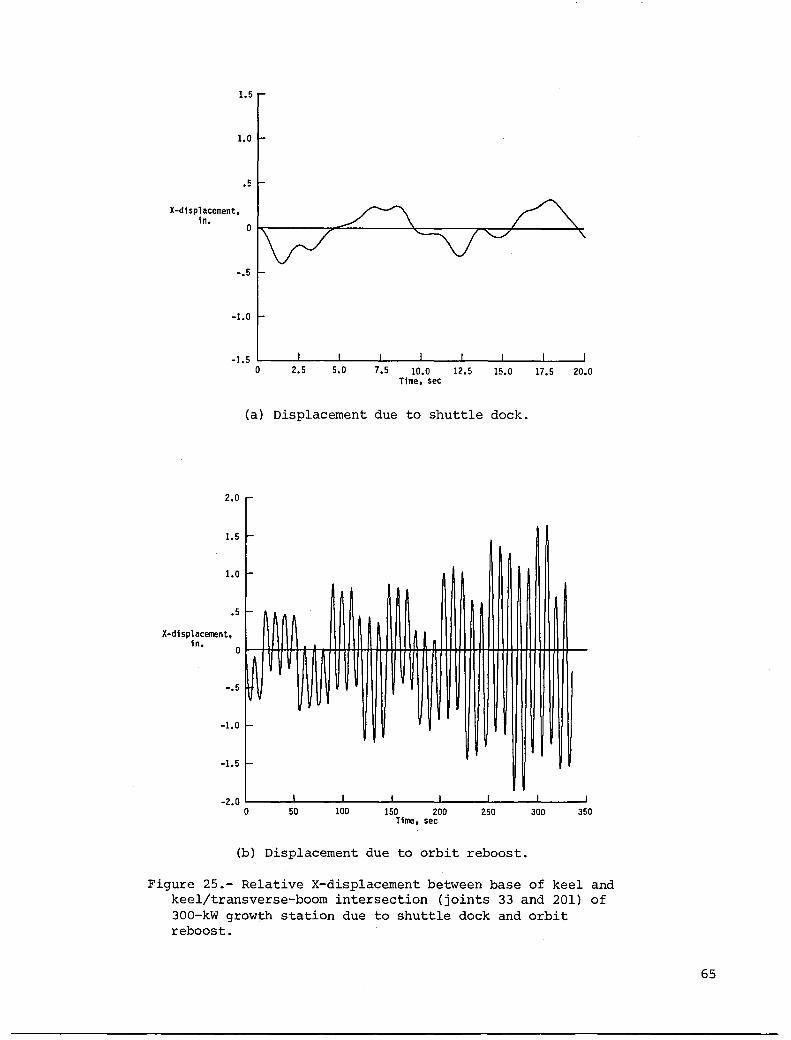
1.5
1.0
X-displacement. in.
.5
-.5
-1.0
-1.5 L--__ L.-_---' __ -.J. __ --'-__ -l.. __ ....L.. __ ....I.-_----'
2.0
1.5
1.0
.5
X-displacement. in.
-.5
-1.0
-1.5
o 2.5 5.0 7.5 10.0 12.5 15.0 17.5 20.0 Time. sec
(a) Displacement due to shuttle dock.
-2.0 '----....1.-----''-----'------'---"'-----'"-----' o 50 100 150 200 250 300 350
Time, sec
(b) Displacement due to orbit reboost.
Figure 25.- Relative X-displacement between base of keel and keel/transverse-boom intersection (joints 33 and 201) of 300-kW growth station due to shuttle dock and orbit reboost.
65
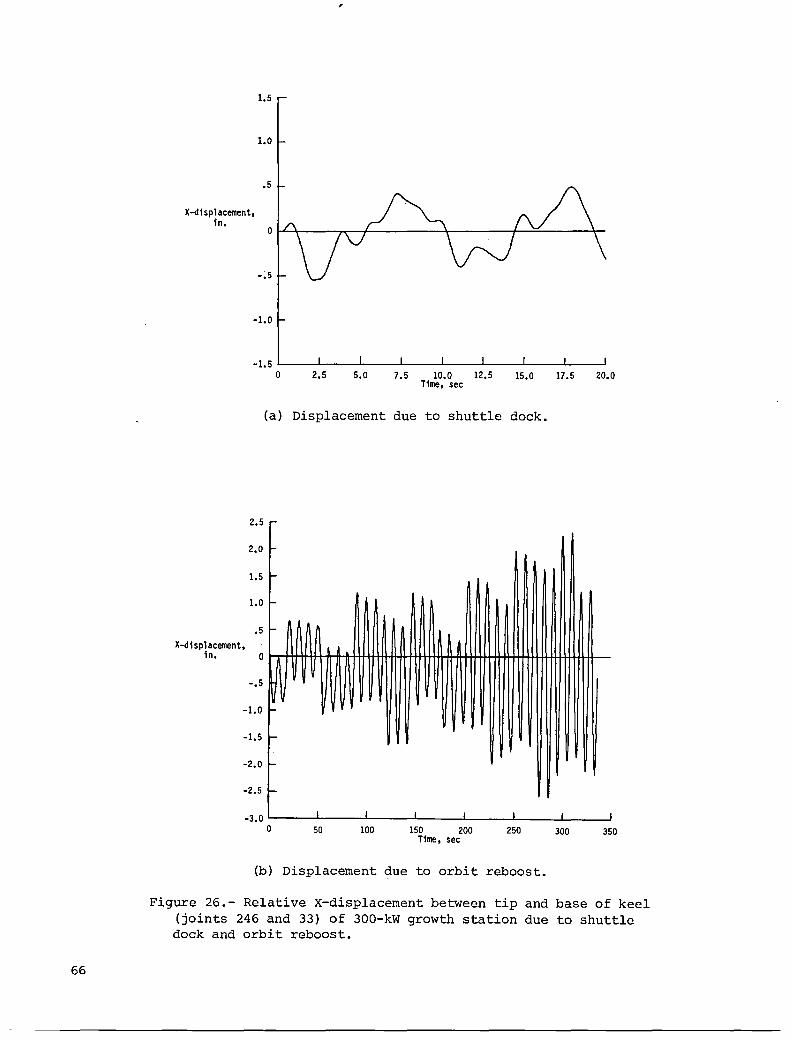
66
X-dl spl acement, In.
1.5
1.0
.5
O~+----,~,r---------T------~~=-----~,
-1.0
_1.5L_ __ -L ____ ~ ____ L_ __ ~ ____ ~ ____ ~ __ ~ ____ ~
o 2.5 5.0 7.5 10.0 12.5 15.0 17.5 20.0 Tlme, sec
(a) Displacement due to shuttle dock.
2.5
2.0
1.5
1.0
.5 X-dlsplacement.
in. 0 t-T-HiH+-1++1l-IH-H++H-H-+H+-H++H+HHrH+-+++tt+H++++++++H-++t-H-+1--
-.5
-1.0
-1.5
-2.0
-2.5
_3.0~-----L ______ L-____ -L ______ L-____ -L ______ L-____ ~
o 50 100 150 200 250 300 350 Tlme, sec
(b) Displacement due to orbit reboost.
Figure 26.- Relative X-displacement between tip and base of keel (joints 246 and 33) of 300-kW growth station due to shuttle dock and orbit reboost.
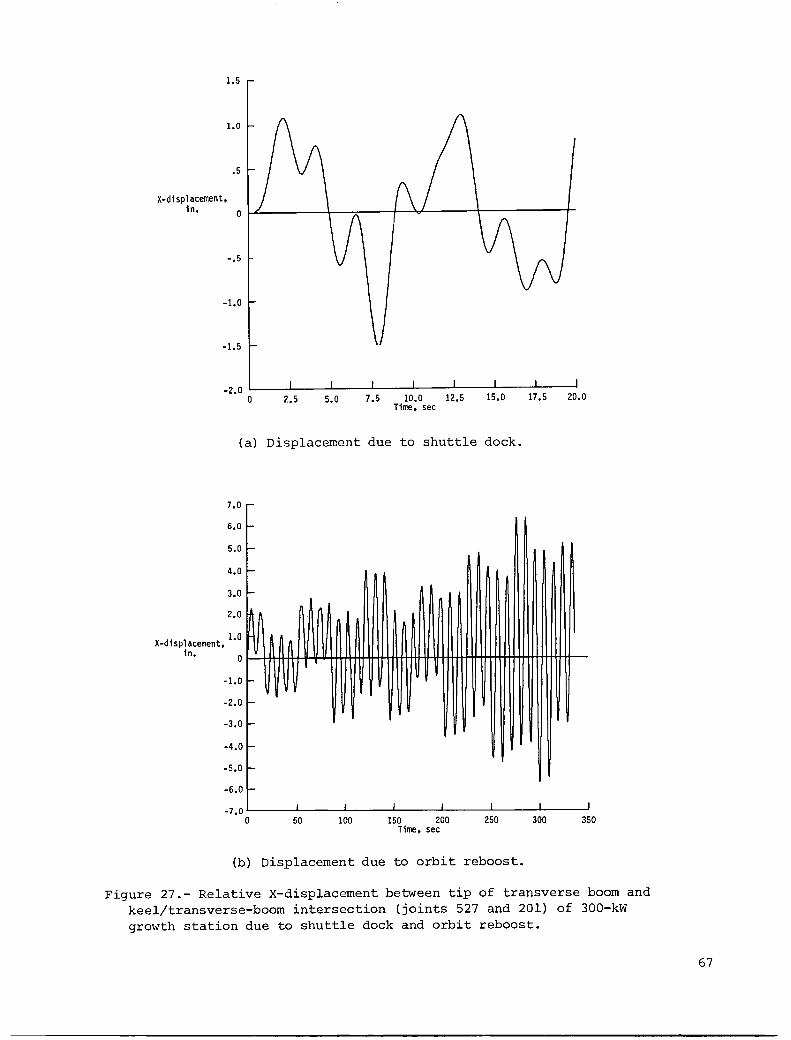
X-displacement. in.
1.5
1.0
.5
o ~--------+-~~--~~~------~--------~
-.5
-1.0
-1.5
-2.0 L--__ ---l ___ .......L __ ....L __ ...L-__ L-_---1 __ -'-__ -l
o 2.5 5.0 7.5 10.0 12.5 15.0 17.5 20.0 Time. sec
(a) Displacement due to shuttle dock.
7.0
6.0
5.0
4.0
3.0
2.0
X d· 1 1.0 - lSP acement.
in. 0 1-=--H-1-H-1+++-I1-ll-H++H+HH++H-+H+HiHl-H+t+++Ht++H+++++++++++H1--
-1.0
-2.0
-3.0
-4.0
-5.0
-6.0
_7.0~ __ -'-___ ~ __ ....L __ --lL-__ -lL __ --l __ ---l
o 50 100 150 200 250 300 350 Time. sec
(b) Displacement due to orbit reboost.
Figure 27.- Relative X-displacement between tip of transverse boom and keel/transverse-boom intersection (joints 527 and 201) of 300-kW growth station due to shuttle dock and orbit reboost.
67
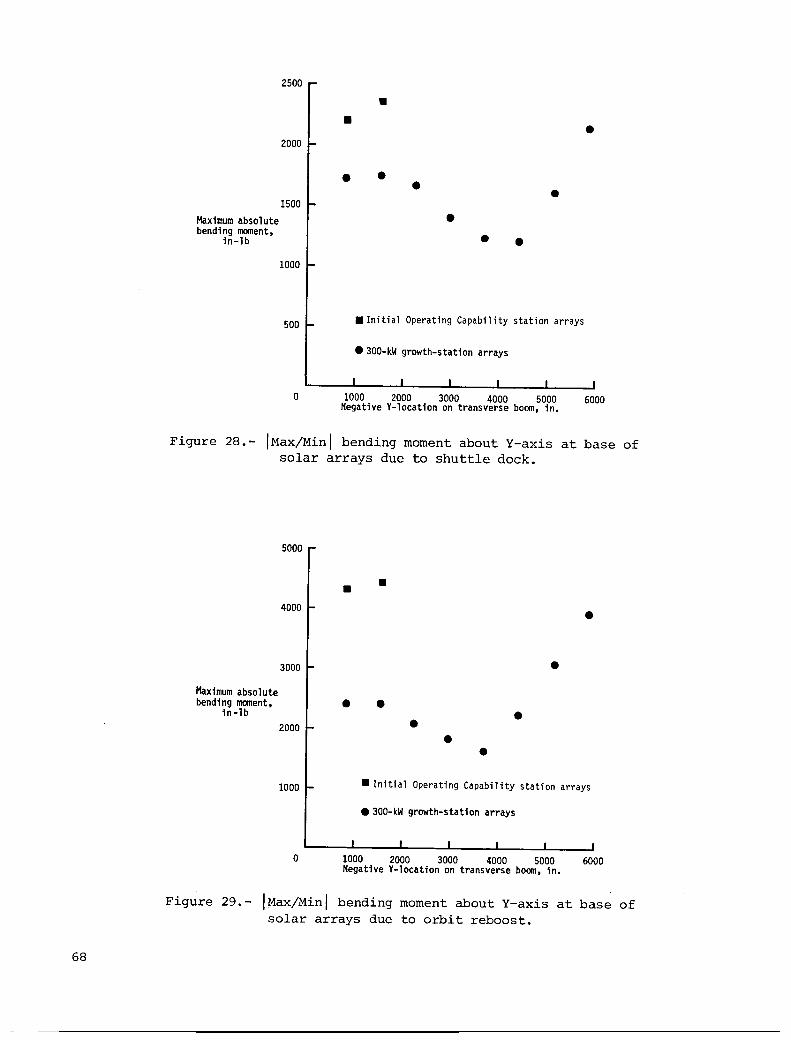
68
2500
2000
1500
Maximum absolute bending moment.
in-lb
1000
500
o
• •
• • • • •
• •
.Initial Operating Capability station arrays
• 300-kW growth-station arrays
1000 2000 3000 4000 5000 Negative V-location on transverse boom. in.
•
6000
Figure 28.- I Max/Min I bending moment about Y-axis at base of solar arrays due to shuttle dock.
Maximum absolute bending moment.
in -lb
5000
4000
3000
2000
1000
o
• • •
• • •
• • • •
• Initial Operating Capability station arrays
• 300-kW growth-station arrays
1000 2000 3000 4000 5000 6000 Negative V-location on transverse boom. in.
Figure 29.- I Max/Min I bending moment about Y-axis at base of solar arrays due to orbit reboost.
Standard Bibliographic Page
1. Report No. 12. Government Accession No. 3. Recipient's Catalog No. NASA TM-87684
4. Title and Subtitle 5. Report Date
Dynamic Characteristics of Power-Tower Space July 1986
Stations With IS-Foot Truss Bays 6. Performing Organization Code 506-43-41-02
7. Author{s) 8. Performing Organization Report No.
John T. Dorsey L-16094
9. Performing Organization Name and Address 10. Work Unit No.
NASA Langley Research Center 11. Contract or Grant No. Hampton, VA 23665-5225
12. Sponsoring Agency Name and Address 13. Type of Report and Period Covered Technical Memorandum
National Aeronautics and Space Administration 14. Sponsoring Agency Code Washington, DC 20546-0001
15. Supplementary Notes
16. Abstract
A power-tower space-station concept which generates power with photovoltaic arrays and where the truss structure has a bay size of 15 ft is described. Rigid-body and flexible-body dynamic characteristics are presented for a 75-kW Initial Operating Capability (IOC) and 150-kW and 300-kW growth stations. The transient response of the IOC and 300-kW growth stations to shuttle dock, orbit reboost, and Mobile Remote Manipulator System transla-tion loads are studied. Displacements, accelerations, and bending moments at various locations on the roc and 300-kW growth stations are presented.
17. Key Words (Suggested by Authors{s» 18. Distribution Statement
Space station Unclassified - Unlimited Large space structures Space truss Structural dynamics
Subject Category 18
19. Security Classif.(of this report) 120. Security Classif.{of t!1is page) 121. No. ofPages,22. Price Unclassified Unclassified 69 A04
For sale by the National Technical Information Service, Springfield, Virginia 22161 NASA-Langley. 1986

End of Document