Embed Size (px)
Citation preview

13th World Conference on Earthquake Engineering Vancouver, B.C., Canada
August 1-6, 2004 Paper No. 2218
DYNAMIC CHARACTERISTICS EVALUATION OF MASJED-SOLEIMAN EMBANKMENT DAM USING
FORCED VIBRATION TEST
Mohammad Kazem JAFARI1 and Mohammad DAVOODI2
SUMMARY Due to the importance of in-situ vibration tests in dynamic behavior evaluation of structures, for the first time in Iran, comprehensive forced vibration test on Masjed-Soleiman (MS) embankment dam was performed. During the tests, the response of the dam body in three directions to three shakers excitation was measured. In order to investigate the effects of spilling the reservoir on modal parameters of the dam body, the ambient vibration tests were done during and without the spilling. Based on the results of the tests, the natural frequencies, mode shapes and modal damping of the dam body was evaluated. Besides in-situ dynamic tests, 2-D and 3-D modal analysis of the dam body was performed using ANSYS software. The dynamic soil properties were calculated based on results of the cyclic triaxial and resonant column tests. Also initial shear modulus of the dam body materials was compared with appropriate seismic refraction investigations. The effects of geometrical modeling of dam body, abutments and foundation depth on modal parameters were investigated. In addition, for considering dam-foundation rock interaction, various conditions of foundation mass was also considered. In this paper, the results of forced vibration test and numerical modeling of the dam body will be presented and discussed. KEYWORDS: Embankment Dam, Forced Vibration Test, Numerical Model, Modal Properties.
INTRODUCTION Dynamic behavior of embankment dams comes could be evaluated using four different approaches: observations made from the dam response during earthquakes, experiments conducted on prototype dams, experiments conduced on reduced scale models of dams including shaking table and centrifuge testing and finally analytical studies.
1 Assoc. Professor, IIEES, Tehran, I.R. Iran, P.O. Box 19395/3913, Fax: (9821) 2299479, e-mail: [email protected]
2 Assistant Professor, IIEES, Tehran, I.R. Iran, e-mail: [email protected]

It is recommended to conduct in-situ dynamic tests on important embankment dams in areas susceptible to strong earthquake events to estimate dynamic characteristics at the low level of excitation. Forced and ambient vibration tests (the most common types of vibration tests on prototype of dams) have been used frequently in the world since 1960s[1]. Since, Iran is a part of Alpine seismic belt and is considered as an earthquake prone region with a high seismic hazard level, the evaluation of the dynamic behavior of dams under earthquake loading is always the outmost concerns of the researchers and engineers in this country. Therefore, for the first time in Iran, a comprehensive ambient and/or forced vibration testing program on embankment dams was defined and two large embankment dams with narrow valley, named Masjed-Soleiman (MS) with a height of 177m and Marun of 165m height, were selected. In this paper, the results of the forced vibration tests and a comparison with numerical modeling of MS embankment dam will be presented.
DESCRIPTION OF THE DAM Masjed-Soleiman dam is a rockfill dam with a clay core, which is located in south west of Iran (Khuzestan province) on Karun river. The dam has a maximum height of 177 m, a dam body volume of nearly 13.4 millions of m3 and a reservoir capacity of about 230 millions of m3. The length to height ratio (L/H) of the dam is 2.76, which is a small ratio in comparison with other large embankment dams. Therefore the 3D evaluation of the dam behavior under dynamic loading is important. The whole dam body lies on Bakhtiyari geological formation, which is marked by hard conglomerate and very thin clay intercalation. The construction of the dam body has been recently completed and first stage of powerplant project is under operation. MS dam and powerplant house located in the Zagros province (32.02 N, 49.24E) next to some active faults (Fig. 1). For example, the Andica fault, which has been located 2.5 km far from the dam site, generated the M=5.7 earthquake in 1978. This earthquake caused a large landslide and rockfall with a 2 km length to be occurred between the fault and dam site (before dam construction). Also, the 2002 Andica earthquake (M=5.4) caused serious damages on adobe structures in rural areas (with no damage on dam body). According to the seismic hazard analysis report [3], the peak horizontal and vertical ground acceleration for DBE level are estimated to be 0.26g and 0.19g and for MDE level, 0.45g and 0.36g, respectively.
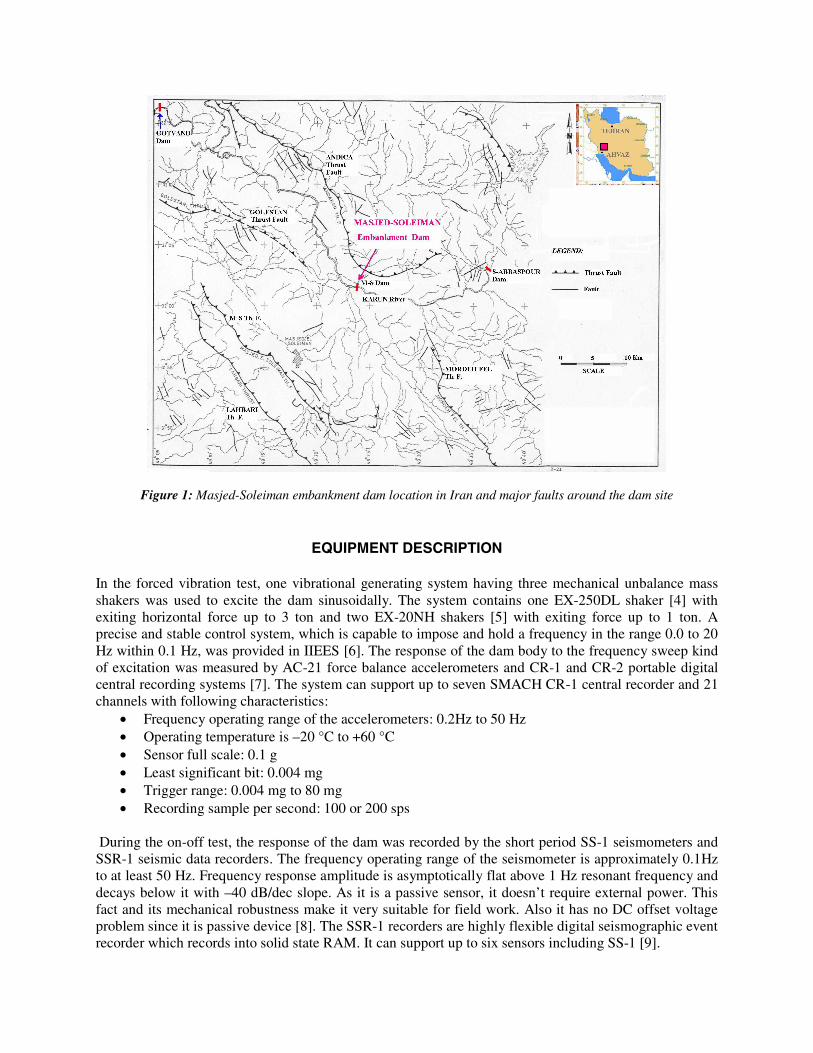
Figure 1: Masjed-Soleiman embankment dam location in Iran and major faults around the dam site
EQUIPMENT DESCRIPTION In the forced vibration test, one vibrational generating system having three mechanical unbalance mass shakers was used to excite the dam sinusoidally. The system contains one EX-250DL shaker [4] with exiting horizontal force up to 3 ton and two EX-20NH shakers [5] with exiting force up to 1 ton. A precise and stable control system, which is capable to impose and hold a frequency in the range 0.0 to 20 Hz within 0.1 Hz, was provided in IIEES [6]. The response of the dam body to the frequency sweep kind of excitation was measured by AC-21 force balance accelerometers and CR-1 and CR-2 portable digital central recording systems [7]. The system can support up to seven SMACH CR-1 central recorder and 21 channels with following characteristics:
• Frequency operating range of the accelerometers: 0.2Hz to 50 Hz • Operating temperature is –20 °C to +60 °C • Sensor full scale: 0.1 g • Least significant bit: 0.004 mg • Trigger range: 0.004 mg to 80 mg • Recording sample per second: 100 or 200 sps
During the on-off test, the response of the dam was recorded by the short period SS-1 seismometers and SSR-1 seismic data recorders. The frequency operating range of the seismometer is approximately 0.1Hz to at least 50 Hz. Frequency response amplitude is asymptotically flat above 1 Hz resonant frequency and decays below it with –40 dB/dec slope. As it is a passive sensor, it doesn’t require external power. This fact and its mechanical robustness make it very suitable for field work. Also it has no DC offset voltage problem since it is passive device [8]. The SSR-1 recorders are highly flexible digital seismographic event recorder which records into solid state RAM. It can support up to six sensors including SS-1 [9].

TEST PROGRAM Forced Vibration Test In the forced vibration test, the shakers were attached firmly to large concrete blocks embedded in the centerline of dam crest. Based on the preliminary results of ambient vibration tests (and numerical studies) and characteristics of the shakers, the arrangement of the shakers was selected to stimulate most symmetric and anti-symmetric modes of the dam body. Consequently, one 3×3×1m block was located at the dam center (for installing one 3 ton shaker) and another 4×3×1m close to the quarter section (for installing two 1 ton shakers). The three shakers were adjusted to apply same force upon each foundation in the frequency range 1-14 Hz. In order to allow sufficient clearance for traffic on the crest and transfer the vibrations correctly from exciters to dam body, the reinforced concrete blocks were cast in place in excavated areas one and half meter below the dam crest (figure 2- a, b) and covered with reinforced concrete slabs. Figure 2-c shows the 1 and 3-ton shakers after installation on their foundations and dam crest view during the test.
(a) (b)
(c)
Figure 2: Forced vibration testing of MS embankment dam: The mechanical unbalance mass shakers after their installation on the MS dam crest: (a) 3×3×1m concrete block construction at dam center; (b) 3-ton shaker
installation on concrete block constructed at dam center; (c) the shakers after instalation on their foundations and dam view during the test

The response of the dam body in three U-D, L & V directions were measured in two stages. In each stage, the shakers were synchronized to run in-phase for symmetric vibration and 180° out-of-phase for anti-symmetric vibration. In the first stage of the test (on-off method), the approximate modal frequency values were evaluated by exciting the 3 shakers in 14 Hz frequency and turning off at a same time. During frequency decrement of oscillating masses, the natural frequencies of dam body coincide with the corresponding values of the shakers and consequently, trivial resonance occurs in dam response. The response of the dam body was measured by 4 SS1 seismometers. In the second stage of forced vibration testing program (frequency sweep method), the exact value of natural frequencies and corresponding mode shapes was evaluated. In this stage, the frequency of excitation was increased at 0.1 Hz intervals around preliminary resonant frequencies and the response of the dam body was measured by 21 GeoSig accelerometers (except for V direction, which there has been used 9 SS1 seismometers). Seismic Refraction Investigation During design and construction of the MS dam body, cyclic triaxial and resonant column tests on small specimens have been conducted and shear modulus variation of core and shell materials with shear strain have been evaluated. In order to investigate the in place dynamic shear modulus of the dam body and foundation materials, appropriate seismic refraction survey were performed. Based on the results of the tests, shear wave velocity distributions in the vicinity of core, filters, downstream face, right and left abutments were obtained. The profile situations of the test have been shown in figure 3.
Figure 3: Seismic refraction profiles on dam crest, downstream face, right and left abutments.
ANALYSIS OF RECORDED DATA Natural Frequencies and Mode shapes A MATLAB subroutine [10] was coded for analysis the recorded data. An example of the preliminary frequency analysis results due to on-off test is presented in figure 4. Using this type of test’s results, the frequencies corresponding to important peaks were candidated as the preliminary natural frequencies of the dam body and complementary tests were conducted by exciting the dam in 0.1 Hz intervals around these resonant frequencies. An example of frequency response curve of the dam crest obtained from symmetric frequency sweep test in U-D direction is presented in figure 5. In addition, Mode shapes of MS
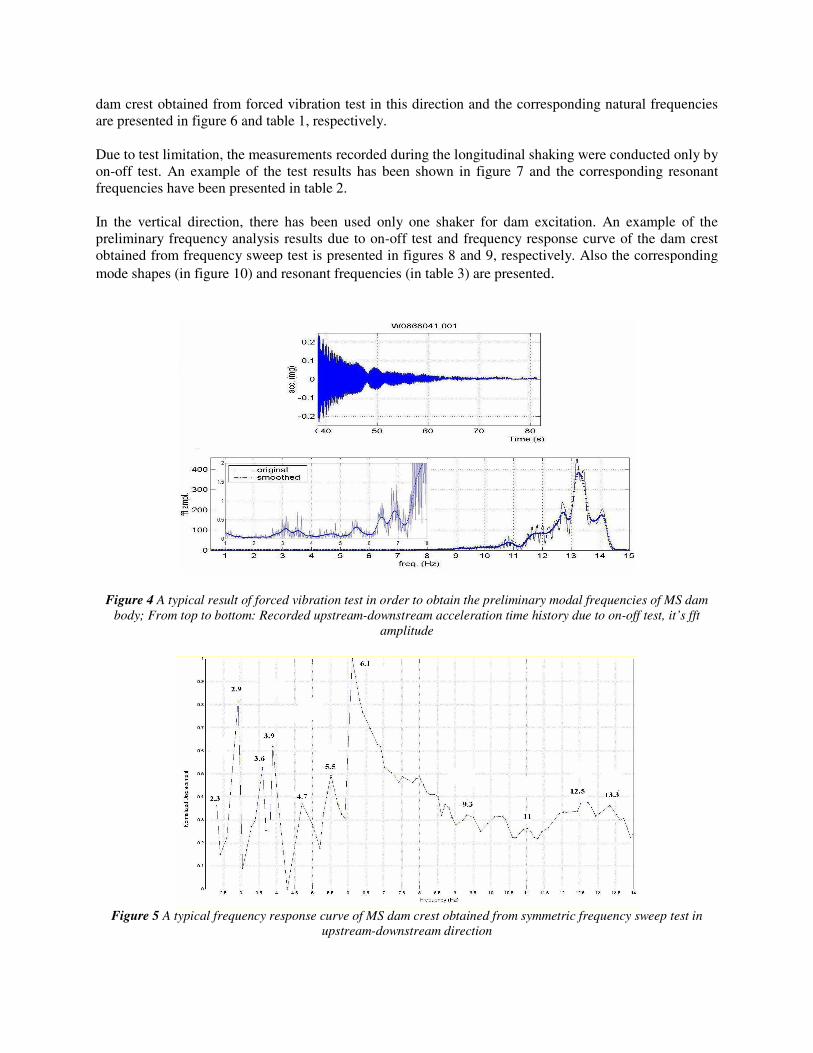
dam crest obtained from forced vibration test in this direction and the corresponding natural frequencies are presented in figure 6 and table 1, respectively. Due to test limitation, the measurements recorded during the longitudinal shaking were conducted only by on-off test. An example of the test results has been shown in figure 7 and the corresponding resonant frequencies have been presented in table 2. In the vertical direction, there has been used only one shaker for dam excitation. An example of the preliminary frequency analysis results due to on-off test and frequency response curve of the dam crest obtained from frequency sweep test is presented in figures 8 and 9, respectively. Also the corresponding mode shapes (in figure 10) and resonant frequencies (in table 3) are presented.
Figure 4 A typical result of forced vibration test in order to obtain the preliminary modal frequencies of MS dam body; From top to bottom: Recorded upstream-downstream acceleration time history due to on-off test, it’s fft
amplitude
Figure 5 A typical frequency response curve of MS dam crest obtained from symmetric frequency sweep test in
upstream-downstream direction

f= 3 .9 H z
-1
-0 .5
0
0 .5
1
0 1 0 0 2 0 0 3 0 0 4 0 0 5 0 0
Da m C r e s t
f= 4 .7 H z
-0 .5
0
0 .5
1
0 1 0 0 2 0 0 3 0 0 4 0 0 5 0 0
D a m C r e s t
f= 2 .9 H z
-1 .5
-1
-0 .5
0
0 .5
1
0 1 0 0 2 0 0 3 0 0 4 0 0 5 0 0
Da m C r e s t
f= 3 .5 H z
-1 .5
-1
-0 .5
0
0 .5
1
1 .5
0 1 0 0 2 0 0 3 0 0 4 0 0 5 0 0
Da m C r e s t
f = 6 .1 H z
-0 .5
0
0 .5
1
0 1 0 0 2 0 0 3 0 0 4 0 0 5 0 0
D a m C r e s t
Figure 6 Mode shapes of MS dam crest obtained from forced vibration test in upstream-downstream direction
Table 1. Resonant frequencies (HZ) and corresponding mode shapes of the MS embankment dam in upstream-
downstream direction due to forced vibration test
Mode type Second
sym. Second antisym.
Third sym.
Forth sym.
Third antisym.
Fifth sym.
- - - -
Freq. (Hz) 2.9 3.5 39 4.7 6.1 6.9 9.1 11 12.5 13.2
Freq. Range (Hz)
- 3.5-3.6 3.7-3.9 4.7-4.9 6-6.1 6.8-6.9 9.1-9.3 11-11.2 - 13.2-13.3
Note: • sym. = symmetric
• antisym.= anti-symmetric • - : specifies the frequencies with no possible unique mode shape identification

Figure 7 A typical result of forced vibration test in order to obtain the preliminary modal frequencies of MS dam body; From top to bottom: Recorded longitudinal time history due to on-off test, it’s fft amplitude
Table 2. Resonant frequencies (HZ) of the MS embankment dam in longitudinal direction due to forced vibration
test
Freq. (Hz) 1.8 2.2 2.4 2.9 4.6 5.1 6 6.7 8.5 12.1 13.3
Freq. Range (Hz)
- - - 4.7-4.9 6-6.1 6.8-6.9 - 11-11.2 - 13.2-13.3 -
Note: • - : specifies the frequencies with no possible unique mode shape identification
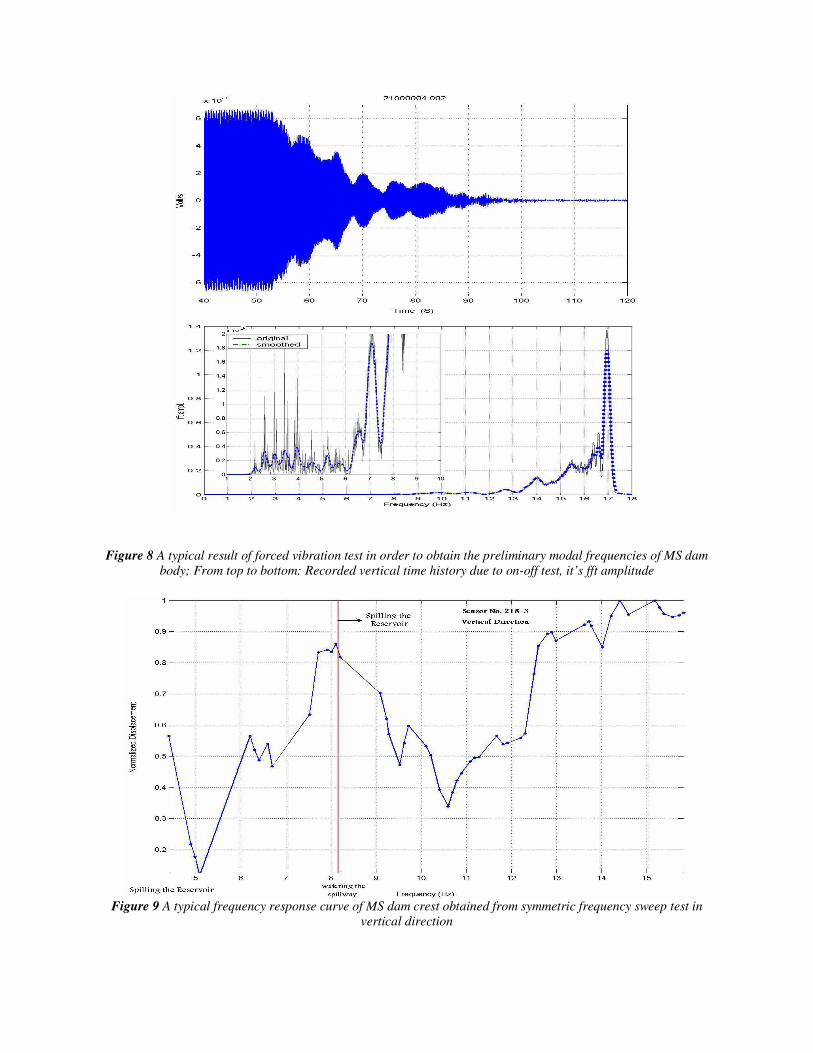
Figure 8 A typical result of forced vibration test in order to obtain the preliminary modal frequencies of MS dam body; From top to bottom: Recorded vertical time history due to on-off test, it’s fft amplitude
Figure 9 A typical frequency response curve of MS dam crest obtained from symmetric frequency sweep test in
vertical direction

f=2.1
-0.5
0
0.5
1
0 100 200 300 400 500
Dam Crest
f=2.9
-0.5
0
0.5
1
0 100 200 300 400 500
Dam Crest
f=6.2
-0.5
0
0.5
1
0 50 100 150 200 250 300 350 400 450 500
Dam Crest
Figure 10 Mode shapes of MS dam crest obtained from forced vibration test in vertical direction
Table 3. Resonant frequencies (HZ) and corresponding mode shapes of the MS embankment dam in vertical
direction due to forced vibration test
Mode type First sym.
Second sym.
- - Forth sym.
- - - - - -
Freq. (Hz) 2.1 2.9 4.4 5.2 6.2 6.6 8.1 9.2 9.8 10.7 12.5
Freq. Range (Hz)
2-2.1 2.9-3 4.4-4.7 5.1-5.2 - - 7.9-8.2 - 9.7-9.8 - 12.5-12.7
Note: • sym. = symmetric
• - = specifies the frequencies with no possible unique mode shape identification Estimation OF Damping Values For each identified mode of forced vibration test, an equivalent viscous damping ratio was determined by both logarithmic decrement (for on-off test step) and half-power bandwidth (for frequency sweep test) method. In some cases, the measured damped sinusoids exhibit contamination from nearby modal responses. This phenomenon affected not only the damped free vibration of these modes, but also the width of the modal peaks of the response curves at the 0.707 points. Consequently, it was preferred to evaluate the modal damping values by both methods.

Totally, It was shown that the damping values of dam body in low strain level was 2-5% for all important modes. Also there was not found an exact tendency in damping values to increase or decrease from lower fundamental mode to higher.
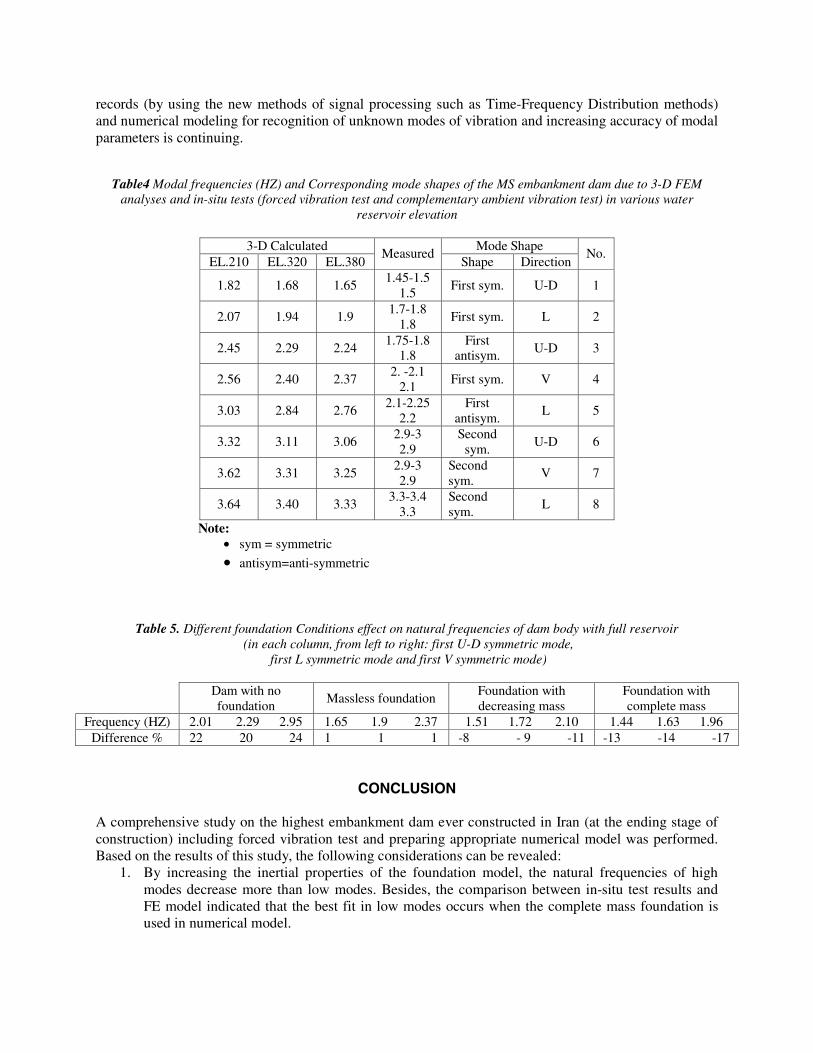
MODAL ANALYSIS The 2-D & 3-D modal analysis of MS embankment dam were developed using ANSYS software [11] and the natural frequencies and mode shapes of the dam body were estimated. In order to study the water level effect on the dynamic properties of the dam body, three different levels of water reservoir were modeled: empty, medium (water level in +320 elevation for the crest elevation of +380) and finally full reservoir condition. There has been used 355 PLANE 42 elements and 384 nodes for 2-D analysis whereas 3801 SOLID45 elements and 858 nodes for 3-D analysis. The dynamic soil properties of the dam body and foundation materials were estimated based on consulting Eng. reports and appropriate seismic refraction investigations. Foundation-dam interaction effect was investigated by modeling 5 different foundation depth (foundation depth to dam height ratio as 0.1, 0.25, 0.5, 1 and 1.5) and 3 different inertial properties (massless, decreasing mass and complete mass model). In the decreasing mass model, the foundation inertia near the dam body is considered completely, whereas towards the outsiding boundaries it reaches to zero. Figure 11 shows the final 3-D finite element model of the dam body and the corresponding foundation. Because of the low slope and high porosity of the shell, the hydrodynamic effects of the reservoir on dynamic properties of the dam has been neglected, while the shear modulus and density values of the dam materials has been affected due to impounding effects. The natural frequencies for 8 modes of 3-D FEM in three water levels are presented in table 4. Furthermore, corresponding 3-D mode shapes of the dam body in U-D direction for medium water level are presented in figure 12. In order to consider the effect of different foundation conditions on natural frequencies of the dam body, 3 first natural frequencies in 4 different cases are summarized in table 5. The results of numerical models by different foundation and water level conditions reveal the following: By decreasing 60 m in the water level of full reservoir, 1.8% increase in the first natural frequency and 2.2% in the mean first 5 frequencies observed. These values increased to 10% and 9.2% (respectively) when 170 m decrease of water level (empty reservoir) was considered. The rate of natural frequency decrement reduces by increasing the foundation depth to dam height ratio. It was found that the optimum foundation and abutment depth in numerical model is as the dam height. In this case, the first natural frequencies in U-D, L and V directions estimated by massless foundation are almost 18% less than the model with no foundation. Furthermore, by increasing the inertial properties of the foundation, the natural frequencies of the dam body decrease. I.e., the first natural frequencies in 3 mentioned directions estimated by complete mass foundation are almost 15% less than massless one. The first natural frequency of the dam body calculated by 3-D FEM is 31% more than 2-D one, which is in good agreement with reference curves [10]. It is due to the small L/H ratio and the topographical features of the MS dam and consequently, the three-dimensional stiffening effect of narrow canyon on dynamic behavior of dam body.

Figure 11: The final finite element model of MS dam body and foundation
(a)
(b)
(c)
Figure 12: The lowest 3 mode shapes of MS dam in U-D direction for
medium level of water reservoir (water El.: 320 m). a: first symmetric, b: first antisymmetric & c: second symmetric mode
COMPARISON OF MEASURED AND COMPUTED RESULTS
Based on the presented results and obtained mode shapes, the first natural frequency of 2-D analysis is 15% less than the measured one, whereas the corresponding 3-D analysis with massless foundation is 10% more. Since there is no scope for across valley motion in 2-D model, no across valley modes can be predicted. Meanwhile a full 3-D model, which predicts also modes across the valley direction, overestimates frequencies, but provides a good estimate of the mode shapes. The best compromise between the measured and 3-D computed values (specially in the low modes) occurred when decreasing mass foundation height became as the height of the dam. In this case, the calculated first natural frequency is approaching the most to the measured one. In high modes of dam body, it seems that the results of massless foundation model fits better to measured one. Complementary studies on both in-situ
records (by using the new methods of signal processing such as Time-Frequency Distribution methods) and numerical modeling for recognition of unknown modes of vibration and increasing accuracy of modal parameters is continuing.
Table4 Modal frequencies (HZ) and Corresponding mode shapes of the MS embankment dam due to 3-D FEM analyses and in-situ tests (forced vibration test and complementary ambient vibration test) in various water
reservoir elevation
3-D Calculated Mode Shape EL.210 EL.320 EL.380
Measured Shape Direction
No.
1.82 1.68 1.65 1.45-1.5
1.5 First sym. U-D 1
2.07 1.94 1.9 1.7-1.8
1.8 First sym. L 2
2.45 2.29 2.24 1.75-1.8
1.8 First
antisym. U-D 3
2.56 2.40 2.37 2. -2.1
2.1 First sym. V 4
3.03 2.84 2.76 2.1-2.25
2.2 First
antisym. L 5
3.32 3.11 3.06 2.9-3 2.9
Second sym.
U-D 6
3.62 3.31 3.25 2.9-3 2.9
Second sym.
V 7
3.64 3.40 3.33 3.3-3.4
3.3 Second sym.
L 8
Note: • sym = symmetric
• antisym=anti-symmetric
Table 5. Different foundation Conditions effect on natural frequencies of dam body with full reservoir (in each column, from left to right: first U-D symmetric mode,
first L symmetric mode and first V symmetric mode)
Dam with no foundation
Massless foundation Foundation with decreasing mass
Foundation with complete mass
Frequency (HZ) 2.01 2.29 2.95 1.65 1.9 2.37 1.51 1.72 2.10 1.44 1.63 1.96 Difference % 22 20 24 1 1 1 -8 - 9 -11 -13 -14 -17
CONCLUSION
A comprehensive study on the highest embankment dam ever constructed in Iran (at the ending stage of construction) including forced vibration test and preparing appropriate numerical model was performed. Based on the results of this study, the following considerations can be revealed:
1. By increasing the inertial properties of the foundation model, the natural frequencies of high modes decrease more than low modes. Besides, the comparison between in-situ test results and FE model indicated that the best fit in low modes occurs when the complete mass foundation is used in numerical model.

2. By increasing the water level of the reservoir, the natural frequencies of the dam decrease, but not more than 10% in the case of maximum water level change. This could be mainly attributed to the material properties variation in numerical model due to impounding and not to the hydrodynamic interaction effect, which is neglected.
3. The results of the dynamic soil properties investigation showed that the concept of shear wave velocity distribution with depth leads to better results in FE modeling than the concept of using empirical relations for estimating the maximum shear modulus in the dam body.
ACKNOWLEDGEMENTS
The authors are grateful of the Iranian Water and Power Company IWPC (the owner of the MS dam) for excellent cooperation and many people contributed substantially to the work described in this paper, especially from geotecnical department and Electronic Instrumentation group of IIEES.
REFERENCES 1. Jafari M.K., Davoodi M., “Forced and Ambient Vibration Tests of embankment Dams”, IIEES, I.R.
Iran, 2002 (in Persian). 2. Dakoulas P., Hsu C.,” Lateral Response of Dams in Semi-Elliptical Rigid Canyons”, Soil Dynamics
and Earthquake Engineering 1993, 12, 497-507. 3. “Seismic Hazard Analysis of Godar-E-Landar site”, Final Report, Mahab-Godss Consulting Engineer,
May 1994. 4. Manual of “Vibration Exciter Model EX-250 DL”, Spec. No. 143-5, ITOH SEIKI CO. LTD, Tokyo,
Japan, 1992. 5. Manual of “Syncronizable Vibration Exciter Model EX-20NH”, Spec. No. 205-(1) (2), ITOHS EIKI
CO. LTD, Tokyo, Japan, 1992. 6. Ahmadi M.K., Heidari H.R., “Synchronization of Vibrational Generating System ”, IIEES, I.R. Iran,
2001. 7. Technical Documentation of “SMACH CR-2 and CR-1 Central Recorders and AC-21 & AC-23
Accelerometers”, GeoSig User Manual, www.geosig.ch,2001. 8. Manual of “Operating Instructions for Model SS-1 Ranger Seismometer”, Kinemetrics Systems,
Pasadena, Calif., 1990. 9. Manual of “SSR-1Solid State Recorder”, Kinemetrics Systems, Pasadena, Calif., 1990. 10. Help of "MATLAB Software, Signal Processing Toolbox", Ver.6, Mathworks Inc., 2000. 11. “ANSYS Theory Manual, ANSYS Release 5.4”, ANSYS INC, Canon Sburg, USA, 8th edition,
www.ansys.com, 1997.