Embed Size (px)
Citation preview
BGD5, 3157–3219, 2008
Dynamic chambers tostudy trace gas
exchange ofgrassland
L. Pape et al.
Title Page
Abstract Introduction
Conclusions References
Tables Figures
J I
J I
Back Close
Full Screen / Esc
Printer-friendly Version
Interactive Discussion
Biogeosciences Discuss., 5, 3157–3219, 2008www.biogeosciences-discuss.net/5/3157/2008/© Author(s) 2008. This work is distributed underthe Creative Commons Attribution 3.0 License.
BiogeosciencesDiscussions
Biogeosciences Discussions is the access reviewed discussion forum of Biogeosciences
An automated dynamic chamber systemfor surface exchange measurement ofnon-reactive and reactive trace gases ofgrassland ecosystems
L. Pape1, C. Ammann2, A. Nyfeler-Brunner2, C. Spirig2, K. Hens1, andF. X. Meixner1,3
1Max Planck Institute for Chemistry, Biogeochemistry Department, P.O.Box 3060, 55020Mainz, Germany2Agroscope ART Research Station, Reckenholzstrasse 191, 8046 Zurich, Switzerland3Department of Physics, University of Zimbabwe, P.O. Box MP 167, Harare, Zimbabwe
Received: 27 June 2008 – Accepted: 5 July 2008 – Published: 12 August 2008
Correspondence to: L. Pape ([email protected])
Published by Copernicus Publications on behalf of the European Geosciences Union.
3157

BGD5, 3157–3219, 2008
Dynamic chambers tostudy trace gas
exchange ofgrassland
L. Pape et al.
Title Page
Abstract Introduction
Conclusions References
Tables Figures
J I
J I
Back Close
Full Screen / Esc
Printer-friendly Version
Interactive Discussion
Abstract
We present an automated dynamic chamber system which is optimised for continuousunattended flux measurements of multiple non-reactive and reactive trace gases ongrassland ecosystems. Main design features of our system are (a) highly transparentchamber walls consisting of chemically inert material, (b) individual purging flow units5
for each chamber, and (c) a movable lid for automated opening and closing of thechamber. The purging flow rate was chosen high enough to keep the mean residencetime of the chamber air below one minute. This guarantees a proven efficient mixingof the chamber volume and a fast equilibration after lid closing. The dynamic chambersystem is able to measure emission as well as deposition fluxes of trace gases. For10
the latter case, the modification of the turbulent transport by the chamber (comparedto undisturbed ambient conditions) is quantitatively described by a bulk resistanceconcept.
Beside a detailed description of the design and functioning of the system, resultsof field applications at two grassland sites are presented. In the first experiment,15
fluxes of five trace gases (CO2, H2O, NO, NO2, O3) were measured simultaneouslyon small grassland plots. It showed that the dynamic chamber system is able to detectthe characteristic diurnal cycles with a sufficient temporal resolution. The results alsodemonstrated the importance of considering the chemical source/sink in the chamberdue to gas phase reactions for the reactive compounds of the NO-NO2-O3 triad. In20
a second field experiment, chamber flux measurements of CO2 and methanol werecompared to simultaneous independent eddy covariance flux measurements on thefield scale. The fluxes obtained with the two methods showed a very good agreementindicating a minimal disturbance of the chambers on the physiological activity of theenclosed vegetation.25
3158

BGD5, 3157–3219, 2008
Dynamic chambers tostudy trace gas
exchange ofgrassland
L. Pape et al.
Title Page
Abstract Introduction
Conclusions References
Tables Figures
J I
J I
Back Close
Full Screen / Esc
Printer-friendly Version
Interactive Discussion
1 Introduction
Grassland ecosystems cover a large fraction (21%) of the global terrestrial surface(Butcher et al., 1992). They are sources and sinks for numerous non-reactive(e.g. CO2, N2O, CH4) and reactive (e.g. NO, NO2, NH3, O3, VOC) trace gases whichplay an important role in atmospheric chemistry and air pollution (Brunner et al., 2007a;5
Bassin, 2007; Tilsner et al., 2003; Herrmann et al., 2001). Grassland ecosystems arecharacterised by distinct dynamics with respect to vegetation growth, species diversity,and management effects. Therefore, trace gas emission from grassland is highlyvariable (diurnal, seasonal) and often event related, e.g. pulse-like emissions followingfertilisation, cut, rain, blooming, etc. (e.g. Bakwin et al., 1990; Davison et al., 2008;10
Meixner et al., 1997).Grassland vegetation is delicate and may easily be affected by measurement
installations. Furthermore, it may undergo several management activities whichrequire periodical removal of field installations. Therefore, the ideal flux measurementsetup for grassland should be robust and mobile. It should facilitate automated15
(quasi-) continuous measurements at multiple points or sub-plots to capture diurnaland seasonal variations as well as spatial variability (on large fields) or managementeffects (on small parallel plots). The disturbance of environmental conditions(e.g. radiation, temperature, humidity, trace gas concentrations) by measurementinstallations should be minimised in order to ensure optimum vegetation development20
and plant physiological activity. This is particularly important for flux measurementof those trace gases whose exchange process is predominantly controlled by plantstomatal activity. Micrometeorological methods (e.g. eddy covariance methods) areoptimal concerning minimal disturbance. However, they are limited to large fields(with extensions of typically ≥100 m; see Horst and Weil, 1994) and to few trace25
gases for which fast (time response of 1 Hz or higher) and very sensitive sensorsare available. For smaller plots (usually used for manipulation experiments), chambermethods are the main alternative to micrometeorological techniques. One chamber
3159

BGD5, 3157–3219, 2008
Dynamic chambers tostudy trace gas
exchange ofgrassland
L. Pape et al.
Title Page
Abstract Introduction
Conclusions References
Tables Figures
J I
J I
Back Close
Full Screen / Esc
Printer-friendly Version
Interactive Discussion
typically covers a surface area of 0.01 to 1 m2 (Livingston and Hutchinson, 1995).Using multiple spatially distributed chambers, the flux variability (heterogeneity) oflarger field areas can be assessed. Static (i.e. closed, non-stationary) chambersare widely used for flux measurements of greenhouse gases or other inert tracegases. However, during the closed state (measurement phase) they usually cause5
non-constant environmental conditions inside the chamber which may be far away fromambient conditions (e.g. accumulation of heat and water vapour; strong depletion ofCO2 and other depositing trace gases). Thus, static chambers can considerably affectplant activity and consequently the emission or uptake processes of the trace gases ofinterest. The non-stationary conditions inside the chamber cause additional problems10
for reactive gases, because the influence of chemical sources or sinks is not constantand thus difficult to quantify.
For measuring the surface exchange of reactive trace gases, dynamic(i.e. steady-state, flow-through) chambers are more suitable (Meixner, 1994).Continuous renewal of the chamber air guarantees that trace gas concentrations and15
other related quantities remain (quasi-) constant and close to ambient conditions. Thedesign and operation characteristics of dynamic chambers reported so far were usuallyadjusted to the requirements of one specific trace gas and focussed on either plant-airor soil-air exchange (see e.g. Table 4 for measurements of NO emission fluxes). Manyof the chambers were operated manually and thus could only be applied in the field20
during intensive short campaigns or with a very low time resolution (in the order ofweeks).
In this paper we present an automated dynamic chamber system which is optimisedfor continuous unattended flux measurements of multiple non-reactive and reactivetrace gases on grassland ecosystems. The development of this system is based25
on previous (partly automated) systems used for NO, NO2, and O3 exchange ofmarshland, heath, and wheat fields (Remde et al., 1993; Ludwig, 1994; Meixner,1994) and forest soil (Gut et al., 2002a, 2002b; Lehmann, 2002), as well as for thereactive organic trace gas exchange of tree branches (Kesselmeier et al., 1997; Kuhn
3160

BGD5, 3157–3219, 2008
Dynamic chambers tostudy trace gas
exchange ofgrassland
L. Pape et al.
Title Page
Abstract Introduction
Conclusions References
Tables Figures
J I
J I
Back Close
Full Screen / Esc
Printer-friendly Version
Interactive Discussion
et al., 2002). Main features of our system are (a) highly transparent chamber wallsconsisting of chemically inert material to minimise wall loss of reactive trace gases,(b) individual purging flow units for each chamber, and (c) an automated lid so thatthe chamber can be kept open except for the short measurement periods. Beside adetailed description of the design and functioning of the system, we will present results5
of specific test measurements, and exemplary results of field applications of our systemat two different grassland sites.
2 Materials and methods
2.1 Dynamic chamber theory
2.1.1 Chamber flux of inert trace gases10
For any chamber system, the flux Fcham of an inert trace gas (i.e. no chemical reactionswith other air constituents or with the chamber walls) between the plant-soil system andthe chamber air is determined by the mass balance of the trace gas in the enclosedheadspace. As derived in Appendix B, it can be described as:
V · ρddµcham
dt= A · Fcham −Q · ρd
[µcham − µamb
](1)15
Here V denotes the volume and A the soil surface area enclosed by the chamber, andQ is the purging air flow rate. µcham and µamb are the trace gas mixing ratios of theinflowing ambient air and of the outflowing chamber air, respectively (see Fig. 1a). ρdis the density of the dry air molecules, and t denotes time. A complete list of symbols,abbreviations, and units is given in Appendix A. While for static chambers Q is zero,20
dynamic chambers are operated with a continuous purging of the chamber air. In thisway, a dynamic equilibrium (steady-state) is developing, where the time derivative andtime dependences in Eq. (1) vanish. Under equilibrium conditions, the mass budget
3161

BGD5, 3157–3219, 2008
Dynamic chambers tostudy trace gas
exchange ofgrassland
L. Pape et al.
Title Page
Abstract Introduction
Conclusions References
Tables Figures
J I
J I
Back Close
Full Screen / Esc
Printer-friendly Version
Interactive Discussion
equation for a dynamic chamber can thus be reduced and rearranged to:
Fcham =QA
· ρd[µcham − µamb
](2)
Realisation of the dynamic chamber principle commonly follows some generalassumptions and design features. Since the purging air flow (Q) through the chamberhas to be known for the flux determination, it is usually produced and maintained5
constant by a pump or fan either at the inlet or at the outlet. With a sufficiently highpurging air flow and/or with the help of additional internal mixing fans (see Sect. 2.2),the chamber headspace can be assumed to be well mixed, i.e. the trace gas mixingratio (µcham) is uniform throughout the chamber and thus equals the mixing ratio of theout-flowing air (as already assumed in Eq. 1).10
2.1.2 Modification of turbulent transport by the chamber
As the most important characteristic of a dynamic chamber, the measured trace gasexchange should be as representative as possible, i.e. not affected (altered) by theapplication of the chamber itself. However, the alteration of the aerodynamic transportis an inherent unavoidable consequence of the application of dynamic chambers.15
Hence, trace gas concentrations above and within the enclosed vegetation canopyare modified. In order to describe this effect in a quantitative way, we consider thecommon bulk resistance model (Hicks et al., 1987; Wesely and Hicks, 2000) and adjustit for the specific environment of the chamber volume. As shown in Fig. 1b, the totalexchange resistance under ambient conditions outside the chamber consists of the20
sum of the turbulent resistance (Ra), the quasi-laminar boundary layer resistance (Rb),and the surface resistance (Rc). Thus the true trace gas flux in ambient conditions(Famb) without the influence of a chamber can be written as:
Famb =1
Ra + Rb + Rcρd
(µcomp − µamb
)(3)
3162

BGD5, 3157–3219, 2008
Dynamic chambers tostudy trace gas
exchange ofgrassland
L. Pape et al.
Title Page
Abstract Introduction
Conclusions References
Tables Figures
J I
J I
Back Close
Full Screen / Esc
Printer-friendly Version
Interactive Discussion
The so-called “compensation point” (Wesely and Hicks, 2000) or “compensationmixing ratio” (µcomp) represents a real or virtual concentration at the lower end of theresistance chain, i.e. inside the plant leaf or in the soil (for microbiological meaning ofµcomp see Conrad, 1994). For exclusively deposited compounds like O3 or nitric acid(HNO3), µcomp equals zero.5
The application of the dynamic chamber modifies the turbulence regime and thus theresistance chain for the trace gas exchange between the ambient air and the plant/soilsystem (see right-hand part of Fig. 1b). The most obvious modification happens toRa. It is replaced by two resistances in series, namely the purging resistance (Rpurge)between ambient and chamber air and the mixing resistance (Rmix), which represents10
the turbulent mixing inside the chamber. If the chamber air is reasonably well mixed byfans, Rmix gets very small as shown by Ludwig (1994), and below in Sect. 3.2.1. Thusit can be neglected in comparison to Rpurge. The forced mixing inside the chamber alsoresults in a modified boundary layer resistance R∗
b as compared to Rb outside of thechamber.15
As mentioned above, a fundamental requirement for the dynamic chamber techniqueis minimum alteration of the investigated source/sink processes of the trace gas ofinterest within plants and soil by the application of the chamber itself. If this requirementis fulfilled by an optimised chamber design (see below), the chamber compensationmixing ratio (µ∗
comp) and the chamber surface resistance (R∗c) should be very close20
to the conditions outside of the chamber (i.e. µ∗comp≈µcomp and R∗
c≈Rc), despite themodified aerodynamic transport regime. In analogy to Eq. (3), the chamber flux can bewritten as:
Fcham =1
Rpurge + R∗b + Rc
ρd(µcomp − µamb
)(4)
For depositing compounds with zero or low compensation points (µcomp�µamb), Fcham25
is generally affected by the modified transport through the chamber. The magnitudeand direction of the modification strongly depends on the relative size of Rc and the
3163

BGD5, 3157–3219, 2008
Dynamic chambers tostudy trace gas
exchange ofgrassland
L. Pape et al.
Title Page
Abstract Introduction
Conclusions References
Tables Figures
J I
J I
Back Close
Full Screen / Esc
Printer-friendly Version
Interactive Discussion
turbulence related resistances. This can be elucidated by the ratio of Fcham and Ftruefollowing from Eqs. (3) and (4):
Fcham
Famb=
Ra + Rb + Rc
Rpurge+ R∗
b + Rc (5)
In the non-modified case, Ra and Rb are direct functions of the turbulence intensitydescribed by the friction velocity u∗ (Hicks et al., 1987), which varies with wind speed5
and thermal stratification. In this way, the measured chamber flux determined byEq. (2) can be corrected if all resistance values inside and outside the chamber can bequantified.
In the case of trace gas emissions (e.g. for NO and most VOCs), the underlyingproduction processes in the soil and plants are usually independent of the respective10
ambient or chamber concentration (in contrast to the deposition processes). Thus theemission flux is not sensitive to the turbulence conditions in the air neither outside norwithin the chamber, and a correction according to Eq. (5) is not necessary.
2.1.3 Chemical reactions inside the chamber
Reactive trace gases in the atmosphere, like e.g. NO, NO2, and O3, may be subject15
to (photo-) chemical reactions with typical time scales of the same order of magnitudelike the residence time of air in the chamber. In this case, the determination of surfaceexchange fluxes by the dynamic chamber method has to take into account the relevantchemical sources and sinks in the chamber volume. For the specific case of NO, NO2,and O3 the main gas-phase reactions outside and inside the chamber are (Remde et20
al., 1993; Warneck, 2000):
NO + O3 → NO2 + O2 (R1)
NO2 + hνO2−→ NO + O3, λ ≤ 420nm (R2)
3164

BGD5, 3157–3219, 2008
Dynamic chambers tostudy trace gas
exchange ofgrassland
L. Pape et al.
Title Page
Abstract Introduction
Conclusions References
Tables Figures
J I
J I
Back Close
Full Screen / Esc
Printer-friendly Version
Interactive Discussion
Formulating the reaction kinetics for NO in (R1) and (R2) yields:
dµ(NO)
dt= −k · µ(NO) · µ(O3) (6)
dµ(NO)
dt= j (NO2) · µ(NO2) (7)
where k is the first order reaction rate constant of (R1) (see Appendix A) and j (NO2) isthe photolysis rate of NO2. The resulting net gas-phase source (Sgp) for NO within the5
chamber volume can be described as:
Sgp(NO) = V ·[j(NO2) · µcham(NO2) − k · µcham(NO) · µcham(O3)
](8)
For ozone and NO2, the reaction kinetics of the gas phase reactions (R1) and (R2)are equal or opposite to that of NO, and thus the corresponding net chemical source isrelated to Eq. (8) as:10
Sgp(NO) ≡ Sgp(O3) ≡ −Sgp(NO2) (9)
Taking into account the net chemical source within the chamber volume, the massbudget in Eq. (1) has to be expanded for any of the three reactive trace gases to:
V · ρddµcham
dt= A · Fcham −Q · ρd
[µcham − µamb
]+ Sgp (10)
and the corresponding chamber flux Eq. (2) is modified to:15
Fcham =QAρd
[µcham − µamb
]− 1
ASgp (11)
2.2 Chamber design and operation
Our design of the dynamic chamber system (see Fig. 2) aims at a minimisedmodification of the trace gas exchange (cf. Sect. 2.1.2) but is also based on practical
3165

BGD5, 3157–3219, 2008
Dynamic chambers tostudy trace gas
exchange ofgrassland
L. Pape et al.
Title Page
Abstract Introduction
Conclusions References
Tables Figures
J I
J I
Back Close
Full Screen / Esc
Printer-friendly Version
Interactive Discussion
requirements concerning robustness and maintenance in the field. The chamber bodyhas a cylindrical shape with 0.35 m inner diameter and 0.43 m height, resulting in anenclosed surface area (A) of 0.096 m2 and a headspace volume (V ) of 0.041 m3. Themanufacturer details of the used materials and parts are listed in Table 1. The outersupporting frame and the movable lid are made of acrylic glass. The inner walls consist5
of a thin transparent FEP film (0.05 mm) tube (welded from a 1.25×0.53 m large FEPfilm sheet). The inner side of the lid is also covered by FEP film. The FEP film parts arefixed by elastic silicone straps running in 4 mm grooves at the outer sides of frame andlid. This provides an easy replacement of the FEP film parts when dirty or damaged.The chamber’s lid is fixed to a lever arm which is moved by a DC motor with gear10
assembly mounted to the frame. An inclinometer mounted on the lever arm monitorsthe lid’s angular position. In the field, the chamber is fixed on pre-installed PVC soilcollars (depth 0.12 m, thickness 5 mm) by four aluminium clamps. Several holes in thesupporting acrylic glass frame allow the installation of inlet and outlet ducts as well asof sample tubes, mixing fans, and sensors for environmental parameters.15
The purging air flow through the chamber is established by a blowing axial inletfan (range: 0–80 l min−1) which is controlled by an air mass flow sensor (range:0–200 l min−1). They are mounted outside the chamber frame and are connectedvia a 3 cm wide PVC inlet tube (Fig. 2). The purging air enters the chamber volume0.11 m above ground, while the outlet hole (3 cm diameter) is located 0.31 m above20
ground on the opposite side. The mass flow sensors were calibrated before and afterfield application using a laboratory mass flow meter (M+W Instruments, Germany).The variation between individual calibrations was less than 0.5%. Continuousturbulent mixing inside the chamber is maintained by two Teflon coated ultra slim fans(360 l min−1 at nominal voltage/12 V DC) blowing downwards.25
The spectral radiation transmissivity of the chamber frame and body materials isillustrated in Fig. 3. In the wavelength range of the photosynthetic active radiation(PAR, 400–700 nm) the transmissivity of the FEP film is around 0.95, while for theacrylic glass it is on average 0.81. In the ultraviolet wavelength domain (≤420 nm,
3166

BGD5, 3157–3219, 2008
Dynamic chambers tostudy trace gas
exchange ofgrassland
L. Pape et al.
Title Page
Abstract Introduction
Conclusions References
Tables Figures
J I
J I
Back Close
Full Screen / Esc
Printer-friendly Version
Interactive Discussion
comprising the photolysis frequency range for NO2 (j (NO2))) the FEP film has anaverage transmissivity of 0.9, while for the acrylic glass of frame and lid it is negligiblysmall. The average radiation transmissivity of the whole chamber body (FEP film +50%acrylic glass) is estimated to about 0.86 for PAR and 0.48 for j (NO2), respectively. Forresults of field measurements of the chamber transmissivity for j (NO2) we refer to5
Sect. 3.3.Up to six chambers can be combined to one system (see Fig. 4a). Each chamber
is connected to an individual controller module (ICO), which is installed in the field at1–2 m distance from the chamber. A detailed schematic drawing of the ICO is displayedin Fig. 4b. The ICO supplies power for all consumers of the chamber (lid motor, purging10
and mixing fans). Further, it provides recording of the signals of operation-relatedsensors (flow meter, inclinometer) and various environmental sensors (probes for airtemperature, soil temperature, soil water content, surface wetness). Three additionalanalogue input channels (0–10 V DC) and 3 analogue output channels (0–5 V DC)can be used to control additional measurement devices in the field. Finally, the ICO15
contains two PFA solenoid valves which control the gas sampling from the individualchambers to the gas analysers.
The ICOs, which have unique addresses for serial bus communication, areconnected in line by combined communication and power cables (24–30 V DC) andcontrolled by a central V25 microprocessor unit (see Fig. 4a). The V25 is programmed20
(PASCAL based code) to send control commands and to read out the data from theICOs every second. Monitoring the signals of the inclinometer and mass flow meter,it controls the motor for lid opening and closing as well as the inlet fan for the purgingair flow by 1 s feedback loops. Further, it controls the DC output for switching thesolenoid valves inside the ICOs and the ICOs’ DC output for the mixing fans. The V2525
unit has eight analogue input channels (0–10 V DC) by which the signals of trace gasanalysers and other instruments can be recorded every second, while eight analogueoutput channels (0–10 V DC) may be used to control additional external devices. TheV25 microprocessor may be operated manually via built-in keypad and display. This
3167

BGD5, 3157–3219, 2008
Dynamic chambers tostudy trace gas
exchange ofgrassland
L. Pape et al.
Title Page
Abstract Introduction
Conclusions References
Tables Figures
J I
J I
Back Close
Full Screen / Esc
Printer-friendly Version
Interactive Discussion
allows the user to control the chambers independently from any measurement cycle,e.g. for testing the status of individual components. Automatic control can be performedvia RS232 communication. In the present study, a LabView (National InstrumentsCorp.) program, running on a personal computer, was used. The LabView programreads and processes the data from the V25 (chamber status, environmental sensors,5
and gas analysers) and stores them on hard disk. Furthermore, it allows to setthe parameters for the measurement cycle and activates (closing and purging) anddeactivates (opening and stop purging) the chambers accordingly.
The sample air flow for trace gas analysis is independent from the purging air flow.Ambient air (with mixing ratio µamb) is sampled from the inlet duct 2 cm before entering10
the chamber volume (no. 13 in Fig. 2), while chamber air (µcham) is sampled fromthe centre of the chamber’s headspace 25 cm above ground (no. 14 in Fig. 2). Inorder to minimise deposition losses in the sampling system all parts in contact with thesample gas are made of Teflon (PFA or PTFE). To prevent contamination of tubing andanalysers, particulate matter is removed from the sample air by PTFE particulate filters15
(pore size: 5µm). The sequential sampling of inlet and chamber air and the switchingbetween multiple chambers is controlled by two 3-way PFA solenoid valves housedwithin the ICO control module of each chamber (Fig. 4b). As illustrated in Fig. 4a, thisenables the sampling air entering one central sampling tube that connects up to sixchambers sequentially. In order to prevent condensation in the central sampling tube it20
is heated by a self-limiting heating tape to a few degrees above ambient temperature.The sampling air flow is established by a central PTFE membrane pump (see Fig. 4a).A large sampling air flow of 10–15 l min−1 ensures short residence time in the tubesand allows the simultaneous detection of various trace gases by different analysers.The entire chambers and all controlling devices are built by the mechanic and the25
electronics workshops of the Max Planck Institute for Chemistry (Mainz, Germany).
3168

BGD5, 3157–3219, 2008
Dynamic chambers tostudy trace gas
exchange ofgrassland
L. Pape et al.
Title Page
Abstract Introduction
Conclusions References
Tables Figures
J I
J I
Back Close
Full Screen / Esc
Printer-friendly Version
Interactive Discussion
2.3 Field experiments
The dynamic chamber system was tested and applied during two field experiments atmanaged grassland sites on the Swiss Central Plateau. As part of the COST 852experiment (Quality legume-based forage systems for contrasting environments) inRumlang, (47◦26′N, 8◦32′E, 486 m a.s.l.), the surface exchange of CO2, H2O, NO, NO2,5
and O3 of four differently managed grass and clover plots (18 m2 each) was measuredduring the 2004 and 2005 vegetation periods. Plots #1 and #2 had been planted withWhite clover and received a high (450 kg N ha−1 y−1) and low (50 kg N ha−1 y−1)fertilisation, respectively. Plots #3 and #4 had been planted with English ryegrassreceiving similar high and low fertilisation levels. Usually, one chamber was applied on10
each of the four plots. In addition, one ’blank chamber’ was operated on the site. In theblank chamber, the surface exchange is excluded by closing the bottom of the chamberby inert FEP film. The blank chamber is used to check for unconsidered chemicalproduction or destruction processes within the chamber (in the gas phase or at thewall surfaces). The five chambers were sampled serially within each hour (cf. Fig. 5a).15
Each individual chamber was closed for only 13 min to ensure minimum modificationof environmental conditions. One minute before an individual measuring period (of12 min duration) the normally open chamber lid was closed and the purging air flowwas established. At the beginning of the measuring period, Valve #2 (see Fig. 4b)was switched to sample ambient air from the chamber inlet for 4 min. Afterwards,20
chamber air was sampled for 4 min by switching Valve #1, followed by a secondsampling of ambient air. At the end of the measuring period Valve #2 was disabled,the purging air flow was stopped, and the lid was opened. Measurements of tracegas concentrations were performed by chemiluminescence (NO, NO2), UV-absorption(O3), and non-dispersive infra-red absorption (CO2, H2O) analysers with a temporal25
resolution of 20 s. The analyser specifications are listed in Table 2.The second field experiment was conducted near the village of Oensingen in the
north-western part of Switzerland (7◦44′E, 47◦17′N, 450 m a.s.l.) (see Ammann et al.,
3169

BGD5, 3157–3219, 2008
Dynamic chambers tostudy trace gas
exchange ofgrassland
L. Pape et al.
Title Page
Abstract Introduction
Conclusions References
Tables Figures
J I
J I
Back Close
Full Screen / Esc
Printer-friendly Version
Interactive Discussion
2007). As part of the EU project CarboEurope-IP and the national project COGAS,surface exchange fluxes of CO2 and volatile organic compounds (VOC) were measuredon an intensively managed grassland (0.77 ha). At Oensingen the dynamic chambersystem comprised three chambers (two regular chambers and one blank chamber)with individual measurement intervals of 10 min resulting in a total measurement cycle5
period of 30 min. Alternating with the chamber measurements, field scale methanolfluxes were measured using the eddy covariance method for 30 min within eachhour (Brunner et al., 2007a). Field scale CO2 fluxes were measured continuouslywith a second eddy covariance system (Ammann et al., 2007). These data wereused to validate the quality of the fluxes measured with the dynamic chambers. The10
instruments used in this experiment and their specifications are also listed in Table 2.Chamber fluxes of CO2, H2O, and methanol were calculated according to Eq. (2),
those for NO, NO2 and O3 according to Eqs. (8), (9), and (11). Due to the alternating(non-simultaneous) measurement of the ambient and chamber concentration, atemporally symmetric measurement schedule (µamb→µcham→µamb) was used for each15
chamber as illustrated in Fig. 5a, and the ambient concentration was averaged overboth measurement phases of µamb. In this way, temporal (linear) trends of the ambientconcentration could be accounted for. However, short term variations of the ambientconcentration could lead to an enhanced scatter of the chamber flux results. To limitthis effect, the standard deviation of individual (20 s) measurements of µamb was20
used as rejection criterion. Based on statistical analysis, individual thresholds for thestandard deviations of NO, NO2, and O3, were determined to 1 ppb, 1.7 ppb, and 7 ppb,respectively. All cases exceeding the threshold for at least one of the mentioned gaseswere rejected.
3170

BGD5, 3157–3219, 2008
Dynamic chambers tostudy trace gas
exchange ofgrassland
L. Pape et al.
Title Page
Abstract Introduction
Conclusions References
Tables Figures
J I
J I
Back Close
Full Screen / Esc
Printer-friendly Version
Interactive Discussion
3 Results
3.1 Equilibration after chamber closure
For being able to perform flux measurements of up to six chambers with a high temporalresolution of about 1 h, our chamber system has been designed to operate with shortmeasurement (closing) periods. Therefore fast equilibration of the chamber air after5
closing the lid is crucial. The time necessary for reaching the new dynamic equilibriumwas investigated by analysis of measured time series (Sect. 3.1.1) as well as bynumerical simulation studies (Sect. 3.1.2).
3.1.1 Definitions and exemplary observations
The equilibration of the chamber mixing ratio (µcham) for an inert trace gas is described10
by the differential Eq. (1). Its analytical solution is a first order exponential decayfunction:
µcham(t) = µamb +A · Fcham
Q · ρd
(1 − e−t/τcham
)(12)
The constant mixing ratio µamb of the inflowing ambient air also represents the initialchamber concentration at t=0 (just before closing). The time scale τcham=V/Q is the15
1/e-response time of the exponential function and represents the mean residencetime of air within the well-mixed chamber volume. For the standard purging rateQ=60 l min−1 used in this study, τcham results in 41.4 s. For a reasonable approximationof the “full” equilibration, we will use the time interval for 98% approximation (t98), whichequals 162 s in the present case, and corresponds to about 4×τcham.20
A direct observation of the equilibration process for the trace gas concentrations inthe chamber is hardly possible with our measurement setup, due to the delay effectsintroduced by the sampling tube, the pump (see Fig. 4a), and due to limited responsetimes of the analysers. However, the temporal development of the equilibration is also
3171

BGD5, 3157–3219, 2008
Dynamic chambers tostudy trace gas
exchange ofgrassland
L. Pape et al.
Title Page
Abstract Introduction
Conclusions References
Tables Figures
J I
J I
Back Close
Full Screen / Esc
Printer-friendly Version
Interactive Discussion
reflected in the chamber air temperature, which is recorded without any time delay. Atypical example for the measured chamber air temperature before and after lid closureis shown in Fig. 6. An exponential fit to the data yielded values of τcham=40.9 s andt98=160 s, nearly identical to the values derived from residence time considerationsabove. The displayed example was chosen for its large temperature change but similar5
response times could be observed for almost all field measurements.Time series of trace gas concentration measurements in the field are shown in
Fig. 5b–d. The equilibration process after lid closure is generally not visible in thedata, because the respective time periods are used to sample ambient air (partly ofthe previous chamber, see Fig. 5a). The observed concentration changes are due to10
switching between ambient and chamber air sampling. They show response times (t98)of 30 s to 60 s that do not represent the chamber equilibration but mainly result fromthe delay effects mentioned above. For that reason, data obtained within in the first100 s after valve switching were generally discarded from data evaluation (effectiveaveraging intervals are indicated as grey bars in Fig. 5b).15
3.1.2 Simulations
Chamber equilibration characteristics for reactive trace gases may not only dependon chamber geometry and purging flow. The influence of net chemical sources (seeSect. 2.1.3) and of the individual surface exchange flux has also to be considered.In order to investigate and illustrate these influences simulation studies for NO, NO2,20
and O3 were conducted. The temporal development of the trace gas mixing ratiosis described by Eq. (10) with the net chemical source Sgp as defined in Eqs. (8) and(9). Since Sgp itself is a function of the mixing ratios of the three reactive trace gases,Eq. (10) can not be solved analytically but was used for numerical integration with atime step of 1 s.25
Selected simulation results are summarised in Fig. 7. They show the temporaldevelopment of the NO mixing ratio after chamber closure (at t=0 s) depending onindividual controlling parameters. For each equilibration curve t98 is indicated. The
3172

BGD5, 3157–3219, 2008
Dynamic chambers tostudy trace gas
exchange ofgrassland
L. Pape et al.
Title Page
Abstract Introduction
Conclusions References
Tables Figures
J I
J I
Back Close
Full Screen / Esc
Printer-friendly Version
Interactive Discussion
simulations in Fig. 6a and b were calculated without any gas-phase chemistry and thusrepresent the basic case of an inert trace gas. As expected according to Eq. (12), t98increases proportionally with Q in Fig. 7a, which corresponds well with experimentalfindings of Suh et al. (2005) and simulation studies of Gao and Yates (1998). Incontrast, t98 is independent from the NO emission flux (Fig. 7b). As mentioned5
above, a high purging rate (Q=60 l min−1) was chosen as operational standard forthe field experiments in order to achieve the desired short measurement intervals.This purging rate was also used for the simulations shown in Fig. 7b–d. For theinert case (Fig. 7b), it results in a t98 value of 162 s, equal to the analytical solutionin the preceding section. When chemical reactions are included (µcham(O3)6=0), the10
equilibration time is not constant anymore, but varies with the concentration of thereactant O3 (Fig. 7c) and/or also with the NO emission flux (Fig. 7d). However, evenfor extreme cases within the chosen parameter range, t98 is only moderately increasedand does not exceed 200 s. The curve for Fcham(NO)=0.71 nmol m−2 s−1 in Fig. 7drepresents a special case, in which the NO soil emission is just counterbalanced by15
the chemical reaction of NO with O3 leading to an almost constant NO mixing ratiowith time. It should be noted, that for NO emissions less than 0.71 nmol m−2 s−1,µcham(NO) becomes smaller than µamb(NO) and hence the concentration differencechanges sign in Eq. (11). Consequently, the flux evaluation without considering netgas-phase sources (i.e. applying Eq. 2 instead of Eq. 11) would lead to the wrong20
result of negative chamber fluxes (i.e. NO deposition).The concentrations of O3 and NO2 (not shown) generally revealed a time response
very similar to that of NO. Based on the simulation results the time between lid closureand the start of sampling of the chamber air was set to at least 4 min (see Fig. 5a),which is well above the maximum of simulated equilibration times.25
3173

BGD5, 3157–3219, 2008
Dynamic chambers tostudy trace gas
exchange ofgrassland
L. Pape et al.
Title Page
Abstract Introduction
Conclusions References
Tables Figures
J I
J I
Back Close
Full Screen / Esc
Printer-friendly Version
Interactive Discussion
3.2 Modification of the turbulent transport by the chamber
3.2.1 Purging resistance Rpurge and mixing resistance Rmix
In order to estimate and, if necessary, to correct for the effect of the chamber on theaerodynamic transport of trace gases (see Fig. 1b and Eq. 5), the resistances Rpurge,Rmix, and R∗
b had to be quantified for representative conditions. According to the rules5
of the resistance analogy, Rpurge is implicitely defined by:
Fcham =1
Rpurgeρd (µcham − µamb) (13)
Comparison of Eq. (13) with Eq. (2) yields Rpurge=A/Q=100 s m−1. The air within thechamber volume is mixed by the purging air flow and additionally by two large mixingfans (see Fig. 2). Rmix was studied by measuring the air movement within the (empty)10
chamber volume using a hot-wire anemometer. Figure 8 shows the correspondingresults for a grid of vertical and horizontal positions. The air velocity is generallybetween 0.3 m s−1 and 2 m s−1 with an average value of about 0.75 m s−1. Supposingan internal re-circulation of the chamber air with this velocity, its inverse value may beused as an estimate for Rmix (≈1.5 s m−1). This low value indicates a very efficient15
mixing of the chamber air, which was also demonstrated in laboratory experiments (notshown), where smoke was added to the inlet of a chamber. It was observed that theentire chamber volume became filled with smoke within less than 2 s. These resultssupport the initial assumption in Sect. 2.1.2 that Rmix is negligibly small in comparisonto Rpurge (100 s m−1).20
The effective mixing of chamber air, even inside a dense vegetation canopy, isdemonstrated by measurements of the O3 mixing ratio within a closed chamber ona mature clover plot (canopy height ≈0.2 m, LAI=5). It was measured at two heights,one above (at 26.5 cm) and the other deep in the clover canopy (at 2.5 cm). Theresults, in form of a regression analysis, are shown in Fig. 9. The O3 mixing ratio in25
3174

BGD5, 3157–3219, 2008
Dynamic chambers tostudy trace gas
exchange ofgrassland
L. Pape et al.
Title Page
Abstract Introduction
Conclusions References
Tables Figures
J I
J I
Back Close
Full Screen / Esc
Printer-friendly Version
Interactive Discussion
the canopy was on average only 8% lower than in the headspace above the canopy,indicating reasonably well mixed conditions even with dense vegetation present.
3.2.2 Quasi-laminar boundary layer resistance R∗b
Due to the high purging air flow and the additional strong mixing of the chamber volumeby two fans, the bulk boundary layer resistance inside the chamber (R∗
b) is supposed5
to be smaller than outside (or possibly in the same order of magnitude, if ambientconditions are characterised by high wind speeds and/or strong convection). Theeffective value of R∗
b during applications with grass vegetation is difficult to quantify.However, it can be approximated or at least constrained by indirect approaches.Using a saturated potassium iodide (KI) solution (representing an ideal sink for ozone,10
i.e. Rc≈ 0), R∗b was determined from ozone deposition experiments in the laboratory
(see Galbally and Roy, 1980; Ludwig, 1994; Gut et al., 2002b). A petri dish (23 cmdia.) filled with saturated KI solution was placed at the bottom of an otherwise emptychamber. The measurements under standard operation conditions showed a totaldeposition resistance Rpurge+Rmix+R
∗b+Rc=185 s m−1 (related to the chamber surface15
area). Since both, Rc and Rmix, are supposed to be negligible and Rpurge equals
100 s m−1 (see above), the boundary layer resistance for a flat liquid surface in anempty chamber is estimated to R∗
b (liq.surface)=85 s m−1. The obtained value is largerthan the one reported by Gut et al. (2002b) for a smaller chamber but lower than theresult of Galbally and Roy (1980) for a much larger chamber. According to the chosen20
laboratory setup, this value for R∗b is only representative for deposition to a flat and
smooth surface, e.g. bare soil. With the presence of vegetation in the chamber, theeffective surface area for trace gas deposition is much larger, and consequently theeffective R∗
b is assumed to be reduced according to the leaf area (see Galbally and Roy,1980). Thus, the effective R∗
b value is parameterised as a function of the (one-sided)25
leaf area index (LAI):
Rb(LAI) = R∗b(liq.surface) · 1
1 + LAI(14)
3175

BGD5, 3157–3219, 2008
Dynamic chambers tostudy trace gas
exchange ofgrassland
L. Pape et al.
Title Page
Abstract Introduction
Conclusions References
Tables Figures
J I
J I
Back Close
Full Screen / Esc
Printer-friendly Version
Interactive Discussion
There is another approach to estimate R∗b(LAI) from field measurements with
vegetation in the chamber. For a trace gas with zero compensation point like ozone,the combination of Eqs. (5) and (4) yields:
R∗b(LAI) =
Rpurge(µamb(O3)µcham(O3) − 1
) − Rc(O3) (15)
In order to use Eq. (15), the value of Rc(O3) has to be known a priori, which is5
generally not the case for field measurements. Yet, a constraint for Rc(O3) is providedby Wesely (1989) and Nussbaum and Fuhrer (2000), who reported minimum valuesfor fully developed grass canopies of about 100 s m−1. Minimum Rc(O3) values areexpected to occur under optimum conditions for stomatal ozone uptake, i.e. high LAIand high radiation. Such favourable conditions prevailed during 4 to 7 June 2004 in10
the Rumlang experiment. Corresponding ambient and chamber ozone mixing ratios,obtained over fully developed ryegrass (LAI=5), are plotted in Fig. 10. The inverseof the regression line slope provides the desired ratio µamb(O3)/µcham(O3)=1.82.Hence, according to Eq. (15), Rb(LAI) is estimated to 22 s m−1 (with Rpurge=100 s m−1,Sect. 3.2.1). This value is in good agreement with Rb(LAI) results obtained by Eq. (14)15
of 14 s m−1 (for LAI=5).
3.2.3 Temperature and humidity conditions in the chamber
Similar to the ozone mixing ratio, temperature and humidity conditions in the chamberheadspace are also determined by the relative magnitude of the chamber resistances(Fig. 1b). Since R∗
b was found to be generally smaller than Rpurge (and Rc for20
temperature transfer is zero), the temperature inside the chamber is expected tobe closer to the leaf temperature than to the ambient temperature. In Fig. 11ameasurements of air temperature in the headspace of the chamber are comparedfor closed and open chamber conditions. The data obtained in the open chamberare considered to represent ambient conditions. The temperature within the closed25
3176
BGD5, 3157–3219, 2008
Dynamic chambers tostudy trace gas
exchange ofgrassland
L. Pape et al.
Title Page
Abstract Introduction
Conclusions References
Tables Figures
J I
J I
Back Close
Full Screen / Esc
Printer-friendly Version
Interactive Discussion
chamber deviates from the ambient temperature by –1 to +6 degrees, with anincreasing trend towards higher temperatures. As shown in Fig. 11b this can beexplained by the effect of global (shortwave solar) radiation that heats the leaf surfaces.Similar to trace gases, the observed difference between chamber and ambient airqualitatively indicates the sensible heat flux from the vegetation to the atmosphere,5
although it may be confounded by interaction between the radiation and materials ofthe chamber.
It is known from micrometeorological studies (see Oke, 1987), that – particularly forfully developed and dense vegetation canopies – a large part of the available radiationenergy is transferred into latent heat, i.e. transpiration and evaporation of water leads10
to a flux of water vapour into the atmosphere. Consequently, the water vapour fluxfrom the grass vegetation enclosed by the chamber implies a difference between thechamber and ambient H2O mixing ratios (Eq. 2). According to the resistance concept(Fig. 1b), the H2O mixing ratio within the chamber lies between the saturated conditionsin the leaf stomata (depending on leaf temperature) and the respective ambient mixing15
ratio. The relation between chamber and ambient H2O mixing ratios measured at theRumlang field site during August/September 2004 are shown in Fig. 11c. The resultingdifference, which is proportional to the water vapour (latent heat) flux, is linearly relatedto the global radiation (see Fig. 11d) like the air temperature difference.
3.3 Modification of NO2 photolysis in the chamber20
The correct calculation of surface exchange fluxes for NO, NO2 and O3 has to considerthe contribution of fast chemical gas phase reactions according to Eqs. (8) to (11). Forthis purpose, the photolysis rate j (NO2) within the chamber volume needs to be known.It is measured as an omni-directional actinic UV radiation flux. However, during our fieldexperiments, a j (NO2) sensor (filter radiometer, Meteorology Consult Inc., Konigstein,25
Germany) was only available for a few weeks. Therefore, we tried to relate the j (NO2)signal (inside and outside of the chamber) to the ambient global radiation, for whichcontinuous measurements are available at our field sites. In a 5-week (18 May–26 June
3177

BGD5, 3157–3219, 2008
Dynamic chambers tostudy trace gas
exchange ofgrassland
L. Pape et al.
Title Page
Abstract Introduction
Conclusions References
Tables Figures
J I
J I
Back Close
Full Screen / Esc
Printer-friendly Version
Interactive Discussion
2007) campaign at the Oensingen site, j (NO2) was measured for 5 days within aclosed dynamic chamber and for 30 days outside the chamber. Figure 12 shows thecorresponding results as a function of the simultaneously measured global radiation(G). For both, j (NO2) inside and outside the chamber, a clearly non-linear relationshipwas observed that could be fitted well by 2nd order polynomial functions (coefficients5
are given in the figure caption). The relationship for the closed chamber was generallyused for the calculation of the net chemical sources of NO, NO2 and O3 in Eqs. (8) and(9). For cases where measurements of ambient j (NO2) are available, the transmissivityof the chamber walls for j (NO2) related radiation (black dashed line in Fig. 12) wascalculated as the ratio of both fitted polynomials. The transmissivity varies between 0.410
and 0.5 and can be described as a linear function of G (see figure caption).
3.4 Flux measurements on small grass plots
As part of the Rumlang experiment the dynamic chamber system was installed onseveral small scale plots (3×6 m), which were sown with different plant speciesand received different fertiliser amounts (see Sect. 2.3). Our main focus was the15
determination of NO, NO2, and O3 exchange fluxes and their dependence on themanagement options. Figure 13 shows exemplary results of dynamic chamber fluxmeasurements on two white clover plots and of the blank chamber operated in parallelfor a one-week period (21–27 September 2004). The highly fertilised plot #1 wascharacterised by an LAI of 3.3 at the time of the displayed measurements; the weakly20
fertilised plot #2 was characterised by an LAI of 2.3. As indicated by the time series ofambient air temperature and global radiation observed at the site (Fig. 13f), there werefair weather conditions in the first half of the displayed period, followed by a significantdecrease in both quantities. The observed CO2 exchange fluxes (representing thephysiological activity of the vegetation) closely followed the course of the solar radiation25
for both clover plots (Fig. 13b). During daytime, plot #1 showed slightly higherphotosynthesis rates (larger negative CO2 fluxes) than plot #2, which can be explainedby the higher LAI of plot #1. The CO2 fluxes of both plots were within a reasonable
3178

BGD5, 3157–3219, 2008
Dynamic chambers tostudy trace gas
exchange ofgrassland
L. Pape et al.
Title Page
Abstract Introduction
Conclusions References
Tables Figures
J I
J I
Back Close
Full Screen / Esc
Printer-friendly Version
Interactive Discussion
range for managed grassland ecosystems (see e.g. Ammann et al., 2007) indicatingrepresentative conditions for plant growth inside the chamber. The difference betweenthe two plots concerning the NO flux was much more pronounced (Fig. 13c). Whilethe NO fluxes of plot #2 were not significantly different from zero, highly significant NOemissions were observed for plot #1 with values mostly above 1 nmol m−2 s−1.5
While emission processes (e.g. for NO) and the exchange of CO2 are supposed to behardly affected by the modification of turbulence resistances of the dynamic chamber(see Sect. 2.1.2), this effect has to be considered for the purely diffusion-limiteddeposition processes for ozone and NO2. For these compounds the measuredchamber flux Fcham may deviate from the true ambient deposition flux (cf. Eq. 5), and10
thus the corresponding surface resistance Rc represents the more relevant result ofthe chamber measurements. Assuming a zero compensation point, Eq. (4) can berearranged to:
Rc =ρd × µamb
Fcham− Rpurge − R∗
b (LAI) (16)
with Fcham determined according to Eq. (11). The resulting surface resistance values15
are plotted in Fig. 13d–e in their inverse form, i.e. as surface conductances 1/Rc(O3)and 1/Rc(NO2). This is graphically more suitable, because cases corresponding to zerofluxes appear as zero conductance values instead of very large or infinite resistances.Like for the photosynthetic CO2 uptake, the surface conductance for O3 and NO2 isgenerally lower for plot #2 than for plot #1. This observation can again be attributed to20
the higher LAI of plot #1.The blank chamber operated in the field experiment alongside with the regular
sampling chambers serves as a check for the proper operation of the system and forthe estimation of the effective uncertainty of the chamber fluxes. Ideally, the blankchamber flux is supposed to be zero, which is not always the case as shown in25
Fig. 13a–e. Statistical characteristics of the blank chamber fluxes measured during theRumlang field campaign and corresponding results for methanol from the Oensingenexperiment are listed in Table 3. The scatter of individual blank chamber fluxes is
3179

BGD5, 3157–3219, 2008
Dynamic chambers tostudy trace gas
exchange ofgrassland
L. Pape et al.
Title Page
Abstract Introduction
Conclusions References
Tables Figures
J I
J I
Back Close
Full Screen / Esc
Printer-friendly Version
Interactive Discussion
characterised by corresponding 10% quantile and 90% quantiles (q10 and q90) ofthe entire dataset. Except for NO, the range between q10 and q90 values is ashigh as 20% of the corresponding flux range observed by the regular chambers.The variability of the blank chamber fluxes is mainly caused by the non-stationarityof ambient trace gas concentrations during the individual measurement interval. In5
contrast, the overall means of the blank chamber fluxes are very small (Table 3). Yet,except for NO and NO2, they are significantly different from zero as indicated by thecorresponding uncertainty range. A detailed assessment of the overall uncertainty offlux measurements with our dynamic chamber system will follow in Sect. 4.5.
3.5 Comparison with eddy covariance measurements on the field scale10
A basic requirement of any chamber system to be applied on vegetated surfaces is toensure a normal (unmodified) physiological behaviour of the enclosed plants. In orderto investigate the influence of our dynamic chambers on diurnal plant physiologicalprocesses, we compared dynamic chamber derived CO2 and methanol fluxes withcorresponding eddy covariance fluxes for a time period of six days (Fig. 14). The15
latter represent field scale measurements that integrate over a larger area of theinvestigated grassland field without affecting the vegetation and thus are supposedto represent average undisturbed fluxes. The gaps in the eddy covariance data resultfrom failures of the corresponding trace gas analyser (e.g. 8 July for methanol) butalso from methodological problems during calm night time conditions (cf. Ammann et20
al., 2007). The gaps in the chamber data are due to the rejection of data obtainedunder high non-stationarity of ambient mixing ratios (Sect. 2.3). Generally, an excellentagreement between chamber and eddy covariance fluxes was observed. The dynamicchamber system is able to detect the characteristic diurnal cycles with a sufficienttemporal resolution. Both the CO2 and the methanol fluxes largely follow the course of25
the global radiation (G). Even the short-term variability of G is reflected in the chamberflux time series (e.g. on 7 July). With respect to the positive CO2 fluxes during night(representing soil and plant respiration) the dynamic chamber fluxes tend to be slightly
3180

BGD5, 3157–3219, 2008
Dynamic chambers tostudy trace gas
exchange ofgrassland
L. Pape et al.
Title Page
Abstract Introduction
Conclusions References
Tables Figures
J I
J I
Back Close
Full Screen / Esc
Printer-friendly Version
Interactive Discussion
lower compared to eddy covariance fluxes. This may be explained by the limited spatialrepresentativeness of the two chambers and by a large small-scale variability for thesoil respiration (compared to photosynthesis).
4 Discussion
4.1 Requirements for dynamic chamber measurements5
The main requirements for any dynamic chamber measurement are
(a) minimal modification of the target trace gas exchange by the application of thechamber
(b) mixing ratio differences between ambient and chamber air large enough that theycan be detected by the available instruments for the encountered range of the10
target trace gas fluxes.
Beside these general requirements, several specific requirements have additionallybeen set for the applied system:
(c) applicability on low vegetation (in particular grassland)
(d) possibility for long-term unattended application (monitoring)15
(e) surface flux measurements with high temporal resolution (approx. 1 h)
(f) parallel operation of several chambers to measure e.g. differences betweenmanipulation plots or to assess the spatial heterogeneity of a site
(g) simultaneous observation of surface exchange fluxes of various reactive and non-reactive trace gases20
The ability of our dynamic chamber system to meet these requirements will bediscussed in comparison to other systems reported in the literature.
3181

BGD5, 3157–3219, 2008
Dynamic chambers tostudy trace gas
exchange ofgrassland
L. Pape et al.
Title Page
Abstract Introduction
Conclusions References
Tables Figures
J I
J I
Back Close
Full Screen / Esc
Printer-friendly Version
Interactive Discussion
4.2 Minimised modification by the chamber
Fulfilment of requirements (a) and (c) by our chamber system implies a minimiseddisturbance of the plant physiological activity of the enclosed grassland vegetation. Inorder to achieve this target, the chamber frame and wall was constructed of highlytransparent materials (particularly for photosynthetic active radiation, PAR). Together5
with our choice of a high purging air flow rate, they provide for a nearly undisturbedphotosynthesis within the chambers as documented by the excellent agreement of CO2fluxes measured by dynamic chambers and by eddy covariance (Fig. 14a). The slightreduction of PAR (about 14%) due to the chamber walls is only of minor importancebecause the photosynthesis rate of grassland vegetation exhibits non-linear saturation10
effects already at low to medium PAR levels (Ammann et al., 2007). Thus the PARreduction should only have an under-proportional effect on photosynthesis (mostly<5%). Furthermore, the good agreement of the methanol fluxes (Fig. 14b), whichare supposed to be strongly controlled by stomatal conductance (see e.g. Harley etal., 2007), indicates the low impact of the (closed) chamber on the plant physiological15
activity of the grassland vegetation.Fulfilment of requirement (a) does not necessarily imply that the environmental
conditions (temperature, humidity, trace gas mixing ratios) in the chamber headspacemust be very close to the ambient conditions outside the chamber. According to theresistance scheme displayed in Fig. 1 and the corresponding results in Sect. 3.2, the20
chamber headspace conditions represent an intermediate state within the resistancechain rather than ambient conditions. The exchange of chamber air by the purging airflow is generally slower than the mixing inside (enforced by the two mixing fans), andthus the properties of the equilibrated chamber air (especially the air temperature, seeFig. 11) are closer to leaf surface conditions than to ambient air conditions. Therefore,25
the chamber volume may be considered as an enhanced canopy or leaf boundarylayer.
As discussed in Sect. 2.1.2, deposition fluxes are generally more affected by
3182

BGD5, 3157–3219, 2008
Dynamic chambers tostudy trace gas
exchange ofgrassland
L. Pape et al.
Title Page
Abstract Introduction
Conclusions References
Tables Figures
J I
J I
Back Close
Full Screen / Esc
Printer-friendly Version
Interactive Discussion
modified turbulence in the chamber than emission fluxes. However, the proposedresistance concept allows for a quantitative description and correction of this effect(cf. Eq. 5). Our resistance concept differs somewhat from that introduced byLudwig (1994), where the purging process was not included (instead µcham wasconsidered as a modified ambient mixing ratio). The advantage of the present concept5
is that it relates the modified chamber flux to the original undisturbed ambient mixingratio. For deposition processes, the surface resistance Rc can be determined byEq. (16) from the chamber flux measurements with known values of the chamberrelated resistances R∗
b and Rpurge. Dry deposition models (Wesely and Hicks, 2000)usually need Rc values for each individual trace gas depending on the surface type10
and vegetation cover. Corresponding results from the Rumlang site (Fig. 13) show ahigher conductance 1/Rc (i.e. lower Rc) for O3 and NO2 on the plot with higher LAI. Thisobservation can be attributed to the increasing number of stomata (proportional to theleaf surface) available for the uptake of trace gases. The generally lower conductance(higher Rc) for NO2 compared to O3 may be an indication for the existence of an15
additional mesophyll resistance (cf. Wesely, 1989; Gut et al., 2002b) for the NO2 uptakewithin the leaf.
4.3 Long-term applicability with high temporal resolution
For long-term unattended application of the dynamic chamber system (requirementd), possible influences of the chambers on the enclosed vegetation was further20
minimised by using automated movable lids that are kept open outside the actualflux measurement intervals. In this way, the chambers remain open for about 80%of the entire duty time. Consequently, during our field experiments with this chambersystem over full growing seasons (not shown) we could not identify any visual differencebetween the vegetation enclosed by the chambers and the surrounding vegetation,25
neither with respect to canopy height nor density. With the long open-state periods ofthe chambers also the exclusion of rainfall is small. For long-term measurements, arepresentative water supply to the enclosed soil area is crucial. In an earlier study with
3183

BGD5, 3157–3219, 2008
Dynamic chambers tostudy trace gas
exchange ofgrassland
L. Pape et al.
Title Page
Abstract Introduction
Conclusions References
Tables Figures
J I
J I
Back Close
Full Screen / Esc
Printer-friendly Version
Interactive Discussion
long-term fixed chambers without lids (Gut et al., 2002a; Kirkman et al., 2002), thisproblem was solved by installing a rain collecting funnel on top of each chamber (withsimilar cross section area), from which the rain was directed into the chambers. For afurther optimisation of the present system, an on-line rain sensor signal might be usedto force the chambers to remain open during significant rain events, as proposed by5
Butterbach-Bahl et al. (1997). It may be argued that the moving of the entire chamber(except for the soil frame) away from the investigated surface area (as e.g. used onforest floor by Pilegaard et al., 2003) would be better than just opening the chamberlid. Yet this solution is hardly practical for dense and delicate grassland vegetation; itwould likely be damaged irreversibly by frequent moving of the entire chambers.10
While long-term applicability of the chamber system is necessary for monitoringentire seasonal cycles of trace gas fluxes and for deriving representative annualbudgets, a high temporal resolution (requirement e) is essential for the detectionand analysis of diurnal cycles as well as short term weather induced (e.g. rain,freezing/thawing) or management induced (e.g. fertilisation, harvest) emission pulses15
and variations. With the parallel operation of several chambers (requirement f) aone-hour resolution was achieved by a short flux measurement interval of only 10to 12 min per individual chamber (Fig. 5). In the first four minutes of this interval,ambient air at the chamber inlet was sampled while the chamber was already closedand allowed to equilibrate. The experimental results and theoretical considerations in20
Sect. 3.1 give evidence that this time is always sufficient for an adequate equilibration(>98%) of temperature and trace gas mixing ratios within the chamber under thechosen purging rate. This also applies to fast reacting gases like O3 and NO as foundby the extensive simulation studies (Fig. 7).
In Table 4 the characteristics of our chamber system are compared to other dynamic25
chamber systems reported in literature for the measurement of soil NO emission fromvarious ecosystems. Many of the chambers were operated manually and thus couldbe applied in the field only during either intensive short campaigns or with a very lowtime resolution in the order of weeks (often with long closure times). In addition, some
3184

BGD5, 3157–3219, 2008
Dynamic chambers tostudy trace gas
exchange ofgrassland
L. Pape et al.
Title Page
Abstract Introduction
Conclusions References
Tables Figures
J I
J I
Back Close
Full Screen / Esc
Printer-friendly Version
Interactive Discussion
of the chambers (applied to bare soil e.g. in forests) used opaque wall materials thatare not suitable to study trace gas exchange of vegetation.
4.4 Choice of purging flow rate
For a given trace gas analyser, flux measurements by the dynamic chamber methodare generally limited by the minimum detectable mixing ratio difference between5
chamber and ambient air (see Eq. 2 and requirement b). This mixing ratio differenceis inversely proportional to the purging air flow rate (Q). The relation is illustrated inFig. 7a: the vertical span of each curve between the start point and the equilibrium statecorresponds to the difference (µcham − µamb) for the respective Q value. On the otherhand, Fig. 7a also shows the strong reduction of the equilibration time with increasing10
Q (in favour of requirement e). Another argument for a high purging flow are empiricalfindings by several authors, who report significant underestimation of soil emissionfluxes of NO (Ludwig et al., 1994; Butterbach-Bahl et al., 1997; Gut et al., 1999)and of gaseous elemental mercury (Lindberg et al., 2002) under low purging rates.Thus the choice of the purging air flow rate is usually a compromise between different15
partly conflicting requirements (flux detection limit vs. time response and modificationof turbulence resistances) for the chamber system.
The standard purging rate Q=60 l min−1 used in this study was chosen high enoughto keep the mean residence time of the chamber air below one minute (τcham=41 s).This value is in the lower range of residence times reported in the literature (between20
17 s and 24 min, see Table 4). It guarantees a fast equilibration after closing the lidand allows an hourly measurement cycle with up to six chambers. A further increaseof Q was considered as unnecessary and would have made the flux detection moredifficult (due to a smaller mixing ratio difference µamb − µcham). For other applicationswith different requirements and limitations, it may be adequate to choose a different25
purging flow. Aeschlimann et al. (2005), for example, used a slower purging flowrate during night than during day for imitating the diurnal variation of the aerodynamicresistances at ambient conditions. Such a feature could be easily implemented in the
3185

BGD5, 3157–3219, 2008
Dynamic chambers tostudy trace gas
exchange ofgrassland
L. Pape et al.
Title Page
Abstract Introduction
Conclusions References
Tables Figures
J I
J I
Back Close
Full Screen / Esc
Printer-friendly Version
Interactive Discussion
control program of our dynamic chamber system.Although a certain pressure difference between outside and inside of the closed
chamber is an inherent consequence of the purging flow, a too high flow rate incombination with small inlet/outlet orifices would cause a significant pressure differencethat may influence the gas exchange with the soil (Gao and Yates, 1998). For5
our chamber system, the pressure difference was carefully checked by a sensitivedifferential pressure sensor (Honeywell DC2R5BDC4, range: ±0.25 kPa) at variouspositions within the closed chamber in standard operation mode. It was found to begenerally less than 2 Pa.
4.5 Significance of gas phase chemistry10
It has been pointed out in Sect. 2.1.3 that chamber flux measurements of reactivecompounds like NO, NO2, and O3 have to consider the chemical gas phase reactionsinside the chamber. In order to illustrate the significance of gas phase chemistry, partof the chamber fluxes of NO, NO2, and O3, corresponding to the results in Fig. 13,are compiled in Fig. 15 with a graphic indication of the respective gas phase reaction15
effect. A vertical line attached to each flux data point represents the contribution ofthe term 1/A · Sgp in Eq. (11). Its absolute and relative magnitude depends on variousfactors. For the blank chamber, the effect is generally very small, which indicatesthat the ambient mixing ratios (which are very close to the respective blank chambermixing ratios) for the three trace gases are already close to a photochemical equilibrium20
(i.e. the equilibrium between Eqs. 6 and 7). In the chamber on plot #2 (small NOemission), this situation is only marginally modified by the deposition of O3 and NO2leading to reduced mixing ratios in the chamber. However, for plot #1 with strong NOemission, the addition of NO to the ambient and especially to the chamber air leads toan enhanced deviation from the photochemical equilibrium. Therefore the gas phase25
term can get quite large (up to 1 nmol m−2 s−1). Even for cases with a large absolutechemistry effect, its relative magnitude is generally less than 50% of the NO and O3chamber fluxes. However, for the smaller NO2 fluxes, the chemical source term has a
3186

BGD5, 3157–3219, 2008
Dynamic chambers tostudy trace gas
exchange ofgrassland
L. Pape et al.
Title Page
Abstract Introduction
Conclusions References
Tables Figures
J I
J I
Back Close
Full Screen / Esc
Printer-friendly Version
Interactive Discussion
much larger relative effect. It can amount to more than two times the absolute value ofthe chamber flux meaning that an omission of the chemical source would even result ina wrong flux direction (NO2 emission instead of deposition), as demonstrated in Fig. 15for plot #1.
These results show, that fast gas phase reactions of NO, NO2, and O3 have to5
be included in the calculation of each individual chamber flux. This necessitatesthe simultaneous measurement of all three trace gases, even if only one of themis of specific interest. Figure 15 also shows that the gas phase reaction term candiffer significantly between chambers of neighbouring plots and in comparison tothe blank chamber, because it depends on the local ambient mixing ratios and on10
the specific emission or deposition fluxes in the chamber. Thus it is in general notpossible to quantify the contribution of chemical reactions based only on blank chambermeasurements. For the investigation of soil NO emissions, gas phase reactions canbe avoided by purging the chamber with zero air (see Table 4, e.g. Parrish et al., 1987;Williams and Davidson, 1993; Kitzler et al., 2006). However, in this way the exchange15
of other trace gases may be highly affected and can not be studied simultaneously.Furthermore, potential NO deposition fluxes can not be observed. They occur if theambient NO mixing ratio exceeds the NO compensation mixing ratio in the soil (Conrad,1994; Conrad 1996; Gut et al., 1999).
4.6 Assessment of overall flux uncertainty20
The statistical uncertainty of flux measurements by the dynamic chamber methodmainly depends on the uncertainty, with which the (average) trace gas mixing ratiosof chamber and ambient air (and consequently their difference) can be measured. Itis important to note in this context, that the observed mixing ratio difference in thefield is often not limited by the precision of the trace gas analysers (Table 2), but25
rather by the temporal variability of the ambient concentration during a measurementinterval (cf. Sect. 2.3). In particular, reactive (short-lived) compounds like O3, NO, NO2,and VOC, which are the main target compounds for dynamic chamber measurements,
3187

BGD5, 3157–3219, 2008
Dynamic chambers tostudy trace gas
exchange ofgrassland
L. Pape et al.
Title Page
Abstract Introduction
Conclusions References
Tables Figures
J I
J I
Back Close
Full Screen / Esc
Printer-friendly Version
Interactive Discussion
may show large variability of ambient mixing ratio due to spatially varying sources(e.g. traffic). This effect is illustrated by the variability of blank chamber fluxes observedin the Rumlang field experiment (see Figs. 12 and 14). The random-like variability ofthe blank chamber fluxes is characterised by the range between the 10% and 90%quantiles in Table 3. The same effect is expected to apply to the fluxes of the regular5
chambers. Therefore, the observed variability of the blank chamber fluxes representsa measure for the uncertainty (detection limit) of individual flux measurements. Forsome trace gases, a considerable relative uncertainty of individual chamber fluxesis observed (see e.g. O3 and CO2in Table 3). Yet due to its random-like nature, itis efficiently reduced by any averaging procedure like temporal averaging or spatial10
averaging over parallel chambers.Beside random-like errors, systematic errors may also add to the uncertainty of the
fluxes. They can result from unknown or not adequately considered chemical reactionsin the chamber headspace, for example the reaction of NO with the HO2 and RO2radicals (see Aneja et al., 1995), which have not been measured here. Moreover,15
emission or deposition processes at the inner chamber walls (e.g. sorption processesor heterogeneous reactions at dirty or wet surfaces) may represent additional sourcesor sinks for target trace gases and thus may bias the intended biosphere-atmosphereexchange measurements. However, such systematic effects can also be checked byblank chamber measurements. For this purpose, the mean (temporally averaged)20
fluxes listed in Table 3 have to be considered. For NO and NO2, the mean blankchamber flux was not significantly different from zero and thus no systematic errorneeds to be taken into account. For ozone and methanol, however, significant negativebiases of –0.54 and –0.07 nmol m−2 s−1, respectively, were observed. They may beattributed to deposition to the chamber walls (see Meixner et al., 1997). The surface25
conductance 1/Rc(O3) in the blank chamber (Fig. 13d) tends to increase towards theend of the period, which can be explained by the rainy weather leading to wet innerwall surfaces. The latter effect is also reflected in the positive water vapour fluxes ofthe blank chamber indicating evaporation of collected rain or condensation water. A
3188

BGD5, 3157–3219, 2008
Dynamic chambers tostudy trace gas
exchange ofgrassland
L. Pape et al.
Title Page
Abstract Introduction
Conclusions References
Tables Figures
J I
J I
Back Close
Full Screen / Esc
Printer-friendly Version
Interactive Discussion
positive unambiguous attribution of systematic biases to a defined source/sink effect isgenerally difficult and has to be examined individually for each trace gas and chamberapplication. In the present case, the small but significant negative CO2 offset can hardlybe explained by wall deposition. Alternatively, it might have been caused by analyticalproblems or by solution of CO2 in condensation water. Without a clear explanation, the5
systematic biases (mean blank chamber fluxes) in Table 3 have to be considered assystematic uncertainty of the chamber fluxes.
5 Conclusions
The presented laboratory tests and field applications show that the newly designeddynamic chamber system is well suited for surface exchange flux measurements of10
various reactive and non-reactive trace gases on grassland ecosystems. Beside thesix trace gases presented here, our chamber system is supposed to be applicable fora large number of other compounds, e.g. for other VOC species that can be detectedby the PTR-MS (cf. Davidson et al., 2007; Rottenberger et al., 2008), for elementalmercury (Lindberg et al., 2002), or for sulphur compounds (Kuhn et al., 1999). For15
long-term automated applications of the chamber system on vegetated surfaces, themost important characteristic is the minimal disturbance of plant physiology and growth.This was checked by comparison of chamber measurements with independent eddycovariance measurements on the field scale. The fluxes of CO2 and methanol obtainedwith the two methods showed a very good agreement. This positive performance is20
ensured by transparent and inert wall materials, short measurement intervals and longphases with open lid (enabled by automated lid movement), high purging rate, andefficient mixing of the chamber air.
The long-term applicability of our dynamic chamber system can be combined witha high time resolution of the measurements in the order of 1 h. This allows detailed25
observations of diurnal cycles as well as of strong but short emission pulses e.g. afterrain events (Meixner et al., 1997), after cutting (Davison et al., 2008) or fertilisation
3189

BGD5, 3157–3219, 2008
Dynamic chambers tostudy trace gas
exchange ofgrassland
L. Pape et al.
Title Page
Abstract Introduction
Conclusions References
Tables Figures
J I
J I
Back Close
Full Screen / Esc
Printer-friendly Version
Interactive Discussion
(Bakwin et al., 1990). A variable number of individual chambers (e.g. to assess thespatial heterogeneity of a site, as done manually by Williams and Davidson, 1993;Maljanen et al., 2007), flexible controlling, variable operating parameters, variablenumber and type of analysers provide a high flexibility of the system and allow itsapplication for numerous scientific investigations. During field experiments the system5
proved to be very robust and easy to maintain. All operational parameters arecontrolled automatically and logged continuously (together with basic environmentalparameters like soil and air temperatures), which minimises manpower requirements.
The system is able to measure emission as well as deposition of trace gases. Thenecessary correction of deposition fluxes for the modified turbulence conditions can10
be achieved by consequent application of the described bulk resistance concept. Asfor all (dynamic) chamber systems, the chemical source/sink terms due to gas phasereactions need to be accounted for when measuring fluxes of reactive compounds likethe NO-NO2-O3 triad.
The presented dynamic chamber system is originally developed for the15
measurement of reactive trace gas exchange of grassland ecosystems. However, dueto the flexible design it can also be applied to other ecosystems like bare soil and arablecrops, on forest floors, or (without the soil frame) around individual branches or twigs(see Kuhn et al., 2002). Depending on the characteristics of the measurement site(root density, litter coverage, or structure of the soil), the present PVC soil collars may20
be omitted (cf. Gut et al., 2002a,b) or replaced by others, that are less deep or made ofdifferent material (e.g. stainless steel, cf. Bargsten et al., 2008). For vegetation higherthan about 30 cm, the chamber height can easily be extended by an additional cylindermodule (similar to Bakwin et al., 1990; Suh et al., 2006). Finally, the chamber systemmay also be used for indoor applications with a controlled environment, e.g. in a climate25
control chamber (Brunner et al., 2007b), where the dynamic chambers can be fixed toplanting pots directly.
3190

BGD5, 3157–3219, 2008
Dynamic chambers tostudy trace gas
exchange ofgrassland
L. Pape et al.
Title Page
Abstract Introduction
Conclusions References
Tables Figures
J I
J I
Back Close
Full Screen / Esc
Printer-friendly Version
Interactive Discussion
Appendix A
List of Symbols and Abbreviations
All concentration and flux quantities are given in molar units. The concentration andflux units given in square brackets are used here for O3, NO, NO2, and methanol. For5
other trace gases, other adequate prefixes are used: ppm ≡µmol mol−1 for CO2 and‰ ≡mmol mol−1 for H2O.
Generally used subscripts:xamb property of ambient air (conditions) outside the chamberxcham property of air (conditions) in the chamberxin property of air flowing into the chamberxout property of air flowing out of the chamberx∗ the asterisk marks a property inside the chamber that might be modified compared
to the respective property in undisturbed ambient conditions (without asterisk)Physical quantities:A surface area enclosed by the chamber [m2]c absolute trace gas concentration (molar density) [nmol m−3]µ trace gas mixing ratio relative to dry air [ppb≡nmol mol−1]µcomp compensation point mixing ratio see Conrad (1994) [ppb≡nmol mol−1]F trace gas surface flux [nmol m2 s−1]G global radiation [W m−2]j (NO2) photolysis rate of NO2 (λ≤420 nm) [s−1]k reaction rate constant of (R1); k=1.4·10−12·exp(−1310/T ), [cm3 molecule−1s−1]
(Atkinson et al., 2004) or k=4.31·10−4, [ppb−1 s−1], at 1013 hPa and 298.16 KLAI single sided leaf area index [m2 m−2]PAR photosynthetic active radiation (λ=400–700 nm) [µmol m−2 s−1]Q chamber purging air flow rate (volumetric air flow) [l min−1; m3 s−1]
10
3191

BGD5, 3157–3219, 2008
Dynamic chambers tostudy trace gas
exchange ofgrassland
L. Pape et al.
Title Page
Abstract Introduction
Conclusions References
Tables Figures
J I
J I
Back Close
Full Screen / Esc
Printer-friendly Version
Interactive Discussion
Ra turbulent (aerodynamic) resistance under ambient conditions [s m−1]Rb quasi-laminar boundary layer resistance under ambient conditions [s m−1]Rc bulk surface resistance under ambient conditions [s m−1]Rmix turbulent mixing resistance inside the chamber [s m−1]Rpurge resistance between ambient and chamber air (attributed to chamber purging) [s m−1]ρd molar density of dry air molecules [mol m−3]Sgp net chemical gas phase source in the chamber for O3, NO, and NO2
due to reactions (R1) and (R2)T air temperature [◦C; K]t time [s]t98 98% equilibration time of the chamber headspace conditions [s]τcham mean residence time of air within the chamber [s]V chamber volume [l; m3]
Appendix B
Derivation of dynamic chamber flux formula
For any chamber system, the flux Fcham of an inert trace gas (no chemical reaction with5
other air constituents or with the chamber walls) between the plant-soil system and thechamber air is determined by the mass balance of the enclosed volume V (e.g. Gaoand Yates, 1998):
Vdccham(t)
dt= A · Fcham +Qin · cin(t) −Qout · cout(t) (B1)
where ccham is the average absolute concentration (molar density) of the target gas10
within the chamber volume V and A is the soil surface area enclosed by the chamber.Qin and Qout are the volumetric air flow rates and cin and cout the absolute tracegas concentrations of the incoming and outgoing air, respectively. While for a staticchamber the air exchange is inhibited (making the Q-terms vanish), dynamic chambers
3192

BGD5, 3157–3219, 2008
Dynamic chambers tostudy trace gas
exchange ofgrassland
L. Pape et al.
Title Page
Abstract Introduction
Conclusions References
Tables Figures
J I
J I
Back Close
Full Screen / Esc
Printer-friendly Version
Interactive Discussion
are operated with a continuous purging of the chamber air leading to a steady-stateequilibrium where the concentrations get time-independent and the time derivative inEq. (B1) vanishes. Thus for a dynamic chamber in equilibrium conditions, the equationcan be rearranged and reduced to:
Fcham =1A
[Qout · cout −Qin · cin
](B2)5
The (standard) volumetric flow rates Qin and Qout are supposed to have similarvalues but are not fully equal in general. This is because of potential differences intemperature, pressure, and in the water vapour content (due to the formation of watervapour by evapotranspiration) of the inflowing and outflowing air. In order to accountfor these effects, the absolute concentration c has to be transferred to a mixing ratio µ10
relative to dry air:
c = µ · ρd (B3)
Here ρd denotes the density of the dry air molecules (disregarding the water vapourmolecules). Applying Eqs. (B3) to (B2) results in
Fcham =1A
[Qout · ρd,out · µout −Qin · ρd,in · µin
](B4)15
Qout·ρd,out and Qin·ρd,in represent the flow of dry air molecules out of and into thechamber. According to mass conservation rules, these two terms have to be equalsince there is no source or sink for dry air molecules within the chamber. Thus Eq. (B4)can be reduced to:
Fcham =Qin
A· ρd,in
[µout − µin
](B5)20
The deviation introduced e.g. by using Qout instead of Qin would be very small andpurely relative (below 2%). Therefore, for the sake of simplicity, the subscript “in” for Q
3193

BGD5, 3157–3219, 2008
Dynamic chambers tostudy trace gas
exchange ofgrassland
L. Pape et al.
Title Page
Abstract Introduction
Conclusions References
Tables Figures
J I
J I
Back Close
Full Screen / Esc
Printer-friendly Version
Interactive Discussion
is omitted in the manuscript (see Eq. 1) and following, and the equation for the dynamicchamber flux of an inert trace gas finally results in:
Fcham =QA
· ρd[µout − µin
](B6)
The important feature in this equation is comprised in the use of the mixing ratio relativeto dry air (µ) instead of using absolute concentrations or a mixing ratio relative to the5
total wet air. The effect is analogous to the considerations by Webb et al. (1980) formicrometeorological flux measurements (see also Ammann, 1998). The normalisationto dry air is particularly important for trace gases with a high background concentrationlike e.g. CO2 and N2O. Without this normalisation, a typical midday evapotranspirationrate (H2O flux) from vegetation of 10 mmol m−2 s−1 would result in a systematic10
underestimation of the CO2 flux by –3.8µmol m−2 s−1.For the practical application of Eq. (B6) it should be noted that the air flow rate Q
is often measured by mass flow meters that yield the volumetric flow for ’standardconditions’ (temperature: 273 K, pressure 1013 hPa). If these values are used, the dryair density has to be normalised to standard conditions as well.15
Considering the origin of the inflowing air (ambient air near chamber inlet) andof the outflowing air (chamber volume), the mixing ratios are denoted accordingly:µin=µamb and µout=µcham. (see Fig. 1a and Sect. 2.1.1). For describing thetemporal development of the equilibration process in the dynamic chamber after closing(before reaching the equilibrium state), one has to go back to the complete mass20
budget Eq. (B1). In order to formulate it in terms of mixing ratios, the derivation inEqs. (B3)–(B6) have to be inserted back into Eq. (B1). This results in the followingdifferential equation for the mixing ratio in the chamber:
V · ρddµcham(t)
dt= A · Fcham −Q · ρd
[µcham − µamb
](B7)
Here µamb represents the constant (time-independent) trace gas mixing ratio of the25
inflowing ambient air and also the initial chamber concentration at t=0 before closing.3194

BGD5, 3157–3219, 2008
Dynamic chambers tostudy trace gas
exchange ofgrassland
L. Pape et al.
Title Page
Abstract Introduction
Conclusions References
Tables Figures
J I
J I
Back Close
Full Screen / Esc
Printer-friendly Version
Interactive Discussion
Acknowledgements. The authors thank the mechanical and electronics workshops of MPICMainz for technical advice and construction of the chambers and all controlling devices,M. Wiesmann for help with field installation and maintenance of the chamber system inRumlang, J. Staehelin of ETH Zurich for borrowing us a NO2 photolysis radiometer, M. Ermelfor help with laboratory experiments. The measurements in Oensingen were financially5
supported by the Swiss National Science Foundation (Project COGAS, Nr. 200020-101636)and by the Swiss State Secretariat for Education and Research through grant Nr. SBFNr. 03.0350-1 (Project CarboEurope-IP). The development of the chamber system and thefield application in the Rumlang experiment was funded by the Max Planck Society.
10
The publication of this article isfinanced by the Max Planck Society.
References
Aeschlimann, U., Nosberger, J., Edwards, P. J., Schneider, M. K., Richter, M., and Blum,15
H.: Responses of net ecosystem CO2 exchange in managed grassland to long-term CO2enrichment, N fertilization and plant species, Plant Cell and Environment, 28, 823–833,2005.
Ammann, C.: On the applicability of relaxed eddy accumulation and common methods formeasuring trace gas surface fluxes, Swiss Federal Institute of Technology, Zurich, 239 pp.,20
1998.Ammann, C., Flechard, C. R., Leifeld, J., Neftel, A., and Fuhrer, J.: The carbon budget
of newly established temperate grassland depends on management intensity, Agriculture,Ecosystems and Environment, 121, 5–20, 2007.
Aneja, V. P., Robarge, W. P., and Holbrook, B. D.: Measurements of Nitric-Oxide Flux from25
an Upper Coastal-Plain, North-Carolina Agricultural Soil, Atmos. Environ., 29, 3037–3042,1995.
Atkinson, R., Baulch, D. L., Cox, R. A., Crowley, J. N., Hampson, R. F., Hynes, R. G., Jenkin,M. E., Rossi, M. J., and Troe, J.: Evaluated kinetic and photochemical data for atmospheric
3195
BGD5, 3157–3219, 2008
Dynamic chambers tostudy trace gas
exchange ofgrassland
L. Pape et al.
Title Page
Abstract Introduction
Conclusions References
Tables Figures
J I
J I
Back Close
Full Screen / Esc
Printer-friendly Version
Interactive Discussion
chemistry: Volume I – gas phase reactions of Ox, HOx, NOx and SOx species, Atmos. Chem.Phys., 4, 1461–1738, 2004,http://www.atmos-chem-phys.net/4/1461/2004/.
Bakwin, P. S., Wofsy, S. C., Fan, S. M., Keller, M., Trumbore, S. E., and Dacosta, J. M.: Emissionof Nitric-Oxide (NO) from Tropical Forest Soils and Exchange of NO between the Forest5
Canopy and Atmospheric Boundary-Layers, J. Geophys. Res.-Atmos., 95, 16755–16764,1990.
Bargsten, A., Moravek, A., Huwe, B., Andreae, M. O., and Meixner, F. X.: Soilflux measurements of reactive and non-reactive trace gases in a mountainous region(Fichtelgebirge, Germany) by a dynamic chamber technique, Geophys. Res. Abstracts, 10,10
06610, 2008.Bassin, S., Calanca, P., Weidinger, T., Gerosa, G., and Fuhrer, E.: Modeling seasonal
ozone fluxes to grassland and wheat: model improvement, testing, and application, Atmos.Environ., 38, 2349–2359, 2004.
Brunner, A., Ammann, C., Neftel, A., and Spirig, C.: Methanol exchange between grassland15
and the atmosphere, Biogeosciences, 4, 395–410, 2007a,http://www.biogeosciences.net/4/395/2007/.
Brunner, A., Ammann, C., Jocher, M., Spirig, C., and Neftel, A.: Ozone triggers VOC emissionsof grassland species, Geophys. Res. Abstracts, 9, 09784, 2007b.
Butcher, S. S., Charlson, R. J., Gordon, H. O., and Gordon, V. W.: Global Biogeochemical20
Cycles, International Geophysics Series, edited by: Dmowska, R., and Holton, J. R.,Academic Press Inc., San Diego, 392 pp., 1992.
Butterbach-Bahl, K., Gasche, R., Breuer, L., and Papen, H.: Fluxes of NO and N2O fromtemperate forest soils: impact of forest type, N deposition and of liming on the NO and N2Oemissions, Nutr. Cycl. Agroecosyst., 48, 79–90, 1997.25
Conrad, R.: Compensation concentration as critical variable for regulating the flux of tracegases between soil and atmosphere, Biogeochemistry, 27, 155–170, 1994.
Conrad, R.: Soil Microorganisms as controllers of atmospheric trace gases (H2, CO, CH4, N2Oand NO), Microbiological Reviews, 60, 609–640, 1996.
Davison, B., Brunner, A., Ammann, C., Spirig, C., Jocher, M., and Neftel, A.: Cut-induced VOC30
emissions from agricultural grasslands, Plant Biology, 10, 76–85, 2008.Galbally, I. E. and Roy, C. R.: Destruction of Ozone at the Earths Surface, Quart. Jo. Roy.
Meteor. Soc., 106, 599–620, 1980.
3196

BGD5, 3157–3219, 2008
Dynamic chambers tostudy trace gas
exchange ofgrassland
L. Pape et al.
Title Page
Abstract Introduction
Conclusions References
Tables Figures
J I
J I
Back Close
Full Screen / Esc
Printer-friendly Version
Interactive Discussion
Gao, F., and Yates, S. R.: Laboratory study of closed and dynamic flux chambers: Experimentalresults and implications for field application, J. Geophys. Res.-Atmos., 103, 26 115–26 125,1998.
Gut, A., Neftel, A., Staffelbach, T., Riedo, M., and Lehmann, B. E.: Nitric oxide flux from soilduring the growing season of wheat by continuous measurements of the NO soil-atmosphere5
concentration gradient: A process study, Plant Soil, 216, 165–180, 1999.Gut, A., van Dijk, S. M., Scheibe, M., Rummel, U., Welling, M., Ammann, C., Meixner, F. X.,
Kirkman, G. A., Andreae, M. O., and Lehmann, B. E.: NO emission from an Amazonianrain forest soil: Continuous measurements of NO flux and soil concentration, J. Geophys.Res.-Atmos., 107, 8057, doi:10.1029/2001JD000521, 2002a.10
Gut, A., Scheibe, M., Rottenberger, S., Rummel, U., Welling, M., Ammann, C., Kirkman, G.A., Kuhn, U., Meixner, F. X., Kesselmeier, J., Lehmann, B. E., Schmidt, W., Muller, E., andPiedade, M. T. F.: Exchange fluxes of NO2 and O3 at soil and leaf surfaces in an Amazonianrain forest, J. Geophys. Res.-Atmos., 107, 8060, doi:10.1029/2001JD000654, 2002b.
Harley, P., Greenberg, J., Niinemets, U., and Guenther, A.: Environmental controls over15
methanol emission from leaves, Biogeosciences, 4, 1083–1099, 2007,http://www.biogeosciences.net/4/1083/2007/.
Herrmann, B., Jones, S. K., Fuhrer, J., Feller, U., and Neftel, A.: N budget and NH3 exchangeof a grass/clover crop at two levels of N application, Plant Soil, 235, 243–252, 2001.
Hicks, B. B., Baldocchi, D. D., Meyers, T. P., Hosker, R. P., and Matt, D. R.: A20
Preliminary Multiple Resistance Routine for Deriving Dry Deposition Velocities fromMeasured Quantities, Water Air and Soil Pollution, 36, 311–330, 1987.
Horst, T. W., and Weil, J. C.: How Far Is Far Enough - the Fetch Requirements forMicrometeorological Measurement of Surface Fluxes, J. Atmos. Oceanic Technol., 11,1018–1025, 1994.25
Horvath, L., Fuhrer, E., and Lajtha, K.: Nitric oxide and nitrous oxide emission from Hungarianforest soils; link with atmospheric N-deposition, Biogeosciences Discuss., 2, 703–723, 2005,http://www.biogeosciences-discuss.net/2/703/2005/.
Kaplan, W. A., Wofsy, S. C., Keller, M., and Dacosta, J. M.: Emission of NO and Deposition ofO-3 in a Tropical Forest System, J. Geophys. Res.-Atmos., 93, 1389–1395, 1988.30
Kesselmeier, J., Bode, K., Hofmann, U., Muller, H., Schafer, L., Wolf, A., Ciccioli, P.,Brancaleoni, E., Cecinato, A., Frattoni, M., Foster, P., Ferrari, C., Jacob, V., Fugit, J. L.,Dutaur, L., Simon, V., and Torres, L.: Emission of short chained organic acids, aldehydes and
3197

BGD5, 3157–3219, 2008
Dynamic chambers tostudy trace gas
exchange ofgrassland
L. Pape et al.
Title Page
Abstract Introduction
Conclusions References
Tables Figures
J I
J I
Back Close
Full Screen / Esc
Printer-friendly Version
Interactive Discussion
monoterpenes from Quercus ilex L. and Pinus pinea L. in relation to physiological activities,carbon budget and emission algorithms, Atmos. Environ., 31, 119–133, 1997.
Kirkman, G. A., Gut, A., Ammann, C., Gatti, L. V., Cordova, A. M., Moura, M. A. L.,Andreae, M. O., and Meixner, F. X.: Surface exchange of nitric oxide, nitrogen dioxide,and ozone at a cattle pasture in Rondonia, Brazil, J. Geophys. Res.-Atmos., 107,5
doi:10.1029/2001JD000523, 2002.Kitzler, B., Zechmeister-Boltenstern, S., Holtermann, C., Skiba, U., and Butterbach-Bahl, K.:
Nitrogen oxides emission from two beech forests subjected to different nitrogen loads,Biogeosciences, 3, 293–310, 2006,http://www.biogeosciences.net/3/293/2006/.10
Kuhn, U., Ammann, C., Wolf, A., Meixner, F. X., Andreae, M. O., and Kesselmeier, J.: Carbonylsulfide exchange on an ecosystem scale: soil represents a dominant sink for atmosphericCOS, Atmos. Environ., 33, 995–1008, 1999.
Kuhn, U., Rottenberger, S., Biesenthal, T., Ammann, C., Wolf, A., Schebeske, G., Oliva, S.T., Tavares, T. M., and Kesselmeier, J.: Exchange of short-chain monocarboxylic acids15
by vegetation at a remote tropical forest site in Amazonia, J. Geophys. Res.-Atmos., 107,doi:10.1029/2000JD000303, 2002.
Lehmann, L.: Untersuchungen zu biogenen NO-Emissionen aus einem mitteleuropaischenLaubwaldboden, Institut fur Geografie und Geookologie, Universitat Karlsruhe, Karlsruhe,92 pp., 2002.20
Lindberg, S. E., Zhang, H., Vette, A. F., Gustin, M. S., Barnett, M. O., and Kuiken, T.: Dynamicflux chamber measurement of gaseous mercury emission fluxes over soils: Part 2 - effect offlushing flow rate and verification of a two-resistance exchange interface simulation model,Atmos. Environ., 36, 847–859, 2002.
Livingston, G. P. and Hutchinson, G. L.: Enclosure-based measurements of trace gas25
exchange: applications and sources of error, in: Biogenic trace gases: measuring emissionfrom soil and water, edited by: Matson, P. A. and Harriss, R. C., Blackwell Science Ltd.,Oxford, 1995.
Ludwig, J.: Untersuchungen zum Austausch von NO und NO2 zwischen Atmosphare undBiosphare, Fakultat fur Biologie, Universitat Bayreuth, Bayreuth, 1994.30
Maljanen, M., Komulainen, V. M., Hytonen, J., Martikainen, P., and Laine, J.: Carbon dioxide,nitrous oxide and methane dynamics in boreal organic agricultural soils with different soilcharacteristics, Soil Biol. Biochem., 36, 1801–1808, 2004.
3198

BGD5, 3157–3219, 2008
Dynamic chambers tostudy trace gas
exchange ofgrassland
L. Pape et al.
Title Page
Abstract Introduction
Conclusions References
Tables Figures
J I
J I
Back Close
Full Screen / Esc
Printer-friendly Version
Interactive Discussion
Maljanen, M., Martikkala, M., Koponen, H. T., Virkajarvi, P., and Martikainen, P. J.: Fluxes ofnitrous oxide and nitric oxide from experimental excreta patches in boreal agricultural soil,Soil Biol. Biochem., 39, 914–920, 2007.
Meixner, F. X.: Surface exchange of odd nitrogen oxides, Nova Acta Leopoldiana, 70, 299–348,1994.5
Meixner, F. X., Fickinger, T., Marufu, L., Serca, D., Nathaus, F. J., Makina, E., Mukurumbira,L., and Andreae, M. O.: Preliminary results on nitric oxide emission from a southern Africansavanna ecosystem, Nutr. Cycl. Agroecosyst., 48, 123–138, 1997.
Nussbaum, S. and Fuhrer, J.: Difference in ozone uptake in grassland species between open-top chambers and ambient air, Environmental Pollution, 109, 463–471, 2000.10
Oke, T. R.: Boundary Layer Climates, Routlege, London and New York, 1987.Parrish, D. D., Williams, E. J., Fahey, D. W., Liu, S. C., and Fehsenfeld, F. C.: Measurement
of Nitrogen-Oxide Fluxes from Soils – Intercomparison of Enclosure and GradientMeasurement Techniques, J. Geophys. Res.-Atmos., 92, 2165–2171, 1987.
Pilegaard, K., Hummelshoj, P., and Jensen, N. O.: Nitric oxide emission from a Norway spruce15
forest floor, J. Geophys. Res.-Atmos., 104, 3433–3445, 1999.Pilegaard, K.: Air-Soil Exchange of NO, NO2 and O3 in Forests, Water, Air, and Soil Pollution,
Focus, 1, 79–88, 2001.Pilegaard, K., Mikkelsen, T. N., Beier, C., Jensen, N. O., Ambus, P., and Ro-Poulsen, H.:
Field measurements of atmosphere-biosphere interactions in a Danish beech forest, Boreal20
Environ. Res., 8, 315–333, 2003.Remde, A., Ludwig, J., Meixner, F. X., and Conrad, R.: A Study to Explain the Emission of
Nitric-Oxide from a Marsh Soil, J. Atmos. Chem., 17, 249–275, 1993.Roelle, P., Aneja, V. P., O’Connor, J., Robarge, W., Kim, D. S., and Levine, J. S.: Measurement
of nitrogen oxide emissions from an agricultural soil with a dynamic chamber system, J.25
Geophys. Res.-Atmos., 104, 1609–1619, 1999.Roelle, P. A., Aneja, V. P., Gay, B., Geron, C., and Pierce, T.: Biogenic nitric oxide emissions
from cropland soils, Atmos. Environ., 35, 115–124, 2001.Rottenberger, S., Kleiss, B., Kuhn, U., Wolf, A., Piedade, M. T. F., Junk, W., and Kesselmeier, J.:
The effect of flooding on the exchange of the volatile C2-compounds ethanol, acetaldehyde30
and acetic acid between leaves of Amazonian floodplain tree species and the atmosphere,Biogeosciences, 5, 1085–1100, 2008,http://www.biogeosciences.net/5/1085/2008/.
3199

BGD5, 3157–3219, 2008
Dynamic chambers tostudy trace gas
exchange ofgrassland
L. Pape et al.
Title Page
Abstract Introduction
Conclusions References
Tables Figures
J I
J I
Back Close
Full Screen / Esc
Printer-friendly Version
Interactive Discussion
Skiba, U., Smith, K. A., and Fowler, D.: Nitrification and Denitrification as Sources of Nitric-Oxide and Nitrous-Oxide in a Sandy Loam Soil, Soil Biol. Biochem., 25, 1527–1536, 1993.
Slemr, F. and Seiler, W.: Field-Measurements of NO and NO2 Emissions from Fertilized andUnfertilized Soils, J. Atmos. Chem., 2, 1–24, 1984.
Suh, S. U., Chun, Y. M., Chae, N. Y., Kim, J., Lim, J. H., Yokozawa, M., Lee, M. S., and Lee,5
J. S.: A chamber system with automatic opening and closing for continuously measuring soilrespiration based on an open-flow dynamic method, Ecol. Res., 21, 405–414, 2006.
Tilsner, J., Wrage, N., Lauf, J., and Gebauer, G.: Emission of gaseous nitrogen oxides from anextensively managed grassland in NE Bavaria, Germany. I. Annual budgets of N2O and NOxemissions, Biogeochemistry, 63, 229–247, 2003.10
van Dijk, S. M. and Duyzer, J. H.: Nitric oxide emissions from forest soils, J. Geophys. Res.-Atmos., 104, 15 955–15 961, 1999.
Warneck, P.: Chemistry of the Natural Atmosphere, 2 ed., International Geophysics Series,edited by: Dmowska, R., and Holton, J. R., Academic Press Inc., San Diego, 927 pp., 2000.
Webb, E. K., Pearman, G. I., and Leuning, R.: Correction of Flux Measurements for Density15
Effects Due to Heat and Water-Vapor Transfer, Q. J. Roy. Meteorol. Soc., 106, 85–100, 1980.Wesely, M. L.: Parameterization of Surface Resistances to Gaseous Dry Deposition in
Regional-Scale Numerical-Models, Atmos. Environ., 23, 1293–1304, 1989.Wesely, M. L. and Hicks, B. B.: A review of the current status of knowledge on dry deposition,
Atmos. Environ., 34, 2261–2282, 2000.20
Williams, E. J. and Davidson, E. A.: An Intercomparison of 2 Chamber Methods for theDetermination of Emission of Nitric-Oxide from Soil, Atmos. Environ. Part a-General Topics,27, 2107–2113, 1993.
Yamulki, S., Goulding, K. W. T., Webster, C. P., and Harrison, R. M.: Studies on NO and N2OFluxes from a Wheat Field, Atmos. Environ., 29, 1627–1635, 1995.25
3200

BGD5, 3157–3219, 2008
Dynamic chambers tostudy trace gas
exchange ofgrassland
L. Pape et al.
Title Page
Abstract Introduction
Conclusions References
Tables Figures
J I
J I
Back Close
Full Screen / Esc
Printer-friendly Version
Interactive Discussion
Table 1. Manufacturer details for all parts of the dynamic chambers.
Part Manufacturer/ Supplier Specifications
frame and lid MPI workshop, Germany acrylic glass, thickness=12 mmFEP film Saint Gobain, Germany FEP (fluorinated ethylene propylene) film,
thickness=0.05 mm, chemically inert, transparent forvisible and UV light
Silicone straps Dichtungstechnik Bensheim GmbH, Germany transparent silicone cord, bulk stock, diameter=5 mmDC motor with gear assembly Bosch, Germany model CDP, 24 V, 22 Wlid inclinometer Pewatron, Switzerland HALL effect inclinometer,
model UV-00H-SW2soil collars ART workshop, Switzerland PVC, thickness=5 mm, height=12 cm,
inner diameter=35 cmaluminium clamps Bessey, Germany aluminium mini clamp, type AM4inlet fan Micronel, Switzerland Axial fan, model D344T012GK-2mixing fan Micronel, Switzerland Ultra Slim fan, model F62MM012GK-9, Teflon® coating
by MPI workshopinlet/outlet adapter MPI workshop, Germany PVC tubing, inner diameter=3 cmair mass flow sensor Honeywell International Inc., USA model AWM 700particulate membrane filter Pall Corporation, USA Zylon™ membrane disc filters, model P4PH047, pore
size 5µm, diameter=47 mmin-line filter case Entegris Inc., USA Galtek® Integral Ferrule in-line filterstubing div. 1/4” PFA tubingsolenoid valves Entegris Inc., USA, Galtek® Diaphragm Valves, 3-way, 1/4” orificesample pump KNF Neuberger GmbH LABOPORT®, model N 810.3 FT.18, all sample exposed
parts are PTFE coatedheating tape Electrolux, Sweden model SLH 15/L300, self limiting
3201

BGD5, 3157–3219, 2008
Dynamic chambers tostudy trace gas
exchange ofgrassland
L. Pape et al.
Title Page
Abstract Introduction
Conclusions References
Tables Figures
J I
J I
Back Close
Full Screen / Esc
Printer-friendly Version
Interactive Discussion
Table 2. Specifications of gas analysers used with the dynamic chamber system.
Species Analyzer Precision
Rumlang experiment
NO, NO2 Model 42C, Thermo Fisher Scientific, Waltham, USA 0.2 ppb, 0.3 ppbO3 Model 49C, Thermo Fisher Scientific, Waltham, USA 0.8 ppbCO2, H2O LI-6262, Li-Cor, Lincoln, USA 1.3 ppm, 0.13‰
Oensingen experiment
CO2, H2O LI-6262, Li-Cor, Lincoln, USA 1.3 ppm, 0.13‰methanol PTR-MS, Ionicon Analytik GmbH, Innsbruck, Austria 0.1 ppb
3202

BGD5, 3157–3219, 2008
Dynamic chambers tostudy trace gas
exchange ofgrassland
L. Pape et al.
Title Page
Abstract Introduction
Conclusions References
Tables Figures
J I
J I
Back Close
Full Screen / Esc
Printer-friendly Version
Interactive Discussion
Table 3. Statistical parameters of blank chamber fluxes and range of observed regular chamberfluxes during the Rumlang field experiment (inorganic compounds) and the Oensingen fieldexperiment (methanol). q10 and q90 denote the 10% and 90% quantiles of the entire dataset;SE denotes the standard error of the mean flux. The last column gives the respective fluxranges observed by the regular chambers during the field measurements.
blank chamber fluxes reg. chamber fluxes
Compound units q10. . .q90 mean (±2 SE) observed range
CO2 µmol m−2 s−1 +4.16. . .+4.16 –0.47 (±0.31) –20. . .+10H2O mmol m−2 s−1 –0.13. . .+0.74 0.19 (±0.03) 0. . .+8NO nmol m−2 s−1 –0.14. . .+0.12 0.009 (±0.018) 0. . .+4NO2 nmol m−2 s−1 +0.35. . .+0.35 0.014 (±0.024) –2. . . 0O3 nmol m−2 s−1 –1.50. . .+0.37 –0.54 (±0.056) –5. . . 0methanol nmol m−2 s−1 –0.56. . .+0.41 –0.07 (±0.048) –1. . .+5
3203

BGD5, 3157–3219, 2008
Dynamic chambers tostudy trace gas
exchange ofgrassland
L. Pape et al.
Title Page
Abstract Introduction
Conclusions References
Tables Figures
J I
J I
Back Close
Full Screen / Esc
Printer-friendly Version
Interactive Discussion
Table 4. Characteristics of dynamic chamber measurements of nitric oxide and other tracegases on different ecosystems.
Author ecosystem target gasesa wall materialb purging air wall loss internal closure time V [L] τcham
(incl. of Sgp) determination mixing (methodd) [mm:ss]
Slemr and Seiler (1984) grassland NO, NO2 SS ambient (no) no 12 min (M) 18 0:24Parrish et al. (1987)c grassland NO, NO2 PA zero-air (no) blank chamber no 30–45 min (M) 28 5:36Kaplan et al. (1988) forest soil NO FEP* ambient (yese) yesf yes ?(M) 7.2 24:00Williams and Davidson (1993) grassland NO PTFE* zero-air (no) no (30) 7:30Remde et al. (1993) pasture NO SS/PA ambient (yes) blank chamber yes 4 min (M) 12.7 0:17Skiba et al. (1993) L. perenne NO PA O3-free (no) yes ? (M) 570 7:07Ludwig (1994)d wheat NO, NO2 PA ambient (yes) blank chamber yes 3 min (A) 42.6 0:37Aneja et al. (1995) agric. soils NO PTFE* ambient (yes) yesf yes ? (M) 25 2:47Yamulki (1995) agric. soils NO PTFE* O3-free (no) ? ? (M) 7.5 3:45Meixner et al. (1997) grassland NO PA ambient (yes) blank chamber yes 3 min (A) 25.7 0:26Butterbach-Bahl et al. (1997) forest soil NO, NO2 PA ambient (yes) blank chamber yes 6 min (A) 37.5 0:42Gut et al. (1999) wheat NO PTFE* ambient (yes) blank chamber yes 3 min (A) 16 0:10Pilegaard (1999) forest soil NO PTFE* ambient (nog) nog yes 1 h (M) 22.6 3:14Roelle et al. (1999) agric. soil NO, NOy PTFE* ambient (yesf) yesf yes 10 h (M) 24 6:00van Dijk and Duyzer (1999) forest soil NO SS/PA ambient (?) yes 1 h (M) 68 6:48Roelle et al. (2001) agric. soil NO PTFE* ambient (?) yes 10 h (M) 24.1 6:01Pilegaard (2001) forest soil NO, NO2, O3 PTFE ambient (yes) blank chamber yes 30 min (A) 12 1:20Gut et al. (2002a,b) forest soil NO, NO2, O3, CO2 PA ambient (yes) blank chamber yes weeksh (M) 11.8 0:25Kirkman et al. (2002) pasture NO, NO2, O3 PA ambient (yes) blank chamber yes weeksh (M) 11.8 0:25Tilsner et al. (2003) pasture NOx PTFE zero-air (no) ? ? (M) 5.3 1:24Kitzler et al. (2006)h forest soil NO, NOx SS/PA ambient (yes) blank chamber ? 5 min (A) 3.3 3:16ibid. forest soil NO SS/PA zero-air (no) ? 5 min (A) 3.3 3:16Horvath et al. (2006) forest soil NO opaque ambient (yes) ? 10 min (M) 0.4 1:13Maljanen et al. (2007) pasture NO PVC ambient (?) ? ? (M) 6.7 13:24this study grassland NO, NO2, O3, CO2, FEP ambient (yes) blank chamber yes 10–13 min (A) 40 0:40
H2O, methanol
a only considering gases for which flux results (or deposition velocities/resistances) are reported;b SS=stainless steel, PA=polyacrylics, PTFE, FEP, PFA=Teflon materials, PVC=polyvinyl chloride, *coating;c M=manual closing, A=automated closing;d see also Williams et al. (1987);e see also Meixner (1994);f empirical method after Kaplan (1988) using equilibration rate;g negligible;h continuous flushing, funnel on top for rain collection.
3204
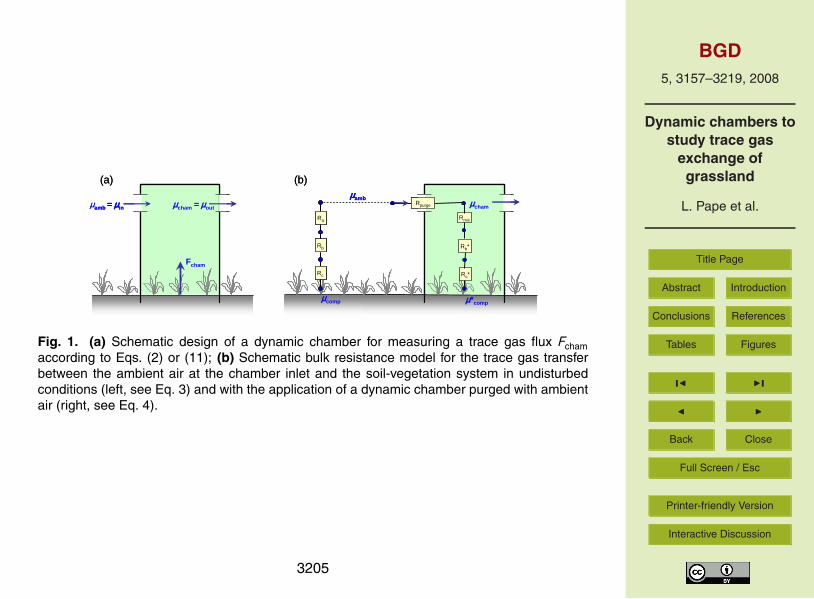
BGD5, 3157–3219, 2008
Dynamic chambers tostudy trace gas
exchange ofgrassland
L. Pape et al.
Title Page
Abstract Introduction
Conclusions References
Tables Figures
J I
J I
Back Close
Full Screen / Esc
Printer-friendly Version
Interactive Discussion
µamb
Ra
Rb
Rc
µcomp
µcham
Rmix
Rb*
Rc*
µ*comp
Rpurgeµamb = µin µcham = µout
Fcham
(a) (b)µamb
Ra
Rb
Rc
µcomp
µcham
Rmix
Rb*
Rc*
µ*comp
Rpurgeµamb = µin µcham = µout
Fcham
(a) (b)
Fig. 1. (a) Schematic design of a dynamic chamber for measuring a trace gas flux Fchamaccording to Eqs. (2) or (11); (b) Schematic bulk resistance model for the trace gas transferbetween the ambient air at the chamber inlet and the soil-vegetation system in undisturbedconditions (left, see Eq. 3) and with the application of a dynamic chamber purged with ambientair (right, see Eq. 4).
3205

BGD5, 3157–3219, 2008
Dynamic chambers tostudy trace gas
exchange ofgrassland
L. Pape et al.
Title Page
Abstract Introduction
Conclusions References
Tables Figures
J I
J I
Back Close
Full Screen / Esc
Printer-friendly Version
Interactive Discussion
7
8
9
10
6
11
2
1
5
312
13
14
10 cm
4
117
8
9
10
6
11
2
1
5
312
13
14
10 cm
4
117
8
9
10
6
11
2
1
5
312
13
14
10 cm
4
11
Fig. 2. Photograph and schematic of one individual dynamic chamber consisting of: (1) acrylicglass frame, (2) transparent FEP film (yellow parts in the scheme), (3) clamp to attach chamberto soil frame, (4) moving lid, (5) lid motor, (6) lid inclinometer, (7) purging fan with ambient airinlet, (8) mass flow meter, (9) chamber air inlet, (10) chamber air outlet, (11) mixing fan, (12)soil frame, (13) sample tube for ambient air, (14) sample tube for chamber air.
3206

BGD5, 3157–3219, 2008
Dynamic chambers tostudy trace gas
exchange ofgrassland
L. Pape et al.
Title Page
Abstract Introduction
Conclusions References
Tables Figures
J I
J I
Back Close
Full Screen / Esc
Printer-friendly Version
Interactive Discussion
Fig. 3. Spectral radiation transmission of acrylic glass frame (blue dashed line), FEP film (blacksolid line), and complete chamber (calculated with FEP film +50% acrylic glass, red dottedline). The shaded areas indicate the wavelength domains of j (NO2) (horizontal lines) and PAR(vertical lines). Data provided by Trebs and Kesselmeier (personal communication).
3207

BGD5, 3157–3219, 2008
Dynamic chambers tostudy trace gas
exchange ofgrassland
L. Pape et al.
Title Page
Abstract Introduction
Conclusions References
Tables Figures
J I
J I
Back Close
Full Screen / Esc
Printer-friendly Version
Interactive Discussion
Motor (0-24 VDC)
IC (5 VDC / 0-5 V)
Blower (0-12 VDC)
MFM (10 VDC / 0-5 V)
chamber
additionals
Aout #3 (0-5 V)
Aout #2 (0-5 V)
Aout #1 (0-5 V)
Ain #3 (5 VDC / 0-10 V)
Ain #2 (5 VDC / 0-10 V)
Ain #1 (0-10 V)environmental sensors
Wetness Grid (15 V / resistance)
SWC (15 VDC / 0-1 V)
Tsoil (thermistor)
Tair (thermistor)
data processing& power transformationdata processing& power transformationDC (28 V)/serial in
from V25
DC (28 V)/serial out
bypass to next chamber
n.o.
Valve #1Valve #1
n.o.
Valve #2Valve #2
outlet air sampling
inlet air sampling bypass from next chamber
to analyzersICO
V25
Analyzer 3
Analyzer 2
Analyzer 1
Exh
au
st
ICO ICO ICO ICO ICO
Pump
Power supply
data acquisitiondata averagingdata storagemeasurementcycle timing
(a)
(b)
Fig. 4. (a) Schematic setup of a sampling system with five combined dynamic chambers, asapplied in the Rumlang field experiment. Black lines are cables for data acquisition and control;open lines are PFA sampling tubes. (b) Schematic drawing of the individual controller module(ICO). Filled lines are cables for RS232 communication, control, and data acquisition, openlines are PFA gas sampling tubes (the gas flow direction is indicated by arrows).
3208

BGD5, 3157–3219, 2008
Dynamic chambers tostudy trace gas
exchange ofgrassland
L. Pape et al.
Title Page
Abstract Introduction
Conclusions References
Tables Figures
J I
J I
Back Close
Full Screen / Esc
Printer-friendly Version
Interactive Discussion
(a)
(b)
(c)
(d)
Ch #1Ch #2Ch #3Ch #4Ch #5
300
320
340
360
CO
2 m
ixin
g ra
tio
[ppm
]
0
10
20
30
O3
mix
ing
ratio
[p
pb]
0
1
2
3
4
00 04 08 12 16 20 24 28 32 36 40 44 48 52 56 00
time [minutes]
NO
mix
ing
ratio
[ppb
]
Fig. 5. Chamber control scheme for 5 individual chambers (Ch #1 to Ch #5) and typical timeseries of trace gas mixing ratios over one full measurement cycle of 1 h during the Rumlang fieldexperiment. (a) Control scheme indicating periods of closed lid (red bars), sampling/analysisof ambient air (blue bars), and sampling/analysis of chamber air (green bars). (b)–(d) Originaltime series (20 s resolution) of CO2, O3, and NO mixing ratios. For flux calculations the first100 s after each valve switching have been discarded (see Sect. 3.1.1). The effective averagingintervals are indicated by grey bars on top of panel (b).
3209

BGD5, 3157–3219, 2008
Dynamic chambers tostudy trace gas
exchange ofgrassland
L. Pape et al.
Title Page
Abstract Introduction
Conclusions References
Tables Figures
J I
J I
Back Close
Full Screen / Esc
Printer-friendly Version
Interactive Discussion
Fig. 6. Exemplary field observation of chamber temperature equilibration after closing of thechamber lid at time=0 s (23 August 2004 15:00 LT, G=540 W m−2). The dashed line representsa fitted exponential function according to Eq. (12). The dotted anchor lines indicate the fittedτcham and t98, respectively (see text).
3210

BGD5, 3157–3219, 2008
Dynamic chambers tostudy trace gas
exchange ofgrassland
L. Pape et al.
Title Page
Abstract Introduction
Conclusions References
Tables Figures
J I
J I
Back Close
Full Screen / Esc
Printer-friendly Version
Interactive Discussion
Fig. 7. Numerical simulations of the temporal development of the chamber NO mixing ratioµcham(NO) after closing the lid. Calculations are based on Eq. (10). Circles with dotted anchorlines represent the 98% equilibration time (t98). All simulations were performed with a constantambient NO mixing ratio of 5 ppb, also representing the initial value for µcham(NO). For eachindividual graph, one parameter was varied (indicated by the coloured curve labels), while theother parameters were held constant:(a) varying purging flow (Q); constant µamb(O3)=0 ppb and F (NO)=1.43 nmol m−2 s−1. (b)varying soil NO emission flux (F (NO)); constant µamb(O3)=0 ppb and Q=60 l min−1. (c) varyingambient ozone mixing ratio (µamb(O3)); constant F (NO)=0 nmol m−2 s−1 and Q=60 l min−1. (d)varying soil NO emission flux (F (NO)); constant µamb(O3)=20 ppb and Q=60 l min−1.
3211

BGD5, 3157–3219, 2008
Dynamic chambers tostudy trace gas
exchange ofgrassland
L. Pape et al.
Title Page
Abstract Introduction
Conclusions References
Tables Figures
J I
J I
Back Close
Full Screen / Esc
Printer-friendly Version
Interactive Discussion
0
5
10
15
20
25
30
35
40
0 0.5 1 1.5 2
air velocity [m s-1]
cham
ber h
eigh
t [cm
] (0
= ch
ambe
r bot
tom
)
10 c
m
0
5
10
15
20
25
30
35
40
0 0.5 1 1.5 2
air velocity [m s-1]
cham
ber h
eigh
t [cm
] (0
= ch
ambe
r bot
tom
)
10 c
m10
cm
Fig. 8. Vertical profiles of air velocity inside the dynamic chamber measured by a hot-wireanemometer. The air movement resulted from the two displayed mixing fans as well as from thepurging air flow (Q=60 l min−1). The coloured vertical lines in the chamber sketch indicate thedifferent horizontal positions of the displayed velocity profile measurements (with correspondingcolours) within the cylindrical chamber.
3212
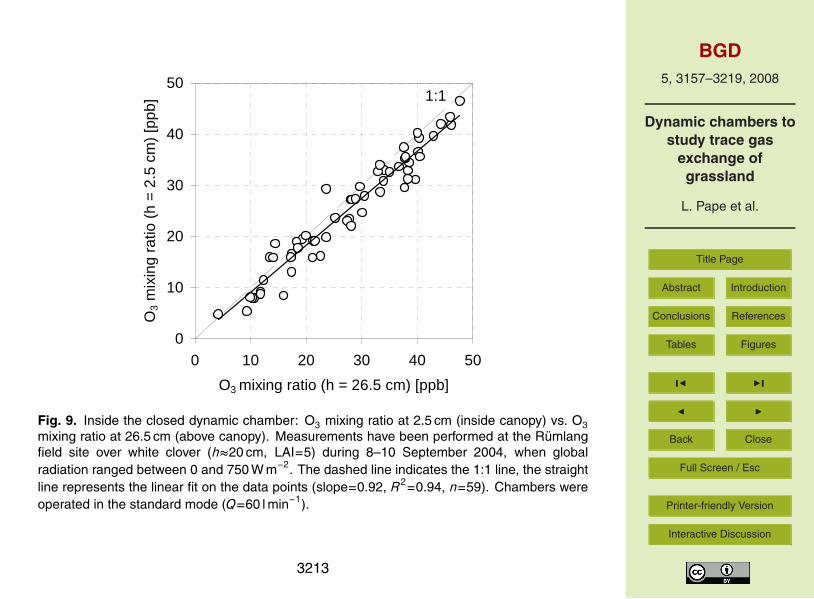
BGD5, 3157–3219, 2008
Dynamic chambers tostudy trace gas
exchange ofgrassland
L. Pape et al.
Title Page
Abstract Introduction
Conclusions References
Tables Figures
J I
J I
Back Close
Full Screen / Esc
Printer-friendly Version
Interactive Discussion
0
10
20
30
40
50
0 10 20 30 40 50
O3 mixing ratio (h = 26.5 cm) [ppb]
O3
mix
ing
ratio
(h
= 2
.5 c
m)
[ppb
] 1:1
Fig. 9. Inside the closed dynamic chamber: O3 mixing ratio at 2.5 cm (inside canopy) vs. O3mixing ratio at 26.5 cm (above canopy). Measurements have been performed at the Rumlangfield site over white clover (h≈20 cm, LAI=5) during 8–10 September 2004, when globalradiation ranged between 0 and 750 W m−2. The dashed line indicates the 1:1 line, the straightline represents the linear fit on the data points (slope=0.92, R2=0.94, n=59). Chambers wereoperated in the standard mode (Q=60 l min−1).
3213

BGD5, 3157–3219, 2008
Dynamic chambers tostudy trace gas
exchange ofgrassland
L. Pape et al.
Title Page
Abstract Introduction
Conclusions References
Tables Figures
J I
J I
Back Close
Full Screen / Esc
Printer-friendly Version
Interactive Discussion
5
10
15
20
25
30
5 10 15 20 25 30 35 40 45
ambient O3 mixing ratio [ppb]
cha
mbe
r O
3 m
ixin
g ra
tio [p
pb]
1:1
Fig. 10. Chamber vs. ambient O3 mixing ratios of a dynamic chamber operated on ryegrass(LAI=5) during daytime (G≥200 W m−2), 4–7 June 2004, at the Rumlang field site. The dashedline indicates the 1:1 line, the straight line represents the linear fit (zero offset) to the datapoints (slope=0.55, R2=0.93, n=58). The chamber was operated in the standard mode(Q=60 l min−1).
3214

BGD5, 3157–3219, 2008
Dynamic chambers tostudy trace gas
exchange ofgrassland
L. Pape et al.
Title Page
Abstract Introduction
Conclusions References
Tables Figures
J I
J I
Back Close
Full Screen / Esc
Printer-friendly Version
Interactive Discussion
Fig. 11. Characterisation of chamber headspace conditions during the Rumlang fieldexperiment (August/September 2004): (a) air temperature: Tcham (in the closed chamber)vs. Tamb (in the open chamber); (b) average difference of air temperature Tcham−Tamb for classesof global radiation; linear fit (solid line): slope=0.0057, offset=0.20, R2=0.99; (c) water vapourmixing ratio: µcham(H2O) (chamber headspace) vs. µamb(H2O) (chamber inlet); (d) averageddifference of water vapour mixing ratio µcham(H2O)–µamb(H2O) for classes of global radiation;linear fit (solid line): slope=0.0069, offset=1.05; R2=0.94.
3215

BGD5, 3157–3219, 2008
Dynamic chambers tostudy trace gas
exchange ofgrassland
L. Pape et al.
Title Page
Abstract Introduction
Conclusions References
Tables Figures
J I
J I
Back Close
Full Screen / Esc
Printer-friendly Version
Interactive Discussion
0
0.002
0.004
0.006
0.008
0.01
0 200 400 600 800 1000
global radiation [W m-2]
NO
2 ph
otol
ysis
rat
e [s
-1]
0
0.1
0.2
0.3
0.4
0.5
tran
smis
sivi
ty [-
]
Fig. 12. NO2 photolysis rate (j (NO2)) as a function of global radiation (G) underambient conditions (open circles) and inside the closed dynamic chamber (filled diamonds).In both cases, a 2nd order polynomial was fitted to the corresponding data pointsresulting in: j (NO2)amb=−0.48×10⁻⁹G2+1.31×10⁻⁵G (black solid line, R2=0.99, n=1528) andj (NO2)cham=−2.95×10⁻⁹G2+6.40×10⁻⁶G (grey solid line, R2=0.95, n=227). The photolysisrelated chamber transmissivity α=j (NO2)cham/j (NO2)amb (black dashed line) was calculated asthe ratio between the two polynomial fit curves and can be parameterised as a function of G:α=−10−4G+0.49.
3216

BGD5, 3157–3219, 2008
Dynamic chambers tostudy trace gas
exchange ofgrassland
L. Pape et al.
Title Page
Abstract Introduction
Conclusions References
Tables Figures
J I
J I
Back Close
Full Screen / Esc
Printer-friendly Version
Interactive Discussion
21.09.04 22.09.04 23.09.04 24.09.04 25.09.04 26.09.04 27.09.04Time (LT)
0
200
400
600
800
G [
W m
-2]
6
9
12
15
18
T [
°C]
0
2
4N
O fl
ux[n
mo
l m-2 s
-1]
0
0.5
1
1.5
1/R
c(N
O2)
[cm
s-1]
0
0.5
1
1.5
2
1/R
c(O
3)[c
m s
-1]
-18-12
-606
12
CO
2 flu
x[µ
mo
l m-2 s
-1]
0
1
2
3
H2O
flu
x[m
mo
l m-2 s
-1](a)
(b)
(c)
(d)
(e)
(f)
Fig. 13. Exemplary time series of (a) water vapour flux, (b) CO2 flux, (c) NO flux, (d) surfaceconductance for O3, (e) surface conductance for NO2, as observed at small scale plots (3×6 m)with white clover monocultures at the Rumlang site. Chamber fluxes were measured on plot #1(triangles) with LAI=3.3 and high N fertilisation, plot #2 (diamonds) with LAI=2.3 and low Nfertilisation, and by a blank chamber (squares) that was sealed against the ground with FEPfilm. (f) Time series of global radiation (orange solid line) and air temperature (blue dashedline) at 2 m height.
3217

BGD5, 3157–3219, 2008
Dynamic chambers tostudy trace gas
exchange ofgrassland
L. Pape et al.
Title Page
Abstract Introduction
Conclusions References
Tables Figures
J I
J I
Back Close
Full Screen / Esc
Printer-friendly Version
Interactive Discussion
0
20
40
60
80
100
tem
pera
ture
[°C
]; r
el. h
umid
ity [%
]
0
200
400
600
800
1000
glob
. rad
iatio
n [W
m-2
]
(a)
-20
-10
0
10
CO
2 flu
x [ µ
mol
m-2
s-1]
(b)
-2
0
2
4
6
07 Jul 08 Jul 09 Jul 10 Jul 11 Jul 12 Jul 13 Jul
met
hano
l flu
x [n
mol
m-2
s-1] (c)
Fig. 14. Flux measurements and environmental conditions from 07 to 13 July 2004 at theOensingen field site (intensively managed grassland): (a) air temperature (red dashed line),relative humidity (blue dotted line), and global radiation (yellow solid line); (b) and (c) CO2 andmethanol surface exchange fluxes measured simultaneously by an eddy covariance system(blue filled diamonds) and two dynamic chambers (light and dark green open symbols).
3218
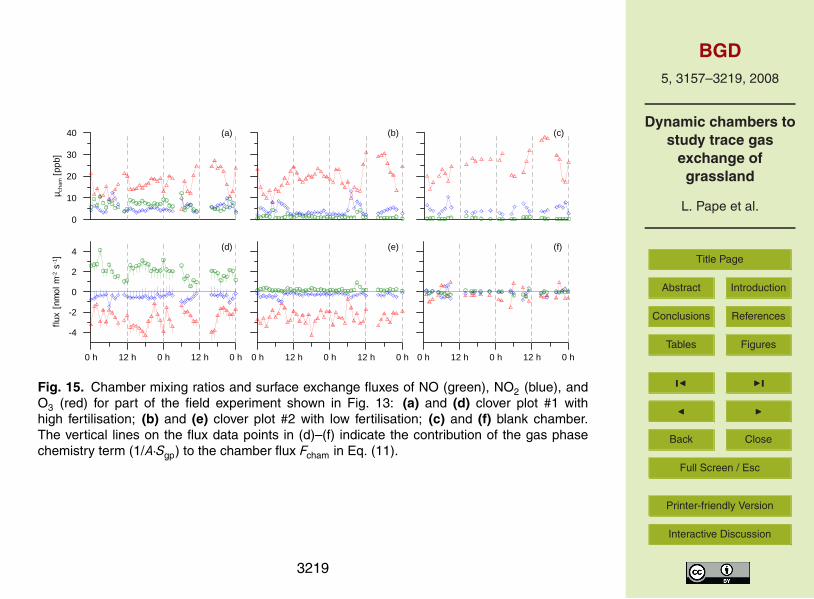
BGD5, 3157–3219, 2008
Dynamic chambers tostudy trace gas
exchange ofgrassland
L. Pape et al.
Title Page
Abstract Introduction
Conclusions References
Tables Figures
J I
J I
Back Close
Full Screen / Esc
Printer-friendly Version
Interactive Discussion
0 h 12 h 0 h 12 h 0 h0 h 12 h 0 h 12 h 0 h0 h 12 h 0 h 12 h 0 h
-4
-2
0
2
4
flux
[nm
ol m
-2 s
-1]
0
10
20
30
40
µ cha
m [
ppb]
(a) (b) (c)
(d) (e) (f)
Fig. 15. Chamber mixing ratios and surface exchange fluxes of NO (green), NO2 (blue), andO3 (red) for part of the field experiment shown in Fig. 13: (a) and (d) clover plot #1 withhigh fertilisation; (b) and (e) clover plot #2 with low fertilisation; (c) and (f) blank chamber.The vertical lines on the flux data points in (d)–(f) indicate the contribution of the gas phasechemistry term (1/A·Sgp) to the chamber flux Fcham in Eq. (11).
3219