Embed Size (px)
Citation preview
Proceedings of Informing Science & IT Education Conference (InSITE) 2010
Dynamic Bus Rapid Transit (BRT) Resource Management Modeling
Using Fuzzy Logic Paradigm Olufade F. W. ONIFADE, Bolanle, F. OLADEJO,
and Tosin, J. OYEDEJI Department of Computer Science, University of Ibadan,
Ibadan, Nigeria
[email protected], [email protected], [email protected]
Abstract Our prosperity and well-being are founded on efficient access to goods, services, people and places. In many developing countries, inadequate transport facilities are often the norm rather than the exception. A good transport system is essential to support economic growth and devel-opment. Nowadays, Traffic congestion resulting into excessive waiting time for the commuter is one of the leading causes of lost productivity and decreased standard of living in metropolis, ur-ban and rural sectors in cities all over the world. This work employed a soft system methodology that is fuzzy logic-based traffic control modeling technique to predict traffic conditions and pro-pose a flexible approach to resolving the allocation of Buses. The technique involves the fuzzifi-cation of input variables that is based on major traffic conditions such as, (Day of the week, Time of the day, public holidays, weather conditions and locality). The design employed Mamdani-style inference system which is very good for the representation of human reasoning and effective analysis. The implementation is done using MATLAB 7.0 fuzzy logic tools. The result shows a tool that can be effectively used to analyze potential traffic deadlock conditions in Lagos State, Nigeria and help traffic officials in the city improve productivity cum standard of living in Lagos metropolis.
Key words: Traffic Congestion, Defuzzification, Vehicle Navigation, Personal Mobility, Fuzzy Model, Traffic Modeling.
Introduction Transportation is an essential part of human activity. It is a requirement for every nation regard-less of its industrial capacity, population size, or technological development (Falola et al., 1986), and in many ways form the basis of all socio-economic interactions. Moving goods and people
from one place to another therefore is critical to maintaining strong economic and political ties between regions in the same state. More importantly, the movement access to education, recrea-tional, business, work and other land-uses is paramount to the continued exis-tence of a city (Kenworthy & Newman, 1999; Litman, 2002; Ogunkoya, 2003).
Material published as part of this publication, either on-line or in print, is copyrighted by the Informing Science Institute. Permission to make digital or paper copy of part or all of these works for personal or classroom use is granted without fee provided that the copies are not made or distributed for profit or commercial advantage AND that copies 1) bear this notice in full and 2) give the full citation on the first page. It is per-missible to abstract these works so long as credit is given. To copy in all other cases or to republish or to post on a server or to redistribute to lists requires specific permission and payment of a fee. Contact [email protected] to re-quest redistribution permission.
Dynamic Bus Rapid Transit
318
Indeed, no two locations will interact effectively without a viable means of movement. Access usually involves movement, and the growth of personal mobility in particular is a story of re-markable success for transport and expanding opportunity for suppliers and operators. It is a suc-cess which comes, nevertheless, at a price measured in congestion delays, pollution, noise and accidents. Congestion results when traffic demand approaches or exceeds the available capacity of the system. While this is a simple concept, it is not constant. Traffic demands vary signifi-cantly depending on the season of the year, the day of the week, and even the time of day. Also, the capacity, often mistaken as constant, can change because of weather, work zones, traffic inci-dents, or other non-recurring events.
Roadway congestion is one of the most pressing transportation issues facing most parts of Lagos today (WSDT, 2006). During the past 20 years, traffic congestion has increased substantially in the state’s urban areas, where the larger part of Lagosians live today, congestion in the form of delay exists for several hours each day in the large part of the metropolis.
Until now, public transport in Lagos metropolis have been largely dominated by para-transit and intermediate mode with absence of formal public transport technologies such as light rail transit, trams, underground metros, elevated rail transit, suburban rail, bus ways etc.
The Lagos metropolitan area of Nigeria is known to have the highest density of vehicles per square kilometer in Nigeria with 224 vehicles km2 compared to average of 15 per km2 in other states of the federation (Sun Newspaper, 2008). With the intervention of the World Bank granting the state a facility worth $US100 Million dollars to Lagos Metropolitan Area Authority (LAMATA) for institutional reform, road rehabilitation and bus operation improvement has commenced to revamp and modernize the public transportation in Lagos through the Lagos Ur-ban Transport Project (LUTPO). This has led to the establishment of an independent agency to plan, chart new direction for public transportation in Lagos state (World Bank, 2002).
Bus Rapid Transit (BRT) Resource Management is the process of identifying, quantifying and analyzing potential traffic deadlock threats to BRT resources and traffic control in Lagos state. It was observed later that instead of reducing traffic deadlock in Lagos as intended, BRT is now creating traffic problems of its own such as;
1. Increased Waiting Time: It was observed that BRT buses are waiting more than the ex-pected five (5) minutes at their shelters. This is as a result of buses already at the shelter picking up commuters. It cannot go on until all buses right in front of it have moved on. This delay could be up to twenty (20) minutes or more which is not acceptable at all in terms of time management for commuters.
2. Stranded Commuters: It was noted that at peak hours, there are always too many commut-ers than buses at the shelters, whereas there is no available bus to pick them up. Commuters could wait for 20 minutes or more before getting an available bus to pick them.
3. Improper Buses Distribution: At off-peak hours, BRT buses have been known to queue up at shelters where there are no commuters to pick up, whereas there are shelters where there are commuters but no bus. This is a gross waste and misuse of BRT Resources. BRT should be where needed and not constitute a nuisance where not needed.
Allocation of busses in Lagos metropolis usually follow a ‘strict’ pattern that can be likened to the hard system concepts (Checkland, 1999), however, this has failed to cub the problem which hitherto necessitated the introduction of BRT busses. In this study, description of traffic situations are captured in linguistic form and these were fuzzified to arrive at better solution. We analyzed these problems and proffered workable solutions to them via the soft computing method. The rest of this work is as follows: Section II presents the related literatures. In Section III, we present the model design, while section IV presents the model simulation and results discussion. We con-clude the work in section V, and give our future work direction.
Onifade, Oladejo, & Oyedeji
319
Related Literature There is no gainsaying in the fact that transportation is the pivot around which the wheel of every modern economy revolves. The role of transportation is as vital as the blood circulatory system to the human body. The efficiency with which people, goods and services can move from one point to the other largely determines the quality of life of the society.
The complex urban transportation problems in developing countries are triggered by certain trends with all of them being interrelated. Urban population growth is one of such trend (Oshin, 1988). For example, in 1995, approximately 45 percent of the world population lived in urban areas and by the year 2025, this figure is projected to go up to 60 percent. A staggering 90 per-cent" of this growth will occur in the world's developing countries, primarily in Africa and Asia.
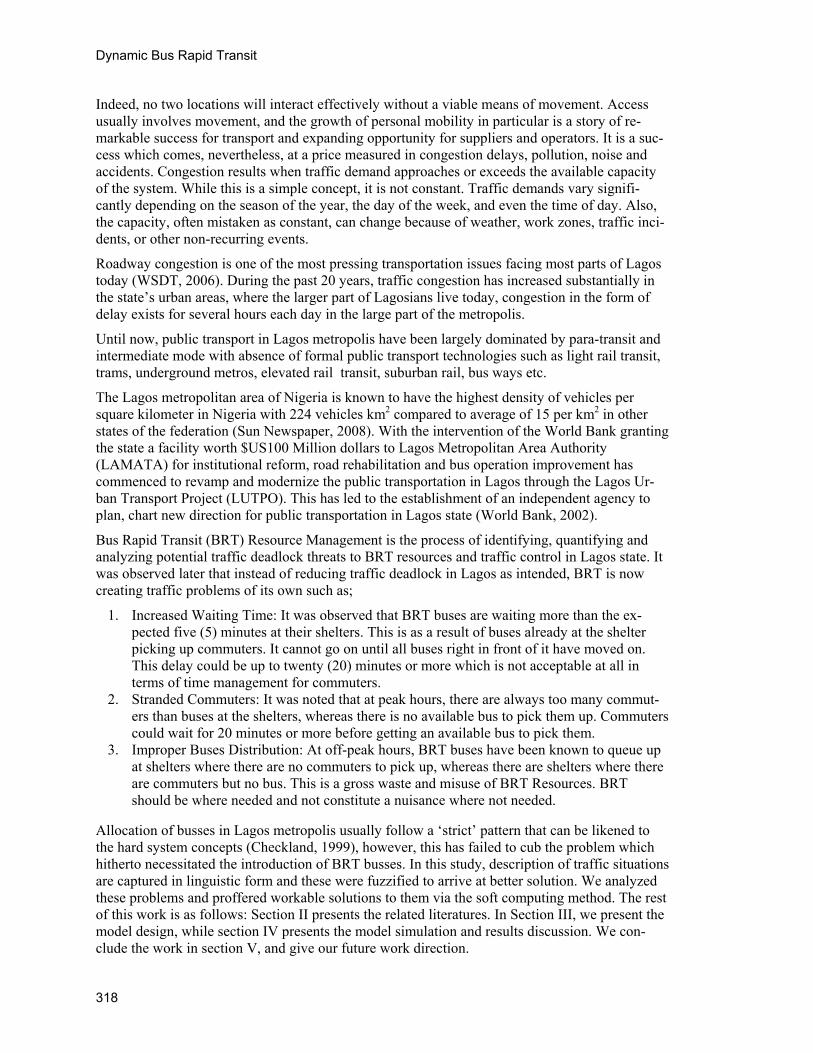
The environmental and social impacts of these trends are significant "because they are directly related to quality of life and urban productivity." These impacts include congestion, energy con-sumption, air pollution, and traffic crashes. It is noted that "congestion is perhaps the most visible manifestation of the failures in urban transportation planning," and its costs are significant.
Figure 1: Peak-Period Congestion (Travel Time Index) Trends by U.S. Population Group
(Banister, 2005)
Cities exist because they promote social interactions and economic transactions. Traffic conges-tion occurs where lots of people pursue these ends simultaneously in limited spaces. Culturally and economically vibrant cities have the worst congestion problems, while declining and de-pressed cities don’t have much traffic.
By some estimates, New York and Los Angeles are America’s most congested cities (Downs, 1992). But if you want access to major brokerage houses or live theater, you will find them easier to reach in congested New York than in any other metropolitan area.
Dynamic Bus Rapid Transit
320
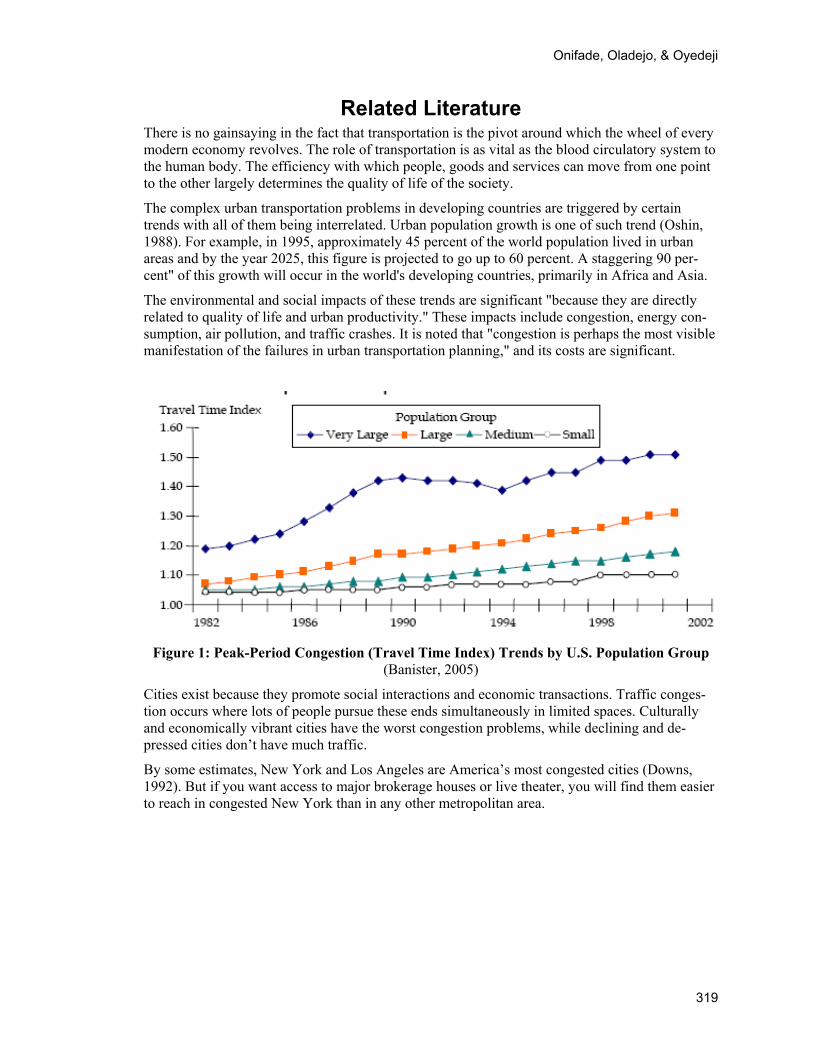
Figure 2: National Trend: Growth in Travel Delay 1982 to 2003 (Hidalgo, 2003)
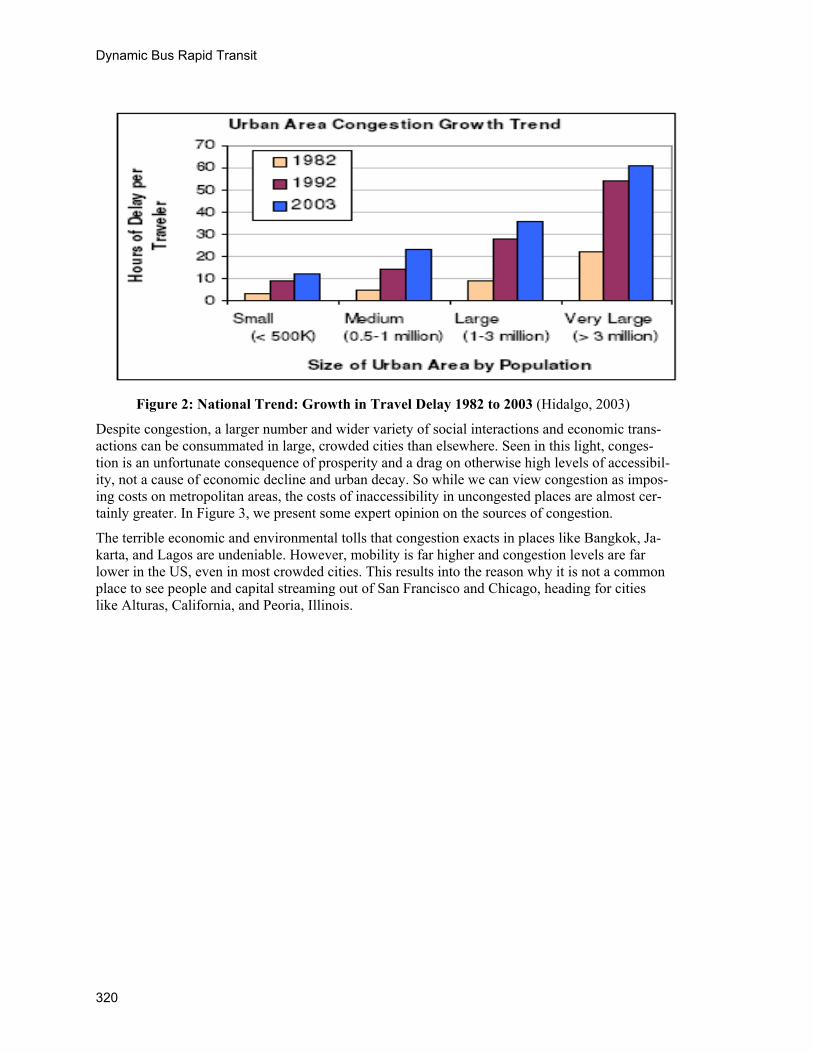
Despite congestion, a larger number and wider variety of social interactions and economic trans-actions can be consummated in large, crowded cities than elsewhere. Seen in this light, conges-tion is an unfortunate consequence of prosperity and a drag on otherwise high levels of accessibil-ity, not a cause of economic decline and urban decay. So while we can view congestion as impos-ing costs on metropolitan areas, the costs of inaccessibility in uncongested places are almost cer-tainly greater. In Figure 3, we present some expert opinion on the sources of congestion.
The terrible economic and environmental tolls that congestion exacts in places like Bangkok, Ja-karta, and Lagos are undeniable. However, mobility is far higher and congestion levels are far lower in the US, even in most crowded cities. This results into the reason why it is not a common place to see people and capital streaming out of San Francisco and Chicago, heading for cities like Alturas, California, and Peoria, Illinois.
Onifade, Oladejo, & Oyedeji
321
Figure 3: The Sources of Congestion (TTI, 2007)
Indeed studies have been carried out in public transportation in developed countries urban centres (Dueker & Bianco, 1999; Muller, 1995; Texas Transportation Institute (TTI), 2007); similarly in a developing country like Nigeria these studies have propounded innovative and dynamic strate-gies towards combating the multifarious urban mobility problems and challenges confronting the urban public transport sub sector in both the developed and the developing countries and in par-ticular Nigeria’s urban public transport subsector (Adeniji, 1985, 1987; Ogunkoya, 2003; Ona-komaiya, 1979).
In recent years, transportation agencies have embraced strategies that deal with the operation of existing highways, transit systems, and freight services, rather than just building new infrastruc-ture, Collectively referred to as Intelligent Transportation Systems (ITS), real-time control of transportation. This study therefore is aimed at proposing a solution to which the city could be able to operate existing capacity more efficiently
Although the impact of BRT on passengers’ mobility in Asia, China, Curitiba, Bogota and other developed cities is extant in literature (Pai & Hildago, 2009). However, since the commencement of Lagos BRT operation in March 2008, research studies on the impact on the mobility of pas-sengers pattern is lacking in literature. It is therefore, deeming fit to fill this research gap and con-tribute to literature on the impact of bus rapid transit on passengers’ movements in developed, developing countries and Lagos.
Research Design The research first attempt is to model the core participants in this study i.e. (manager, officer, driver, commuters). This model abstracts the essential details of the underlying problem from its usually complicated real world. Figure 4 depicts a sample effort of this with the aid of collabora-tion diagram to depict the relationship, interaction and possible functionality of each of the identi-fied design.
Dynamic Bus Rapid Transit
322
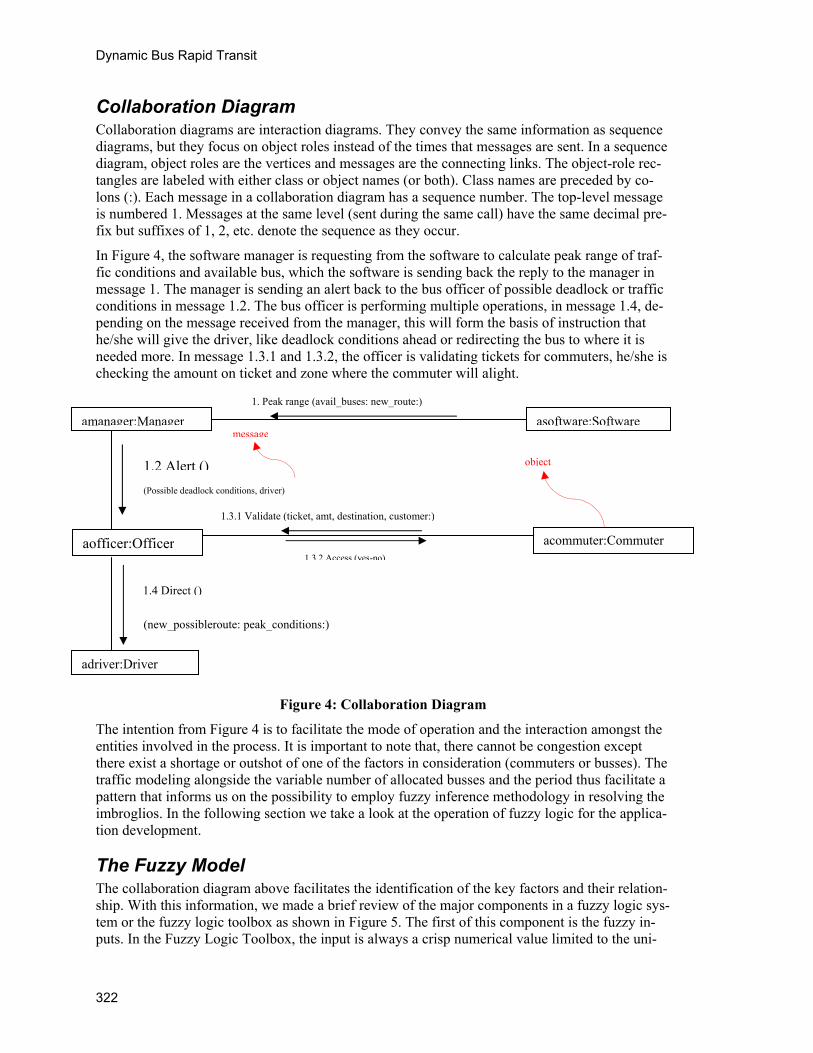
Collaboration Diagram Collaboration diagrams are interaction diagrams. They convey the same information as sequence diagrams, but they focus on object roles instead of the times that messages are sent. In a sequence diagram, object roles are the vertices and messages are the connecting links. The object-role rec-tangles are labeled with either class or object names (or both). Class names are preceded by co-lons (:). Each message in a collaboration diagram has a sequence number. The top-level message is numbered 1. Messages at the same level (sent during the same call) have the same decimal pre-fix but suffixes of 1, 2, etc. denote the sequence as they occur.
In Figure 4, the software manager is requesting from the software to calculate peak range of traf-fic conditions and available bus, which the software is sending back the reply to the manager in message 1. The manager is sending an alert back to the bus officer of possible deadlock or traffic conditions in message 1.2. The bus officer is performing multiple operations, in message 1.4, de-pending on the message received from the manager, this will form the basis of instruction that he/she will give the driver, like deadlock conditions ahead or redirecting the bus to where it is needed more. In message 1.3.1 and 1.3.2, the officer is validating tickets for commuters, he/she is checking the amount on ticket and zone where the commuter will alight.
Figure 4: Collaboration Diagram
The intention from Figure 4 is to facilitate the mode of operation and the interaction amongst the entities involved in the process. It is important to note that, there cannot be congestion except there exist a shortage or outshot of one of the factors in consideration (commuters or busses). The traffic modeling alongside the variable number of allocated busses and the period thus facilitate a pattern that informs us on the possibility to employ fuzzy inference methodology in resolving the imbroglios. In the following section we take a look at the operation of fuzzy logic for the applica-tion development.
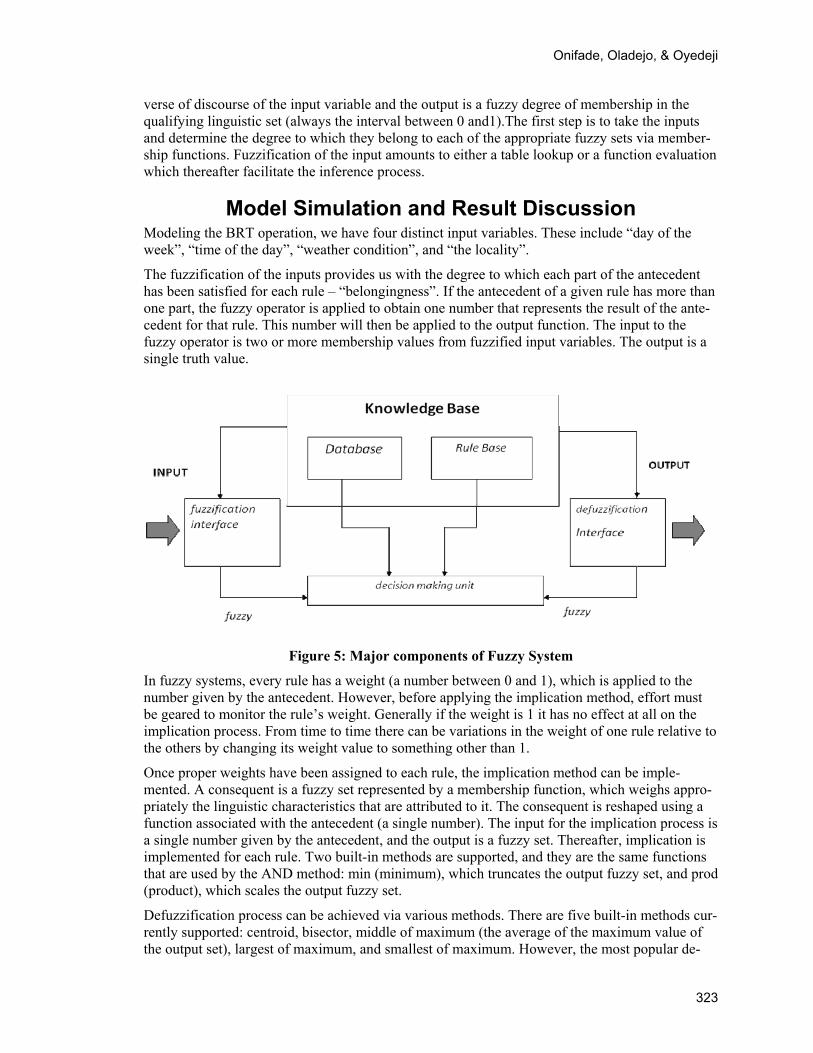
The Fuzzy Model The collaboration diagram above facilitates the identification of the key factors and their relation-ship. With this information, we made a brief review of the major components in a fuzzy logic sys-tem or the fuzzy logic toolbox as shown in Figure 5. The first of this component is the fuzzy in-puts. In the Fuzzy Logic Toolbox, the input is always a crisp numerical value limited to the uni-
1. Peak range (avail_buses: new_route:)
object
message
1.3.1 Validate (ticket, amt, destination, customer:)
1.3.2 Access (yes-no)
1.2 Alert ()
1.4 Direct ()
(new_possibleroute: peak_conditions:)
(Possible deadlock conditions, driver)
amanager:Manager asoftware:Software
aofficer:Officer acommuter:Commuter
adriver:Driver
Onifade, Oladejo, & Oyedeji
323
verse of discourse of the input variable and the output is a fuzzy degree of membership in the qualifying linguistic set (always the interval between 0 and1).The first step is to take the inputs and determine the degree to which they belong to each of the appropriate fuzzy sets via member-ship functions. Fuzzification of the input amounts to either a table lookup or a function evaluation which thereafter facilitate the inference process.
Model Simulation and Result Discussion Modeling the BRT operation, we have four distinct input variables. These include “day of the week”, “time of the day”, “weather condition”, and “the locality”.
The fuzzification of the inputs provides us with the degree to which each part of the antecedent has been satisfied for each rule – “belongingness”. If the antecedent of a given rule has more than one part, the fuzzy operator is applied to obtain one number that represents the result of the ante-cedent for that rule. This number will then be applied to the output function. The input to the fuzzy operator is two or more membership values from fuzzified input variables. The output is a single truth value.
Figure 5: Major components of Fuzzy System
In fuzzy systems, every rule has a weight (a number between 0 and 1), which is applied to the number given by the antecedent. However, before applying the implication method, effort must be geared to monitor the rule’s weight. Generally if the weight is 1 it has no effect at all on the implication process. From time to time there can be variations in the weight of one rule relative to the others by changing its weight value to something other than 1.
Once proper weights have been assigned to each rule, the implication method can be imple-mented. A consequent is a fuzzy set represented by a membership function, which weighs appro-priately the linguistic characteristics that are attributed to it. The consequent is reshaped using a function associated with the antecedent (a single number). The input for the implication process is a single number given by the antecedent, and the output is a fuzzy set. Thereafter, implication is implemented for each rule. Two built-in methods are supported, and they are the same functions that are used by the AND method: min (minimum), which truncates the output fuzzy set, and prod (product), which scales the output fuzzy set.
Defuzzification process can be achieved via various methods. There are five built-in methods cur-rently supported: centroid, bisector, middle of maximum (the average of the maximum value of the output set), largest of maximum, and smallest of maximum. However, the most popular de-
Dynamic Bus Rapid Transit
324
fuzzification method is the centroid function calculation, which returns the center of area under the curve (Abraham & Nath, 2000).
Again, as shown in Figure 5, decision making is made possible via the combinatorial effect of the database and the rule base that both constitute the knowledge base. This is sequel to the fact that decisions are based on the testing of all of the rules in an FIS, the rules must be combined in the best manner in order to make a decision. Aggregation is thus the process by which the fuzzy sets that represent the outputs of each rule are combined into a single fuzzy set. Aggregation only oc-curs once for each output variable, just prior to the fifth and final step, i.e. defuzzification.
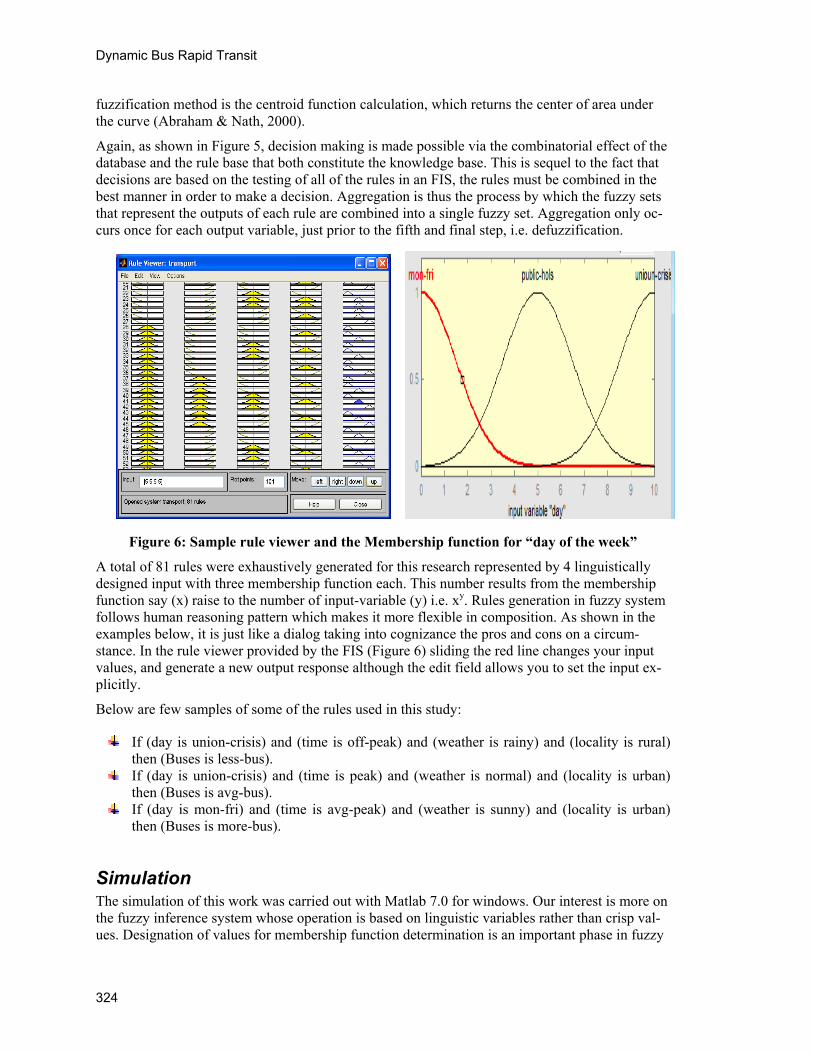
Figure 6: Sample rule viewer and the Membership function for “day of the week”
A total of 81 rules were exhaustively generated for this research represented by 4 linguistically designed input with three membership function each. This number results from the membership function say (x) raise to the number of input-variable (y) i.e. xy. Rules generation in fuzzy system follows human reasoning pattern which makes it more flexible in composition. As shown in the examples below, it is just like a dialog taking into cognizance the pros and cons on a circum-stance. In the rule viewer provided by the FIS (Figure 6) sliding the red line changes your input values, and generate a new output response although the edit field allows you to set the input ex-plicitly.
Below are few samples of some of the rules used in this study:
If (day is union-crisis) and (time is off-peak) and (weather is rainy) and (locality is rural) then (Buses is less-bus).
If (day is union-crisis) and (time is peak) and (weather is normal) and (locality is urban) then (Buses is avg-bus).
If (day is mon-fri) and (time is avg-peak) and (weather is sunny) and (locality is urban) then (Buses is more-bus).
Simulation The simulation of this work was carried out with Matlab 7.0 for windows. Our interest is more on the fuzzy inference system whose operation is based on linguistic variables rather than crisp val-ues. Designation of values for membership function determination is an important phase in fuzzy
Onifade, Oladejo, & Oyedeji
325
system designs. With the membership function, each variable can be allocated a level of belong-ingness to the world of discuss thereby facilitating a robust mean of association with other vari-ables and their membership function. In Figure 6, we present a sample of membership function for the input variable ‘day of the week’. While it should noted that partitioning the space for membership generation is not limited by any factor, the important thing is to ensure a properly represented partitioning. In other to make the system and representational, we employ three membership functions for each of the input variable and taking together in the process of defuzzi-fication, the effect of each of them can be viewed and manipulated via the rule viewer (left side of fFgure 6).
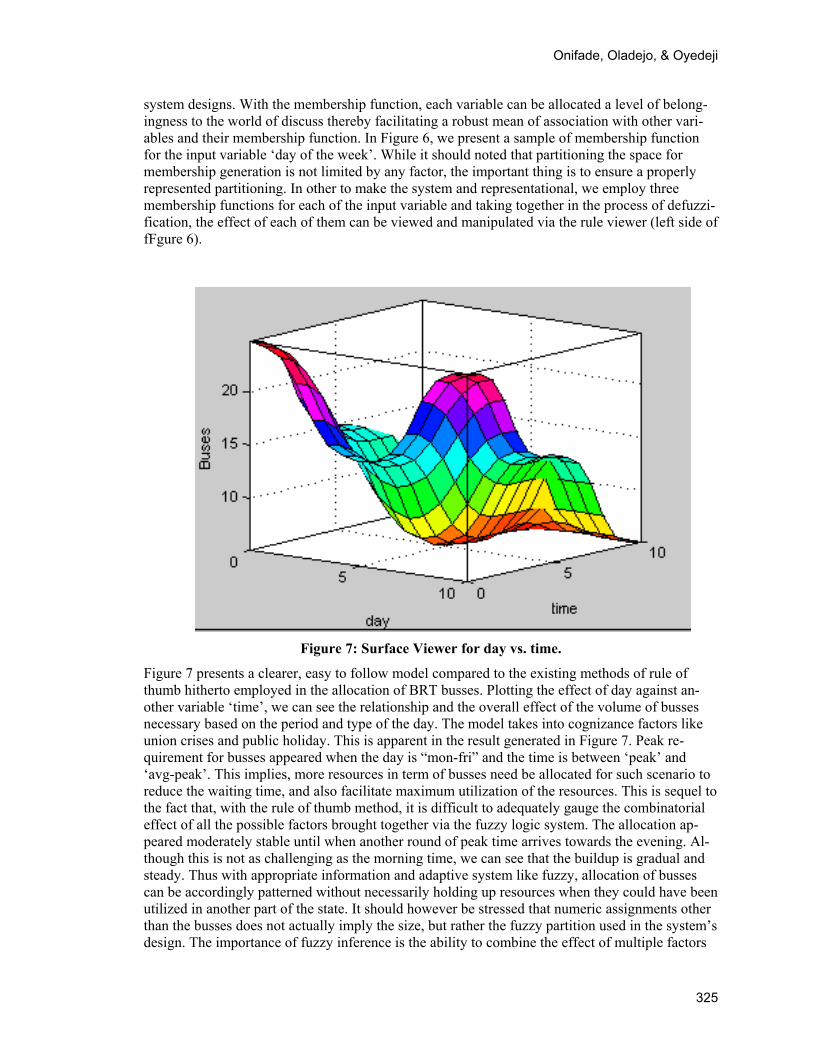
Figure 7: Surface Viewer for day vs. time.
Figure 7 presents a clearer, easy to follow model compared to the existing methods of rule of thumb hitherto employed in the allocation of BRT busses. Plotting the effect of day against an-other variable ‘time’, we can see the relationship and the overall effect of the volume of busses necessary based on the period and type of the day. The model takes into cognizance factors like union crises and public holiday. This is apparent in the result generated in Figure 7. Peak re-quirement for busses appeared when the day is “mon-fri” and the time is between ‘peak’ and ‘avg-peak’. This implies, more resources in term of busses need be allocated for such scenario to reduce the waiting time, and also facilitate maximum utilization of the resources. This is sequel to the fact that, with the rule of thumb method, it is difficult to adequately gauge the combinatorial effect of all the possible factors brought together via the fuzzy logic system. The allocation ap-peared moderately stable until when another round of peak time arrives towards the evening. Al-though this is not as challenging as the morning time, we can see that the buildup is gradual and steady. Thus with appropriate information and adaptive system like fuzzy, allocation of busses can be accordingly patterned without necessarily holding up resources when they could have been utilized in another part of the state. It should however be stressed that numeric assignments other than the busses does not actually imply the size, but rather the fuzzy partition used in the system’s design. The importance of fuzzy inference is the ability to combine the effect of multiple factors
Dynamic Bus Rapid Transit
326
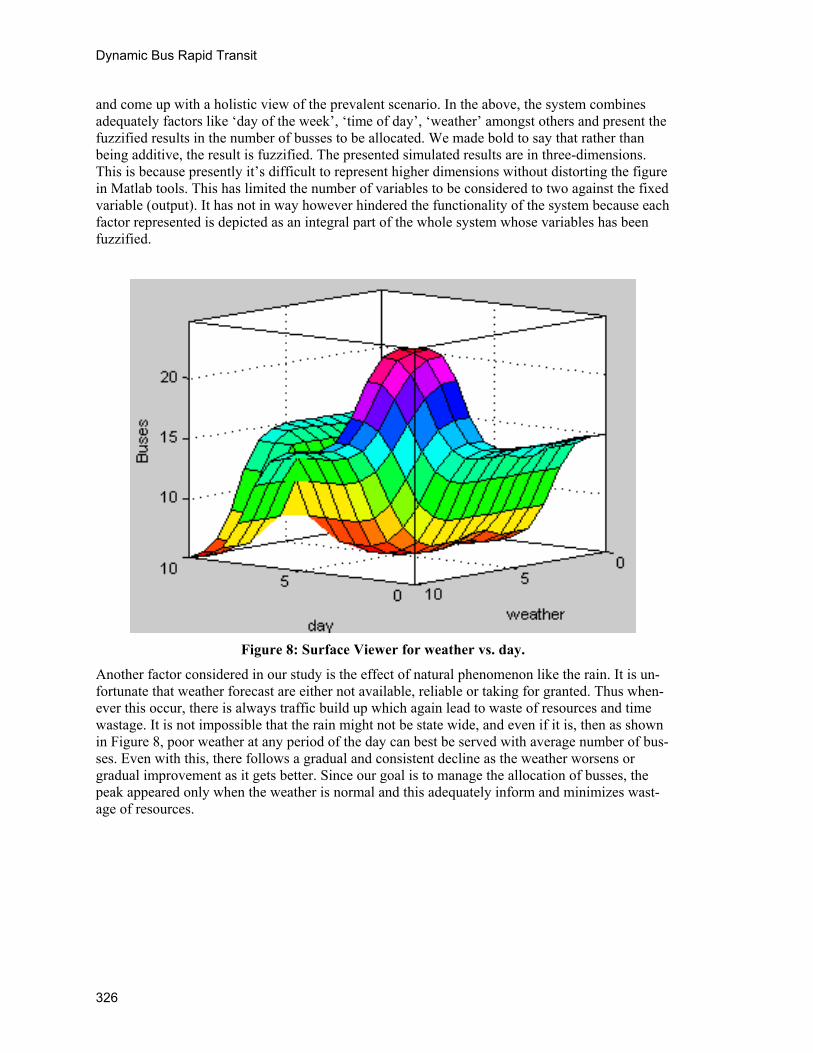
and come up with a holistic view of the prevalent scenario. In the above, the system combines adequately factors like ‘day of the week’, ‘time of day’, ‘weather’ amongst others and present the fuzzified results in the number of busses to be allocated. We made bold to say that rather than being additive, the result is fuzzified. The presented simulated results are in three-dimensions. This is because presently it’s difficult to represent higher dimensions without distorting the figure in Matlab tools. This has limited the number of variables to be considered to two against the fixed variable (output). It has not in way however hindered the functionality of the system because each factor represented is depicted as an integral part of the whole system whose variables has been fuzzified.
Figure 8: Surface Viewer for weather vs. day.
Another factor considered in our study is the effect of natural phenomenon like the rain. It is un-fortunate that weather forecast are either not available, reliable or taking for granted. Thus when-ever this occur, there is always traffic build up which again lead to waste of resources and time wastage. It is not impossible that the rain might not be state wide, and even if it is, then as shown in Figure 8, poor weather at any period of the day can best be served with average number of bus-ses. Even with this, there follows a gradual and consistent decline as the weather worsens or gradual improvement as it gets better. Since our goal is to manage the allocation of busses, the peak appeared only when the weather is normal and this adequately inform and minimizes wast-age of resources.
Onifade, Oladejo, & Oyedeji
327
Figure 9: Surface Viewer for locality vs. day.
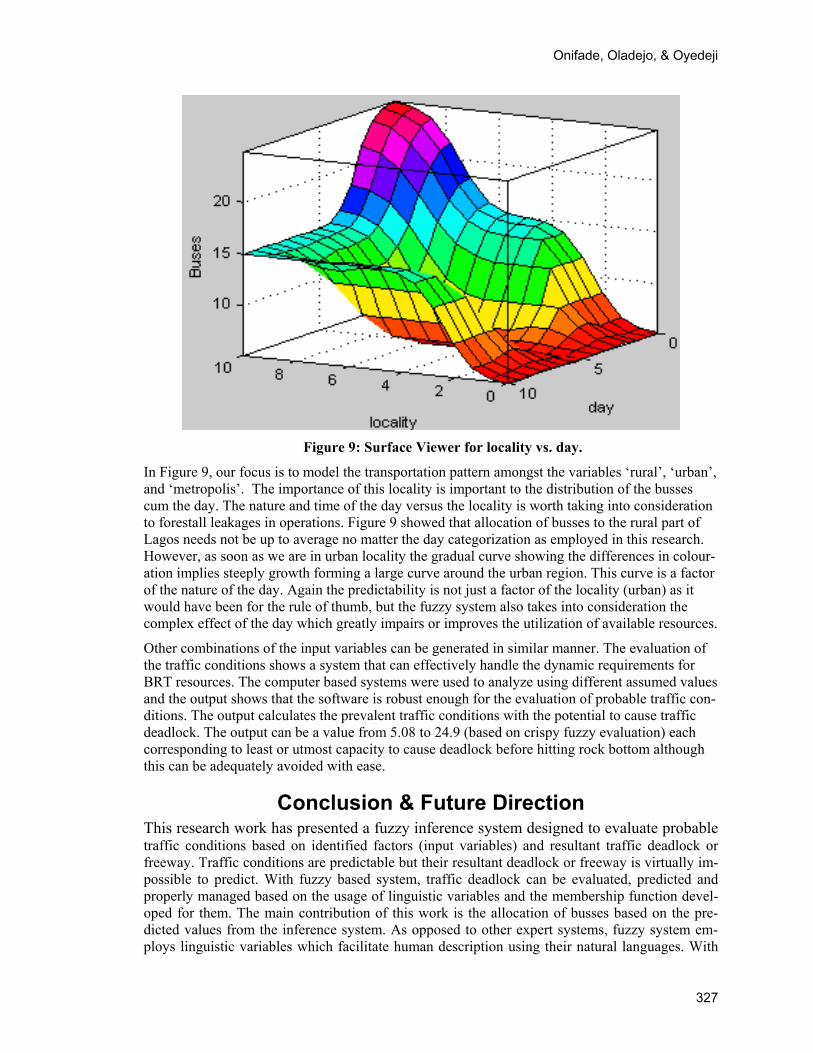
In Figure 9, our focus is to model the transportation pattern amongst the variables ‘rural’, ‘urban’, and ‘metropolis’. The importance of this locality is important to the distribution of the busses cum the day. The nature and time of the day versus the locality is worth taking into consideration to forestall leakages in operations. Figure 9 showed that allocation of busses to the rural part of Lagos needs not be up to average no matter the day categorization as employed in this research. However, as soon as we are in urban locality the gradual curve showing the differences in colour-ation implies steeply growth forming a large curve around the urban region. This curve is a factor of the nature of the day. Again the predictability is not just a factor of the locality (urban) as it would have been for the rule of thumb, but the fuzzy system also takes into consideration the complex effect of the day which greatly impairs or improves the utilization of available resources.
Other combinations of the input variables can be generated in similar manner. The evaluation of the traffic conditions shows a system that can effectively handle the dynamic requirements for BRT resources. The computer based systems were used to analyze using different assumed values and the output shows that the software is robust enough for the evaluation of probable traffic con-ditions. The output calculates the prevalent traffic conditions with the potential to cause traffic deadlock. The output can be a value from 5.08 to 24.9 (based on crispy fuzzy evaluation) each corresponding to least or utmost capacity to cause deadlock before hitting rock bottom although this can be adequately avoided with ease.
Conclusion & Future Direction This research work has presented a fuzzy inference system designed to evaluate probable traffic conditions based on identified factors (input variables) and resultant traffic deadlock or freeway. Traffic conditions are predictable but their resultant deadlock or freeway is virtually im-possible to predict. With fuzzy based system, traffic deadlock can be evaluated, predicted and properly managed based on the usage of linguistic variables and the membership function devel-oped for them. The main contribution of this work is the allocation of busses based on the pre-dicted values from the inference system. As opposed to other expert systems, fuzzy system em-ploys linguistic variables which facilitate human description using their natural languages. With
Dynamic Bus Rapid Transit
328
this development, the volume of traffic only need by inputted in natural language term and not precise values. The results are entrusting and promising based on the flexibility and ease of adaptability. In the future, we hope to inculcate provision for short mail service (SMS) to send in text into the system which can be utilized automatically, thereby reducing the human factors inherent in traffic resolution problems.
References Abraham, A. & Nath, B. (2000). Hybrid intelligent systems (HIS): A review of a decade of research. Re-
trieved from www.citeseer.ist.psu.ed/523093.html.
Downs, A. (1992). Stuck in traffic: Coping with peak-hour traffic congestion. Washington, D.C.: The Brookings Institution.
Ardila-Gomez, A. (2004). Transit planning in Bogota and Curitiba; Roles in interaction, risk and change. Ph.D thesis in Urban and transportation planning at the Massachusetts Institute of Technology (MIT). Boston: MIT. Retrieved from www.dspace.mit.edu/handle/1721.12879
Banister, D. (2005). Unsustainable transport city transport in the new century (1st ed.). Taylor and Francis. ISBN: 0415857829,978041537821.
Checkland, P. (1999). System thinking, system practice – A 30 years retrospective (pp. A13-A23). John Willey & Sons.
Falola, T., & Olanrewaju, S.A. (Eds.). (1986). Transport systems in Nigeria. Syracuse, NY: Maxwell School of Citizenship and Public Affairs, Syracuse University.
Hidalgo, D. (2003a). The backbone of the mobility strategy of Bogota: TransMileno. Public Transport Int., 51, 28-30. Retrieved from www.itdp.org/documents/part(RGARI)%2020007%2009.pdf
Hidalgo, D. (2003b). TransMileno: A high capacity-low cost bus rapid transit system developed for Bo-gota, Colombia. Presented at the 55th World Congress of the International Public Transport Union (UITP). 4th-9th, May, Madrid, Spain. www.eprintd.ucl.ac.uk/110/1/Wright_and_Montezuma,_Walk21_V,_Copenhagen,_Jun_2004.pd
Kenworthy, J. R., & Newman, P. (1999). Sustainability and cities. Washington, DC: Island Press. ISBN: 1559636602.9781559636605.
Litman, T. (2002). Evaluating transportation land-uses impacts. Victoria Transport Policy Institute. Re-trieved from http://www.vtpi.org/landuse.pdf
Ogunkoya, A.O. (2003). The impact of the use of mobile telephone on trip pattern of urban residents of Lagos metropolis. Unpublished M.Sc. Thesis Olabisi Onabanjo University, Ago-Iwoye, Ogun-State, Nigeria.
Onifade, O. F. W., Aderounmu, G. A., & Tayo, O. (2008). Sustaining negotiated QoS in connection admis-sion control for ATM networks using fuzzy logic techniques. Journal of Issues in Informing Science & Information Technology, 5, 645 – 655.
Oshin, S. (1988). Transport studies in Nigeria: A review. In Odu: A journal of West African Studies (pp. 219-225).
Oyedeji, T. J. (2009). BRT resource management modeling using fuzzy logic paradigm. Unpublished un-dergraduate project
Rodriguez, D., & Targa, F. (2004). The value of accessibility to Bogota’s Bus Rapid Transit system. Trans-port Rev., 24(5), 587-610.
Sodiya, A. S., Onashoga, S. A., & Oladunjoye, B. A. (2007). Threat modeling using fuzzy logic paradigm. Issues in Informing Science and Information Technology, 4, 53-61.
The MathWorks, Inc. (1995 – 2002). Fuzzy logic tool box user’s guide.
Onifade, Oladejo, & Oyedeji
329
SUN Newspaper. (2008, March 17) Retrieved from http://www.sunnewsonline.com/default.htm
Thomas, E. (2001). Bus rapid transit. Presentation at the Institute of Transport Engineers. Annual Meeting Chicago, August, 19-22.
Vuchic, V.R. (2007). Urban transit systems and technology (1st ed.). New Jersey: John Wiley and Sons. ISBN: 047175823X, 9780471758235.
Washington State Department of Transportation. (2006). Congestion relief analysis.
Wright, L. (2003). Bus rapid transit. In GTZ (Deutsche Gesellschaft fur Technische Zusammenarbeit). Sus-tainable transport: A sourcebook for policy-makers in developing cities. Eschborn: GTZ. www.eprints.ucl.ac.uk/108/1/Lloyd_Wright,_Bonn,_Germany,_Transport_and_climate_change.pdf
Zadeh, L. A. (1996). Fuzzy logic= Computing with words (CW). IEEE Transactions on Fuzzy Systems, 4(2), 103-111.
Zadeh, L. (1991). Fuzzy logic and the calculus of fuzzy if-then rules. OMRON Technics, 31(4), 316-320.
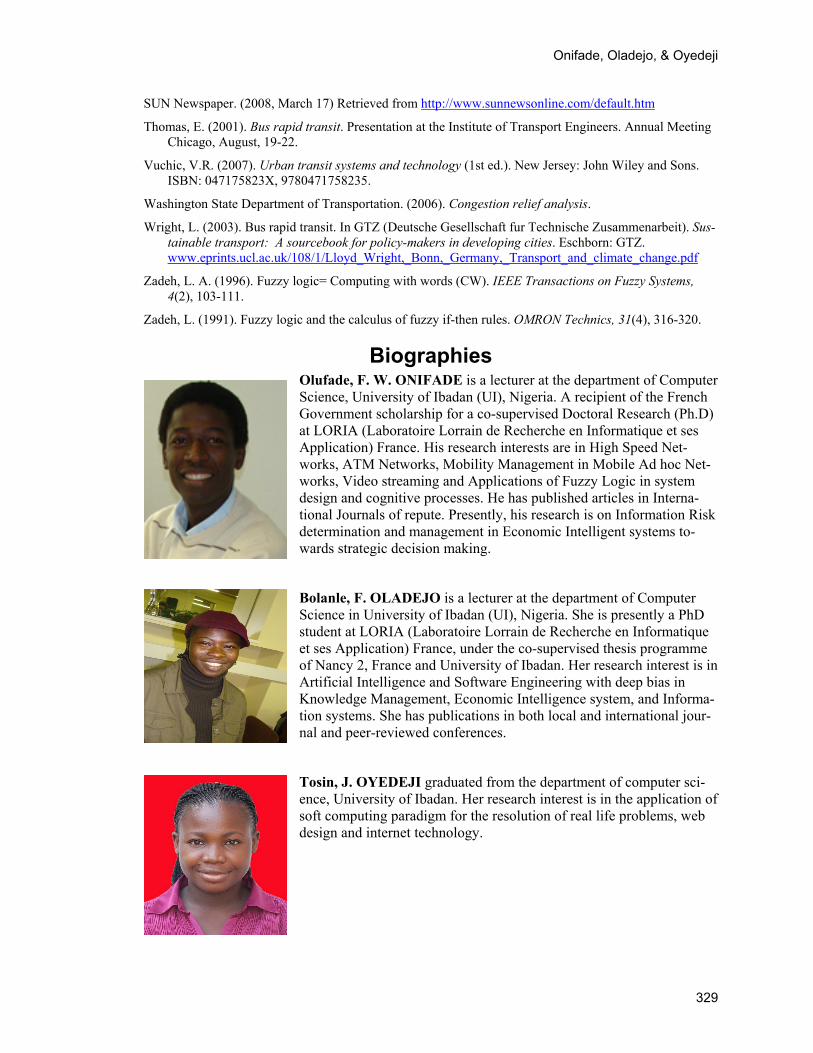
Biographies Olufade, F. W. ONIFADE is a lecturer at the department of Computer Science, University of Ibadan (UI), Nigeria. A recipient of the French Government scholarship for a co-supervised Doctoral Research (Ph.D) at LORIA (Laboratoire Lorrain de Recherche en Informatique et ses Application) France. His research interests are in High Speed Net-works, ATM Networks, Mobility Management in Mobile Ad hoc Net-works, Video streaming and Applications of Fuzzy Logic in system design and cognitive processes. He has published articles in Interna-tional Journals of repute. Presently, his research is on Information Risk determination and management in Economic Intelligent systems to-wards strategic decision making.
Bolanle, F. OLADEJO is a lecturer at the department of Computer Science in University of Ibadan (UI), Nigeria. She is presently a PhD student at LORIA (Laboratoire Lorrain de Recherche en Informatique et ses Application) France, under the co-supervised thesis programme of Nancy 2, France and University of Ibadan. Her research interest is in Artificial Intelligence and Software Engineering with deep bias in Knowledge Management, Economic Intelligence system, and Informa-tion systems. She has publications in both local and international jour-nal and peer-reviewed conferences.
Tosin, J. OYEDEJI graduated from the department of computer sci-ence, University of Ibadan. Her research interest is in the application of soft computing paradigm for the resolution of real life problems, web design and internet technology.