Embed Size (px)
Citation preview

Pär Tranvik, Göran AlpstenDynamic Behaviour under Wind Loading of a 90 m Steel Chimney
Dynamic Behaviour under Wind Loadingof a 90 m Steel Chimney
Pär Tranvik Alstom Power Sweden AB, VäxjöGöran Alpsten Stålbyggnadskontroll AB, Solna
Alstom Power Sweden AB Report S-01041Stålbyggnadskontroll AB Report 9647-3March 2002
Pär Tranvik, Göran AlpstenDynamic Behaviour under Wind Loading of a 90 m Steel Chimney
i.1
Contents
Preface............................................................................................................................................ i.4
Abstract.......................................................................................................................................... i.5
Introduction..................................................................................................................................... 11.1 Scope of investigation .................................................................................................. 11.2 Action of slender structures under wind loading........................................................ 2
1.2.1 General................................................................................................................. 21.2.2 Vortex shedding.................................................................................................. 2
1.3 Symbols and units......................................................................................................... 5
Description of the VEAB chimney............................................................................................... 72.1 VEAB Sandvik II plant................................................................................................. 72.2 Data for structure of the VEAB chimney .................................................................... 9
2.2.1 General data......................................................................................................... 92.2.2 Structural details ............................................................................................... 112.2.3 Manufacturing characteristics .......................................................................... 18
2.3 Mechanical damper..................................................................................................... 192.3.1 Common damping designs............................................................................... 192.3.2 Tuned pendulum damper of the VEAB chimney ........................................... 23
2.4 Dynamic properties of the VEAB chimney .............................................................. 262.4.1 Natural frequencies........................................................................................... 262.4.2 Vortex shedding................................................................................................ 282.4.3 Elastic energy .................................................................................................... 30
2.5 Time history of the VEAB chimney.......................................................................... 32
3. Observed and recorded behaviour of the VEAB chimney...........................................333.1 Observations of mal-functioning of the chimney ..................................................... 33
3.1.1 Observations of large oscillations.................................................................... 333.1.2 Initial observations of cracks and causes ........................................................ 343.1.3 Detailed examination of cracks........................................................................ 343.1.4 Summary of cracks ........................................................................................... 363.1.5 Notches not available for examination............................................................ 363.1.6 Repair of the damaged welds ........................................................................... 36
3.2 Data recording system ................................................................................................ 373.2.1 General............................................................................................................... 373.2.2 Strain gauges ..................................................................................................... 373.2.3 Wind data transmitter ....................................................................................... 383.2.4 Recording computer ......................................................................................... 413.2.5 Calculation of top deflection range.................................................................. 453.2.6 Verification of the equipment.......................................................................... 453.2.7 Procedures......................................................................................................... 463.2.8 Operating experience........................................................................................ 46
Pär Tranvik, Göran AlpstenDynamic Behaviour under Wind Loading of a 90 m Steel Chimney
i.2
3.3 Behaviour of the mechanical damper ........................................................................ 473.3.1 Observation of behaviour of chimney with and without damper .................. 473.3.2 Theoretical study of chimney behaviour with and without damper.............. 603.3.3 Comparison between observations and theoretical study .............................. 74
3.4 Recorded dynamic properties of the chimney........................................................... 753.5 Observed wind properties........................................................................................... 80
3.5.1 Wind pressure and top deflection range, anthill diagrams............................. 803.5.2 Accumulated wind pressure and accumulated top deflection range.............. 83
diagrams3.5.3 Elastic energy diagrams.................................................................................... 873.5.4 Anthill diagrams for wind pressure at Växjö A station.................................. 893.5.5 Deflection and wind velocity anthill diagrams ............................................... 913.5.6 Wind turbulence anthill diagrams .................................................................... 933.5.7 Load spectra ...................................................................................................... 953.5.8 Frequency of wind velocity............................................................................ 1003.5.9 Iso wind velocity plots.................................................................................... 102
3.6 Recordings of top deflection from deducted strain gage measurements............... 1063.7 First and second mode oscillations .......................................................................... 112
3.7.1 Screen plots ..................................................................................................... 1123.7.2 Logged files..................................................................................................... 1133.7.3 First mode evaluation ..................................................................................... 1143.7.4 Second mode evaluation................................................................................. 1163.7.5 Discussion ....................................................................................................... 117
3.8 Temperature and temperature dependent properties............................................... 1183.8.1 Mean temperatures ......................................................................................... 1183.8.2 Density and kinematic viscosity .................................................................... 1203.8.3 Discussion ....................................................................................................... 121
4. Fatigue action ....................................................................................................................1234.1 Fatigue model considered......................................................................................... 1234.2 Estimated cumulative damage for period with mal-functioning damper .............. 1264.3 Cumulative damage for period with functioning damper ...................................... 129
4.3.1 First mode of natural frequency ..................................................................... 1294.3.2 Influence of second mode of natural frequency............................................ 131
5. Crack propagation............................................................................................................1335.1 Method of analysis ................................................................................................... 1335.2 Results ....................................................................................................................... 133
6. Discussion...........................................................................................................................1356.1 The reliability of buildings with mechanical movable devices.............................. 1356.2 Comparable chimney data........................................................................................ 1366.3 Codes ......................................................................................................................... 139
6.3.1 General............................................................................................................. 1396.3.2 Comparison between some codes and behaviour the VEAB chimney ....... 140
6.4 Comparison of spectra from literature data and the VEAB chimney.................... 1456.5 Second mode............................................................................................................. 1466.6 The future .................................................................................................................. 146
Pär Tranvik, Göran AlpstenDynamic Behaviour under Wind Loading of a 90 m Steel Chimney
i.3
7. Summary ............................................................................................................................1497.1 In English................................................................................................................... 1497.2 In Swedish ................................................................................................................. 150
8. References ..........................................................................................................................151
Appendices with recorded and calculated data (Not included in this printing butenclosed in the covered CD):
Appendix A VEAB brochure for the cogeneration block at Växjö..................................... A.1
Appendix B Description of recording system for the VEAB chimney(in Swedish)........................................................................................................B.1
Appendix C Behaviour of mechanical damper – Observations from the damping test......C.1
Appendix D Screen plots for first and second order oscillations ........................................ D.1
Appendix E Cumulative fatigue damage...............................................................................E.1
Appendix F Wind pressure and deflection range diagrams .................................................F.1
Appendix G Recorded temperatures ..................................................................................... G.1
Appendix H Computer programs for data reduction............................................................ H.1
Appendix I Recorded dynamic behaviour of the chimney................................................... I.1
Appendix J Detailed examination of cracks .........................................................................J.1
Appendix K Finite element analysis of hot spots in chimney structure.............................. K.1
Appendix L Simplified crack propagation analysis ..............................................................L.1
Pär Tranvik, Göran AlpstenDynamic Behaviour under Wind Loading of a 90 m Steel Chimney
i.4
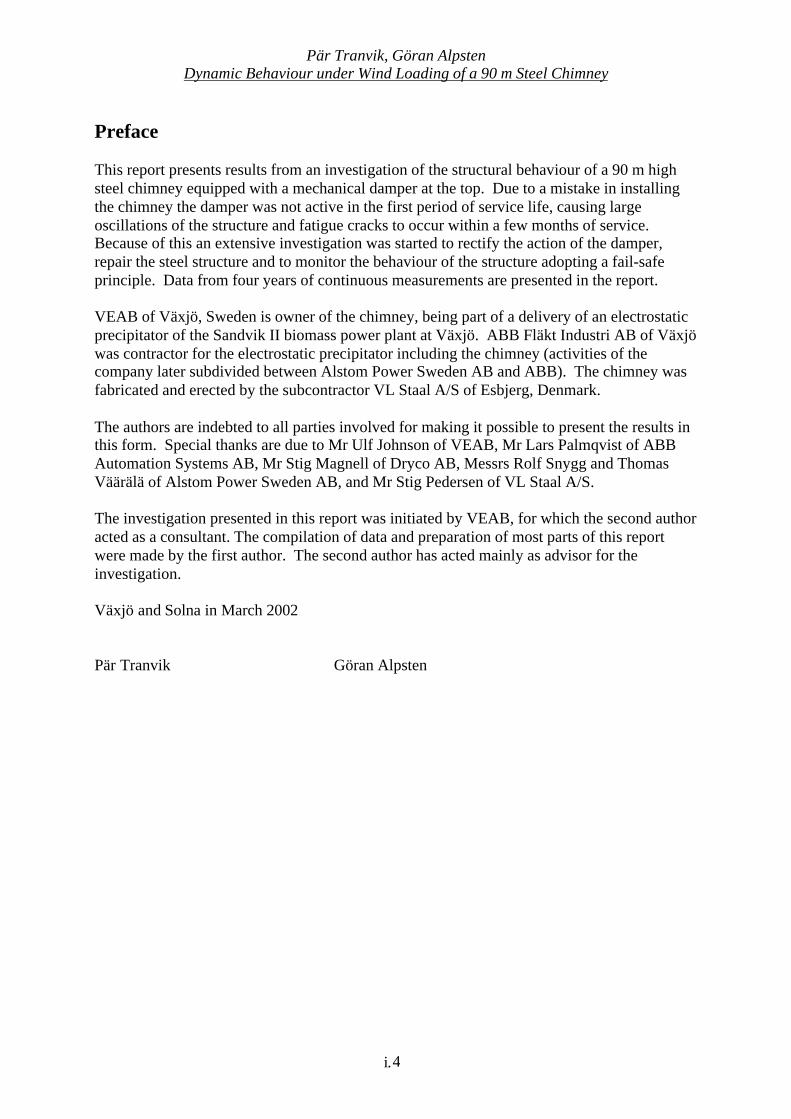
Preface
This report presents results from an investigation of the structural behaviour of a 90 m highsteel chimney equipped with a mechanical damper at the top. Due to a mistake in installingthe chimney the damper was not active in the first period of service life, causing largeoscillations of the structure and fatigue cracks to occur within a few months of service.Because of this an extensive investigation was started to rectify the action of the damper,repair the steel structure and to monitor the behaviour of the structure adopting a fail-safeprinciple. Data from four years of continuous measurements are presented in the report.
VEAB of Växjö, Sweden is owner of the chimney, being part of a delivery of an electrostaticprecipitator of the Sandvik II biomass power plant at Växjö. ABB Fläkt Industri AB of Växjöwas contractor for the electrostatic precipitator including the chimney (activities of thecompany later subdivided between Alstom Power Sweden AB and ABB). The chimney wasfabricated and erected by the subcontractor VL Staal A/S of Esbjerg, Denmark.
The authors are indebted to all parties involved for making it possible to present the results inthis form. Special thanks are due to Mr Ulf Johnson of VEAB, Mr Lars Palmqvist of ABBAutomation Systems AB, Mr Stig Magnell of Dryco AB, Messrs Rolf Snygg and ThomasVäärälä of Alstom Power Sweden AB, and Mr Stig Pedersen of VL Staal A/S.
The investigation presented in this report was initiated by VEAB, for which the second authoracted as a consultant. The compilation of data and preparation of most parts of this reportwere made by the first author. The second author has acted mainly as advisor for theinvestigation.
Växjö and Solna in March 2002
Pär Tranvik Göran Alpsten
Pär Tranvik, Göran AlpstenDynamic Behaviour under Wind Loading of a 90 m Steel Chimney
i.5
Abstract
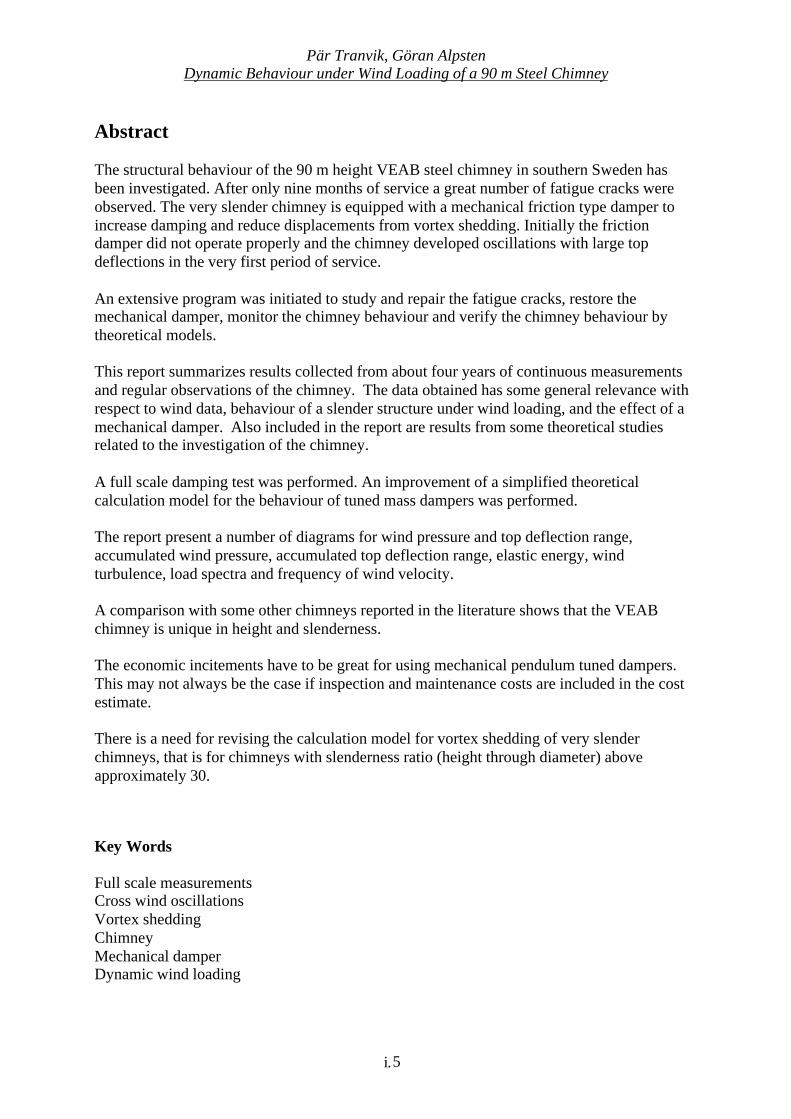
The structural behaviour of the 90 m height VEAB steel chimney in southern Sweden hasbeen investigated. After only nine months of service a great number of fatigue cracks wereobserved. The very slender chimney is equipped with a mechanical friction type damper toincrease damping and reduce displacements from vortex shedding. Initially the frictiondamper did not operate properly and the chimney developed oscillations with large topdeflections in the very first period of service.
An extensive program was initiated to study and repair the fatigue cracks, restore themechanical damper, monitor the chimney behaviour and verify the chimney behaviour bytheoretical models.
This report summarizes results collected from about four years of continuous measurementsand regular observations of the chimney. The data obtained has some general relevance withrespect to wind data, behaviour of a slender structure under wind loading, and the effect of amechanical damper. Also included in the report are results from some theoretical studiesrelated to the investigation of the chimney.
A full scale damping test was performed. An improvement of a simplified theoreticalcalculation model for the behaviour of tuned mass dampers was performed.
The report present a number of diagrams for wind pressure and top deflection range,accumulated wind pressure, accumulated top deflection range, elastic energy, windturbulence, load spectra and frequency of wind velocity.
A comparison with some other chimneys reported in the literature shows that the VEABchimney is unique in height and slenderness.
The economic incitements have to be great for using mechanical pendulum tuned dampers.This may not always be the case if inspection and maintenance costs are included in the costestimate.
There is a need for revising the calculation model for vortex shedding of very slenderchimneys, that is for chimneys with slenderness ratio (height through diameter) aboveapproximately 30.
Key Words
Full scale measurementsCross wind oscillationsVortex sheddingChimneyMechanical damperDynamic wind loading

Pär Tranvik, Göran AlpstenDynamic Behaviour under Wind Loading of a 90 m Steel Chimney
i.6
Pär Tranvik, Göran AlpstenDynamic Behaviour under Wind Loading of a 90 m Steel Chimney - Section 1
1
1. Introduction
1.1 Scope of investigation
This report presents results from an investigation of the structural behaviour of a 90 m highsteel chimney erected at Växjö in southern Sweden in 1995. The chimney is equipped with amechanical friction-type damper at the top.
Due to a mistake during erection and installation of the chimney the transport fixings of thedamper were not released properly and the chimney developed extensive oscillations in thevery first period of service. This caused a great number of fatigue cracks to occur within afew months of service.
After the functioning of the damper had been restored and the fatigue cracks repaired anextensive program was initiated in 1996 to monitor the structural behaviour of the chimneyunder wind loading. This included continuous measurement of stresses in the structure inorder to record the stress history and thus monitor the risk for fatigue of the repaired structure.Visual inspection and magnetic particle evaluation have been performed at regular intervals,determined from a fail-safe principle.
This report summarises results collected from about four years of continuous measurementsand regular observations of the chimney. The data obtained has some general relevance withrespect to wind data, behaviour of a slender structure under wind loading, and the effect of amechanical damper. Also included in the report are results from some theoretical studiesrelated to the investigation of the chimney.
In addition to presenting results of general interest and discussions in the main part of thereport, original data and further compilations of detailed results are given in Appendices to thereport, in order to make possible further evaluation of the data for other investigators.
The observations and recordings from the VEAB chimney are unique because of thefollowing items:
- It is a high and slender steel chimney equipped with a tuned pendulum damper.
- The natural frequencies are low and therefore also the critical resonance windvelocity for vortex-induced oscillations is low.
- Large top amplitude deflections have been observed with the damper mistakenlyinactive.
- Vortex shedding oscillations were observed at both first and at rare occasionsalso at second mode of natural frequency.
- Field recordings have been made continuously during four years of service.Wind and temperature data and the response of the chimney to wind loadingwere recorded.
Pär Tranvik, Göran AlpstenDynamic Behaviour under Wind Loading of a 90 m Steel Chimney - Section 1
2
- A full-scale damping test was performed.
- A detailed examination of cracks was performed.
- Comparisons between theory and observations were made for naturalfrequencies, damping, dynamic behaviour, wind data, fatigue, cracks and finallythere are a discussion about the use of tuned dampers.
1.2 Action of slender structures under wind loading
1.2.1 General
For slender structures subjected to wind loading there are three main actions to consider, gustwind, vortex shedding and ring oscillation ovalling.
Gust winds displace the chimney in the same direction as the wind load. For a rigid structuregust wind is independent of the dynamic properties of the structure but dependent for aflexible structure.
Vortex shedding occurs when the natural frequency of a structure corresponds with vorticesshed from opposite sides of the structure resulting in cross gas flow oscillations. The vortexshedding will be discussed more in detail in Section 1.2.2, 2.4.2, 3.4, 3.5, 3.7 and 6.
Ring oscillations (ovalling) are a pulsating oval oscillation of for instance a cylindrical shellstructure.
1.2.2 Vortex shedding
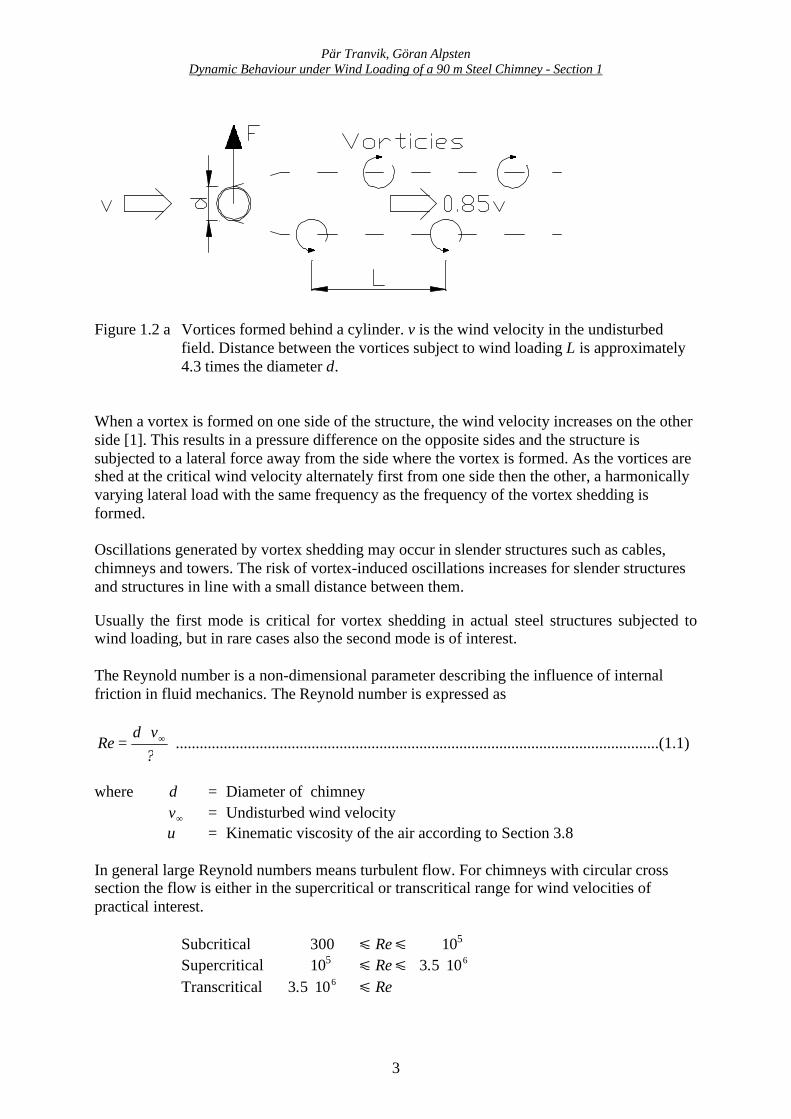
Vortex-induced oscillations occur when vortices are shed alternately from opposite sides of astructure. It gives rise to a fluctuating load perpendicular to the wind direction as shownschematically in Figure 1.2 a.
Pär Tranvik, Göran AlpstenDynamic Behaviour under Wind Loading of a 90 m Steel Chimney - Section 1
3
Figure 1.2 a Vortices formed behind a cylinder. v is the wind velocity in the undisturbedfield. Distance between the vortices subject to wind loading L is approximately4.3 times the diameter d.
When a vortex is formed on one side of the structure, the wind velocity increases on the otherside [1]. This results in a pressure difference on the opposite sides and the structure issubjected to a lateral force away from the side where the vortex is formed. As the vortices areshed at the critical wind velocity alternately first from one side then the other, a harmonicallyvarying lateral load with the same frequency as the frequency of the vortex shedding isformed.
Oscillations generated by vortex shedding may occur in slender structures such as cables,chimneys and towers. The risk of vortex-induced oscillations increases for slender structuresand structures in line with a small distance between them.
Usually the first mode is critical for vortex shedding in actual steel structures subjected towind loading, but in rare cases also the second mode is of interest.
The Reynold number is a non-dimensional parameter describing the influence of internalfriction in fluid mechanics. The Reynold number is expressed as
?vd
Re ∞⋅= .........................................................................................................................(1.1)
where d = Diameter of chimney
∞v = Undisturbed wind velocityυ = Kinematic viscosity of the air according to Section 3.8
In general large Reynold numbers means turbulent flow. For chimneys with circular crosssection the flow is either in the supercritical or transcritical range for wind velocities ofpractical interest.
Subcritical 300 õ Reõ 105
Supercritical 105 õ Reõ 6105.3 ⋅Transcritical 6105.3 ⋅ õ Re
Pär Tranvik, Göran AlpstenDynamic Behaviour under Wind Loading of a 90 m Steel Chimney - Section 1
4
Aero elasticity causes a regular vortex shedding also in the supercritical range.
For a non-vibrating chimney the distance L between vortices rotating in the same direction isproportional to the diameter of the chimney d. In slender structures, large oscillations mayoccur if the frequency of vortex shedding coincides with the natural frequency for thestructure vibrating in a mode in the crosswind direction [1]. The proportionality factor forvortex shedding is named Strouhal number.
The Strouhal number is expressed as
∞
⋅=
vfd
St 0 ............................................................................................................................(1.2)
where 0f = Natural frequency
The Strouhal number describes the dependence of the cross section, the surface roughness andthe wind turbulence [1]. It depends on the Reynold number for a stationary smooth cylinderand for an aeroelastic chimney. The Strouhal number depends on the motion of the structure(aero elasticity).
Characteristic properties for crosswind are:
- Net gust load caused by lateral wind fluctuations.
- Loads caused by vortex shedding. The load occurs whether or not the structure ismoving, but may be strongly dependent on the size of the motion [1], [6], [25]. Themotion could start to rule the vortex shedding. This part of the load is called net vortexshedding load [1].
- Motion-induced forces. Most important is the negative aerodynamic damping generatedby vortex shedding.
Vortex shedding structural oscillations are more probable if:
- Smooth laminar air flow which for instance occurs in the stable atmosphere during coldwinter days.
- Increased small-scale turbulence, for instance that occurring in the wake of a slender,nearby structure of similar size.
Bearing in mind the risk of violent vortex-induced oscillations, aerodynamic damping is ofprimary concern.

Pär Tranvik, Göran AlpstenDynamic Behaviour under Wind Loading of a 90 m Steel Chimney - Section 1
5
The Scruton number is a non-dimensional parameter defined as
2es2
dm
Sc⋅
⋅⋅=
ρδ
.....................................................................................................................(1.3)
where =sδ The logarithmic decrement of the structural damping=em Equivalent mass per unit of length according to the
mode considered=ρ Density of air
A comparison of the predicted amplitudes for steel chimneys with full-scale measurements isshown in [2]. Similar diagrams are found in [1].
1.3 Symbols and units
Symbols are explained in the text where they first occur. Unless otherwise noted basic SIunits has been used through out this report.

Pär Tranvik, Göran AlpstenDynamic Behaviour under Wind Loading of a 90 m Steel Chimney - Section 1
6
Pär Tranvik, Göran AlpstenDynamic Behaviour under Wind Loading of a 90 m Steel Chimney – Section 2.1
7
2. Description of the VEAB chimney
2.1 VEAB Sandvik II plant
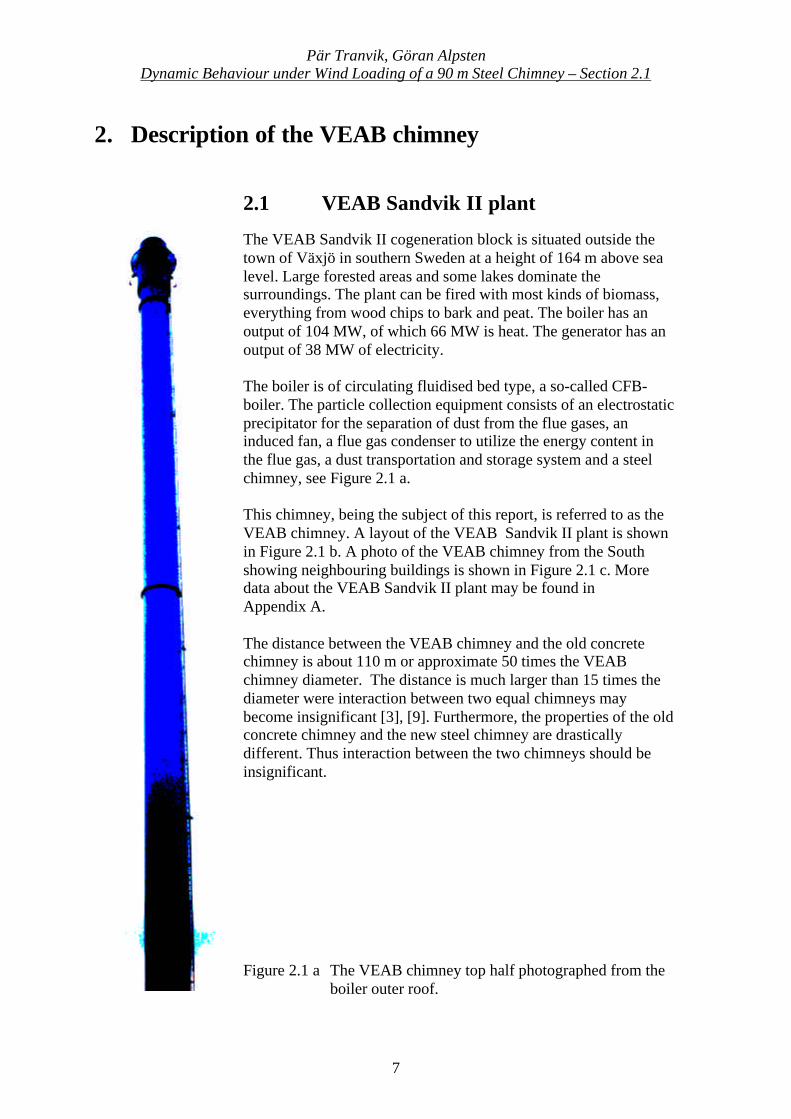
The VEAB Sandvik II cogeneration block is situated outside thetown of Växjö in southern Sweden at a height of 164 m above sealevel. Large forested areas and some lakes dominate thesurroundings. The plant can be fired with most kinds of biomass,everything from wood chips to bark and peat. The boiler has anoutput of 104 MW, of which 66 MW is heat. The generator has anoutput of 38 MW of electricity.
The boiler is of circulating fluidised bed type, a so-called CFB-boiler. The particle collection equipment consists of an electrostaticprecipitator for the separation of dust from the flue gases, aninduced fan, a flue gas condenser to utilize the energy content inthe flue gas, a dust transportation and storage system and a steelchimney, see Figure 2.1 a.
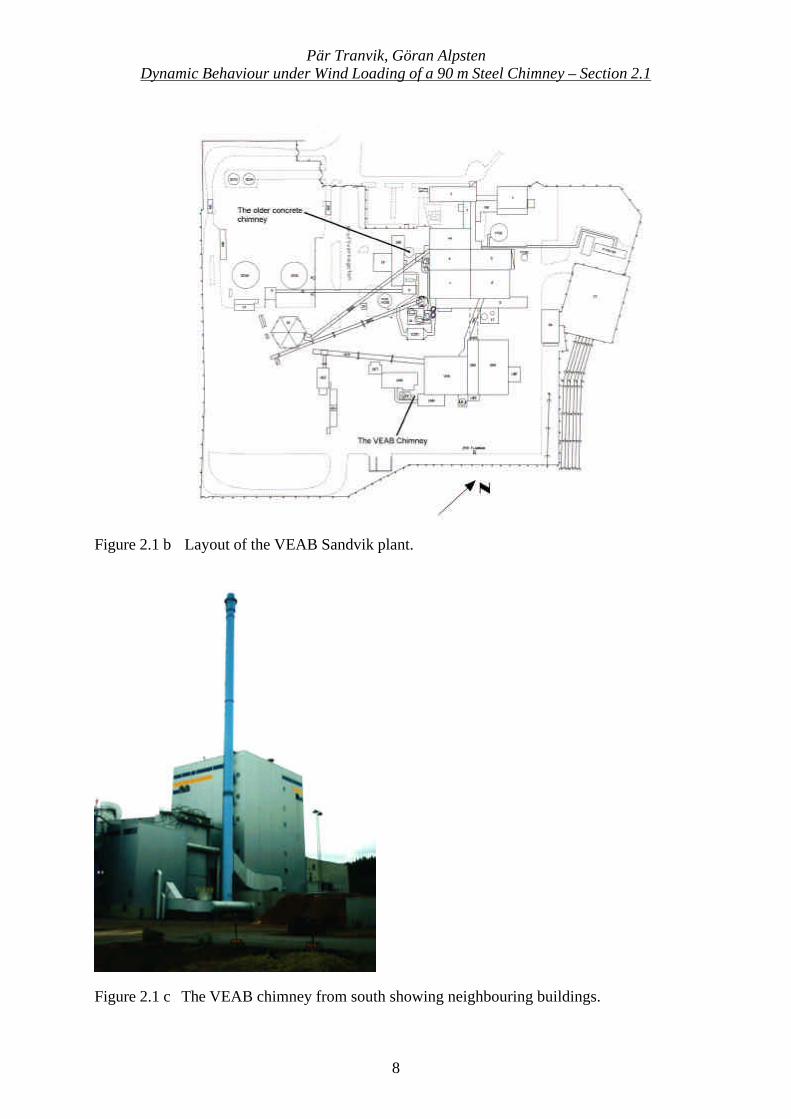
This chimney, being the subject of this report, is referred to as theVEAB chimney. A layout of the VEAB Sandvik II plant is shownin Figure 2.1 b. A photo of the VEAB chimney from the Southshowing neighbouring buildings is shown in Figure 2.1 c. Moredata about the VEAB Sandvik II plant may be found inAppendix A.
The distance between the VEAB chimney and the old concretechimney is about 110 m or approximate 50 times the VEABchimney diameter. The distance is much larger than 15 times thediameter were interaction between two equal chimneys maybecome insignificant [3], [9]. Furthermore, the properties of the oldconcrete chimney and the new steel chimney are drasticallydifferent. Thus interaction between the two chimneys should beinsignificant.
Figure 2.1 a The VEAB chimney top half photographed from the boiler outer roof.
Pär Tranvik, Göran AlpstenDynamic Behaviour under Wind Loading of a 90 m Steel Chimney – Section 2.1
8
Figure 2.1 b Layout of the VEAB Sandvik plant.
Figure 2.1 c The VEAB chimney from south showing neighbouring buildings.
Pär Tranvik, Göran AlpstenDynamic Behaviour under Wind Loading of a 90 m Steel Chimney – Section 2.2
9
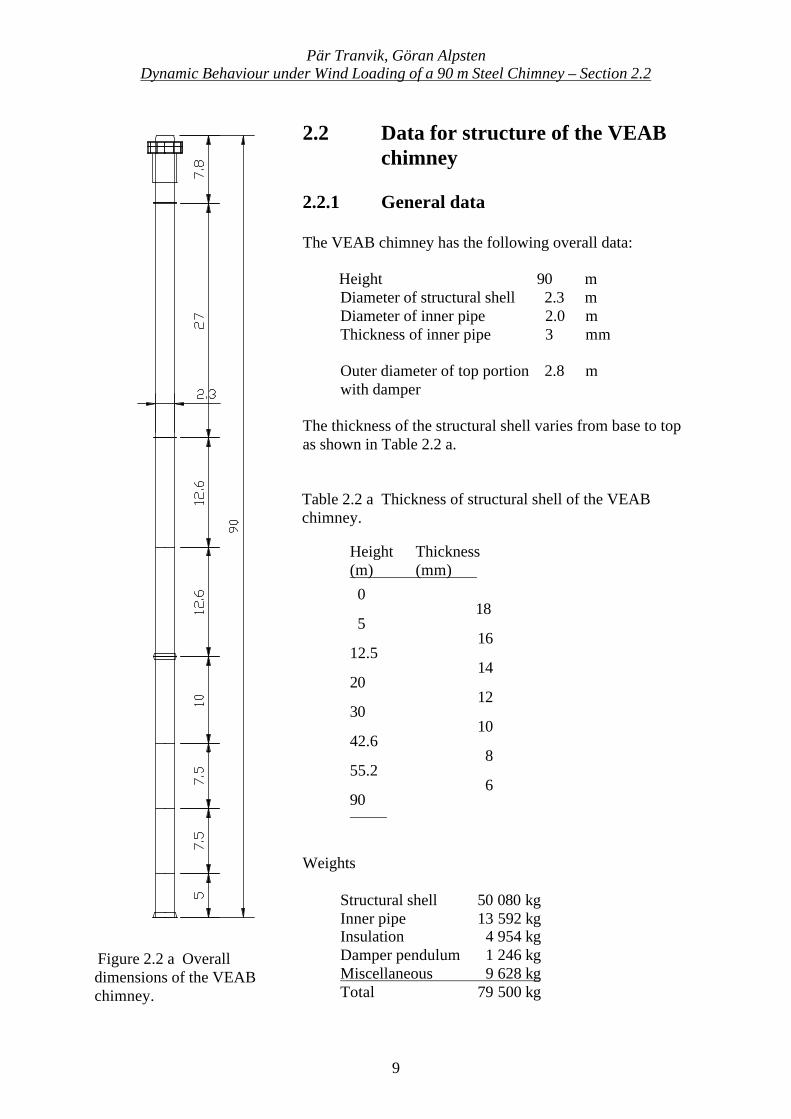
Figure 2.2 a Overalldimensions of the VEABchimney.
2.2 Data for structure of the VEABchimney
2.2.1 General data
The VEAB chimney has the following overall data:
Height 90 mDiameter of structural shell 2.3 mDiameter of inner pipe 2.0 mThickness of inner pipe 3 mm
Outer diameter of top portion 2.8 mwith damper
The thickness of the structural shell varies from base to topas shown in Table 2.2 a.
Table 2.2 a Thickness of structural shell of the VEABchimney.
Height Thickness(m) (mm)
0 18
516
12.514
2012
3010
42.6 8
55.2 6
90
Weights
Structural shell 50 080 kgInner pipe 13 592 kgInsulation 4 954 kgDamper pendulum 1 246 kgMiscellaneous 9 628 kgTotal 79 500 kg
Pär Tranvik, Göran AlpstenDynamic Behaviour under Wind Loading of a 90 m Steel Chimney – Section 2.2
10
Material
Structural parts Cor-ten, MPa355e =R , MPa000210=EInner pipe Steel SS2350Foundation bolts Steel S355J2G3 according to EN10025, MPa345e =RBolts at flanged splices 8.8, MPa800=mR
Corrosion protection
Sand blasting to Sa 2.52 x 60 µm alkyd primer
2 x 60 µm top coat
For transport and erection purposes flanged splices are arranged at levels 30 m, 55.2 m and82.2 m.
2 x 40 mm of thermal insulation of mineral wool are arranged between inner pipe and outershell.
Just below the top of the chimney a mechanical pendulum damper is arranged to decrease topdeflection caused by vortex shedding. The damper is described more in detail in Section 2.3.
Above the damper, at 88 m level, a platform is arranged.
From height 2.5 m level up to the platform at height 88 m level an outside ladder is arranged.The distance between ladder and chimney shell (equal to connection gusset plates width) is200 mm (see also Figure 2.2 m).
Three warning lights for aircrafts are connected to the outside plate shell of the damper unit.
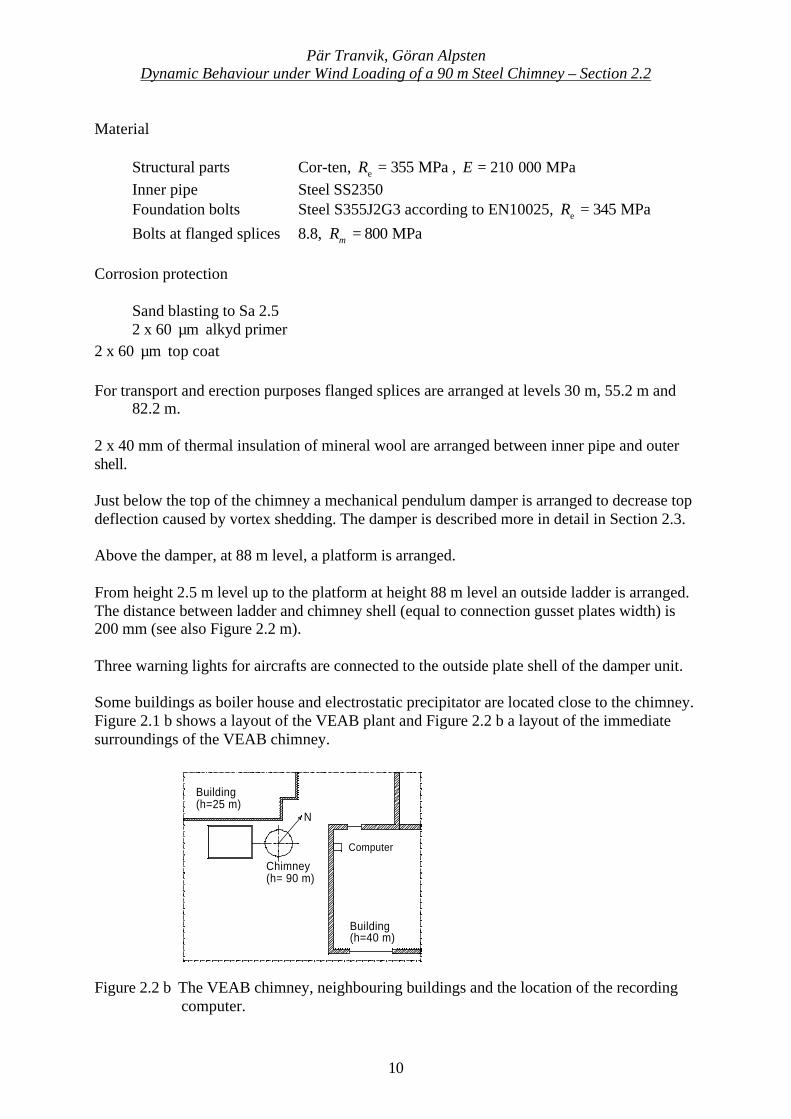
Some buildings as boiler house and electrostatic precipitator are located close to the chimney.Figure 2.1 b shows a layout of the VEAB plant and Figure 2.2 b a layout of the immediatesurroundings of the VEAB chimney.
Figure 2.2 b The VEAB chimney, neighbouring buildings and the location of the recordingcomputer.
Computer
N
Chimney(h= 90 m)
Building(h=25 m)
Building(h=40 m)

Pär Tranvik, Göran AlpstenDynamic Behaviour under Wind Loading of a 90 m Steel Chimney – Section 2.2
11
The slenderness ratio for a chimney may be defined as
dh
=λ ..................................................................................................................................(2.1)
where h = height of the chimneyd = diameter of the chimney
For the VEAB chimney 393.2
90==λ which is greater than 30, the approximate limit value
according to [3] for applicability of the code model for calculating vortex shedding forces.
2.2.2 Structural details
The base details consist of a bottom ring, 40 gusset plates at outside and 40 at inside. A totalof 80 foundation bolts M56 connect the VEAB chimney to the concrete foundation structure.See Figures 2.2 c and 2.2 d. Initially the design had no ring placed at the top of the gussetplates.
Figure 2.2 c Base plate with 2 x 40 foundation gusset plates and 2 x 40 bolt holes.
Pär Tranvik, Göran AlpstenDynamic Behaviour under Wind Loading of a 90 m Steel Chimney – Section 2.2
12
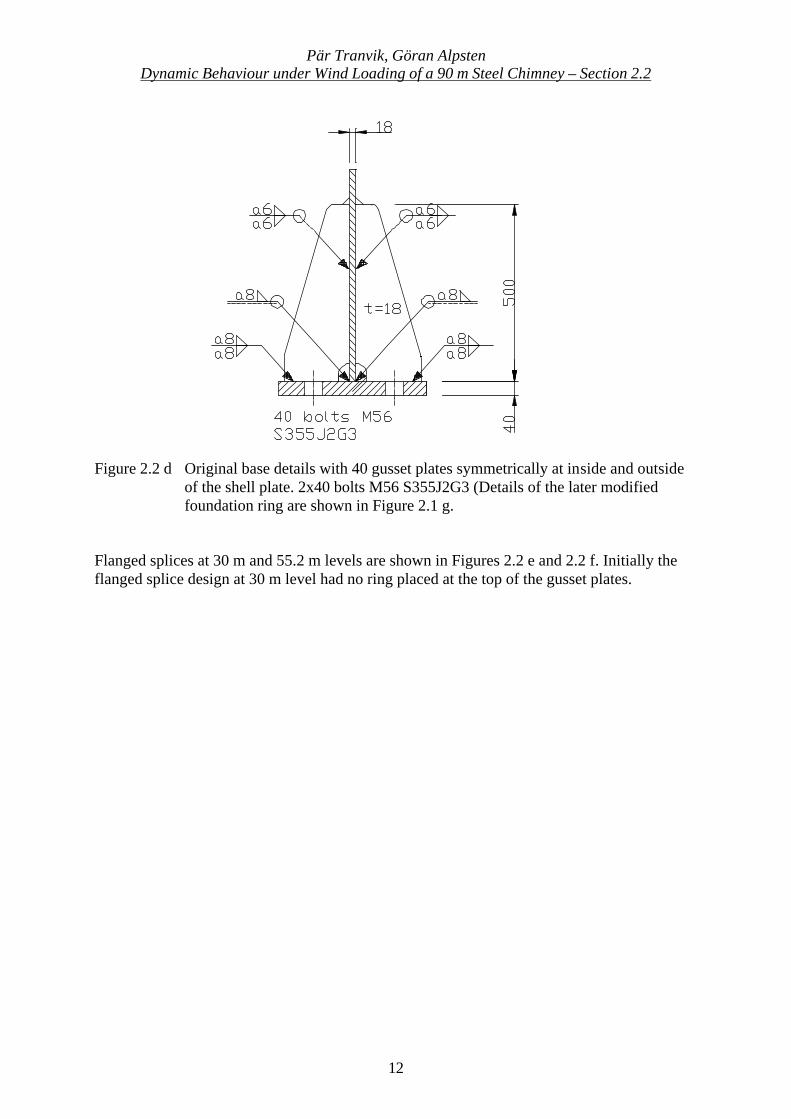
Figure 2.2 d Original base details with 40 gusset plates symmetrically at inside and outsideof the shell plate. 2x40 bolts M56 S355J2G3 (Details of the later modifiedfoundation ring are shown in Figure 2.1 g.
Flanged splices at 30 m and 55.2 m levels are shown in Figures 2.2 e and 2.2 f. Initially theflanged splice design at 30 m level had no ring placed at the top of the gusset plates.
Pär Tranvik, Göran AlpstenDynamic Behaviour under Wind Loading of a 90 m Steel Chimney – Section 2.2
13
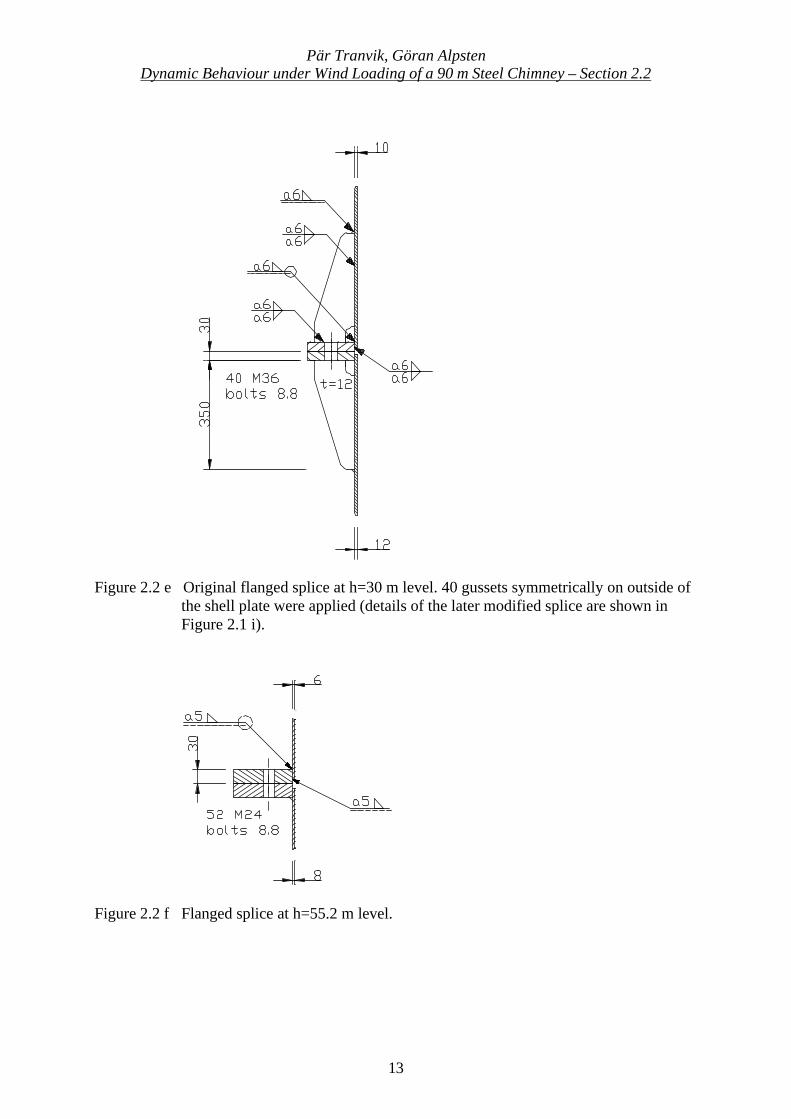
Figure 2.2 e Original flanged splice at h=30 m level. 40 gussets symmetrically on outside ofthe shell plate were applied (details of the later modified splice are shown inFigure 2.1 i).
Figure 2.2 f Flanged splice at h=55.2 m level.
Pär Tranvik, Göran AlpstenDynamic Behaviour under Wind Loading of a 90 m Steel Chimney – Section 2.2
14
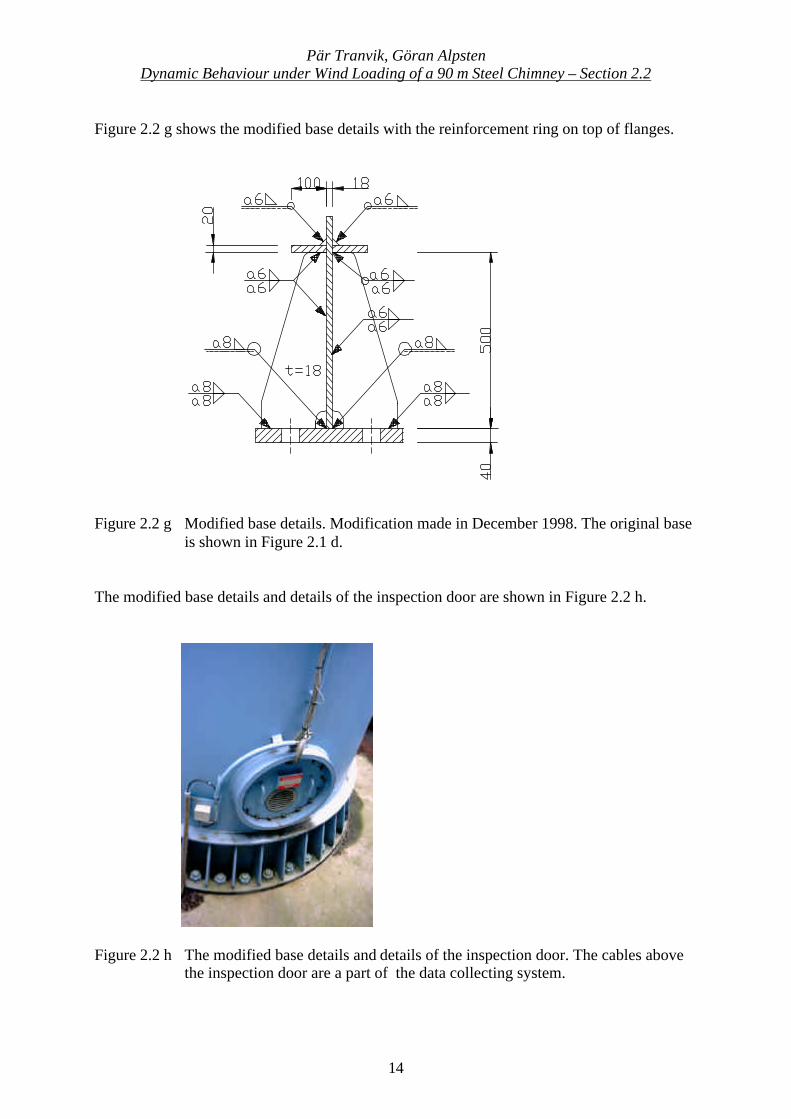
Figure 2.2 g shows the modified base details with the reinforcement ring on top of flanges.
Figure 2.2 g Modified base details. Modification made in December 1998. The original baseis shown in Figure 2.1 d.
The modified base details and details of the inspection door are shown in Figure 2.2 h.
Figure 2.2 h The modified base details and details of the inspection door. The cables abovethe inspection door are a part of the data collecting system.
Pär Tranvik, Göran AlpstenDynamic Behaviour under Wind Loading of a 90 m Steel Chimney – Section 2.2
15
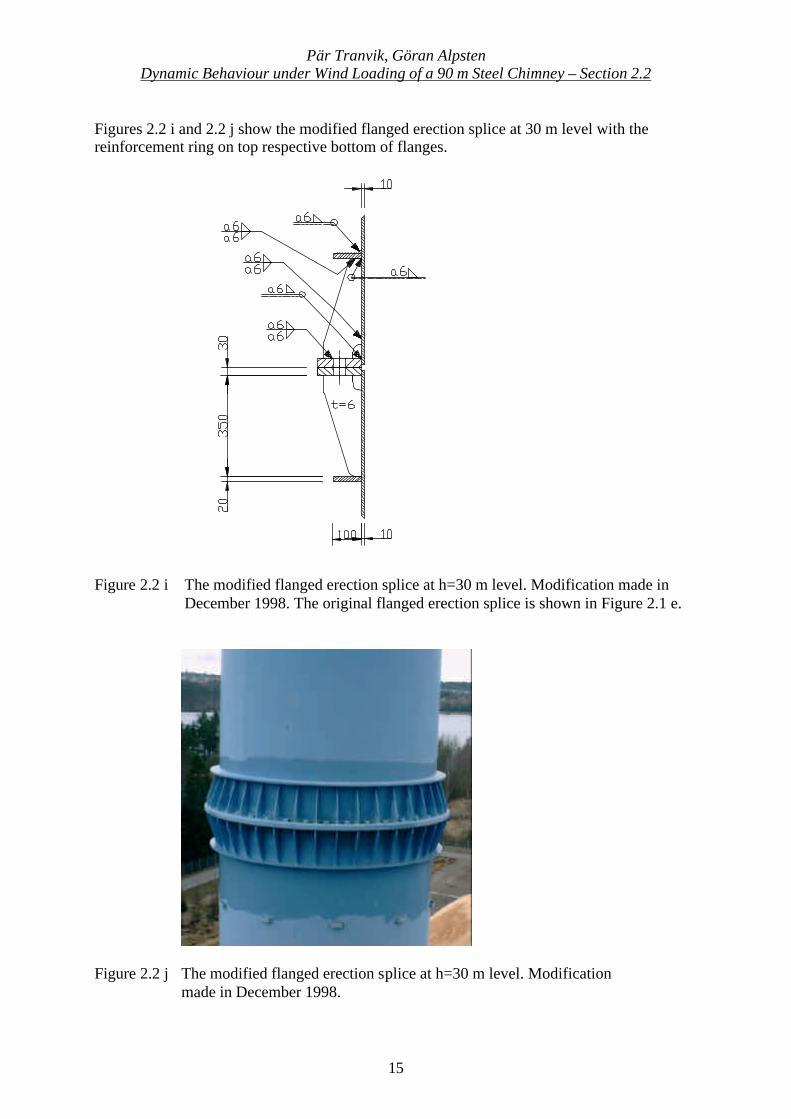
Figures 2.2 i and 2.2 j show the modified flanged erection splice at 30 m level with thereinforcement ring on top respective bottom of flanges.
Figure 2.2 i The modified flanged erection splice at h=30 m level. Modification made inDecember 1998. The original flanged erection splice is shown in Figure 2.1 e.
Figure 2.2 j The modified flanged erection splice at h=30 m level. Modificationmade in December 1998.
Pär Tranvik, Göran AlpstenDynamic Behaviour under Wind Loading of a 90 m Steel Chimney – Section 2.2
16
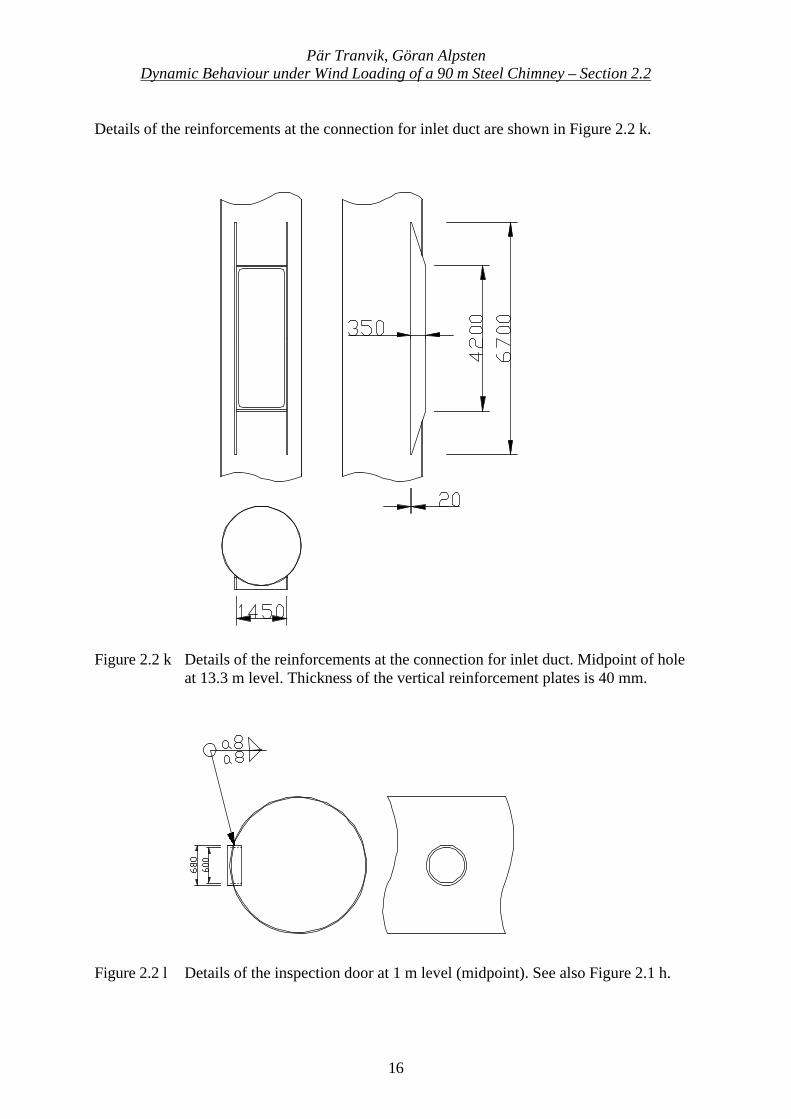
Details of the reinforcements at the connection for inlet duct are shown in Figure 2.2 k.
Figure 2.2 k Details of the reinforcements at the connection for inlet duct. Midpoint of holeat 13.3 m level. Thickness of the vertical reinforcement plates is 40 mm.
Figure 2.2 l Details of the inspection door at 1 m level (midpoint). See also Figure 2.1 h.
Pär Tranvik, Göran AlpstenDynamic Behaviour under Wind Loading of a 90 m Steel Chimney – Section 2.2
17
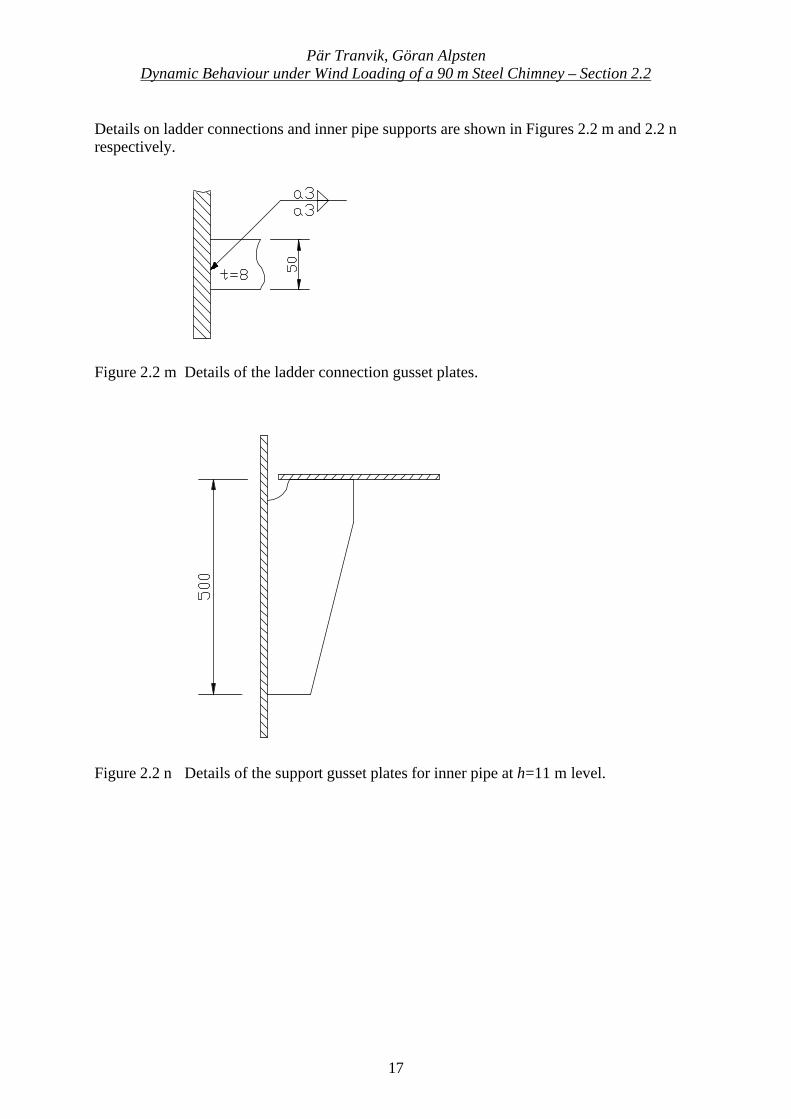
Details on ladder connections and inner pipe supports are shown in Figures 2.2 m and 2.2 nrespectively.
Figure 2.2 m Details of the ladder connection gusset plates.
Figure 2.2 n Details of the support gusset plates for inner pipe at h=11 m level.

Pär Tranvik, Göran AlpstenDynamic Behaviour under Wind Loading of a 90 m Steel Chimney – Section 2.2
18
2.2.3 Manufacturing characteristics
The manufacturing was intended to follow Swedish regulations for load carrying steelstructures [3], [4] and [17]. According to the manufacturers documentation:
Workmanship class GBCutting class Sk2Weld class WC according to [4], that is, modified class C according
to ISO 5817
From inspection of the delivered structure, a number of deviations from the intended qualitywere found. Most important, a large number of welds at base and at flanged erection splice at30 m level not did satisfy weld class WC. Weld class WC is the lowest weld qualityapplicable for load carrying steel structures according to [4].
The manufacturing was made at the VL Staal a/s workshop in Esbjerg, Denmark. In thequality control of the chimney a third party was involved.
Pär Tranvik, Göran AlpstenDynamic Behaviour under Wind Loading of a 90 m Steel Chimney – Section 2.3
19
2.3 Mechanical damper
2.3.1 Common damping designs
Two principal solutions to reduce oscillations caused by vortex shedding are described in theliterature, see for instance [1] and [6].
The first method is to apply helical strakes or any similar aerodynamic device for removing orreducing the magnitude of oscillations induced by regular vortex shedding. The periodicformation of vortices will be reduced or eliminated by the changed airflow. The design of thehelical strakes is important for an effective reduction of vortex-induced oscillations. Adisadvantage with the use of helical strakes is an increased projected area at chimney top andincreased drag coefficient, thus causing increased gust wind loads.
Another method for reducing or eliminating the risk of oscillations induced by vortexshedding is to apply tuned mass dampers. There are two types of tuned mass dampers, passiveand active. An active mass damper requires an automatic engineering system to trigger themass damper to counteract any occurring oscillation.
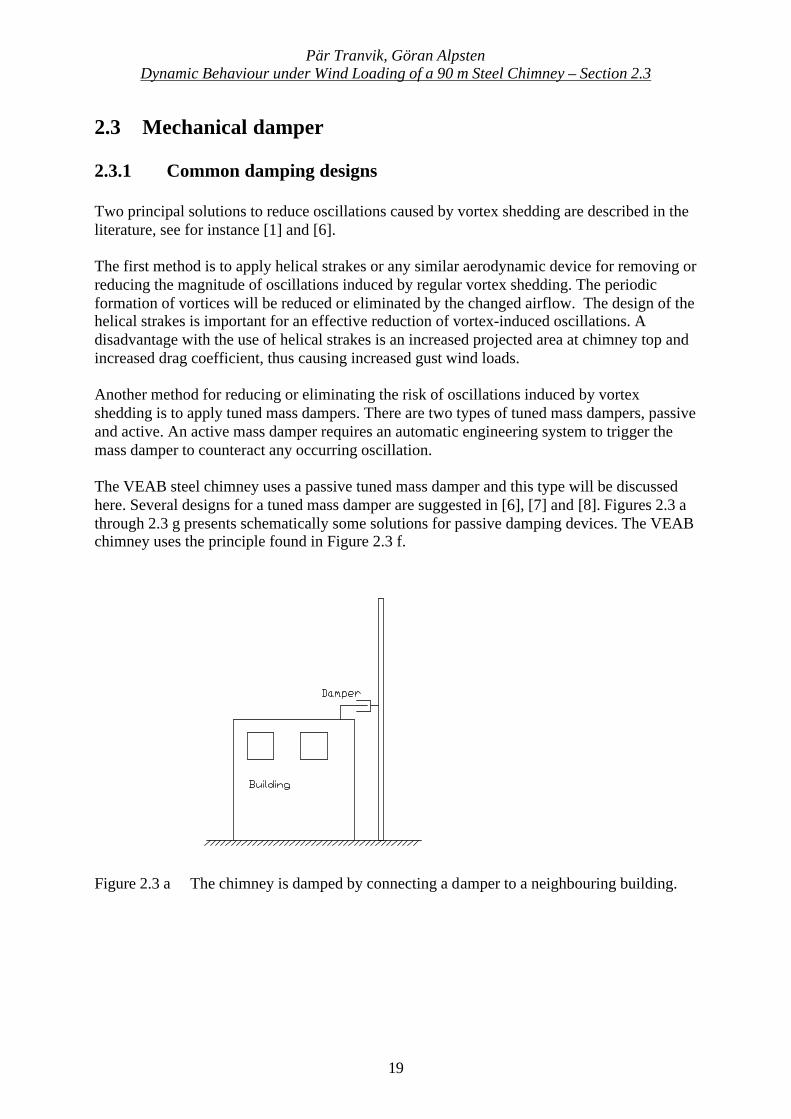
The VEAB steel chimney uses a passive tuned mass damper and this type will be discussedhere. Several designs for a tuned mass damper are suggested in [6], [7] and [8]. Figures 2.3 athrough 2.3 g presents schematically some solutions for passive damping devices. The VEABchimney uses the principle found in Figure 2.3 f.
Figure 2.3 a The chimney is damped by connecting a damper to a neighbouring building.
Pär Tranvik, Göran AlpstenDynamic Behaviour under Wind Loading of a 90 m Steel Chimney – Section 2.3
20
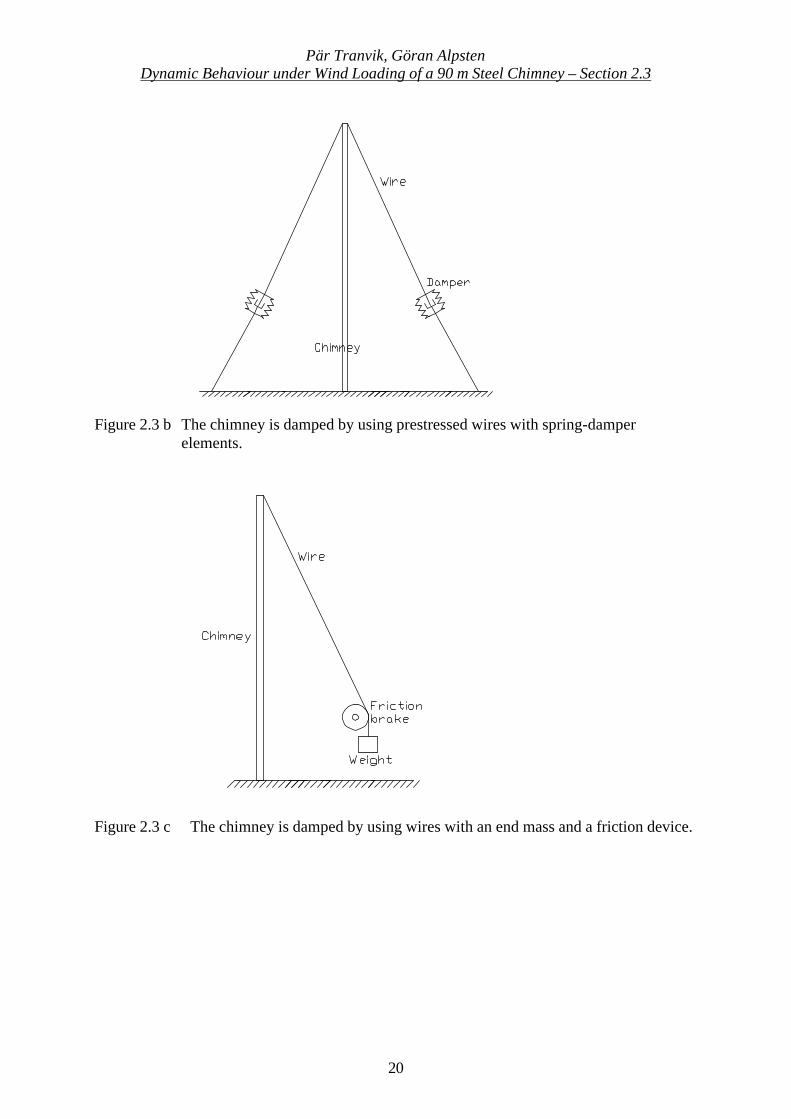
Figure 2.3 b The chimney is damped by using prestressed wires with spring-damperelements.
Figure 2.3 c The chimney is damped by using wires with an end mass and a friction device.
Pär Tranvik, Göran AlpstenDynamic Behaviour under Wind Loading of a 90 m Steel Chimney – Section 2.3
21
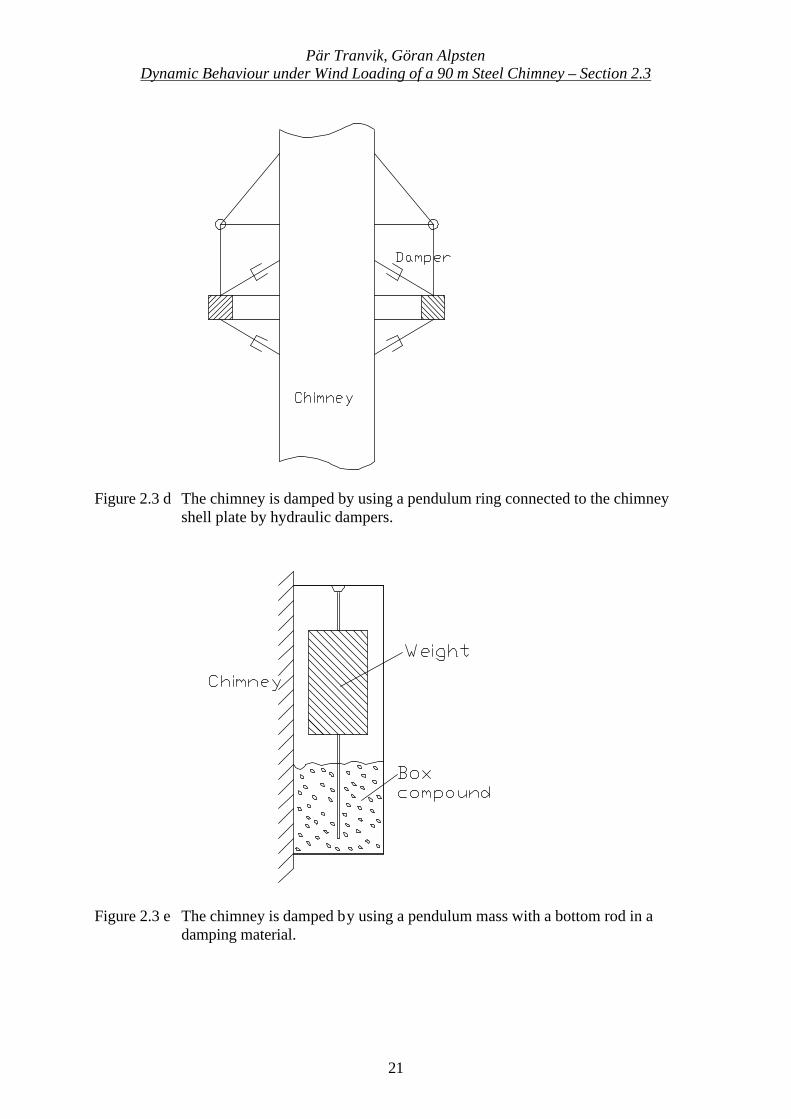
Figure 2.3 d The chimney is damped by using a pendulum ring connected to the chimneyshell plate by hydraulic dampers.
Figure 2.3 e The chimney is damped by using a pendulum mass with a bottom rod in adamping material.
Pär Tranvik, Göran AlpstenDynamic Behaviour under Wind Loading of a 90 m Steel Chimney – Section 2.3
22
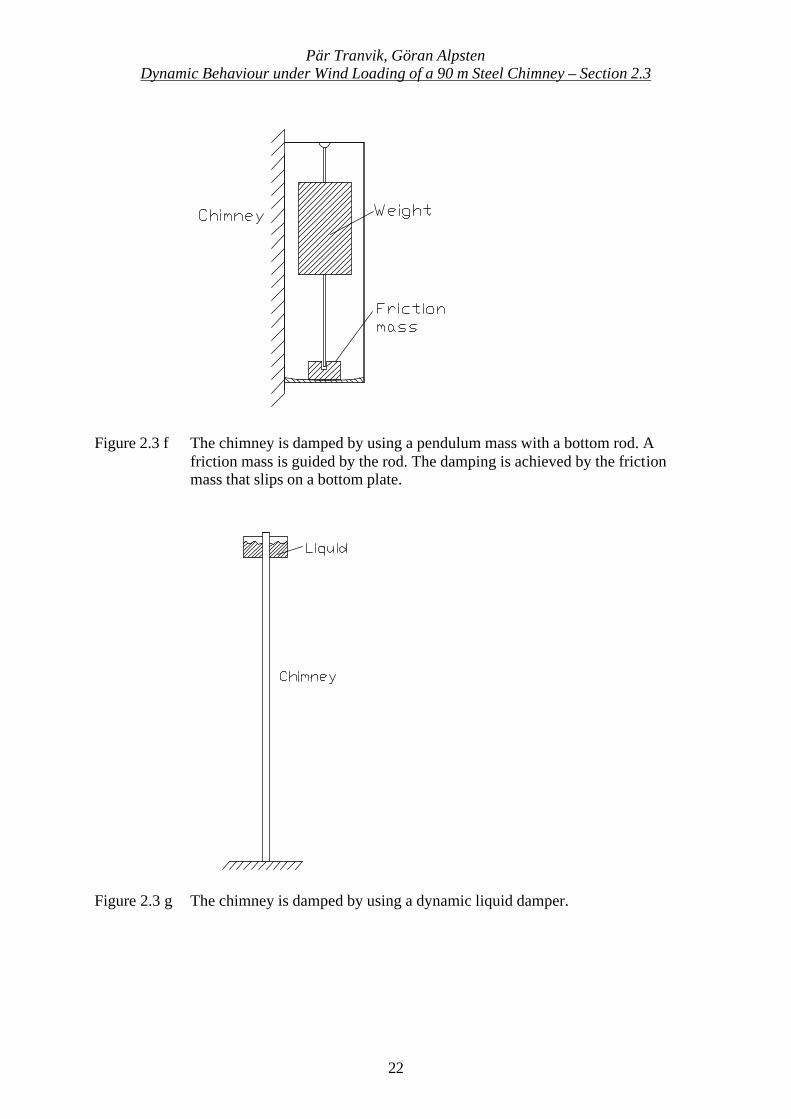
Figure 2.3 f The chimney is damped by using a pendulum mass with a bottom rod. Afriction mass is guided by the rod. The damping is achieved by the frictionmass that slips on a bottom plate.
Figure 2.3 g The chimney is damped by using a dynamic liquid damper.
Pär Tranvik, Göran AlpstenDynamic Behaviour under Wind Loading of a 90 m Steel Chimney – Section 2.3
23
2.3.2 Tuned pendulum damper of the VEAB chimney
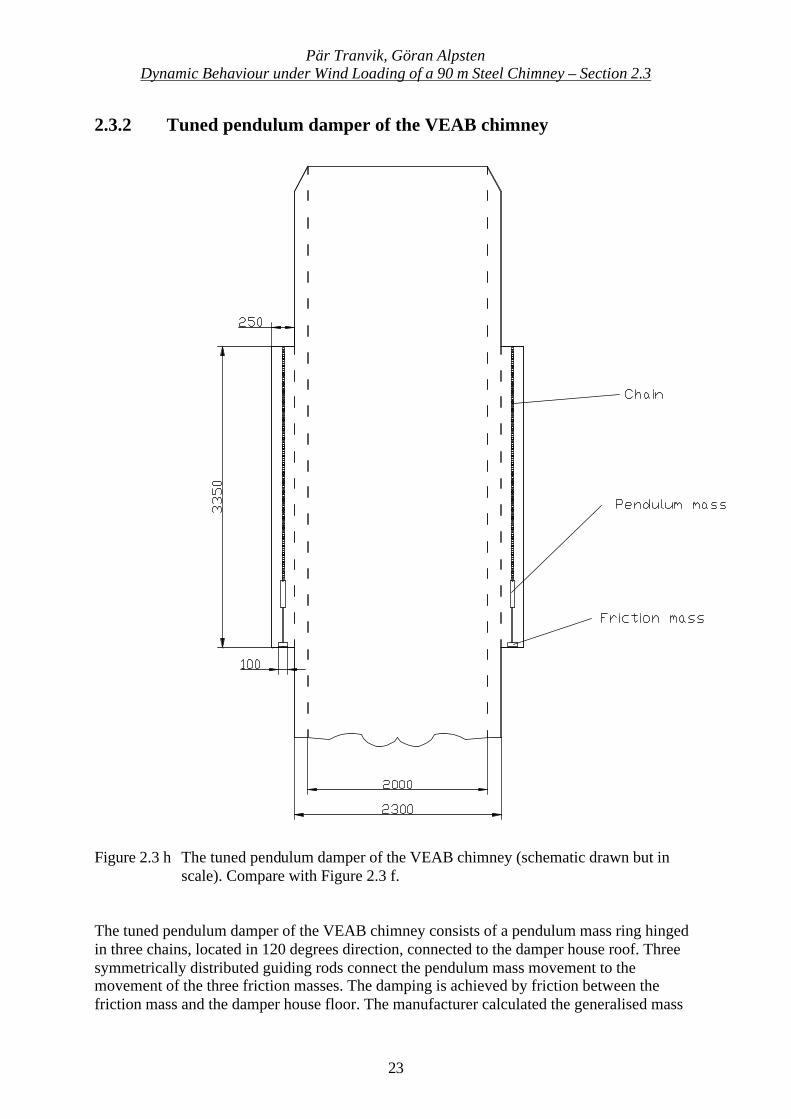
Figure 2.3 h The tuned pendulum damper of the VEAB chimney (schematic drawn but inscale). Compare with Figure 2.3 f.
The tuned pendulum damper of the VEAB chimney consists of a pendulum mass ring hingedin three chains, located in 120 degrees direction, connected to the damper house roof. Threesymmetrically distributed guiding rods connect the pendulum mass movement to themovement of the three friction masses. The damping is achieved by friction between thefriction mass and the damper house floor. The manufacturer calculated the generalised mass
Pär Tranvik, Göran AlpstenDynamic Behaviour under Wind Loading of a 90 m Steel Chimney – Section 2.3
24
to Mgen=12 460 kg. The pendulum mass was selected to 10 percent of the generalised mass toM=1 246 kg [6].
The generalised mass is defined as
∫ ⋅
⋅=
H
dxy
xyxmM
0
2
topgen
)()( ….............................…………........................................(2.2)
wherem(x) = Mass per length at height xy(x) = Deflection at height xytop = Top deflectiondx = Integration segmentH = Chimney height
00.010.020.030.040.05
0.060.070.080.090.1
0 10 20 30 40 50 60 70 80 90
Height (m)
Dis
pla
cem
ent
(mm
)
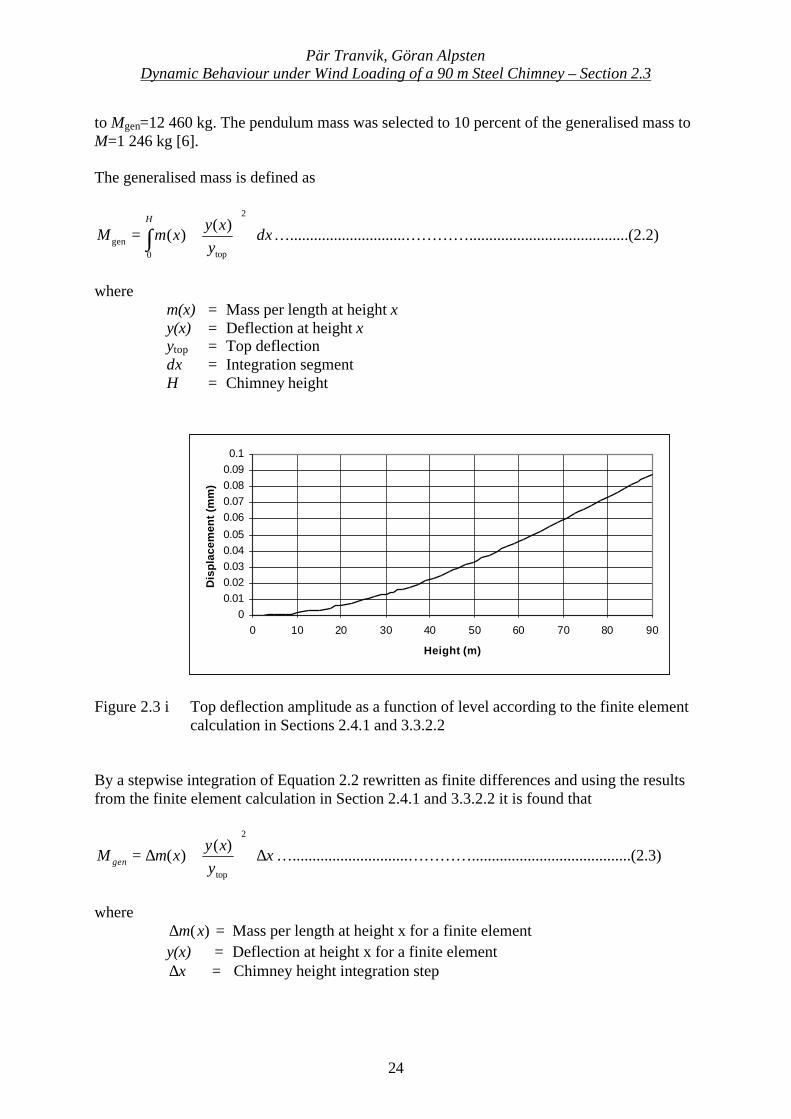
Figure 2.3 i Top deflection amplitude as a function of level according to the finite elementcalculation in Sections 2.4.1 and 3.3.2.2
By a stepwise integration of Equation 2.2 rewritten as finite differences and using the resultsfrom the finite element calculation in Section 2.4.1 and 3.3.2.2 it is found that
xy
xyxmM gen ∆⋅
⋅∆=
2
top
)()( ….............................…………........................................(2.3)
where)(xm∆ = Mass per length at height x for a finite element
y(x) = Deflection at height x for a finite elementx∆ = Chimney height integration step
Pär Tranvik, Göran AlpstenDynamic Behaviour under Wind Loading of a 90 m Steel Chimney – Section 2.3
25
The generalised mass may be achieved as kg81016gen =M which differs from 12 460 kgaccording to above.
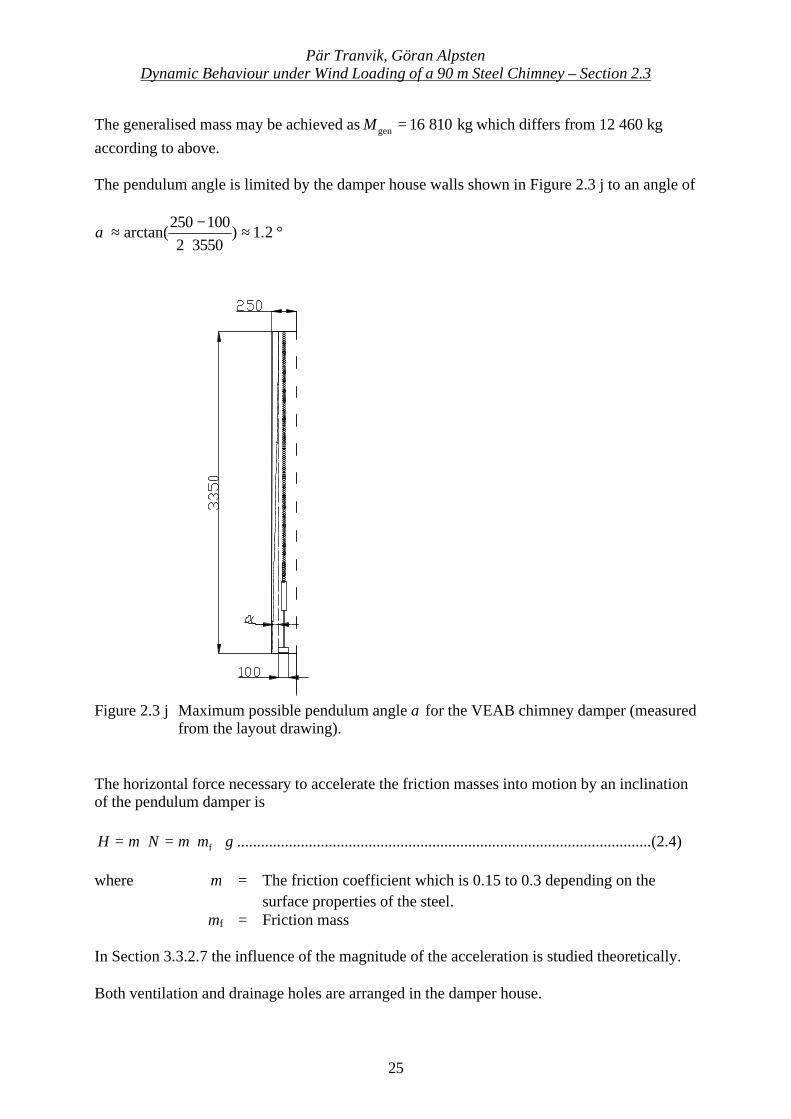
The pendulum angle is limited by the damper house walls shown in Figure 2.3 j to an angle of
°≈⋅
−≈ 2.1)
35502100250
arctan(α
Figure 2.3 j Maximum possible pendulum angle α for the VEAB chimney damper (measuredfrom the layout drawing).
The horizontal force necessary to accelerate the friction masses into motion by an inclinationof the pendulum damper is
gmNH ⋅⋅=⋅= fµµ ........................................................................................................(2.4)
where µ = The friction coefficient which is 0.15 to 0.3 depending on thesurface properties of the steel.
mf = Friction mass
In Section 3.3.2.7 the influence of the magnitude of the acceleration is studied theoretically.
Both ventilation and drainage holes are arranged in the damper house.
Pär Tranvik, Göran AlpstenDynamic Behaviour under Wind Loading of a 90 m Steel Chimney – Section 2.4
26
2.4 Dynamic properties of the VEAB chimney
2.4.1 Natural frequencies
The three lowest modes of natural frequencies of the VEAB chimney were calculated with afinite element program.
The following assumptions were made:
- The chimney was modelled as a fixed end cantilever.
- The actual variation with height of the mass and the stiffness of the structurewas considered
- An additional mass of 2 500 kg for the damper equipment was added in thenode
at the mass centre of the damper.
- Distributed masses of 310 kg/m were added to all nodes. It includes inner pipe,insulation, ladder, electrical cables and other non-structural elements.
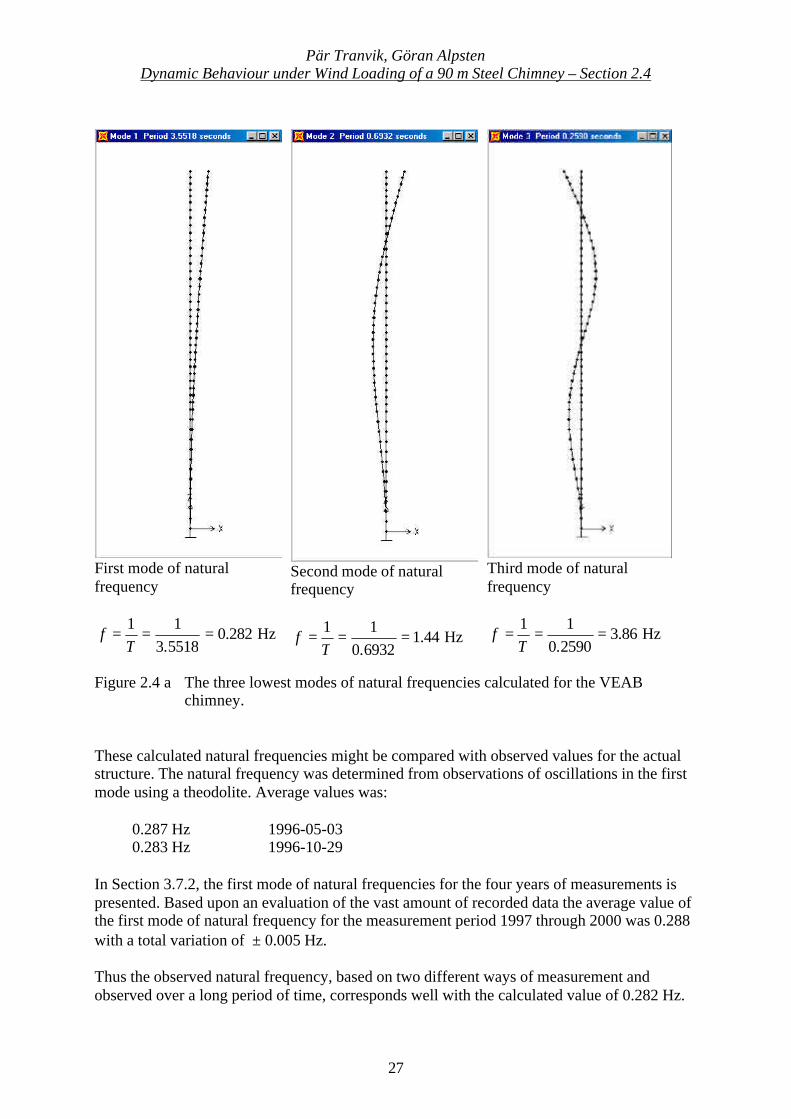
The three lowest modes of natural frequencies are shown in Figure 2.4 a.
Pär Tranvik, Göran AlpstenDynamic Behaviour under Wind Loading of a 90 m Steel Chimney – Section 2.4
27
First mode of naturalfrequency
Hz282.05518.311
===T
f
Second mode of naturalfrequency
Hz44.16932.011
===T
f
Third mode of naturalfrequency
Hz86.32590.011
===T
f
Figure 2.4 a The three lowest modes of natural frequencies calculated for the VEABchimney.
These calculated natural frequencies might be compared with observed values for the actualstructure. The natural frequency was determined from observations of oscillations in the firstmode using a theodolite. Average values was:
0.287 Hz 1996-05-030.283 Hz 1996-10-29
In Section 3.7.2, the first mode of natural frequencies for the four years of measurements ispresented. Based upon an evaluation of the vast amount of recorded data the average value ofthe first mode of natural frequency for the measurement period 1997 through 2000 was 0.288with a total variation of ± 0.005 Hz.
Thus the observed natural frequency, based on two different ways of measurement andobserved over a long period of time, corresponds well with the calculated value of 0.282 Hz.
Pär Tranvik, Göran AlpstenDynamic Behaviour under Wind Loading of a 90 m Steel Chimney – Section 2.4
28
2.4.2 Vortex shedding
According to [3] the critical wind velocity at vortex shedding is calculated as
Stdf
v⋅
=cr .......................................................... .................. .............................................(2.5)
where f = Natural frequency (0.282 Hz used in this section)d = DiameterSt = Strouhal number (Equation 1.2), 0.2 at ordinary vortex
shedding and lower if any lock-in phenomena occur
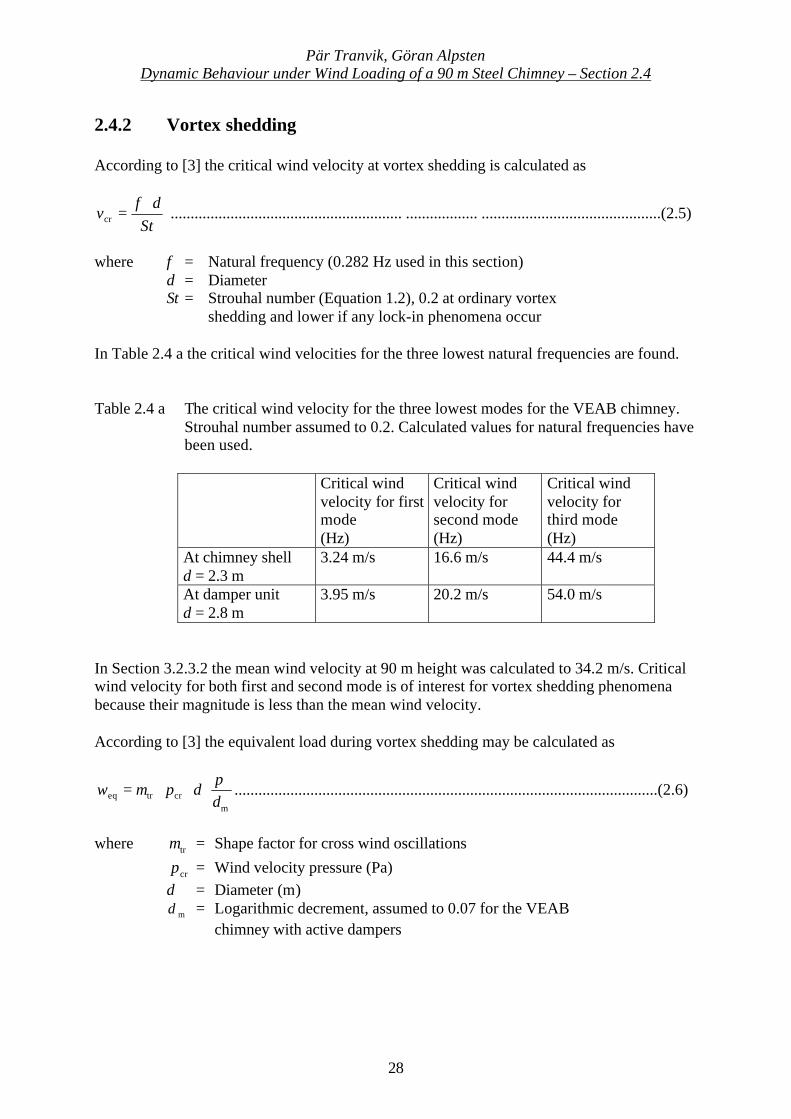
In Table 2.4 a the critical wind velocities for the three lowest natural frequencies are found.
Table 2.4 a The critical wind velocity for the three lowest modes for the VEAB chimney.Strouhal number assumed to 0.2. Calculated values for natural frequencies havebeen used.
Critical windvelocity for firstmode(Hz)
Critical windvelocity forsecond mode(Hz)
Critical windvelocity forthird mode(Hz)
At chimney shelld = 2.3 m
3.24 m/s 16.6 m/s 44.4 m/s
At damper unitd = 2.8 m
3.95 m/s 20.2 m/s 54.0 m/s
In Section 3.2.3.2 the mean wind velocity at 90 m height was calculated to 34.2 m/s. Criticalwind velocity for both first and second mode is of interest for vortex shedding phenomenabecause their magnitude is less than the mean wind velocity.
According to [3] the equivalent load during vortex shedding may be calculated as
mcrtreq d
dpwπ
µ ⋅⋅⋅= ..........................................................................................................(2.6)
where trµ = Shape factor for cross wind oscillations
crp = Wind velocity pressure (Pa)d = Diameter (m)
mδ = Logarithmic decrement, assumed to 0.07 for the VEABchimney with active dampers
Pär Tranvik, Göran AlpstenDynamic Behaviour under Wind Loading of a 90 m Steel Chimney – Section 2.4
29
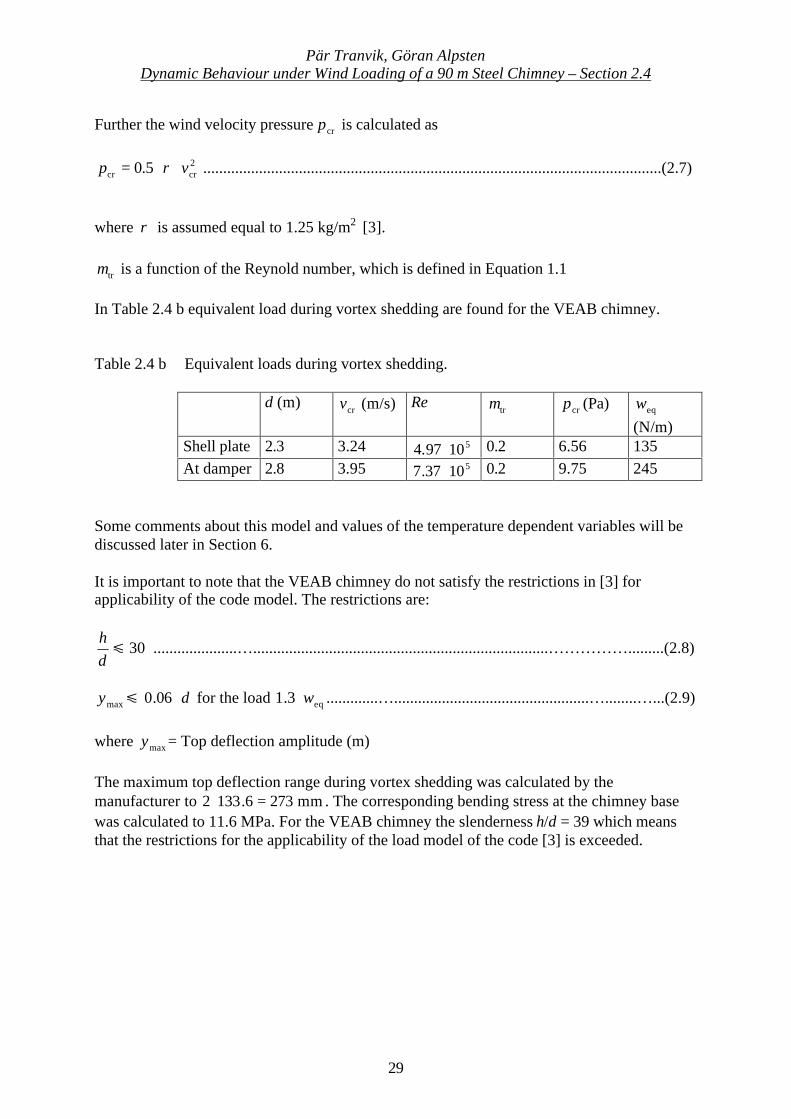
Further the wind velocity pressure crp is calculated as
2crcr 5.0 vp ⋅⋅= ρ ...................................................................................................................(2.7)
where ρ is assumed equal to 1.25 kg/m2 [3].
trµ is a function of the Reynold number, which is defined in Equation 1.1
In Table 2.4 b equivalent load during vortex shedding are found for the VEAB chimney.
Table 2.4 b Equivalent loads during vortex shedding.
d (m)crv (m/s) Re
trµ crp (Pa) eqw(N/m)
Shell plate 2.3 3.24 51097.4 ⋅ 0.2 6.56 135At damper 2.8 3.95 51037.7 ⋅ 0.2 9.75 245
Some comments about this model and values of the temperature dependent variables will bediscussed later in Section 6.
It is important to note that the VEAB chimney do not satisfy the restrictions in [3] forapplicability of the code model. The restrictions are:
dh
õ 30 .....................…..........................................................................…………….........(2.8)
maxy õ d⋅06.0 for the load eq3.1 w⋅ .............….................................................…........…...(2.9)
where maxy = Top deflection amplitude (m)
The maximum top deflection range during vortex shedding was calculated by themanufacturer to mm2736.1332 =⋅ . The corresponding bending stress at the chimney basewas calculated to 11.6 MPa. For the VEAB chimney the slenderness h/d = 39 which meansthat the restrictions for the applicability of the load model of the code [3] is exceeded.
Pär Tranvik, Göran AlpstenDynamic Behaviour under Wind Loading of a 90 m Steel Chimney – Section 2.4
30
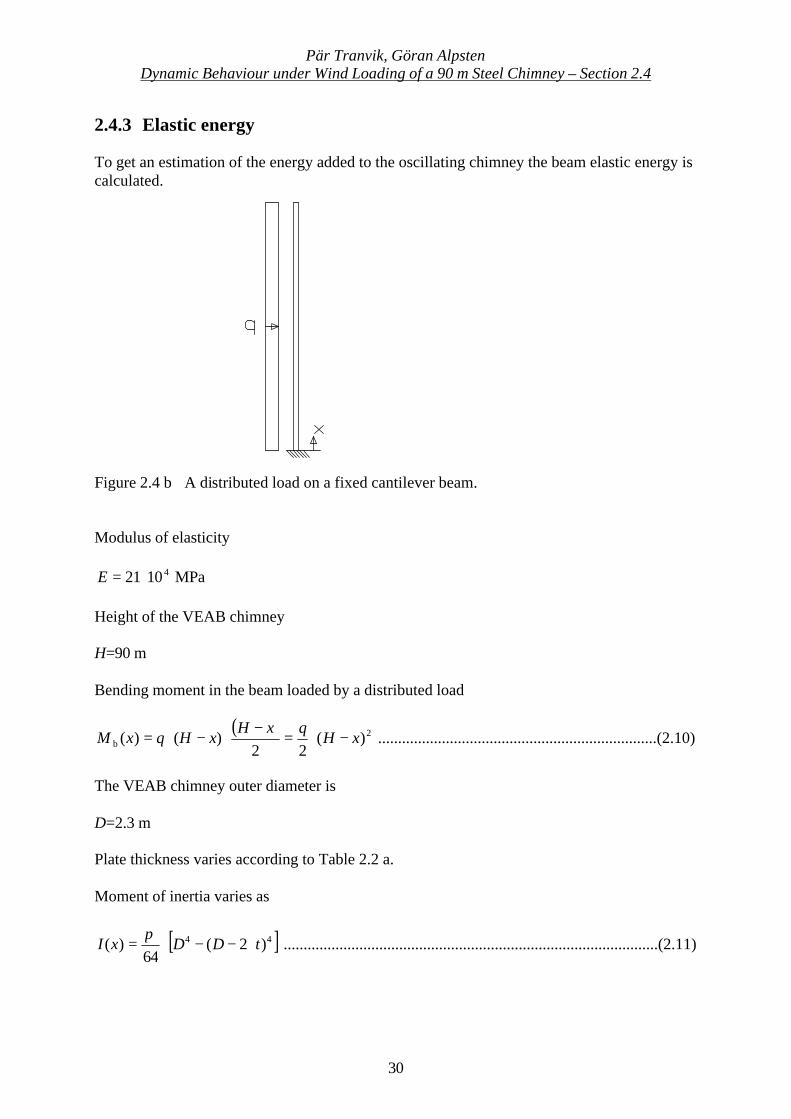
2.4.3 Elastic energy
To get an estimation of the energy added to the oscillating chimney the beam elastic energy iscalculated.
Figure 2.4 b A distributed load on a fixed cantilever beam.
Modulus of elasticity
MPa1021 4⋅=E
Height of the VEAB chimney
H=90 m
Bending moment in the beam loaded by a distributed load
( ) 2b )(
22)()( xH
qxHxHqxM −⋅=
−⋅−⋅= ......................................................................(2.10)
The VEAB chimney outer diameter is
D=2.3 m
Plate thickness varies according to Table 2.2 a.
Moment of inertia varies as
[ ]44 )2(64
)( tDDxI ⋅−−⋅=π
..............................................................................................(2.11)
Pär Tranvik, Göran AlpstenDynamic Behaviour under Wind Loading of a 90 m Steel Chimney – Section 2.4
31
The beam elastic energy is described as
∫ ⋅
⋅⋅
=H
dxxIE
xMW
0
2b
)(2))((
.................................................................................................….(2.12)
For each part with a constant shell thickness the moment of inertia is constant. The integral istherefore calculated separately for each part with constant shell thickness. The total beamelastic energy is then calculated by superposition. The part integration will be
∫∫ ⋅−⋅⋅
=⋅⋅⋅
=2
1
2
1
4
part
22
partpart )(
8))((
21 h
h
h
hb dxxH
IEq
dxxMIE
W
2
1
5
part
2
part )(51
8
h
h
xHIE
qW
−⋅−
⋅⋅=
[ ]52
51
part
2
part )()(40
hHhHIE
qW −−−
⋅⋅= ............................….....................................(2.13)
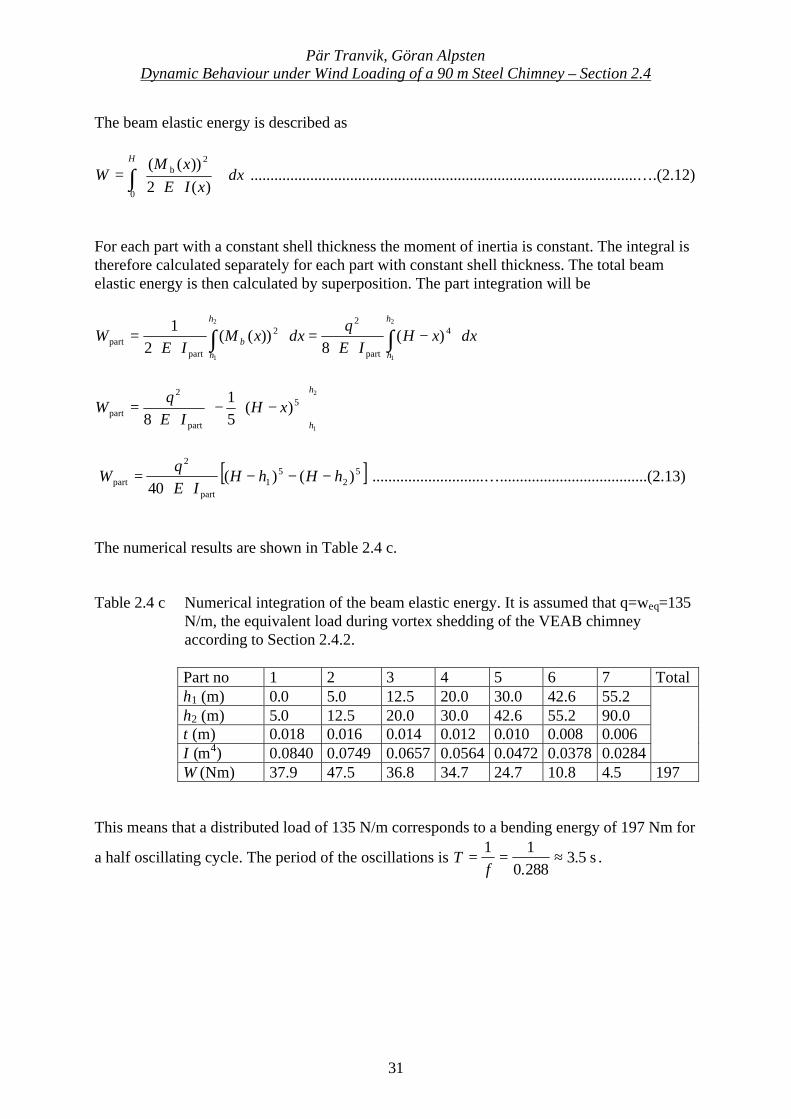
The numerical results are shown in Table 2.4 c.
Table 2.4 c Numerical integration of the beam elastic energy. It is assumed that q=weq=135N/m, the equivalent load during vortex shedding of the VEAB chimneyaccording to Section 2.4.2.
Part no 1 2 3 4 5 6 7 Totalh1 (m) 0.0 5.0 12.5 20.0 30.0 42.6 55.2h2 (m) 5.0 12.5 20.0 30.0 42.6 55.2 90.0t (m) 0.018 0.016 0.014 0.012 0.010 0.008 0.006I (m4) 0.0840 0.0749 0.0657 0.0564 0.0472 0.0378 0.0284W (Nm) 37.9 47.5 36.8 34.7 24.7 10.8 4.5 197
This means that a distributed load of 135 N/m corresponds to a bending energy of 197 Nm for
a half oscillating cycle. The period of the oscillations is s5.3288.011
≈==f
T .
Pär Tranvik, Göran AlpstenDynamic Behaviour under Wind Loading of a 90 m Steel Chimney – Section 2.5
32
2.5 Time history of the VEAB chimney
The VEAB chimney was erected in late November to early December 1995. It was snowyweather and the temperature was a couple of degrees below zero Celsius.
During the first winter period after erection several persons made observations of oscillationswith large top deflections of the chimney. The potential for fatigue problems were firstpointed out in a report by the second author. During the spring of 1996 cracks were found.Therefore an extensive crack examination program was carried out during the late summerand early autumn of 1996. A large number of cracks were found, examined and repaired.
One important explanation to the unacceptable top deflections was that the damper was mal-functioning. It was repaired but questions still remained if there could be other explanationsfor the large oscillations. Therefore an extensive data collecting system was installed intendedto continuously monitor and record the response of the structure to wind loads. The datacollecting system has been in continuous operation since mid December 1996 until 2001.
In December 1998 some additional cracks were found at locations not examined before. Acouple of design changes were made. As part of the action to ensure a safe design the originalfoundation ring was modified. On top of the gussets an additional ring was added aimed toreduce stress concentrations at the horizontal welds between shell and gusset plates. Thesame action was taken at the connection ring at the flanged splice on the 30 m level.
Pär Tranvik, Göran AlpstenDynamic Behaviour under Wind Loading of a 90 m Steel Chimney – Section 3.1
33
3. Observed and recorded behaviour of the VEABchimney
3.1 Observation of mal-functioning of the chimney
3.1.1 Observations of large oscillations
During the first nine months of the chimney in operation oscillations with large topdeflections were observed. Observations of some witnesses during the first winter periodDecember 1995 to April 1996 were later documented and are briefly related below.
The first working day after Christmas 1995 the temperature was about -20 °C with a sunnyclear sky. A supervisor discovered that the chimney top oscillated with an amplitudeapproximately equal to the diameter and sounded like a chime of bells with a frequency ofabout one second period. He estimated the magnitude of the top deflection frommeasurements on the chimney shadow. His understanding was that the sound originated frommovements between the outer and inner pipe. At 10.30 to 12.30 h the top chimney shadowmoved about 4 m at the top of the power plant building. The chimney oscillated in west/eastdirection. The smoke from the older concrete chimney was almost above the new one or alittle to the west. At 14.00 to 15.00 h the chimney again oscillated in a similarly manner. At17.00 to18.00 h it oscillated again but not as much as before. The supervisor estimated thatthe chimney oscillated from Christmas 1995 or April 1996 one or two days a week with totaltop deflection amplitude of 0.5 to1.0 m.
A building worker observed on the first working day after Christmas 1995 that the chimneyoscillated with a top amplitude equal to about the diameter. Later during the winter the samebuilding worker, working on the power plant roof, observed the chimney to oscillate withamplitude of about 0.5 m at roof level.
Another building worker also made observations of the oscillations the same day as thesupervisor. The top deflection amplitude was not quantified. After that he saw the chimneyoscillate several times but not as much as on the first day.
Several design engineers and one structural engineer at a nearby engineering office of theFläkt Industri AB located about 600 m NW of the chimney observed from their windowsduring the first working day after Christmas 1995 that the chimney oscillated violently. Thestructural engineer estimated the top amplitude to about half the diameter. The conditions forestimating the magnitude of the oscillations were good because the new steel chimney isalmost in line with an older concrete chimney as viewed from the engineering officewindows.
Two other structural engineers at a separate engineering office of the Fläkt Industri ABlocated about 1 km NW of the chimney observed from their windows the chimney to oscillatedrastically during several times in January and February 1996. By levelling relative to a wallthey estimated the top amplitude to be about half the diameter.
Pär Tranvik, Göran AlpstenDynamic Behaviour under Wind Loading of a 90 m Steel Chimney – Section 3.1
34
3.1.2 Initial observations of cracks and causes
According to the manufacturer a documented quality control was made before the shipping ofthe chimney and there where no detected cracks when it left the workshop. Personnel from themanufacturer as well as external testing personnel were involved in the quality inspection andtesting.
Because of the observed behaviour of the VEAB chimney an inspection was made in May1996 by the second author acting as a consultant for VEAB. At the foundation level crackswere found at the weld toes to the gusset plates. Both the maximum bending moment fromwind loads and the large stress concentration at fillet welds at top of gusset plates to shell atchimney coincided. The appearance of these cracks indicated that the cause was fatigue.
The main explanation for the cracks was that one of the three guiding bars for friction massesof the damping pendulum at the top of the chimney was to long and therefore resting on thebottom friction plate. The pendulum movements were partly restrained. Apparently thedamper gave only limited damping action until it was adjusted in September 1996.
3.1.3 Detailed examination of cracks
As a result of the initial observations of cracks at the base a detailed examination of crackswas made using magnetic particle and eddy current testing techniques. A description of thedetailed examination of cracks is found in appendix J. The first author conducted andparticipated in all inspections and investigations and performed all evaluations.
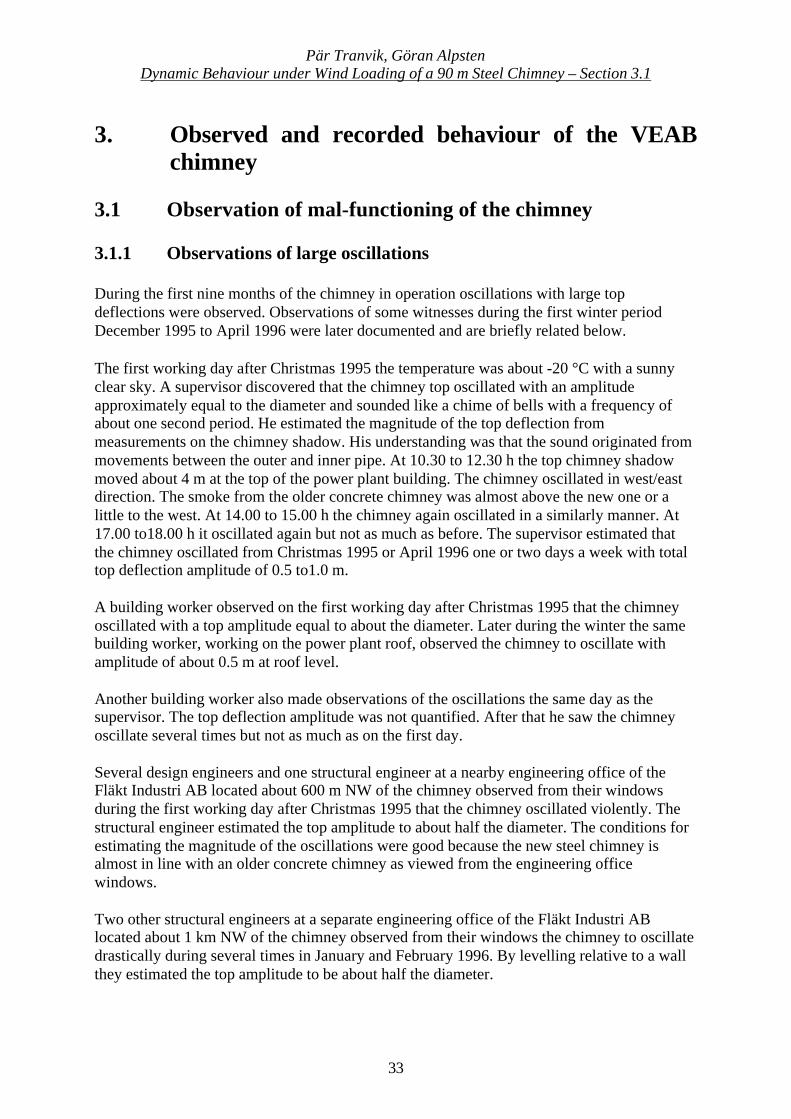
Cracks were found at foundation ring gusset plates, at flanged erection splice gusset plates at30 m level and at top and bottom of connecting gas duct vertical gussets. In Figure 3.1 atypical cracks for vertical gusset plates at foundation ring and vertical gusset plates at flangederection splice at 30 m level are found. (a) denotes the initiation point at the weld toe wherethe angle at several welds was too sharp. (b) denotes the initiation point at the weld root. (1)shows the propagation direction for the weld toe initiated cracks. (2) and (3) shows thepropagation direction for the centre of weld-initiated cracks. The most common type of crackwas (1).
Pär Tranvik, Göran AlpstenDynamic Behaviour under Wind Loading of a 90 m Steel Chimney – Section 3.1
35
Figure 3.1 a Typical cracks at horizontal fillet welds at top of gusset plates to shell atchimney
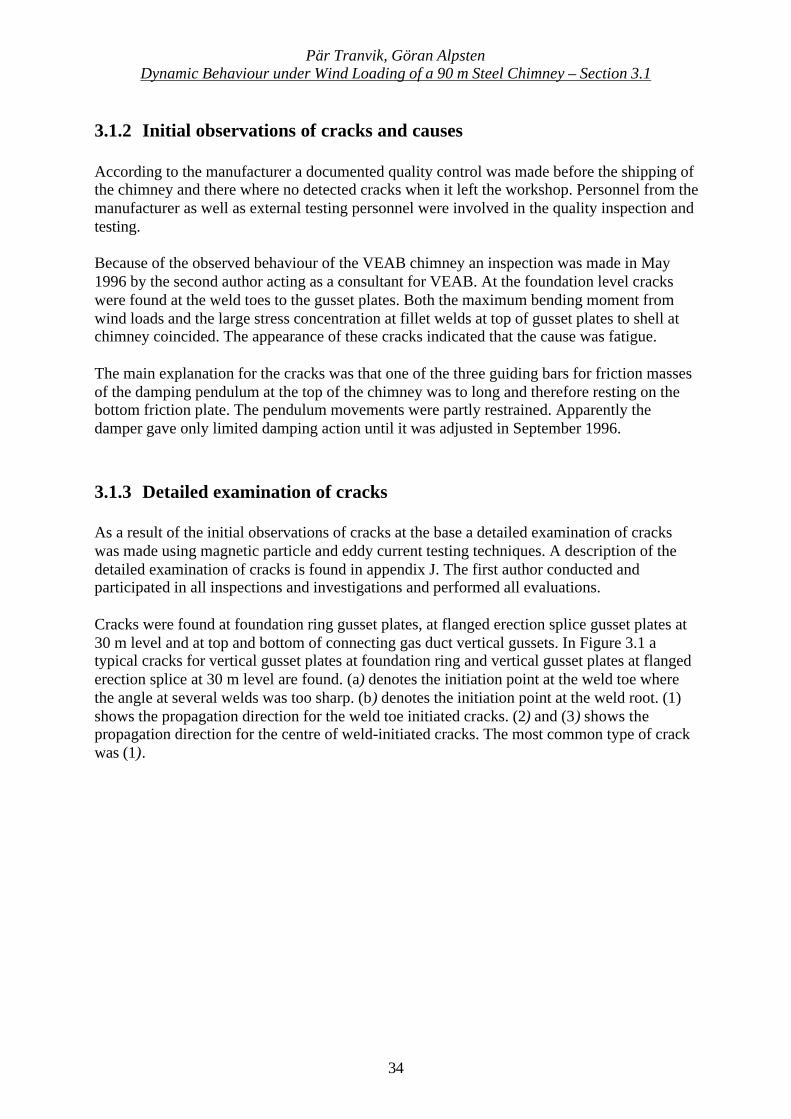
At 12 of the 40 outside gusset plates and 37 of the 40 inside gusset plates at foundation levelcracks were indicated. At 30 m level almost all of the gusset plates had some kind of a linearindication, probably from cracks. At both locations the crack lengths varied from 2 to 20 mmand the depths 1 to 3 mm, except at (2) according to Figure 3.1 a where some of the cracks atfoundation level went through the weld. A picture of a typical weld is found in Figure 3.1 b.
← Crack at the weld toe← Crack in centre of weld
Figure 3.1 b A weld after 1.5 mm of grinding.
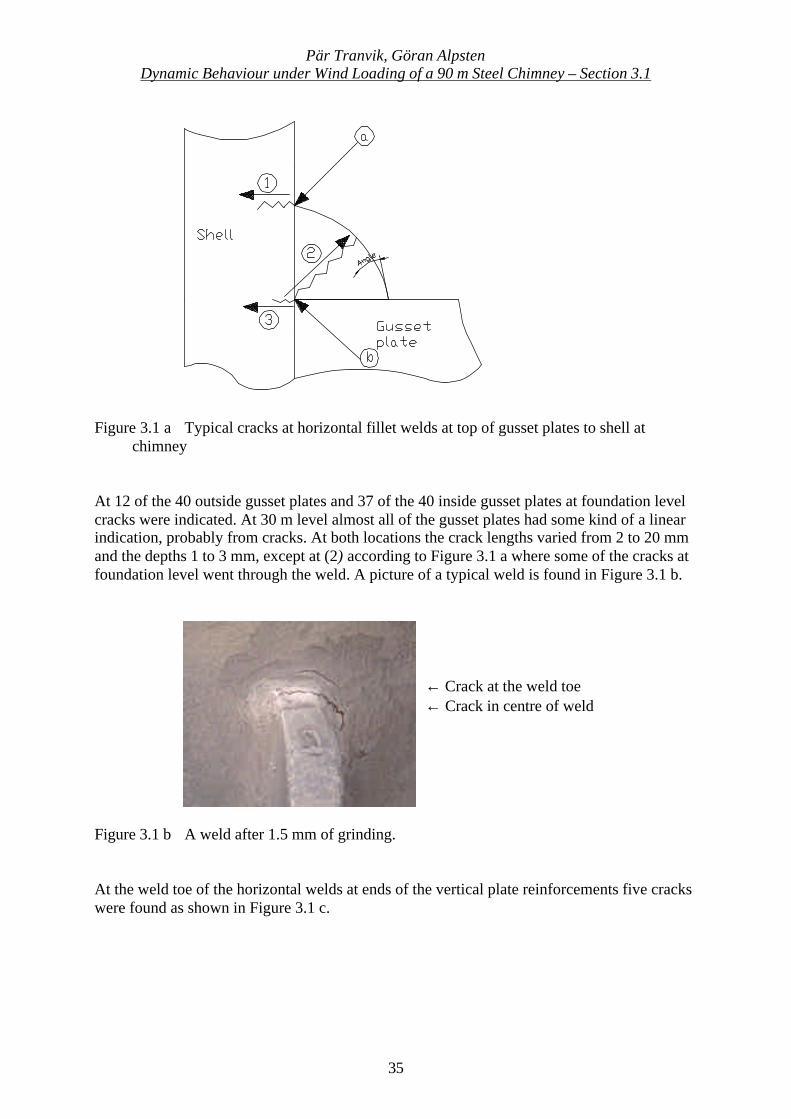
At the weld toe of the horizontal welds at ends of the vertical plate reinforcements five crackswere found as shown in Figure 3.1 c.
Pär Tranvik, Göran AlpstenDynamic Behaviour under Wind Loading of a 90 m Steel Chimney – Section 3.1
36
Figure 3.1 c Detected cracks at gas duct inlet.
3.1.4 Summary of cracks
All detected cracks had started either from an sharp and unacceptable weld toe or from rootdefects as shown in Figure 3.1 a. The weld roots had often remaining slag and cavities. Theweld quality did not satisfy the code requirements for the weld qualities used in the designcalculations. Most of the horizontal welds at top of gusset plates at foundation level and 30 mlevel were damaged by cracks observed after only a few months of service of the chimney.
3.1.5 Notches not available for examination
A number of potential points for fatigue crack initiation were not available for examination,such as welds at support gusset plates for inner pipe and guiding U-beams for inner pipebetween the inner and outer shell. Therefore knowledge about their condition is unknown.
3.1.6 Repair of the damaged welds
All welds with indicated cracks were repaired and once again examined by the magneticparticle method. This was made immediately after the testing.
Pär Tranvik, Göran AlpstenDynamic Behaviour under Wind Loading of a 90 m Steel Chimney – Section 3.2
37
3.2 Data recording system
3.2.1 General
Because doubts remained about the reliability of the damper even after the adjustment in September 1996 it wasdecided that oscillations of the structure had to be monitored and stored by a data recording system. The datarecording system consists of three main parts, the strain gauges, the wind data transmitters and the computer.
The data recording system was created primarily for studying the influence of first mode oscillations withrespect to fatigue strength. Daltek Probator, Sweden, was responsible for developing and installing the datarecording system.
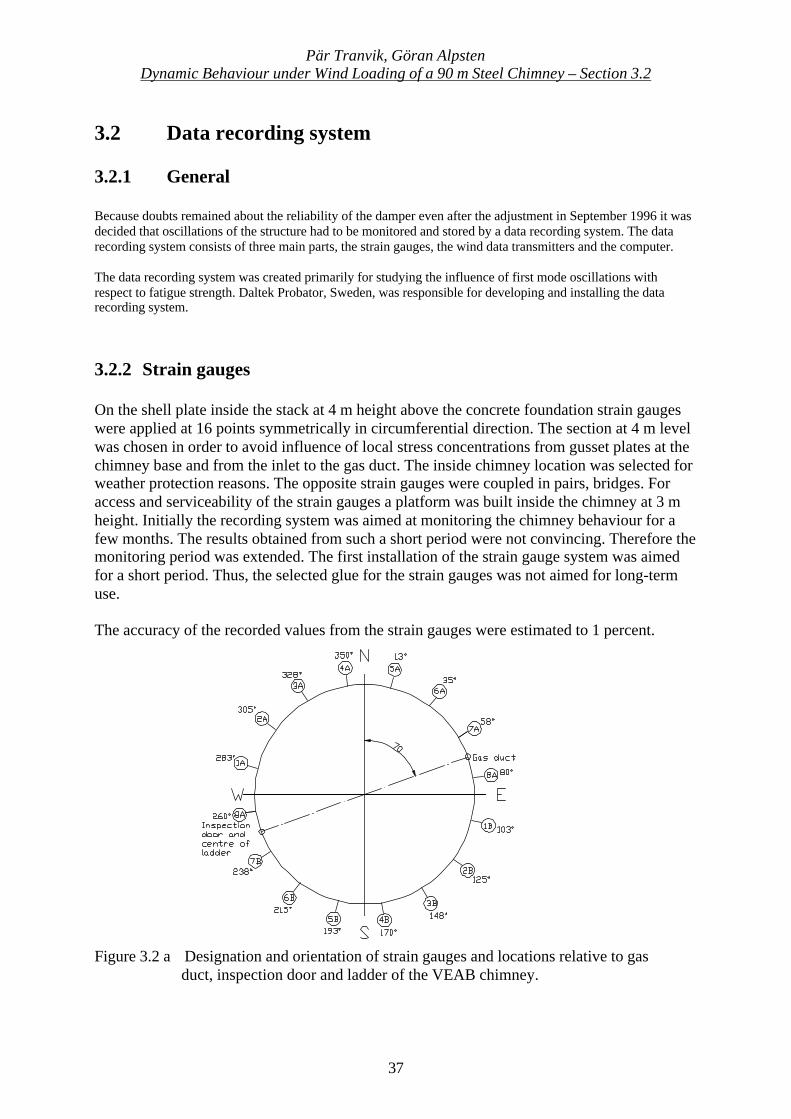
3.2.2 Strain gauges
On the shell plate inside the stack at 4 m height above the concrete foundation strain gaugeswere applied at 16 points symmetrically in circumferential direction. The section at 4 m levelwas chosen in order to avoid influence of local stress concentrations from gusset plates at thechimney base and from the inlet to the gas duct. The inside chimney location was selected forweather protection reasons. The opposite strain gauges were coupled in pairs, bridges. Foraccess and serviceability of the strain gauges a platform was built inside the chimney at 3 mheight. Initially the recording system was aimed at monitoring the chimney behaviour for afew months. The results obtained from such a short period were not convincing. Therefore themonitoring period was extended. The first installation of the strain gauge system was aimedfor a short period. Thus, the selected glue for the strain gauges was not aimed for long-termuse.
The accuracy of the recorded values from the strain gauges were estimated to 1 percent.
Figure 3.2 a Designation and orientation of strain gauges and locations relative to gasduct, inspection door and ladder of the VEAB chimney.
Pär Tranvik, Göran AlpstenDynamic Behaviour under Wind Loading of a 90 m Steel Chimney – Section 3.2
38
3.2.3 Wind data transmitter
3.2.3.1 General
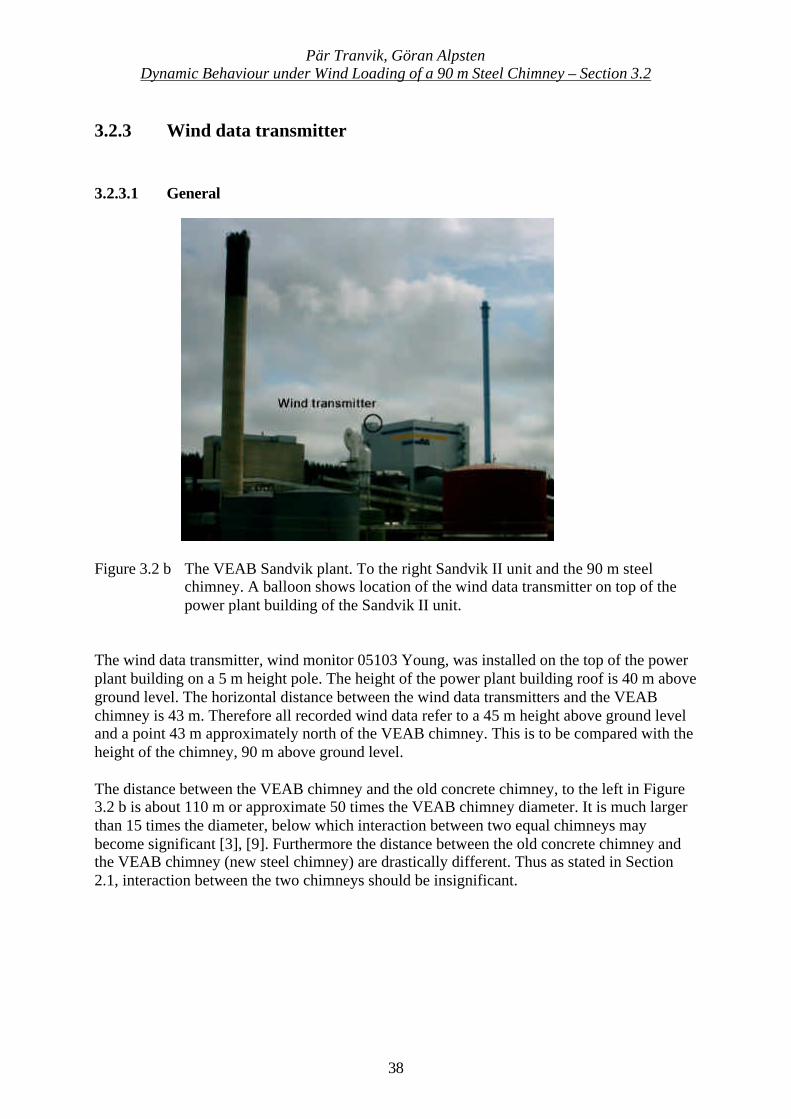
Figure 3.2 b The VEAB Sandvik plant. To the right Sandvik II unit and the 90 m steelchimney. A balloon shows location of the wind data transmitter on top of thepower plant building of the Sandvik II unit.
The wind data transmitter, wind monitor 05103 Young, was installed on the top of the powerplant building on a 5 m height pole. The height of the power plant building roof is 40 m aboveground level. The horizontal distance between the wind data transmitters and the VEABchimney is 43 m. Therefore all recorded wind data refer to a 45 m height above ground leveland a point 43 m approximately north of the VEAB chimney. This is to be compared with theheight of the chimney, 90 m above ground level.
The distance between the VEAB chimney and the old concrete chimney, to the left in Figure3.2 b is about 110 m or approximate 50 times the VEAB chimney diameter. It is much largerthan 15 times the diameter, below which interaction between two equal chimneys maybecome significant [3], [9]. Furthermore the distance between the old concrete chimney andthe VEAB chimney (new steel chimney) are drastically different. Thus as stated in Section2.1, interaction between the two chimneys should be insignificant.

Pär Tranvik, Göran AlpstenDynamic Behaviour under Wind Loading of a 90 m Steel Chimney – Section 3.2
39
Figure 3.2 c The wind data transmitters on the Sandvik II unit roof.
Because of the small distance between the power plant outer roof and the wind datatransmitter some form of turbulent boundary layer disturbances in the recorded wind data maybe expected.
The wind data transmitter signals were also used by VEAB for their plant planning and formonitoring environmental conditions.
3.2.3.2 Correction for wind at 90 m height
The wind mean velocity varies with height according to [3]
)()( exprefmk zCvzv ⋅= ........................................................................................................(3.1)
where the exposure factor is
2
0exp ln)(
⋅=
zzzC β for minzz > .................................................................................(3.2)
For the VEAB chimney, topographical category II that is similar to the code definition [3] ofan open terrain with small obstacles.
Reference wind velocity and terrain related parameters for topographical category II is [3]
m/s24ref =v , 19.0=β , 05.00 =z and m4min =z
Pär Tranvik, Göran AlpstenDynamic Behaviour under Wind Loading of a 90 m Steel Chimney – Section 3.2
40
The height correction factor ncorr for wind at height h2 but measured at height h1 above groundlevel will be
)()(
1mk
2mkcorr hv
hvn = ....................................................................................................................(3.3)
Table 3.2 a Exposure factor, wind mean velocity and height correction factor to 90 m heightfor some heights.
Height (m) Cexp vmk (m/s) ncorr
10 1.01 24.2 1.4145 1.67 31.0 1.1090 2.03 34.2 1.00
Wind data presented in this report have been corrected with the correction factor ncorr in Table3.2 a.
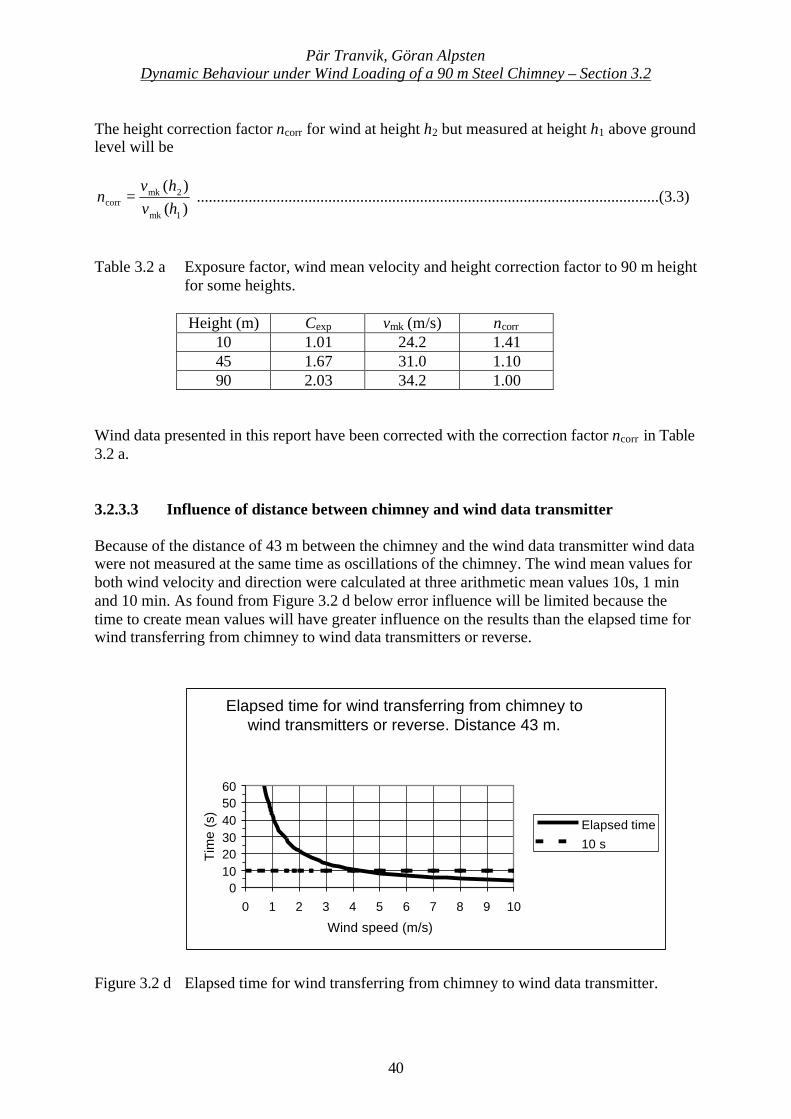
3.2.3.3 Influence of distance between chimney and wind data transmitter
Because of the distance of 43 m between the chimney and the wind data transmitter wind datawere not measured at the same time as oscillations of the chimney. The wind mean values forboth wind velocity and direction were calculated at three arithmetic mean values 10s, 1 minand 10 min. As found from Figure 3.2 d below error influence will be limited because thetime to create mean values will have greater influence on the results than the elapsed time forwind transferring from chimney to wind data transmitters or reverse.
Elapsed time for wind transferring from chimney to wind transmitters or reverse. Distance 43 m.
0102030405060
0 1 2 3 4 5 6 7 8 9 10
Wind speed (m/s)
Tim
e (s
)
Elapsed time
10 s
Figure 3.2 d Elapsed time for wind transferring from chimney to wind data transmitter.
Pär Tranvik, Göran AlpstenDynamic Behaviour under Wind Loading of a 90 m Steel Chimney – Section 3.2
41
Distance between chimney and transmitter is 43 m. Therefore, in this report no correction wasmade to account for the distance between chimney and wind data transmitter.
3.2.4 Recording computer
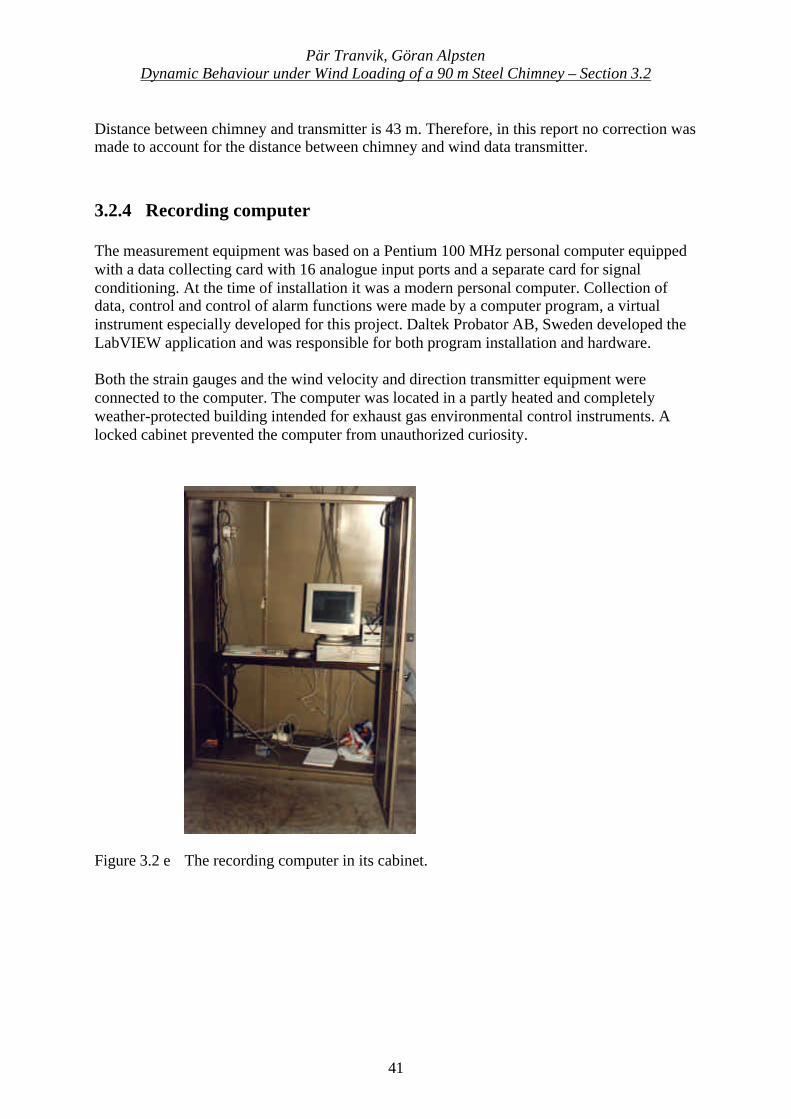
The measurement equipment was based on a Pentium 100 MHz personal computer equippedwith a data collecting card with 16 analogue input ports and a separate card for signalconditioning. At the time of installation it was a modern personal computer. Collection ofdata, control and control of alarm functions were made by a computer program, a virtualinstrument especially developed for this project. Daltek Probator AB, Sweden developed theLabVIEW application and was responsible for both program installation and hardware.
Both the strain gauges and the wind velocity and direction transmitter equipment wereconnected to the computer. The computer was located in a partly heated and completelyweather-protected building intended for exhaust gas environmental control instruments. Alocked cabinet prevented the computer from unauthorized curiosity.
Figure 3.2 e The recording computer in its cabinet.
Pär Tranvik, Göran AlpstenDynamic Behaviour under Wind Loading of a 90 m Steel Chimney – Section 3.2
42
Figure 3.2 f The recording computer.
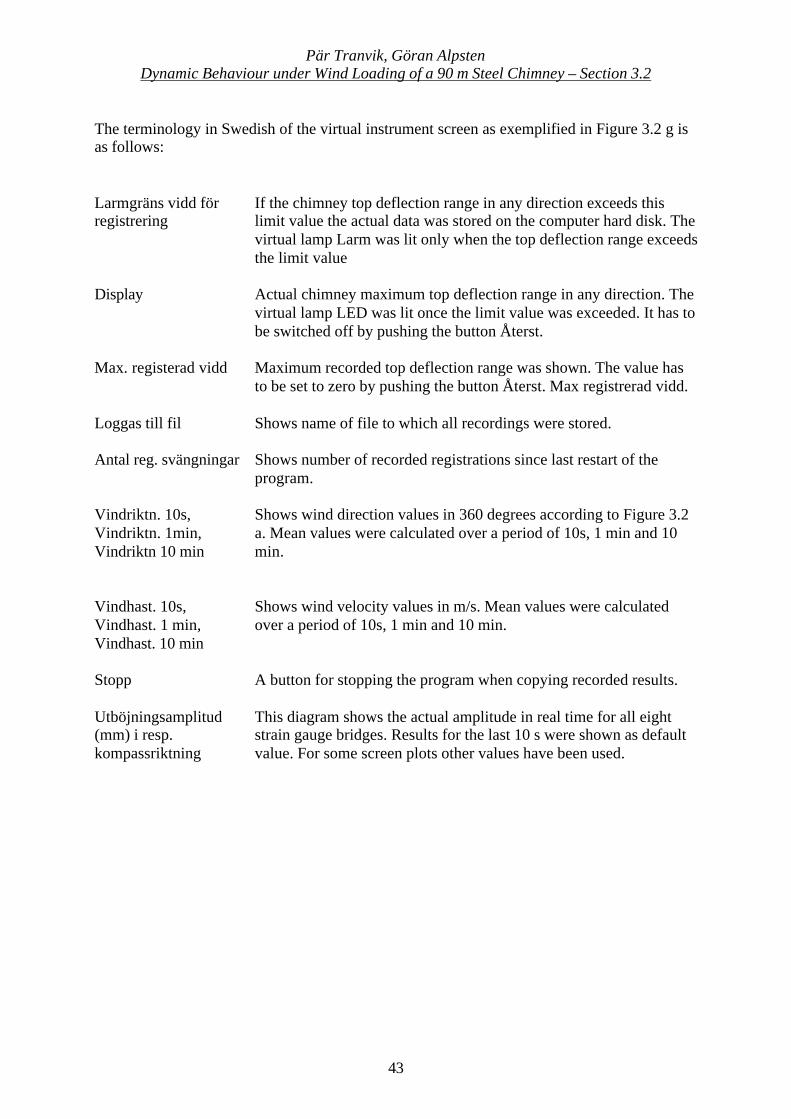
The measurement program collected data continuously and supervised eight signals from theeight strain gauge bridges and two signals from the wind data transmitter (velocity anddirection). On the computer screen a virtual instrument presented some output data. Anexample is shown in Figure 3.2 g.
Figure 3.2 g The virtual instrument for recording and supervising the chimney.
Pär Tranvik, Göran AlpstenDynamic Behaviour under Wind Loading of a 90 m Steel Chimney – Section 3.2
43
The terminology in Swedish of the virtual instrument screen as exemplified in Figure 3.2 g isas follows:
Larmgräns vidd förregistrering
If the chimney top deflection range in any direction exceeds thislimit value the actual data was stored on the computer hard disk. Thevirtual lamp Larm was lit only when the top deflection range exceedsthe limit value
Display Actual chimney maximum top deflection range in any direction. Thevirtual lamp LED was lit once the limit value was exceeded. It has tobe switched off by pushing the button Återst.
Max. registerad vidd Maximum recorded top deflection range was shown. The value hasto be set to zero by pushing the button Återst. Max registrerad vidd.
Loggas till fil Shows name of file to which all recordings were stored.
Antal reg. svängningar Shows number of recorded registrations since last restart of theprogram.
Vindriktn. 10s,Vindriktn. 1min,Vindriktn 10 min
Shows wind direction values in 360 degrees according to Figure 3.2a. Mean values were calculated over a period of 10s, 1 min and 10min.
Vindhast. 10s,Vindhast. 1 min,Vindhast. 10 min
Shows wind velocity values in m/s. Mean values were calculatedover a period of 10s, 1 min and 10 min.
Stopp A button for stopping the program when copying recorded results.
Utböjningsamplitud(mm) i resp.kompassriktning
This diagram shows the actual amplitude in real time for all eightstrain gauge bridges. Results for the last 10 s were shown as defaultvalue. For some screen plots other values have been used.
Pär Tranvik, Göran AlpstenDynamic Behaviour under Wind Loading of a 90 m Steel Chimney – Section 3.2
44
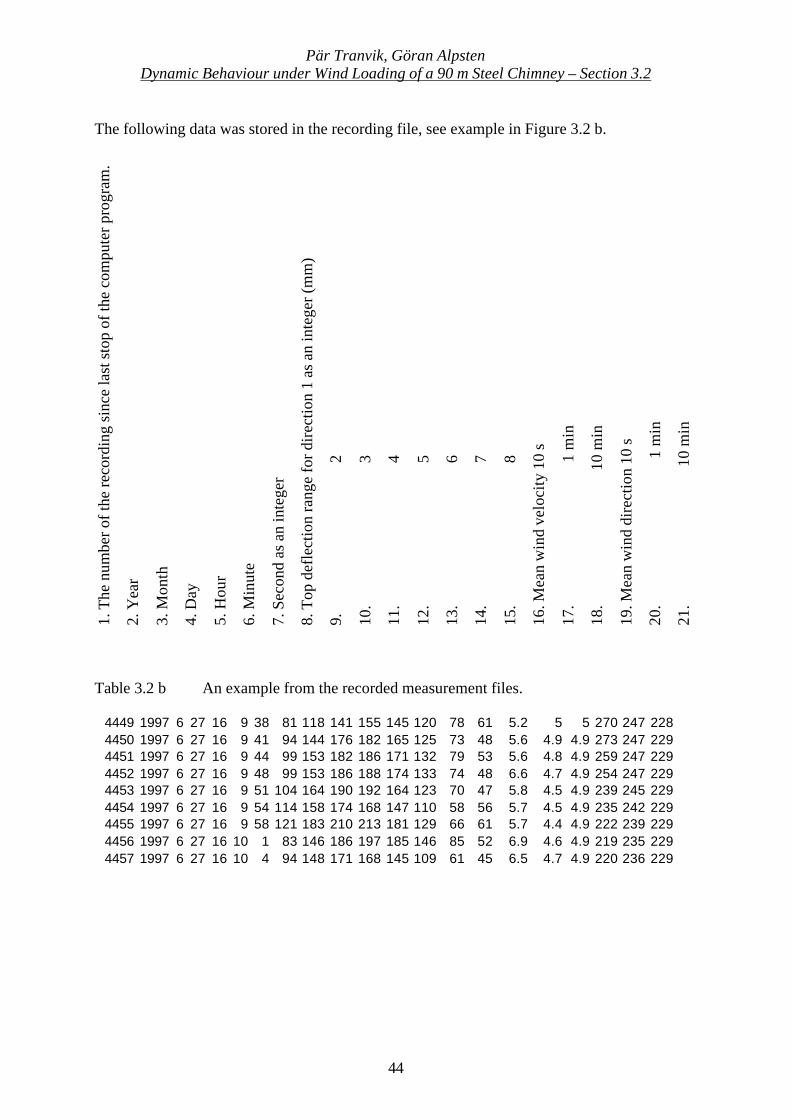
The following data was stored in the recording file, see example in Figure 3.2 b.
1. T
he n
umbe
r of t
he re
cord
ing
sinc
e la
st s
top
of th
e co
mpu
ter p
rogr
am.
2. Y
ear
3. M
onth
4. D
ay
5. H
our
6. M
inut
e
7. S
econ
d as
an
inte
ger
8. T
op d
efle
ctio
n ra
nge
for d
irec
tion
1 as
an
inte
ger (
mm
)
9.
2
10.
3
11.
4
12.
5
13.
6
14.
7
15.
8
16. M
ean
win
d ve
loci
ty 1
0 s
17.
1
min
18.
10
min
19. M
ean
win
d di
rect
ion
10 s
20.
1
min
21.
10
min
Table 3.2 b An example from the recorded measurement files.
4449 1997 6 27 16 9 38 81 118 141 155 145 120 78 61 5.2 5 5 270 247 2284450 1997 6 27 16 9 41 94 144 176 182 165 125 73 48 5.6 4.9 4.9 273 247 2294451 1997 6 27 16 9 44 99 153 182 186 171 132 79 53 5.6 4.8 4.9 259 247 2294452 1997 6 27 16 9 48 99 153 186 188 174 133 74 48 6.6 4.7 4.9 254 247 2294453 1997 6 27 16 9 51 104 164 190 192 164 123 70 47 5.8 4.5 4.9 239 245 2294454 1997 6 27 16 9 54 114 158 174 168 147 110 58 56 5.7 4.5 4.9 235 242 2294455 1997 6 27 16 9 58 121 183 210 213 181 129 66 61 5.7 4.4 4.9 222 239 2294456 1997 6 27 16 10 1 83 146 186 197 185 146 85 52 6.9 4.6 4.9 219 235 2294457 1997 6 27 16 10 4 94 148 171 168 145 109 61 45 6.5 4.7 4.9 220 236 229
Pär Tranvik, Göran AlpstenDynamic Behaviour under Wind Loading of a 90 m Steel Chimney – Section 3.2
45
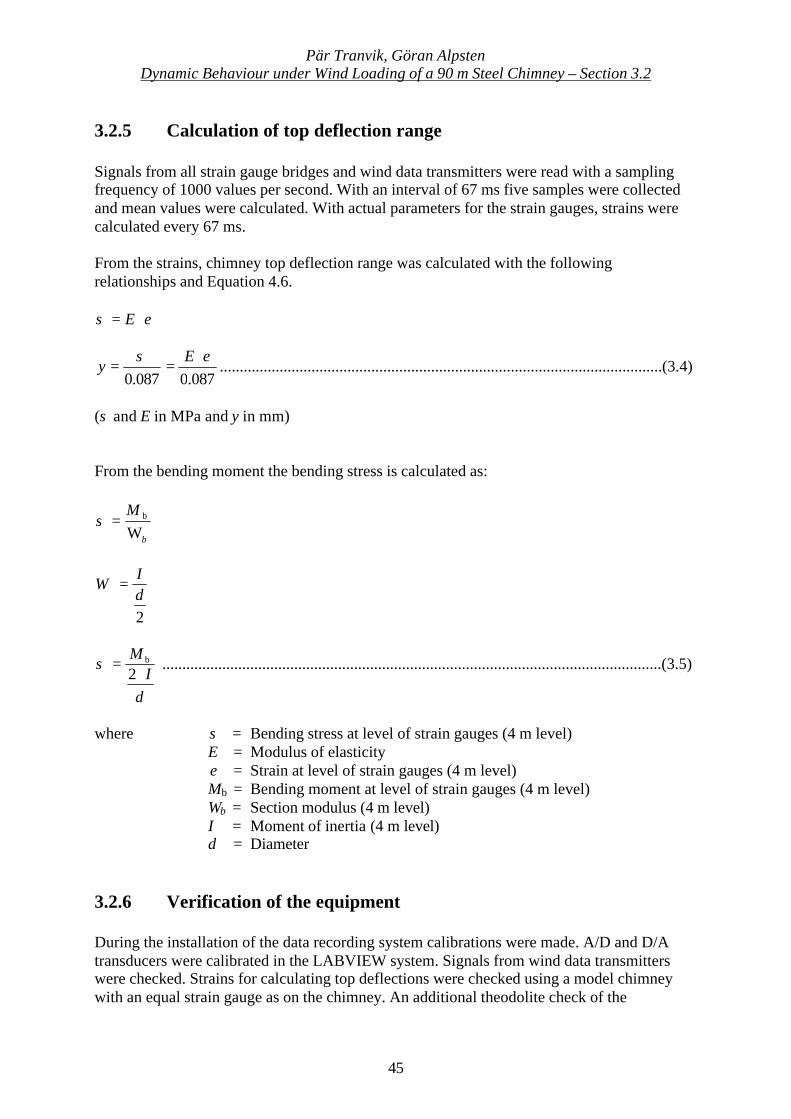
3.2.5 Calculation of top deflection range
Signals from all strain gauge bridges and wind data transmitters were read with a samplingfrequency of 1000 values per second. With an interval of 67 ms five samples were collectedand mean values were calculated. With actual parameters for the strain gauges, strains werecalculated every 67 ms.
From the strains, chimney top deflection range was calculated with the followingrelationships and Equation 4.6.
εσ ⋅= E
087.0087.0εσ ⋅
==E
y ...............................................................................................................(3.4)
(σ and E in MPa and y in mm)
From the bending moment the bending stress is calculated as:
b
MW
b=σ
2dI
W =
dI
M⋅
=2
bσ .............................................................................................................................(3.5)
where σ = Bending stress at level of strain gauges (4 m level)E = Modulus of elasticityε = Strain at level of strain gauges (4 m level)Mb = Bending moment at level of strain gauges (4 m level)Wb = Section modulus (4 m level)I = Moment of inertia (4 m level)d = Diameter
3.2.6 Verification of the equipment
During the installation of the data recording system calibrations were made. A/D and D/Atransducers were calibrated in the LABVIEW system. Signals from wind data transmitterswere checked. Strains for calculating top deflections were checked using a model chimneywith an equal strain gauge as on the chimney. An additional theodolite check of the
Pär Tranvik, Göran AlpstenDynamic Behaviour under Wind Loading of a 90 m Steel Chimney – Section 3.2
46
deflections to those obtained from the strain gauges was made during the damping tests inAugust 1997 (see Section 3.3.1). Both deflection range and frequency were checked andcompared with computer results.
3.2.7 Procedures
A limit value for recording the results was set to 100 mm equivalent top deflection range toensure a reasonable amount of recorded data. This means that all results where the maximumrange was less than 100 mm were truncated except during the damping tests.
During the first months the computer was checked twice a week. Later the interval wasincreased to once a week, twice a month and finally once a month. All data results were thentransferred to another computer where the evaluations were made. Maximum values werechecked and the evaluation computer programs were run (Appendix H). The results weresorted and fatigue damage was calculated.
3.2.8 Operating experiences
The strain gauge equipment started to operate in December 1996 and operated without anyproblem until January 2000. Two of the strain gauges, no 1 and 3, then started to presentunrealistic values and almost immediately became short-circuited. A decision wasimmediately taken that all strain gauges should be replaced with new ones and that a long-term glue should be used. Fortunately the strain gauge no 4, which was unharmed, had giventhe largest ranges for the first three years of measurements. Therefore the data recordingsystem could operate satisfactory and deliver trustworthy recordings with only a short breakfor the installation of the new strain gauges.
During the recording period there were also some small interruptions in recording of datacaused by short interruption of the plant electricity. Other interruptions were some minuteseach time when the recorded data was transferred from the recording computer to datadiskettes. The recording program was always shut off on such occasions.
The recording system has been in operation 99.8 percent of the time during the measurementyears.
During the month of July in 1998 the “Larmgräns vidd för registrering” (see section 3.2.4) bya mistake was set to 200 mm instead of the intended value 100 mm. Therefore ranges below200 mm were truncated that month. There was no correction made for this.
Unfortunately the strain gauges were damaged in the spring of 2001 (see Section 6.6).
Pär Tranvik, Göran AlpstenDynamic Behaviour under Wind Loading of a 90 m Steel Chimney – Section 3.3
47
3.3 Behaviour of the mechanical damper
3.3.1 Observation of behaviour of chimney with and without damper
3.3.1.1 Introduction
Tests were performed to determine the damping properties of the VEAB chimney, that is, thelogarithmic decrement of the chimney with the mechanical damper. The chimney was initiallyforced to deflect and the resulting free sway of the chimney was recorded. Comparison testswere also made for the chimney with the mechanical damper in a locked position.
The damping test was repeated a number of times in order to get a good mean value of thelogarithmic decrement, and to get some understanding of the variability in the measurements.
The damping tests were made in August 1997 in fairly calm weather. The wind was below 6 m/s(10-minute mean) during all tests performed. The test instances were selected in order to avoidinfluence of aerodynamic damping from gust wind during the damping tests.
3.3.1.2 Setup for Damping tests
A 20 mm nylon rope was attached to the top of the chimney and connected to a wheel loaderlocated approximately 150 m away from the chimney in southward direction. The wheel loaderpulled the rope until a desired deflection was obtained. Using a mechanical device the rope wasabruptly disconnected close to the wheel loader and the chimney started to oscillate freely. Acatch rope was connected to the pulling rope in order to prevent the rope from swayinguncontrolled. The setup for damping measurements is shown in Figure 3.3 a and 3.3 b.
Figure 3.3 a Setup of damping measurements for VEAB chimney – view
Pär Tranvik, Göran AlpstenDynamic Behaviour under Wind Loading of a 90 m Steel Chimney – Section 3.3
48
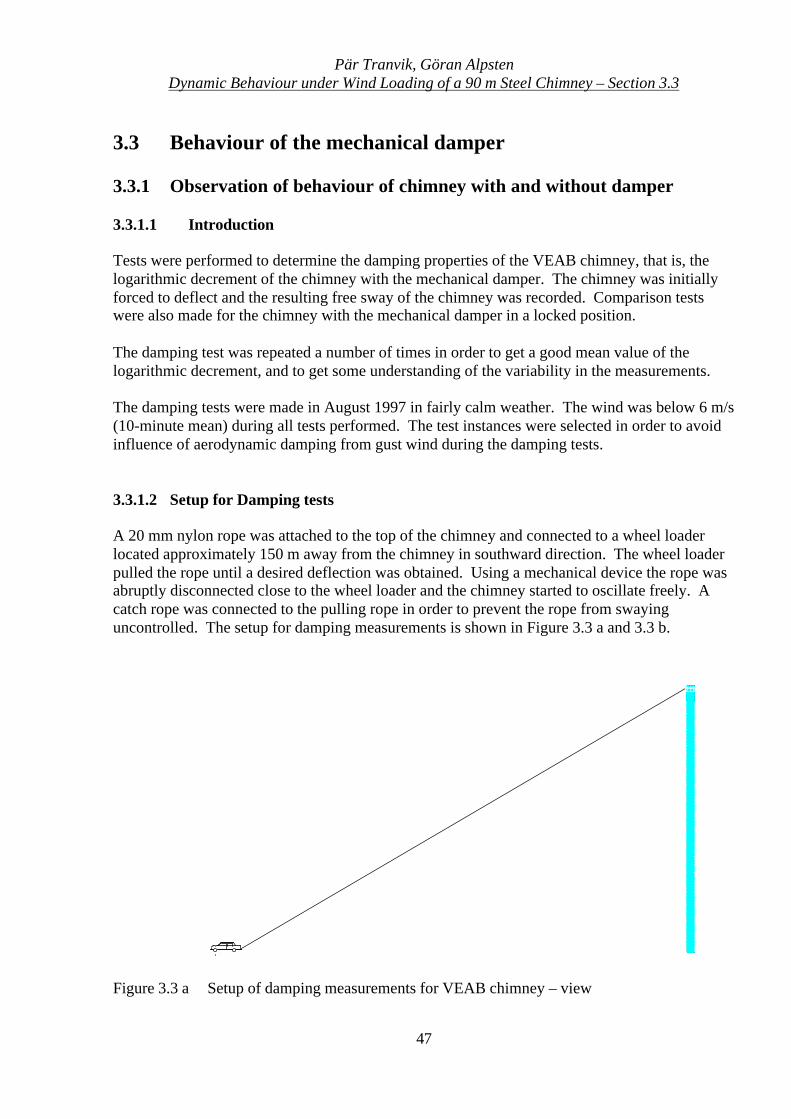
Figure 3.3 b Setup of damping measurements for VEAB chimney - plan
The top of the chimney was forced to deflect a maximum distance of 200 mm for a freemechanical damper and 100 mm for the chimney the comparison test with locked damper. Thislimit was used in order to secure that the damping device would not be harmed in any way. Thenormal recording program to determine oscillations from wind and other actions was in effectduring the damping tests.
Deflections at the top of the chimney were calculated from recordings of the strain gaugesattached to the chimney (see Section 3.2), which had been calibrated to the top deflections.Deflections of the chimney were checked also using a theodolite. These visual observationsshowed good agreement with the recordings obtained from the strain gauges.
Similar measurements of damping of other slender structures have been reported in the literature,see for instance [2].
During the course of the damping measurements the wind velocity and direction were recordedusing the wind indicator located on the top of the adjacent power plant building at 45 m heightabove ground and at a distance of approximately 43 m from the chimney (see Section 3.2.3.1).The wind velocity during the damping tests was very low, and in no instances exceeded 6 m/s(10-minute mean) or 8 m/s (10 s mean). The wind direction was approximately the same as thepulling direction in the damping tests.
3.3.1.3 Recordings
A total number of 20 tests were performed to verify the damping of the chimney. Tests # 1through 16 refer to the chimney with the mechanical damper acting in normal operation. Tests #17 through 20 refer to the chimney with a locked damper.
Pullingdirection
Building
Building
N
BuildingChimney
Pär Tranvik, Göran AlpstenDynamic Behaviour under Wind Loading of a 90 m Steel Chimney – Section 3.3
49
The data was collected using strain gauge readings and the recording computer describedpreviously (se Section 3.2).
It should be observed that recordings refer to variations in actions, in this case deflection rangerather than the deflection itself. This is because the recording system was designed to verifyperformance of the chimney with respect to fatigue, where variation of stress, that is, stressrange, is of utmost importance. Where required, deflection itself has been evaluated from thedeflection-range data, as discussed below.
Some examples of screen plots showing the parts of the oscillation behaviour during the dampingtests are shown in Figures 3.3 c, 3.3 d and 3.3 e.
The recorded natural frequency (first mode) of the chimney with the mechanical damper innormal operation was 0.253 Hz. For the chimney with locked damper the recorded naturalfrequency was 0.258 Hz.
The natural frequency obtained from the damping tests differ by 10 percent from the naturalfrequency calculated theoretically for the chimney considering the actual distribution of stiffnessand mass along the chimney, see Section 2.4.1 and from that measured 0.288 Hz, see Section3.7.2.
One explanation could be that the first cycles of time history for the two mass damped systemshave an irregular behaviour. This explanation is supported by the irregular curve for the firstcycles as shown in the screen plots in Figures 3.3 c, 3.3 d, 3.3 e and in Appendix C.
Another explanation could be that the damper may have been tuned by the manufacturer of thechimney during the days of damping tests. A definite explanation for this discrepancy has notbeen found. Thus natural frequency was about the same with and without an acting damper.
All recordings from the damping tests have been collected in Appendix C. A data file withresults from the recording program is shown in tables. Some explanations and support lines havebeen included there to facilitate the interpretation of the data.
In Appendix C is also plotted the Deflection Range (that is, twice the deflection) as a function ofthe order of the oscillation cycle.
Furthermore, in Appendix C is shown a screen plot of the virtual recording instrument for alldamping tests. In evaluating the results it should be observed that the recording limit of 100 mmmeans that a few cycles at the end of the course of sway action may not be registered.
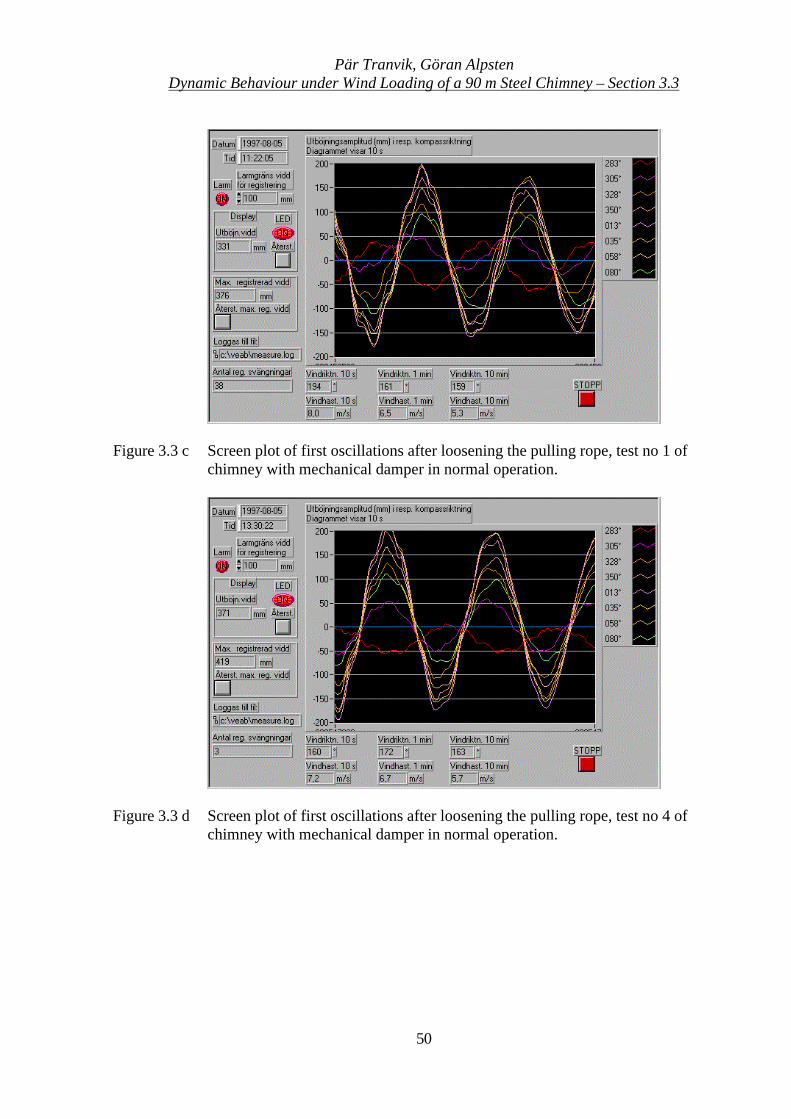
Pär Tranvik, Göran AlpstenDynamic Behaviour under Wind Loading of a 90 m Steel Chimney – Section 3.3
50
Figure 3.3 c Screen plot of first oscillations after loosening the pulling rope, test no 1 ofchimney with mechanical damper in normal operation.
Figure 3.3 d Screen plot of first oscillations after loosening the pulling rope, test no 4 ofchimney with mechanical damper in normal operation.
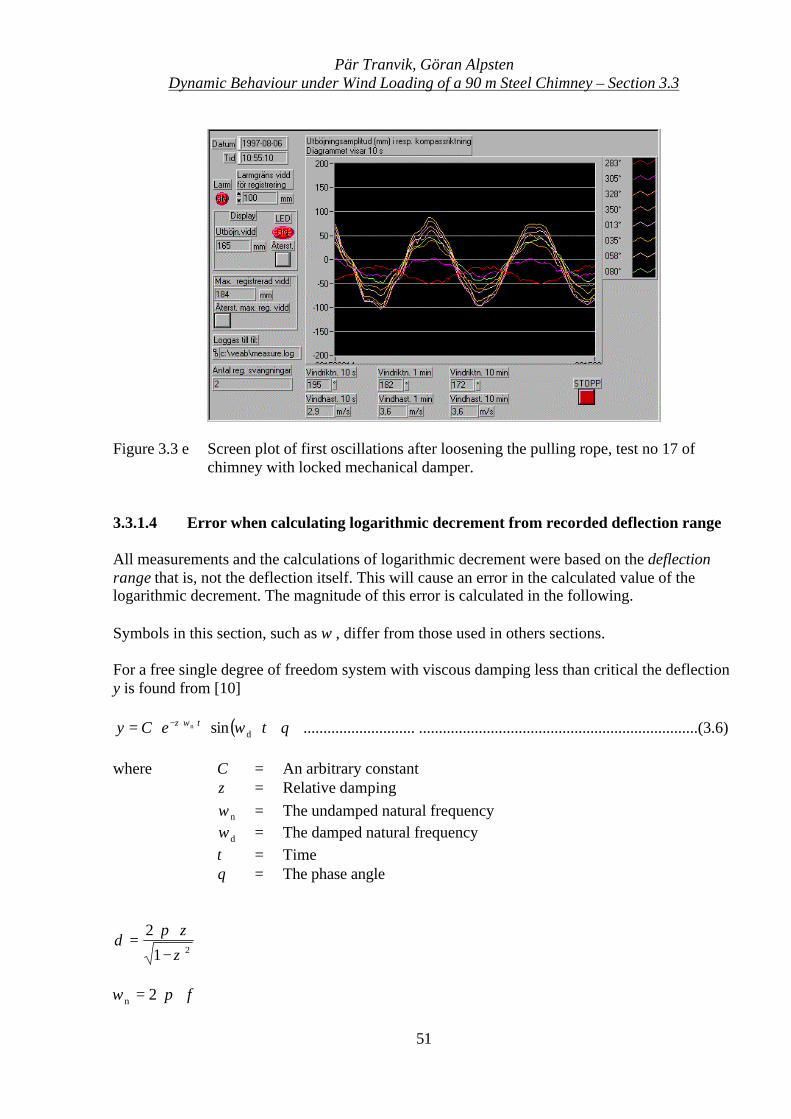
Pär Tranvik, Göran AlpstenDynamic Behaviour under Wind Loading of a 90 m Steel Chimney – Section 3.3
51
Figure 3.3 e Screen plot of first oscillations after loosening the pulling rope, test no 17 ofchimney with locked mechanical damper.
3.3.1.4 Error when calculating logarithmic decrement from recorded deflection range
All measurements and the calculations of logarithmic decrement were based on the deflectionrange that is, not the deflection itself. This will cause an error in the calculated value of thelogarithmic decrement. The magnitude of this error is calculated in the following.
Symbols in this section, such as ω , differ from those used in others sections.
For a free single degree of freedom system with viscous damping less than critical the deflectiony is found from [10]
( )θωωζ +⋅⋅⋅= ⋅⋅− teCy tdsinn ............................ ......................................................................(3.6)
where C = An arbitrary constantζ = Relative damping
nω = The undamped natural frequency
dω = The damped natural frequencyt = Timeθ = The phase angle
21
2
ζ
ζπδ
−
⋅⋅=
f⋅⋅= πω 2n
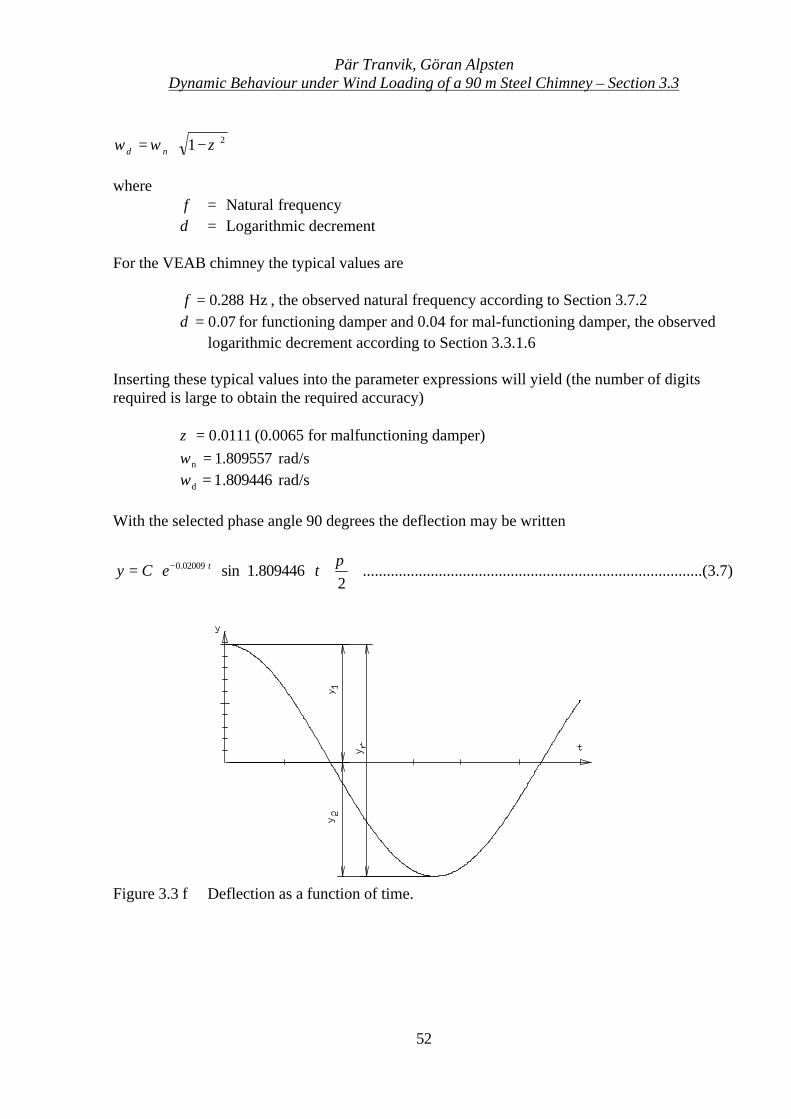
Pär Tranvik, Göran AlpstenDynamic Behaviour under Wind Loading of a 90 m Steel Chimney – Section 3.3
52
21 ζωω −⋅= nd
wheref = Natural frequencyδ = Logarithmic decrement
For the VEAB chimney the typical values are
Hz288.0=f , the observed natural frequency according to Section 3.7.207.0=δ for functioning damper and 0.04 for mal-functioning damper, the observed
logarithmic decrement according to Section 3.3.1.6
Inserting these typical values into the parameter expressions will yield (the number of digitsrequired is large to obtain the required accuracy)
0111.0=ζ (0.0065 for malfunctioning damper)rad/s809557.1n =ωrad/s809446.1d =ω
With the selected phase angle 90 degrees the deflection may be written
+⋅⋅⋅= ⋅−
2809446.1sin02009.0 π
teCy t .....................................................................................(3.7)
Figure 3.3 f Deflection as a function of time.
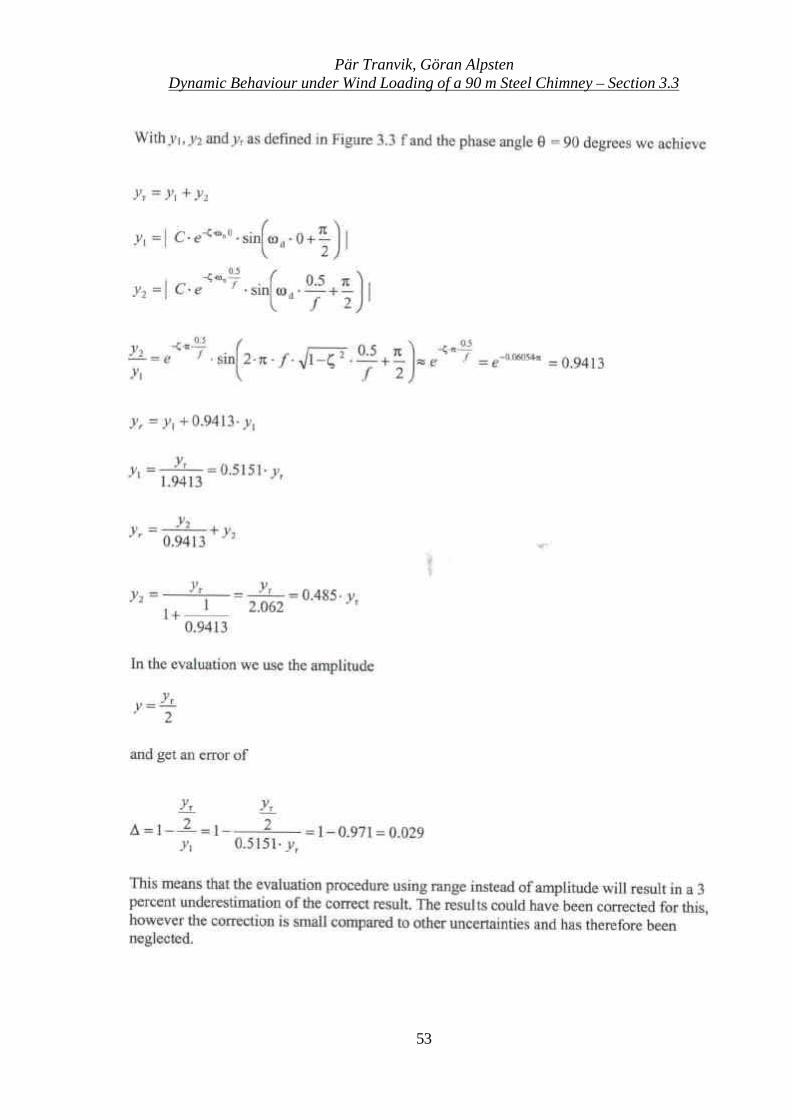
Pär Tranvik, Göran AlpstenDynamic Behaviour under Wind Loading of a 90 m Steel Chimney – Section 3.3
53
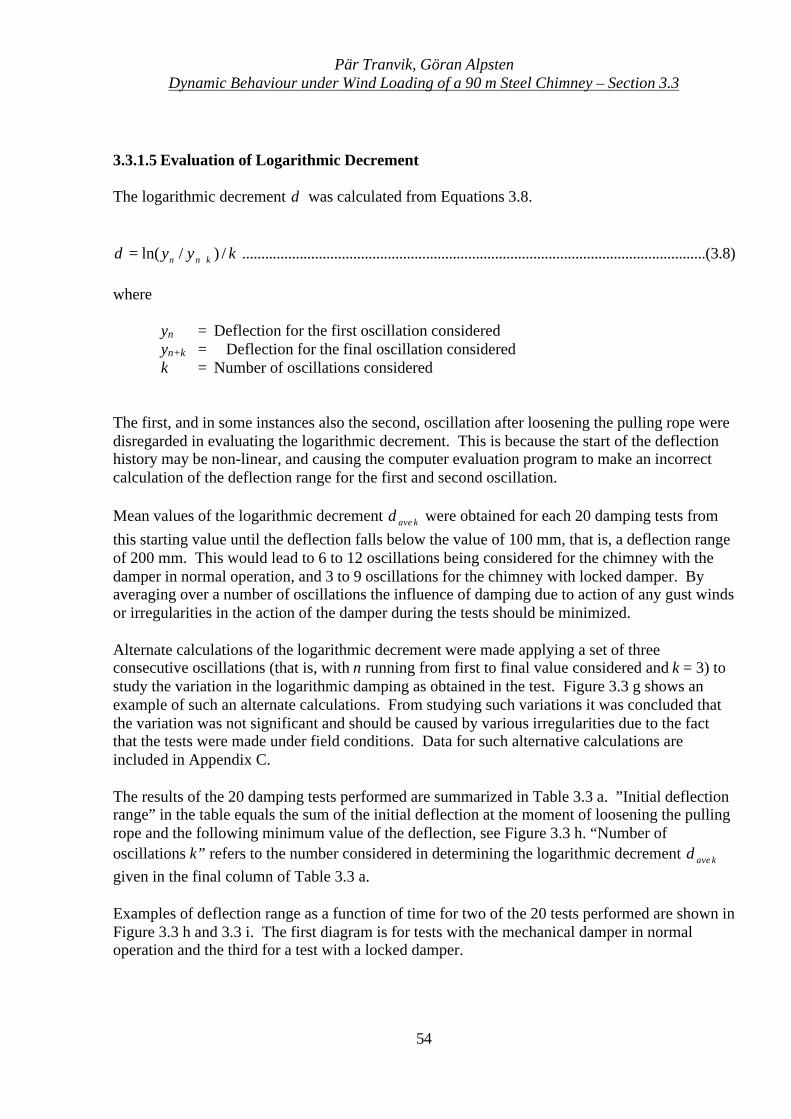
Pär Tranvik, Göran AlpstenDynamic Behaviour under Wind Loading of a 90 m Steel Chimney – Section 3.3
54
3.3.1.5 Evaluation of Logarithmic Decrement
The logarithmic decrement δ was calculated from Equations 3.8.
kyy knn /)/ln( +=δ .........................................................................................................................(3.8)
where
yn = Deflection for the first oscillation consideredyn+k = Deflection for the final oscillation consideredk = Number of oscillations considered
The first, and in some instances also the second, oscillation after loosening the pulling rope weredisregarded in evaluating the logarithmic decrement. This is because the start of the deflectionhistory may be non-linear, and causing the computer evaluation program to make an incorrectcalculation of the deflection range for the first and second oscillation.
Mean values of the logarithmic decrement kaveδ were obtained for each 20 damping tests fromthis starting value until the deflection falls below the value of 100 mm, that is, a deflection rangeof 200 mm. This would lead to 6 to 12 oscillations being considered for the chimney with thedamper in normal operation, and 3 to 9 oscillations for the chimney with locked damper. Byaveraging over a number of oscillations the influence of damping due to action of any gust windsor irregularities in the action of the damper during the tests should be minimized.
Alternate calculations of the logarithmic decrement were made applying a set of threeconsecutive oscillations (that is, with n running from first to final value considered and k = 3) tostudy the variation in the logarithmic damping as obtained in the test. Figure 3.3 g shows anexample of such an alternate calculations. From studying such variations it was concluded thatthe variation was not significant and should be caused by various irregularities due to the factthat the tests were made under field conditions. Data for such alternative calculations areincluded in Appendix C.
The results of the 20 damping tests performed are summarized in Table 3.3 a. ”Initial deflectionrange” in the table equals the sum of the initial deflection at the moment of loosening the pullingrope and the following minimum value of the deflection, see Figure 3.3 h. “Number ofoscillations k” refers to the number considered in determining the logarithmic decrement kaveδgiven in the final column of Table 3.3 a.
Examples of deflection range as a function of time for two of the 20 tests performed are shown inFigure 3.3 h and 3.3 i. The first diagram is for tests with the mechanical damper in normaloperation and the third for a test with a locked damper.
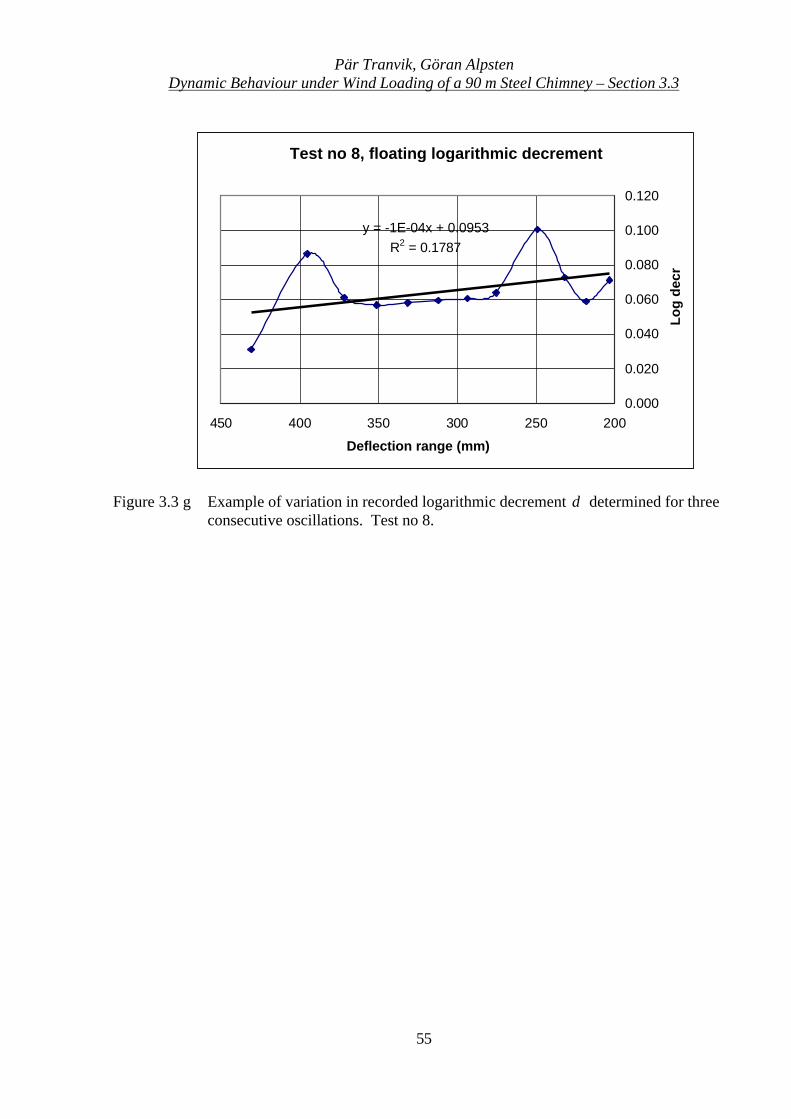
Pär Tranvik, Göran AlpstenDynamic Behaviour under Wind Loading of a 90 m Steel Chimney – Section 3.3
55
Figure 3.3 g Example of variation in recorded logarithmic decrement δ determined for threeconsecutive oscillations. Test no 8.
Test no 8, floating logarithmic decrement
y = -1E-04x + 0.0953R2 = 0.1787
0.000
0.020
0.040
0.060
0.080
0.100
0.120
200250300350400450
Deflection range (mm)
Lo
g d
ecr
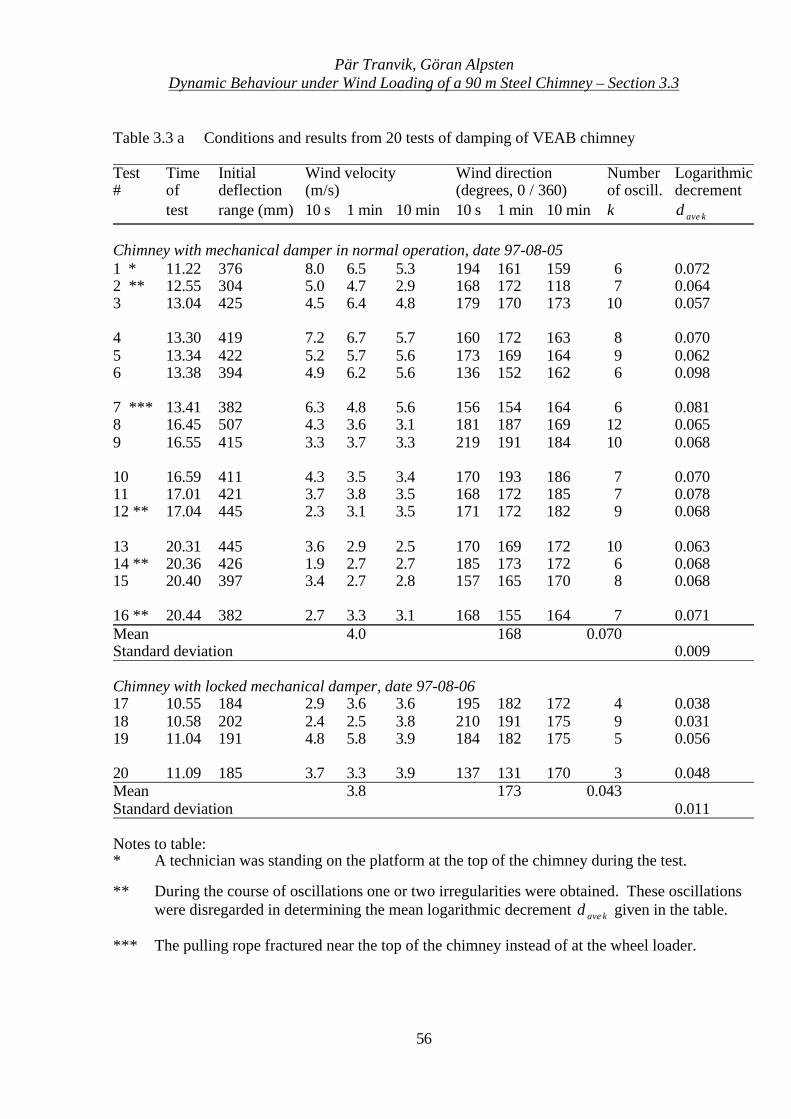
Pär Tranvik, Göran AlpstenDynamic Behaviour under Wind Loading of a 90 m Steel Chimney – Section 3.3
56
Table 3.3 a Conditions and results from 20 tests of damping of VEAB chimney
Test Time Initial Wind velocity Wind direction Number Logarithmic# of deflection (m/s) (degrees, 0 / 360) of oscill. decrement
test range (mm) 10 s 1 min 10 min 10 s 1 min 10 min k kaveδ
Chimney with mechanical damper in normal operation, date 97-08-051 * 11.22 376 8.0 6.5 5.3 194 161 159 6 0.0722 ** 12.55 304 5.0 4.7 2.9 168 172 118 7 0.0643 13.04 425 4.5 6.4 4.8 179 170 173 10 0.057
4 13.30 419 7.2 6.7 5.7 160 172 163 8 0.0705 13.34 422 5.2 5.7 5.6 173 169 164 9 0.0626 13.38 394 4.9 6.2 5.6 136 152 162 6 0.098
7 *** 13.41 382 6.3 4.8 5.6 156 154 164 6 0.0818 16.45 507 4.3 3.6 3.1 181 187 169 12 0.0659 16.55 415 3.3 3.7 3.3 219 191 184 10 0.068
10 16.59 411 4.3 3.5 3.4 170 193 186 7 0.07011 17.01 421 3.7 3.8 3.5 168 172 185 7 0.07812 ** 17.04 445 2.3 3.1 3.5 171 172 182 9 0.068
13 20.31 445 3.6 2.9 2.5 170 169 172 10 0.06314 ** 20.36 426 1.9 2.7 2.7 185 173 172 6 0.06815 20.40 397 3.4 2.7 2.8 157 165 170 8 0.068
16 ** 20.44 382 2.7 3.3 3.1 168 155 164 7 0.071Mean 4.0 168 0.070Standard deviation 0.009
Chimney with locked mechanical damper, date 97-08-0617 10.55 184 2.9 3.6 3.6 195 182 172 4 0.03818 10.58 202 2.4 2.5 3.8 210 191 175 9 0.03119 11.04 191 4.8 5.8 3.9 184 182 175 5 0.056
20 11.09 185 3.7 3.3 3.9 137 131 170 3 0.048Mean 3.8 173 0.043Standard deviation 0.011
Notes to table:* A technician was standing on the platform at the top of the chimney during the test.
** During the course of oscillations one or two irregularities were obtained. These oscillationswere disregarded in determining the mean logarithmic decrement kaveδ given in the table.
*** The pulling rope fractured near the top of the chimney instead of at the wheel loader.
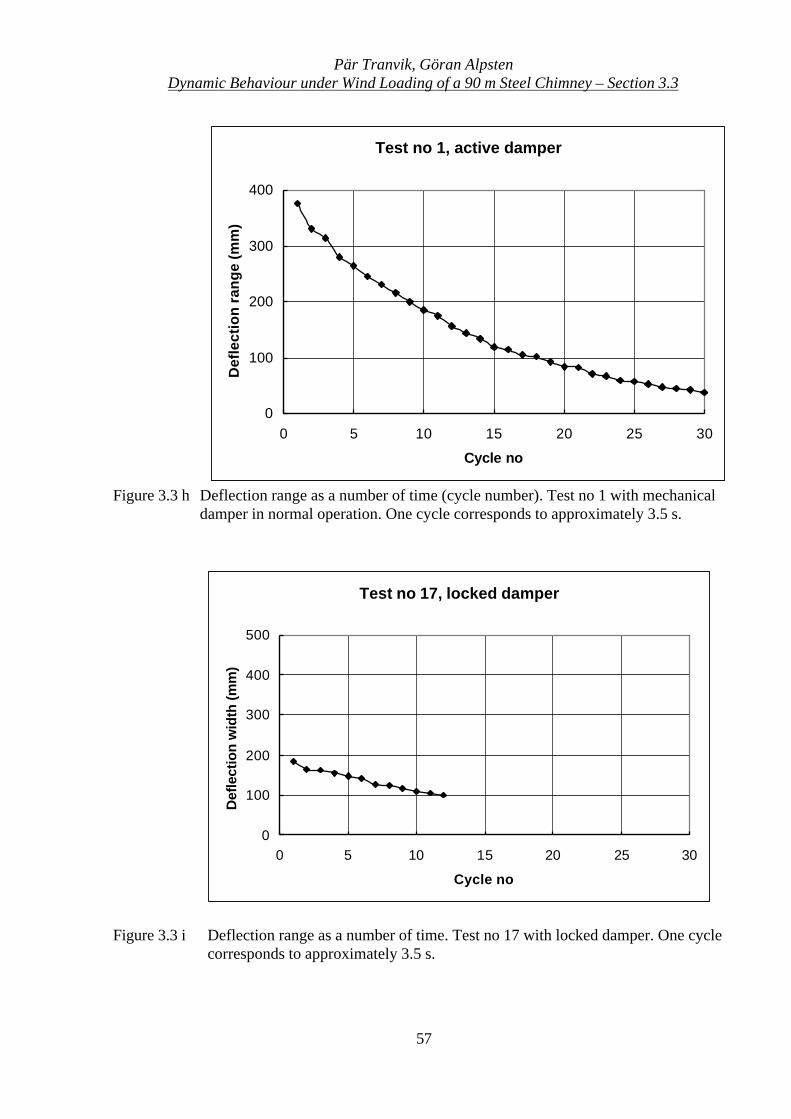
Pär Tranvik, Göran AlpstenDynamic Behaviour under Wind Loading of a 90 m Steel Chimney – Section 3.3
57
Figure 3.3 h Deflection range as a number of time (cycle number). Test no 1 with mechanicaldamper in normal operation. One cycle corresponds to approximately 3.5 s.
Figure 3.3 i Deflection range as a number of time. Test no 17 with locked damper. One cyclecorresponds to approximately 3.5 s.
Test no 1, active damper
0
100
200
300
400
0 5 10 15 20 25 30
Cycle no
Def
lect
ion
ran
ge
(mm
)
Test no 17, locked damper
0
100
200
300
400
500
0 5 10 15 20 25 30
Cycle no
Def
lect
ion
wid
th (m
m)
Pär Tranvik, Göran AlpstenDynamic Behaviour under Wind Loading of a 90 m Steel Chimney – Section 3.3
58
Further examples are found in Appendix C.
The recorded damping expressed as logarithmic decrement δ consists of three parts:
dma δδδδ ++= ............................................................................................................................ (3.9)
where
=aδ aerodynamic damping=mδ mechanical damping of the chimney, without damper=dδ mechanical damping of the damper
The mean recorded logarithmic decrement for the chimney with the mechanical damper innormal operation is 0.070. The logarithmic decrement in the 16 tests performed varies from0.057 to 0.098.
The mean recorded logarithmic decrement for the chimney with a locked damper is 0.043. Thelogarithmic decrement variation in the four tests performed varies from 0.031 to 0.056.
Thus, the recorded logarithmic decrement of the chimney with the mechanical damper in normaloperation was 63 percent higher than for the chimney with a locked damper. This beneficialeffect was smaller than could be expected, considering the fact that a theoretical study performedby the supplier of the chimney claimed a tenfold increase in the logarithmic decrement whenadding the mechanical damper to the chimney. The probable cause for this is discussed inSection 3.3.2.5.
3.3.1.6 Discussion of results
The recorded logarithmic decrement δ =0.043 is somewhat higher than the range 0.02 to 0.03, tobe used for design of normal steel chimneys with installations, such as internal ducts, ladder etc.as given in [3], [5]. This increase in damping may at least partly be caused by some beneficialaction from the mechanical damper, although it was locked to minimise such action and fromeffective damping of non-structural elements.
The mechanical damper will increase the mean value of the logarithmic decrement of thechimney δ =0.07 over the normal upper design value of 0.03 [3], [5] by a factor of 2.3.
The relatively large variation in the logarithmic decrement obtained in the repeated tests,expressed as a standard deviation of about 0.01, could be due to at least three reasons, listed herein the order of estimated importance:
1) Accidental variations in the action of the mechanical damper

Pär Tranvik, Göran AlpstenDynamic Behaviour under Wind Loading of a 90 m Steel Chimney – Section 3.3
59
2) Disturbances from variations in environmental conditions, mainly aerodynamic dampingdue to variations in wind velocity and wind direction, due to the fact that these tests weremade under field conditions
3) Inaccuracies in the recording system.
The recorded logarithmic decrement of the VEAB chimney, with the mechanical damper innormal operation, agrees well with the damping assumed in the design calculations prepared bythe chimney supplier, but was considerably smaller than could be expected from a theoreticalstudy.
In [11] a full scale damping test for a 45 m chimney with a tuned damper was made. As in ourdamping tests the damper was both locked and unlocked. The logarithmic decrement was foundto be 0.019 with locked damper and 0.5 to 0.6 with unlocked damper. Compared to the VEABchimney the damping arrangement as reported in [11] appears much more efficient.
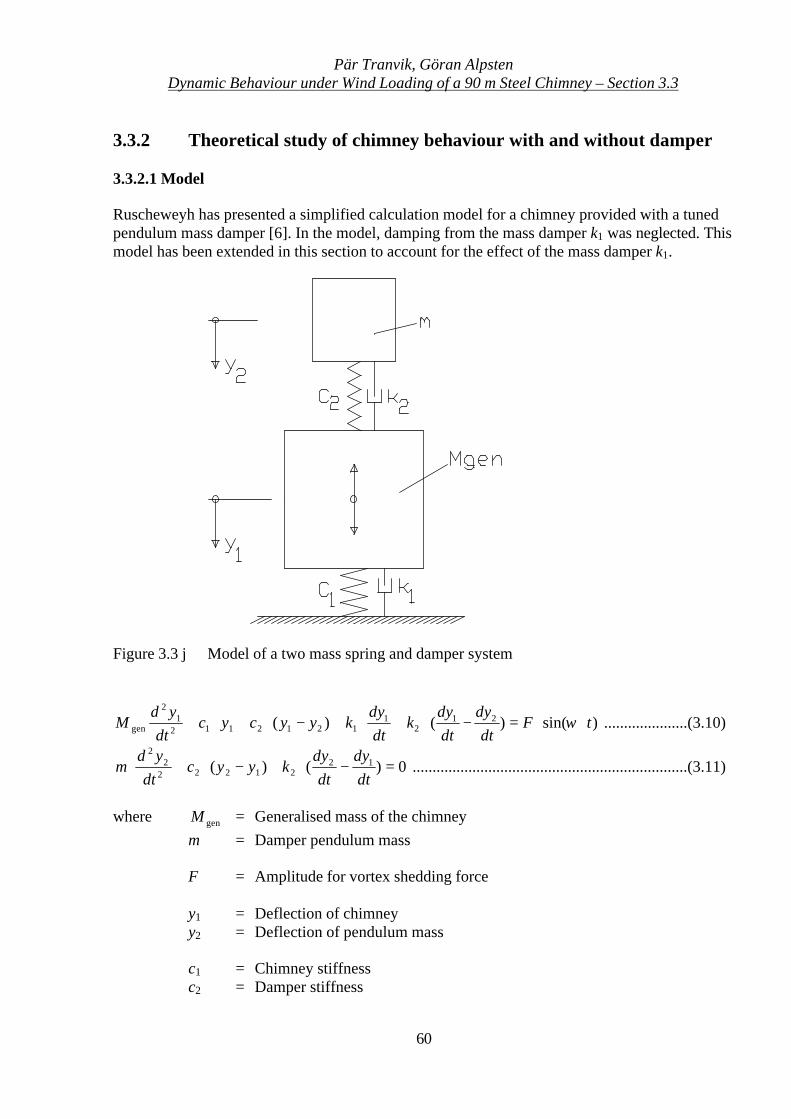
Pär Tranvik, Göran AlpstenDynamic Behaviour under Wind Loading of a 90 m Steel Chimney – Section 3.3
60
3.3.2 Theoretical study of chimney behaviour with and without damper
3.3.2.1 Model
Ruscheweyh has presented a simplified calculation model for a chimney provided with a tunedpendulum mass damper [6]. In the model, damping from the mass damper k1 was neglected. Thismodel has been extended in this section to account for the effect of the mass damper k1.
Figure 3.3 j Model of a two mass spring and damper system
)sin()()( 212
11212112
12
gen tFdt
dydtdy
kdtdy
kyycycdt
ydM ⋅⋅=−⋅+⋅+−⋅+⋅+ ω .....................(3.10)
0)()( 1221222
22
=−⋅+−⋅+⋅dtdy
dtdy
kyycdt
ydm .....................................................................(3.11)
where genM = Generalised mass of the chimneym = Damper pendulum mass
F = Amplitude for vortex shedding force
y1 = Deflection of chimneyy2 = Deflection of pendulum mass
c1 = Chimney stiffnessc2 = Damper stiffness
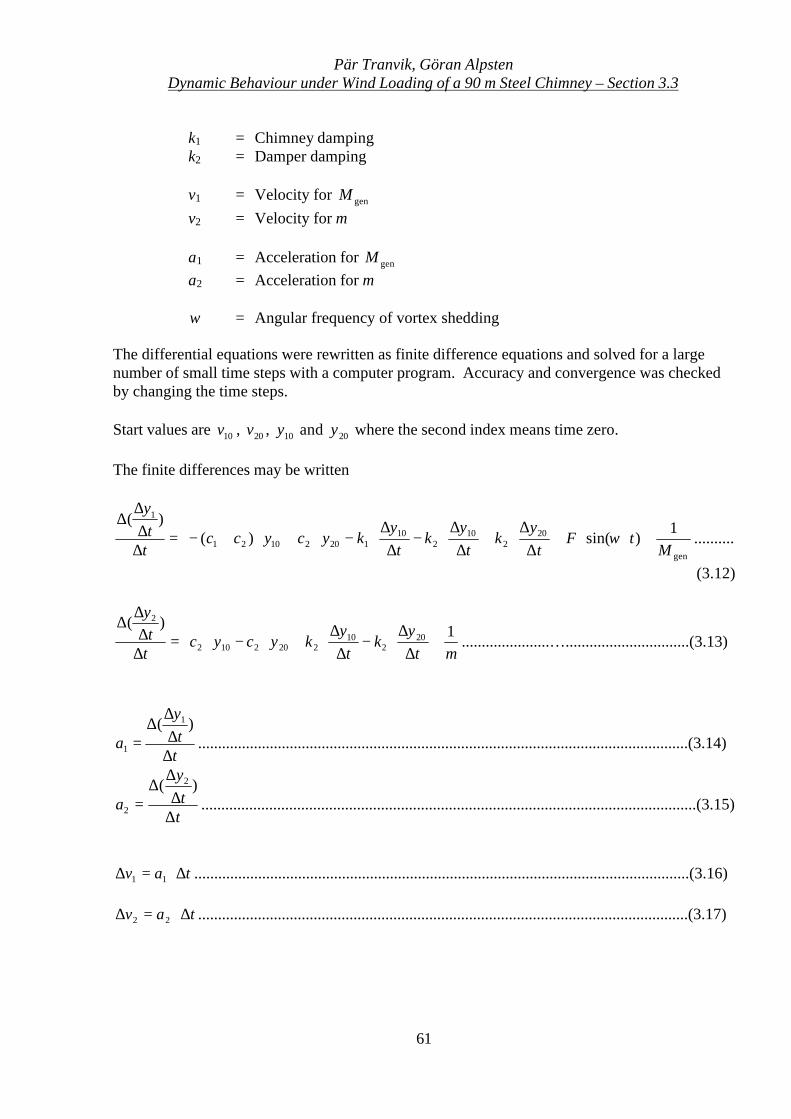
Pär Tranvik, Göran AlpstenDynamic Behaviour under Wind Loading of a 90 m Steel Chimney – Section 3.3
61
k1 = Chimney dampingk2 = Damper damping
v1 = Velocity for genMv2 = Velocity for m
a1 = Acceleration for genMa2 = Acceleration for m
ω = Angular frequency of vortex shedding
The differential equations were rewritten as finite difference equations and solved for a largenumber of small time steps with a computer program. Accuracy and convergence was checkedby changing the time steps.
Start values are 10v , 20v , 10y and 20y where the second index means time zero.
The finite differences may be written
gen
202
102
1012021021
1
1)sin()(
)(
MtF
ty
kt
yk
ty
kycycctty
⋅
⋅⋅+
∆∆
⋅+∆
∆⋅−
∆∆
⋅−⋅+⋅+−=∆∆∆
∆ω ..........
(3.12)
mty
kt
ykycyc
tt
y1)(
202
102202102
2
⋅
∆∆
⋅−∆
∆⋅+⋅−⋅=
∆∆
∆∆
......................…...............................(3.13)
tty
a∆∆∆
∆=
)( 1
1 ...........................................................................................................................(3.14)
tt
y
a∆∆
∆∆
=)( 2
2 ............................................................................................................................(3.15)
tav ∆⋅=∆ 11 ............................................................................................................................(3.16)
tav ∆⋅=∆ 22 ...........................................................................................................................(3.17)
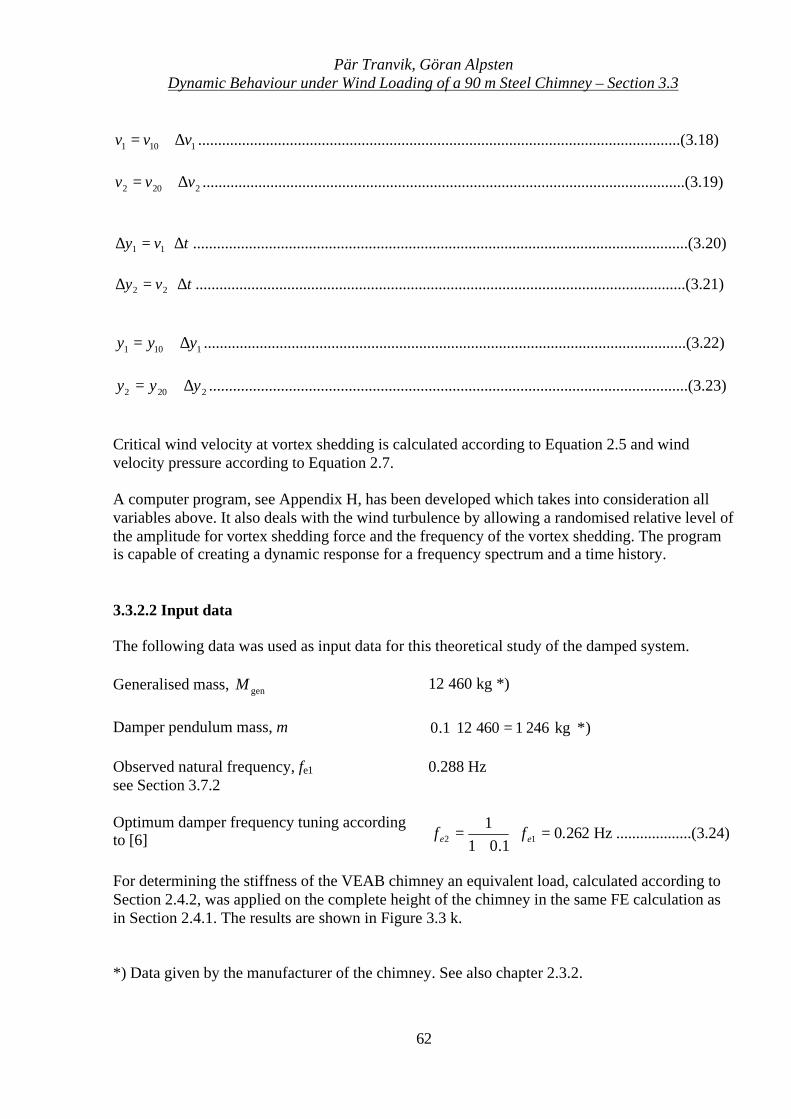
Pär Tranvik, Göran AlpstenDynamic Behaviour under Wind Loading of a 90 m Steel Chimney – Section 3.3
62
1101 vvv ∆+= .........................................................................................................................(3.18)
2202 vvv ∆+= .........................................................................................................................(3.19)
tvy ∆⋅=∆ 11 ............................................................................................................................(3.20)
tvy ∆⋅=∆ 22 ...........................................................................................................................(3.21)
1101 yyy ∆+= .........................................................................................................................(3.22)
2202 yyy ∆+= ........................................................................................................................(3.23)
Critical wind velocity at vortex shedding is calculated according to Equation 2.5 and windvelocity pressure according to Equation 2.7.
A computer program, see Appendix H, has been developed which takes into consideration allvariables above. It also deals with the wind turbulence by allowing a randomised relative level ofthe amplitude for vortex shedding force and the frequency of the vortex shedding. The programis capable of creating a dynamic response for a frequency spectrum and a time history.
3.3.2.2 Input data
The following data was used as input data for this theoretical study of the damped system.
Generalised mass, genM 12 460 kg *)
Damper pendulum mass, m kg2461460121.0 =⋅ *)
Observed natural frequency, fe1
see Section 3.7.20.288 Hz
Optimum damper frequency tuning accordingto [6] Hz262.0
1.011
12 =⋅+
= ee ff ...................(3.24)
For determining the stiffness of the VEAB chimney an equivalent load, calculated according toSection 2.4.2, was applied on the complete height of the chimney in the same FE calculation asin Section 2.4.1. The results are shown in Figure 3.3 k.
*) Data given by the manufacturer of the chimney. See also chapter 2.3.2.
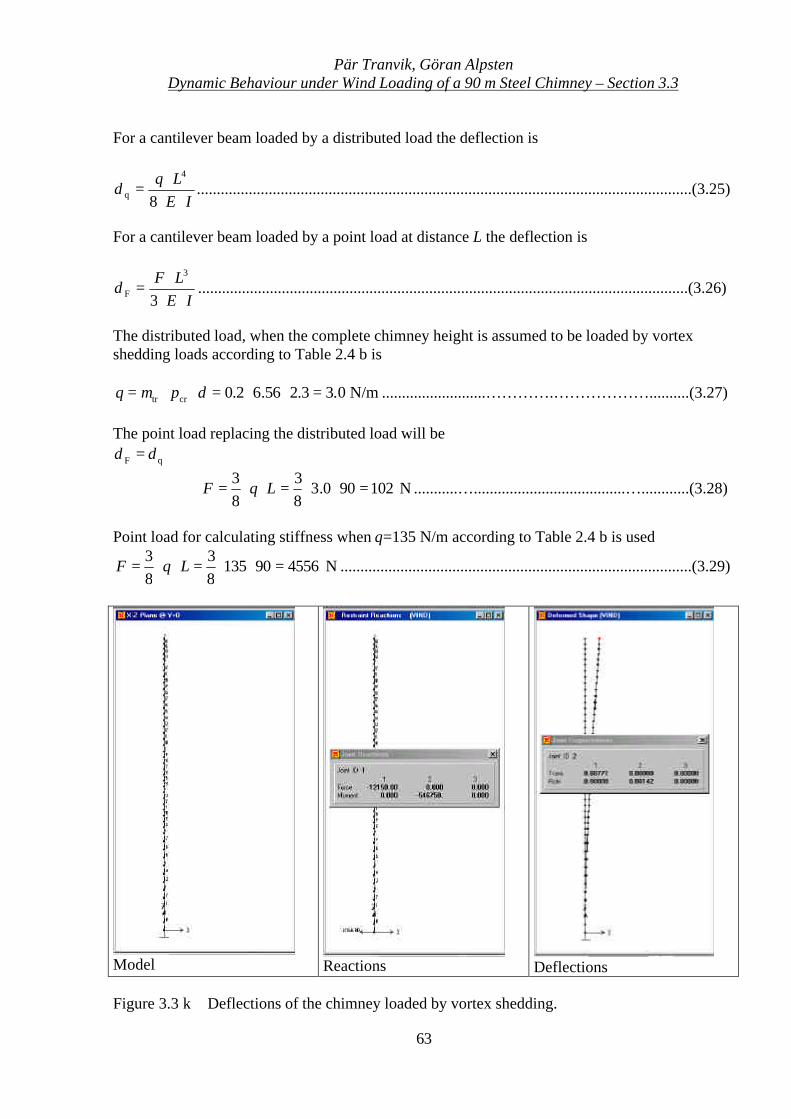
Pär Tranvik, Göran AlpstenDynamic Behaviour under Wind Loading of a 90 m Steel Chimney – Section 3.3
63
For a cantilever beam loaded by a distributed load the deflection is
IELq⋅⋅
⋅=
8
4
qδ ............................................................................................................................(3.25)
For a cantilever beam loaded by a point load at distance L the deflection is
IELF⋅⋅
⋅=
3
3
Fδ ...........................................................................................................................(3.26)
The distributed load, when the complete chimney height is assumed to be loaded by vortexshedding loads according to Table 2.4 b is
N/m0.33.256.62.0crtr =⋅⋅=⋅⋅= dpq µ ..........................………….………………..........(3.27)
The point load replacing the distributed load will be
qF δδ = ⇒
N102900.383
83
=⋅⋅=⋅⋅= LqF ...........…......................................…............(3.28)
Point load for calculating stiffness when q=135 N/m according to Table 2.4 b is used
N45569013583
83
=⋅⋅=⋅⋅= LqF ........................................................................................(3.29)
Model Reactions Deflections
Figure 3.3 k Deflections of the chimney loaded by vortex shedding.
Pär Tranvik, Göran AlpstenDynamic Behaviour under Wind Loading of a 90 m Steel Chimney – Section 3.3
64
Chimney stiffness
N/m000520877.05564
1 ==c ......................................................................................................(3.30)
Damper stiffness
N/m3723)262.02(2461)2( 2222 =⋅⋅⋅=⋅⋅⋅= ππ efmc .....................................................(3.31)
Logarithmic decrement according to [12]
21
1
1
101
1
2ln
ς
ςπδ
−
⋅⋅=
=
yy
.........................................................................................................(3.32)
mc
k
⋅=⋅
1
112 ς ........................................................................................................................(3.33)
22
2
2
202
1
2ln
ς
ςπδ
−
⋅⋅=
=
yy
........................................................................................................(3.34)
genMc
k
⋅=⋅
2
222 ς ..................................................................................................................(3.35)
where ζ = The fraction of critical damping or relative damping
From Equations 3.33 through 3.35 the logarithmic decrement of the chimney 0.04 corresponds toa damping of k1=324 kg/s. Similarly the logarithmic decrement of the pendulum damper 0.03corresponds to a damping of k2=19 kg/s.
From a comparison study the time step found to be acceptable considering convergence andprecision is
∆t s= 0 001.
Start values for dynamic response calculations during vortex shedding at time 0:
y10 = 0y20 = 0v10 = 0v20 = 0
The density of air was assumed to 1.25 kg/m3.
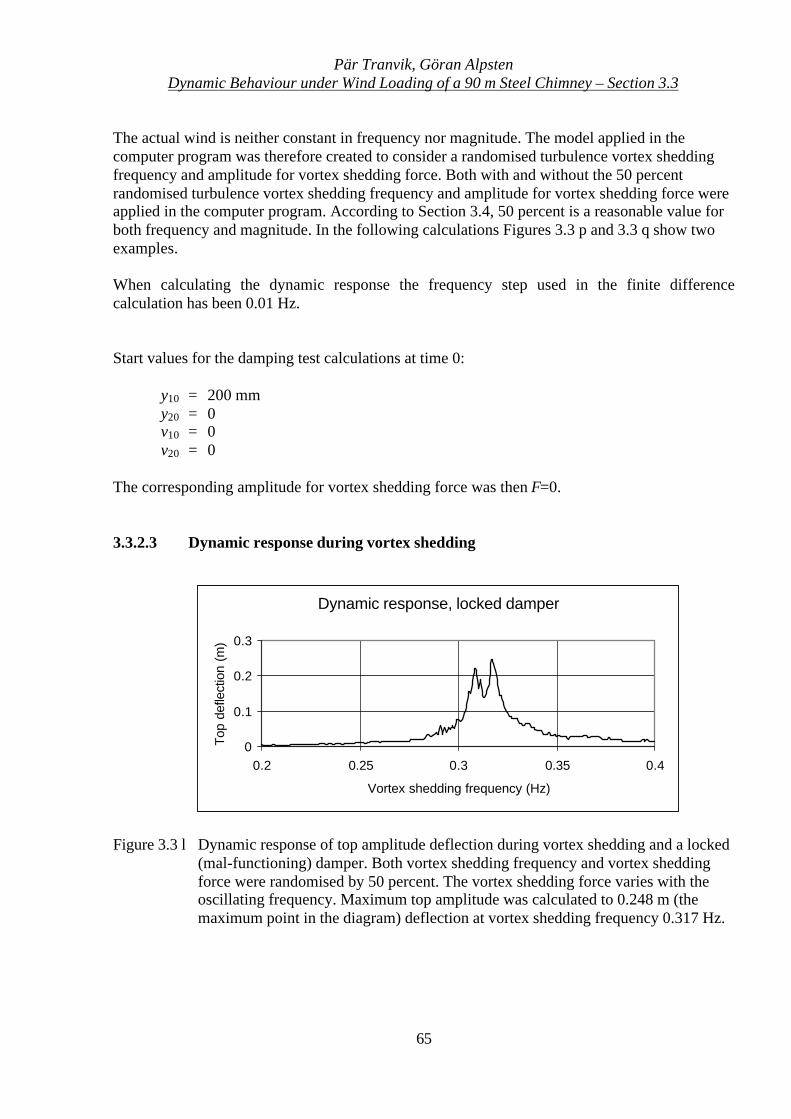
Pär Tranvik, Göran AlpstenDynamic Behaviour under Wind Loading of a 90 m Steel Chimney – Section 3.3
65
The actual wind is neither constant in frequency nor magnitude. The model applied in thecomputer program was therefore created to consider a randomised turbulence vortex sheddingfrequency and amplitude for vortex shedding force. Both with and without the 50 percentrandomised turbulence vortex shedding frequency and amplitude for vortex shedding force wereapplied in the computer program. According to Section 3.4, 50 percent is a reasonable value forboth frequency and magnitude. In the following calculations Figures 3.3 p and 3.3 q show twoexamples.
When calculating the dynamic response the frequency step used in the finite differencecalculation has been 0.01 Hz.
Start values for the damping test calculations at time 0:
y10 = 200 mmy20 = 0v10 = 0v20 = 0
The corresponding amplitude for vortex shedding force was then F=0.
3.3.2.3 Dynamic response during vortex shedding
Figure 3.3 l Dynamic response of top amplitude deflection during vortex shedding and a locked(mal-functioning) damper. Both vortex shedding frequency and vortex sheddingforce were randomised by 50 percent. The vortex shedding force varies with theoscillating frequency. Maximum top amplitude was calculated to 0.248 m (themaximum point in the diagram) deflection at vortex shedding frequency 0.317 Hz.
Dynamic response, locked damper
0
0.1
0.2
0.3
0.2 0.25 0.3 0.35 0.4
Vortex shedding frequency (Hz)
Top
defle
ctio
n (m
)
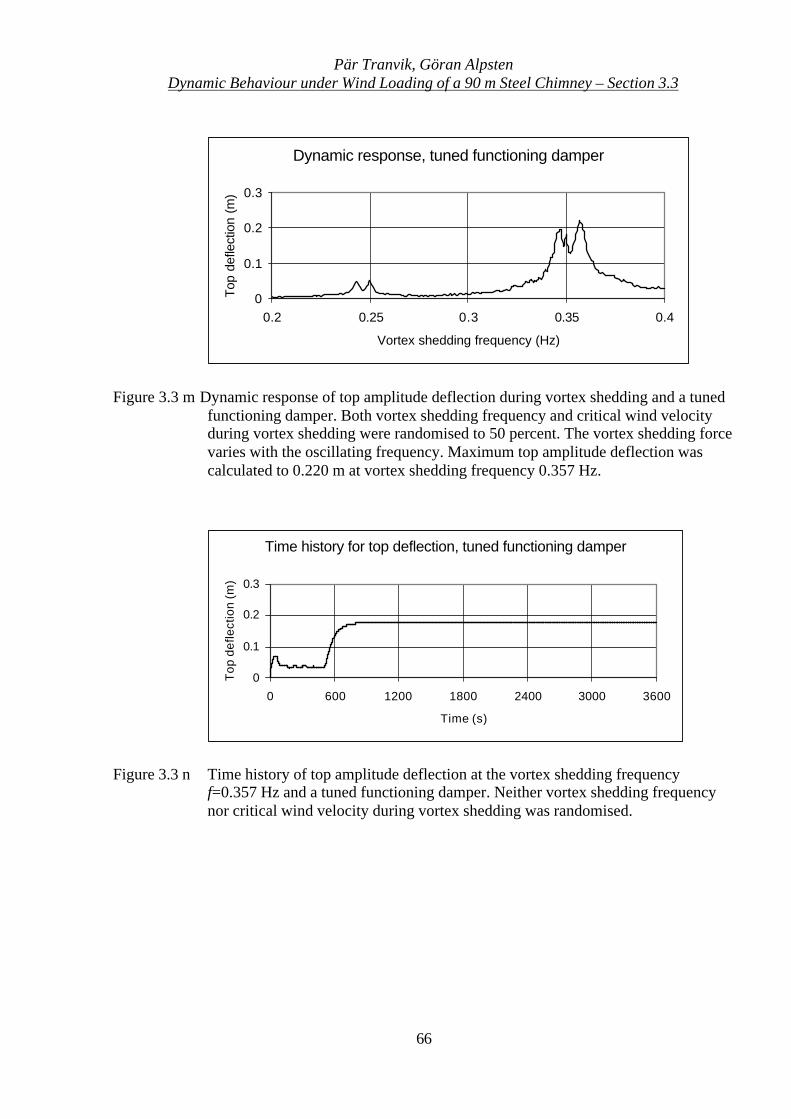
Pär Tranvik, Göran AlpstenDynamic Behaviour under Wind Loading of a 90 m Steel Chimney – Section 3.3
66
Figure 3.3 m Dynamic response of top amplitude deflection during vortex shedding and a tunedfunctioning damper. Both vortex shedding frequency and critical wind velocityduring vortex shedding were randomised to 50 percent. The vortex shedding forcevaries with the oscillating frequency. Maximum top amplitude deflection wascalculated to 0.220 m at vortex shedding frequency 0.357 Hz.
Figure 3.3 n Time history of top amplitude deflection at the vortex shedding frequencyf=0.357 Hz and a tuned functioning damper. Neither vortex shedding frequencynor critical wind velocity during vortex shedding was randomised.
Time history for top deflection, tuned functioning damper
0
0.1
0.2
0.3
0 600 1200 1800 2400 3000 3600
Time (s)
Top
def
lect
ion
(m)
Dynamic response, tuned functioning damper
0
0.1
0.2
0.3
0.2 0.25 0.3 0.35 0.4
Vortex shedding frequency (Hz)
Top
defle
ctio
n (m
)
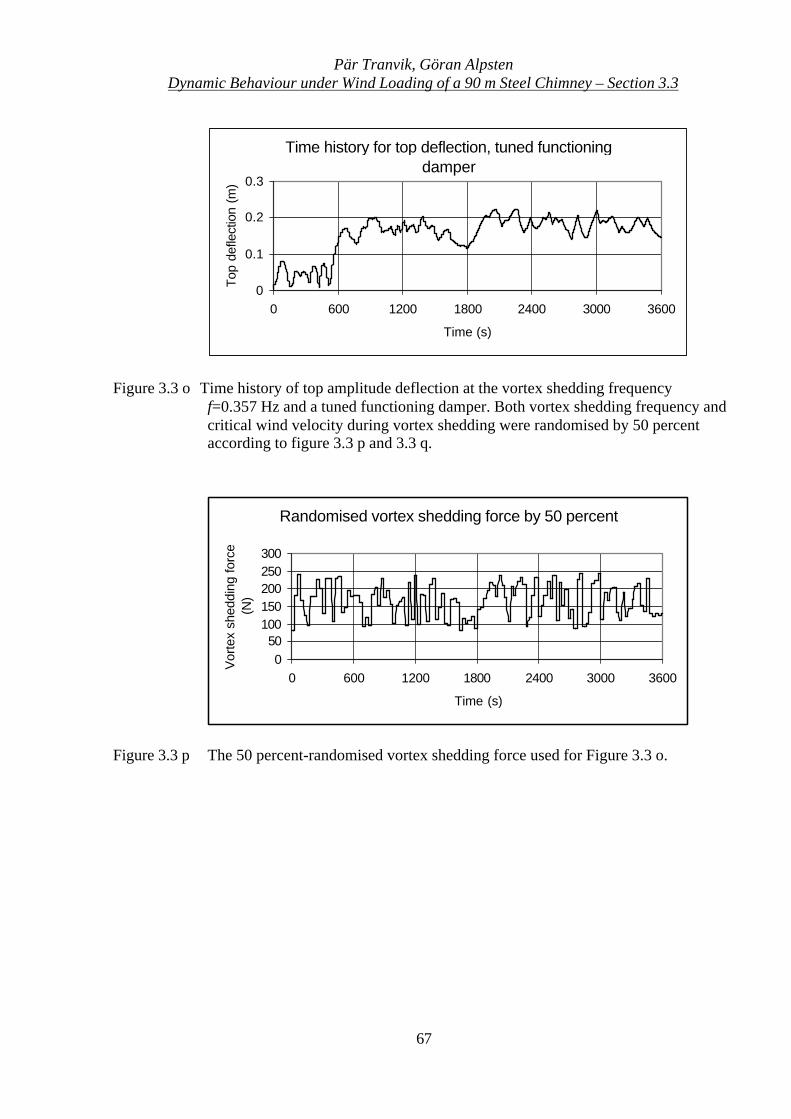
Pär Tranvik, Göran AlpstenDynamic Behaviour under Wind Loading of a 90 m Steel Chimney – Section 3.3
67
Figure 3.3 o Time history of top amplitude deflection at the vortex shedding frequencyf=0.357 Hz and a tuned functioning damper. Both vortex shedding frequency andcritical wind velocity during vortex shedding were randomised by 50 percentaccording to figure 3.3 p and 3.3 q.
Figure 3.3 p The 50 percent-randomised vortex shedding force used for Figure 3.3 o.
Randomised vortex shedding force by 50 percent
050
100150200250300
0 600 1200 1800 2400 3000 3600
Time (s)
Vor
tex
shed
ding
forc
e (N
)
Time history for top deflection, tuned functioning damper
0
0.1
0.2
0.3
0 600 1200 1800 2400 3000 3600
Time (s)
Top
defle
ctio
n (m
)
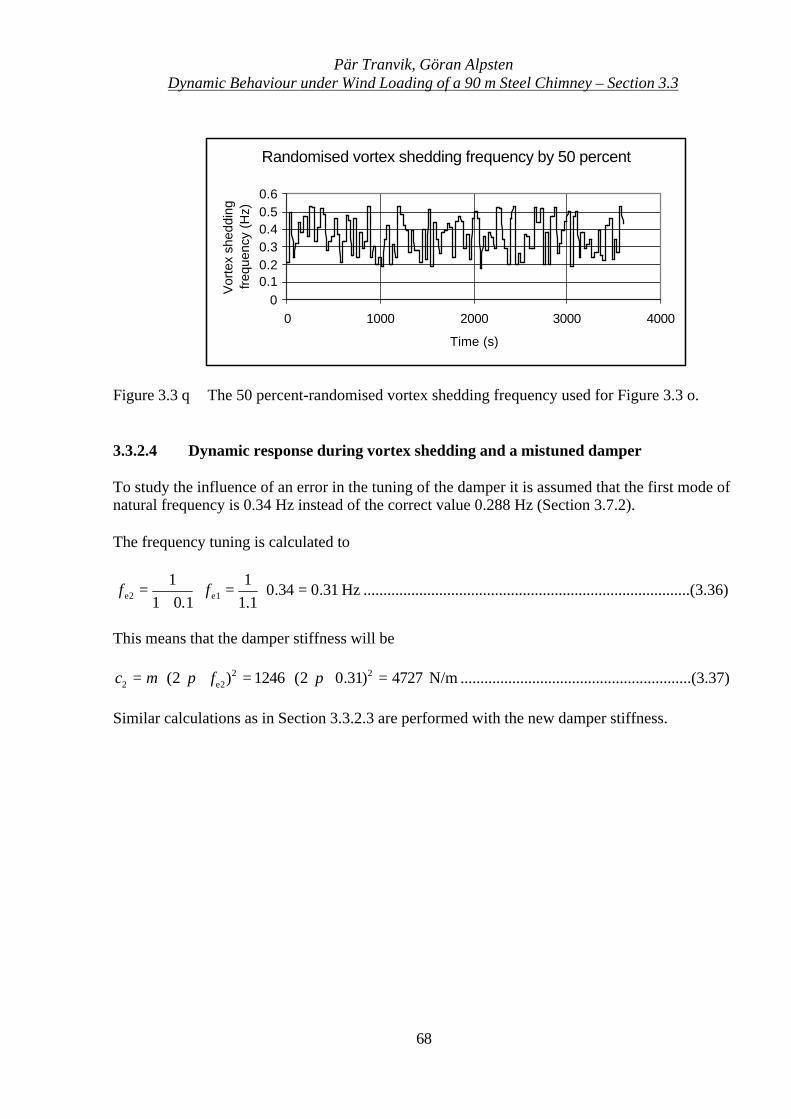
Pär Tranvik, Göran AlpstenDynamic Behaviour under Wind Loading of a 90 m Steel Chimney – Section 3.3
68
Figure 3.3 q The 50 percent-randomised vortex shedding frequency used for Figure 3.3 o.
3.3.2.4 Dynamic response during vortex shedding and a mistuned damper
To study the influence of an error in the tuning of the damper it is assumed that the first mode ofnatural frequency is 0.34 Hz instead of the correct value 0.288 Hz (Section 3.7.2).
The frequency tuning is calculated to
Hz31.034.01.1
11.01
1e1e2 =⋅=⋅
+= ff ..................................................................................(3.36)
This means that the damper stiffness will be
N/m4727)31.02(1246)2( 22e22 =⋅⋅⋅=⋅⋅⋅= ππ fmc ..........................................................(3.37)
Similar calculations as in Section 3.3.2.3 are performed with the new damper stiffness.
Randomised vortex shedding frequency by 50 percent
00.10.20.30.40.50.6
0 1000 2000 3000 4000
Time (s)
Vor
tex
shed
ding
fre
quen
cy (
Hz)
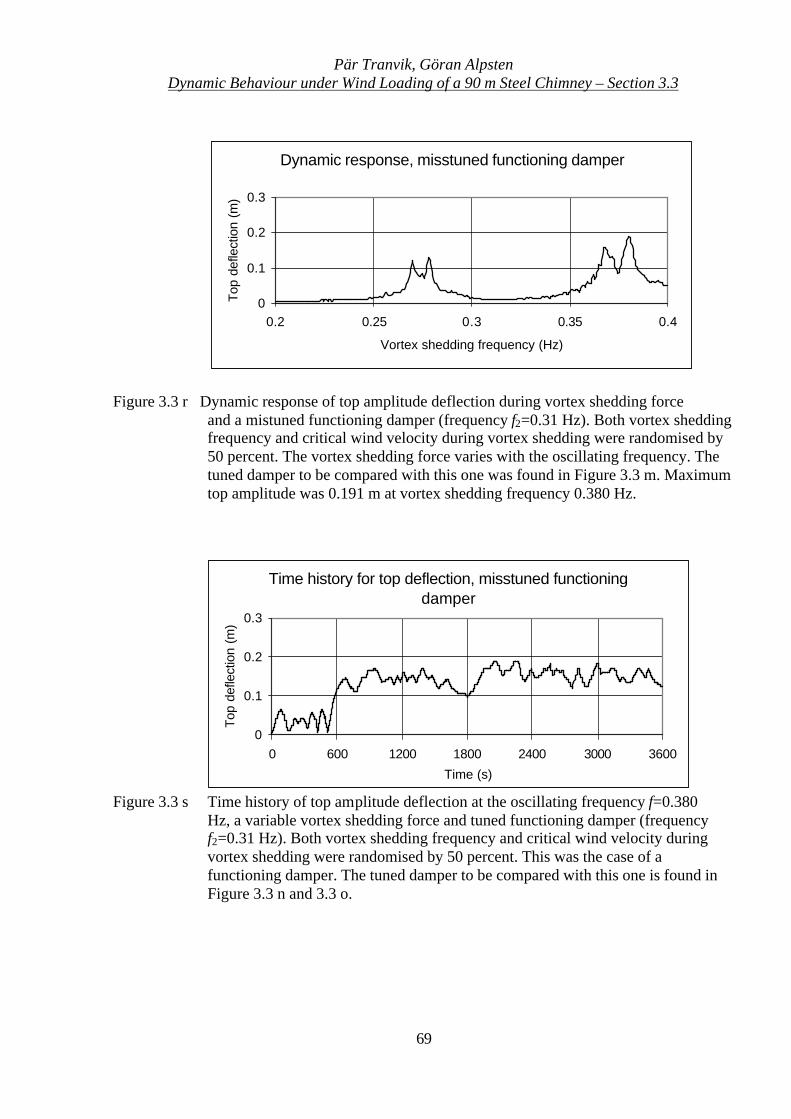
Pär Tranvik, Göran AlpstenDynamic Behaviour under Wind Loading of a 90 m Steel Chimney – Section 3.3
69
Figure 3.3 r Dynamic response of top amplitude deflection during vortex shedding forceand a mistuned functioning damper (frequency f2=0.31 Hz). Both vortex sheddingfrequency and critical wind velocity during vortex shedding were randomised by50 percent. The vortex shedding force varies with the oscillating frequency. Thetuned damper to be compared with this one was found in Figure 3.3 m. Maximumtop amplitude was 0.191 m at vortex shedding frequency 0.380 Hz.
Figure 3.3 s Time history of top amplitude deflection at the oscillating frequency f=0.380Hz, a variable vortex shedding force and tuned functioning damper (frequencyf2=0.31 Hz). Both vortex shedding frequency and critical wind velocity duringvortex shedding were randomised by 50 percent. This was the case of afunctioning damper. The tuned damper to be compared with this one is found inFigure 3.3 n and 3.3 o.
Dynamic response, misstuned functioning damper
0
0.1
0.2
0.3
0.2 0.25 0.3 0.35 0.4
Vortex shedding frequency (Hz)
Top
defle
ctio
n (m
)
Time history for top deflection, misstuned functioning damper
0
0.1
0.2
0.3
0 600 1200 1800 2400 3000 3600
Time (s)
Top
defle
ctio
n (m
)
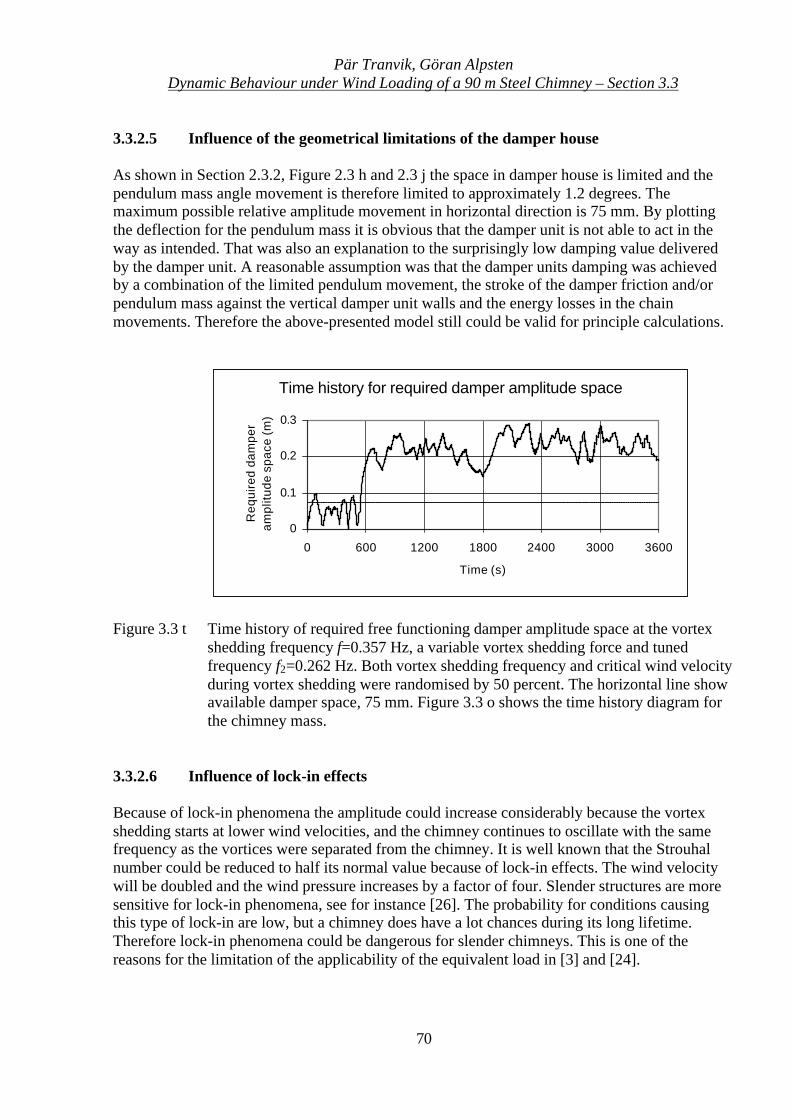
Pär Tranvik, Göran AlpstenDynamic Behaviour under Wind Loading of a 90 m Steel Chimney – Section 3.3
70
3.3.2.5 Influence of the geometrical limitations of the damper house
As shown in Section 2.3.2, Figure 2.3 h and 2.3 j the space in damper house is limited and thependulum mass angle movement is therefore limited to approximately 1.2 degrees. Themaximum possible relative amplitude movement in horizontal direction is 75 mm. By plottingthe deflection for the pendulum mass it is obvious that the damper unit is not able to act in theway as intended. That was also an explanation to the surprisingly low damping value deliveredby the damper unit. A reasonable assumption was that the damper units damping was achievedby a combination of the limited pendulum movement, the stroke of the damper friction and/orpendulum mass against the vertical damper unit walls and the energy losses in the chainmovements. Therefore the above-presented model still could be valid for principle calculations.
Figure 3.3 t Time history of required free functioning damper amplitude space at the vortexshedding frequency f=0.357 Hz, a variable vortex shedding force and tunedfrequency f2=0.262 Hz. Both vortex shedding frequency and critical wind velocityduring vortex shedding were randomised by 50 percent. The horizontal line showavailable damper space, 75 mm. Figure 3.3 o shows the time history diagram forthe chimney mass.
3.3.2.6 Influence of lock-in effects
Because of lock-in phenomena the amplitude could increase considerably because the vortexshedding starts at lower wind velocities, and the chimney continues to oscillate with the samefrequency as the vortices were separated from the chimney. It is well known that the Strouhalnumber could be reduced to half its normal value because of lock-in effects. The wind velocitywill be doubled and the wind pressure increases by a factor of four. Slender structures are moresensitive for lock-in phenomena, see for instance [26]. The probability for conditions causingthis type of lock-in are low, but a chimney does have a lot chances during its long lifetime.Therefore lock-in phenomena could be dangerous for slender chimneys. This is one of thereasons for the limitation of the applicability of the equivalent load in [3] and [24].
Time history for required damper amplitude space
0
0.1
0.2
0.3
0 600 1200 1800 2400 3000 3600
Time (s)
Req
uire
d da
mpe
r am
plitu
de s
pace
(m
)
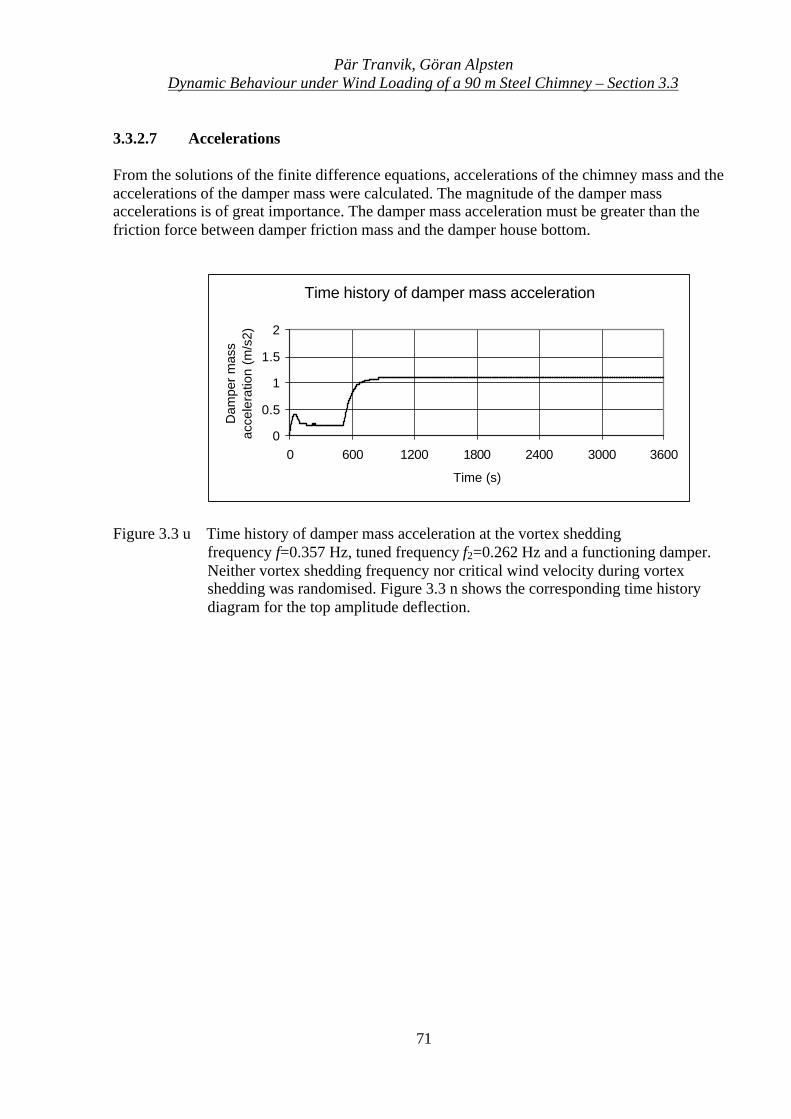
Pär Tranvik, Göran AlpstenDynamic Behaviour under Wind Loading of a 90 m Steel Chimney – Section 3.3
71
3.3.2.7 Accelerations
From the solutions of the finite difference equations, accelerations of the chimney mass and theaccelerations of the damper mass were calculated. The magnitude of the damper massaccelerations is of great importance. The damper mass acceleration must be greater than thefriction force between damper friction mass and the damper house bottom.
Figure 3.3 u Time history of damper mass acceleration at the vortex sheddingfrequency f=0.357 Hz, tuned frequency f2=0.262 Hz and a functioning damper.Neither vortex shedding frequency nor critical wind velocity during vortexshedding was randomised. Figure 3.3 n shows the corresponding time historydiagram for the top amplitude deflection.
Time history of damper mass acceleration
0
0.5
1
1.5
2
0 600 1200 1800 2400 3000 3600
Time (s)
Dam
per
mas
s ac
cele
ratio
n (m
/s2)
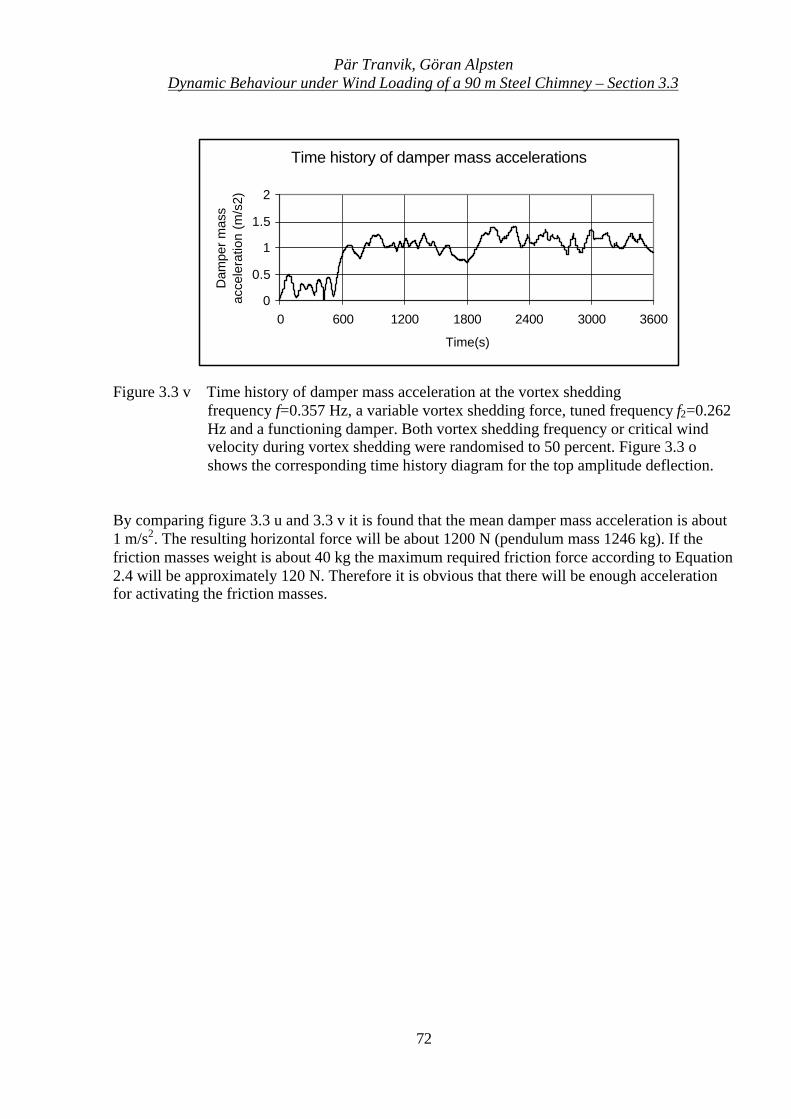
Pär Tranvik, Göran AlpstenDynamic Behaviour under Wind Loading of a 90 m Steel Chimney – Section 3.3
72
Figure 3.3 v Time history of damper mass acceleration at the vortex sheddingfrequency f=0.357 Hz, a variable vortex shedding force, tuned frequency f2=0.262Hz and a functioning damper. Both vortex shedding frequency or critical windvelocity during vortex shedding were randomised to 50 percent. Figure 3.3 oshows the corresponding time history diagram for the top amplitude deflection.
By comparing figure 3.3 u and 3.3 v it is found that the mean damper mass acceleration is about1 m/s2. The resulting horizontal force will be about 1200 N (pendulum mass 1246 kg). If thefriction masses weight is about 40 kg the maximum required friction force according to Equation2.4 will be approximately 120 N. Therefore it is obvious that there will be enough accelerationfor activating the friction masses.
Time history of damper mass accelerations
0
0.5
1
1.5
2
0 600 1200 1800 2400 3000 3600
Time(s)
Dam
per
mas
s ac
cele
ratio
n (m
/s2)
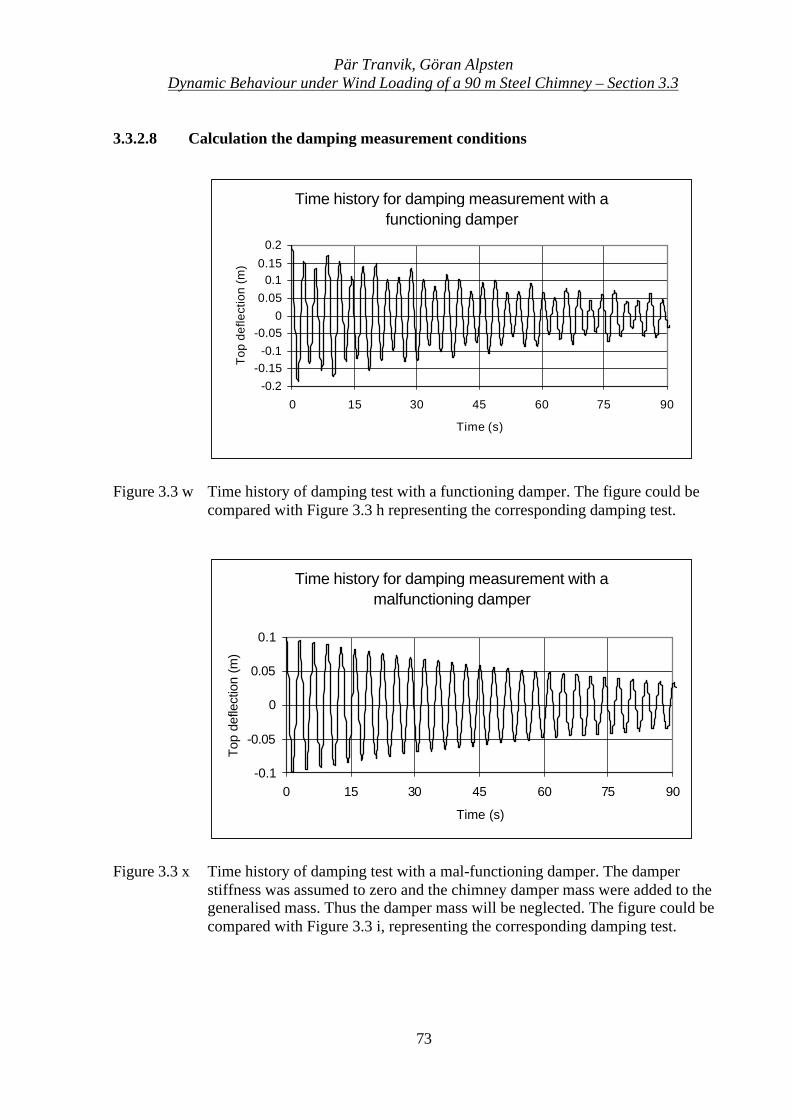
Pär Tranvik, Göran AlpstenDynamic Behaviour under Wind Loading of a 90 m Steel Chimney – Section 3.3
73
3.3.2.8 Calculation the damping measurement conditions
Figure 3.3 w Time history of damping test with a functioning damper. The figure could becompared with Figure 3.3 h representing the corresponding damping test.
Figure 3.3 x Time history of damping test with a mal-functioning damper. The damperstiffness was assumed to zero and the chimney damper mass were added to thegeneralised mass. Thus the damper mass will be neglected. The figure could becompared with Figure 3.3 i, representing the corresponding damping test.
Time history for damping measurement with a malfunctioning damper
-0.1
-0.05
0
0.05
0.1
0 15 30 45 60 75 90
Time (s)
Top
defle
ctio
n (m
)
Time history for damping measurement with a functioning damper
-0.2-0.15
-0.1-0.05
00.05
0.10.15
0.2
0 15 30 45 60 75 90
Time (s)
Top
def
lect
ion
(m)
Pär Tranvik, Göran AlpstenDynamic Behaviour under Wind Loading of a 90 m Steel Chimney – Section 3.3
74
3.3.3 Comparison between observations and theoretical study
The solutions for the dynamic response, Equation 3.10 and 3.11, show a similar behaviour in thesolutions as in [6], [13] and [14].
It is important to note that the model does not include any advanced fluid mechanical behaviour.
According to the theory a sudden and quick increase of the top amplitude deflection will occur.From the recorded data given in Section 3.4 a similar behaviour is observed. A very quickincrease of the top amplitude deflection and often an almost equal decrease was observed. Thequick decrease was explained by the turbulent behaviour of the wind. The recorded data alsoshow that the wind quickly and often change both velocity and direction. Thus the model only islimited sensitive to relatively large randomised changes in frequency or vortex shedding force,large amplitude deflection during vortex shedding will only occur for short periods at a time.This corresponds also well to the recordings according to Section 3.4.
There were some deviations between theory and damping measurements that mainly may beexplained by the fact that theory comes to the conclusion that there is not enough horizontalspace in the damper house. Thus the damper produces less damping than expected.
Figure 3.3 l for the mal-functioning damper show a top deflection range of 496 mm. No lock-ineffects are included. If we assume a lock-in on the wind velocity of two times the top deflectionrange will increase with a factor four to about 2000 mm. The calculations will then roughlyconfirm the observations noted in Section 3.1 and studied further in an estimated load spectrumin Section 4.2 and reverse.
Figures 3.3 m, 3.3 n and 3.3 o for the functioning damper show a top deflection range ofapproximately 400 mm. With the same discussion as for the mal-functioning damper it seemsreasonable to expect a top deflection range of approximately 1600 mm for the functioningdamper and the same weather conditions.
It is worth noting that the mistuned damper in Figure 3.3 r and 3.3 s gives a little less topdeflection amplitude as compared to the tuned damper, but the vortex shedding frequency islarger.
The accelerations are found to be large enough to overcome the friction forces between thedamper friction masses and the damper house bottom friction plate.
For the simulation of the damping tests, Figure 3.3 w and 3.3 x corresponding to the dampingtests, Figure 3.3 h and 3.3 i are found except for one behaviour. Figure 3.3 w shows twosuperimposed oscillations, which could not be found in Figure 3.3 h. The superimposedoscillations show the sum of oscillations of the both masses. This difference was an additionalargument to that only a minority of the damping is achieved from the friction masses. The majorpart is probably achieved from friction losses in the chains etc.
The theoretical study supports the statement made in Section 3.3.1.6 that the VEAB chimneydamper is a not an optimum damper device.
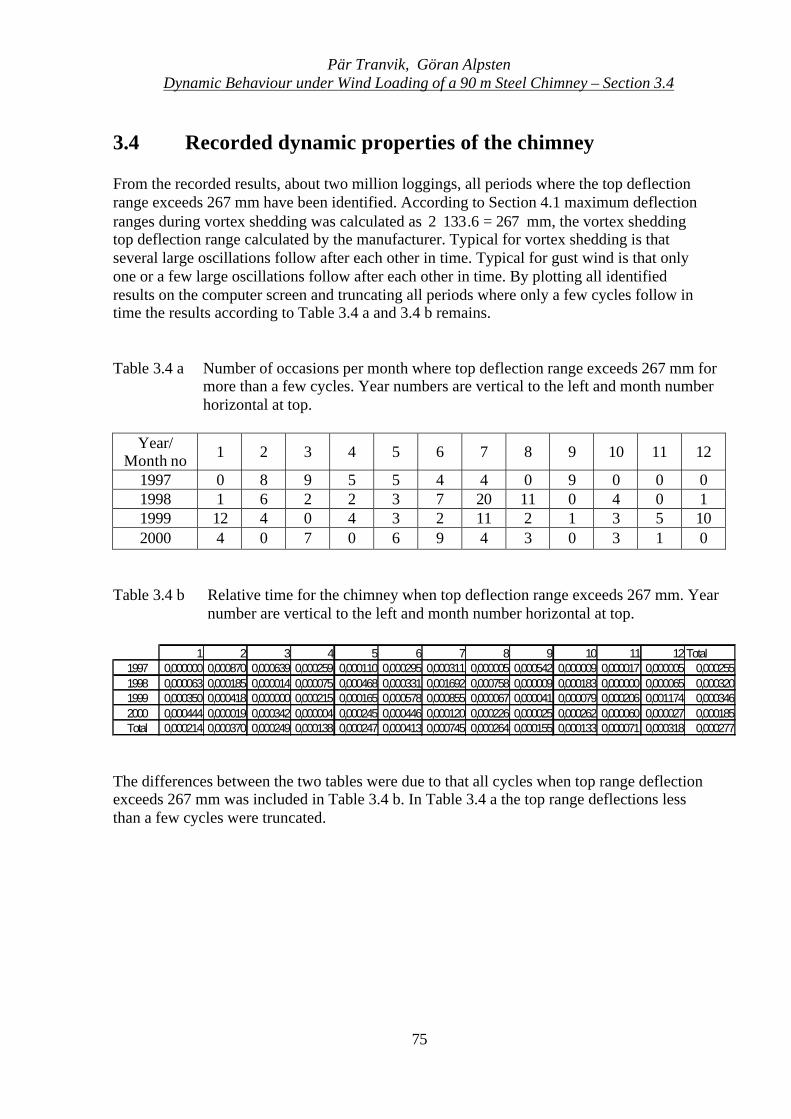
Pär Tranvik, Göran AlpstenDynamic Behaviour under Wind Loading of a 90 m Steel Chimney – Section 3.4
75
3.4 Recorded dynamic properties of the chimney
From the recorded results, about two million loggings, all periods where the top deflectionrange exceeds 267 mm have been identified. According to Section 4.1 maximum deflectionranges during vortex shedding was calculated as 2676.1332 =⋅ mm, the vortex sheddingtop deflection range calculated by the manufacturer. Typical for vortex shedding is thatseveral large oscillations follow after each other in time. Typical for gust wind is that onlyone or a few large oscillations follow after each other in time. By plotting all identifiedresults on the computer screen and truncating all periods where only a few cycles follow intime the results according to Table 3.4 a and 3.4 b remains.
Table 3.4 a Number of occasions per month where top deflection range exceeds 267 mm formore than a few cycles. Year numbers are vertical to the left and month numberhorizontal at top.
Year/Month no 1 2 3 4 5 6 7 8 9 10 11 12
1997 0 8 9 5 5 4 4 0 9 0 0 01998 1 6 2 2 3 7 20 11 0 4 0 11999 12 4 0 4 3 2 11 2 1 3 5 102000 4 0 7 0 6 9 4 3 0 3 1 0
Table 3.4 b Relative time for the chimney when top deflection range exceeds 267 mm. Yearnumber are vertical to the left and month number horizontal at top.
The differences between the two tables were due to that all cycles when top range deflectionexceeds 267 mm was included in Table 3.4 b. In Table 3.4 a the top range deflections lessthan a few cycles were truncated.
1 2 3 4 5 6 7 8 9 10 11 12Total1997 0,000000 0,000870 0,000639 0,000259 0,000110 0,000295 0,000311 0,000005 0,000542 0,000009 0,000017 0,000005 0,0002551998 0,000063 0,000185 0,000014 0,000075 0,000468 0,000331 0,001692 0,000758 0,000009 0,000183 0,000000 0,000065 0,0003201999 0,000350 0,000418 0,000000 0,000215 0,000165 0,000578 0,000855 0,000067 0,000041 0,000079 0,000206 0,001174 0,0003462000 0,000444 0,000019 0,000342 0,000004 0,000245 0,000446 0,000120 0,000226 0,000025 0,000262 0,000060 0,000027 0,000185Total 0,000214 0,000370 0,000249 0,000138 0,000247 0,000413 0,000745 0,000264 0,000155 0,000133 0,000071 0,000318 0,000277
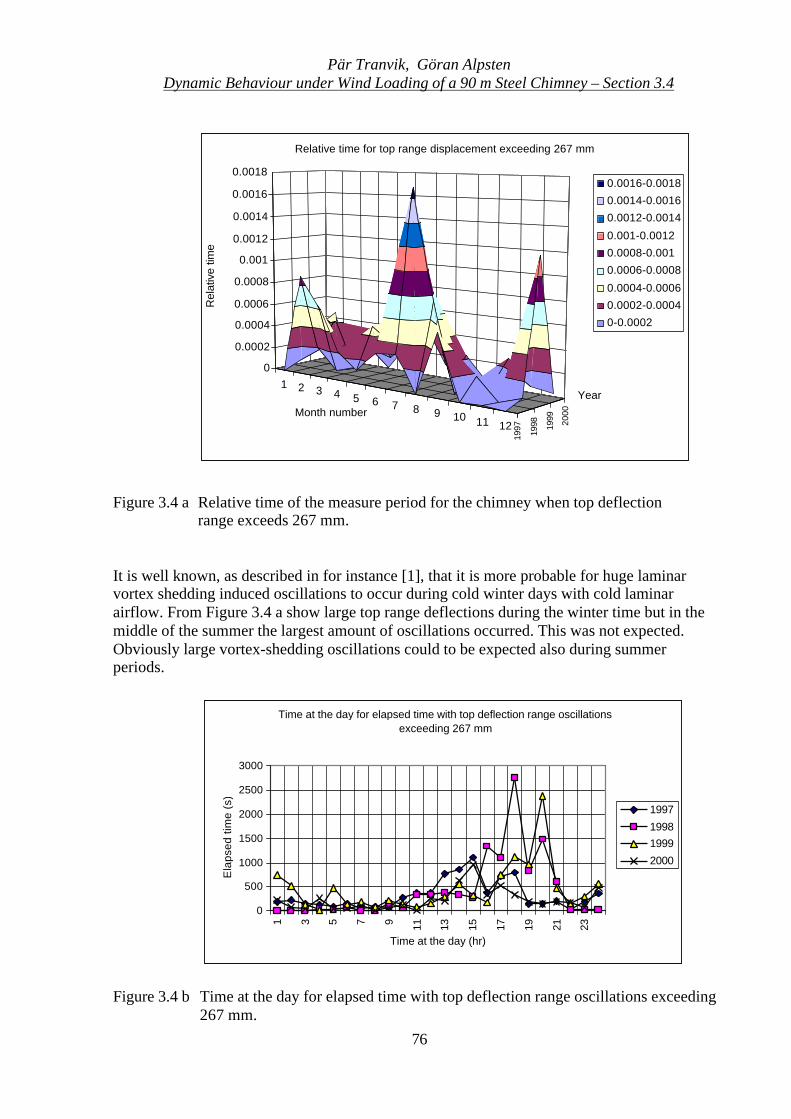
Pär Tranvik, Göran AlpstenDynamic Behaviour under Wind Loading of a 90 m Steel Chimney – Section 3.4
76
Figure 3.4 a Relative time of the measure period for the chimney when top deflectionrange exceeds 267 mm.
It is well known, as described in for instance [1], that it is more probable for huge laminarvortex shedding induced oscillations to occur during cold winter days with cold laminarairflow. From Figure 3.4 a show large top range deflections during the winter time but in themiddle of the summer the largest amount of oscillations occurred. This was not expected.Obviously large vortex-shedding oscillations could to be expected also during summerperiods.
Time at the day for elapsed time with top deflection range oscillations exceeding 267 mm
0
500
1000
1500
2000
2500
3000
1 3 5 7 9 11 13 15 17 19 21 23
Time at the day (hr)
Ela
psed
tim
e (s
)
1997
19981999
2000
Figure 3.4 b Time at the day for elapsed time with top deflection range oscillations exceeding267 mm.
1 2 3 4 5 6 7 8 9 10 11 12
1997 1998 19
99 2000
0
0.0002
0.0004
0.0006
0.0008
0.001
0.0012
0.0014
0.0016
0.0018
Rel
ativ
e tim
e
Month number
Year
Relative time for top range displacement exceeding 267 mm
0.0016-0.0018
0.0014-0.0016
0.0012-0.0014
0.001-0.0012
0.0008-0.001
0.0006-0.0008
0.0004-0.0006
0.0002-0.0004
0-0.0002
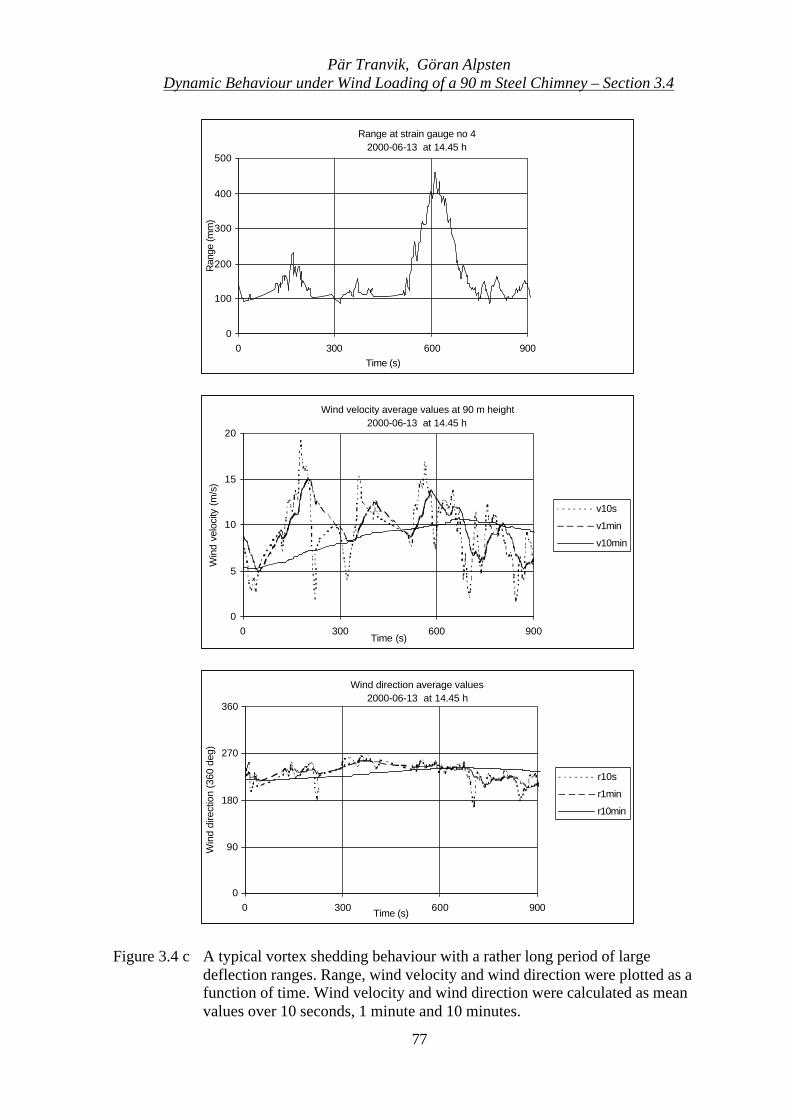
Pär Tranvik, Göran AlpstenDynamic Behaviour under Wind Loading of a 90 m Steel Chimney – Section 3.4
77
Figure 3.4 c A typical vortex shedding behaviour with a rather long period of largedeflection ranges. Range, wind velocity and wind direction were plotted as afunction of time. Wind velocity and wind direction were calculated as meanvalues over 10 seconds, 1 minute and 10 minutes.
Range at strain gauge no 4 2000-06-13 at 14.45 h
0
100
200
300
400
500
0 300 600 900Time (s)
Ran
ge (m
m)
Wind direction average values 2000-06-13 at 14.45 h
0
90
180
270
360
0 300 600 900Time (s)
Win
d di
rect
ion
(360
deg
)
r10s
r1min
r10min
Wind velocity average values at 90 m height 2000-06-13 at 14.45 h
0
5
10
15
20
0 300 600 900Time (s)
Win
d ve
loci
ty (
m/s
)
v10s
v1min
v10min
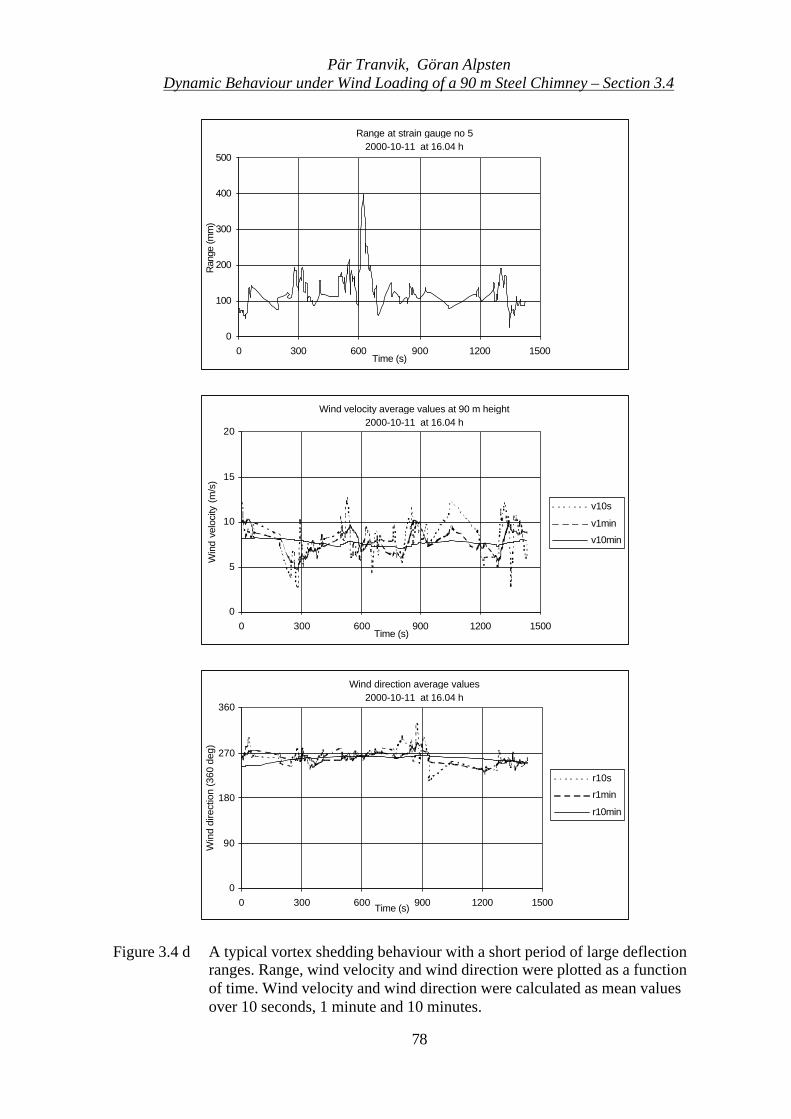
Pär Tranvik, Göran AlpstenDynamic Behaviour under Wind Loading of a 90 m Steel Chimney – Section 3.4
78
Figure 3.4 d A typical vortex shedding behaviour with a short period of large deflectionranges. Range, wind velocity and wind direction were plotted as a functionof time. Wind velocity and wind direction were calculated as mean valuesover 10 seconds, 1 minute and 10 minutes.
Range at strain gauge no 5 2000-10-11 at 16.04 h
0
100
200
300
400
500
0 300 600 900 1200 1500Time (s)
Ran
ge (m
m)
Wind velocity average values at 90 m height 2000-10-11 at 16.04 h
0
5
10
15
20
0 300 600 900 1200 1500Time (s)
Win
d ve
loci
ty (
m/s
)
v10s
v1min
v10min
Wind direction average values 2000-10-11 at 16.04 h
0
90
180
270
360
0 300 600 900 1200 1500Time (s)
Win
d di
rect
ion
(360
deg
)
r10s
r1min
r10min
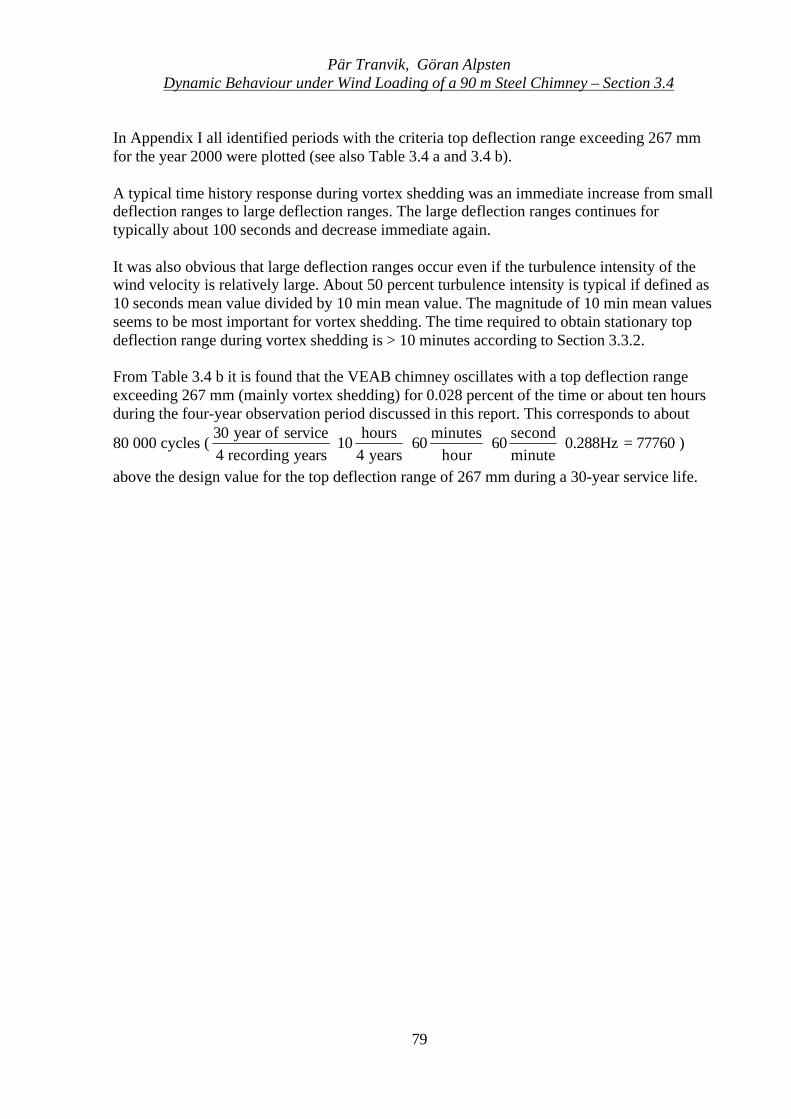
Pär Tranvik, Göran AlpstenDynamic Behaviour under Wind Loading of a 90 m Steel Chimney – Section 3.4
79
In Appendix I all identified periods with the criteria top deflection range exceeding 267 mmfor the year 2000 were plotted (see also Table 3.4 a and 3.4 b).
A typical time history response during vortex shedding was an immediate increase from smalldeflection ranges to large deflection ranges. The large deflection ranges continues fortypically about 100 seconds and decrease immediate again.
It was also obvious that large deflection ranges occur even if the turbulence intensity of thewind velocity is relatively large. About 50 percent turbulence intensity is typical if defined as10 seconds mean value divided by 10 min mean value. The magnitude of 10 min mean valuesseems to be most important for vortex shedding. The time required to obtain stationary topdeflection range during vortex shedding is > 10 minutes according to Section 3.3.2.
From Table 3.4 b it is found that the VEAB chimney oscillates with a top deflection rangeexceeding 267 mm (mainly vortex shedding) for 0.028 percent of the time or about ten hoursduring the four-year observation period discussed in this report. This corresponds to about
80 000 cycles ( 777600.288Hzminutesecond
60hour
minutes60
years4hours
10yearsrecording4
serviceofyear30=⋅⋅⋅⋅ )
above the design value for the top deflection range of 267 mm during a 30-year service life.
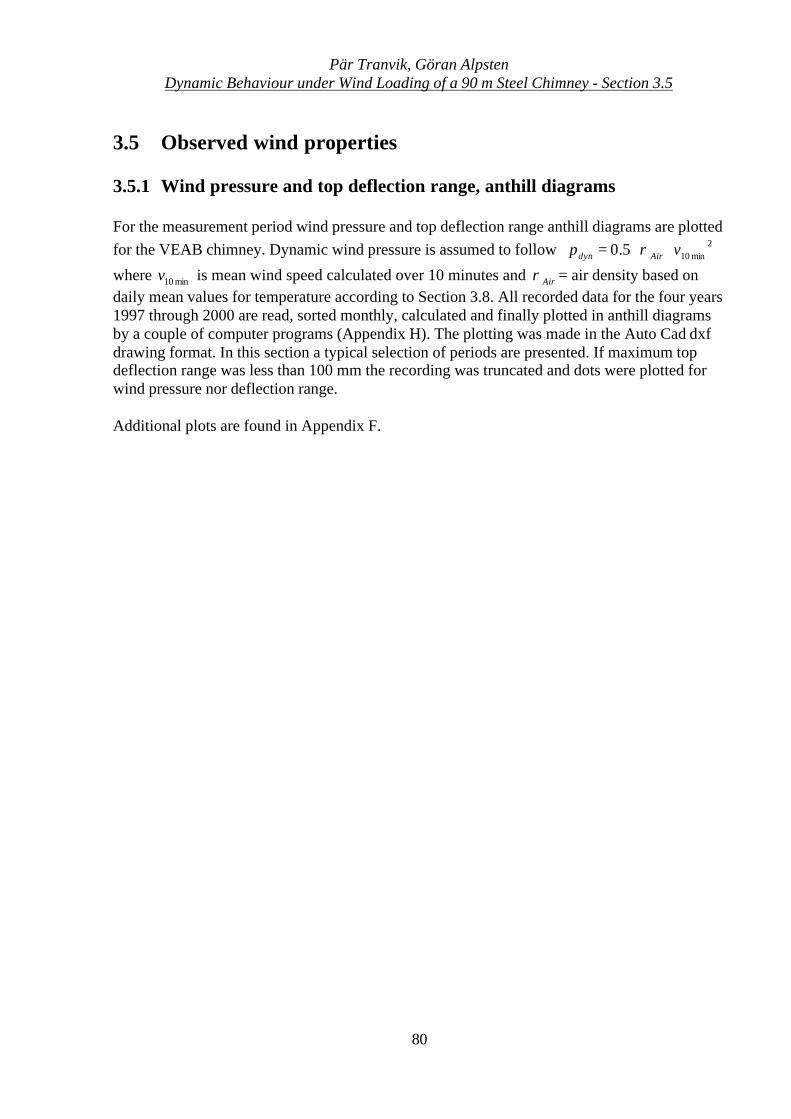
Pär Tranvik, Göran AlpstenDynamic Behaviour under Wind Loading of a 90 m Steel Chimney - Section 3.5
80
3.5 Observed wind properties
3.5.1 Wind pressure and top deflection range, anthill diagrams
For the measurement period wind pressure and top deflection range anthill diagrams are plottedfor the VEAB chimney. Dynamic wind pressure is assumed to follow 2
min105.0 vp Airdyn ⋅⋅= ρ
where min10v is mean wind speed calculated over 10 minutes and Airρ = air density based ondaily mean values for temperature according to Section 3.8. All recorded data for the four years1997 through 2000 are read, sorted monthly, calculated and finally plotted in anthill diagramsby a couple of computer programs (Appendix H). The plotting was made in the Auto Cad dxfdrawing format. In this section a typical selection of periods are presented. If maximum topdeflection range was less than 100 mm the recording was truncated and dots were plotted forwind pressure nor deflection range.
Additional plots are found in Appendix F.
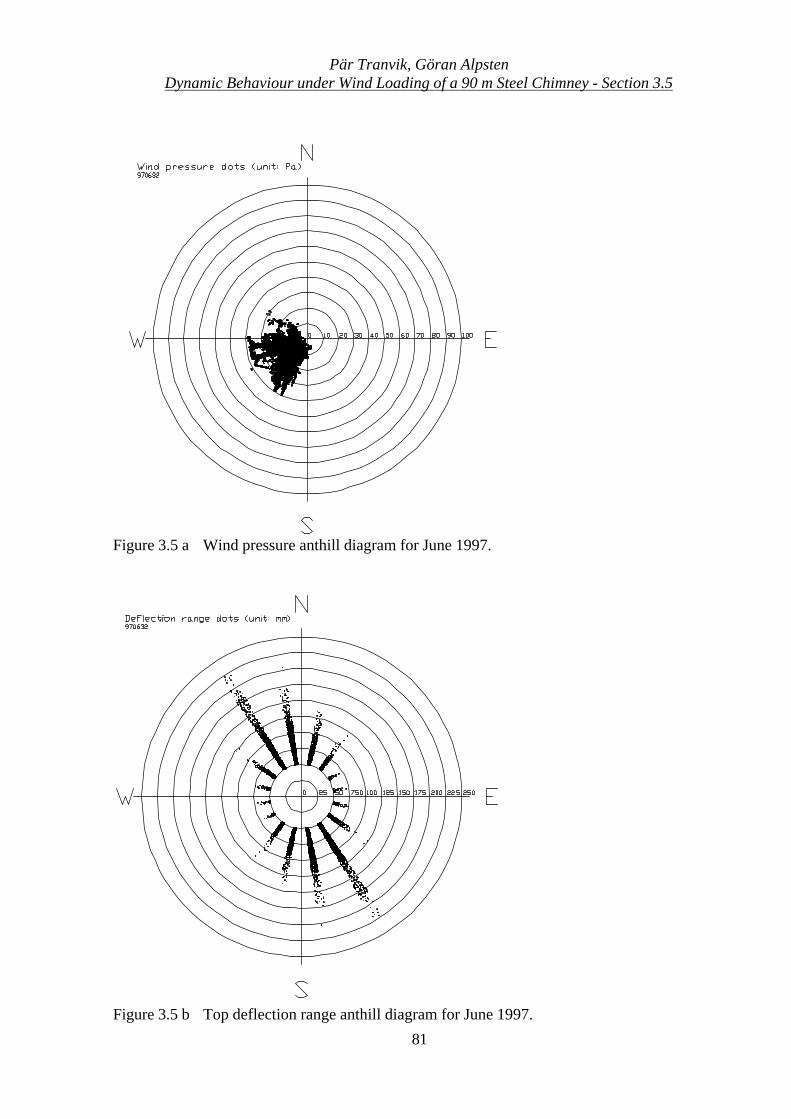
Pär Tranvik, Göran AlpstenDynamic Behaviour under Wind Loading of a 90 m Steel Chimney - Section 3.5
81
Figure 3.5 a Wind pressure anthill diagram for June 1997.
Figure 3.5 b Top deflection range anthill diagram for June 1997.
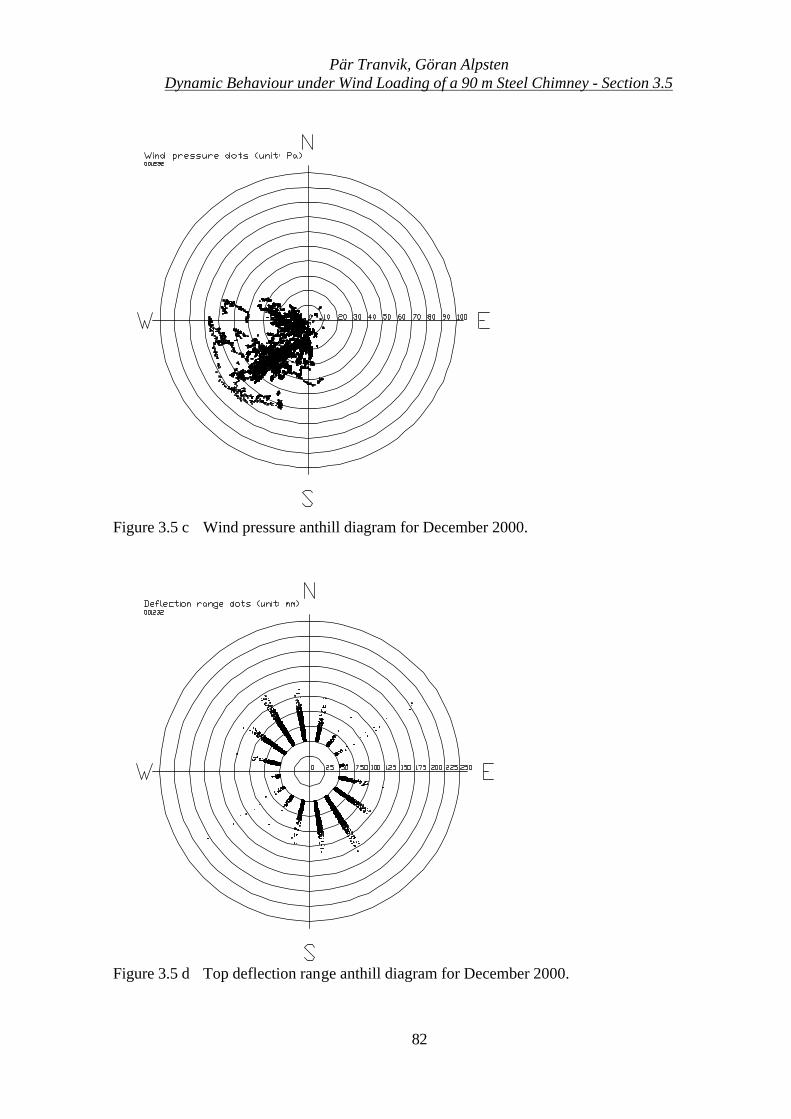
Pär Tranvik, Göran AlpstenDynamic Behaviour under Wind Loading of a 90 m Steel Chimney - Section 3.5
82
Figure 3.5 c Wind pressure anthill diagram for December 2000.
Figure 3.5 d Top deflection range anthill diagram for December 2000.
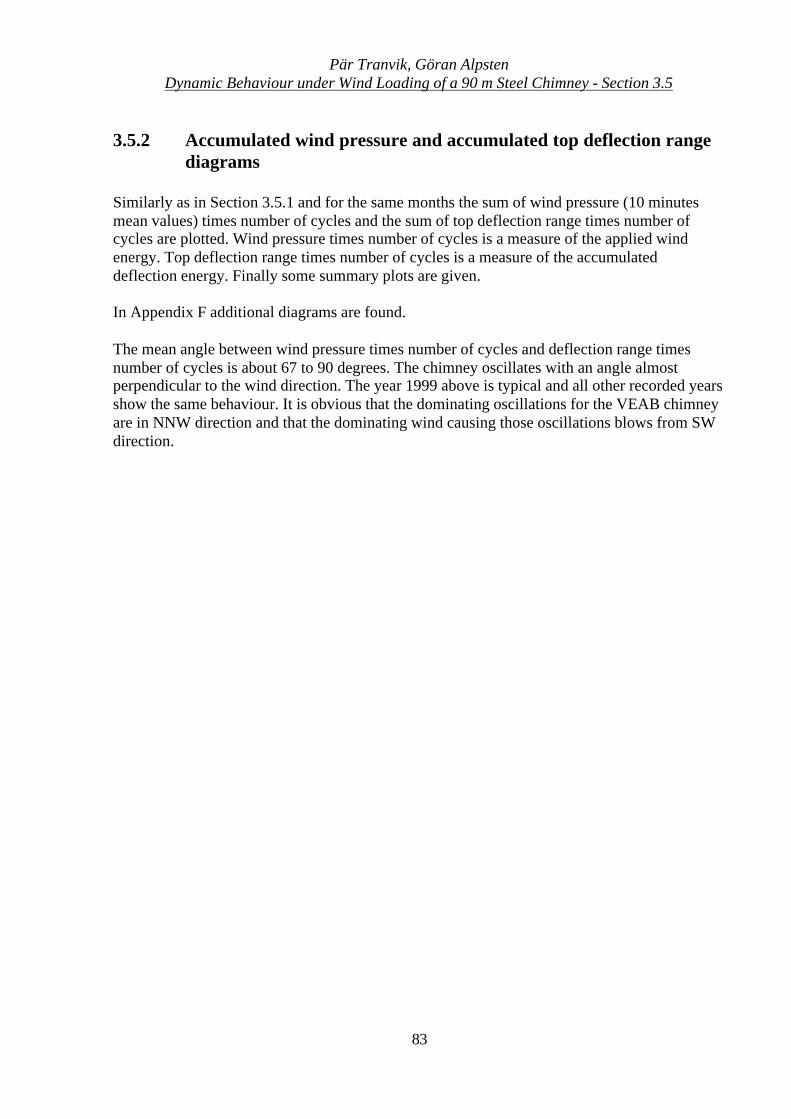
Pär Tranvik, Göran AlpstenDynamic Behaviour under Wind Loading of a 90 m Steel Chimney - Section 3.5
83
3.5.2 Accumulated wind pressure and accumulated top deflection rangediagrams
Similarly as in Section 3.5.1 and for the same months the sum of wind pressure (10 minutesmean values) times number of cycles and the sum of top deflection range times number ofcycles are plotted. Wind pressure times number of cycles is a measure of the applied windenergy. Top deflection range times number of cycles is a measure of the accumulateddeflection energy. Finally some summary plots are given.
In Appendix F additional diagrams are found.
The mean angle between wind pressure times number of cycles and deflection range timesnumber of cycles is about 67 to 90 degrees. The chimney oscillates with an angle almostperpendicular to the wind direction. The year 1999 above is typical and all other recorded yearsshow the same behaviour. It is obvious that the dominating oscillations for the VEAB chimneyare in NNW direction and that the dominating wind causing those oscillations blows from SWdirection.
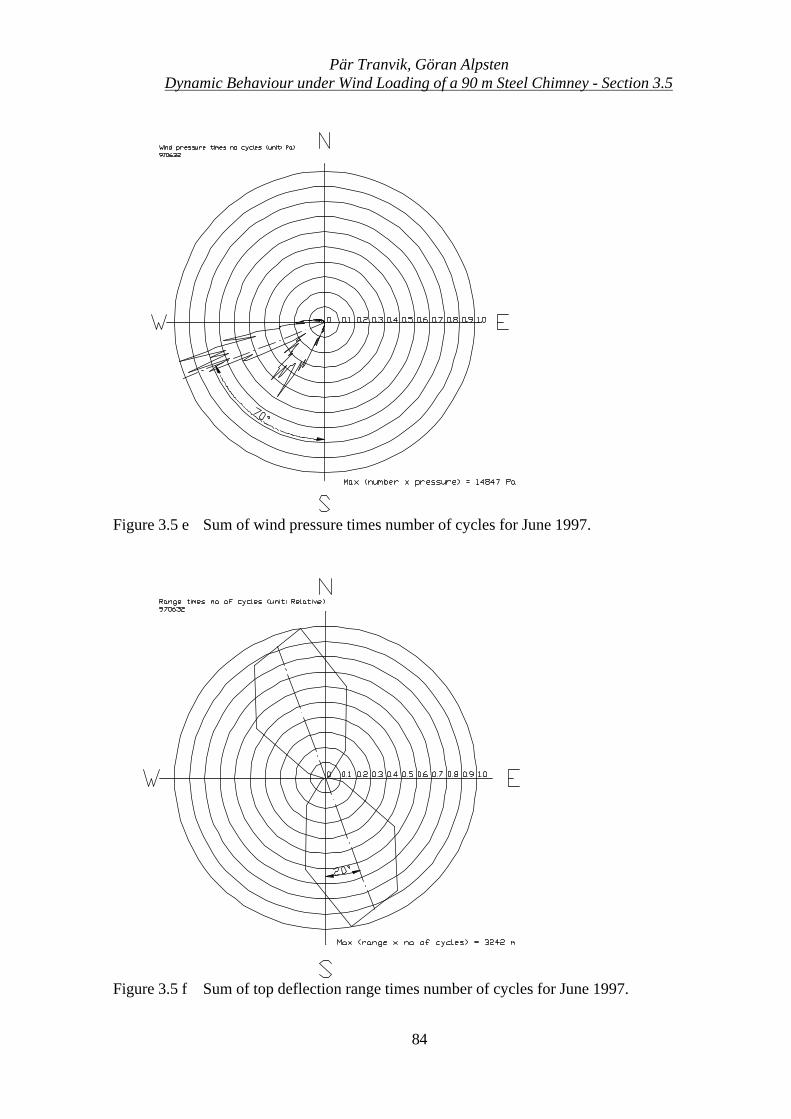
Pär Tranvik, Göran AlpstenDynamic Behaviour under Wind Loading of a 90 m Steel Chimney - Section 3.5
84
Figure 3.5 e Sum of wind pressure times number of cycles for June 1997.
Figure 3.5 f Sum of top deflection range times number of cycles for June 1997.
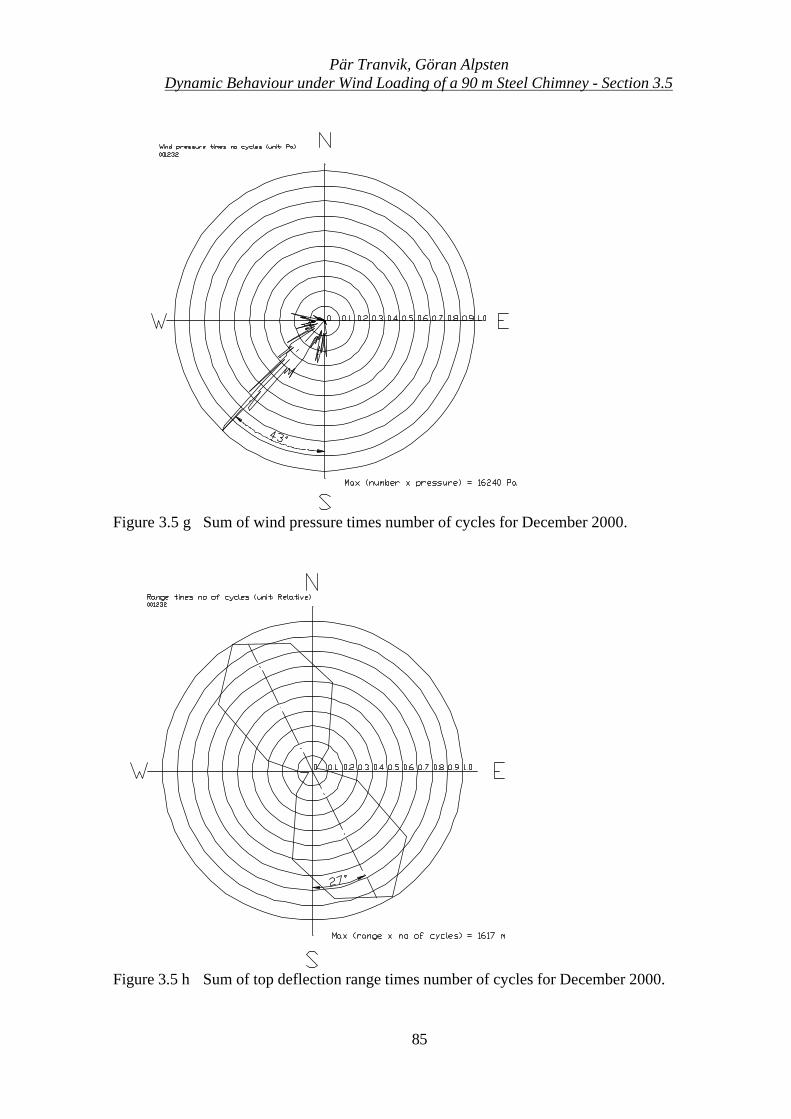
Pär Tranvik, Göran AlpstenDynamic Behaviour under Wind Loading of a 90 m Steel Chimney - Section 3.5
85
Figure 3.5 g Sum of wind pressure times number of cycles for December 2000.
Figure 3.5 h Sum of top deflection range times number of cycles for December 2000.
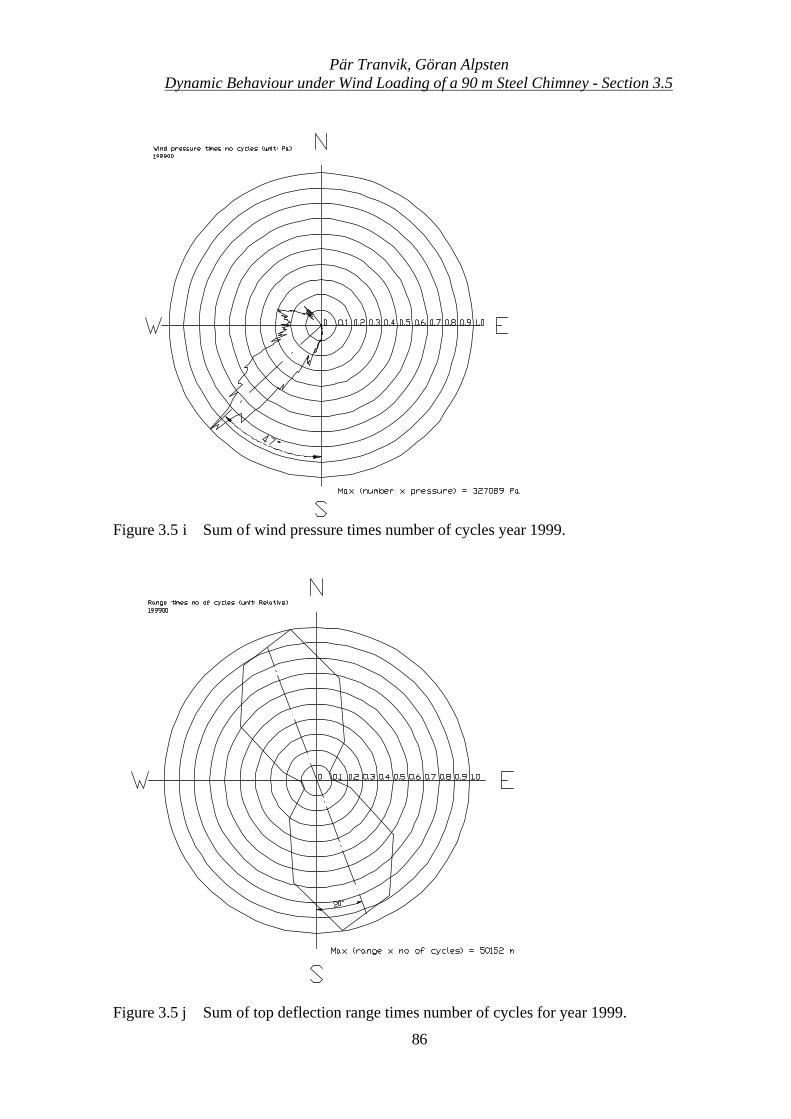
Pär Tranvik, Göran AlpstenDynamic Behaviour under Wind Loading of a 90 m Steel Chimney - Section 3.5
86
Figure 3.5 i Sum of wind pressure times number of cycles year 1999.
Figure 3.5 j Sum of top deflection range times number of cycles for year 1999.
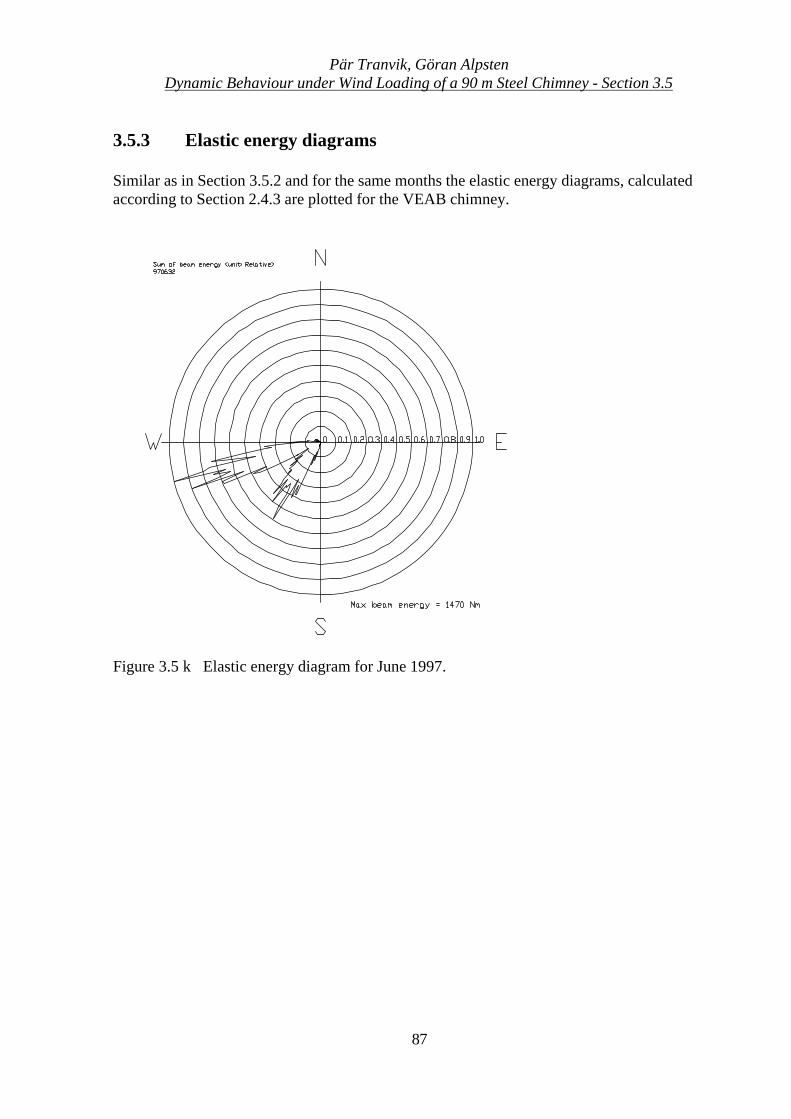
Pär Tranvik, Göran AlpstenDynamic Behaviour under Wind Loading of a 90 m Steel Chimney - Section 3.5
87
3.5.3 Elastic energy diagrams
Similar as in Section 3.5.2 and for the same months the elastic energy diagrams, calculatedaccording to Section 2.4.3 are plotted for the VEAB chimney.
Figure 3.5 k Elastic energy diagram for June 1997.
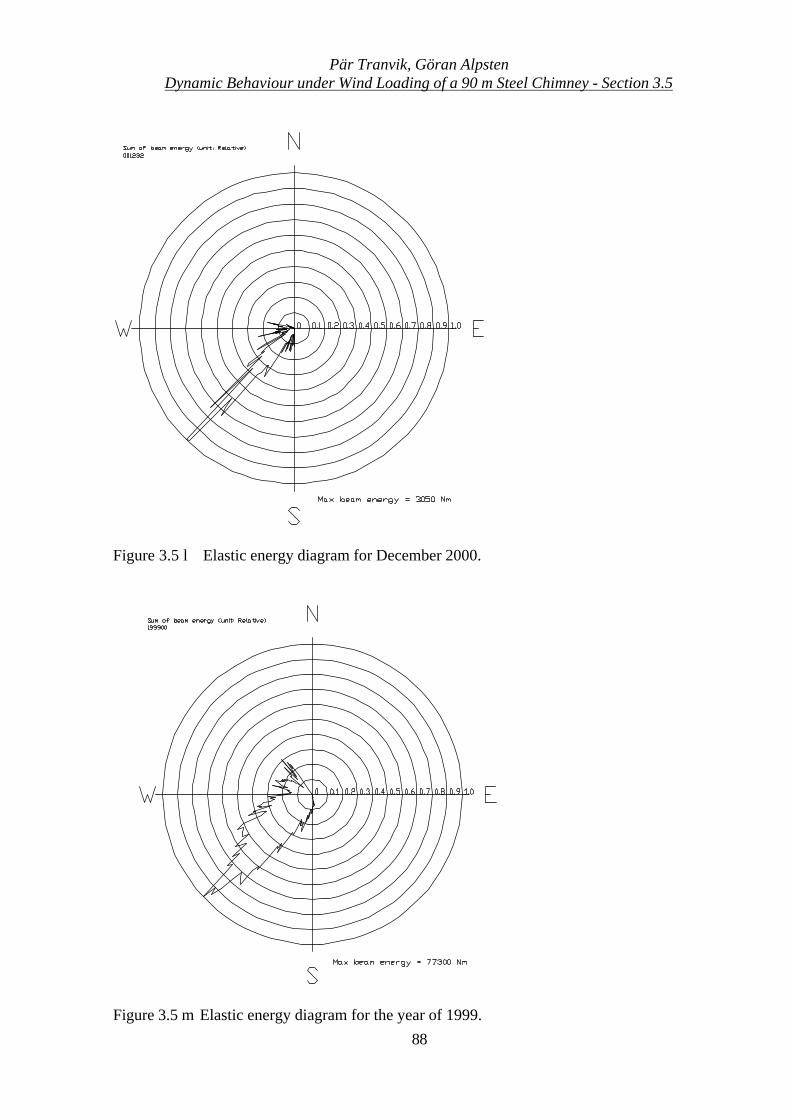
Pär Tranvik, Göran AlpstenDynamic Behaviour under Wind Loading of a 90 m Steel Chimney - Section 3.5
88
Figure 3.5 l Elastic energy diagram for December 2000.
Figure 3.5 m Elastic energy diagram for the year of 1999.
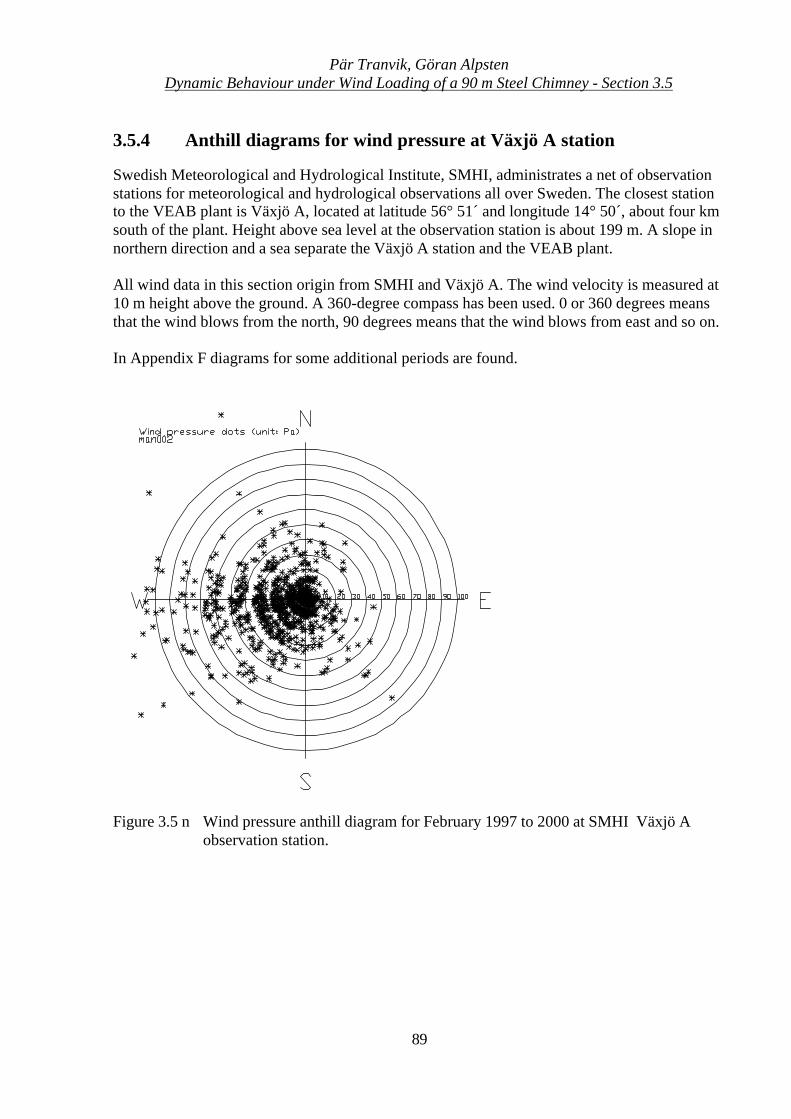
Pär Tranvik, Göran AlpstenDynamic Behaviour under Wind Loading of a 90 m Steel Chimney - Section 3.5
89
3.5.4 Anthill diagrams for wind pressure at Växjö A station
Swedish Meteorological and Hydrological Institute, SMHI, administrates a net of observationstations for meteorological and hydrological observations all over Sweden. The closest stationto the VEAB plant is Växjö A, located at latitude 56° 51´ and longitude 14° 50´, about four kmsouth of the plant. Height above sea level at the observation station is about 199 m. A slope innorthern direction and a sea separate the Växjö A station and the VEAB plant.
All wind data in this section origin from SMHI and Växjö A. The wind velocity is measured at10 m height above the ground. A 360-degree compass has been used. 0 or 360 degrees meansthat the wind blows from the north, 90 degrees means that the wind blows from east and so on.
In Appendix F diagrams for some additional periods are found.
Figure 3.5 n Wind pressure anthill diagram for February 1997 to 2000 at SMHI Växjö Aobservation station.
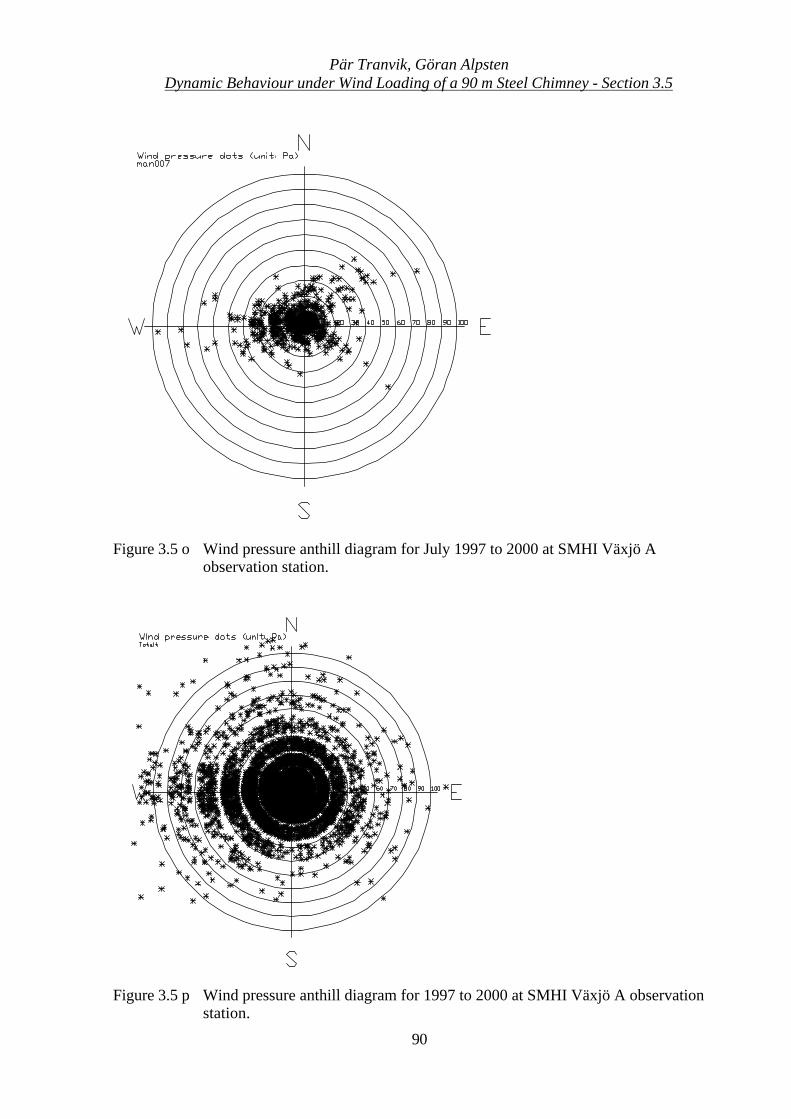
Pär Tranvik, Göran AlpstenDynamic Behaviour under Wind Loading of a 90 m Steel Chimney - Section 3.5
90
Figure 3.5 o Wind pressure anthill diagram for July 1997 to 2000 at SMHI Växjö Aobservation station.
Figure 3.5 p Wind pressure anthill diagram for 1997 to 2000 at SMHI Växjö A observationstation.
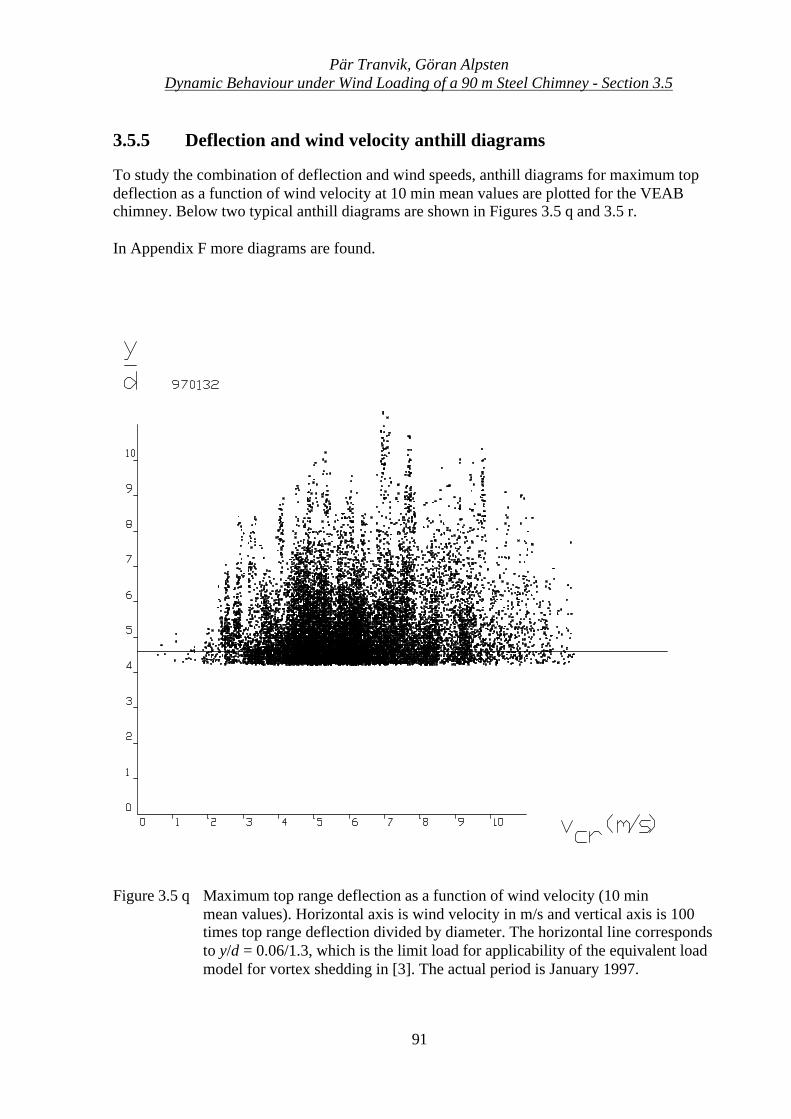
Pär Tranvik, Göran AlpstenDynamic Behaviour under Wind Loading of a 90 m Steel Chimney - Section 3.5
91
3.5.5 Deflection and wind velocity anthill diagrams
To study the combination of deflection and wind speeds, anthill diagrams for maximum topdeflection as a function of wind velocity at 10 min mean values are plotted for the VEABchimney. Below two typical anthill diagrams are shown in Figures 3.5 q and 3.5 r.
In Appendix F more diagrams are found.
Figure 3.5 q Maximum top range deflection as a function of wind velocity (10 minmean values). Horizontal axis is wind velocity in m/s and vertical axis is 100times top range deflection divided by diameter. The horizontal line correspondsto y/d = 0.06/1.3, which is the limit load for applicability of the equivalent loadmodel for vortex shedding in [3]. The actual period is January 1997.
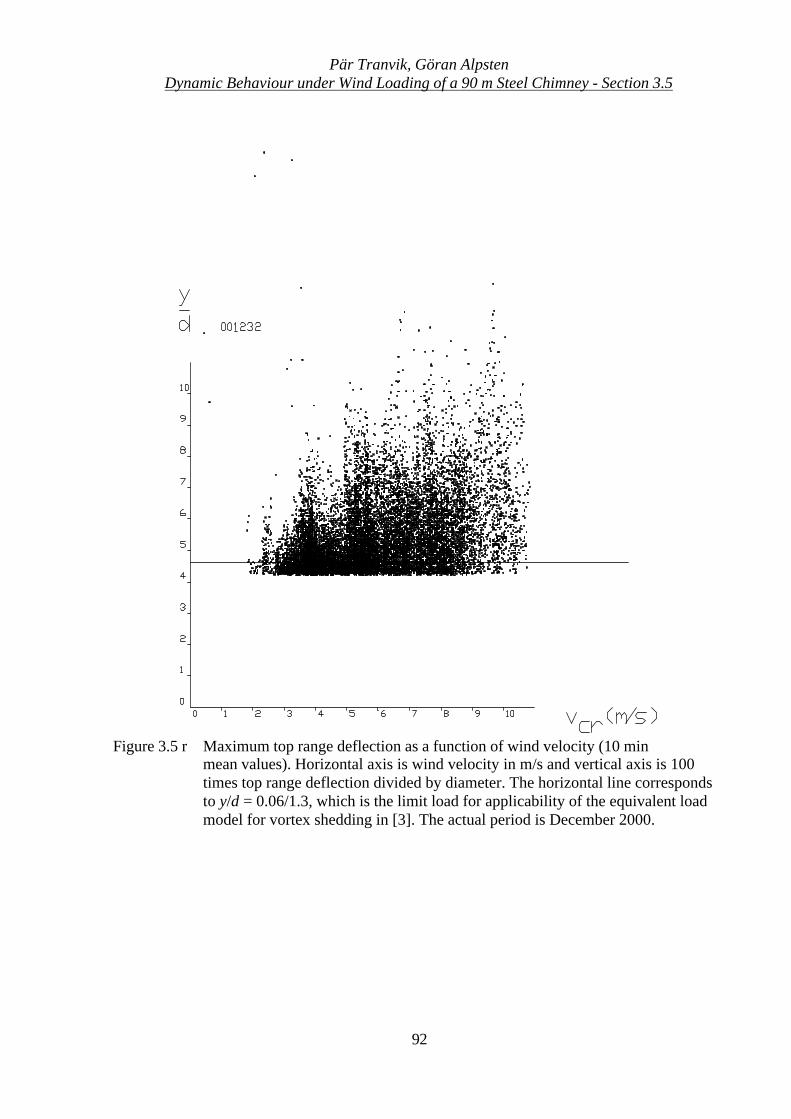
Pär Tranvik, Göran AlpstenDynamic Behaviour under Wind Loading of a 90 m Steel Chimney - Section 3.5
92
Figure 3.5 r Maximum top range deflection as a function of wind velocity (10 minmean values). Horizontal axis is wind velocity in m/s and vertical axis is 100times top range deflection divided by diameter. The horizontal line correspondsto y/d = 0.06/1.3, which is the limit load for applicability of the equivalent loadmodel for vortex shedding in [3]. The actual period is December 2000.
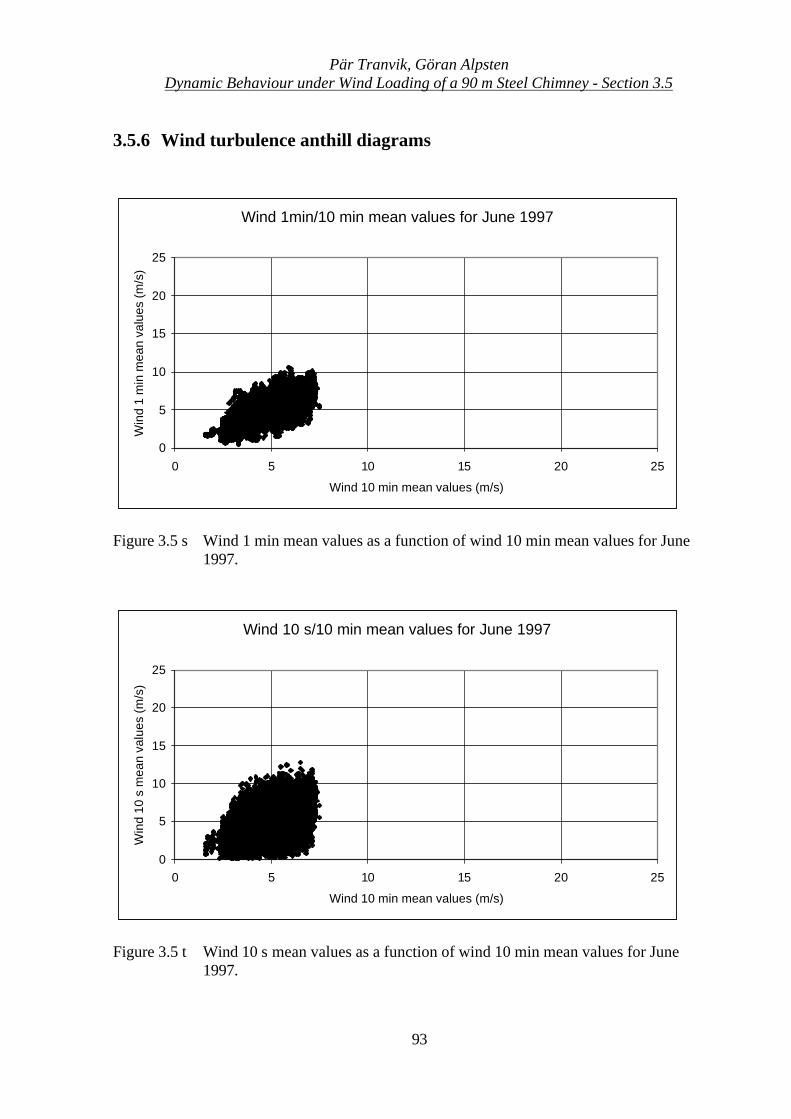
Pär Tranvik, Göran AlpstenDynamic Behaviour under Wind Loading of a 90 m Steel Chimney - Section 3.5
93
3.5.6 Wind turbulence anthill diagrams
Wind 1min/10 min mean values for June 1997
0
5
10
15
20
25
0 5 10 15 20 25
Wind 10 min mean values (m/s)
Win
d 1
min
mea
n va
lues
(m/s
)
Figure 3.5 s Wind 1 min mean values as a function of wind 10 min mean values for June1997.
Wind 10 s/10 min mean values for June 1997
0
5
10
15
20
25
0 5 10 15 20 25
Wind 10 min mean values (m/s)
Win
d 10
s m
ean
valu
es (m
/s)
Figure 3.5 t Wind 10 s mean values as a function of wind 10 min mean values for June1997.
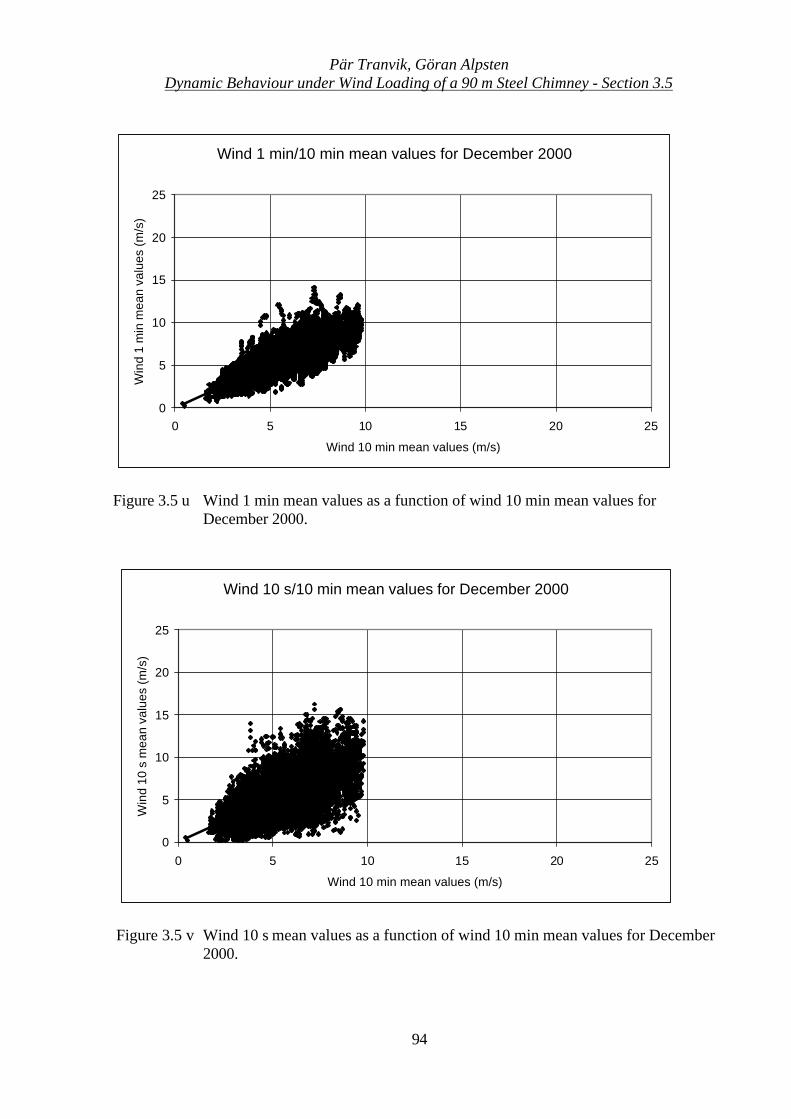
Pär Tranvik, Göran AlpstenDynamic Behaviour under Wind Loading of a 90 m Steel Chimney - Section 3.5
94
Wind 1 min/10 min mean values for December 2000
0
5
10
15
20
25
0 5 10 15 20 25
Wind 10 min mean values (m/s)
Win
d 1
min
mea
n va
lues
(m/s
)
Figure 3.5 u Wind 1 min mean values as a function of wind 10 min mean values forDecember 2000.
Wind 10 s/10 min mean values for December 2000
0
5
10
15
20
25
0 5 10 15 20 25
Wind 10 min mean values (m/s)
Win
d 10
s m
ean
valu
es (m
/s)
Figure 3.5 v Wind 10 s mean values as a function of wind 10 min mean values for December2000.
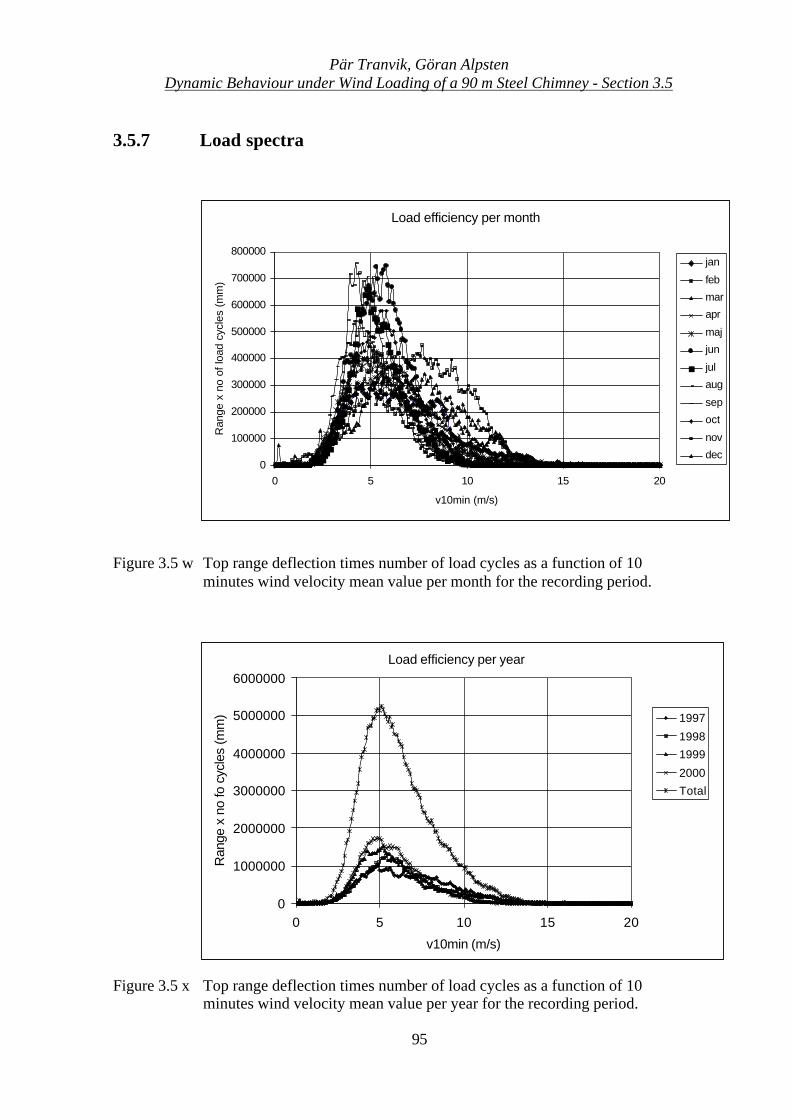
Pär Tranvik, Göran AlpstenDynamic Behaviour under Wind Loading of a 90 m Steel Chimney - Section 3.5
95
3.5.7 Load spectra
Figure 3.5 w Top range deflection times number of load cycles as a function of 10minutes wind velocity mean value per month for the recording period.
Figure 3.5 x Top range deflection times number of load cycles as a function of 10minutes wind velocity mean value per year for the recording period.
Load efficiency per month
0
100000
200000
300000
400000
500000
600000
700000
800000
0 5 10 15 20
v10min (m/s)
Ran
ge x
no
of lo
ad c
ycle
s (m
m)
jan
feb
mar
apr
maj
jun
jul
aug
sep
oct
nov
dec
Load efficiency per year
0
1000000
2000000
3000000
4000000
5000000
6000000
0 5 10 15 20
v10min (m/s)
Ran
ge x
no
fo c
ycle
s (m
m) 1997
1998
1999
2000
Total
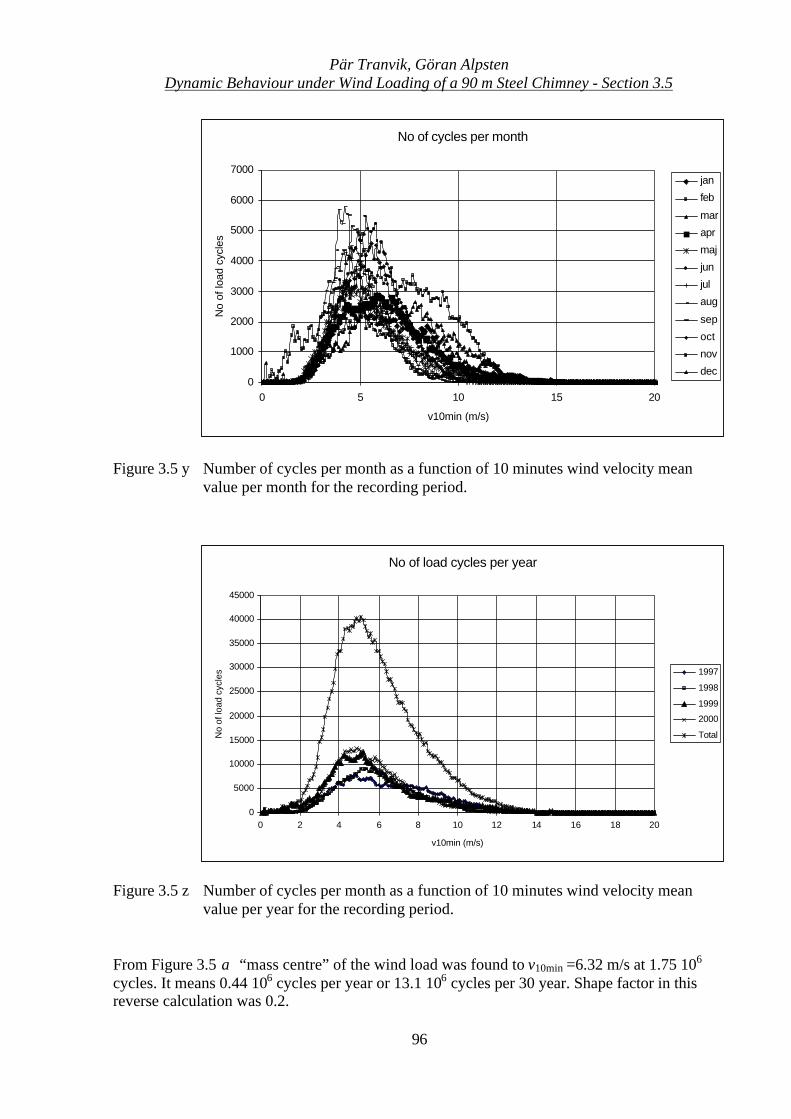
Pär Tranvik, Göran AlpstenDynamic Behaviour under Wind Loading of a 90 m Steel Chimney - Section 3.5
96
Figure 3.5 y Number of cycles per month as a function of 10 minutes wind velocity meanvalue per month for the recording period.
Figure 3.5 z Number of cycles per month as a function of 10 minutes wind velocity meanvalue per year for the recording period.
From Figure 3.5 α “mass centre” of the wind load was found to v10min =6.32 m/s at 1.75 106
cycles. It means 0.44 106 cycles per year or 13.1 106 cycles per 30 year. Shape factor in thisreverse calculation was 0.2.
No of cycles per month
0
1000
2000
3000
4000
5000
6000
7000
0 5 10 15 20
v10min (m/s)
No
of lo
ad c
ycle
s
jan
feb
mar
apr
maj
jun
jul
aug
sep
oct
nov
dec
No of load cycles per year
0
5000
10000
15000
20000
25000
30000
35000
40000
45000
0 2 4 6 8 10 12 14 16 18 20
v10min (m/s)
No
of lo
ad c
ycle
s 1997
1998
1999
2000
Total
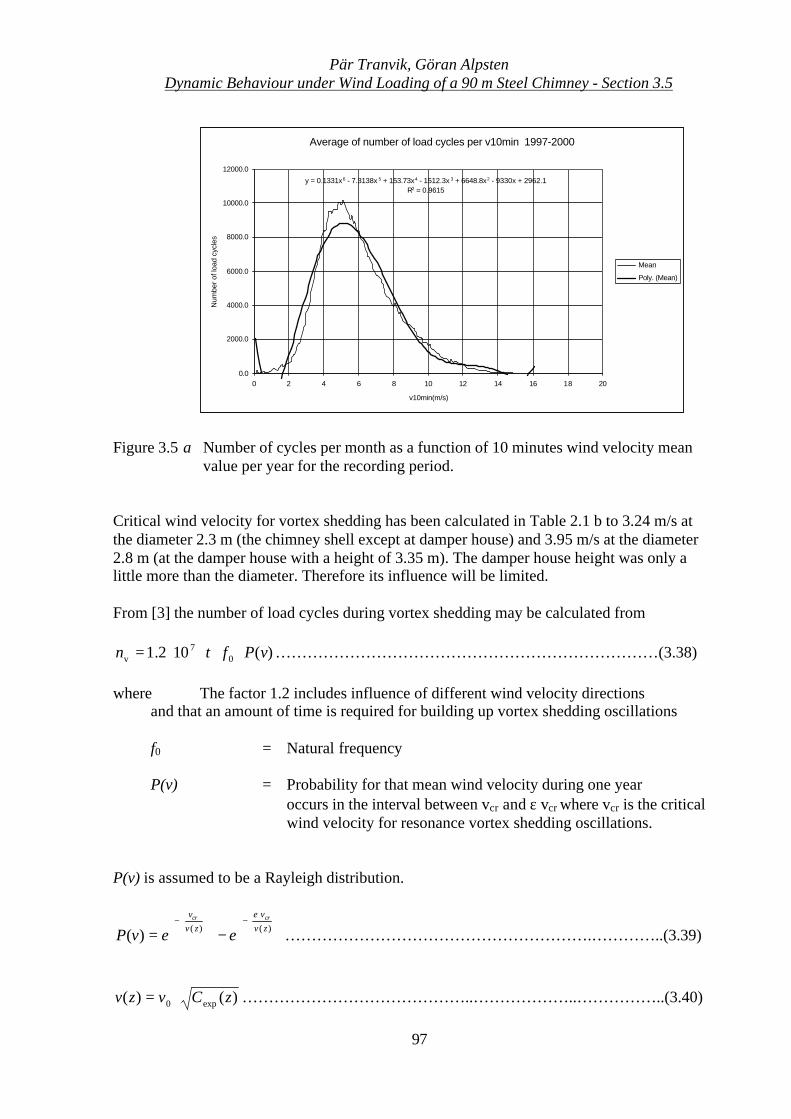
Pär Tranvik, Göran AlpstenDynamic Behaviour under Wind Loading of a 90 m Steel Chimney - Section 3.5
97
Figure 3.5 α Number of cycles per month as a function of 10 minutes wind velocity meanvalue per year for the recording period.
Critical wind velocity for vortex shedding has been calculated in Table 2.1 b to 3.24 m/s atthe diameter 2.3 m (the chimney shell except at damper house) and 3.95 m/s at the diameter2.8 m (at the damper house with a height of 3.35 m). The damper house height was only alittle more than the diameter. Therefore its influence will be limited.
From [3] the number of load cycles during vortex shedding may be calculated from
)(102.1 07
v vPftn ⋅⋅⋅⋅= ………………………………………………………………(3.38)
where The factor 1.2 includes influence of different wind velocity directionsand that an amount of time is required for building up vortex shedding oscillations
f0 = Natural frequency
P(v) = Probability for that mean wind velocity during one yearoccurs in the interval between vcr and ε vcr where vcr is the criticalwind velocity for resonance vortex shedding oscillations.
P(v) is assumed to be a Rayleigh distribution.
⋅−
−
−= )()()( zvv
zvv crcr
eevPε
………………………………………………….…………..(3.39)
)()( exp0 zCvzv ⋅= ……………………………………..………………..……………..(3.40)
Average of number of load cycles per v10min 1997-2000
y = 0.1331x6 - 7.3138x 5 + 153.73x4 - 1512.3x 3 + 6648.8x2 - 9330x + 2962.1R2 = 0.9615
0.0
2000.0
4000.0
6000.0
8000.0
10000.0
12000.0
0 2 4 6 8 10 12 14 16 18 20
v10min(m/s)
Num
ber o
f loa
d cy
cles
Mean
Poly. (Mean)
Pär Tranvik, Göran AlpstenDynamic Behaviour under Wind Loading of a 90 m Steel Chimney - Section 3.5
98
where v(z) = Yearly mean wind velocity at the height zv0 = The modal value of the distribution, 5.5 m/sε = 1.25 but the difference between ε and ε vcr should be at least 2
m/s
vcr is defined in Section 2.4.2. Cexp is defined and found from Table 3.2 a to 2.03.
Numerical values for the VEAB chimney gives
v(z) = 7.83 m/sP(v) = 0.204nv = 6107.0 ⋅ oscillations per year or 61021⋅ oscillations for a 30 year period
The wind velocity found is twice the value achieved if the code [3] is extrapolated outside itslimits but the number of cycles is less. In Figure 6.3 b the spectra for top deflection(functioning damper) is shown for both the recordings and some codes.
The wind vortex shedding load on the VEAB chimney is 4.224.3102132.6101.13
26
26
=⋅⋅⋅⋅
times larger
than what will be assumed from calculations according to [3] when limit restrictions areneglected (gust wind is not considered).
In Figure 3.5 β cumulative frequency of top deflection range for strain gauge no 4 is shown.The data for 4 years of service 1997 through 2000, a graphically fitted lognormal distributionfor cumulative frequency of top deflection range and limits from Kolmogorov-Smirnov test(α=0.05) are plotted.
Because of the truncation of the data, top deflection range100 mm, the fitted curve differsgreatly from measure data at the lower end. A log-normal representation has been chosen forsimplicity.
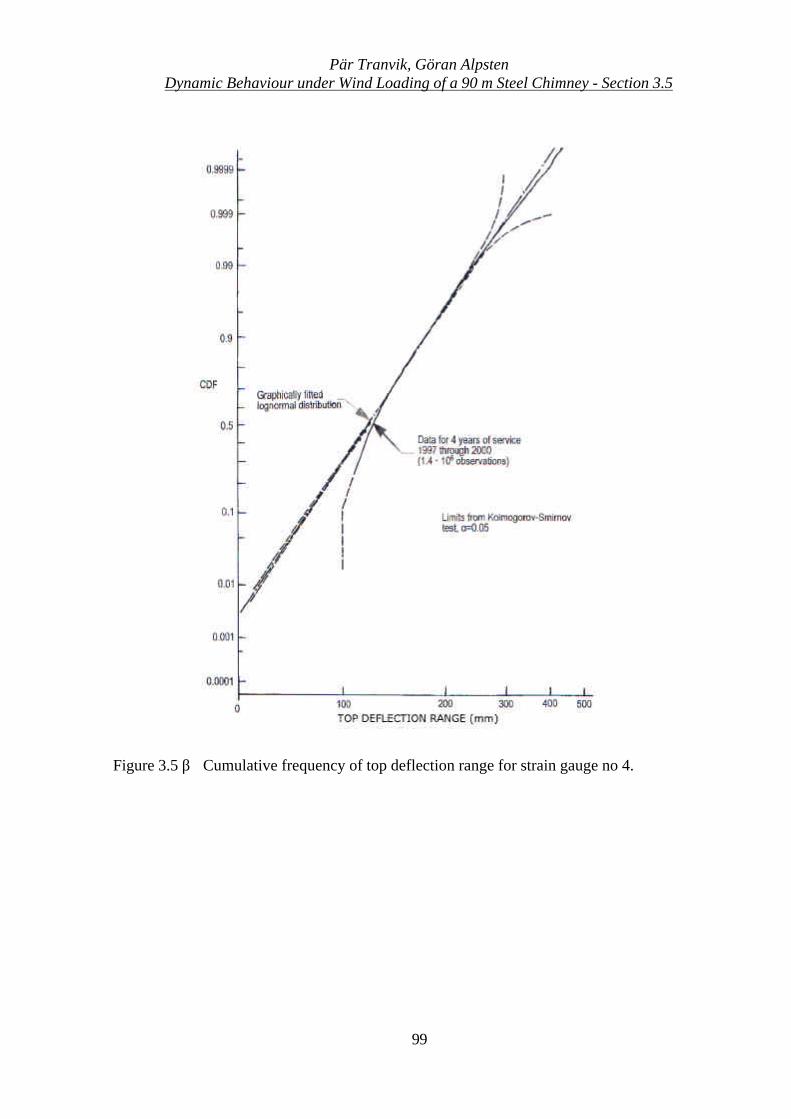
Pär Tranvik, Göran AlpstenDynamic Behaviour under Wind Loading of a 90 m Steel Chimney - Section 3.5
99
Figure 3.5 β Cumulative frequency of top deflection range for strain gauge no 4.
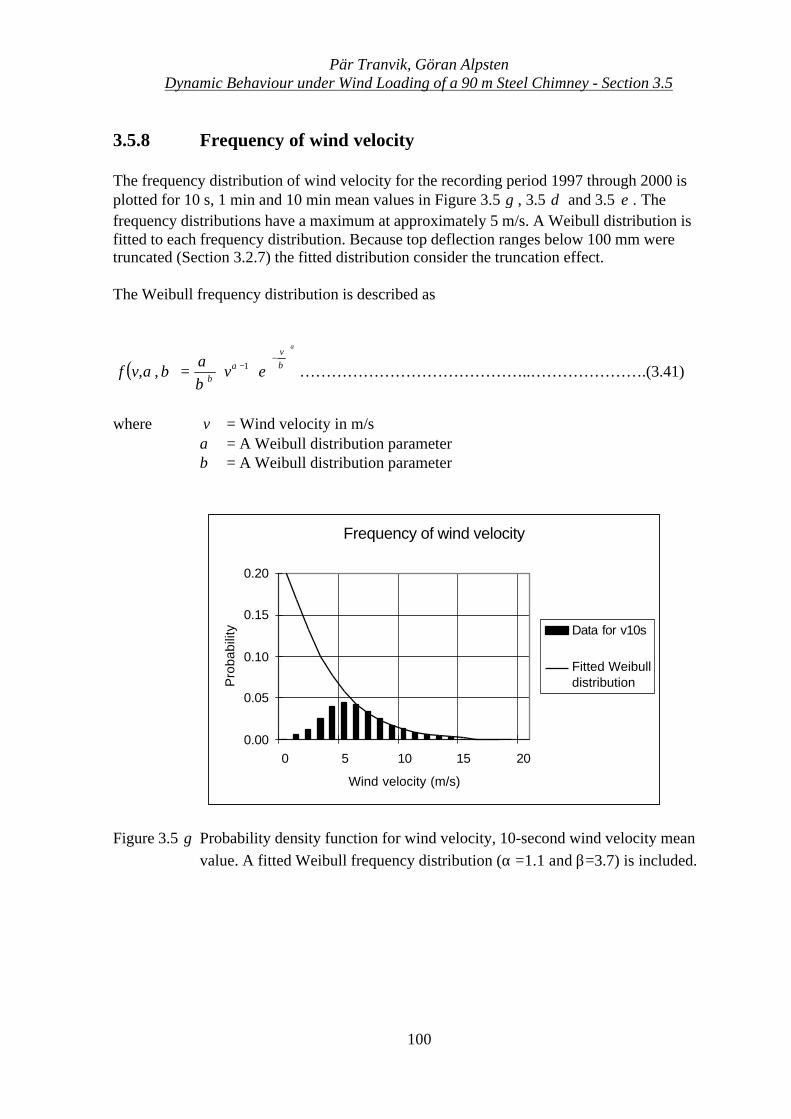
Pär Tranvik, Göran AlpstenDynamic Behaviour under Wind Loading of a 90 m Steel Chimney - Section 3.5
100
3.5.8 Frequency of wind velocity
The frequency distribution of wind velocity for the recording period 1997 through 2000 isplotted for 10 s, 1 min and 10 min mean values in Figure 3.5 γ , 3.5 δ and 3.5 ε . Thefrequency distributions have a maximum at approximately 5 m/s. A Weibull distribution isfitted to each frequency distribution. Because top deflection ranges below 100 mm weretruncated (Section 3.2.7) the fitted distribution consider the truncation effect.
The Weibull frequency distribution is described as
( )α
βα
βα
βα
−
− ⋅⋅=v
b evvf 1,, ……………………………………..………………….(3.41)
where v = Wind velocity in m/sα = A Weibull distribution parameterβ = A Weibull distribution parameter
Frequency of wind velocity
0.00
0.05
0.10
0.15
0.20
0 5 10 15 20
Wind velocity (m/s)
Pro
babi
lity Data for v10s
Fitted Weibulldistribution
Figure 3.5 γ Probability density function for wind velocity, 10-second wind velocity meanvalue. A fitted Weibull frequency distribution (α =1.1 and β=3.7) is included.
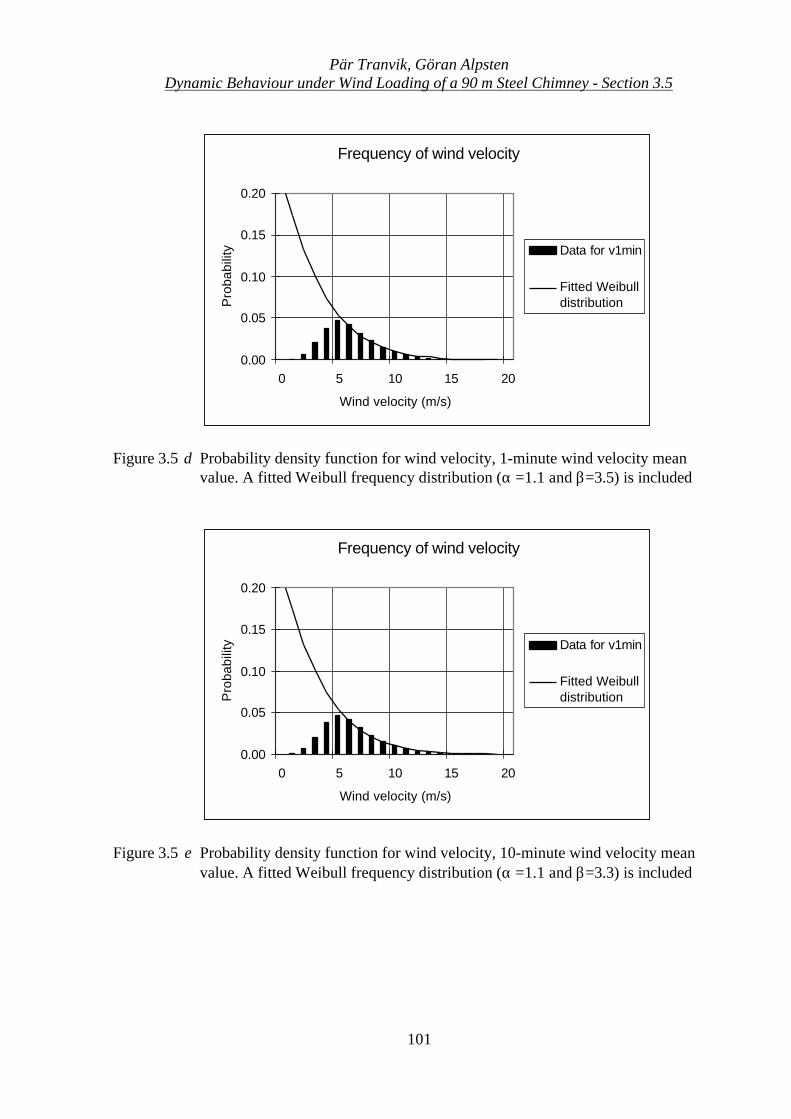
Pär Tranvik, Göran AlpstenDynamic Behaviour under Wind Loading of a 90 m Steel Chimney - Section 3.5
101
Frequency of wind velocity
0.00
0.05
0.10
0.15
0.20
0 5 10 15 20
Wind velocity (m/s)
Pro
babi
lity Data for v1min
Fitted Weibulldistribution
Figure 3.5 δ Probability density function for wind velocity, 1-minute wind velocity meanvalue. A fitted Weibull frequency distribution (α =1.1 and β=3.5) is included
Frequency of wind velocity
0.00
0.05
0.10
0.15
0.20
0 5 10 15 20
Wind velocity (m/s)
Pro
babi
lity Data for v1min
Fitted Weibulldistribution
Figure 3.5 ε Probability density function for wind velocity, 10-minute wind velocity meanvalue. A fitted Weibull frequency distribution (α =1.1 and β=3.3) is included
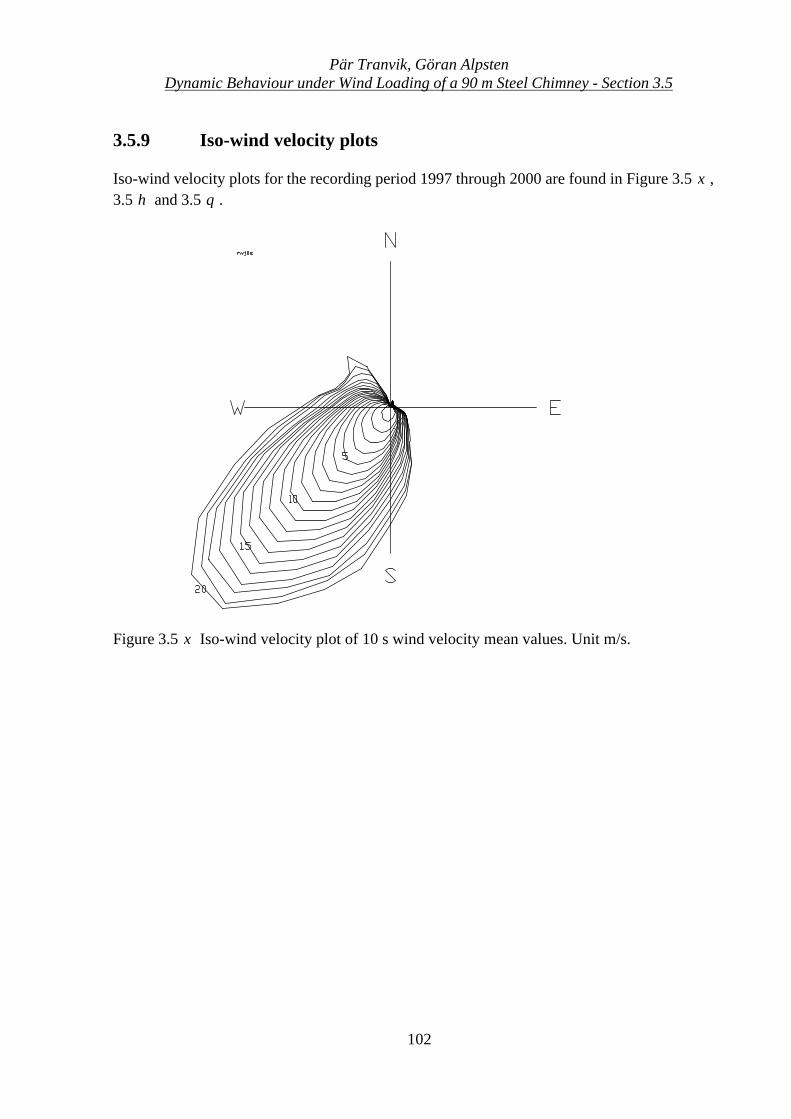
Pär Tranvik, Göran AlpstenDynamic Behaviour under Wind Loading of a 90 m Steel Chimney - Section 3.5
102
3.5.9 Iso-wind velocity plots
Iso-wind velocity plots for the recording period 1997 through 2000 are found in Figure 3.5 ξ ,3.5 η and 3.5 θ .
Figure 3.5 ξ Iso-wind velocity plot of 10 s wind velocity mean values. Unit m/s.
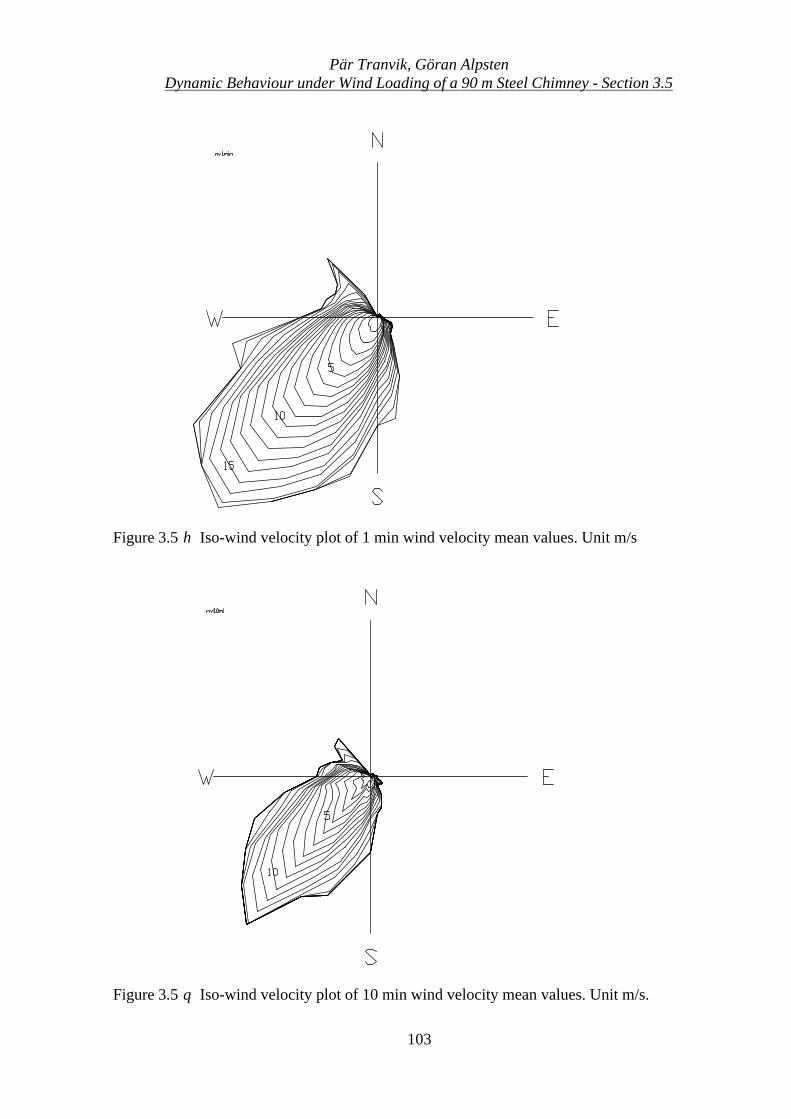
Pär Tranvik, Göran AlpstenDynamic Behaviour under Wind Loading of a 90 m Steel Chimney - Section 3.5
103
Figure 3.5 η Iso-wind velocity plot of 1 min wind velocity mean values. Unit m/s
Figure 3.5 θ Iso-wind velocity plot of 10 min wind velocity mean values. Unit m/s.
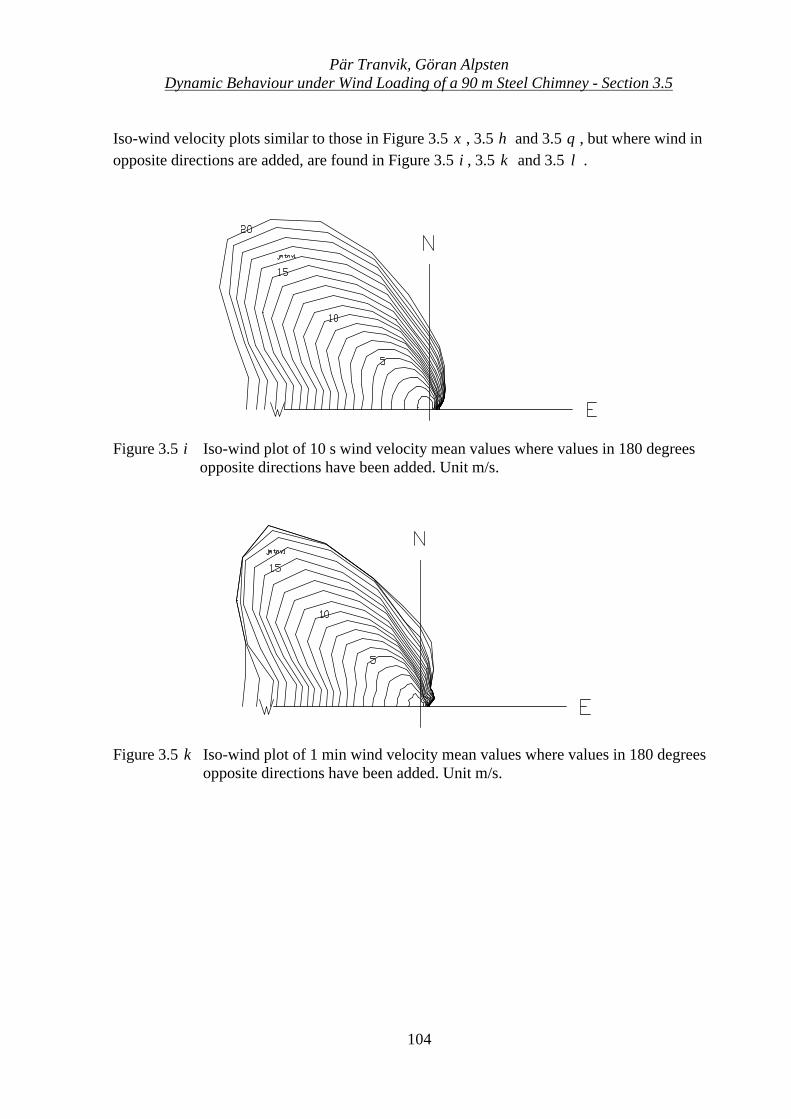
Pär Tranvik, Göran AlpstenDynamic Behaviour under Wind Loading of a 90 m Steel Chimney - Section 3.5
104
Iso-wind velocity plots similar to those in Figure 3.5 ξ , 3.5 η and 3.5 θ , but where wind inopposite directions are added, are found in Figure 3.5 ι , 3.5 κ and 3.5 λ .
Figure 3.5 ι Iso-wind plot of 10 s wind velocity mean values where values in 180 degreesopposite directions have been added. Unit m/s.
Figure 3.5 κ Iso-wind plot of 1 min wind velocity mean values where values in 180 degreesopposite directions have been added. Unit m/s.
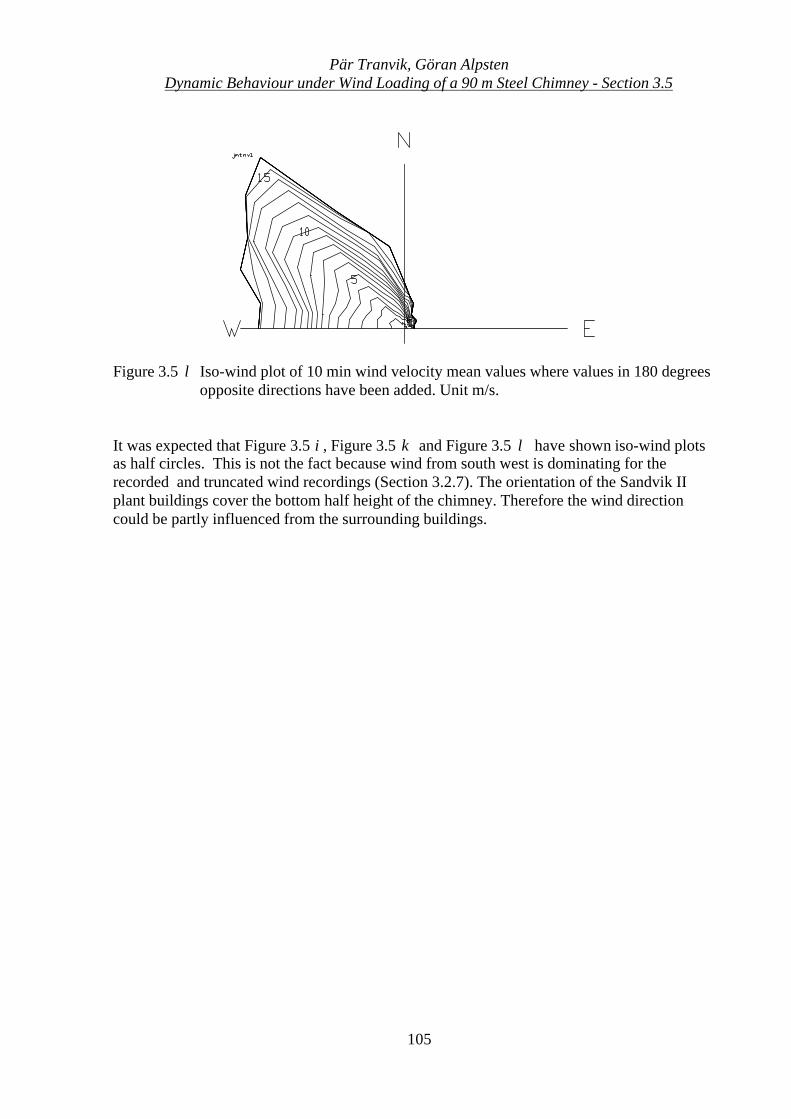
Pär Tranvik, Göran AlpstenDynamic Behaviour under Wind Loading of a 90 m Steel Chimney - Section 3.5
105
Figure 3.5 λ Iso-wind plot of 10 min wind velocity mean values where values in 180 degreesopposite directions have been added. Unit m/s.
It was expected that Figure 3.5 ι , Figure 3.5 κ and Figure 3.5 λ have shown iso-wind plotsas half circles. This is not the fact because wind from south west is dominating for therecorded and truncated wind recordings (Section 3.2.7). The orientation of the Sandvik IIplant buildings cover the bottom half height of the chimney. Therefore the wind directioncould be partly influenced from the surrounding buildings.
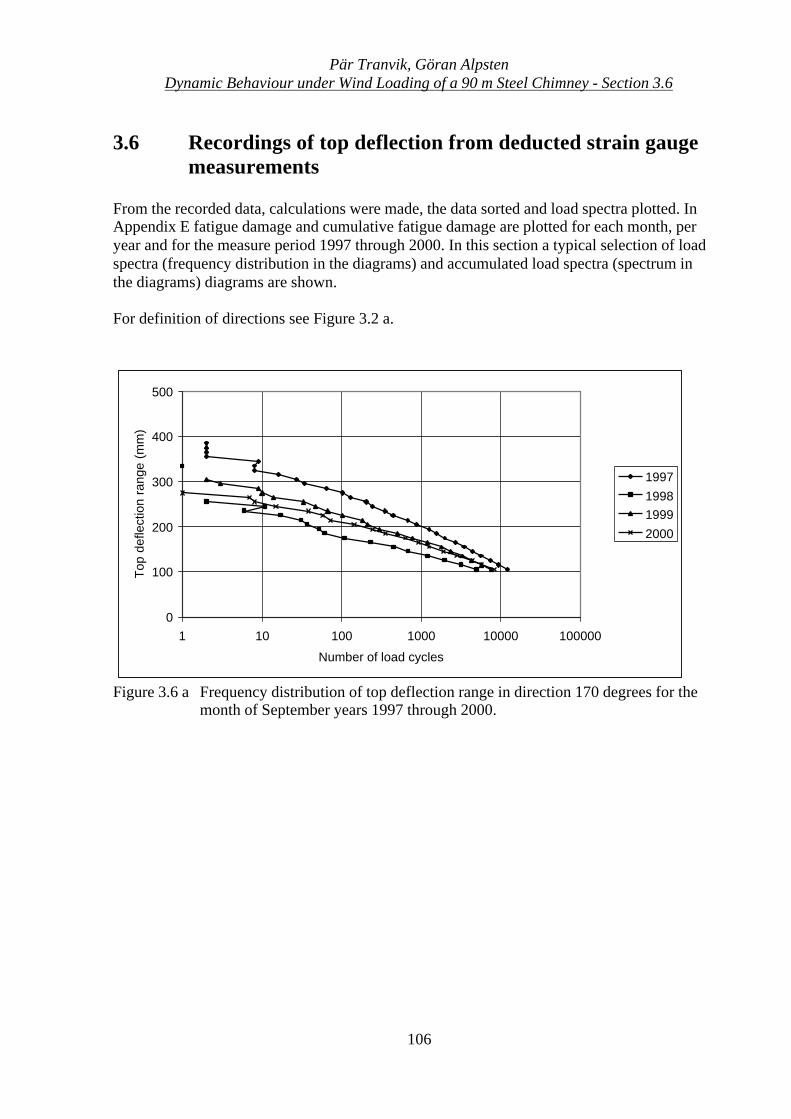
Pär Tranvik, Göran AlpstenDynamic Behaviour under Wind Loading of a 90 m Steel Chimney - Section 3.6
106
3.6 Recordings of top deflection from deducted strain gaugemeasurements
From the recorded data, calculations were made, the data sorted and load spectra plotted. InAppendix E fatigue damage and cumulative fatigue damage are plotted for each month, peryear and for the measure period 1997 through 2000. In this section a typical selection of loadspectra (frequency distribution in the diagrams) and accumulated load spectra (spectrum inthe diagrams) diagrams are shown.
For definition of directions see Figure 3.2 a.
0
100
200
300
400
500
1 10 100 1000 10000 100000
Number of load cycles
Top
def
lect
ion
rang
e (m
m)
1997
19981999
2000
Figure 3.6 a Frequency distribution of top deflection range in direction 170 degrees for themonth of September years 1997 through 2000.
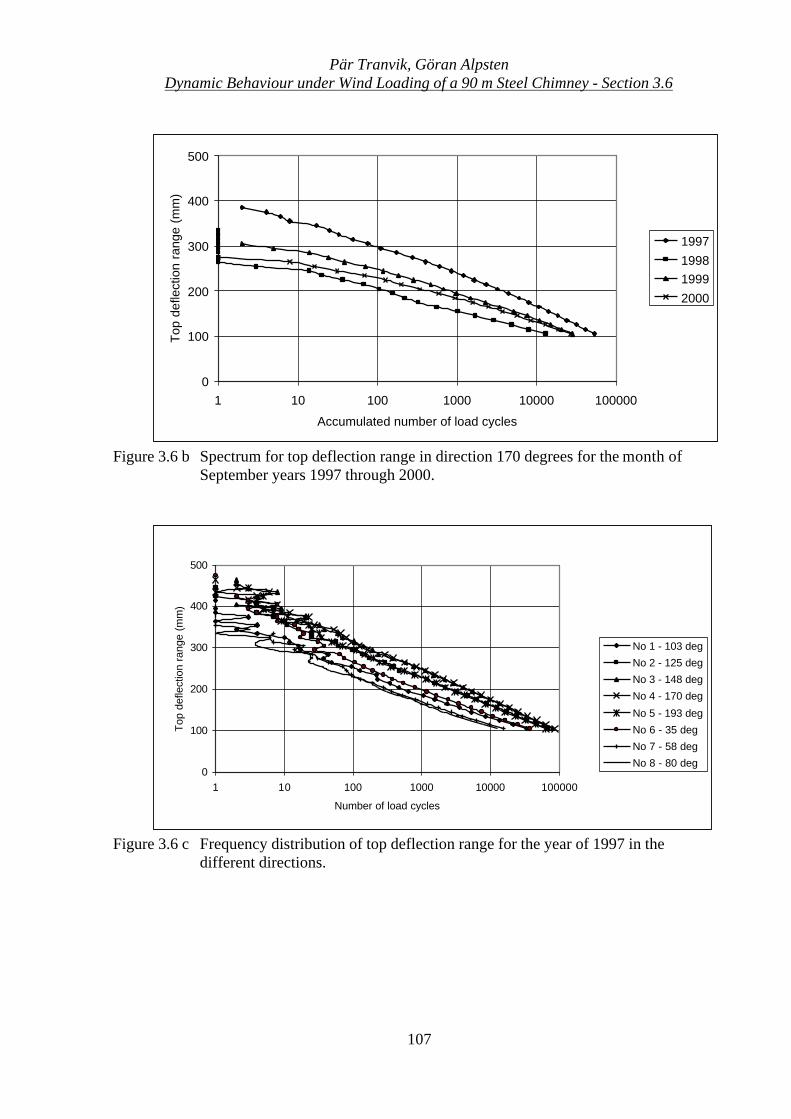
Pär Tranvik, Göran AlpstenDynamic Behaviour under Wind Loading of a 90 m Steel Chimney - Section 3.6
107
0
100
200
300
400
500
1 10 100 1000 10000 100000
Accumulated number of load cycles
Top
def
lect
ion
rang
e (m
m)
1997
19981999
2000
Figure 3.6 b Spectrum for top deflection range in direction 170 degrees for the month ofSeptember years 1997 through 2000.
0
100
200
300
400
500
1 10 100 1000 10000 100000
Number of load cycles
Top
def
lect
ion
rang
e (m
m)
No 1 - 103 deg
No 2 - 125 deg
No 3 - 148 deg
No 4 - 170 deg
No 5 - 193 deg
No 6 - 35 deg
No 7 - 58 deg
No 8 - 80 deg
Figure 3.6 c Frequency distribution of top deflection range for the year of 1997 in thedifferent directions.
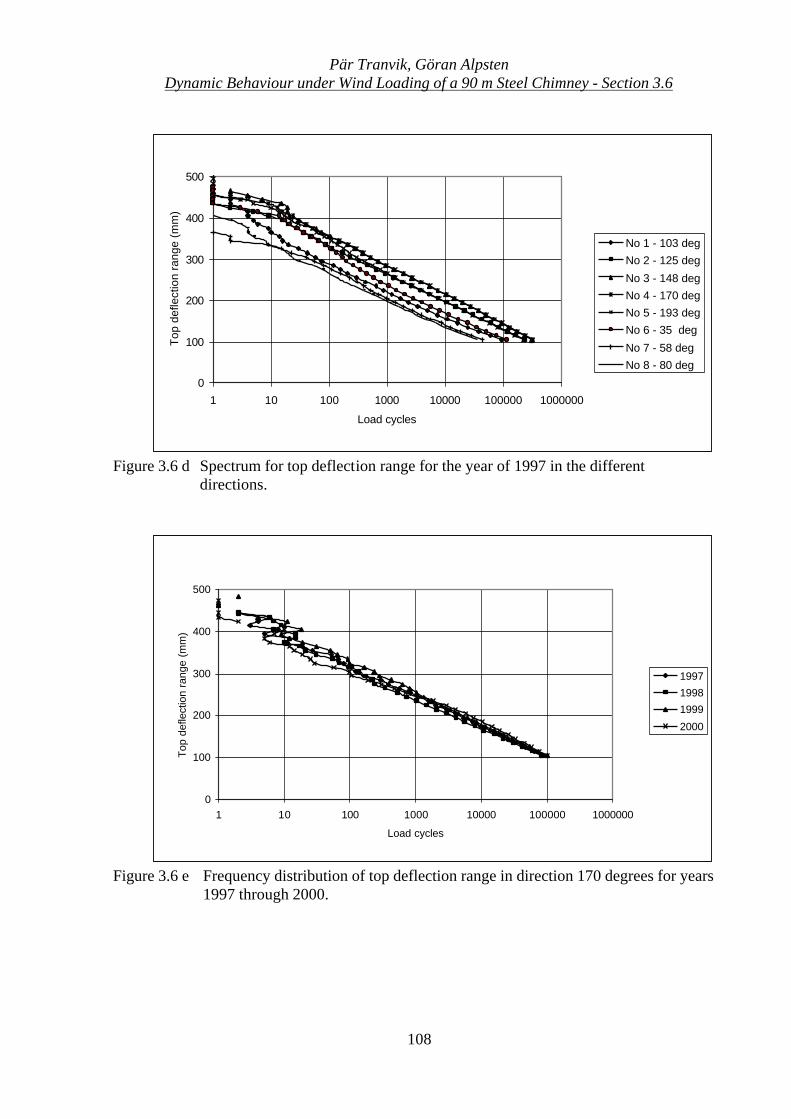
Pär Tranvik, Göran AlpstenDynamic Behaviour under Wind Loading of a 90 m Steel Chimney - Section 3.6
108
0
100
200
300
400
500
1 10 100 1000 10000 100000 1000000
Load cycles
Top
def
lect
ion
rang
e (m
m)
No 1 - 103 deg
No 2 - 125 deg
No 3 - 148 deg
No 4 - 170 deg
No 5 - 193 deg
No 6 - 35 deg
No 7 - 58 deg
No 8 - 80 deg
Figure 3.6 d Spectrum for top deflection range for the year of 1997 in the differentdirections.
0
100
200
300
400
500
1 10 100 1000 10000 100000 1000000
Load cycles
Top
def
lect
ion
rang
e (m
m)
1997
1998
1999
2000
Figure 3.6 e Frequency distribution of top deflection range in direction 170 degrees for years1997 through 2000.
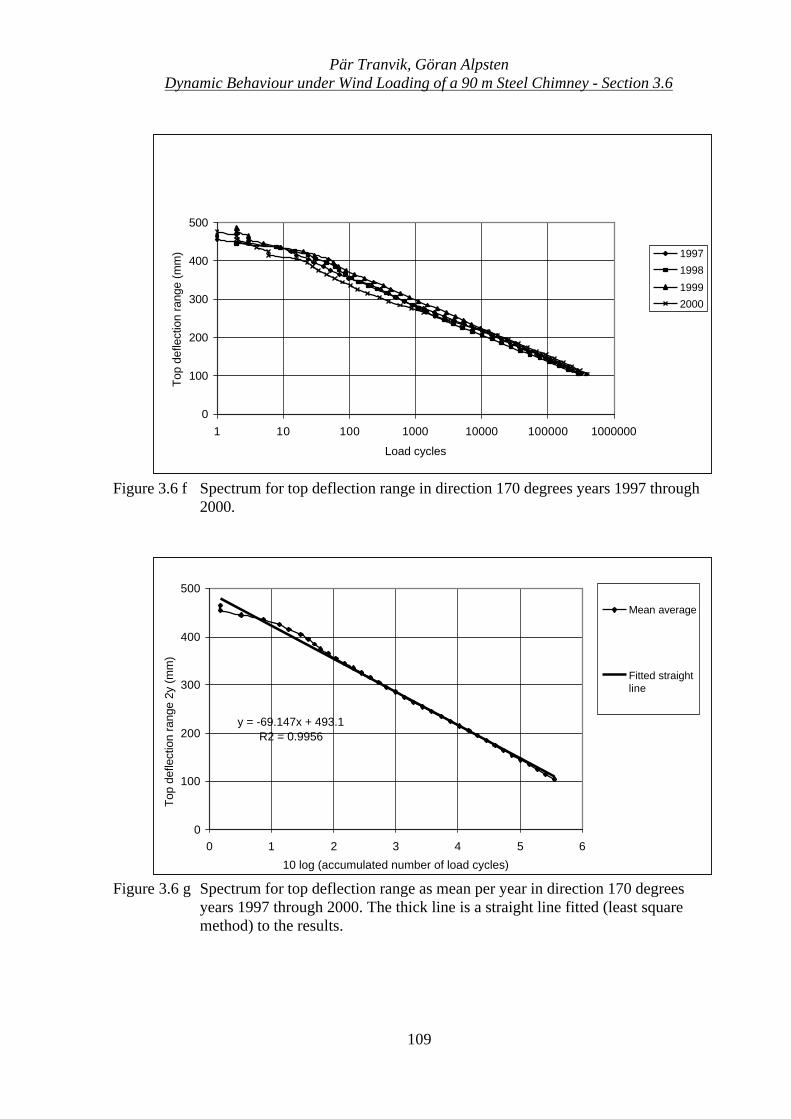
Pär Tranvik, Göran AlpstenDynamic Behaviour under Wind Loading of a 90 m Steel Chimney - Section 3.6
109
0
100
200
300
400
500
1 10 100 1000 10000 100000 1000000
Load cycles
Top
defle
ctio
n ra
nge
(mm
) 1997
1998
1999
2000
Figure 3.6 f Spectrum for top deflection range in direction 170 degrees years 1997 through2000.
y = -69.147x + 493.1R2 = 0.9956
0
100
200
300
400
500
0 1 2 3 4 5 6
10 log (accumulated number of load cycles)
Top
defle
ctio
n ra
nge
2y (m
m)
Mean average
Fitted straightline
Figure 3.6 g Spectrum for top deflection range as mean per year in direction 170 degreesyears 1997 through 2000. The thick line is a straight line fitted (least squaremethod) to the results.
Pär Tranvik, Göran AlpstenDynamic Behaviour under Wind Loading of a 90 m Steel Chimney - Section 3.6
110
The straight line fitted to the data in Figure 3.6 g may be written
( ) 247log35 t10 +⋅−= ny ......................................................................................................(3.43)
where nt = Accumulated number of load cyclesy = Top deflection amplitude in mm
By using Equation 4.6 the bending stress bσ in MPa per year at the chimney base is obtained as
( ) 5.21log01.3087.0 10 +⋅−=⋅= tb nyσ ..............................................................................(3.44)
Bending moment at the chimney base per year in Nm is found from Equation 3.5
( )[ ] 6106 1057.1log220.0730002
10 ⋅+⋅−=⋅=⋅
⋅⋅= tbbb nd
IM σσ ....................................(3.45)
Equation 2.10 gives the distributed load q N/m per year in Pa to
( ) 387log2.5490
22 1022
+⋅−=⋅
=⋅
= tbb n
MHM
q .....................................................................(3.46)
If we assume that the distributed load will correspond to a wind pressure p in Pa per year ofloads uniformly distributed over the chimney
( ) 168log6.23 10 +⋅−== tndq
p ...........................................................................................(3.47)
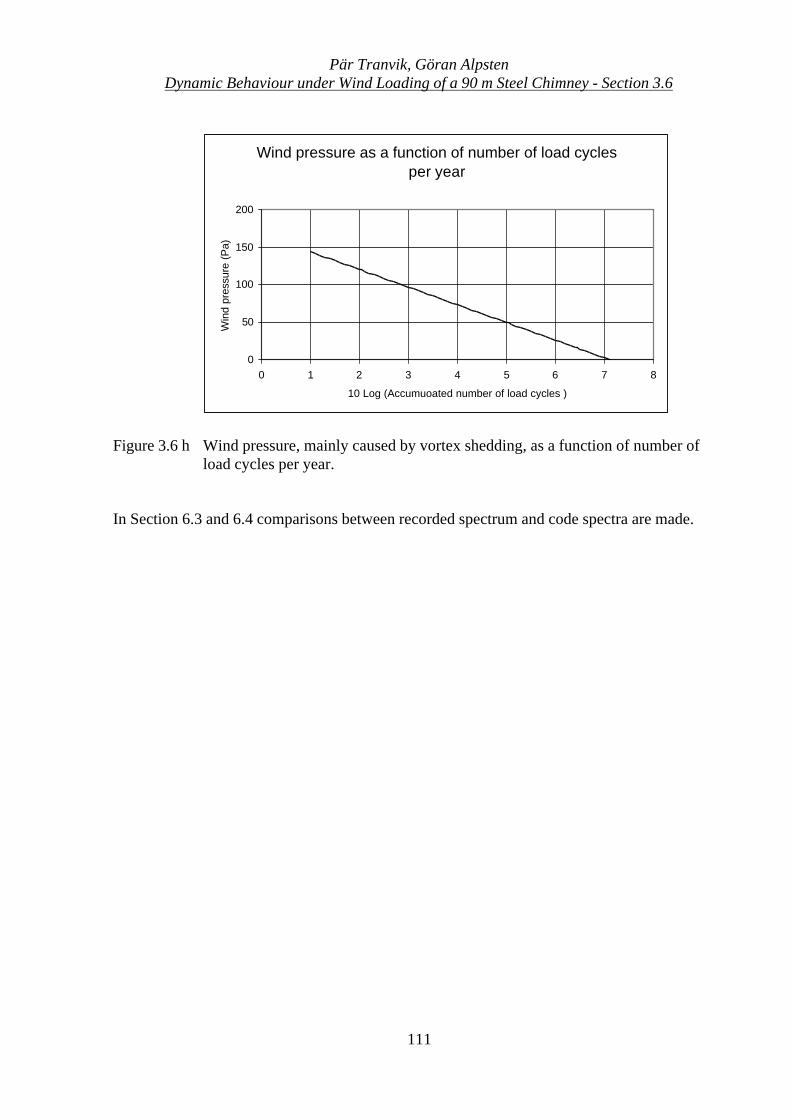
Pär Tranvik, Göran AlpstenDynamic Behaviour under Wind Loading of a 90 m Steel Chimney - Section 3.6
111
Wind pressure as a function of number of load cycles per year
0
50
100
150
200
0 1 2 3 4 5 6 7 8
10 Log (Accumuoated number of load cycles )
Win
d pr
essu
re (
Pa)
Figure 3.6 h Wind pressure, mainly caused by vortex shedding, as a function of number ofload cycles per year.
In Section 6.3 and 6.4 comparisons between recorded spectrum and code spectra are made.
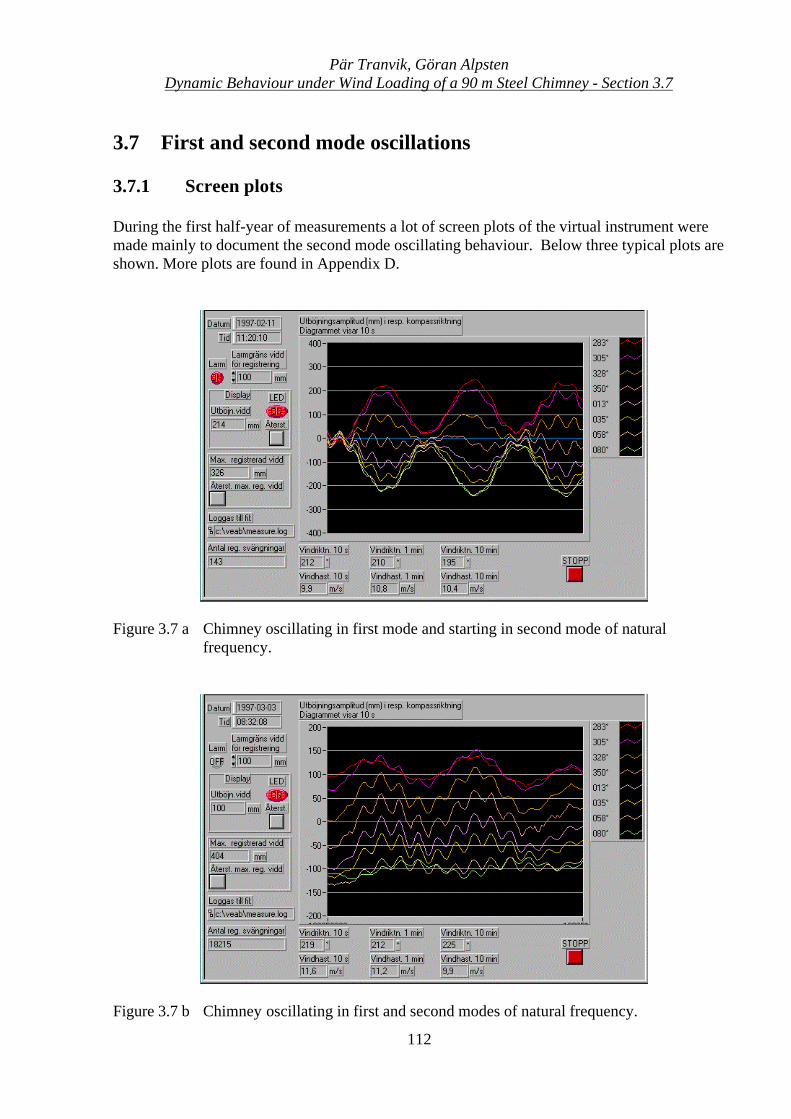
Pär Tranvik, Göran AlpstenDynamic Behaviour under Wind Loading of a 90 m Steel Chimney - Section 3.7
112
3.7 First and second mode oscillations
3.7.1 Screen plots
During the first half-year of measurements a lot of screen plots of the virtual instrument weremade mainly to document the second mode oscillating behaviour. Below three typical plots areshown. More plots are found in Appendix D.
Figure 3.7 a Chimney oscillating in first mode and starting in second mode of naturalfrequency.
Figure 3.7 b Chimney oscillating in first and second modes of natural frequency.
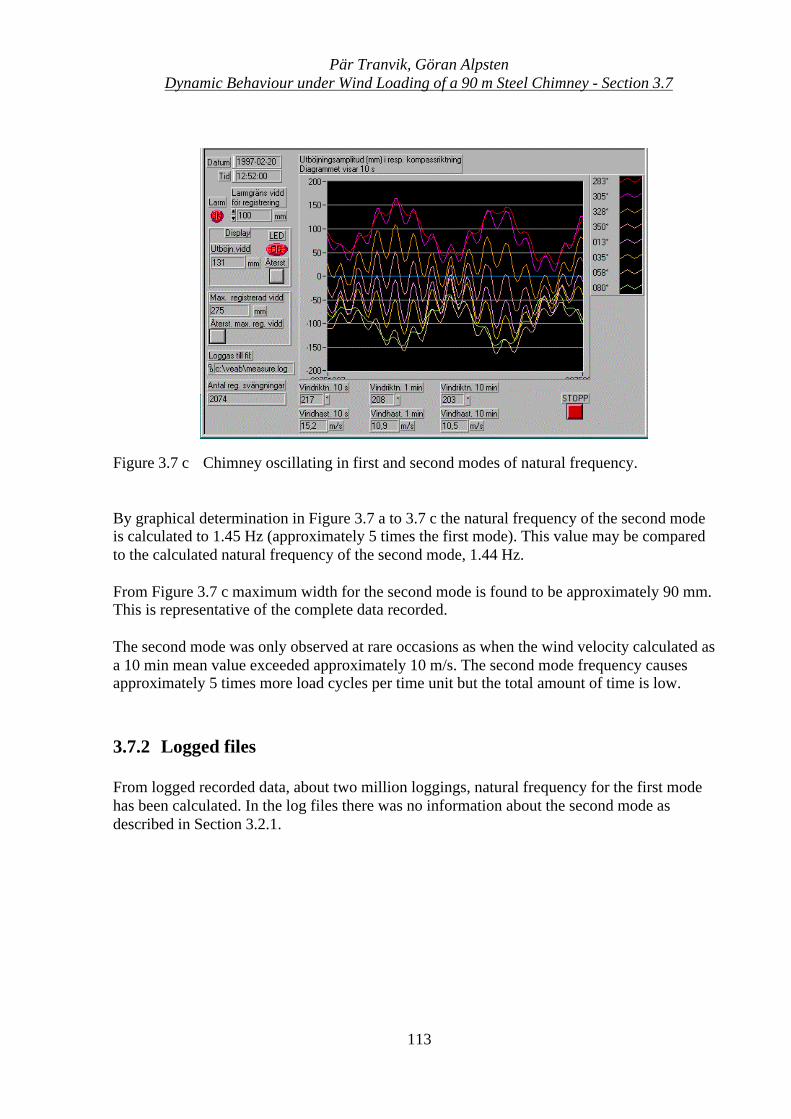
Pär Tranvik, Göran AlpstenDynamic Behaviour under Wind Loading of a 90 m Steel Chimney - Section 3.7
113
Figure 3.7 c Chimney oscillating in first and second modes of natural frequency.
By graphical determination in Figure 3.7 a to 3.7 c the natural frequency of the second modeis calculated to 1.45 Hz (approximately 5 times the first mode). This value may be comparedto the calculated natural frequency of the second mode, 1.44 Hz.
From Figure 3.7 c maximum width for the second mode is found to be approximately 90 mm.This is representative of the complete data recorded.
The second mode was only observed at rare occasions as when the wind velocity calculated asa 10 min mean value exceeded approximately 10 m/s. The second mode frequency causesapproximately 5 times more load cycles per time unit but the total amount of time is low.
3.7.2 Logged files
From logged recorded data, about two million loggings, natural frequency for the first modehas been calculated. In the log files there was no information about the second mode asdescribed in Section 3.2.1.
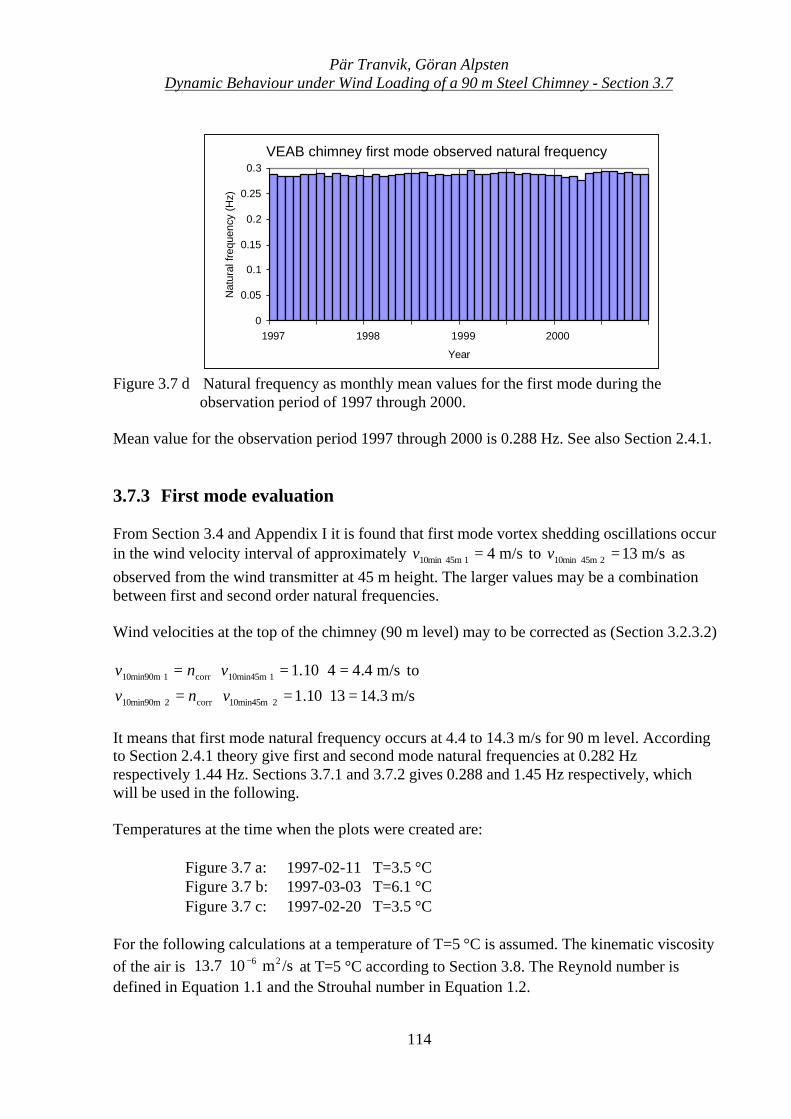
Pär Tranvik, Göran AlpstenDynamic Behaviour under Wind Loading of a 90 m Steel Chimney - Section 3.7
114
VEAB chimney first mode observed natural frequency
0
0.05
0.1
0.15
0.2
0.25
0.3
1997 1998 1999 2000
Year
Nat
ural
freq
uenc
y (H
z)
Figure 3.7 d Natural frequency as monthly mean values for the first mode during theobservation period of 1997 through 2000.
Mean value for the observation period 1997 through 2000 is 0.288 Hz. See also Section 2.4.1.
3.7.3 First mode evaluation
From Section 3.4 and Appendix I it is found that first mode vortex shedding oscillations occurin the wind velocity interval of approximately m/s4145m10min =v to m/s13245m10min =v asobserved from the wind transmitter at 45 m height. The larger values may be a combinationbetween first and second order natural frequencies.
Wind velocities at the top of the chimney (90 m level) may to be corrected as (Section 3.2.3.2)
m/s4.4410.1110min45mcorr110min90m =⋅=⋅= vnv to
m/s3.141310.1210min45mcorr210min90m =⋅=⋅= vnv
It means that first mode natural frequency occurs at 4.4 to 14.3 m/s for 90 m level. Accordingto Section 2.4.1 theory give first and second mode natural frequencies at 0.282 Hzrespectively 1.44 Hz. Sections 3.7.1 and 3.7.2 gives 0.288 and 1.45 Hz respectively, whichwill be used in the following.
Temperatures at the time when the plots were created are:
Figure 3.7 a: 1997-02-11 T=3.5 °CFigure 3.7 b: 1997-03-03 T=6.1 °CFigure 3.7 c: 1997-02-20 T=3.5 °C
For the following calculations at a temperature of T=5 °C is assumed. The kinematic viscosityof the air is /sm107.13 26−⋅ at T=5 °C according to Section 3.8. The Reynold number isdefined in Equation 1.1 and the Strouhal number in Equation 1.2.
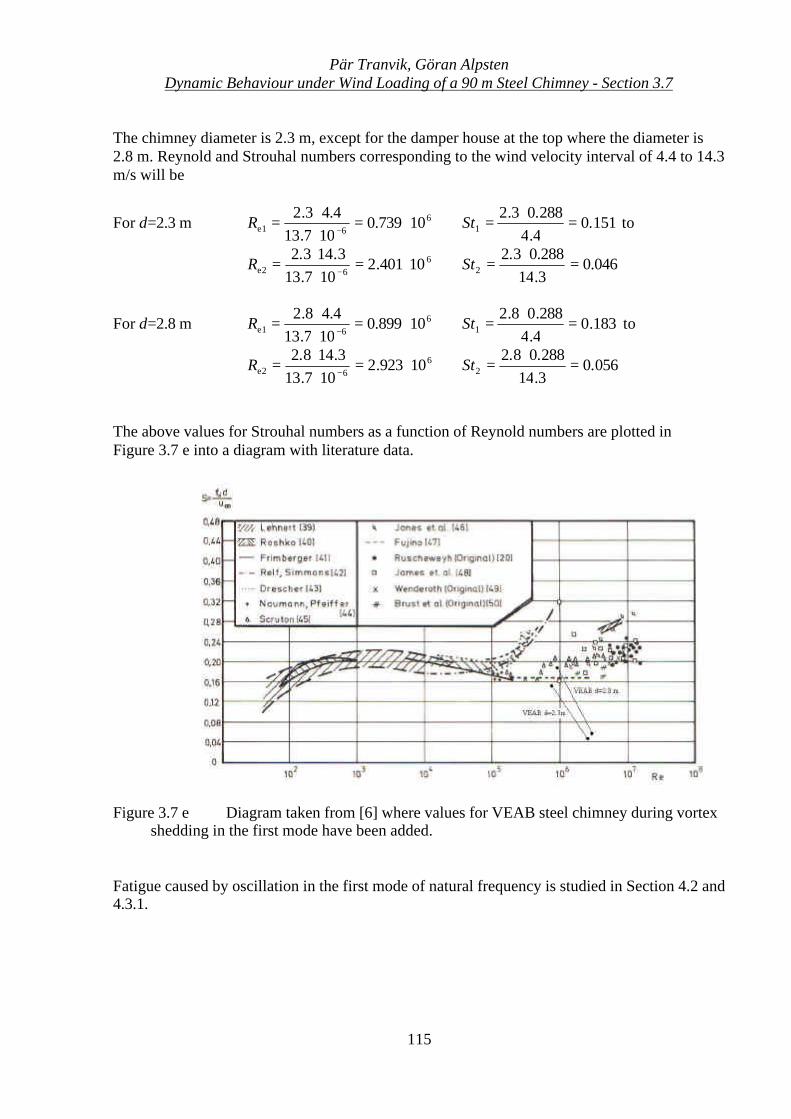
Pär Tranvik, Göran AlpstenDynamic Behaviour under Wind Loading of a 90 m Steel Chimney - Section 3.7
115
The chimney diameter is 2.3 m, except for the damper house at the top where the diameter is2.8 m. Reynold and Strouhal numbers corresponding to the wind velocity interval of 4.4 to 14.3m/s will be
For d=2.3 m 66e1 10739.0
107.134.43.2
⋅=⋅⋅
=−
R 151.04.4288.03.2
1 =⋅
=St to
66e2 10401.2
107.133.143.2
⋅=⋅⋅
=−
R 046.03.14288.03.2
2 =⋅
=St
For d=2.8 m 66e1 10899.0
107.134.48.2
⋅=⋅⋅
=−
R 183.04.4288.08.2
1 =⋅
=St to
66e2 10923.2
107.133.148.2
⋅=⋅⋅
=−
R 056.03.14288.08.2
2 =⋅
=St
The above values for Strouhal numbers as a function of Reynold numbers are plotted inFigure 3.7 e into a diagram with literature data.
Figure 3.7 e Diagram taken from [6] where values for VEAB steel chimney during vortexshedding in the first mode have been added.
Fatigue caused by oscillation in the first mode of natural frequency is studied in Section 4.2 and4.3.1.
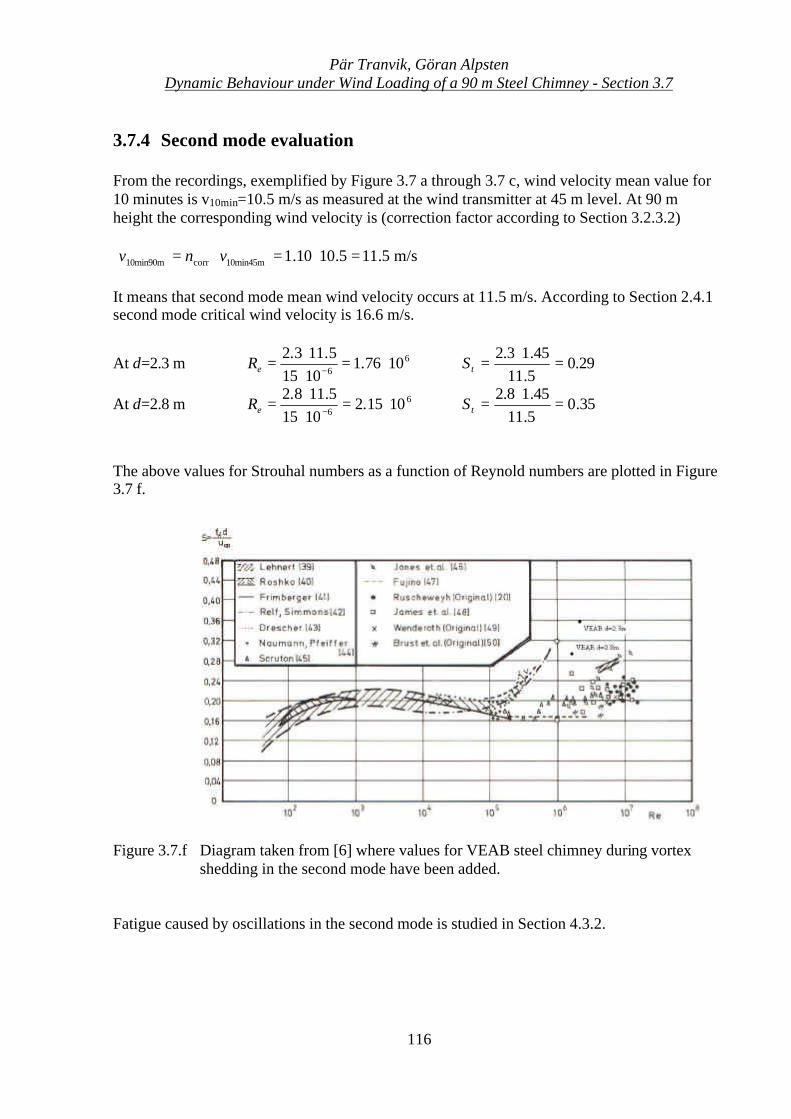
Pär Tranvik, Göran AlpstenDynamic Behaviour under Wind Loading of a 90 m Steel Chimney - Section 3.7
116
3.7.4 Second mode evaluation
From the recordings, exemplified by Figure 3.7 a through 3.7 c, wind velocity mean value for10 minutes is v10min=10.5 m/s as measured at the wind transmitter at 45 m level. At 90 mheight the corresponding wind velocity is (correction factor according to Section 3.2.3.2)
m/s5.115.1010.110min45mcorr10min90m =⋅=⋅= vnv
It means that second mode mean wind velocity occurs at 11.5 m/s. According to Section 2.4.1second mode critical wind velocity is 16.6 m/s.
At d=2.3 m 66
1076.11015
5.113.2⋅=
⋅⋅
=−eR 29.0
5.1145.13.2
=⋅
=tS
At d=2.8 m 66
1015.21015
5.118.2⋅=
⋅⋅
=−eR 35.0
5.1145.18.2
=⋅
=tS
The above values for Strouhal numbers as a function of Reynold numbers are plotted in Figure3.7 f.
Figure 3.7.f Diagram taken from [6] where values for VEAB steel chimney during vortexshedding in the second mode have been added.
Fatigue caused by oscillations in the second mode is studied in Section 4.3.2.
Pär Tranvik, Göran AlpstenDynamic Behaviour under Wind Loading of a 90 m Steel Chimney - Section 3.7
117
3.7.5 Discussion
Strouhal number could be as big as 0.3, but forces exited are small. Therefore it isrecommended that a Strouhal number of 0.2 should be used for engineering design calculations[1], [3], [5], [9]. For the first mode recorded results sometimes gives as small Strouhal numberas 0.06. The effect explaining this is lock-in, where the vortex shedding starts at a lower windvelocities and continue to oscillate during increasing wind velocity. This is possible if thedesign has big slenderness ratio. Some codes, i. e. the Swedish BSV 97 manual [3] have limitedthe use of the code model to a maximum slenderness (height through diameter) ofapproximately 30. The results of this investigation support such a limit unless design loads areincreased for slender structures, such as noted in some papers [1], [15]. The main problem withcreating a code calculation model valid also for slender structures (slenderness much greaterthan 30) is the limited amount of recorded measure data. Sections 3.5.7 and 3.6 containsuggested load spectra and that this is more complex. Furthermore, chimneys with oscillationsoccurring in the second mode are more rare.
Second mode oscillations are seldom observed in structural steel chimneys [26]. For most steelchimneys only the first mode of oscillation is of practical importance for vortex sheddinginduced oscillations. The large slenderness of the VEAB chimney explains the relativelycommon and large second mode oscillations.
Because of the slender VEAB steel chimney (height through diameter = 39) correspondencebetween Strouhal number and Reynold number do not follow the predictions of Figure 3.7 eand 3.7 f [6]. For slender chimneys several codes give unconservative design loads for vortexshedding.
A damper applied at the top of the chimney is less efficient for second order than first ordermode.
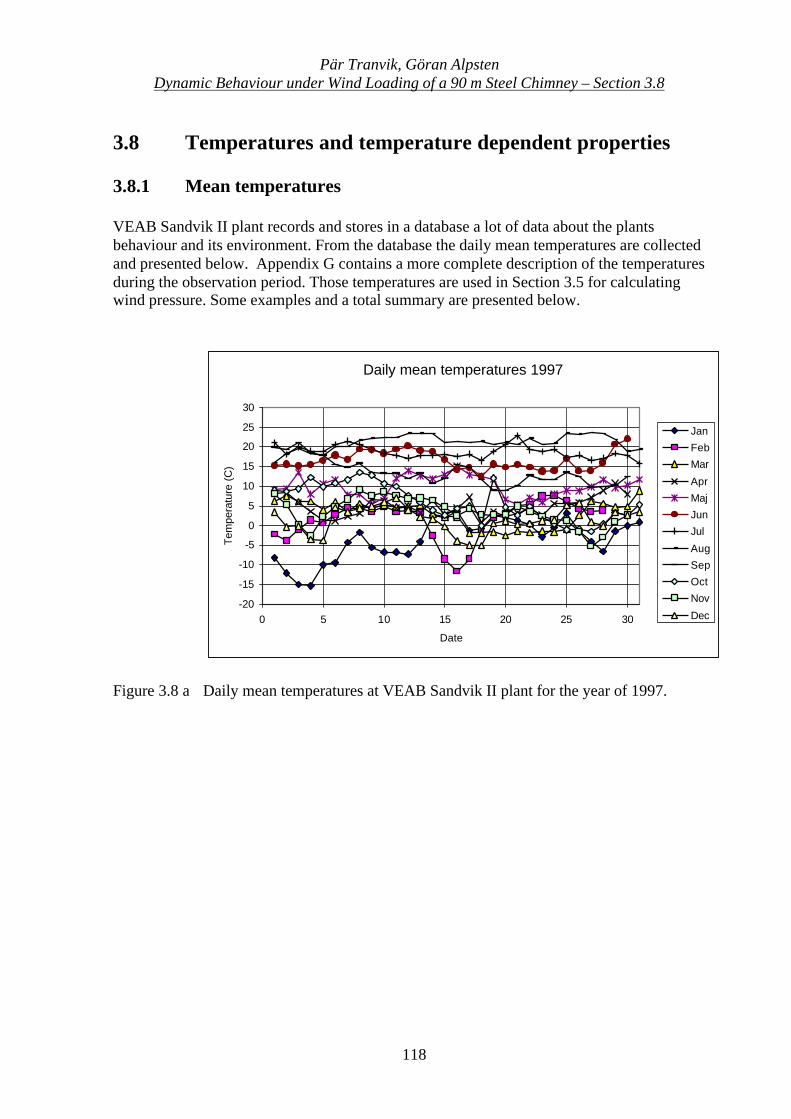
Pär Tranvik, Göran AlpstenDynamic Behaviour under Wind Loading of a 90 m Steel Chimney – Section 3.8
118
3.8 Temperatures and temperature dependent properties
3.8.1 Mean temperatures
VEAB Sandvik II plant records and stores in a database a lot of data about the plantsbehaviour and its environment. From the database the daily mean temperatures are collectedand presented below. Appendix G contains a more complete description of the temperaturesduring the observation period. Those temperatures are used in Section 3.5 for calculatingwind pressure. Some examples and a total summary are presented below.
Daily mean temperatures 1997
-20
-15
-10
-5
0
5
10
15
20
25
30
0 5 10 15 20 25 30
Date
Tem
pera
ture
(C
)
Jan
Feb
Mar
Apr
Maj
Jun
Jul
Aug
Sep
Oct
Nov
Dec
Figure 3.8 a Daily mean temperatures at VEAB Sandvik II plant for the year of 1997.
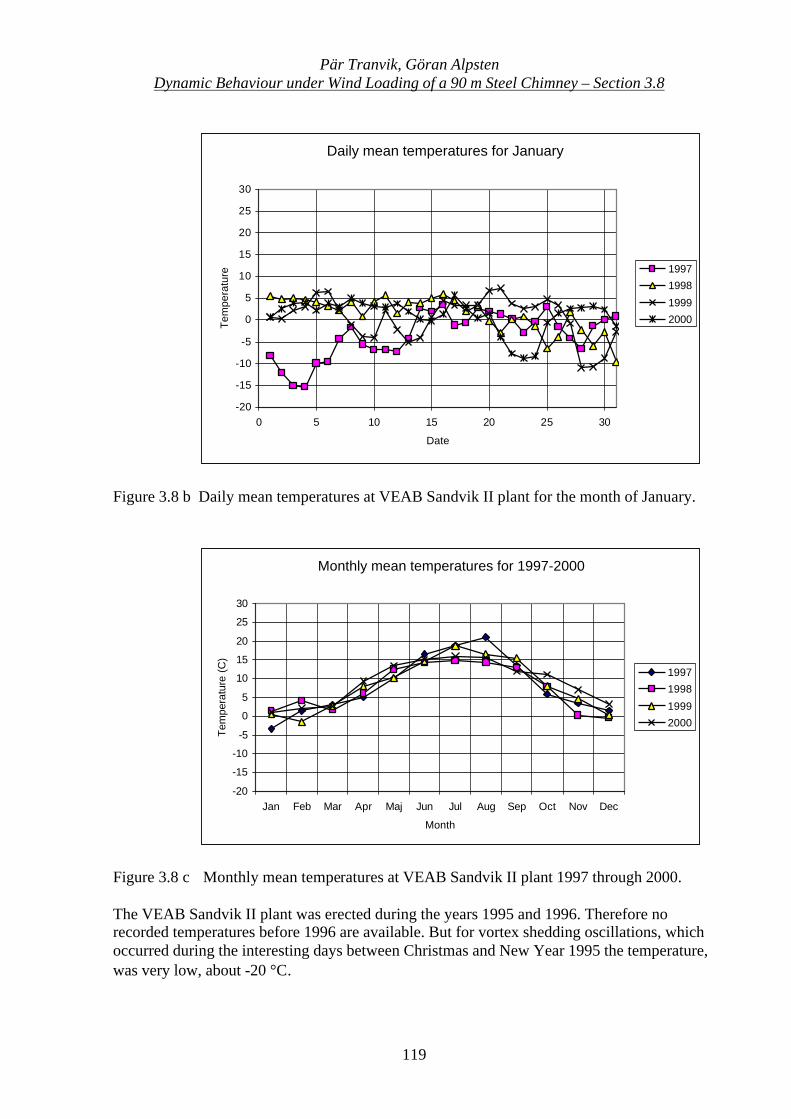
Pär Tranvik, Göran AlpstenDynamic Behaviour under Wind Loading of a 90 m Steel Chimney – Section 3.8
119
Daily mean temperatures for January
-20
-15
-10
-5
0
5
10
15
20
25
30
0 5 10 15 20 25 30
Date
Tem
pera
ture 1997
1998
1999
2000
Figure 3.8 b Daily mean temperatures at VEAB Sandvik II plant for the month of January.
Monthly mean temperatures for 1997-2000
-20
-15
-10
-5
0
5
10
15
20
25
30
Jan Feb Mar Apr Maj Jun Jul Aug Sep Oct Nov Dec
Month
Tem
pera
ture
(C
)
1997
1998
1999
2000
Figure 3.8 c Monthly mean temperatures at VEAB Sandvik II plant 1997 through 2000.
The VEAB Sandvik II plant was erected during the years 1995 and 1996. Therefore norecorded temperatures before 1996 are available. But for vortex shedding oscillations, whichoccurred during the interesting days between Christmas and New Year 1995 the temperature,was very low, about -20 °C.
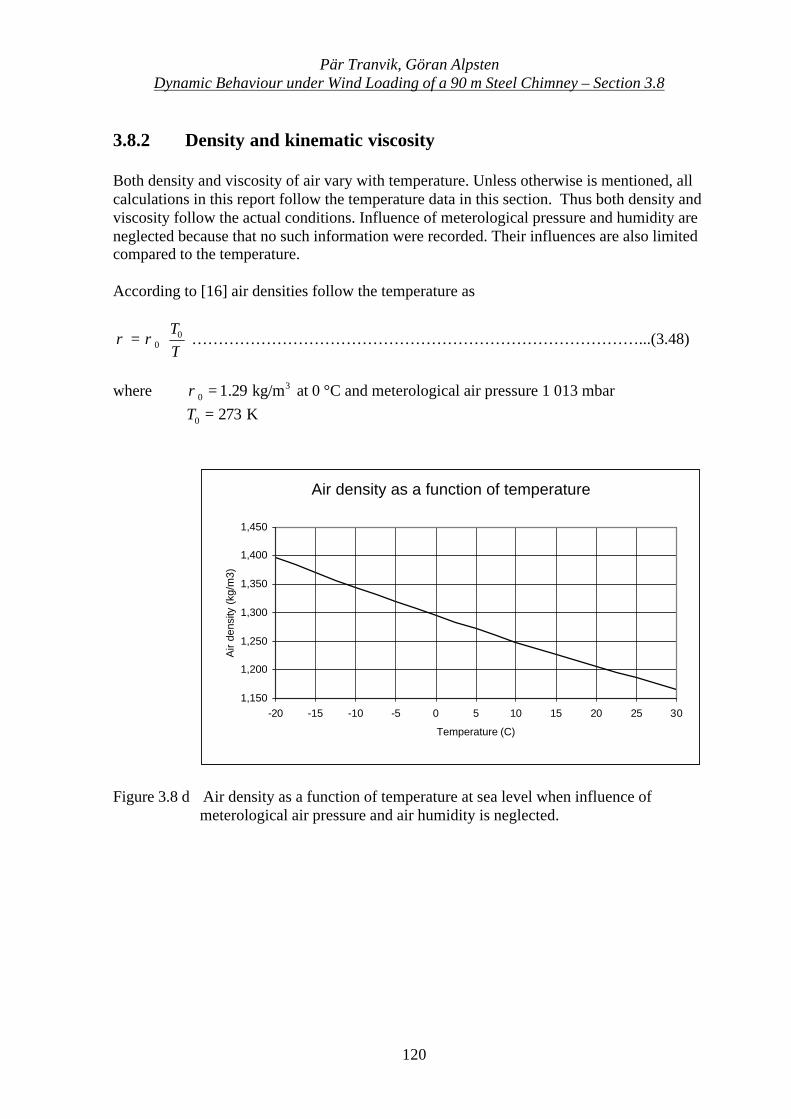
Pär Tranvik, Göran AlpstenDynamic Behaviour under Wind Loading of a 90 m Steel Chimney – Section 3.8
120
3.8.2 Density and kinematic viscosity
Both density and viscosity of air vary with temperature. Unless otherwise is mentioned, allcalculations in this report follow the temperature data in this section. Thus both density andviscosity follow the actual conditions. Influence of meterological pressure and humidity areneglected because that no such information were recorded. Their influences are also limitedcompared to the temperature.
According to [16] air densities follow the temperature as
TT0
0 ⋅= ρρ …………………………………………………………………………...(3.48)
where 30 kg/m29.1=ρ at 0 °C and meterological air pressure 1 013 mbar
K2730 =T
Air density as a function of temperature
1,150
1,200
1,250
1,300
1,350
1,400
1,450
-20 -15 -10 -5 0 5 10 15 20 25 30
Temperature (C)
Air
dens
ity (
kg/m
3)
Figure 3.8 d Air density as a function of temperature at sea level when influence ofmeterological air pressure and air humidity is neglected.
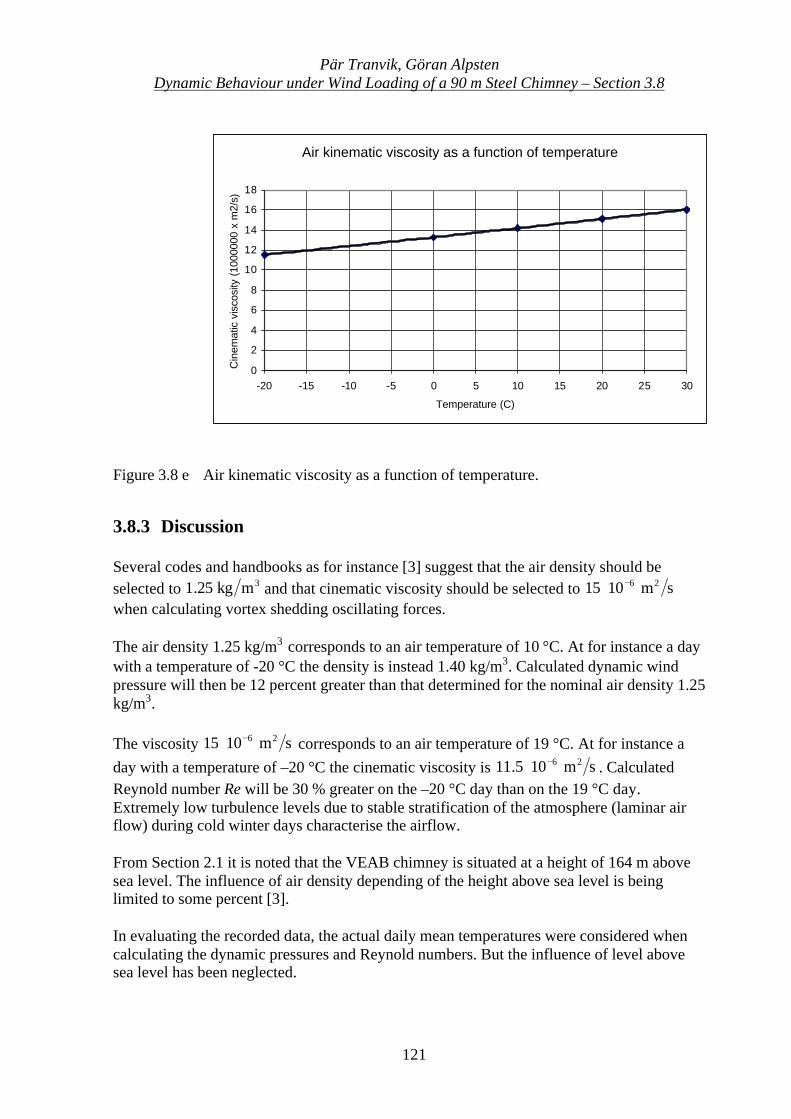
Pär Tranvik, Göran AlpstenDynamic Behaviour under Wind Loading of a 90 m Steel Chimney – Section 3.8
121
Air kinematic viscosity as a function of temperature
0
2
4
6
8
10
12
14
16
18
-20 -15 -10 -5 0 5 10 15 20 25 30
Temperature (C)
Cin
emat
ic v
isco
sity
(10
0000
0 x
m2/
s)
Figure 3.8 e Air kinematic viscosity as a function of temperature.
3.8.3 Discussion
Several codes and handbooks as for instance [3] suggest that the air density should beselected to 3mkg25.1 and that cinematic viscosity should be selected to sm1015 26−⋅when calculating vortex shedding oscillating forces.
The air density 1.25 kg/m3 corresponds to an air temperature of 10 °C. At for instance a daywith a temperature of -20 °C the density is instead 1.40 kg/m3. Calculated dynamic windpressure will then be 12 percent greater than that determined for the nominal air density 1.25kg/m3.
The viscosity sm1015 26−⋅ corresponds to an air temperature of 19 °C. At for instance aday with a temperature of –20 °C the cinematic viscosity is sm105.11 26−⋅ . CalculatedReynold number Re will be 30 % greater on the –20 °C day than on the 19 °C day.Extremely low turbulence levels due to stable stratification of the atmosphere (laminar airflow) during cold winter days characterise the airflow.
From Section 2.1 it is noted that the VEAB chimney is situated at a height of 164 m abovesea level. The influence of air density depending of the height above sea level is beinglimited to some percent [3].
In evaluating the recorded data, the actual daily mean temperatures were considered whencalculating the dynamic pressures and Reynold numbers. But the influence of level abovesea level has been neglected.

Pär Tranvik, Göran AlpstenDynamic Behaviour under Wind Loading of a 90 m Steel Chimney – Section 3.8
122

Pär Tranvik, Göran AlpstenDynamic Behaviour under Wind Loading of a 90 m Steel Chimney - Section 4.1
123
4. Fatigue action
4.1 Fatigue model considered
For fatigue evaluation of the chimney the Swedish Manual for Steel Structures BSK 99 [4] isfollowed.
The term stress range rdσ refers to the difference between maximum and minimum stress ata defined point, stresses being calculated according to elastic theory as normal stresseswithout consideration of local stress variations due to for instance the detailed geometry ofthe weld.
For normal stress, the design criterion with respect to fatigue is
rdrd f≤σ [4] ……………………………………………………………………………..(4.1)
where )1.1/( nrkrd γ⋅= ff is the design value of the fatigue strength.
The characteristic fatigue strength, rkf is to be calculated with due regard to the stressconcentration effects characterised by the class of detail C in accordance with [4], thenumber of stress cycles tn during the service life of the structure, and the shape of the stressspectrum in accordance with [4].
The class of detail C is a measure of the characteristic fatigue strength for 6102 ⋅ stresscycles at a constant stress range.
Classes of detail for parent material and welded connections are given in [4]. The valuesgiven assume Workmanship GA or GB in accordance with [4].
For a spectrum with a constant stress range the characteristic value of the fatigue strength is
3/1
t
6
rk102
⋅⋅=
nCf , 6
t 105 ⋅≤n [4] ………………………………………..(4.2)
5/1
t
6
rk102
885.0
⋅⋅⋅=
nCf , 8
t6 10105 ≤≤⋅ n [4] ………………………………….(4.3)
For structures not appreciably affected by corrosion, for instance where the corrosionprotection is well maintained, it is assumed that the fatigue limit for a spectrum withconstant stress range is assumed to be reached at 810 stress cycles.
The relationship between the characteristic value of the fatigue strength and the number ofstress cycles is set out in [4].
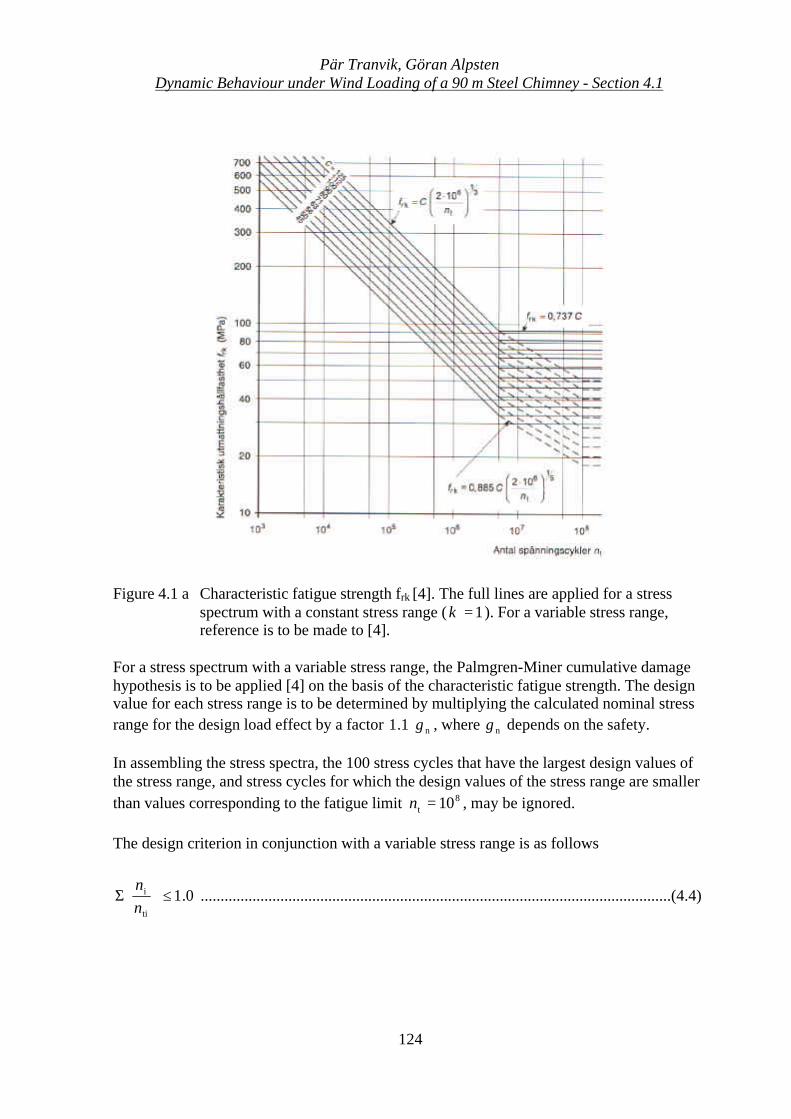
Pär Tranvik, Göran AlpstenDynamic Behaviour under Wind Loading of a 90 m Steel Chimney - Section 4.1
124
Figure 4.1 a Characteristic fatigue strength frk [4]. The full lines are applied for a stressspectrum with a constant stress range ( 1=κ ). For a variable stress range,reference is to be made to [4].
For a stress spectrum with a variable stress range, the Palmgren-Miner cumulative damagehypothesis is to be applied [4] on the basis of the characteristic fatigue strength. The designvalue for each stress range is to be determined by multiplying the calculated nominal stressrange for the design load effect by a factor n1.1 γ⋅ , where nγ depends on the safety.
In assembling the stress spectra, the 100 stress cycles that have the largest design values ofthe stress range, and stress cycles for which the design values of the stress range are smallerthan values corresponding to the fatigue limit 8
t 10=n , may be ignored.
The design criterion in conjunction with a variable stress range is as follows
0.1ti
i ≤
Σ
nn
......................................................................................................................(4.4)
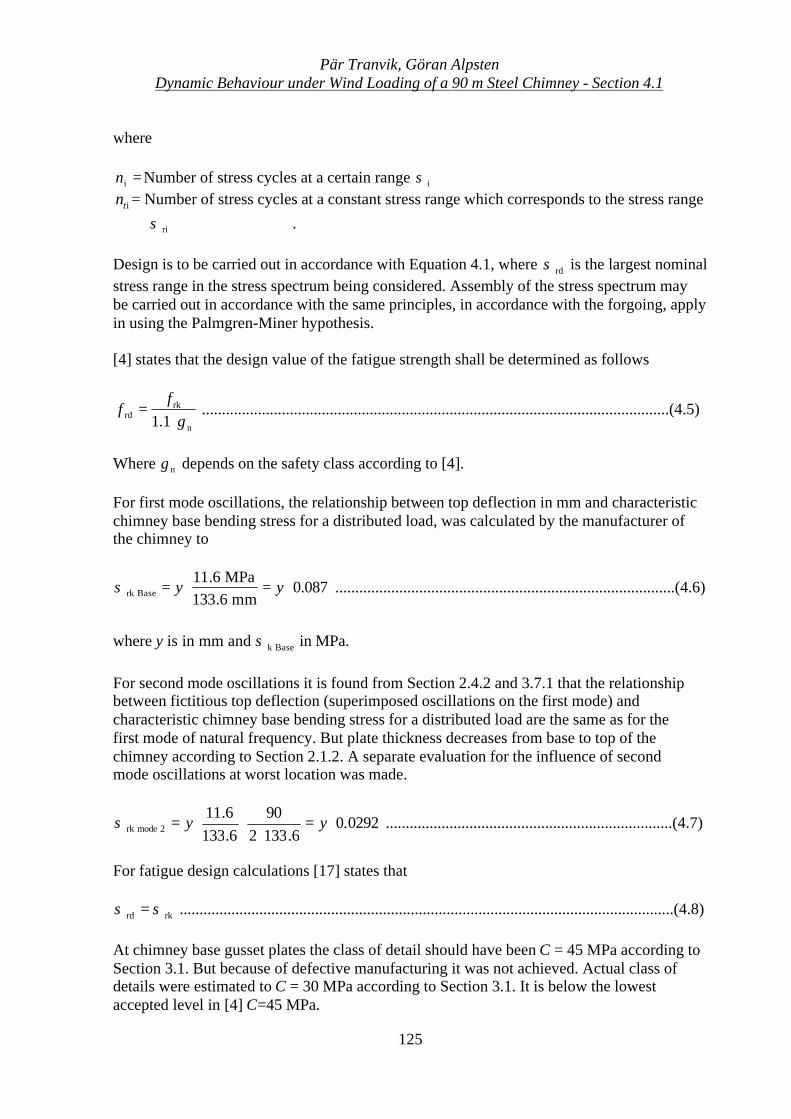
Pär Tranvik, Göran AlpstenDynamic Behaviour under Wind Loading of a 90 m Steel Chimney - Section 4.1
125
where
=in Number of stress cycles at a certain range iσ
itn = Number of stress cycles at a constant stress range which corresponds to the stress range
riσ .
Design is to be carried out in accordance with Equation 4.1, where rdσ is the largest nominalstress range in the stress spectrum being considered. Assembly of the stress spectrum maybe carried out in accordance with the same principles, in accordance with the forgoing, applyin using the Palmgren-Miner hypothesis.
[4] states that the design value of the fatigue strength shall be determined as follows
n
rkrd 1.1 γ⋅
=f
f .....................................................................................................................(4.5)
Where nγ depends on the safety class according to [4].
For first mode oscillations, the relationship between top deflection in mm and characteristicchimney base bending stress for a distributed load, was calculated by the manufacturer ofthe chimney to
087.0mm6.133
MPa6.11Baserk ⋅=⋅= yyσ .....................................................................................(4.6)
where y is in mm and Basekσ in MPa.
For second mode oscillations it is found from Section 2.4.2 and 3.7.1 that the relationshipbetween fictitious top deflection (superimposed oscillations on the first mode) andcharacteristic chimney base bending stress for a distributed load are the same as for thefirst mode of natural frequency. But plate thickness decreases from base to top of thechimney according to Section 2.1.2. A separate evaluation for the influence of secondmode oscillations at worst location was made.
0292.06.1332
906.1336.11
2moderk ⋅=⋅
⋅⋅= yyσ ........................................................................(4.7)
For fatigue design calculations [17] states that
rkrd σσ = ............................................................................................................................(4.8)
At chimney base gusset plates the class of detail should have been C = 45 MPa according toSection 3.1. But because of defective manufacturing it was not achieved. Actual class ofdetails were estimated to C = 30 MPa according to Section 3.1. It is below the lowestaccepted level in [4] C=45 MPa.
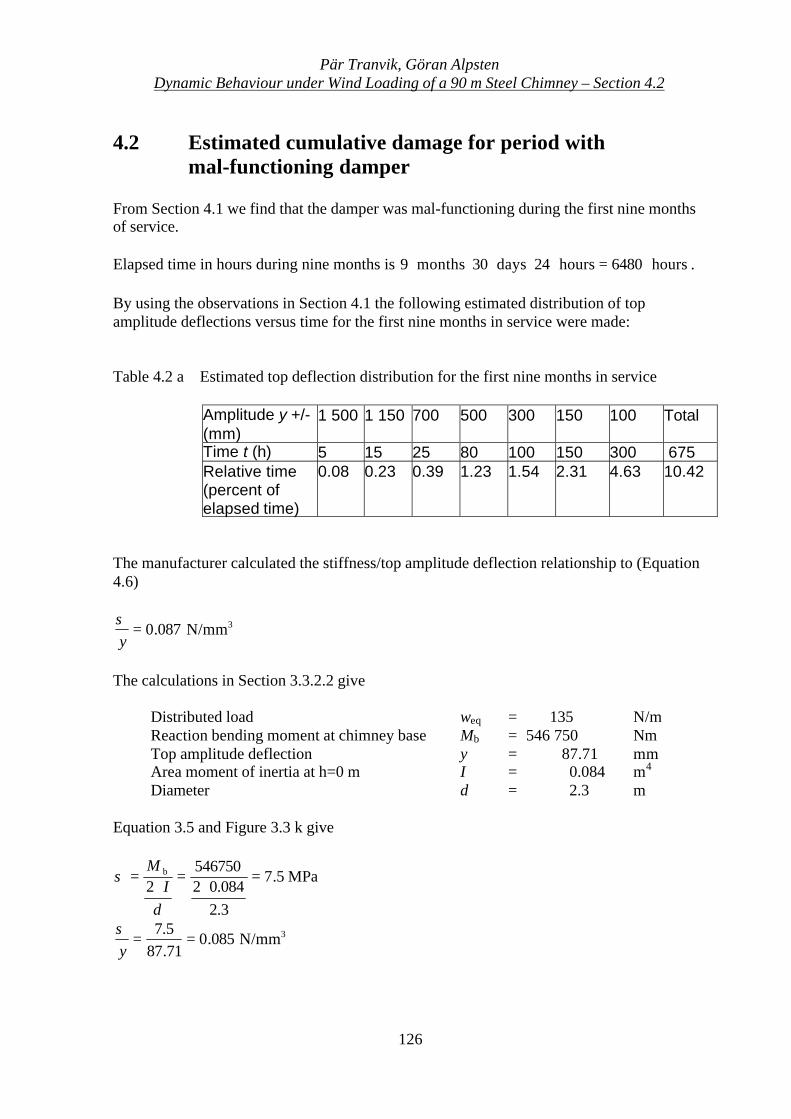
Pär Tranvik, Göran AlpstenDynamic Behaviour under Wind Loading of a 90 m Steel Chimney – Section 4.2
126
4.2 Estimated cumulative damage for period withmal-functioning damper
From Section 4.1 we find that the damper was mal-functioning during the first nine monthsof service.
Elapsed time in hours during nine months is hours6480hours24days30months9 ⋅=⋅⋅⋅⋅⋅ .
By using the observations in Section 4.1 the following estimated distribution of topamplitude deflections versus time for the first nine months in service were made:
Table 4.2 a Estimated top deflection distribution for the first nine months in service
Amplitude y +/-(mm)
1 500 1 150 700 500 300 150 100 Total
Time t (h) 5 15 25 80 100 150 300 675Relative time(percent ofelapsed time)
0.08 0.23 0.39 1.23 1.54 2.31 4.63 10.42
The manufacturer calculated the stiffness/top amplitude deflection relationship to (Equation4.6)
3N/mm087.0=yσ
The calculations in Section 3.3.2.2 give
Distributed load weq = 135 N/mReaction bending moment at chimney base Mb = 546 750 NmTop amplitude deflection y = 87.71 mmArea moment of inertia at h=0 m I = 0.084 m4
Diameter d = 2.3 m
Equation 3.5 and Figure 3.3 k give
MPa5.7
3.2084.02
5467502
b =⋅
=⋅
=
dI
Mσ
3N/mm085.071.875.7
==yσ
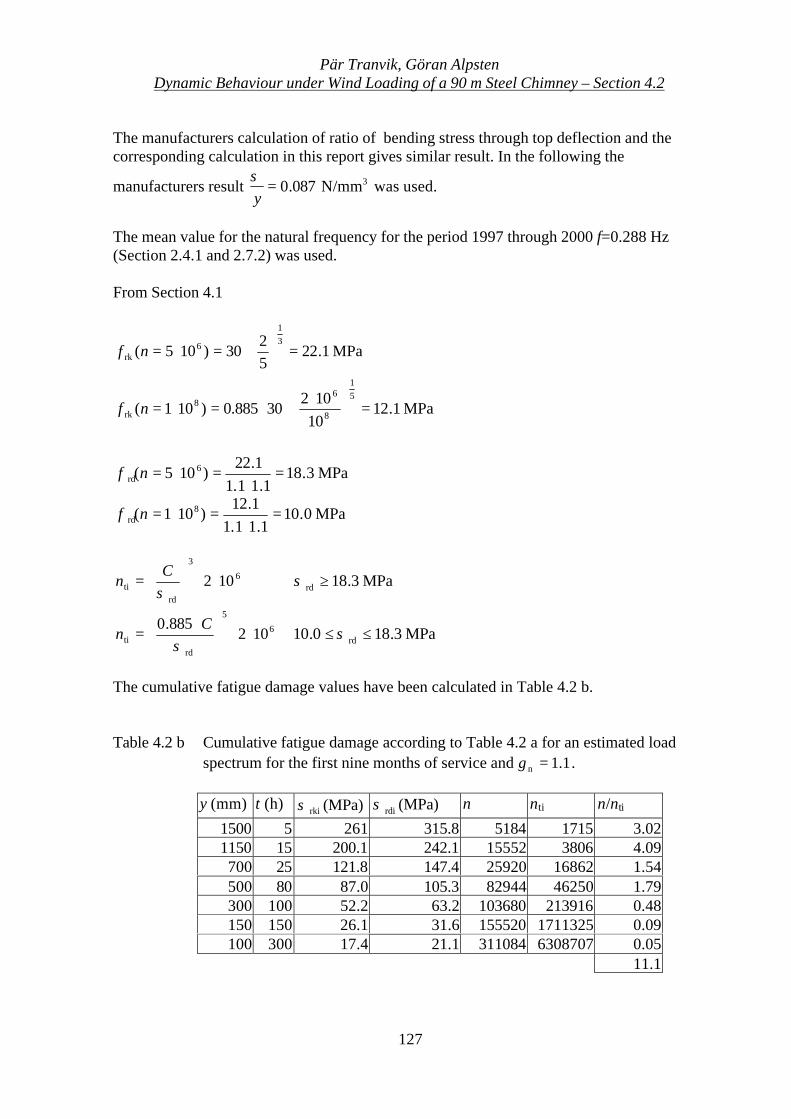
Pär Tranvik, Göran AlpstenDynamic Behaviour under Wind Loading of a 90 m Steel Chimney – Section 4.2
127
The manufacturers calculation of ratio of bending stress through top deflection and thecorresponding calculation in this report gives similar result. In the following the
manufacturers result 3N/mm087.0=yσ
was used.
The mean value for the natural frequency for the period 1997 through 2000 f=0.288 Hz(Section 2.4.1 and 2.7.2) was used.
From Section 4.1
MPa1.2252
30)105(31
6rk =
⋅=⋅=nf
MPa1.1210102
30885.0)101(51
8
68
rk =
⋅⋅⋅=⋅=nf
MPa3.181.11.1
1.22)105( 6
rd =⋅
=⋅=nf
MPa0.101.11.1
1.12)101( 8
rd =⋅
=⋅=nf
6
3
rdti 102 ⋅⋅
=
σC
n MPa3.18rd ≥σ
6
5
rdti 102
885.0⋅⋅
⋅=
σC
n MPa3.180.10 rd ≤≤ σ
The cumulative fatigue damage values have been calculated in Table 4.2 b.
Table 4.2 b Cumulative fatigue damage according to Table 4.2 a for an estimated loadspectrum for the first nine months of service and 1.1n =γ .
y (mm) t (h) rkiσ (MPa) rdiσ (MPa) n nti n/nti
1500 5 261 315.8 5184 1715 3.021150 15 200.1 242.1 15552 3806 4.09700 25 121.8 147.4 25920 16862 1.54500 80 87.0 105.3 82944 46250 1.79300 100 52.2 63.2 103680 213916 0.48150 150 26.1 31.6 155520 1711325 0.09100 300 17.4 21.1 311084 6308707 0.05
11.1
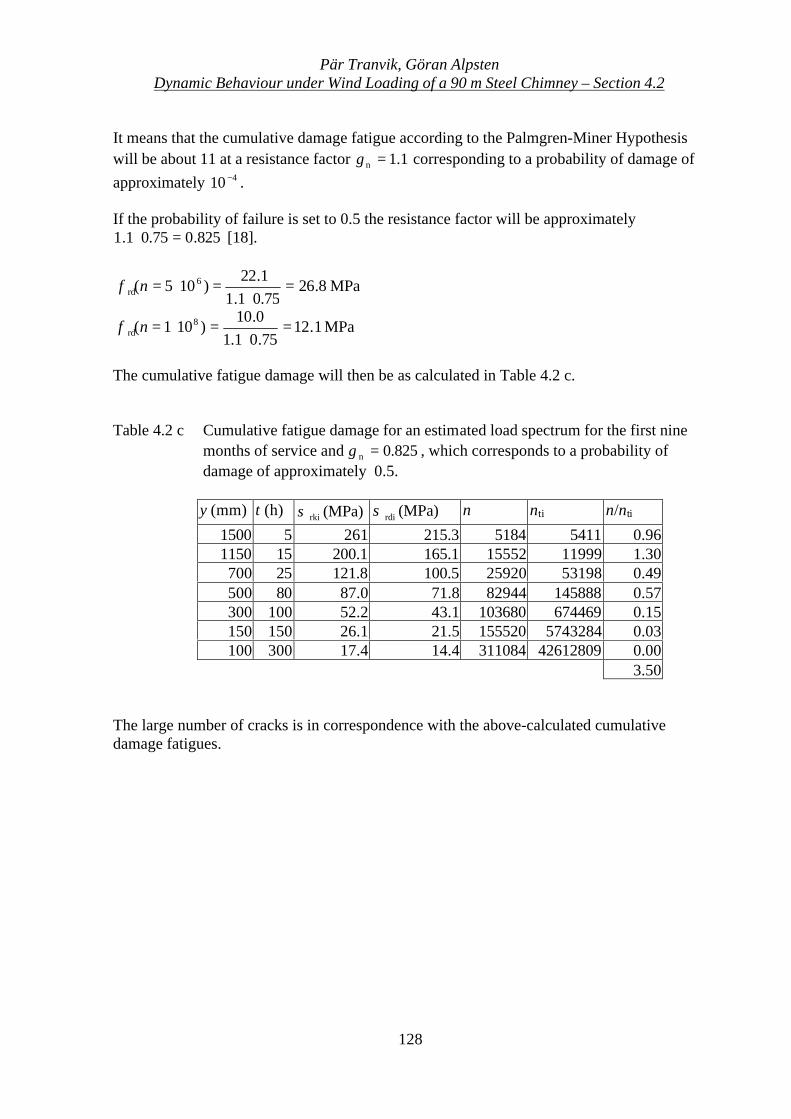
Pär Tranvik, Göran AlpstenDynamic Behaviour under Wind Loading of a 90 m Steel Chimney – Section 4.2
128
It means that the cumulative damage fatigue according to the Palmgren-Miner Hypothesiswill be about 11 at a resistance factor 1.1n =γ corresponding to a probability of damage ofapproximately 410 − .
If the probability of failure is set to 0.5 the resistance factor will be approximately825.075.01.1 =⋅ [18].
MPa8.2675.01.11.22
)105( 6rd =
⋅=⋅=nf
MPa1.1275.01.1
0.10)101( 8
rd =⋅
=⋅=nf
The cumulative fatigue damage will then be as calculated in Table 4.2 c.
Table 4.2 c Cumulative fatigue damage for an estimated load spectrum for the first ninemonths of service and 825.0n =γ , which corresponds to a probability ofdamage of approximately 0.5.
y (mm) t (h) rkiσ (MPa) rdiσ (MPa) n nti n/nti
1500 5 261 215.3 5184 5411 0.961150 15 200.1 165.1 15552 11999 1.30700 25 121.8 100.5 25920 53198 0.49500 80 87.0 71.8 82944 145888 0.57300 100 52.2 43.1 103680 674469 0.15150 150 26.1 21.5 155520 5743284 0.03100 300 17.4 14.4 311084 42612809 0.00
3.50
The large number of cracks is in correspondence with the above-calculated cumulativedamage fatigues.

Pär Tranvik, Göran AlpstenDynamic Behaviour under Wind Loading of a 90 m Steel Chimney – Section 4.3
129
4.3 Cumulative damage for period with functioning damper
4.3.1 First mode of natural frequency
4.3.1.1 Foundation level
The strain gauges were primarily aimed to study the influence of first mode of naturalfrequency to the fatigue strength (Section 3.2.1).
The recording period is the years 1997 through 2000. To reduce the amount of data to bestored, values were truncated if maximum range was less than 100 mm according to Section3.2.7.
For strain gauge 1 and 3 there are a number of unrealistic values from January until April2000. They are truncated because of errors at the strain gauges, see Section 3.2.8.
Cumulative fatigue damage has been calculated for the recording period 1997 through 2000.Because of the difference between design assumptions and true values for class of detail bothC=45 and C=30 are assumed. C=45 is the design assumption and C=30 the accurate class ofdetail. C=45 corresponds to a class of detail similar to a class of weld of WC according to [4].It means that C=30 corresponds to a class of weld below WC. In the cumulative damagecalculations nothing else than geometric stress concentrations from the weld alone wasincluded. For the original design of the gusset plates at foundation level (Figure 2.2 c and 2.2d) and 30 m level (Figure 2.2 e) it is reasonable to add an additional geometric stressconcentration. Because of the changed design after two years of service (Figure 2.2 g andFigure 2.2 i) no additional stress concentrations are added to the class of detail C.
Table 4.3.a Damage fatigue for 1997 at class of detail C=30 respective C=45C Gauge no 1 Gauge no 2 Gauge no 3 Gauge no 4 Gauge no 5 Gauge no 6 Gauge no 7 Gauge no 830 0.0016736 0.00625349 0.0099898 0.01003540 0.00578685 0.00235369 0.00080252 0.0006754345 0.00013162 0.00057027 0.00102408 0.00099927 0.00052442 0.00019323 0.00006214 0.00005592
Table 4.3.b Damage fatigue for 1998 at class of detail C=30 respective C=45C Gauge no 1 Gauge no 2 Gauge no 3 Gauge no 4 Gauge no 5 Gauge no 6 Gauge no 7 Gauge no 830 0.00109454 0.00580580 0.01042424 0.01130228 0.00630474 0.00181172 0.00025356 0.0002174045 0.00007902 0.00061170 0.00126551 0.00133086 0.00063884 0.00011620 0.00001215 0.00001095
Table 4.3.c Damage fatigue for 1999 at class of detail C=30 respective C=45C Gauge no 1 Gauge no 2 Gauge no 3 Gauge no 4 Gauge no 5 Gauge no 6 Gauge no 7 Gauge no 830 0.00171796 0.00612419 0.01083196 0.01212821 0.00726709 0.00267103 0.00077496 0.0007052145 0.00013927 0.00056558 0.00115432 0.00128465 0.00070408 0.00023725 0.00006437 0.00005421
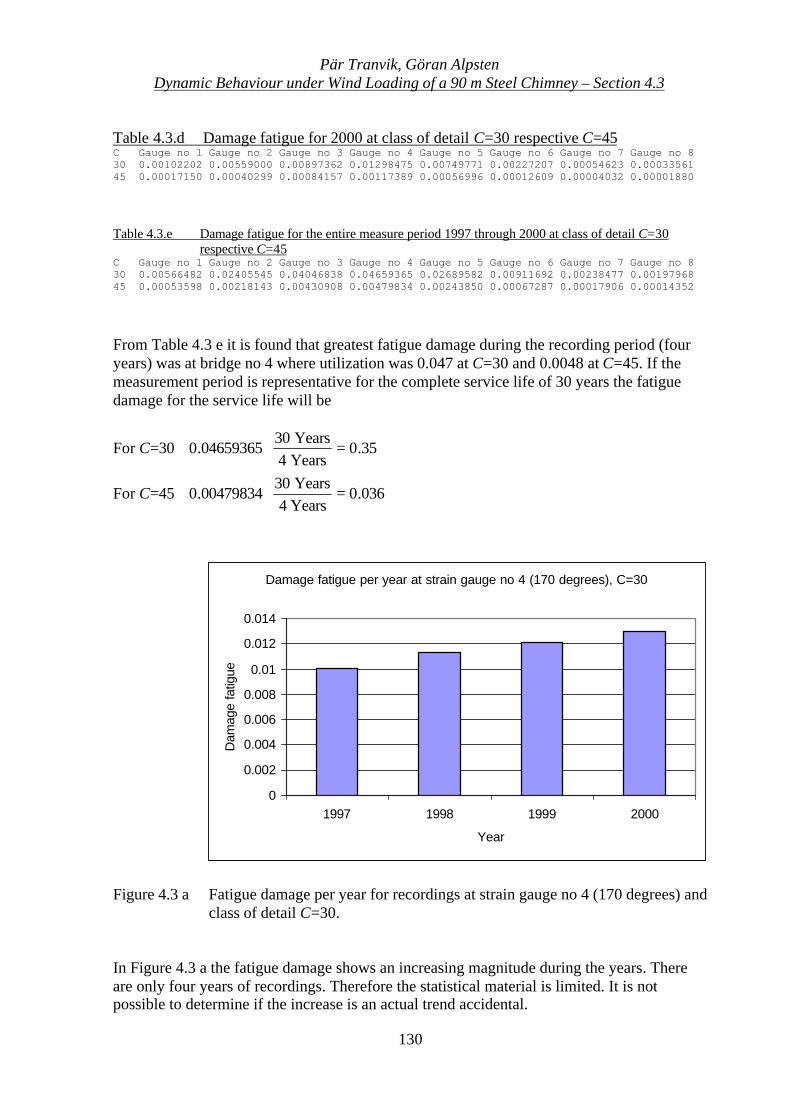
Pär Tranvik, Göran AlpstenDynamic Behaviour under Wind Loading of a 90 m Steel Chimney – Section 4.3
130
Table 4.3.d Damage fatigue for 2000 at class of detail C=30 respective C=45C Gauge no 1 Gauge no 2 Gauge no 3 Gauge no 4 Gauge no 5 Gauge no 6 Gauge no 7 Gauge no 830 0.00102202 0.00559000 0.00897362 0.01298475 0.00749771 0.00227207 0.00054623 0.0003356145 0.00017150 0.00040299 0.00084157 0.00117389 0.00056996 0.00012609 0.00004032 0.00001880
Table 4.3.e Damage fatigue for the entire measure period 1997 through 2000 at class of detail C=30respective C=45
C Gauge no 1 Gauge no 2 Gauge no 3 Gauge no 4 Gauge no 5 Gauge no 6 Gauge no 7 Gauge no 830 0.00566482 0.02405545 0.04046838 0.04659365 0.02689582 0.00911692 0.00238477 0.0019796845 0.00053598 0.00218143 0.00430908 0.00479834 0.00243850 0.00067287 0.00017906 0.00014352
From Table 4.3 e it is found that greatest fatigue damage during the recording period (fouryears) was at bridge no 4 where utilization was 0.047 at C=30 and 0.0048 at C=45. If themeasurement period is representative for the complete service life of 30 years the fatiguedamage for the service life will be
For C=30 35.0Years4Years30
04659365.0 =⋅
For C=45 036.0Years4Years30
00479834.0 =⋅
Figure 4.3 a Fatigue damage per year for recordings at strain gauge no 4 (170 degrees) andclass of detail C=30.
In Figure 4.3 a the fatigue damage shows an increasing magnitude during the years. Thereare only four years of recordings. Therefore the statistical material is limited. It is notpossible to determine if the increase is an actual trend accidental.
Damage fatigue per year at strain gauge no 4 (170 degrees), C=30
0
0.002
0.004
0.006
0.008
0.01
0.012
0.014
1997 1998 1999 2000
Year
Dam
age
fatig
ue
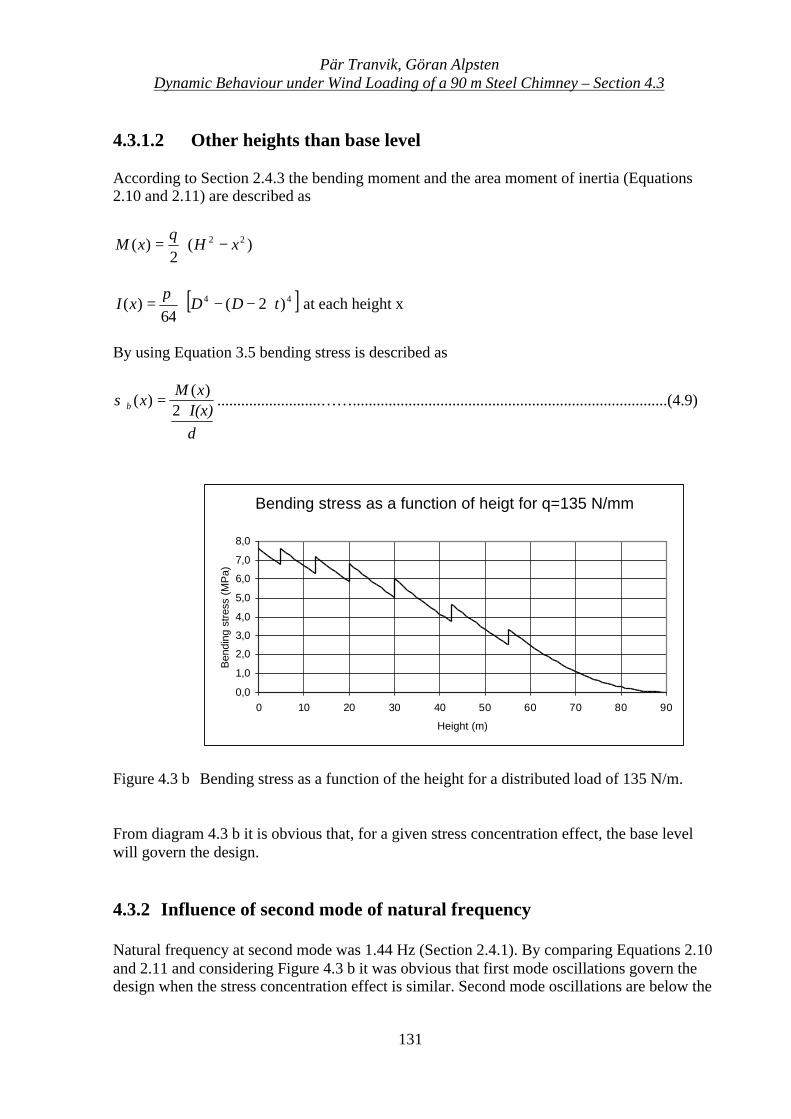
Pär Tranvik, Göran AlpstenDynamic Behaviour under Wind Loading of a 90 m Steel Chimney – Section 4.3
131
4.3.1.2 Other heights than base level
According to Section 2.4.3 the bending moment and the area moment of inertia (Equations2.10 and 2.11) are described as
)(2
)( 22 xHq
xM −⋅=
[ ]44 )2(64
)( tDDxI ⋅−−⋅=π
at each height x
By using Equation 3.5 bending stress is described as
dI(x)xM
xb ⋅=
2)(
)(σ ..........................……...............................................................................(4.9)
Bending stress as a function of heigt for q=135 N/mm
0,0
1,0
2,0
3,0
4,0
5,0
6,0
7,0
8,0
0 10 20 30 40 50 60 70 80 90
Height (m)
Ben
ding
stre
ss (
MP
a)
Figure 4.3 b Bending stress as a function of the height for a distributed load of 135 N/m.
From diagram 4.3 b it is obvious that, for a given stress concentration effect, the base levelwill govern the design.
4.3.2 Influence of second mode of natural frequency
Natural frequency at second mode was 1.44 Hz (Section 2.4.1). By comparing Equations 2.10and 2.11 and considering Figure 4.3 b it was obvious that first mode oscillations govern thedesign when the stress concentration effect is similar. Second mode oscillations are below the

Pär Tranvik, Göran AlpstenDynamic Behaviour under Wind Loading of a 90 m Steel Chimney – Section 4.3
132
endurance limit. Therefore no superposition of first and second mode oscillations has beenmade.
Pär Tranvik, Göran AlpstenDynamic Behaviour under Wind Loading of a 90 m Steel Chimney – Section 5
133
5 Crack propagation
5.1 Method of analysis
To get an estimation of the safety against fracture of the VEAB chimney, at the point of timewhen the damper was malfunctioning and before the cracks were repaired, a simplified crackpropagation analysis was made. The complete calculation is shown in Appendix L.
In this simplified estimation study the linear method was used as presented in [18].
The observed cracks at the erection splice at the 30 m level were found to be most critical.
The studied crack was of type 1 according to Figure 3.1 a. The shell plate thickness was 10mm. Typical crack length was 10 mm and a crack depth of 3 mm into the shell plateaccording to Appendix J.
The pitch is approximately 180 mm between the gusset plates. Several welds at the gussetplates were damaged by cracks. Therefore acceptable crack width was expected to be <<180 mm.
A lock-in factor of two is assumed for this analysis. It is based on results from Sections 3.4and 3.5.
5.2 Results
From a simple finite element analysis (FEA) calculation the geometric stress concentration wasfound to be 2 (Appendix K).
For the case with a functioning damper allowable crack length for a non-propagating surface crackwas calculated to 0.3 mm. For the case with a malfunctioning damper the corresponding crack lengthwas calculated to 0.2 mm.
The cracks were found to propagate critical if the damper is functioning after1 200 000 +114 000 = 1 300 000 cycles, or 48 + 4.6 = 53 days of continuous vortex sheddingoscillation.
The cracks were found to propagate critical if the damper is malfunctioning after225 000 + 21 400 = 250 000 cycles, or 9 + 1 = 10 days of continuous vortex shedding oscillating.
The corresponding number of load cycles during vortex shedding according to Section 3.5.7 is 13.1 .
106 according to the observations and 21 . 106 according to [3]. The load spectrum is discussed inchapter 3.6.
Considering the assumed load spectrum it is obvious that the chimney before it was repaired had ahigh probability for collapse.

Pär Tranvik, Göran AlpstenDynamic Behaviour under Wind Loading of a 90 m Steel Chimney – Section 5
134
Pär Tranvik, Göran AlpstenDynamic Behaviour under Wind Loading of a 90 m Steel Chimney – Section 6
135
6 Discussion
6.1 The reliability of buildings with mechanical movabledevices
The reliability of typical ordinary buildings is only depending on its support structuretransferring loads from the entire part of the building to the supports. A chimney or any otherconstruction equipped with a mechanical damper relies both on the support structure and onthe function of the damper.
Therefore the first question to discuss is whether reliability of building structures should bedepending on a devise or not. If the device is properly designed and functions as expectedthere are no problems. But if the device is mal-functioning in any way it could be hazardousfor the reliability of the building.
For mechanical pendulum tuned dampers at steel chimneys we have noted the following risks:
- There will be condensation in the damper house. An estimating calculation shows thatthere is risk of condensation in the damper house at some weather conditions, but theamount of condensed water is small. Thus the friction between friction mass and damperhouse bottom will be other than assumed in the design calculations and the damperproperties could be changed.
- There may be corrosion in the damper house caused by condensation in the damperhouse. The friction mass could corrode and get caught to the damper house bottom andthe damper will be locked. There may require excessive accelerations to loosen thefriction mass from the damper house bottom.
- The friction mass will freeze to the damper house bottom caused by the condensationwater and the damper will be locked. There will be required large accelerations toloosen the friction mass from the damper house bottom.
- The chimneys are aimed to operate for a period of many years. For the VEAB chimneythe design lifetime was decided to 30 years, which is common practice for chimneys inSweden. Because of the long lifetime there could be worries about dangerous weareventually in combination with corrosion.
- Error in handling or careless handling during erection and service could make thedamper inoperable by mistake.
- Design errors as wrongly calculated natural frequencies, error in selection of pendulummasses, error in selection of friction devices may result in a mistuned damper withlimited damping. [19] and Section 3.3.2.4 deals with the problem of mistuned damperson steel chimneys. There could be a lot of reasons for why calculated natural frequencydiffer from the real one, such as errors in calculating the natural frequency, simplifiedcalculation model which miss some effects or different mass distribution than assumed.
Pär Tranvik, Göran AlpstenDynamic Behaviour under Wind Loading of a 90 m Steel Chimney – Section 6
136
- The mechanical pendulum tuned damper requires a regular maintenance program. Forthe VEAB chimney it was decided to once a year. If the maintenance is neglected thereliability of the chimney is impaired. As for the aircraft and nuclear industry theinspection interval has to be smaller than the time required for a crack to grow criticalwith a mal-functioning damper. According to Section 5, 10 days of continuous vortexshedding oscillations could create critical crack and collapse. For the VEAB chimneythere were only one yearly inspection planned and acceptable inspection intervaltherefore were to long.
- Ice on the chimney during the winter periods add mass and changes the naturalfrequency resulting in a mistuned damper.
- Reynold number is changed if the chimney is charged with rainwater as discussed in[20]. Then the shape factor during vortex shedding oscillations could be increased withhazardous consequences for the chimney.
By paying attention to the risks above the economic incitement have to be big for usingmechanical pendulum tuned dampers. According to our experiences that is not the factespecially if the inspection and maintenance costs are included in the cost estimate. Achimney with any form of not movable device to reduce oscillations caused by vortexshedding is only requiring a limited amount of inspection and is therefore as economic as thependulum device.
To rely on movable devices in buildings is a form of risk management. Which risk isacceptable for a building? Our recommendation is that chimneys as other important buildingsshould not be depending on movable devices unless a careful risk management analysis havebeen made.
By using two differently tuned mechanical dampers some of the above mentioneddisadvantages could be avoided.
Vortex shedding oscillations are also a little surprising, in fact that no appreciate oscillationscould appear for decenniums and suddenly a winter period when critical meteorologicalconditions occur the chimney start to oscillate hazardous for a period as discussed in [1].Therefore it is easy to be lulled into security about the reliability after some years ofsatisfactory operating experience. Oscillations recorded during the current four-year programon the VEAB chimney never approached those observed in December 1996.
6.2 Comparable chimney data
Some investigations similar to that presented in this report have been published after thisinvestigation was started. Those other investigations involving measurements over time arelimited to a much shorter time period than for this investigation. The investigation presentedin this report cover a measurement period twice or more that of other investigations [1], [2],[15], [19], [21] and [22].
Pär Tranvik, Göran AlpstenDynamic Behaviour under Wind Loading of a 90 m Steel Chimney – Section 6
137
In [1] Table 6.2 a data as Scruton number and calculated and observed top amplitudedeflection for a number of steel chimneys are shown. To the table has been added the VEABchimney, a chimney at Varberg [21] with great oscillations from vortex shedding, a chimneyat Magdeburg [15] and with four chimneys presented in [22].
In Table 6.2 a the chimneys from [1] are named number 1 to 9, the chimneys in [22] with longterm recordings number 10 to 14, the VEAB chimney number 15, the Varberg chimney [21]number 16 and.
The following notifications are made in Table 7.1:
h = Heightd = Diameter? = Slenderness ratio h/dttopp = Top shell thicknessf = Natural frequencyd = Logarithmic decrementSc = Scruton numbervcr = Critical wind velocityRe = Reynold numberclat = The basic value of the aerodynamic exiting forceleffcorr = Effective correlation lengthK? = Eurocode 1 calculation variableKw = Eurocode 1 calculation variableymax = Calculated top amplitude deflection according to Eurocode 1yobs = Observed top amplitude deflectionymeasured = Measured top amplitude deflection
M = MeasuredO = Observed* = The difference in Scruton numbers is due to differences in structural
damping and mode shape** = The bigger diameter concern outer diameter of the damper.*** = Estimated top mass
15a = The VEAB chimney with a mal-functioning damper.15b = The VEAB chimney with a functioning damper.
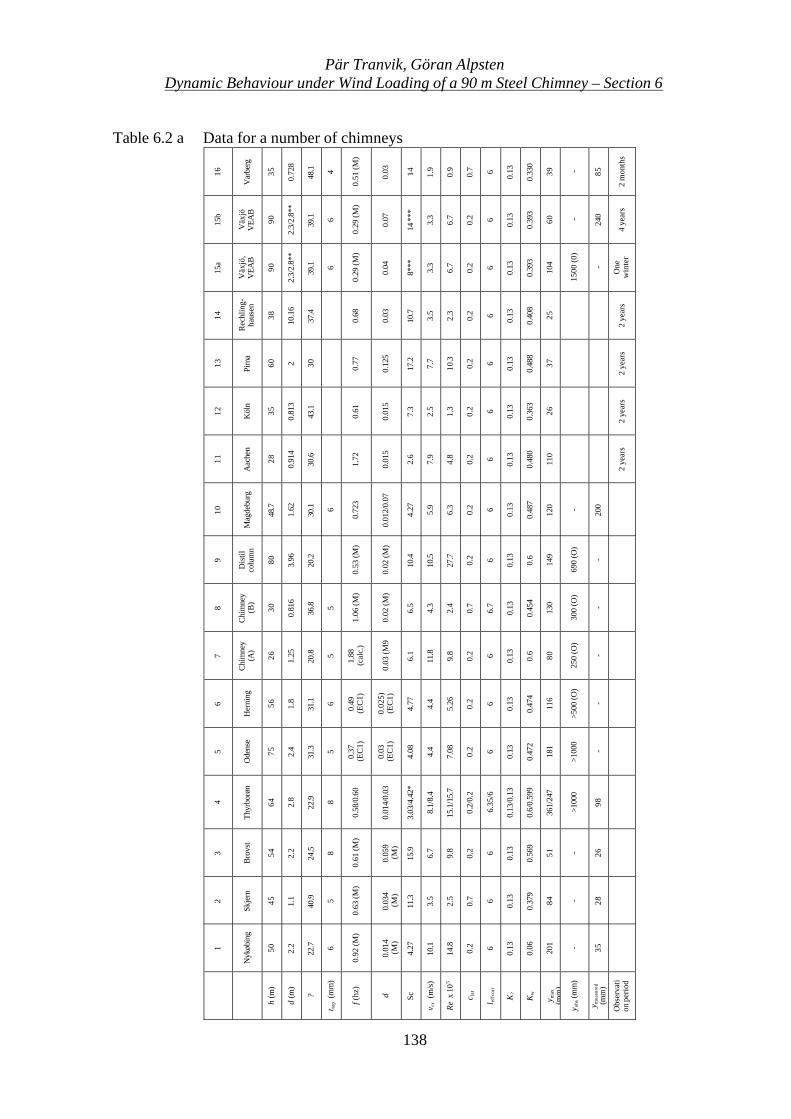
Pär Tranvik, Göran AlpstenDynamic Behaviour under Wind Loading of a 90 m Steel Chimney – Section 6
138
Table 6.2 a Data for a number of chimneys
16
Var
berg
35
0.72
8
48.1 4
0.51
(M)
0.03 14 1.9
0.9
0.7 6
0.13
0.33
0
39 - 85
2 m
onth
s
15b
Väx
jöV
EAB
90
2.3/
2.8*
*
39.1 6
0.29
(M)
0.07
14 *
**
3.3
6.7
0.2 6
0.13
0.39
3
60 -
240
4 ye
ars
15a
Väx
jö,
VEA
B
90
2.3/
2.8*
*
39.1 6
0.29
(M)
0.04
8***
3.3
6.7
0.2 6
0.13
0.39
3
104
1500
(0)
-
One
win
ter
14
Rec
hlin
g-ha
usen
38
10.1
6
37.4
0.68
0.03
10.7
3.5
2.3
0.2 6
0.13
0.40
8
25
2 ye
ars
13 Pirn
a
60 2 30 0.77
0.12
5
17.2
7.7
10.3
0.2 6
0.13
0.48
8
37
2 ye
ars
12 Köl
n
35
0.81
3
43.1
0.61
0.01
5
7.3
2.5
1.3
0.2 6
0.13
0.36
3
26
2 ye
ars
11
Aac
hen
28
0.91
4
30.6
1.72
0.01
5
2.6
7.9
4.8
0.2 6
0.13
0.48
0
110
2 ye
ars
10
Mag
debu
rg
48.7
1.62
30.1 6
0.72
3
0.01
2/0.
07
4.27 5.9
6.3
0.2 6
0.13
0.48
7
120 -
200
9
Dis
tilco
lum
n
80 3.96
20.2
0.53
(M)
0.02
(M)
10.4
10.5
27.7
0.2 6
0.13 0.6
149
690
(O)
-
8
Chi
mne
y(B
)
30
0.81
6
36.8 5
1.06
(M)
0.02
(M)
6.5
4.3
2.4
0.7
6.7
0.13
0.45
4
130
300
(O)
-
7
Chi
mne
y(A
)
26 1.25
20.8 5
1.88
(cal
c.)
0.03
(M9
6.1
11.8
9.8
0.2 6
0.13 0.6 80
250
(O)
-
6
Her
ning
56 1.8
31.1 6
0.49
(EC
1)
0.02
5)(E
C1)
4.77 4.4
5.26 0.2 6
0.13
0.47
4
116
>500
(O)
-
5
Ode
nse
75 2.4
31.3 5
0.37
(EC
1)
0.03
(EC
1)
4.08 4.4
7.08 0.2 6
0.13
0.47
2
181
>100
0
-
4
Thyr
borø
n
64 2.8
22.9 8
0.58
/0.6
0
0.01
4/0.
03
3.03
/4.4
2*
8.1/
8.4
15.1
/15.
7
0.2/
0.2
6.35
/6
0.13
/0.1
3
0.6/
0.59
9
361/
247
>100
0
98
3
Bro
vst
54 2.2
24.5 8
0.61
(M)
0.05
9(M
)
15.9
6.7
9.8
0.2 6
0.13
0.56
9
51 - 26
2
Skje
rn
45 1.1
40.9 5
0.63
(M)
0.03
4(M
)
11.3
3.5
2.5
0.7 6
0.13
0.37
9
84 - 28
1
Nyk
øbin
g
50 2.2
22.7 6
0.92
(M)
0.01
4(M
)
4.27
10.1
14.8
0.2 6
0.13
0.06 201 - 35
h (m
)
d (m
)
?
t top
(mm
)
f (hz
)
d Sc
v cr
(m/s
)
Re
x 1
05
c lat
l effc
orr
K?
Kw
y max
(mm
)
y obs
(mm
)
y mea
sure
d(m
m)
Obs
erva
tion
per
iod
Pär Tranvik, Göran AlpstenDynamic Behaviour under Wind Loading of a 90 m Steel Chimney – Section 6
139
As [1] notifies Table 6.2 a show that Eurocode 1 often underestimates the top amplitudedeflections during vortex shedding oscillations. BSV 97 [3] has limits for slenderness and topdeflection as noted in Section 2.4.2.
It is worth noticing that non-professional persons often overestimate visual observations ofchimney top deflections. That is a reasonable fact, but that is not the same as saying thatvisual observations of chimney top deflection always are overestimated. The professional isaware of necessary references needed for the estimation.
6.3 Codes
6.3.1 General
Rules for designing slender structures under wind loading as chimneys are found in variouscodes. Most countries have their own national codes but organisations such as CEN andComite International Des Cheminées Industrielles (CICIND) have developed common codesas the Eurocode and the CICIND code.
There are great deviations between the national codes as well as the common codes. Mostcodes deals with static wind loads in a similar way. However action from vortex shedding istreated in different ways. Some codes limit the allowable slenderness ratio (height/diameter),for applicability of the code design model. Limit restrictions for the top deflection at vortexshedding are also used.
There is a discussion going on about the requirement of revision the codes. See for instance[1] and [15].
For static design the 50-year maximum wind load (gust included) considering global and localbuckling and plasticity are applied combined with dead load and other loads.
For dynamic loads fatigue has to be considered. The spectra of fatigue effects will be made upof response from gust wind, vortex shedding and ring oscillations (ovalling).
As a complement to the codes, handbooks have to be used for evaluation of buckling modes,welds and details. In most cases also a finite element (FEA) computer program is necessaryfor calculating natural frequencies with an acceptable accuracy.
Selection of the applicable code is in most cases depending on in which country the chimneywill be erected. Some codes for designing steel chimneys are found in [3], [4], [5], [9], [17]and [23].
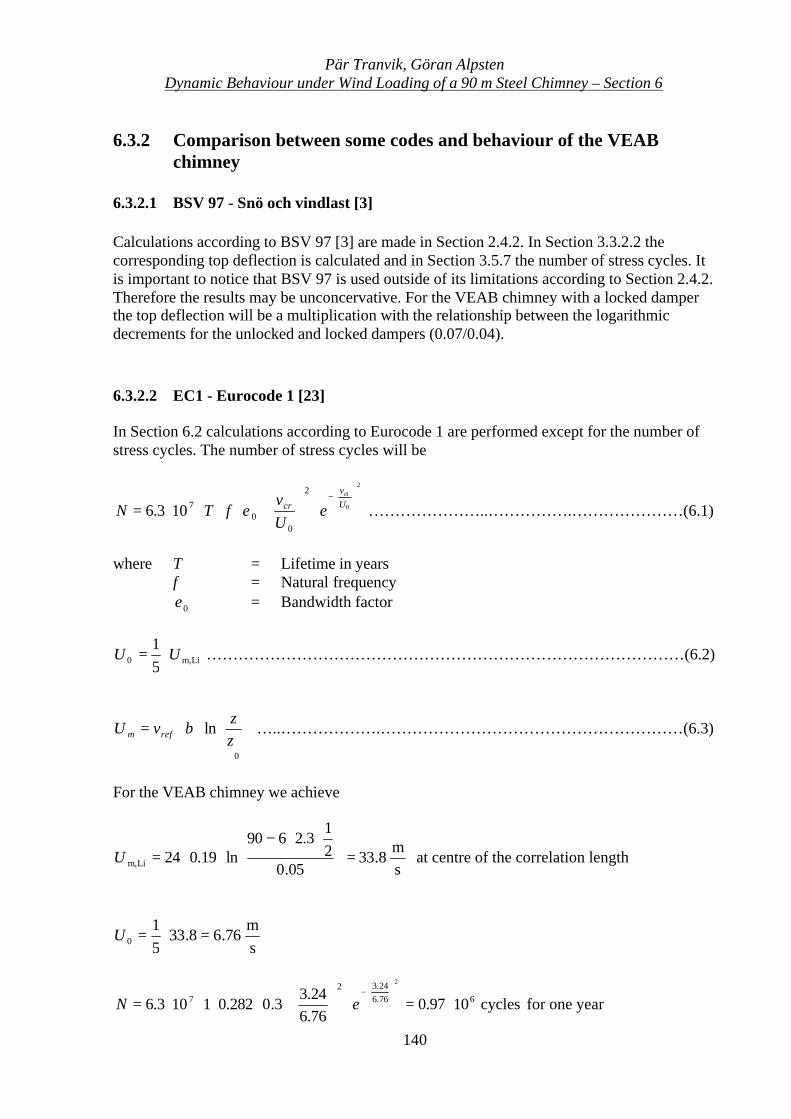
Pär Tranvik, Göran AlpstenDynamic Behaviour under Wind Loading of a 90 m Steel Chimney – Section 6
140
6.3.2 Comparison between some codes and behaviour of the VEABchimney
6.3.2.1 BSV 97 - Snö och vindlast [3]
Calculations according to BSV 97 [3] are made in Section 2.4.2. In Section 3.3.2.2 thecorresponding top deflection is calculated and in Section 3.5.7 the number of stress cycles. Itis important to notice that BSV 97 is used outside of its limitations according to Section 2.4.2.Therefore the results may be unconcervative. For the VEAB chimney with a locked damperthe top deflection will be a multiplication with the relationship between the logarithmicdecrements for the unlocked and locked dampers (0.07/0.04).
6.3.2.2 EC1 - Eurocode 1 [23]
In Section 6.2 calculations according to Eurocode 1 are performed except for the number ofstress cycles. The number of stress cycles will be
2
0
2
00
7103.6
−
⋅
⋅⋅⋅⋅⋅= U
v
crct
eUv
fTN ε …………………..…………….…………………(6.1)
where T = Lifetime in yearsf = Natural frequency
0ε = Bandwidth factor
Lim,0 51
UU ⋅= ………………………………………………………………………………(6.2)
⋅⋅=
0
lnzz
vU refm β …..……………….…………………………………………………(6.3)
For the VEAB chimney we achieve
sm
8.3305.0
21
3.2690ln19.024Lim, =
⋅⋅−⋅⋅=U at centre of the correlation length
sm
76.68.3351
0 =⋅=U
cycles1097.076.624.3
3.0282.01103.6 676.624.32
7
2
⋅=⋅
⋅⋅⋅⋅⋅=
−eN for one year
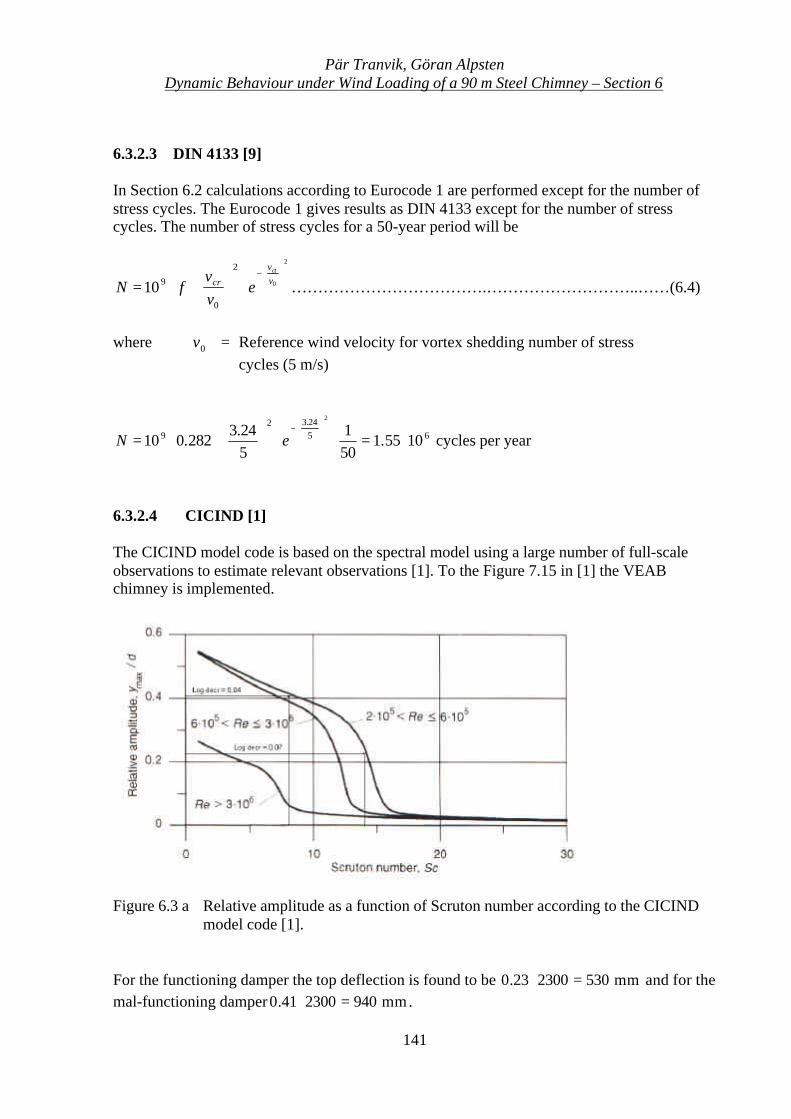
Pär Tranvik, Göran AlpstenDynamic Behaviour under Wind Loading of a 90 m Steel Chimney – Section 6
141
6.3.2.3 DIN 4133 [9]
In Section 6.2 calculations according to Eurocode 1 are performed except for the number ofstress cycles. The Eurocode 1 gives results as DIN 4133 except for the number of stresscycles. The number of stress cycles for a 50-year period will be
2
0
2
0
910
−
⋅
⋅⋅= v
v
crct
evv
fN ……………………………….………………………..……(6.4)
where 0v = Reference wind velocity for vortex shedding number of stresscycles (5 m/s)
6524.32
9 1055.1501
524.3
282.010
2
⋅=⋅⋅
⋅⋅=
−eN cycles per year
6.3.2.4 CICIND [1]
The CICIND model code is based on the spectral model using a large number of full-scaleobservations to estimate relevant observations [1]. To the Figure 7.15 in [1] the VEABchimney is implemented.
Figure 6.3 a Relative amplitude as a function of Scruton number according to the CICINDmodel code [1].
For the functioning damper the top deflection is found to be mm530230023.0 =⋅ and for themal-functioning damper mm940230041.0 =⋅ .
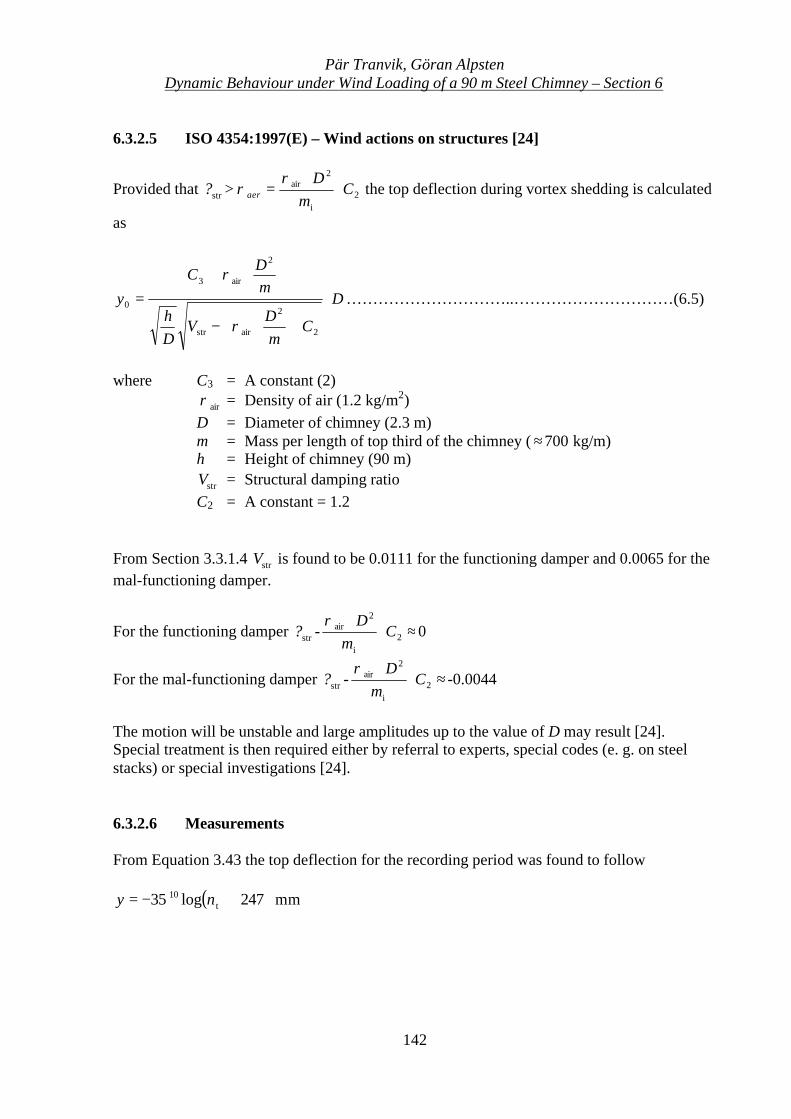
Pär Tranvik, Göran AlpstenDynamic Behaviour under Wind Loading of a 90 m Steel Chimney – Section 6
142
6.3.2.5 ISO 4354:1997(E) – Wind actions on structures [24]
Provided that str? > 2i
2air Cm
Daer ⋅
⋅=
ρρ the top deflection during vortex shedding is calculated
as
D
CmD
Dh
mDC
y ⋅
⋅
⋅−
⋅⋅
=
2
2
airstr
2
air3
0
ρς
ρ…………………………..…………………………(6.5)
where C3 = A constant (2)airρ = Density of air (1.2 kg/m2)
D = Diameter of chimney (2.3 m)m = Mass per length of top third of the chimney ( ≈ 700 kg/m)h = Height of chimney (90 m)
strς = Structural damping ratioC2 = A constant = 1.2
From Section 3.3.1.4 strς is found to be 0.0111 for the functioning damper and 0.0065 for themal-functioning damper.
For the functioning damper str? - 2i
2air Cm
D⋅
⋅ρ≈ 0
For the mal-functioning damper str? - 2i
2air Cm
D⋅
⋅ρ≈ -0.0044
The motion will be unstable and large amplitudes up to the value of D may result [24].Special treatment is then required either by referral to experts, special codes (e. g. on steelstacks) or special investigations [24].
6.3.2.6 Measurements
From Equation 3.43 the top deflection for the recording period was found to follow
( ) 247log35 t10 +⋅−= ny mm
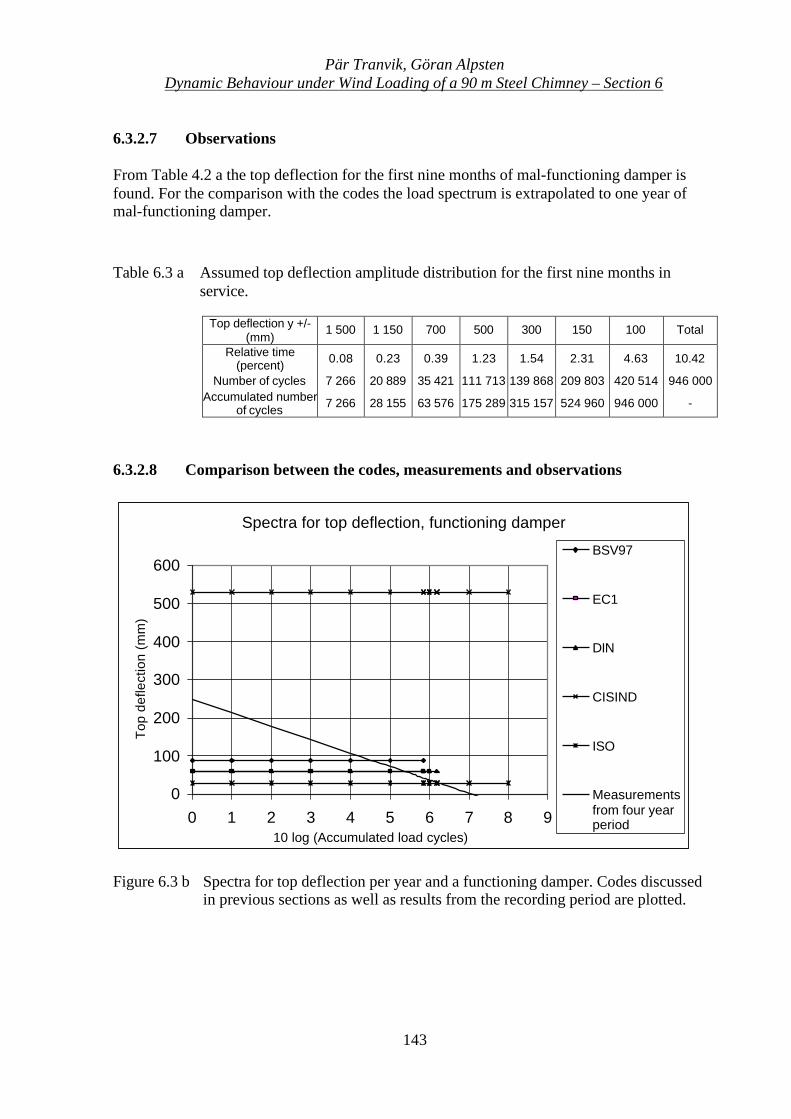
Pär Tranvik, Göran AlpstenDynamic Behaviour under Wind Loading of a 90 m Steel Chimney – Section 6
143
6.3.2.7 Observations
From Table 4.2 a the top deflection for the first nine months of mal-functioning damper isfound. For the comparison with the codes the load spectrum is extrapolated to one year ofmal-functioning damper.
Table 6.3 a Assumed top deflection amplitude distribution for the first nine months inservice.
Top deflection y +/-(mm)
1 500 1 150 700 500 300 150 100 Total
Relative time(percent) 0.08 0.23 0.39 1.23 1.54 2.31 4.63 10.42
Number of cycles 7 266 20 889 35 421 111 713 139 868 209 803 420 514 946 000Accumulated number
of cycles 7 266 28 155 63 576 175 289 315 157 524 960 946 000 -
6.3.2.8 Comparison between the codes, measurements and observations
Spectra for top deflection, functioning damper
0
100
200
300
400
500
600
0 1 2 3 4 5 6 7 8 910 log (Accumulated load cycles)
Top
def
lect
ion
(mm
)
BSV97
EC1
DIN
CISIND
ISO
Measurementsfrom four yearperiod
Figure 6.3 b Spectra for top deflection per year and a functioning damper. Codes discussedin previous sections as well as results from the recording period are plotted.
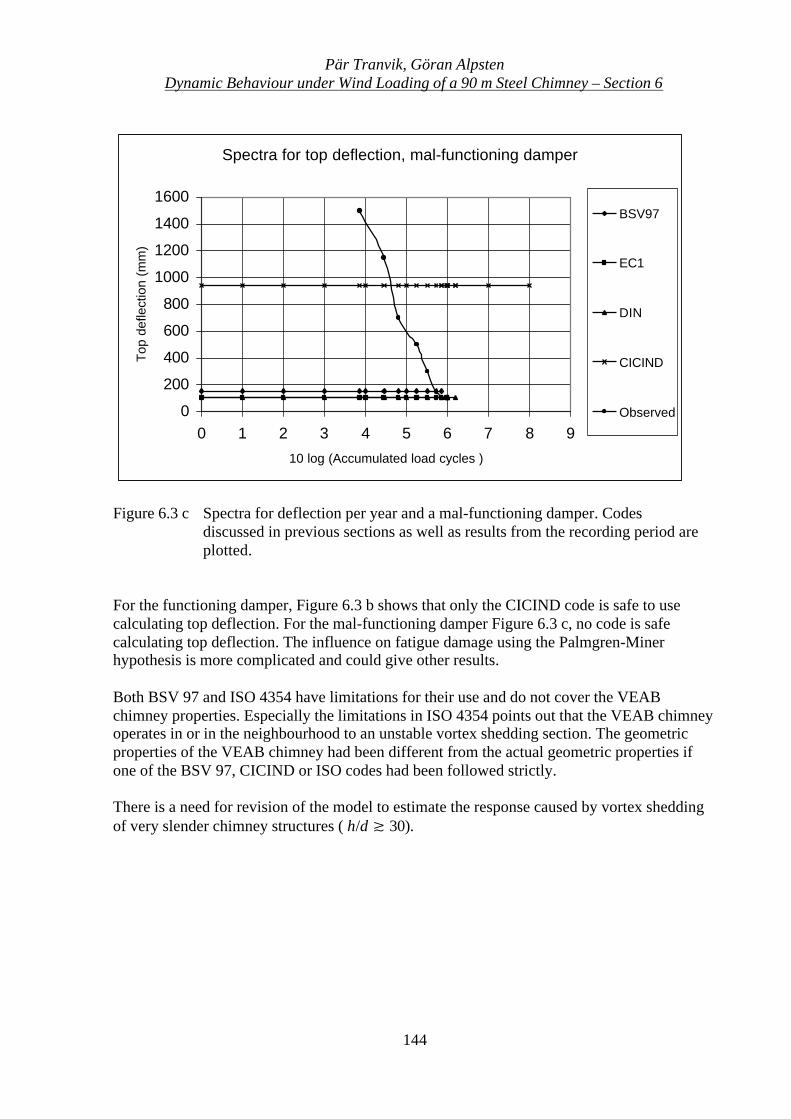
Pär Tranvik, Göran AlpstenDynamic Behaviour under Wind Loading of a 90 m Steel Chimney – Section 6
144
Spectra for top deflection, mal-functioning damper
0
200
400
600
800
1000
1200
1400
1600
0 1 2 3 4 5 6 7 8 9
10 log (Accumulated load cycles )
Top
def
lect
ion
(mm
)
BSV97
EC1
DIN
CICIND
Observed
Figure 6.3 c Spectra for deflection per year and a mal-functioning damper. Codesdiscussed in previous sections as well as results from the recording period areplotted.
For the functioning damper, Figure 6.3 b shows that only the CICIND code is safe to usecalculating top deflection. For the mal-functioning damper Figure 6.3 c, no code is safecalculating top deflection. The influence on fatigue damage using the Palmgren-Minerhypothesis is more complicated and could give other results.
Both BSV 97 and ISO 4354 have limitations for their use and do not cover the VEABchimney properties. Especially the limitations in ISO 4354 points out that the VEAB chimneyoperates in or in the neighbourhood to an unstable vortex shedding section. The geometricproperties of the VEAB chimney had been different from the actual geometric properties ifone of the BSV 97, CICIND or ISO codes had been followed strictly.
There is a need for revision of the model to estimate the response caused by vortex sheddingof very slender chimney structures ( h/d ¤ 30).
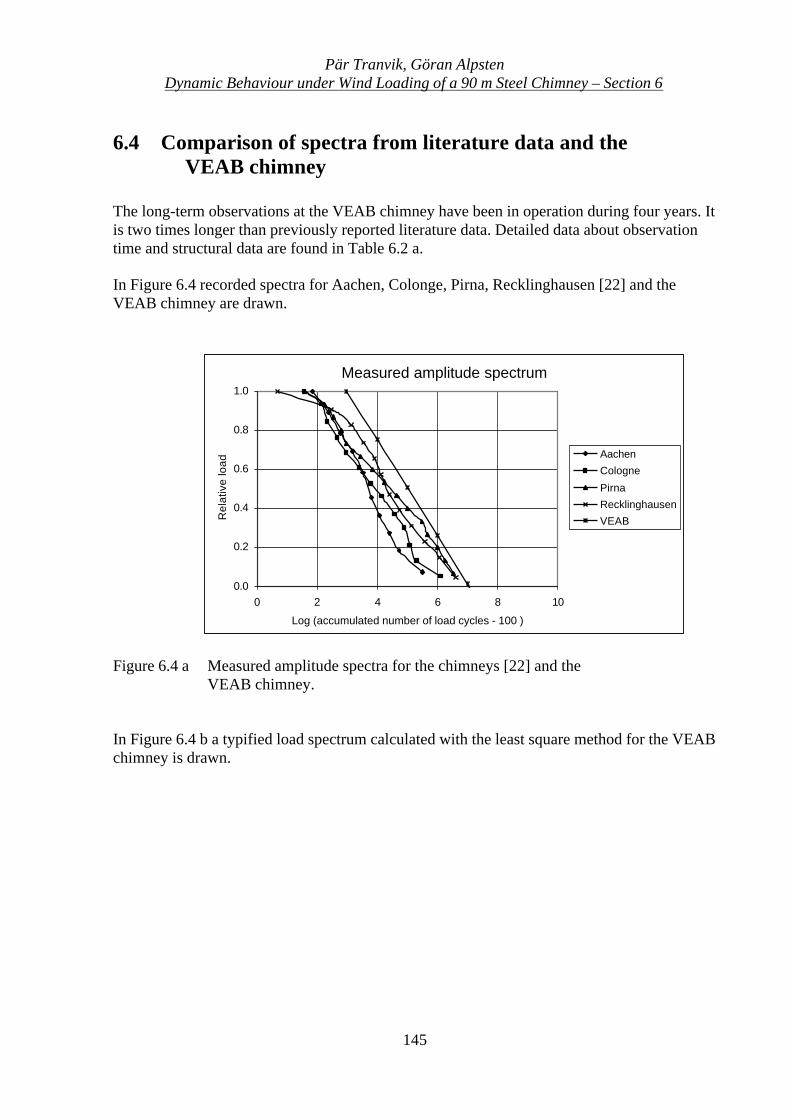
Pär Tranvik, Göran AlpstenDynamic Behaviour under Wind Loading of a 90 m Steel Chimney – Section 6
145
6.4 Comparison of spectra from literature data and theVEAB chimney
The long-term observations at the VEAB chimney have been in operation during four years. Itis two times longer than previously reported literature data. Detailed data about observationtime and structural data are found in Table 6.2 a.
In Figure 6.4 recorded spectra for Aachen, Colonge, Pirna, Recklinghausen [22] and theVEAB chimney are drawn.
Measured amplitude spectrum
0.0
0.2
0.4
0.6
0.8
1.0
0 2 4 6 8 10
Log (accumulated number of load cycles - 100 )
Rel
ativ
e lo
ad
Aachen
Cologne
Pirna
Recklinghausen
VEAB
Figure 6.4 a Measured amplitude spectra for the chimneys [22] and theVEAB chimney.
In Figure 6.4 b a typified load spectrum calculated with the least square method for the VEABchimney is drawn.
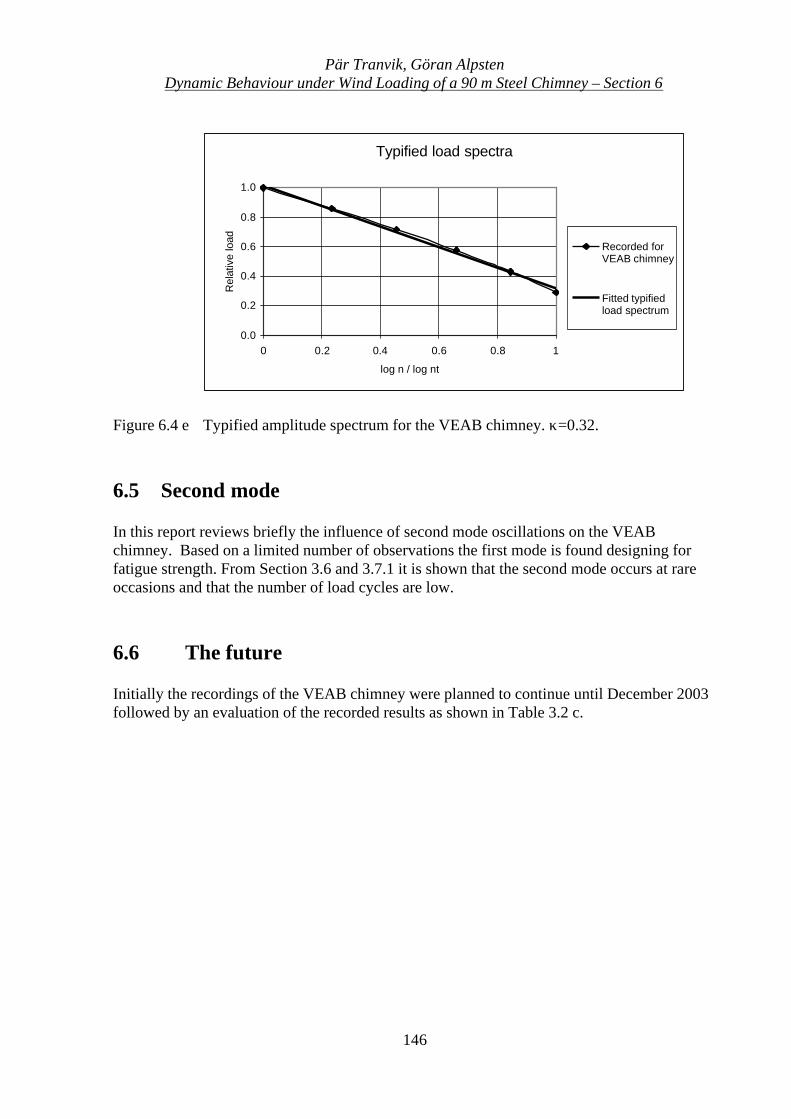
Pär Tranvik, Göran AlpstenDynamic Behaviour under Wind Loading of a 90 m Steel Chimney – Section 6
146
Typified load spectra
0.0
0.2
0.4
0.6
0.8
1.0
0 0.2 0.4 0.6 0.8 1
log n / log nt
Rel
ativ
e lo
ad
Recorded forVEAB chimney
Fitted typifiedload spectrum
Figure 6.4 e Typified amplitude spectrum for the VEAB chimney. κ=0.32.
6.5 Second mode
In this report reviews briefly the influence of second mode oscillations on the VEABchimney. Based on a limited number of observations the first mode is found designing forfatigue strength. From Section 3.6 and 3.7.1 it is shown that the second mode occurs at rareoccasions and that the number of load cycles are low.
6.6 The future
Initially the recordings of the VEAB chimney were planned to continue until December 2003followed by an evaluation of the recorded results as shown in Table 3.2 c.
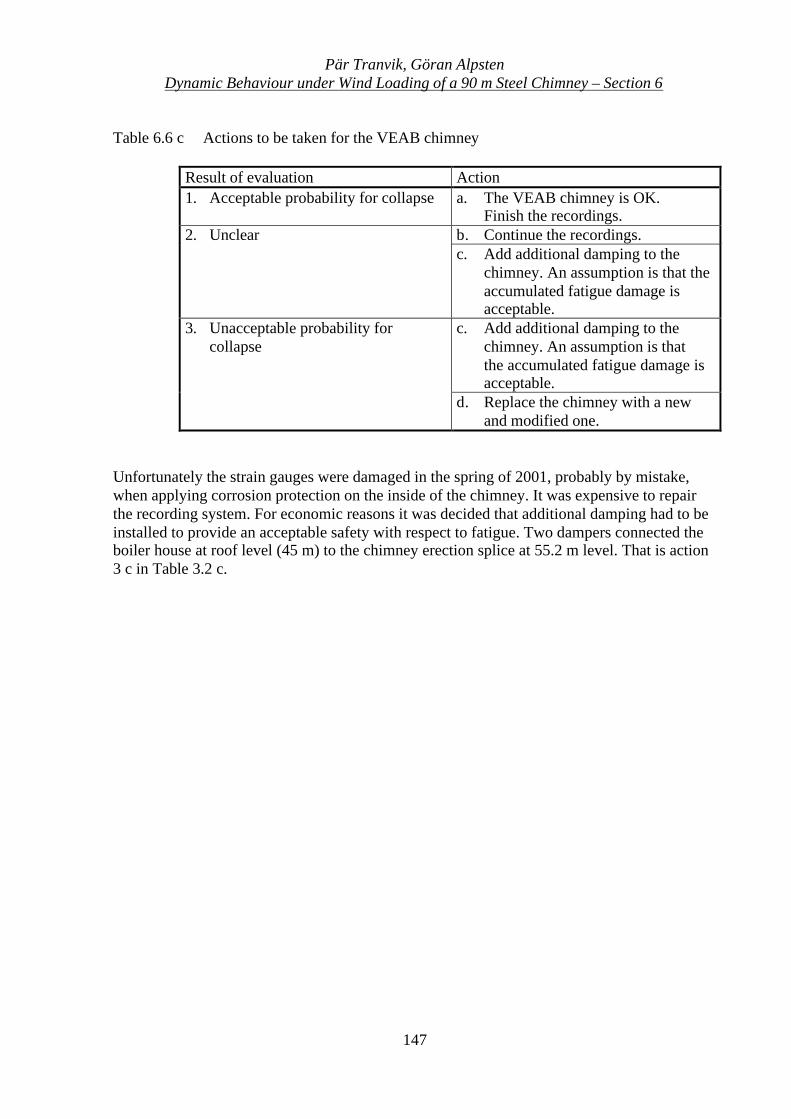
Pär Tranvik, Göran AlpstenDynamic Behaviour under Wind Loading of a 90 m Steel Chimney – Section 6
147
Table 6.6 c Actions to be taken for the VEAB chimney
Result of evaluation Action1. Acceptable probability for collapse a. The VEAB chimney is OK.
Finish the recordings.2. Unclear b. Continue the recordings.
c. Add additional damping to thechimney. An assumption is that theaccumulated fatigue damage isacceptable.
3. Unacceptable probability for collapse
c. Add additional damping to the chimney. An assumption is that the accumulated fatigue damage is acceptable.
d. Replace the chimney with a new and modified one.
Unfortunately the strain gauges were damaged in the spring of 2001, probably by mistake,when applying corrosion protection on the inside of the chimney. It was expensive to repairthe recording system. For economic reasons it was decided that additional damping had to beinstalled to provide an acceptable safety with respect to fatigue. Two dampers connected theboiler house at roof level (45 m) to the chimney erection splice at 55.2 m level. That is action3 c in Table 3.2 c.

Pär Tranvik, Göran AlpstenDynamic Behaviour under Wind Loading of a 90 m Steel Chimney – Section 6
148
Pär Tranvik, Göran AlpstenDynamic Behaviour under Wind Loading of a 90 m Steel Chimney - Section 7
149
7 Summary
7.1 In English
The long-term observations at the VEAB chimney have been in operation during four years. Itis two times longer than previously available data in the literature for other chimneys.
The report contains data on the behaviour of a major chimney with a mass damper. Themeasured damping was less than expected, probably because the limited space in the damperhouse not did allow necessary pendulum movements, and too low pendulum mass.
The VEAB chimney was found to oscillate in both first and second mode of naturalfrequency. Second mode oscillations are rare for normal chimneys. The damping of secondorder oscillations is much greater than for first order. The evaluation of the measurementsshowed that the influence of second order oscillations could be neglected.
A comparison with some other chimneys reported in the literature shows that the VEABchimney is unique in height and slenderness.
Typified linear load effect spectra describe the chimney behaviour well.
A full scale damping measurement was performed and evaluated for the VEAB chimney withand without functioning damper.
A comparison with a number of code regulations has been performed.
A refinement of a theoretical calculation model for the behaviour of tuned mass dampers wasperformed.
Actual meterological data were considered in evaluation the action for the VEAB chimney.
Geometric properties of the VEAB chimney had been selected to other dimensions if one ofthe BSV 97, CICIND or ISO codes had been followed strictly. The diameter had beenselected to a greater size.
There is a need for revising the calculation model for vortex shedding of very slenderchimneys, that is for chimneys with slender ratio height through diameter aboveapproximately 30.
Pär Tranvik, Göran AlpstenDynamic Behaviour under Wind Loading of a 90 m Steel Chimney - Section 7
150
7.2 In Swedish
Mätsystemet för långtidsövervakning av VEAB stålskorsten har varit i drift under fyra år.Det är två gånger längre än tidigare i litteraturen beskrivna mätningar för skorstenar.
Rapporten innehåller uppgifter om beteende för en skorsten försedd med massdämpare. Denuppmätta dämpningen var mindre än väntat, antagligen på grund av att begränsat utrymme idämparhuset inte tillät nödvändig pendelrörelse samt att pendelmassan var för låg.
VEAB stålskorsten observerades svänga i både första och andra modens egenfrekvens.Svängningar i andra moden är ovanliga för stålskorstenar. Dämpningen är mycket större förandra modens svängningar än för första modens. Utvärderingen av mätdata visade att andramodens inflytande kunde försummas.
En jämförelse med ett antal andra skorstenar beskrivna i litteraturen visade att VEABskorstenen är unik i höjd och slankhet.
Skorstenens uppförande beskrivs väl av ett lastspektrum.
En mätning av dämpning genomfördes i full skala för VEAB stålskorsten med bådefungerande och låst dämpare.
En jämförelse med ett antal normer är gjord.
Verkliga meteorologiska data beaktades vid utvärderingen.
En förbättrat förslag på beräkningsmodell för pendelförsedda massdämpare är utarbetat.
Aktuella meteorologiska data har beaktats vid alla utvärderingar.
Dom geometriska storheterna för VEAB stålskorsten hade valts annorlunda om någon avnormerna BSV 97, CICIND or ISO hade följts konsekvent. Skorstenens diameter hade dåvalts större.
Det är behov av en översyn av beräkningsmodellen för att uppskatta responsen frånvirvelavlösning för mycket slanka stålskorstenar. Med mycket slanka stålskorstenar avses ettslankhetstalet (höjd genom diameter) över ungefär 30.
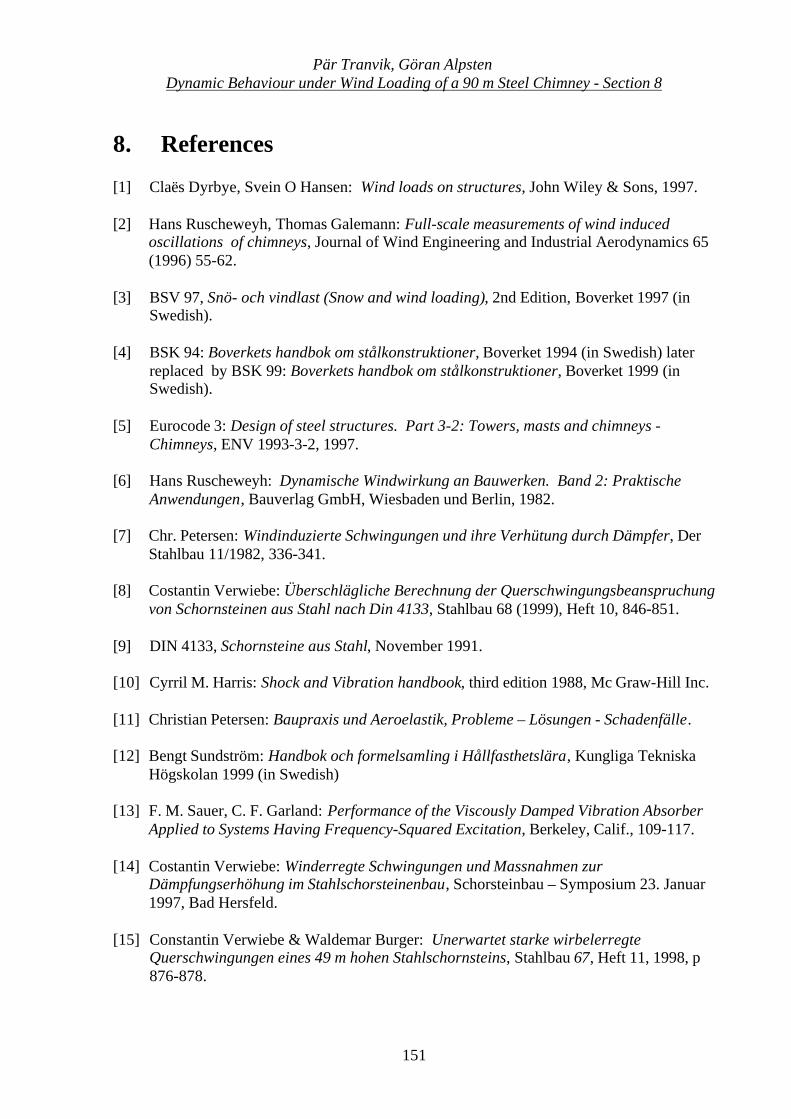
Pär Tranvik, Göran AlpstenDynamic Behaviour under Wind Loading of a 90 m Steel Chimney - Section 8
151
8. References
[1] Claës Dyrbye, Svein O Hansen: Wind loads on structures, John Wiley & Sons, 1997.
[2] Hans Ruscheweyh, Thomas Galemann: Full-scale measurements of wind inducedoscillations of chimneys, Journal of Wind Engineering and Industrial Aerodynamics 65(1996) 55-62.
[3] BSV 97, Snö- och vindlast (Snow and wind loading), 2nd Edition, Boverket 1997 (inSwedish).
[4] BSK 94: Boverkets handbok om stålkonstruktioner, Boverket 1994 (in Swedish) laterreplaced by BSK 99: Boverkets handbok om stålkonstruktioner, Boverket 1999 (inSwedish).
[5] Eurocode 3: Design of steel structures. Part 3-2: Towers, masts and chimneys -Chimneys, ENV 1993-3-2, 1997.
[6] Hans Ruscheweyh: Dynamische Windwirkung an Bauwerken. Band 2: PraktischeAnwendungen, Bauverlag GmbH, Wiesbaden und Berlin, 1982.
[7] Chr. Petersen: Windinduzierte Schwingungen und ihre Verhütung durch Dämpfer, DerStahlbau 11/1982, 336-341.
[8] Costantin Verwiebe: Überschlägliche Berechnung der Querschwingungsbeanspruchungvon Schornsteinen aus Stahl nach Din 4133, Stahlbau 68 (1999), Heft 10, 846-851.
[9] DIN 4133, Schornsteine aus Stahl, November 1991.
[10] Cyrril M. Harris: Shock and Vibration handbook, third edition 1988, Mc Graw-Hill Inc.
[11] Christian Petersen: Baupraxis und Aeroelastik, Probleme – Lösungen - Schadenfälle.
[12] Bengt Sundström: Handbok och formelsamling i Hållfasthetslära, Kungliga TekniskaHögskolan 1999 (in Swedish)
[13] F. M. Sauer, C. F. Garland: Performance of the Viscously Damped Vibration AbsorberApplied to Systems Having Frequency-Squared Excitation, Berkeley, Calif., 109-117.
[14] Costantin Verwiebe: Winderregte Schwingungen und Massnahmen zurDämpfungserhöhung im Stahlschorsteinenbau, Schorsteinbau – Symposium 23. Januar1997, Bad Hersfeld.
[15] Constantin Verwiebe & Waldemar Burger: Unerwartet starke wirbelerregteQuerschwingungen eines 49 m hohen Stahlschornsteins, Stahlbau 67, Heft 11, 1998, p876-878.
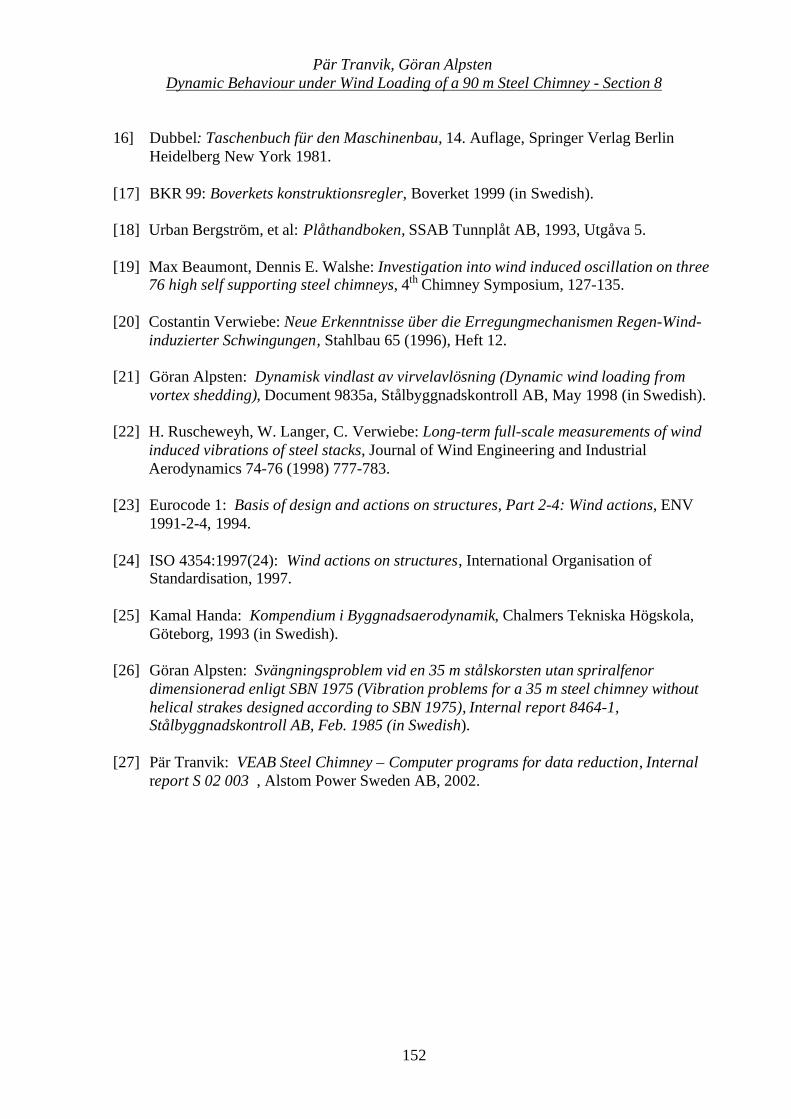
Pär Tranvik, Göran AlpstenDynamic Behaviour under Wind Loading of a 90 m Steel Chimney - Section 8
152
16] Dubbel: Taschenbuch für den Maschinenbau, 14. Auflage, Springer Verlag BerlinHeidelberg New York 1981.
[17] BKR 99: Boverkets konstruktionsregler, Boverket 1999 (in Swedish).
[18] Urban Bergström, et al: Plåthandboken, SSAB Tunnplåt AB, 1993, Utgåva 5.
[19] Max Beaumont, Dennis E. Walshe: Investigation into wind induced oscillation on three76 high self supporting steel chimneys, 4th Chimney Symposium, 127-135.
[20] Costantin Verwiebe: Neue Erkenntnisse über die Erregungmechanismen Regen-Wind-induzierter Schwingungen, Stahlbau 65 (1996), Heft 12.
[21] Göran Alpsten: Dynamisk vindlast av virvelavlösning (Dynamic wind loading fromvortex shedding), Document 9835a, Stålbyggnadskontroll AB, May 1998 (in Swedish).
[22] H. Ruscheweyh, W. Langer, C. Verwiebe: Long-term full-scale measurements of windinduced vibrations of steel stacks, Journal of Wind Engineering and IndustrialAerodynamics 74-76 (1998) 777-783.
[23] Eurocode 1: Basis of design and actions on structures, Part 2-4: Wind actions, ENV1991-2-4, 1994.
[24] ISO 4354:1997(24): Wind actions on structures, International Organisation ofStandardisation, 1997.
[25] Kamal Handa: Kompendium i Byggnadsaerodynamik, Chalmers Tekniska Högskola,Göteborg, 1993 (in Swedish).
[26] Göran Alpsten: Svängningsproblem vid en 35 m stålskorsten utan spriralfenordimensionerad enligt SBN 1975 (Vibration problems for a 35 m steel chimney withouthelical strakes designed according to SBN 1975), Internal report 8464-1,Stålbyggnadskontroll AB, Feb. 1985 (in Swedish).
[27] Pär Tranvik: VEAB Steel Chimney – Computer programs for data reduction, Internalreport S 02 003 , Alstom Power Sweden AB, 2002.