Embed Size (px)
Citation preview
Dynamic and static cues for binocular vision – a systematic comparison
Thesis submitted in accordance with the requirements of the University of Liverpool for the degree of Doctor of Philosophy
by
Laurence P F Y H Tidbury
October 2016
Experimental Psychology and The Directorate of Orthoptics and Vision Science University of Liverpool
2
Contents
Contents ....................................................................................................................... 2
Abstract ........................................................................................................................ 7
Acknowledgements ...................................................................................................... 9
Abbreviations ............................................................................................................. 10
Chapter One - Introduction ........................................................................................ 11
Motion in depth ...................................................................................................... 11
The detection of depth, with changing depth .................................................... 15
Stereoacuity and Motion in Depth ..................................................................... 17
The detection of motion vs the detection of depth ........................................... 19
Scotomas of stereoblindness to motion in depth vs static depth ...................... 20
Aim and Summary of experiments ......................................................................... 21
Chapter Two - General Methods................................................................................ 22
Ethical Approval ...................................................................................................... 22
Screening ................................................................................................................ 22
Subjects .................................................................................................................. 23
Display Types ...................................................................................................... 25
Display I - LG ........................................................................................................ 27
Display II – Modified Synoptophore ................................................................... 34
Development of Stimuli Patches ............................................................................ 40

3
Control of experiment ............................................................................................ 42
Equipment ........................................................................................................... 42
Software .............................................................................................................. 42
Stimuli display ..................................................................................................... 46
Chapter Three – Dynamic cues to binocular depth ................................................... 50
Introduction ............................................................................................................ 50
Methods ................................................................................................................. 53
Experimental conditions ..................................................................................... 53
Results .................................................................................................................... 54
Discussion ............................................................................................................... 56
Chapter Four – A systematic comparison of static and dynamic cues for depth
perception .................................................................................................................. 59
Introduction ............................................................................................................ 59
Materials and Methods .......................................................................................... 63
Procedure ............................................................................................................ 67
Statistical Analysis ............................................................................................... 67
Results .................................................................................................................... 68
Do dynamic stimuli results in lower depth detection thresholds than static
stimuli? ................................................................................................................ 70
Factorial combination of pattern and z-location change ................................... 70

4
Control for the use of non-disparity signals ....................................................... 71
Discussion ............................................................................................................... 72
Dynamic stereoscopic stimuli and the perception of depth .............................. 72
Task Difficulty ...................................................................................................... 73
Facilitation specific to disparity change .............................................................. 75
Conclusion .............................................................................................................. 80
Chapter Five - The effect of induced fusional demand on static and dynamic
stereoacuity thresholds ............................................................................................. 82
Introduction ............................................................................................................ 82
Materials and Methods .......................................................................................... 85
Subjects ............................................................................................................... 85
Apparatus ............................................................................................................ 85
Fusion .................................................................................................................. 87
Stimuli. ................................................................................................................ 88
Procedure ............................................................................................................ 90
Threshold estimation .......................................................................................... 91
Statistical Analysis ............................................................................................... 91
Results .................................................................................................................... 92
Discussion ............................................................................................................... 96
Chapter Six – Control experiments .......................................................................... 100

5
Chapter 6a – Spurious Temporal Correlation ....................................................... 100
Materials and Methods ........................................................................................ 101
Stimulus Design ................................................................................................. 101
Procedure .......................................................................................................... 102
Apparatus .......................................................................................................... 103
Threshold estimation ........................................................................................ 103
Statistical Analysis ............................................................................................. 103
Results .................................................................................................................. 103
Discussion ............................................................................................................. 106
Chapter 6B – Rate of change of disparity ............................................................. 108
Materials and Methods ........................................................................................ 109
Apparatus .......................................................................................................... 109
Stimuli ............................................................................................................... 109
Threshold estimation ........................................................................................ 109
Procedure .......................................................................................................... 110
Statistical Analysis ............................................................................................. 110
Results .................................................................................................................. 111
IOVD condition .................................................................................................. 111
CDOT condition ................................................................................................. 112
Discussion ............................................................................................................. 116
6
Chapter 6C – The ratio of cues ............................................................................. 118
Materials and Methods ........................................................................................ 119
Stimuli Design ................................................................................................... 119
Results .................................................................................................................. 121
Part one ............................................................................................................. 121
Part two ............................................................................................................ 123
Discussion ............................................................................................................. 125
Conclusion ............................................................................................................ 126
Chapter Seven - General Discussion ........................................................................ 127
Conclusion ............................................................................................................ 145
Appendices ............................................................................................................... 146
Appendix I – Ethical Approval ............................................................................... 147
Appendix II – Planar System example .................................................................. 148
Appendix IV – Chapter four additional data ......................................................... 154
Appendix V –Sections as published ...................................................................... 158
References ................................................................................................................ 158
7
Abstract
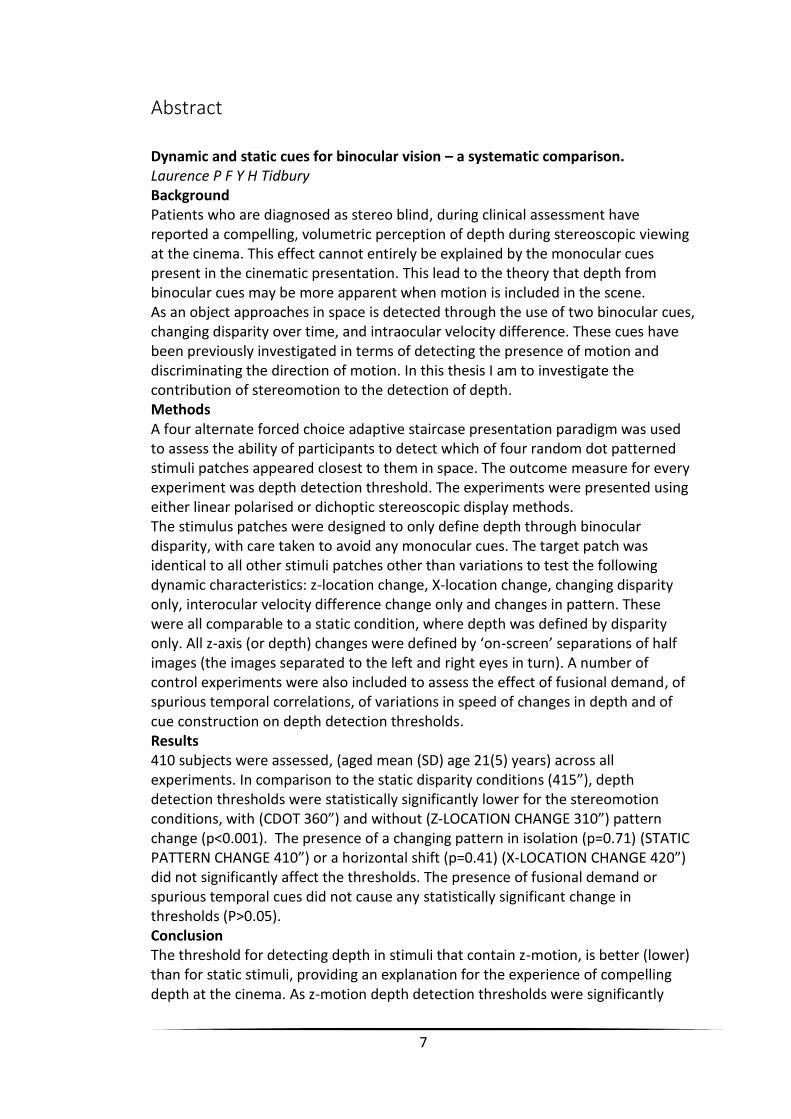
Dynamic and static cues for binocular vision – a systematic comparison. Laurence P F Y H Tidbury Background Patients who are diagnosed as stereo blind, during clinical assessment have reported a compelling, volumetric perception of depth during stereoscopic viewing at the cinema. This effect cannot entirely be explained by the monocular cues present in the cinematic presentation. This lead to the theory that depth from binocular cues may be more apparent when motion is included in the scene. As an object approaches in space is detected through the use of two binocular cues, changing disparity over time, and intraocular velocity difference. These cues have been previously investigated in terms of detecting the presence of motion and discriminating the direction of motion. In this thesis I am to investigate the contribution of stereomotion to the detection of depth. Methods A four alternate forced choice adaptive staircase presentation paradigm was used to assess the ability of participants to detect which of four random dot patterned stimuli patches appeared closest to them in space. The outcome measure for every experiment was depth detection threshold. The experiments were presented using either linear polarised or dichoptic stereoscopic display methods. The stimulus patches were designed to only define depth through binocular disparity, with care taken to avoid any monocular cues. The target patch was identical to all other stimuli patches other than variations to test the following dynamic characteristics: z-location change, X-location change, changing disparity only, interocular velocity difference change only and changes in pattern. These were all comparable to a static condition, where depth was defined by disparity only. All z-axis (or depth) changes were defined by ‘on-screen’ separations of half images (the images separated to the left and right eyes in turn). A number of control experiments were also included to assess the effect of fusional demand, of spurious temporal correlations, of variations in speed of changes in depth and of cue construction on depth detection thresholds. Results 410 subjects were assessed, (aged mean (SD) age 21(5) years) across all experiments. In comparison to the static disparity conditions (415”), depth detection thresholds were statistically significantly lower for the stereomotion conditions, with (CDOT 360”) and without (Z-LOCATION CHANGE 310”) pattern change (p<0.001). The presence of a changing pattern in isolation (p=0.71) (STATIC PATTERN CHANGE 410”) or a horizontal shift (p=0.41) (X-LOCATION CHANGE 420”) did not significantly affect the thresholds. The presence of fusional demand or spurious temporal cues did not cause any statistically significant change in thresholds (P>0.05). Conclusion The threshold for detecting depth in stimuli that contain z-motion, is better (lower) than for static stimuli, providing an explanation for the experience of compelling depth at the cinema. As z-motion depth detection thresholds were significantly
8
lower than static thresholds, this suggests motion provides an advantage to extracting depth, above serial static disparity detection alone. The assessment of stereoacuity should include the measurement of depth detection thresholds using changing depth stimuli, in order to fully investigate binocular potential.

9
Acknowledgements
Thanks and appreciation first of all to my supervisors Sophie and Anna, who have
not only guided me through the PhD process, but have encouraged and mentored
me in both research, career and academic life.
I express my gratitude to the Economic and Social Research Council [ES/J500094/1]
for their sponsorship, and Kevin for the discussions that helped shape my
understanding.
Thank you to my friends, and fellow PhD students especially Rob, who shared in the
screams, manic laughter, despair and the awe & agony of the doctoral life. Thanks
also to those friends who offered welcome distractions, adventures playing in the
mud, and escapes to outer space.
Most importantly, thanks to my family for their love and encouragement, for all the
opportunities I was given growing up that helped shape my life and got me to
where I am today.
Above all thanks to my wife Nicola, for always being there for me, providing
constant support, love and encouragement.
Lastly, thanks to Elisabeth for helping me to extend the write up process and enjoy
being a student for another year.
10
Abbreviations
‘ Minute of arc
“ Second of arc
2D Two Dimensional
3D Three Dimensional
3DTV Three Dimensional Television
AFC Alternate Forced Choice
CDOT Changing Disparity Over Time
fMRI Functional Magnetic Resonance Imaging
HD High Definition
IOVD InterOcular Velocity Difference
LE Left Eye
MID Motion In Depth
MST Medial Superior Temporal
MT Middle Temporal
PC Personal Computer
Randot Random Dot (occasionally referring to the
preschool Randot stereoacuity test)
RE Right Eye
SD Standard Deviation
VA Visual Acuity
VDU Visual display unit
11
Chapter One - Introduction
Motion in depth
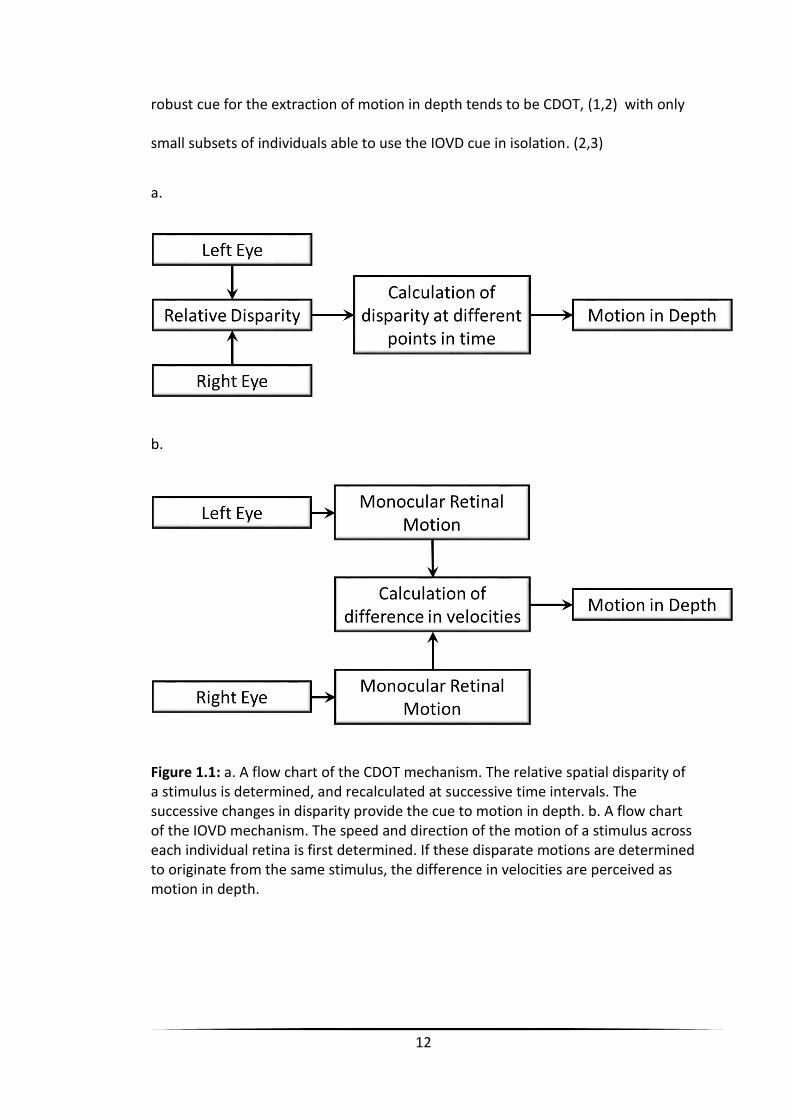
There are two mechanisms that result in the perception of binocular motion in
depth. These are Changing Disparity Over Time (CDOT) and Interocular Velocity
Differences (IOVD). These are outlined in figure 1.1. The mechanism that detects
changes in the amount of disparity over time (CDOT), relies on the interpretation of
changes in the separation between any spatially corresponding points in the right
and left eye. A CDOT stimulus is perceived as movement through depth (z-motion,
i.e. motion towards or away from the observer) through the recalculation of
disparity and recognition of a change in disparity over time, providing information
on changing depth. The second putative mechanism extracts the interocular
velocity difference (IOVD) between the two eyes. The IOVD mechanism does not
require spatially matching points between the two retinas; rather it utilises motion
of individual points across each retina separately, and the difference in velocity
between the two eyes is used to infer depth (Figure 1.3). For example, an object
which moves straight towards an observer will result in rightward retinal motion in
the right eye and in leftward motion in the left eye. Comparing these two velocities
is informative about the change in depth of the object.
While there is evidence for two distinct mechanisms processing these cues (CDOT
and IOVD), (1-7) under natural viewing conditions these two cues are unlikely to
occur in isolation and performance is better when both cues are present. The more
12
robust cue for the extraction of motion in depth tends to be CDOT, (1,2) with only
small subsets of individuals able to use the IOVD cue in isolation. (2,3)
a.
b.
Figure 1.1: a. A flow chart of the CDOT mechanism. The relative spatial disparity of a stimulus is determined, and recalculated at successive time intervals. The successive changes in disparity provide the cue to motion in depth. b. A flow chart of the IOVD mechanism. The speed and direction of the motion of a stimulus across each individual retina is first determined. If these disparate motions are determined to originate from the same stimulus, the difference in velocities are perceived as motion in depth.
13
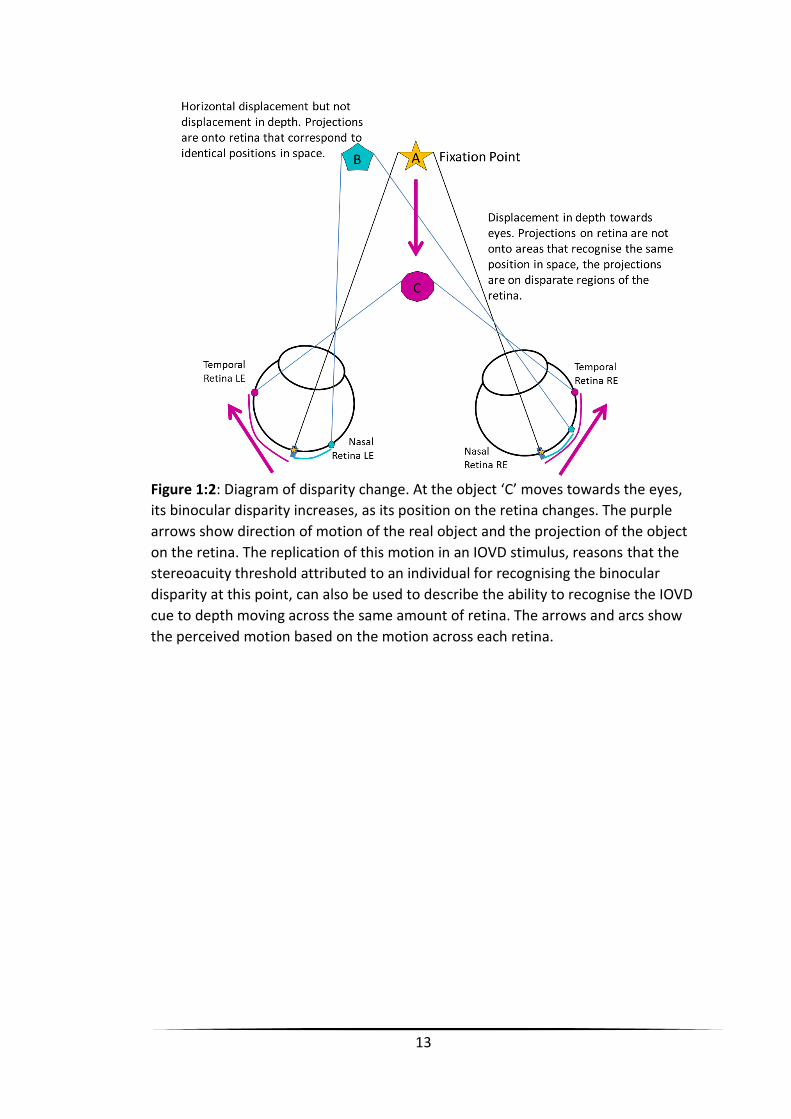
Figure 1:2: Diagram of disparity change. At the object ‘C’ moves towards the eyes,
its binocular disparity increases, as its position on the retina changes. The purple
arrows show direction of motion of the real object and the projection of the object
on the retina. The replication of this motion in an IOVD stimulus, reasons that the
stereoacuity threshold attributed to an individual for recognising the binocular
disparity at this point, can also be used to describe the ability to recognise the IOVD
cue to depth moving across the same amount of retina. The arrows and arcs show
the perceived motion based on the motion across each retina.
14
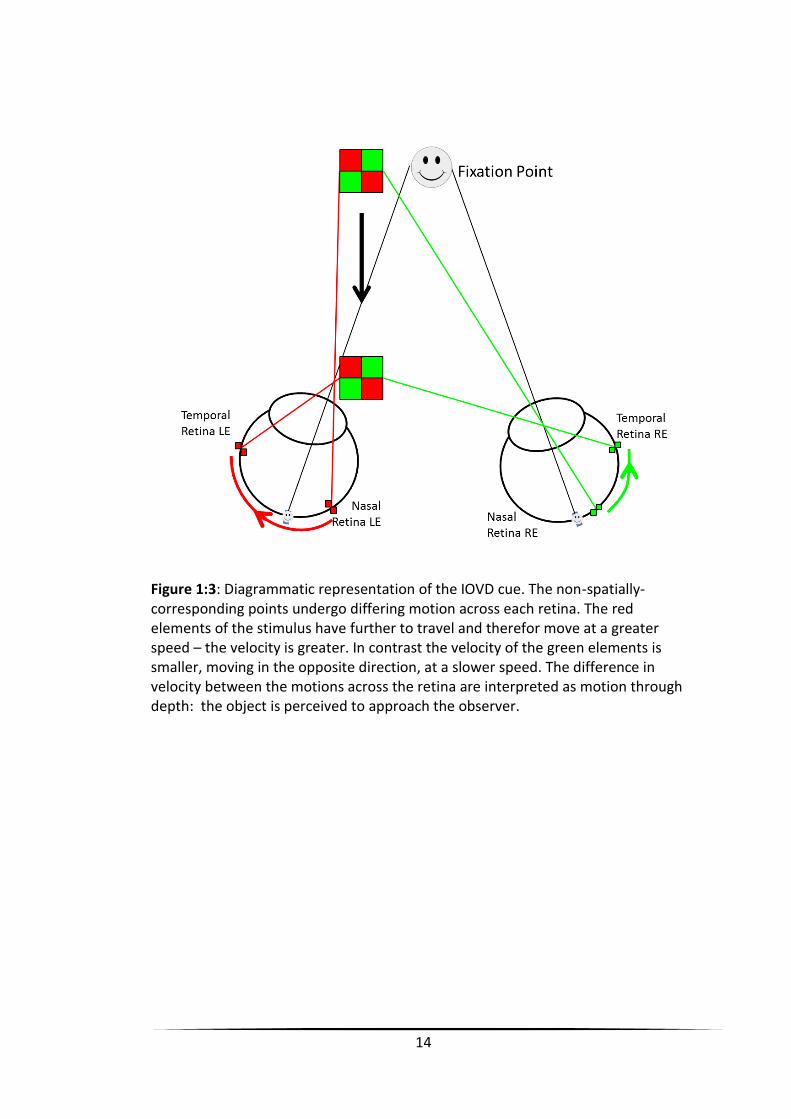
Figure 1:3: Diagrammatic representation of the IOVD cue. The non-spatially-corresponding points undergo differing motion across each retina. The red elements of the stimulus have further to travel and therefor move at a greater speed – the velocity is greater. In contrast the velocity of the green elements is smaller, moving in the opposite direction, at a slower speed. The difference in velocity between the motions across the retina are interpreted as motion through depth: the object is perceived to approach the observer.
15
The detection of depth, with changing depth
There are surprisingly few studies that have directly considered the detection of
depth in moving stimuli, as the majority of studies consider the perception of
direction of motion in depth. Individuals tend to perceive a greater amount of
depth in stimuli that move through depth. When asked to match the amount of
depth apparent in an approaching stimuli to a static target in depth (communicated
by changes in disparity/interocular velocity differences), participants consistently
matched lower amounts of disparity in the stereomotion stimuli, to stimuli with
static disparity. That was a statistically significant trend to reporting a depth match
before the approaching target contained as much disparity as the static target. In
other words, observers perceived the changing depth stimuli as closer than would
be predicted by the magnitude of image disparity. (8)
An early experiment demonstrated that targets which are difficult to locate can be
found more quickly and with fewer errors and misses in the presence of
stereomotion, than with comparable fixed/static disparity presentations. (9) The
capturing and display of the stereoscopic content was a complex procedure, using a
film camera and projectors, and motors oscillating the capture camera. The
outcome of the capture procedure resulted in a right and left half image, that were
180o out of phase. When displayed to each eye individually using polarising filters,
the percept was of targets moving toward the observer. The time taken for the
participants to identify a number of targets was assessed with a fixed amount of
disparity (no motion) and with induced stereoscopic motion and showed that the
16
time taken to identify stereoscopic targets is significantly lower when the targets
undergo stereoscopic motion.
A slightly more recent study measured the time taken for participants to determine
the closest of four binocular targets with various relative disparities, as they moved
on a track through depth towards the participant. (10) The time taken to identify
the closest target did not correlate significantly with static stereoacuity scores as
measured with either the TNO or Titmus tests. It does appear that levels of
performance with moving and stationary targets are unrelated based on these
findings, however the differences between stimuli and procedure for the two tasks
may compromise the interpretation of results. The stimuli in the experiment were a
four-alternate design, but the task was always to determine the difference between
the four targets. This relative disparity would never change as the difference was
fixed by construction.
The TNO or Titmus fly tests are very different to the ‘real’ contour stimuli used on
the experimental apparatus box (similar to the Frisby Davis 2 stereotest, with one
shape closer than the others), which approached the subjects on a rail. There is no
detail regarding fixation instructions, and so it is likely that the subject would have
tried to pursue the target binocularly, probably making substantial vergence errors.
(4) It's likely that for a presentation of several seconds, a number of corrective
vergence saccades would have been made. This would result in absolute disparities
presented during the experiment being very variable, presenting large disparities,
and not the fine 2 arc second disparity the authors claim.
17
Stereoacuity and Motion in Depth
Stereoacuity is traditionally considered as the threshold measure of how well an
individual can interpret binocular disparity as perceived depth, by determining the
spatial correlation of points projected onto the retina. Zero disparity is when the
image is at the fixation point and projects onto corresponding points of each retina,
either on both fovea or on corresponding points of the temporal and nasal retina in
the alternate eye.
As a real object moves towards or away from an individual, a number of factors
change, including a number of monocular cues, and two binocular cues to depth.
Any point forward of where the eyes are fixated provides crossed disparity, that is,
these points are projected on the temporal retina of both eyes. This is binocular
disparity, as the corresponding point to the temporal retina of one eye, is the nasal
point of the other eye (figure 1.2 shape “c”).
As the amount of disparity of an object moving through depth changes, the image
of the object moves across the retina over a period of time (the time of the objects
movement) (figure 1.2). Within this motion across the retina, two cues to depth are
inherent. Firstly, there is a change in the amount of disparity between each eyes
retina (changing disparity over time (CDOT)) and second, a synergistic movement of
the image across the retinae in opposite directions or differing speeds (interocular
velocity difference (IOVD)). In order to isolate the CDOT cue, motion of the points
across the retina over time must be removed, and to isolate the IOVD cue any
spatial correlation must be removed (separate points of square in figure 1.3).
18
To present the changing disparity over time cue, each time a new disparity is
presented, a new set of spatial correlations must be presented. To present an
interocular velocity difference cue, no spatial correlations should be present at any
time, only the motion across the retina.
To portray a depth of 300” (seconds of arc) the disparity of the retinal projections
differ by 300”. If the object started at zero disparity and moved through depth to
300”, the object moves across an amount of retina equivalent to a disparity of 300”
– which if detected, would represent an stereoacuity threshold of at least 300”.
Because of this, even though no spatial correlations exist, the elements of an IOVD
stimulus can be considered as having 300” of disparity as they have moved across
300” of retina, and therefore represent a stereoacuity threshold of at least 300”.
19
The detection of motion vs the detection of depth
The purpose of this thesis is to examine the detection of depth in the presence of
motion, however, interest in stereomotion detection has been frequently
considered in the field.
Sensitivity to stereomotion (the ability to determine the approaching target) has
been demonstrated in the absence of measurable static stereopsis in a 46
strabismic patients, with improvements also found following corrective surgery.
(11) Fukikado et al. demonstrated that 39/52 subjects were able to locate a pattern
moving in depth, while only 28 could experience stereoscopic depth of the fly on
the Titmus test. (12) Watanabe et al. determined detection thresholds for
stereomotion in 52 strabismic subjects and found that six were able to detect
stereomotion at thresholds of less than 1200”, despite being unable to detect
depth in stimuli with 1200” of static disparity on the Titmus test. Conversely four
out of the 17 who could demonstrate static stereoacuity of 500” or better were not
able to detect the stereomotion stimulus. (13) Of 31 esotropic patients, Maeda et
al. found that a total of 18 with no measurable static stereoacuity, as per the
Titmus fly test, were able to recognise binocular depth from motion. (14) Hess et al.
demonstrated residual stereoscopic function for stereomotion stimuli in two out of
15 strabismic amblyopic subjects who could not demonstrate static stereoacuity.
(15) They further investigated a subsample of four stereomotion blind subjects by
placing a neutral density filter in front of their fixing eye, to balance mean-
luminance to the amblyopic eye. This enhanced the detection of stereomotion
20
above the chance level previously demonstrated; suggesting consideration should
be paid to any visual acuity difference in subjects used for stereoscopic research.
All of these studies demonstrate the potential of subjects with no measurable static
stereoacuity to provide a response based on binocular processing when the stimuli
contain stereomotion. There are a number of barriers however in previous
investigation that does not allow us to be confident that depth detection from
stereomotion is superior to static depth detection.
The enhanced perception of depth reported by clinically diagnosed stereoblind
subjects, could be attributed to peripheral cues, indeed, further to Kitoji and
Toyama’s findings in the peripheral visual field, findings in the central visual field
show that while 40% of subjects could detect static depth, only 24% were able to
detect depth from stereomotion. (16)
Scotomas of stereoblindness to motion in depth vs static depth
When considering the literature on the ability to detect a change in direction of
motion, several studies have shown examples of stereomotion scotoma where
intact static depth perception is present. This has been demonstrated to coincide in
specific areas of a single subject's visual field, though normal performance may be
possible in other areas. This 'area' can be either a location in a frontoparallel plane
or a range of disparities. (4,17-19) Cases of intact stereomotion perception in areas
where subjects are unable to detect differences in static depth have also been
presented in the peripheral visual field of strabismic subjects. (11,16) This may
21
account for the enhanced perception of depth experienced by some when viewing
3D entertainment media.
Aim and Summary of experiments
The overall aim of the thesis was to determine if stereomotion allows the detection
of depth at a smaller disparity than static presentations of binocular disparity. The
recent literature has mostly been concerned with the discrimination of direction of,
speed variation in, and the trajectory of motion in depth. This study uses modern
psychophysical methods to compare static and dynamic binocular cues to depth, to
investigate the advantage of stereomotion to the task of discriminating depth. The
stimuli were carefully controlled to ensure that the any advantage were due to
binocular, rather than monocular detection of motion.
Chapter three and four concern a systematic investigation of static and dynamic
stereoscopic stimuli (experiments 1 (blocked design) and 2 (interleaved design) to
determine whether dynamic cues are superior to static cues for depth detection.
Chapter six contains a series of control experiments, and looks at the contribution
of spurious IOVD cues in the stimulus (exp. 3a), the effect of the varying
proportions of CDOT and IOVD cue in the stimulus (exp. 3b) and the effect of
varying the rate of change of disparity on depth detection thresholds (exp. 3c).
Chapter five investigates the effect of vergence demand on depth detection
thresholds in both static and stereomotion stimuli (exp. 4).
22
Chapter Two - General Methods
The general approach taken for each experiment is described in this chapter,
however, some details differ amongst chapters and so the differences are described
again in each.
Ethical Approval
Ethical approval was gained from the University of Liverpool Ethics Sub-committee
to cover all experiment in this thesis (see Appendix I for approval confirmation). The
study was performed in accordance with the ethical standards laid down in the
Declaration of Helsinki. Participants were recruited from the staff and student
population of the University of Liverpool, via advertisement for volunteers to
participate in a 3D vision study, through personal contacts and via the electronic
participant recruitment system in the school of psychology. Prior to participation,
informed consent was gained from each of the subjects.
Screening
Inclusion criteria were broad for all experiments with the only requirement
appearing on advertising: ‘Vision of driving standard in at least one eye’. This broad
criteria was designed to allow the recruitment and assessment of an incident
population reflective of the ‘normal’ population. Combined with the non-specific
instruction to ‘select the target that appears closest to you’, it was hoped to
provide a broad indication of whether smaller amounts of depth are detectable in
dynamic, over static presentations, in the population. Visual acuity was measured
23
using the Early Treatment Diabetic Retinopath Study (ETDRS) LogMAR chart
(Precision VisionTM; La Salle, IL,USA).
Subjects were further assessed upon recruitment (any excluded in chapter 5 if no
simultaneous perception was present) to confirm the presence of any grade of
binocular single vision. Although not a requirement of participation, all recruited
subjects had demonstrable stereopsis of at least 800” on standard clinical testing
using the Titmus stereotest circles (Stereo-Optical; Chicago, IL, USA) or Frisby
stereotest. This is mentioned to highlight that some subjects were unable to
perform the psychometric task reliably, rather than not being able to detect
binocular disparity.
There was a second stage of ‘exclusion’ based on unreliable results. As explained
above, some subjects were unable to contribute meaningful results. If this were the
case for all conditions in an experiment, these subjects were deleted in a listwise
basis. This was determined by the goodness of fit as explained later in this chapter.
Subjects
Across all experiments, a total of 410 subjects were assessed with over 380 of these
representing unique subjects. The ratio of female to male participants was
approximately 3:1 with ages between 18 and 56 years, mean(SD) age 21(5) years.
Though a small number of participants (~5) were experienced in psychophysical
experiments the majority were naïve to psychophysics.
The subject pool was recruited from the staff and students and Nuffield summer
students of the University of Liverpool through printed advertising, electronic

24
announcements and email calls. No financial inducement was offered for any
experiment. All subjects provided informed consent prior to participation, having
received the information sheet upon initial contact.
25
Apparatus
Display Types
A number of stereoscopic presentation options were explored to determine the
display of choice for this course of study, with the final decision largely based on
cost implications.
The ideal display for stereoscopic research is one where the pixels of the display for
the right eye, and the pixels for the left eye are presented in the same spatial
location at exactly the same time. The pixels must also be as small as possible to
limit the size of changes of disparity, in order to accurately detect a change.
There are four main methods of delivering stereoscopic content currently in use:
The first is a Wheatstone stereoscope, where two displays are positioned and
reflected using a pair of mirrors to each eye. The alignment of this system can be
difficult, especially as due to its close proximity to the observer, interpolation is
used to decrease the size of disparity jumps, which makes maintaining perfect pixel
alignment vital. The second method requires similar alignment precision, using a
pair of projectors incorporating polarising filters to separate the image. This
method requires the participant to wear polarising glasses to view the stereoscopic
effect. A similar system (a cross between polarised projectors and the Wheatstone
stereoscope), with built in stable alignment is the Planar system (appendix II),
26
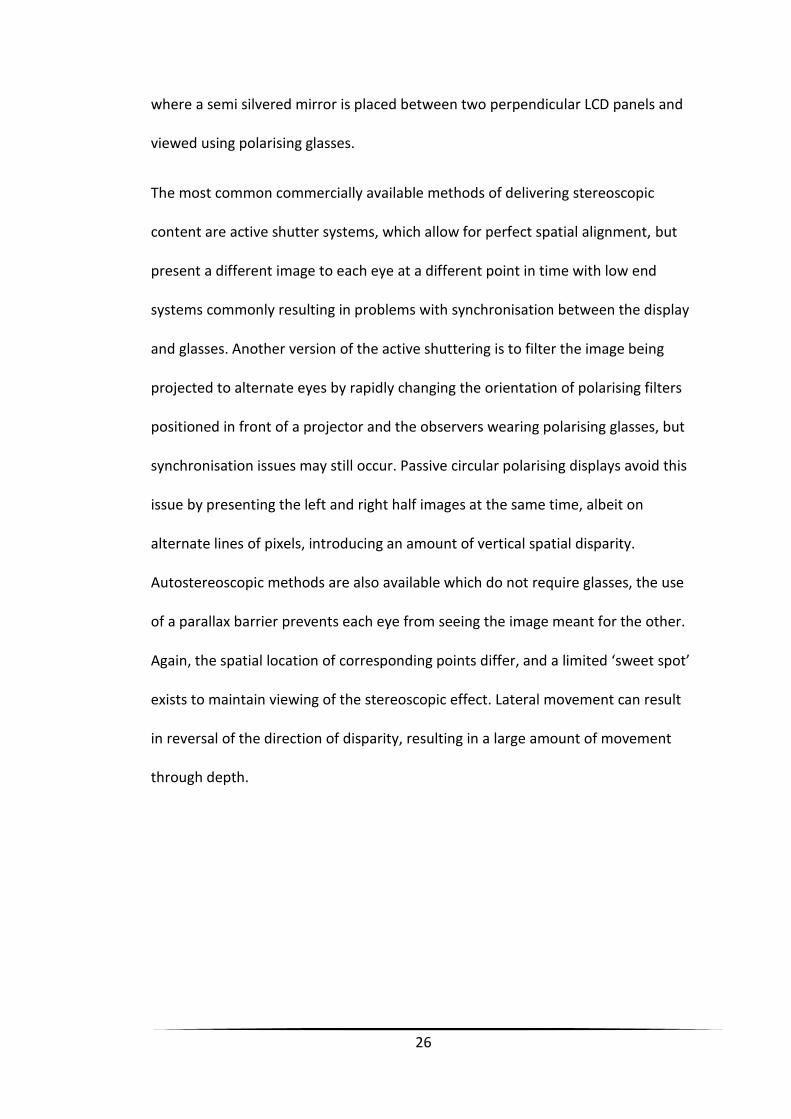
where a semi silvered mirror is placed between two perpendicular LCD panels and
viewed using polarising glasses.
The most common commercially available methods of delivering stereoscopic
content are active shutter systems, which allow for perfect spatial alignment, but
present a different image to each eye at a different point in time with low end
systems commonly resulting in problems with synchronisation between the display
and glasses. Another version of the active shuttering is to filter the image being
projected to alternate eyes by rapidly changing the orientation of polarising filters
positioned in front of a projector and the observers wearing polarising glasses, but
synchronisation issues may still occur. Passive circular polarising displays avoid this
issue by presenting the left and right half images at the same time, albeit on
alternate lines of pixels, introducing an amount of vertical spatial disparity.
Autostereoscopic methods are also available which do not require glasses, the use
of a parallax barrier prevents each eye from seeing the image meant for the other.
Again, the spatial location of corresponding points differ, and a limited ‘sweet spot’
exists to maintain viewing of the stereoscopic effect. Lateral movement can result
in reversal of the direction of disparity, resulting in a large amount of movement
through depth.
27
Display I - LG
VDU Type
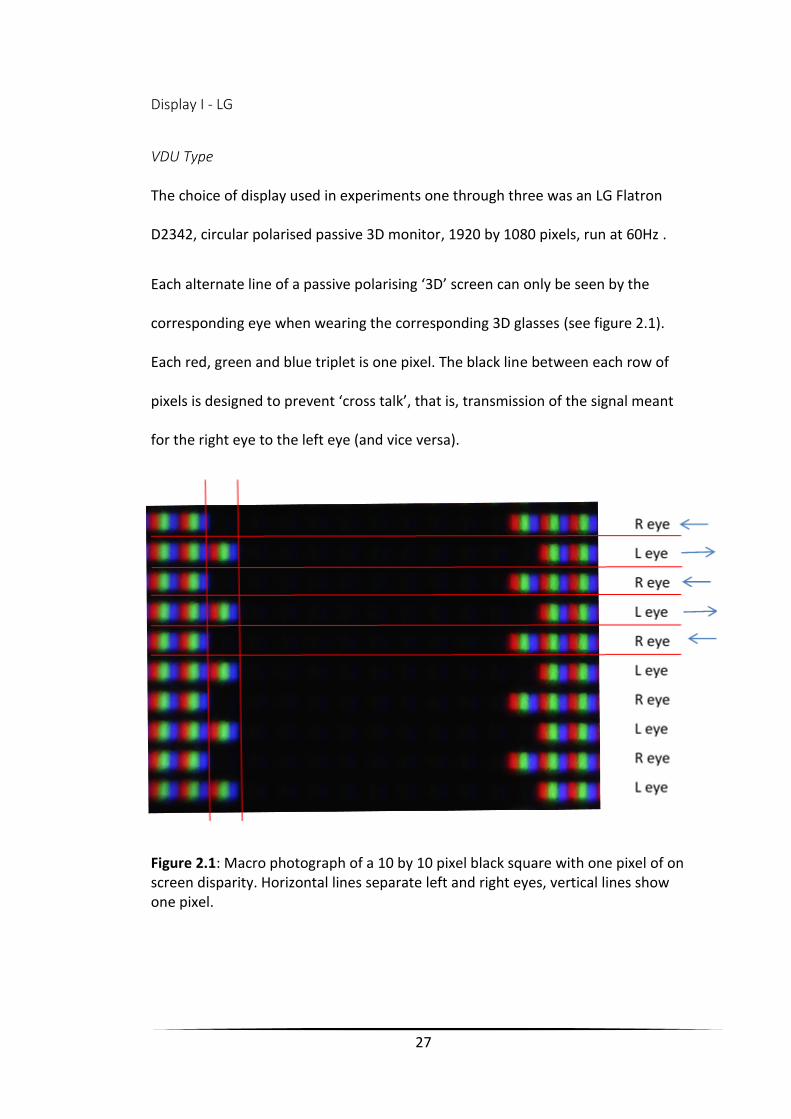
The choice of display used in experiments one through three was an LG Flatron
D2342, circular polarised passive 3D monitor, 1920 by 1080 pixels, run at 60Hz .
Each alternate line of a passive polarising ‘3D’ screen can only be seen by the
corresponding eye when wearing the corresponding 3D glasses (see figure 2.1).
Each red, green and blue triplet is one pixel. The black line between each row of
pixels is designed to prevent ‘cross talk’, that is, transmission of the signal meant
for the right eye to the left eye (and vice versa).
Figure 2.1: Macro photograph of a 10 by 10 pixel black square with one pixel of on screen disparity. Horizontal lines separate left and right eyes, vertical lines show one pixel.

28
Disparity Calculation
Due to the positioning of human eyes, typically 60mm apart, a slightly different
view of the world falls on each retina. Assuming correct ocular alignment, any point
forward of the point of fixation produces ‘crossed disparity’ and anything beyond it
produces ‘uncrossed disparity’. In crossed disparity the points fall on the temporal
retina of the either eye.
Figure 2.2 shows an amount of crossed disparity, by artificially adjusting where the
objects image falls on the retina. The fixation point must be the screen plane
(backed up by a fixation target), otherwise the image will be blurred. Therefore the
image of the black square falls temporal to the fixation point on each retina.
To work out the amount of disparity produced by a shift of the image on screen we
need to know two things:
1. The viewing distance (‘a’)
This was maintained throughout the experiments by aligning the monitor
with a mark on the floor, and through the use of a chin rest fixed to a table.
2. The size of the separation on screen (‘o’)
Tan(α) = Opposite (‘o’) over Adjacent (‘a’)
29
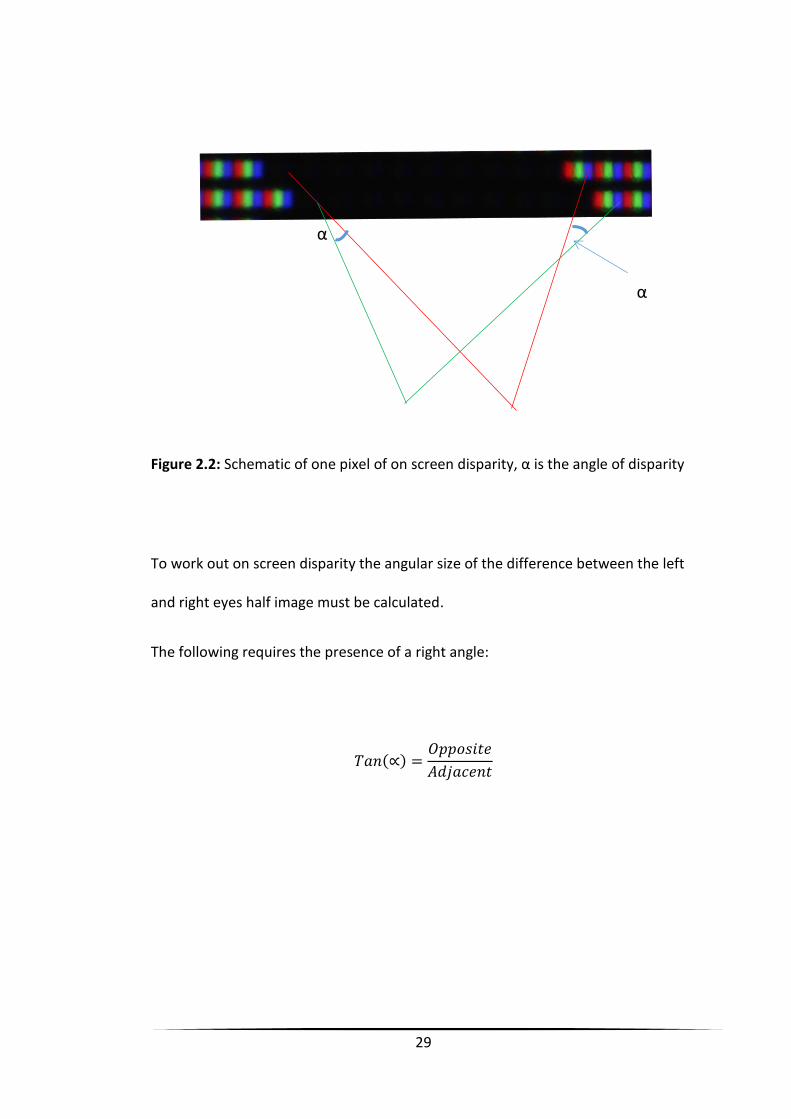
Figure 2.2: Schematic of one pixel of on screen disparity, α is the angle of disparity
To work out on screen disparity the angular size of the difference between the left
and right eyes half image must be calculated.
The following requires the presence of a right angle:
𝑇𝑎𝑛(∝) =𝑂𝑝𝑝𝑜𝑠𝑖𝑡𝑒
𝐴𝑑𝑗𝑎𝑐𝑒𝑛𝑡
α
α
30
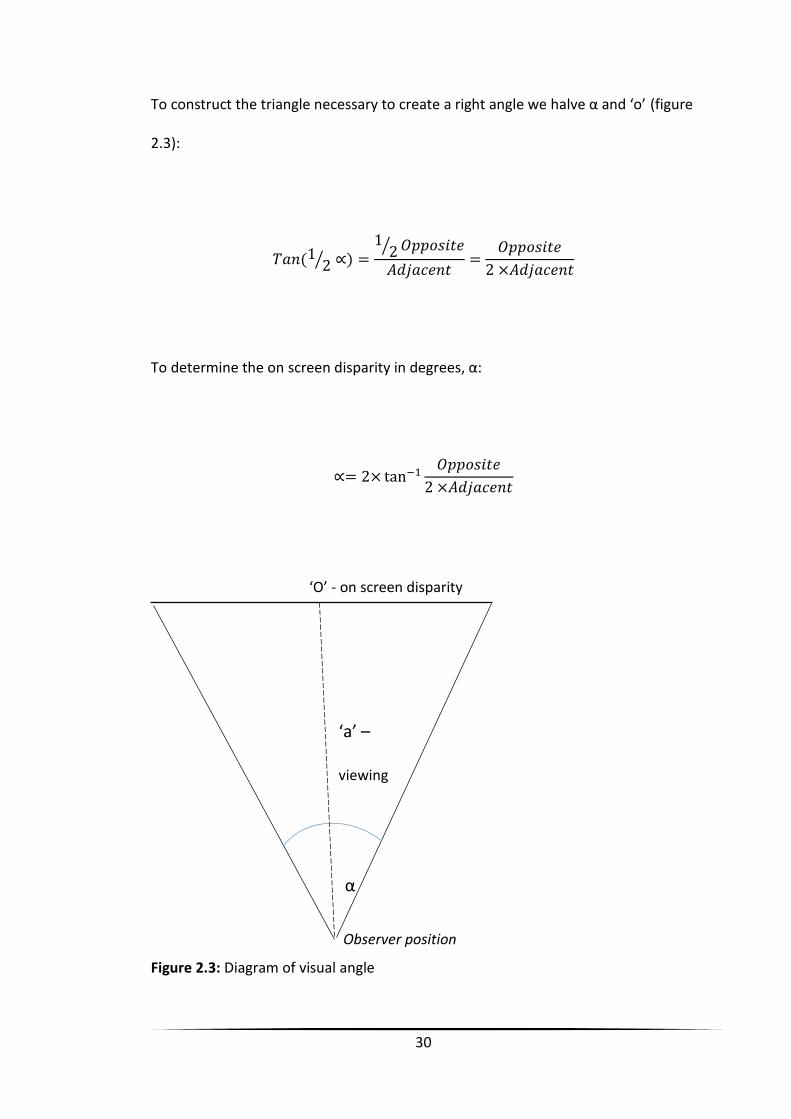
To construct the triangle necessary to create a right angle we halve α and ‘o’ (figure
2.3):
𝑇𝑎𝑛(12⁄ ∝) =
12⁄ 𝑂𝑝𝑝𝑜𝑠𝑖𝑡𝑒
𝐴𝑑𝑗𝑎𝑐𝑒𝑛𝑡=
𝑂𝑝𝑝𝑜𝑠𝑖𝑡𝑒
2 ×𝐴𝑑𝑗𝑎𝑐𝑒𝑛𝑡
To determine the on screen disparity in degrees, α:
∝= 2× tan−1𝑂𝑝𝑝𝑜𝑠𝑖𝑡𝑒
2 ×𝐴𝑑𝑗𝑎𝑐𝑒𝑛𝑡
Figure 2.3: Diagram of visual angle
α
‘a’ –
viewing
distance
‘O’ - on screen disparity
Observer position
31
The Flatron D2342 (LG Electronics, Seoul, Korea) has a resolution of 1920 pixels in
width by 1080 high, and has a visible screen width of 0.505263m. The typical
viewing distance used in the experiments is 3m which, for one pixel, gives a
disparity of 0.005o or 18.09”. One arc second is 1/3600th of a degree.
Cross Talk
A further difficulty with single projection/monitor displays such as passive
polarisation and shutter glasses is the potential for cross talk, where the image
meant for the left eye is not extinct from the right eye, resulting in a ghost image in
the right eye.
To determine the amount of cross talk endemic to the display the luminance of a
grey field was measured, to determine if using a high or low brightness setting
would result in more or less cross talk. The contrast between the ‘ghost image’ and
the intended image can provide an indication of how apparent the cross talk may
appear.
A large grey patch (1920x1080 pixels) was programmed to be presented to the right
eye only when viewed through the passive circular polarising glasses. The
background was black and this was presented to the left eye when viewed through
the passive circular polarising glasses.
The luminance measurement function of a Spectrascan PR670 was used to measure
the luminance of the display though each lens of the polarising glasses in turn. The
32
Spectrascan was set up 0.5m from the display on a tripod, with a further stand used
to support the polarising glasses in front of the Spectrascan aperture. Both were
aligned vertically with the centre of the screen.
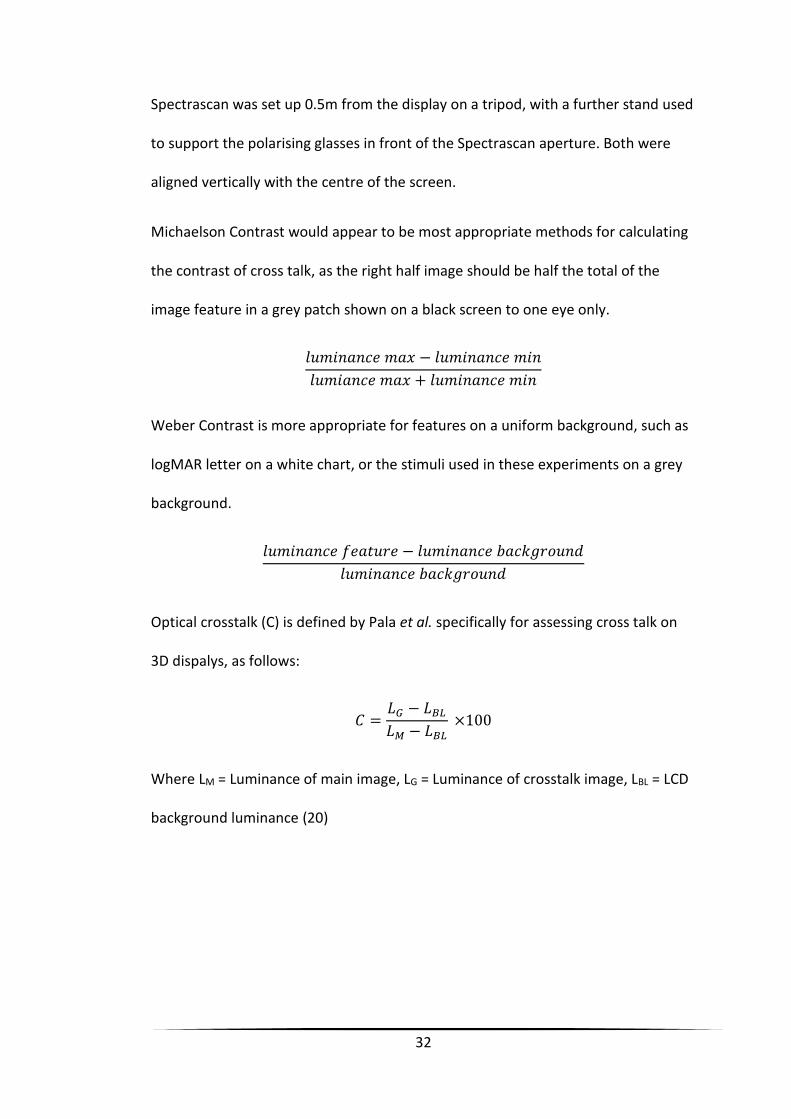
Michaelson Contrast would appear to be most appropriate methods for calculating
the contrast of cross talk, as the right half image should be half the total of the
image feature in a grey patch shown on a black screen to one eye only.
𝑙𝑢𝑚𝑖𝑛𝑎𝑛𝑐𝑒 𝑚𝑎𝑥 − 𝑙𝑢𝑚𝑖𝑛𝑎𝑛𝑐𝑒 𝑚𝑖𝑛
𝑙𝑢𝑚𝑖𝑎𝑛𝑐𝑒 𝑚𝑎𝑥 + 𝑙𝑢𝑚𝑖𝑛𝑎𝑛𝑐𝑒 𝑚𝑖𝑛
Weber Contrast is more appropriate for features on a uniform background, such as
logMAR letter on a white chart, or the stimuli used in these experiments on a grey
background.
𝑙𝑢𝑚𝑖𝑛𝑎𝑛𝑐𝑒 𝑓𝑒𝑎𝑡𝑢𝑟𝑒 − 𝑙𝑢𝑚𝑖𝑛𝑎𝑛𝑐𝑒 𝑏𝑎𝑐𝑘𝑔𝑟𝑜𝑢𝑛𝑑
𝑙𝑢𝑚𝑖𝑛𝑎𝑛𝑐𝑒 𝑏𝑎𝑐𝑘𝑔𝑟𝑜𝑢𝑛𝑑
Optical crosstalk (C) is defined by Pala et al. specifically for assessing cross talk on
3D dispalys, as follows:
𝐶 =𝐿𝐺 − 𝐿𝐵𝐿
𝐿𝑀 − 𝐿𝐵𝐿 ×100
Where LM = Luminance of main image, LG = Luminance of crosstalk image, LBL = LCD
background luminance (20)

33
High Brightness (Screen setting @100) Luminance without glasses Grey: 36.61 cd/m2
Black Level: 0.29 cd/m2 Luminance through right filter: 27.24 cd/m2
Luminance though left filter: 1.51 cd/m2 Michaelson Contrast: 10.50 Weber Contrast: 5.64 C=4.53% Low Brightness (Screen setting @0) Luminance without glasses Grey: 15.38 cd/m2
Black Level: 0.12 cd/m2
Luminance through right filter: 11.56 cd/m2
Luminance though left filter: 0.71 cd/m2 Michaelson Contrast: 11.67 Weber Contrast: 6.14 C=5.16%
The amount of optical crosstalk (C), is counterintuitively lower in the high
brightness setting, confirmed by the contrast ratios. The high brightness setting was
used for all experiments.
34
Display II – Modified Synoptophore
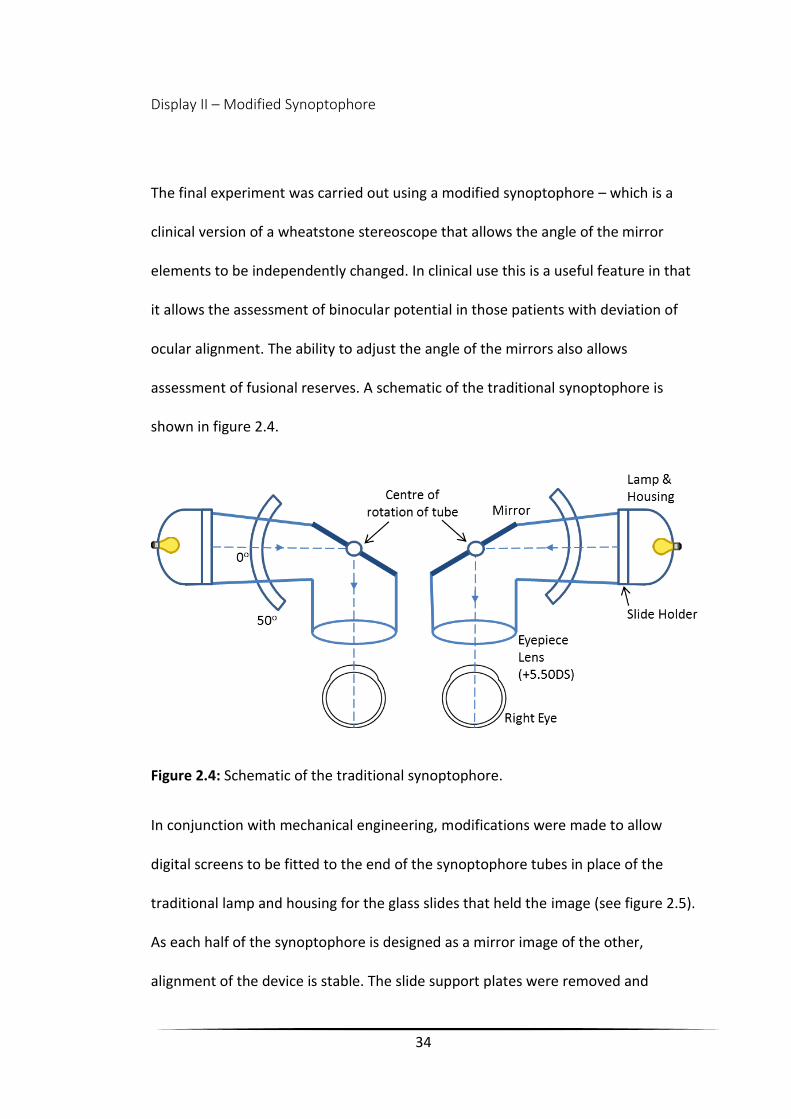
The final experiment was carried out using a modified synoptophore – which is a
clinical version of a wheatstone stereoscope that allows the angle of the mirror
elements to be independently changed. In clinical use this is a useful feature in that
it allows the assessment of binocular potential in those patients with deviation of
ocular alignment. The ability to adjust the angle of the mirrors also allows
assessment of fusional reserves. A schematic of the traditional synoptophore is
shown in figure 2.4.
Figure 2.4: Schematic of the traditional synoptophore.
In conjunction with mechanical engineering, modifications were made to allow
digital screens to be fitted to the end of the synoptophore tubes in place of the
traditional lamp and housing for the glass slides that held the image (see figure 2.5).
As each half of the synoptophore is designed as a mirror image of the other,
alignment of the device is stable. The slide support plates were removed and
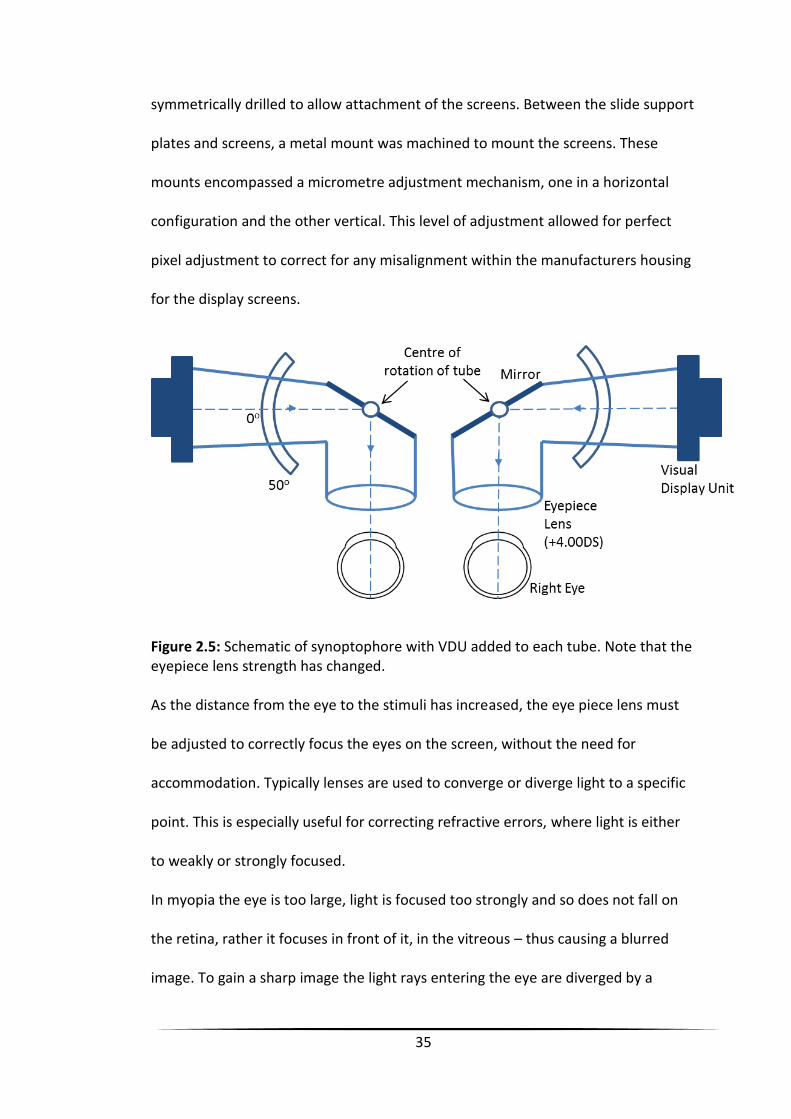
35
symmetrically drilled to allow attachment of the screens. Between the slide support
plates and screens, a metal mount was machined to mount the screens. These
mounts encompassed a micrometre adjustment mechanism, one in a horizontal
configuration and the other vertical. This level of adjustment allowed for perfect
pixel adjustment to correct for any misalignment within the manufacturers housing
for the display screens.
Figure 2.5: Schematic of synoptophore with VDU added to each tube. Note that the eyepiece lens strength has changed. As the distance from the eye to the stimuli has increased, the eye piece lens must
be adjusted to correctly focus the eyes on the screen, without the need for
accommodation. Typically lenses are used to converge or diverge light to a specific
point. This is especially useful for correcting refractive errors, where light is either
to weakly or strongly focused.
In myopia the eye is too large, light is focused too strongly and so does not fall on
the retina, rather it focuses in front of it, in the vitreous – thus causing a blurred
image. To gain a sharp image the light rays entering the eye are diverged by a
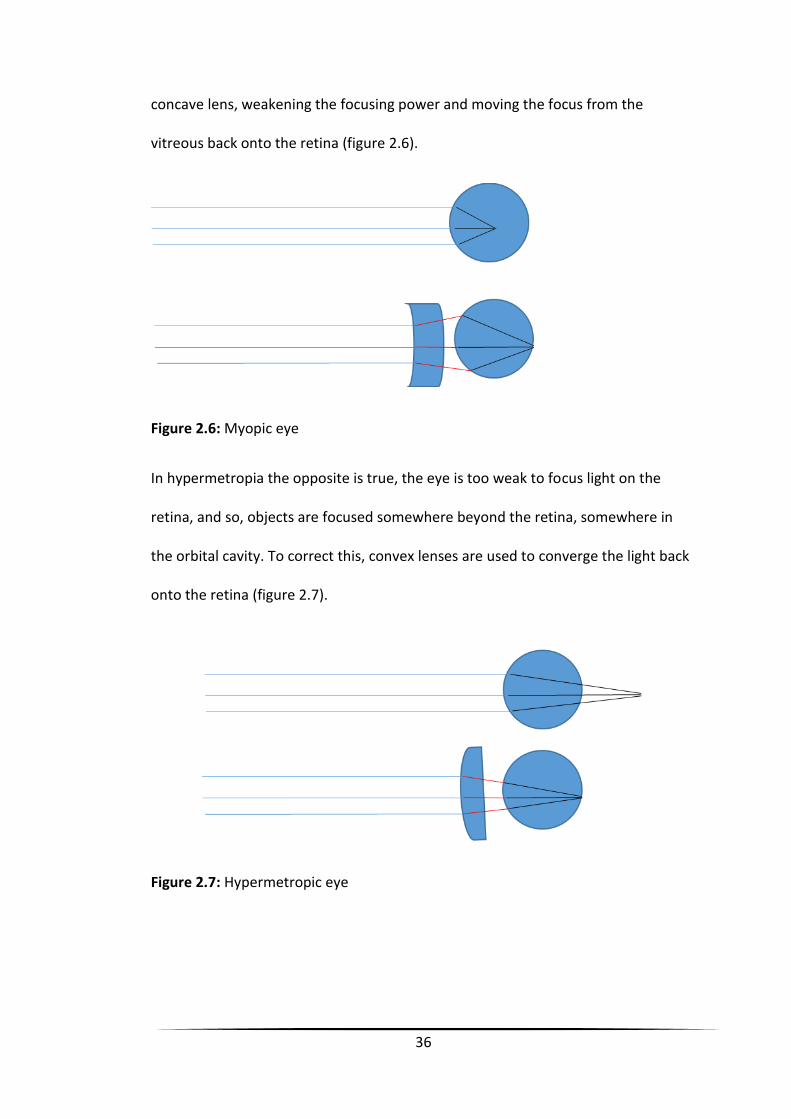
36
concave lens, weakening the focusing power and moving the focus from the
vitreous back onto the retina (figure 2.6).
Figure 2.6: Myopic eye
In hypermetropia the opposite is true, the eye is too weak to focus light on the
retina, and so, objects are focused somewhere beyond the retina, somewhere in
the orbital cavity. To correct this, convex lenses are used to converge the light back
onto the retina (figure 2.7).
Figure 2.7: Hypermetropic eye
37
Because P=1/f. The power of a lens (in dioptres) is the reciprocal of the focal length
(in metres), and the focal length of a lens is the reciprocal of the lens power.
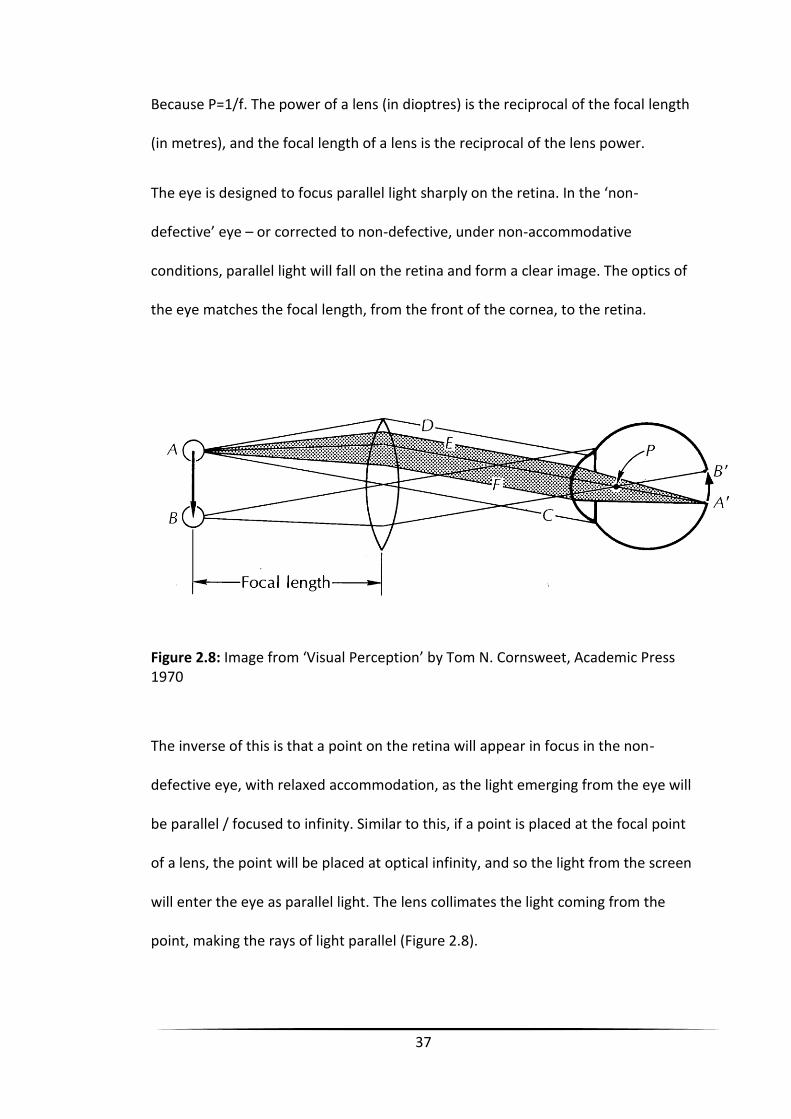
The eye is designed to focus parallel light sharply on the retina. In the ‘non-
defective’ eye – or corrected to non-defective, under non-accommodative
conditions, parallel light will fall on the retina and form a clear image. The optics of
the eye matches the focal length, from the front of the cornea, to the retina.
Figure 2.8: Image from ‘Visual Perception’ by Tom N. Cornsweet, Academic Press 1970
The inverse of this is that a point on the retina will appear in focus in the non-
defective eye, with relaxed accommodation, as the light emerging from the eye will
be parallel / focused to infinity. Similar to this, if a point is placed at the focal point
of a lens, the point will be placed at optical infinity, and so the light from the screen
will enter the eye as parallel light. The lens collimates the light coming from the
point, making the rays of light parallel (Figure 2.8).
38
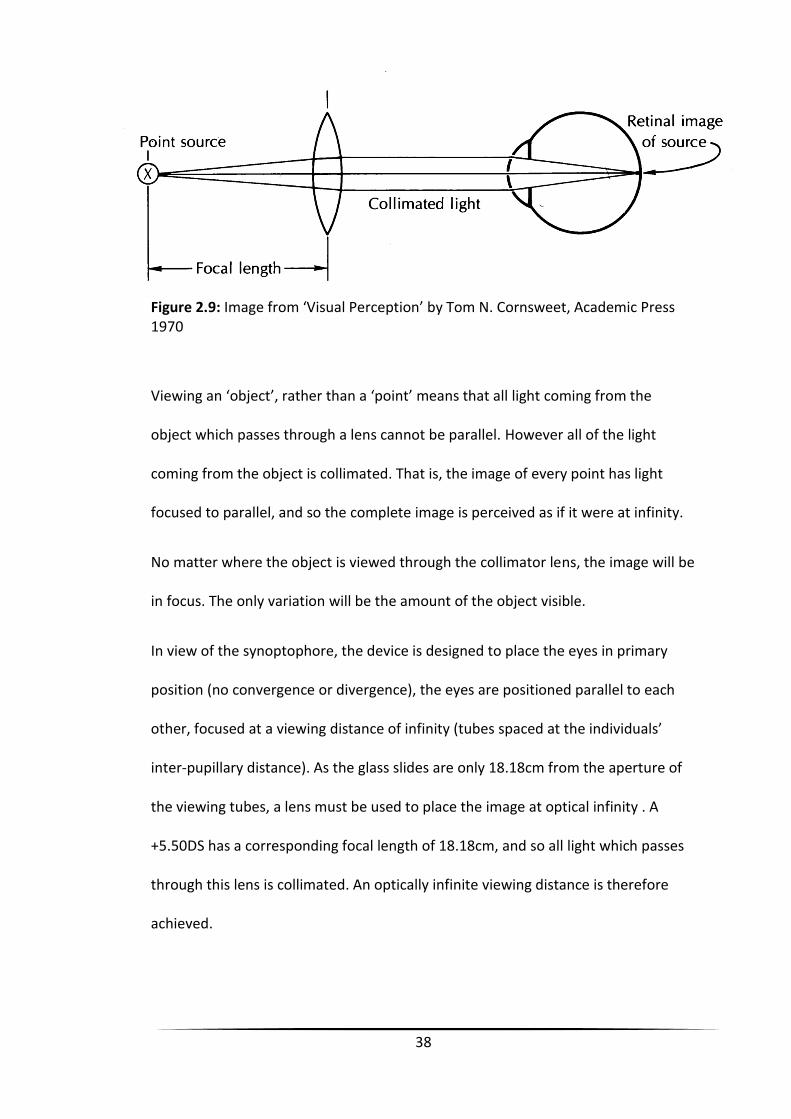
Figure 2.9: Image from ‘Visual Perception’ by Tom N. Cornsweet, Academic Press 1970
Viewing an ‘object’, rather than a ‘point’ means that all light coming from the
object which passes through a lens cannot be parallel. However all of the light
coming from the object is collimated. That is, the image of every point has light
focused to parallel, and so the complete image is perceived as if it were at infinity.
No matter where the object is viewed through the collimator lens, the image will be
in focus. The only variation will be the amount of the object visible.
In view of the synoptophore, the device is designed to place the eyes in primary
position (no convergence or divergence), the eyes are positioned parallel to each
other, focused at a viewing distance of infinity (tubes spaced at the individuals’
inter-pupillary distance). As the glass slides are only 18.18cm from the aperture of
the viewing tubes, a lens must be used to place the image at optical infinity . A
+5.50DS has a corresponding focal length of 18.18cm, and so all light which passes
through this lens is collimated. An optically infinite viewing distance is therefore
achieved.
39
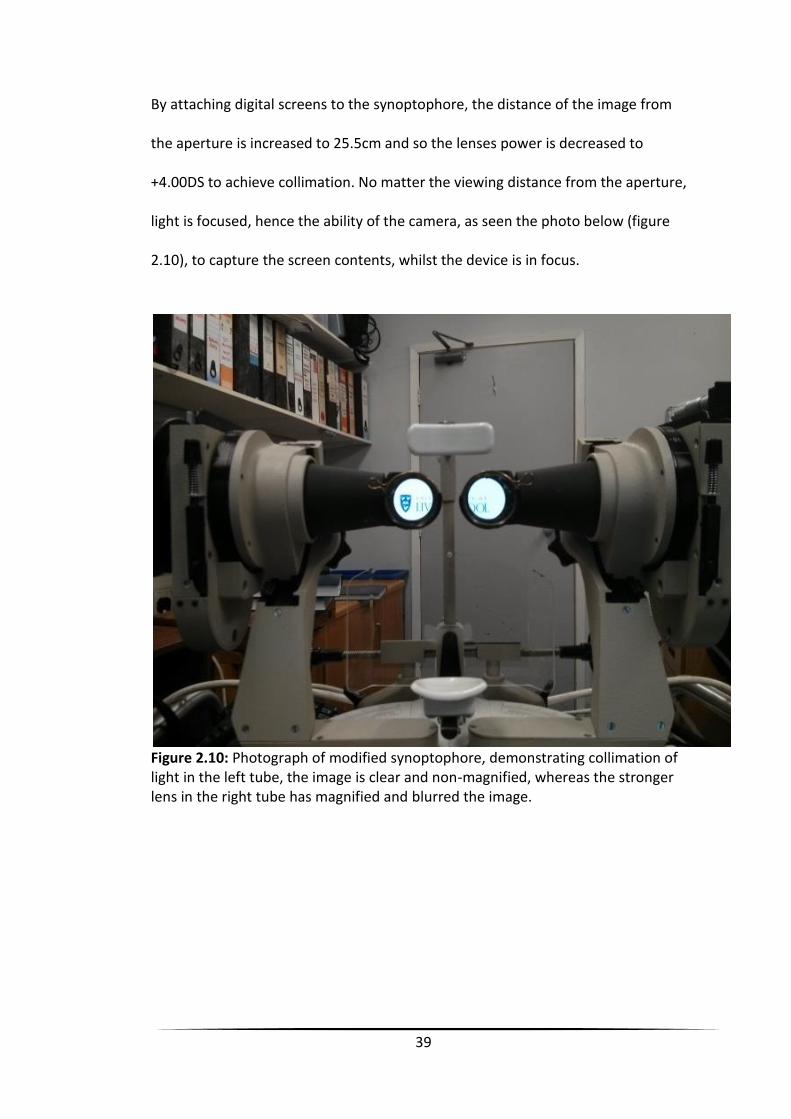
By attaching digital screens to the synoptophore, the distance of the image from
the aperture is increased to 25.5cm and so the lenses power is decreased to
+4.00DS to achieve collimation. No matter the viewing distance from the aperture,
light is focused, hence the ability of the camera, as seen the photo below (figure
2.10), to capture the screen contents, whilst the device is in focus.
Figure 2.10: Photograph of modified synoptophore, demonstrating collimation of light in the left tube, the image is clear and non-magnified, whereas the stronger lens in the right tube has magnified and blurred the image.
40
VDU Type
The choice of digital screens used for the synoptophore were a pair of FreeWorld
56D120175 Camera Field Monitors. These monitors were mounted on a
synoptophore. The resolution of these monitors was 1280 pixels horizontal by 800
pixels vertical run at 60Hz. Disparity is calculated as above, using the screen width
of 0.12065m and a horizontal pixel number of 1280. The viewing distance was
0.225m.
Cross Talk
Zero crosstalk is present when viewing the stimuli on the synoptophore. The left
and right image as displayed on physically separate visual display units with no
common optics. The effect of crosstalk could be established by comparing
thresholds achieved by both display methods.
Development of Stimuli Patches
The stimuli in all experiments were near identical and consisted of a pattern of
black dots presented on a grey background. These stimuli patches were
precomputed using Matlab (Mathworks®).
The script was used to create a nominal ‘square’ grid of ten by ten, with the 25
stimuli dots defining the square, with the background consisting of grey. A total of
60 stimuli patches with randomly distributed dots were produced. The decision to
use random, rather than uniformly randomly distributed dots across the 10 by 10

41
grid was made in an attempt to avoid the patch being clearly defined as a square, to
minimise contamination of the CDOT cue with the IOVD cue, where the implied
edges could provide a temporally correlated edge. The basic script for the
development of the stimuli patches is in Appendix III.
In experiment 3a, the stimuli were further developed to remove any chance of
spurious IOVD signals occurring within the CDOT stimuli (see chapter 6a). In
experiment 6c, where varying proportions of the IOVD and CDOT cue were
presented at the same time, the patches were modified to allow overlapping of the
stimuli patches (by creating a transparent background instead of grey), with
controls to prevent any unwanted CDOT and IOVD cue contamination (see chapter
3c).
42
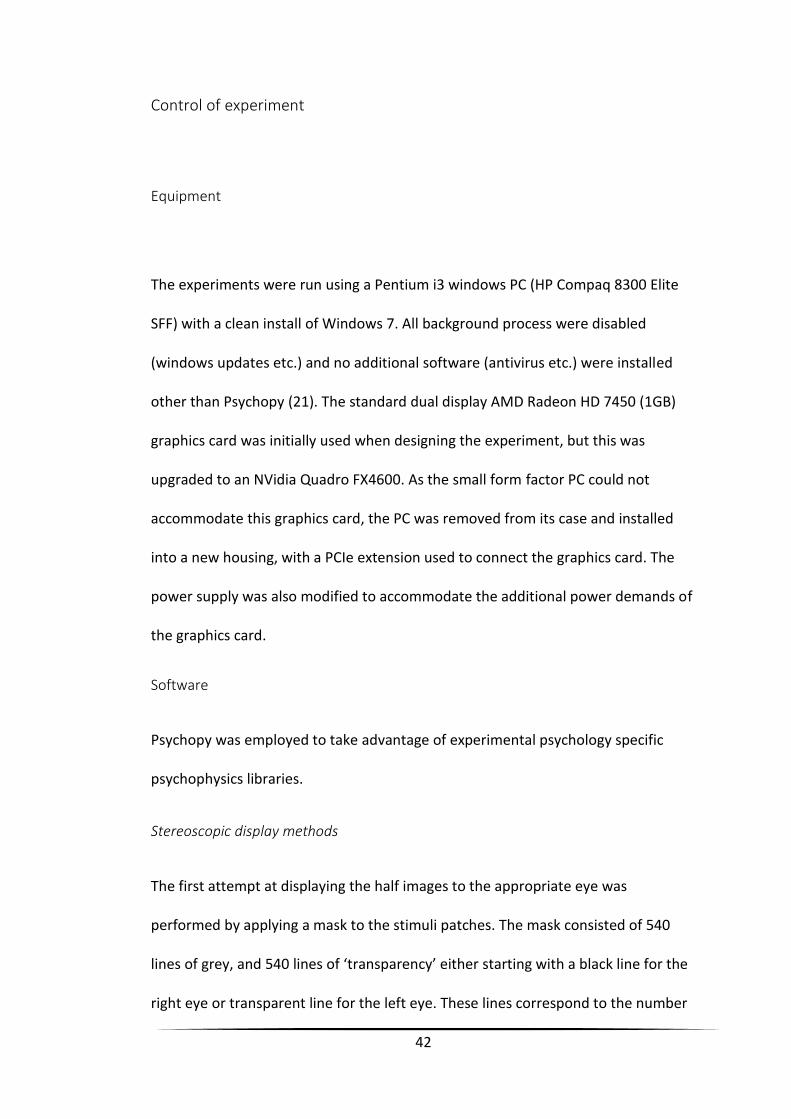
Control of experiment
Equipment
The experiments were run using a Pentium i3 windows PC (HP Compaq 8300 Elite
SFF) with a clean install of Windows 7. All background process were disabled
(windows updates etc.) and no additional software (antivirus etc.) were installed
other than Psychopy (21). The standard dual display AMD Radeon HD 7450 (1GB)
graphics card was initially used when designing the experiment, but this was
upgraded to an NVidia Quadro FX4600. As the small form factor PC could not
accommodate this graphics card, the PC was removed from its case and installed
into a new housing, with a PCIe extension used to connect the graphics card. The
power supply was also modified to accommodate the additional power demands of
the graphics card.
Software
Psychopy was employed to take advantage of experimental psychology specific
psychophysics libraries.
Stereoscopic display methods
The first attempt at displaying the half images to the appropriate eye was
performed by applying a mask to the stimuli patches. The mask consisted of 540
lines of grey, and 540 lines of ‘transparency’ either starting with a black line for the
right eye or transparent line for the left eye. These lines correspond to the number

43
of vertical lines on the HD screen (1080). By applying the mask to the same image, it
was possible to display the intended part of the image to the appropriate eye. By
offsetting the images horizontally, disparity was introduced, which was perceived as
depth by observers.
This method led to lag in the display of images, and was difficult to implement for
non-static stimuli. It was also specific to horizontal full HD interleaved screens.
The use of a ‘quadro’ graphics card (with four buffers) offered a solution to these
problems. The quadro graphics card consists of four buffers; right and left front and
right and left back, which simplifies the code (using win.setBuffer(‘right’[/’left’])), as
the draw commands can be directed to either the right or left buffer accordingly.
This method also allows the script to be run on different displays, as the display
type is configured in the graphics card settings, e.g. horizontal interleaved for the
LG display and DualDisplay for the synopthopre display.
The Nvidia Quadro FX4600 graphical processors used in the experiments were
purchased second hand from eBay, due to financial considerations.
Experiment control
The stairhandler function of psychopy was used to control the initial experiment
where the conditions we run in a blocked format. Each condition had its own script
with identical parameters aside from those defining the condition. Two three up,
one down procedure was used in all cases to converge on the 79.4% correct level,
(22) that is, for the amount of disparity to decrease by the appropriate step size
44
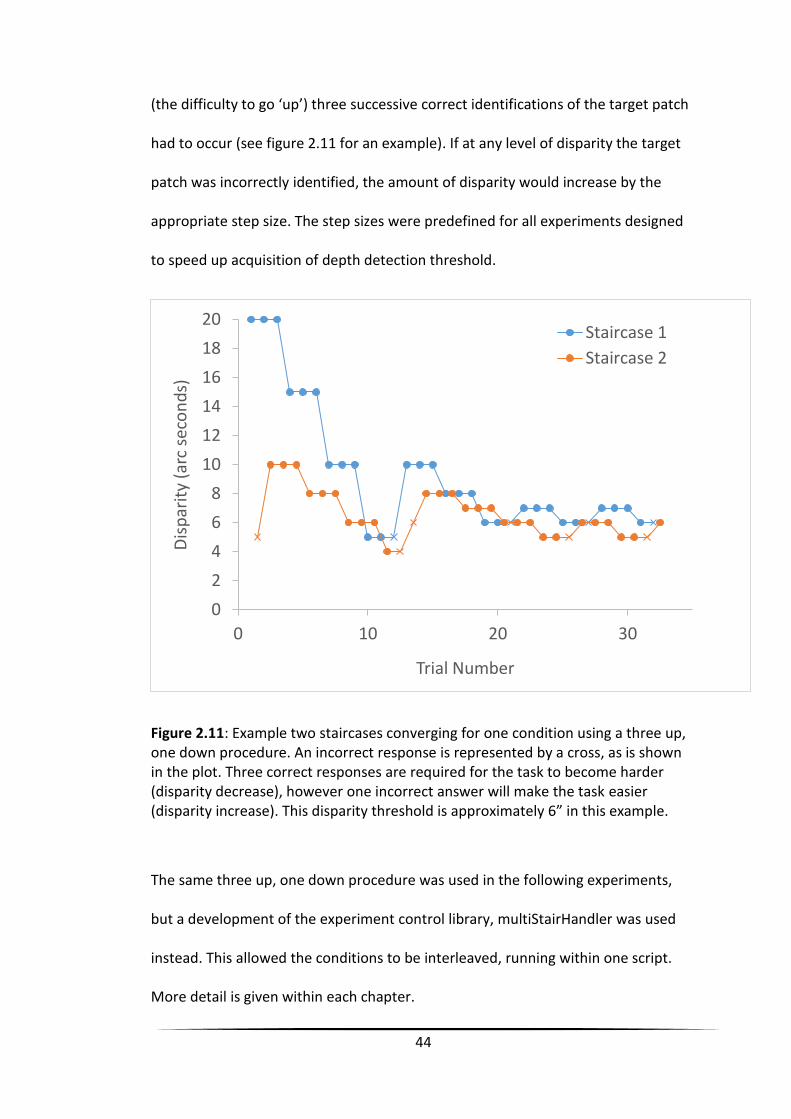
(the difficulty to go ‘up’) three successive correct identifications of the target patch
had to occur (see figure 2.11 for an example). If at any level of disparity the target
patch was incorrectly identified, the amount of disparity would increase by the
appropriate step size. The step sizes were predefined for all experiments designed
to speed up acquisition of depth detection threshold.
Figure 2.11: Example two staircases converging for one condition using a three up, one down procedure. An incorrect response is represented by a cross, as is shown in the plot. Three correct responses are required for the task to become harder (disparity decrease), however one incorrect answer will make the task easier (disparity increase). This disparity threshold is approximately 6” in this example.
The same three up, one down procedure was used in the following experiments,
but a development of the experiment control library, multiStairHandler was used
instead. This allowed the conditions to be interleaved, running within one script.
More detail is given within each chapter.
0
2
4
6
8
10
12
14
16
18
20
0 10 20 30
Dis
par
ity
(arc
sec
on
ds)
Trial Number
Staircase 1
Staircase 2
45
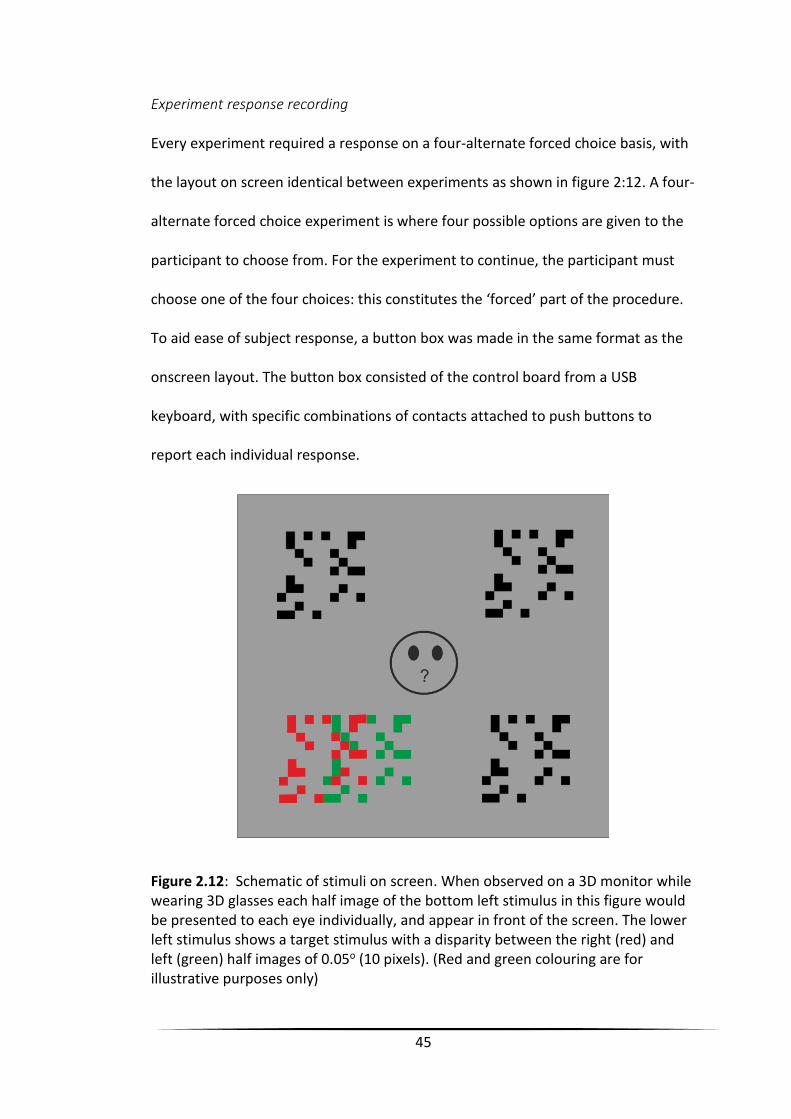
Experiment response recording
Every experiment required a response on a four-alternate forced choice basis, with
the layout on screen identical between experiments as shown in figure 2:12. A four-
alternate forced choice experiment is where four possible options are given to the
participant to choose from. For the experiment to continue, the participant must
choose one of the four choices: this constitutes the ‘forced’ part of the procedure.
To aid ease of subject response, a button box was made in the same format as the
onscreen layout. The button box consisted of the control board from a USB
keyboard, with specific combinations of contacts attached to push buttons to
report each individual response.
Figure 2.12: Schematic of stimuli on screen. When observed on a 3D monitor while wearing 3D glasses each half image of the bottom left stimulus in this figure would be presented to each eye individually, and appear in front of the screen. The lower left stimulus shows a target stimulus with a disparity between the right (red) and left (green) half images of 0.05o (10 pixels). (Red and green colouring are for illustrative purposes only)
46
Stimuli display
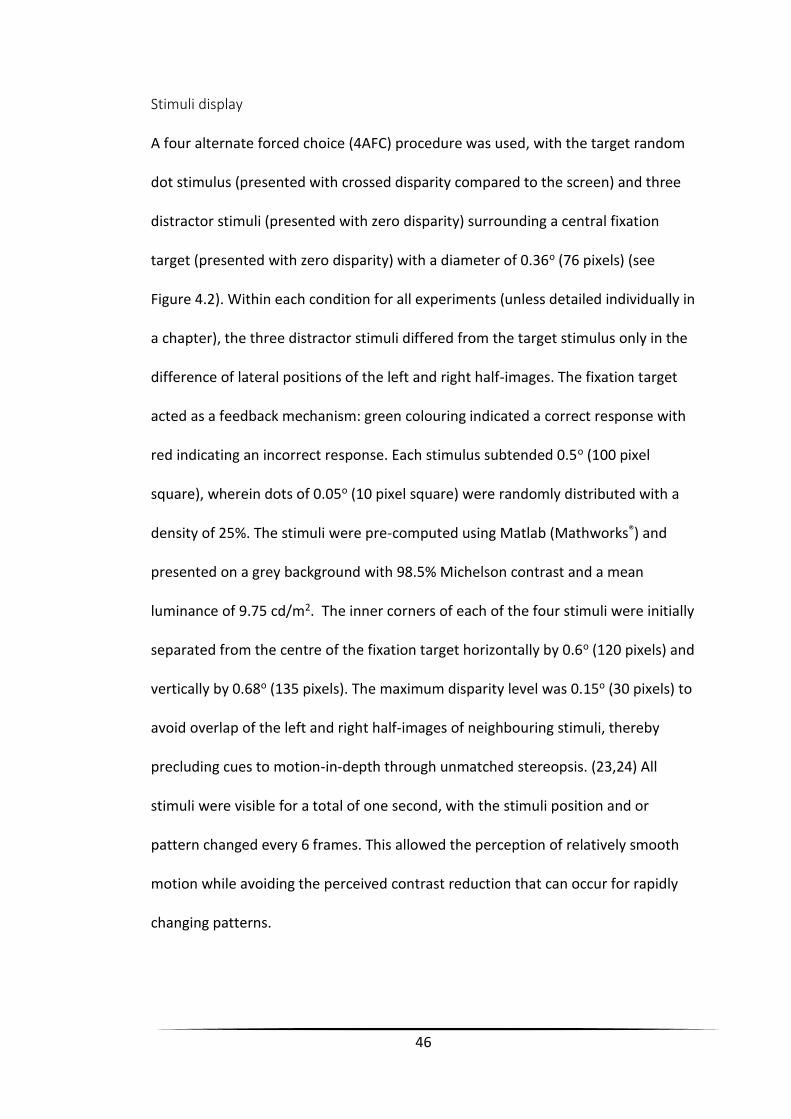
A four alternate forced choice (4AFC) procedure was used, with the target random
dot stimulus (presented with crossed disparity compared to the screen) and three
distractor stimuli (presented with zero disparity) surrounding a central fixation
target (presented with zero disparity) with a diameter of 0.36o (76 pixels) (see
Figure 4.2). Within each condition for all experiments (unless detailed individually in
a chapter), the three distractor stimuli differed from the target stimulus only in the
difference of lateral positions of the left and right half-images. The fixation target
acted as a feedback mechanism: green colouring indicated a correct response with
red indicating an incorrect response. Each stimulus subtended 0.5o (100 pixel
square), wherein dots of 0.05o (10 pixel square) were randomly distributed with a
density of 25%. The stimuli were pre-computed using Matlab (Mathworks®) and
presented on a grey background with 98.5% Michelson contrast and a mean
luminance of 9.75 cd/m2. The inner corners of each of the four stimuli were initially
separated from the centre of the fixation target horizontally by 0.6o (120 pixels) and
vertically by 0.68o (135 pixels). The maximum disparity level was 0.15o (30 pixels) to
avoid overlap of the left and right half-images of neighbouring stimuli, thereby
precluding cues to motion-in-depth through unmatched stereopsis. (23,24) All
stimuli were visible for a total of one second, with the stimuli position and or
pattern changed every 6 frames. This allowed the perception of relatively smooth
motion while avoiding the perceived contrast reduction that can occur for rapidly
changing patterns.
47
Experiment set up
All experiments were carried out in the dark to reduce the influence of external
factors. The LG display was mounted on a moveable trolley with the monitor at a
fixed height. The height was fixed so that the centre of the screen was aligned with
the eye level indicator on the chin rest. By aligning the participants eye with the eye
level indicator, perfect alignment with the centre of the screen was ensured,
minimising the likelihood of any crosstalk occurring.
Statistical Analysis
To obtain depth detection thresholds for each participant, a cumulative Weibull
function (eq. 1) was fitted to the proportion of correct responses as a function of
disparity level. (25) Chance level (B) in a 4-AFC experiment is 25%, and the
asymptote (A) value was set to 1. The parameters estimated were the steepness of
the curve (d) and the location of the curve (c). We use c as our threshold, as this
represents the disparity level at which observers achieved a 72.41% correct
response.
𝒇(𝒙) = 𝑨 − (𝑨 − 𝑩) × 𝒆𝒙𝒑(− (𝒙
𝒄)
𝒅
) (eq. 1)
The lower bound of c was set to zero and the upper bound was set to 1086”. As a
criterion for exclusion, we used the goodness of fit value of the cumulative Weibull
function; if r2<0.3 in all conditions, the subject was excluded from further analysis.
For each comparison, thresholds were only used from subjects who provided a
reliable response in the conditions included in the planned comparison.
48
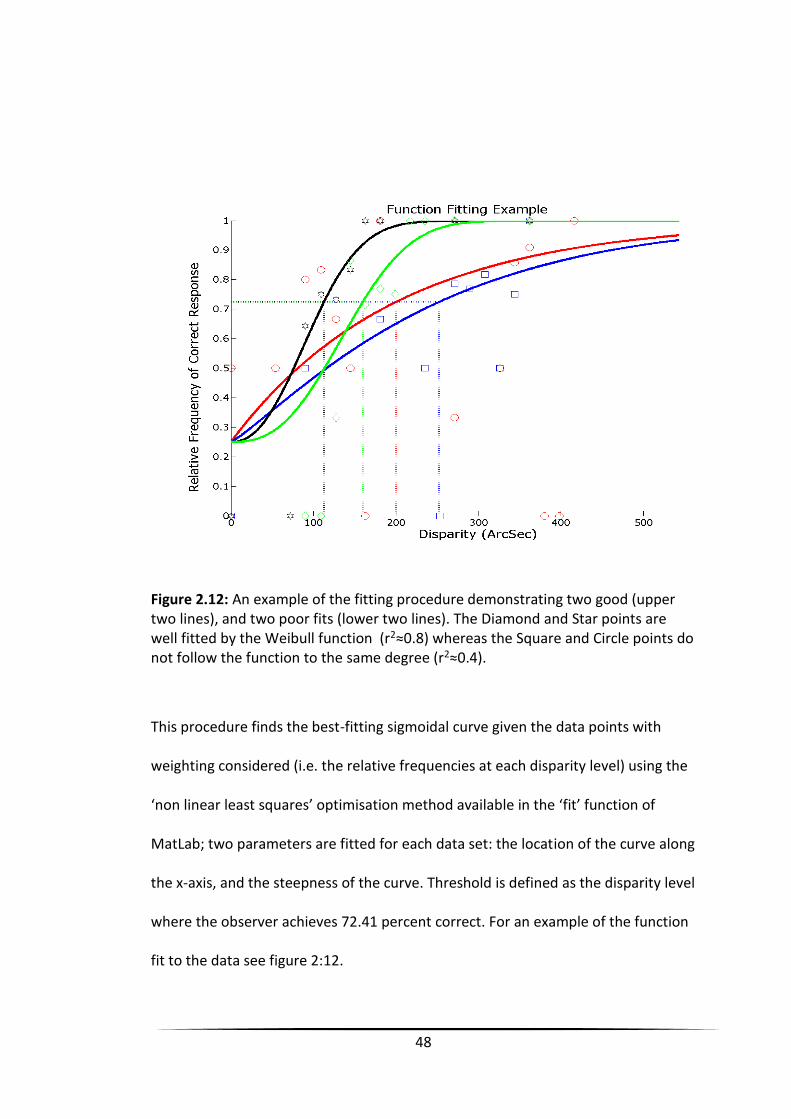
Figure 2.12: An example of the fitting procedure demonstrating two good (upper two lines), and two poor fits (lower two lines). The Diamond and Star points are well fitted by the Weibull function (r2≈0.8) whereas the Square and Circle points do not follow the function to the same degree (r2≈0.4).
This procedure finds the best-fitting sigmoidal curve given the data points with
weighting considered (i.e. the relative frequencies at each disparity level) using the
‘non linear least squares’ optimisation method available in the ‘fit’ function of
MatLab; two parameters are fitted for each data set: the location of the curve along
the x-axis, and the steepness of the curve. Threshold is defined as the disparity level
where the observer achieves 72.41 percent correct. For an example of the function
fit to the data see figure 2:12.
49
As a threshold was always provided by the function, an arbitrary criterion was
necessary to avoid erroneous conclusions being formed. To be included in the
analysis, it was required that at least one out of the four conditions resulted in a
reliable Weibull fit (r2 of at least 0.3), to demonstrate the subject understood the
task.
Details of analysis carried out are included in each chapter.
50
Chapter Three – Dynamic cues to binocular depth
This experiment tested a total of 32 subjects to pilot the newly developed
stereomotion stimuli and to assess the experimental paradigm to determine if the
variations in the stimuli provided measurable differences between the stimuli.
Introduction
A proportion of the population have binocular vision deficits, with the prevalence of
strabismus between 2.3% and 3.6% in young children alone. (26-29) These deficits
often lead to reduced or absent stereoacuity when assessed with current clinical
methods. At the same time, qualitative work has shown, that even in the absence
of clinically measurable stereopsis, the experience of compelling 3D volumetric
depth is reported when viewing dynamic stereoscopic stimuli such as 3D video. (30-
32) The discrepancy between clinical measures and patient reports may be due to
the limitations of clinical tests, or additional cues present in stereoscopic
entertainment media.
Multiple monocular cues to depth are present in video, which provide the
perception of depth considered as compelling, as binocular disparity based depth
information. (33) Binocular disparity is not the sole cue used to extract depth
information, however, it is an important indication of the quality and control of an
individuals’ binocular single vision. In clinical ophthalmological practice, testing
currently only assess once facet of this, namely static binocular disparity. Motion is
51
useful for the detection of depth order, the determination of shape, and the
discrimination of movement through depth, motion should therefore be considered
as an important binocular cue.
Motion in depth, present in both monocular and binocular stimuli, provides the
impression of movement of a stimulus through depth, toward or away from the
observer. The presence of this stereomotive facet of stereopsis has been
demonstrated in the absence of measurable static stereoacuity. Of 42 subjects who
were unable to identify depth on a static stereoacuity test which displayed
disparities up to 1200” (Titmus stereo-test), 22 were able to identify binocular
motion in depth at a threshold of 500” or smaller. (13,14) Other studies suggest
that the presence of changing disparity results in the identification of motion in
depth, where static disparity demonstrated no depth. (11,12) Furthermore, the
time taken to identify which target is closest to an observer is significantly shorter
when the target moves through depth even if the stationary presentation has a
larger amount of disparity. (9) When asked to compare static and stereomotion
targets, observers matched smaller amounts of disparity where motion in depth is
present, to a static disparity target. (8) The presence of motion in depth enhances
the perception of depth.
Motion in depth (a Depth Change) contains two binocular cues, changes in disparity
over time (CDOT) and interocular velocity differences (IOVD). (6,34) The CDOT
mechanism determines the amount of spatial disparity present between the images
projected onto each retina, continually monitoring for changes. If the amount of
disparity of an object seen in depth increases or decreases over time, the object is
52
perceived to be moving towards (looming) or away (receding) from the observer.
The IOVD mechanism does not rely on determining spatial disparity, rather it uses
the motion of the images projected onto each retina, and based on any difference
between the motion in the left and right eye (speed or direction) perceives motion
through depth. It appears also that the CDOT cue is used by most individuals in
isolation whereas fewer are able to use the IOVD. (2)
While these studies agree that the presence of motion in depth can demonstrate
binocular function in the absence of measurable static stereoacuity, there are a
number of limitations of the methodologies employed, such as the comparison of
different disparity ranges and using differing presentation methods (computer
display vs paper based testing) between the static and stereomotion conditions.
Also, the previous studies investigated the perception of motion in depth, rather
than depth detection per se.
Therefore, the aim of this chapter is to directly compare static and dynamic
conditions, using stimuli presented on the same device, to determine if
stereomotion cues to depth result in lower thresholds than static cues.
53
Methods
Experimental conditions
The main comparison in the experiment was between the static and depth change
conditions, but to further investigate stereomotion depth cues, we included a CDOT
only condition for comparison. Further, a fourth condition was also introduced as a
control for the CDOT condition. The order of presentation of these conditions was
randomised for each subject. All stimuli were displayed for a total of one second.
The features of each condition are as follows:
1. STATIC: Stimulus is presented at a fixed amount of disparity. Between each
trial the pattern of dots changed.
2. Z-LOCATION CHANGE: Each half-image consisted of the same pattern of dots
during the one second presentation, however, every 167ms, an increase in
the amount of disparity occurred from the initial disparity of 1/6th of the
target disparity. E.g. for a target disparity of 60”: in the first 167ms the
disparity was 10”, increasing to 20” for the next 167ms, and then up to 60”
for the final 167ms of the presentation time. Between each trial the pattern
of dots changed.
3. CDOT: This condition is similar to the Z-LOCATION CHANGE condition,
however on each change in disparity, the pattern of dots making up each
patch also changed in the target and control patches.
4. STATIC CHANGING PATTERN: To ensure any differences between the
dynamic and CDOT conditions were not due to the changing pattern of dots
54
during presentation, this condition is identical to the STATIC condition with
the pattern of dots changing every 1/6th of a second. E.g. for a target
disparity of 60”: for the first 167ms the disparity was 60” with one pattern,
for the next 167ms the disparity remained at 60”, however a different
pattern of dots was presented, etc.
To exclude any cue from monocular viewing or from motion alone indicating the
correct response in the conditions with changing disparity (Z-LOCATION CHANGE
and CDOT), lateral motion was introduced to the three distractor patches in the
stimuli. The amount of motion was identical to the distance moved by the target
patch, occurring every 167ms, however rather than the half images moving in the
opposing directions to create crossed disparity, the non-target patch half images
moved in the same direction, thereby providing the same amount of retinal motion,
but zero disparity change.
Results
In total 32 subjects aged 18-41 years were recruited, screened and took part in the
experiment. The average interocular visual acuity difference was mean (±SD)
0.04(±0.04) LogMAR. Reliability of function fit was analysed for each participant,
seven of which were excluded as they did not meet the criteria. The mean (±SD) age
of the remaining subjects were 25 (±1.2) years.
55
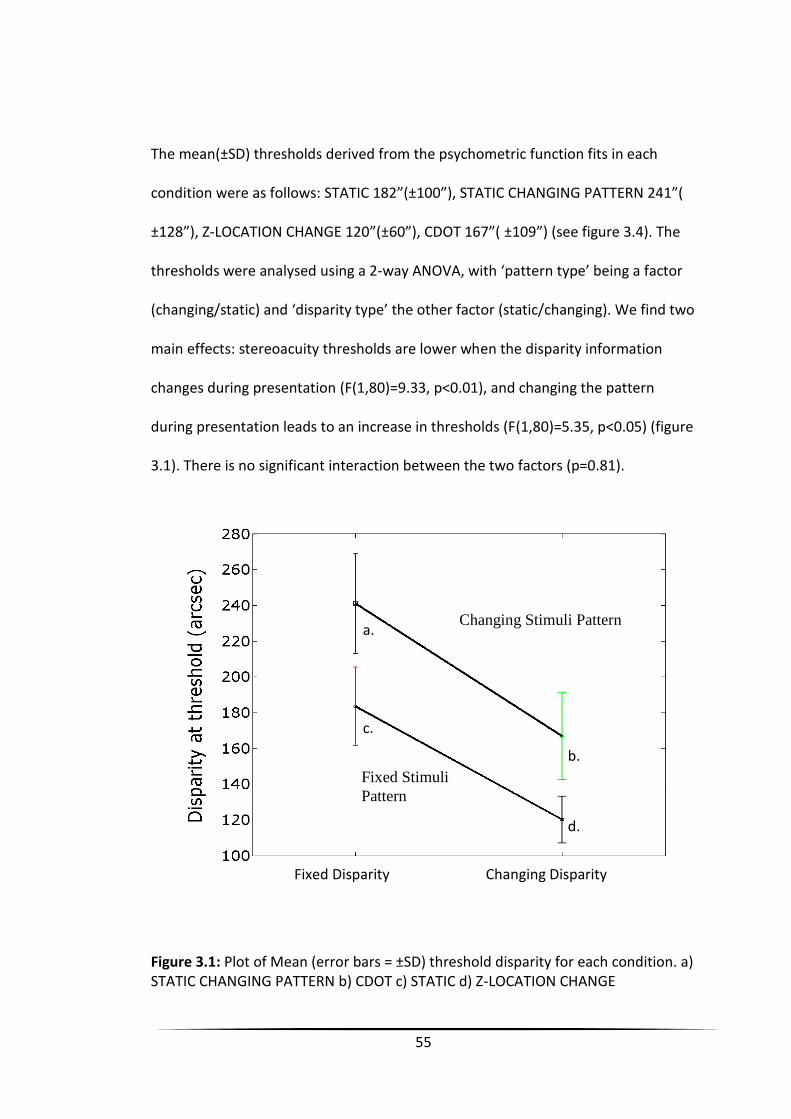
The mean(±SD) thresholds derived from the psychometric function fits in each
condition were as follows: STATIC 182”(±100”), STATIC CHANGING PATTERN 241”(
±128”), Z-LOCATION CHANGE 120”(±60”), CDOT 167”( ±109”) (see figure 3.4). The
thresholds were analysed using a 2-way ANOVA, with ‘pattern type’ being a factor
(changing/static) and ‘disparity type’ the other factor (static/changing). We find two
main effects: stereoacuity thresholds are lower when the disparity information
changes during presentation (F(1,80)=9.33, p<0.01), and changing the pattern
during presentation leads to an increase in thresholds (F(1,80)=5.35, p<0.05) (figure
3.1). There is no significant interaction between the two factors (p=0.81).
Figure 3.1: Plot of Mean (error bars = ±SD) threshold disparity for each condition. a) STATIC CHANGING PATTERN b) CDOT c) STATIC d) Z-LOCATION CHANGE
Fixed
Stimuli Pattern
Changing Stimuli Pattern
Fixed Disparity Changing Disparity
Fixed Stimuli
Pattern
b.
a.
c.
d.
56
Discussion
In previous studies, (31,32) subjects reported compelling depth perception when
viewing stereoscopic 3D entertainment media when a large variety of cues to depth
were present in the stimuli. The aim of the current experiment was to remove
monocular cues to depth to investigate the contribution of dynamic disparity
information for depth detection.
By directly comparing thresholds for static and dynamic conditions using stimuli
presented on the same device with the same settings (display duration, size,
contrast, colour, display method, luminance, testing protocol), we can conclude
that it is the stereomotion that confers a benefit on individuals’ depth detection.
This finding provides a potential explanation for the observation that those without
measurable static stereoacuity seem to perceive volumetric 3D depth at the
cinema, (30,31) and can accurately report changes in depth when presented with
motion. (11-14)
The lowest thresholds were found for the Z-LOCATION CHANGE condition
(Changing Disparity/Fixed Pattern), which is consistent with the idea that the CDOT
cue alone is not solely responsible for depth detection of motion-in-depth stimuli,
but that another cue, the IOVD cue, might be utilised, in line with previous reports.
(2)
Additional experiments have been conducted to determine if an isolation of the
IOVD cue results in the perception of depth. By definition, no disparity information
57
is available in the IOVD cue, as no spatially corresponding points exist between the
two eyes; the IOVD cue signals only a change in position. Indeed, of 132 subjects
assessed in a subsequent study, only 12 were able to provide a reliable fit in the
IOVD only condition, with thresholds significantly higher than any other condition.
(35)
Of the 32 subjects tested, seven were not included in the analysis as they did not
provide a reliable function fit in at least one condition. As the population of subjects
used in this study were not familiar with psychophysical testing methods, it is not
unexpected that a considerable proportion did not provide reliable data. A study
using similar stimuli to display similar cues found that only half of their 62 subjects
provided thresholds for use in analysis. (2) The level of stereoacuity (e.g. STATIC
185”) measured in the study sample may appear poor; this is due to the design of
the stimuli used in the experiment. The aim was not to measure absolute
thresholds, but to allow comparison between the different conditions without
creating a ceiling effect due to the relatively large pixel size in the display.
By introducing lateral motion to the distractor patches in the stimuli in the CDOT
and Z-LOCATION CHANGE conditions, we aimed to ensure the subjects were not
responding on the basis of monocular retinal motion alone. (6) Whilst no lateral
motion was programmed in the target stimulus, a degree of lateral motion can be
perceived in stimuli moving through depth, as the lateral motion is more readily
detected than the depth change. (36)
The data presented here provides evidence that the human visual system can utilise
stereomotion information more effectively than static disparity signals,

58
corroborating work performed by Weldon et al.. (9) This is distinct from other
studies mentioned here, where the ability to detect motion was assessed. Our
finding that stereomotion disparity processing is superior to static processing
warrants further investigation and potential development of a clinical test, to allow
the full assessment of binocular potential to assist management decisions.
Binocularity may be demonstrable when tested with a binocular test including
stereomotion, where absence of response is found during static assessment.
59
Chapter Four – A systematic comparison of static and dynamic
cues for depth perception
This chapter builds on the previous chapter by introducing two further stimuli to
determine the contribution of other potential cues which may be beneficial to
depth perception. The format of the experiment also changes from a blocked
design to an interleaved design to reduce any learning effect that may occur during
blocked presentation. While standard clinical stereovision tests involve stationary
stimuli with a given static disparity, dynamic 3D stimuli can involve movement
across the screen (x or y location change), variations of the surface pattern of
stimuli over time (pattern change), and/or changes in the amount of simulated
depth over time (z location change, or “stereomotion”), each of which could affect
the observer’s ability to extract stereoscopic information. This chapter will evaluate
the effectiveness of these stimulus characteristics with the addition of stimuli that
move across the screen.
Introduction
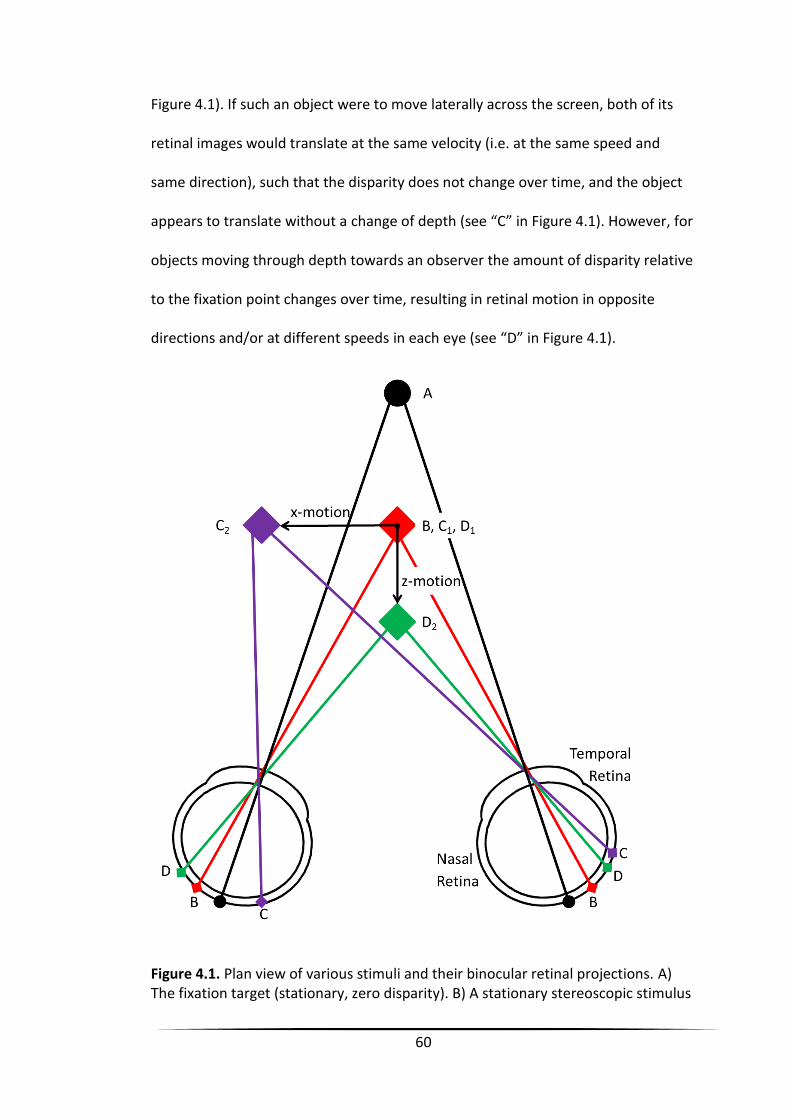
When the two retinal half-images of an object fall on corresponding points in each
eye (e.g. a fixation target in the central fovea), it has zero disparity (see “A” in
Figure 4.1), and where non-corresponding retinal locations are stimulated, a
disparity is present. For a stimulus whose half-images are displaced in a temporal
direction with respect to each other, the disparity is crossed, and the relevant
stimulus feature appears to be nearer than the zero disparity object (see “B” in
60
Figure 4.1). If such an object were to move laterally across the screen, both of its
retinal images would translate at the same velocity (i.e. at the same speed and
same direction), such that the disparity does not change over time, and the object
appears to translate without a change of depth (see “C” in Figure 4.1). However, for
objects moving through depth towards an observer the amount of disparity relative
to the fixation point changes over time, resulting in retinal motion in opposite
directions and/or at different speeds in each eye (see “D” in Figure 4.1).
Figure 4.1. Plan view of various stimuli and their binocular retinal projections. A) The fixation target (stationary, zero disparity). B) A stationary stereoscopic stimulus
61
with a crossed disparity. C) A stimulus moving laterally (x-motion) at a constant disparity. D) A stimulus moving in depth (z-motion), changing its disparity as its half-images translate at different velocities across the retinae. In all cases subscript 1 denotes the start location at time 1 (B on retina) and subscript 2 is the next location at time 2 (C and D on retina)).
Disparity change in particular has been considered the most likely candidate for
residual stereopsis in those clinically defined as stereoblind (no measurable
stereoacuity on standard clinical tests); quantitative work has shown that
stereoblind subjects are able to correctly identify the approaching or receding
motion of stimuli when changes in depth are simulated stereoscopically in
laboratory stimuli. (11-14,16,37) However, in these studies observers were asked to
judge motion and not depth. In studies measuring subjects’ ability to appreciate
depth in stereoscopic stimuli, it appears that non-stereoblind observers perceive a
greater amount of depth for stimuli involving approaching or receding motion,
compared to static stimuli. When asked to match the amplitude of depth of a static
disparity target to one with changing disparity, participants always set a smaller
amplitude of disparity for the moving target. (8) Moreover, when observers were
asked to detect depth in an approaching target that begins with zero disparity, this
can be achieved more quickly than for a stationary target with a larger disparity,
indicating an enhanced sensitivity for dynamic stereoscopic targets. (9) Zinn &
Solomon (1985) measured the time taken for participants to determine the closest
of four binocular targets with various relative disparities, as they moved through
depth towards the participant. (10) The amount of time taken to determine the
closest target did not correlate significantly with static stereoacuity scores as
measured with either the TNO or Titmus tests. Although this null result appears to
62
suggest that levels of performance with moving and stationary targets are
unrelated, the differences between stimuli and procedure for the two tasks make a
direct comparison difficult since other stimulus- and task-related parameters may
affect the performance.
The presence of a changing pattern in dynamic stimuli may result in an improved
detection of depth, due to the presence of several independent samples and
thereby increasing the reliability of estimating depth and solving the
correspondence problem. (38,39) We aim to further investigate the effect of a
pattern change on depth detection thresholds.
Another element of a dynamic display is lateral motion in addition to disparity.
Thresholds for detecting depth are not affected when the lateral velocity is below
2o per second, but worsen exponentially as the velocity increases from 2o to 12o per
second. Control experiments found that this effect was not primarily due to
exposure duration or increasing target eccentricity, but the reduced performance is
due to fast lateral motion. (40)
It is important to note also that comparisons of stereoscopic performance between
dynamic and static stimuli have been made using fundamentally different test
types, for example computerised/projected disparity change stimuli compared to
book based tests. (12-14) As a direct comparison between clinically used book-
based static stereoacuity tests is not possible as each provides a different threshold
for the same individual, (41,42) the differing findings of static and dynamic tests
may be due to variations in test design rather than the presence or absence of
static and dynamic stereopsis.
63
This chapter investigates the influence of various characteristics of dynamic
stereoscopic stimuli on the detection of depth in direct comparison to static stimuli.
We include stimuli that either feature or lack changes of disparity, of horizontal
location, or of stimulus pattern. By assessing these stimulus characteristics under
equivalent conditions direct comparisons between dynamic and static depth
detection thresholds are possible.
Materials and Methods
To determine the contribution of each aspect of dynamic stereoscopic stimuli to the
detection of depth, six specific stimulus conditions were included. In each case, the
appearance of the four stimulus patches on each trial was designed to be similar,
aside from the target stimulus being defined by a separation of the right and left
half-images.
1. STATIC. Target stimuli were presented with a fixed disparity. Both the
stimulus’ frontoparallel location and its dot pattern were constant
throughout.
2. PATTERN CHANGE. The left and right eye images were presented with a
fixed disparity and location. The dot pattern changed to a novel random
array of dots every screen update.
3. X-LOCATION CHANGE. Stimuli were presented with a fixed disparity and
lateral motion with a total displacement equivalent to half of the target
stimulus’ disparity. Importantly, each half image moved in the same
64
direction (no disparity change), simulating lateral motion. The dot pattern
was fixed.
4. Z-LOCATION CHANGE. Target stimuli were presented with a disparity that
changed over time (starting at zero and increasing towards the target
disparity), but with a constant location and dot pattern. Many observers
perceive these stimuli to move laterally as they approach, a percept that is
more likely in observers for whom there is substantial suppression of one
eye’s input. (6) To ensure that this artefactual percept could not be used to
provide the correct answer in our 4AFC task, randomised rightward or
leftward motion was added to the three distractor stimuli. The two half-
images of each individual distractor stimulus moved simultaneously in the
same direction and by the same distance as the target stimulus’ half images.
5. Z-LOCATION & PATTERN CHANGE. Target stimuli were presented with a
changing disparity (as for the Z-LOCATION CHANGE stimulus), while the dot
pattern also changed to a new random array every screen update. As for the
Z-LOCATION CHANGE condition, randomised rightward or leftward motion
was added to the three distractor stimuli.
In principle, the Z-LOCATION CHANGE condition contains the same information on
positional depth as the Z-LOCATION & PATTERN CHANGE condition. However, it
also contains a motion in depth cue (Inter-ocular Velocity Difference - IOVD) which
provides information on the rate and trajectory of motion in depth. (1-3,6,7) To
assess the possibility that subjects might be tempted to select the stimulus that
appeared to move in depth, rather than use positional depth signals per se, we
65
included a control condition featuring this cue to motion in depth only. We
hypothesised that it would not provide any information on static depth, and hence
thresholds would not be recordable.
6. CONTROL. Target stimuli were identical to those in the Z-LOCATION
CHANGE condition, in terms of the temporal motion of each retinal half-
image, the constancy of stimulus pattern and the lack of overall lateral
motion. However, in this condition, left and right half-images consisted of
different patterns with no binocular correlation. While this eliminates any
coherent binocular disparity signal from the target and distractor patches, it
cannot be said that there are no disparity signals present at all. The stimulus
itself contains many vertical edges in each eye, and although any arbitrary
left-right pair of edges could in principle be said to have a disparity, these
would be random and inconsistent, forming a cloud of noisy depth signals
centring on zero. Although these signals could not be used to complete the
task, it is possible that the IOVD cue might be used to identify which
stimulus is moving in depth. To prevent the target patch from being
detected by lateral motion due to suppression or diplopia, the distractor
stimuli featured nasal motion in each half-image.
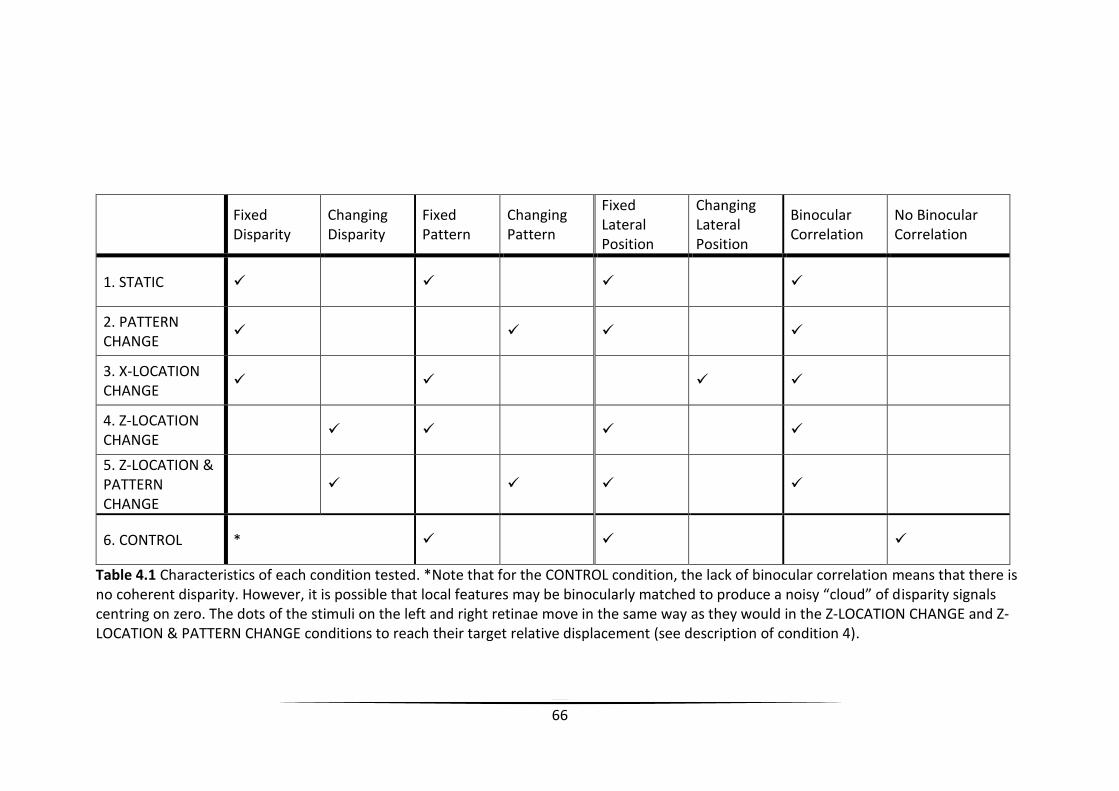
66
Fixed Disparity
Changing Disparity
Fixed Pattern
Changing Pattern
Fixed Lateral Position
Changing Lateral Position
Binocular Correlation
No Binocular Correlation
1. STATIC
2. PATTERN CHANGE
3. X-LOCATION CHANGE
4. Z-LOCATION CHANGE
5. Z-LOCATION & PATTERN CHANGE
6. CONTROL *
Table 4.1 Characteristics of each condition tested. *Note that for the CONTROL condition, the lack of binocular correlation means that there is no coherent disparity. However, it is possible that local features may be binocularly matched to produce a noisy “cloud” of disparity signals centring on zero. The dots of the stimuli on the left and right retinae move in the same way as they would in the Z-LOCATION CHANGE and Z-LOCATION & PATTERN CHANGE conditions to reach their target relative displacement (see description of condition 4).
67
Procedure
In each session, all six condition staircases were randomly interleaved. Two
thresholds were estimated for each condition by separate staircases (Multistair
handler functional of Psychopy (21)), one starting at a large disparity (362”), and the
other at a small disparity (90”) to ensure the starting value did not systematically
affect the final threshold. The initial step size was 95”, which after three reversals
was reduced to 38”. After a further two reversals the step size was halved to the
minimum step size of 19’’. A three-down-one-up method was used so that the
staircases converged to a performance of 79.4% correct. (22) The staircase for each
condition terminated when eight reversals occurred or if 150 trials were reached.
Note that for the CONTROL condition the variable controlled by the staircase was
maximal horizontal retinal displacement, which is applicable to stimuli lacking
binocular correlation while being equivalent to retinal disparity in the other
conditions.
Statistical Analysis
To determine whether dynamic stimuli result in lower depth detection thresholds
than static stimuli, planned comparisons were made between the STATIC vs.
PATTERN CHANGE; the STATIC vs. X-LOCATION CHANGE; the STATIC vs. Z-LOCATION
CHANGE, and the STATIC vs. Z-LOCATION & PATTERN CHANGE conditions. To
examine the potential use of artefactual motion-in-depth signals in our depth
detection task (i.e. participants choosing the stimulus that appears to move in
depth, rather than the stimulus that appeared closer), a comparison was made
between the STATIC and the CONTROL condition, which appeared to move in depth
68
despite having an undefined disparity. As a total of six individual paired
comparisons were made using paired t-tests, Bonferroni corrections were applied
to maintain a family-wise α of 0.05. The corrected α value was 0.05
5 = 0.01. In
addition, a supplementary 2x2 ANOVA was performed to examine the factorial
combination of the two independent variables of pattern (fixed/changing) and
depth (fixed/changing).
Results
In total, 127 subjects (85 Female, 42 male; mean (SD) age 21 (5) years) who passed
screening were assessed. Of these, 19 were excluded on the basis of unreliable
performance (see threshold estimation in methods). Table 4.2 provides an
indication of the conditions where subjects were most and least able to detect
depth by the remaining 108 subjects, with Figure 4.2 showing threshold
performance for each of the conditions.
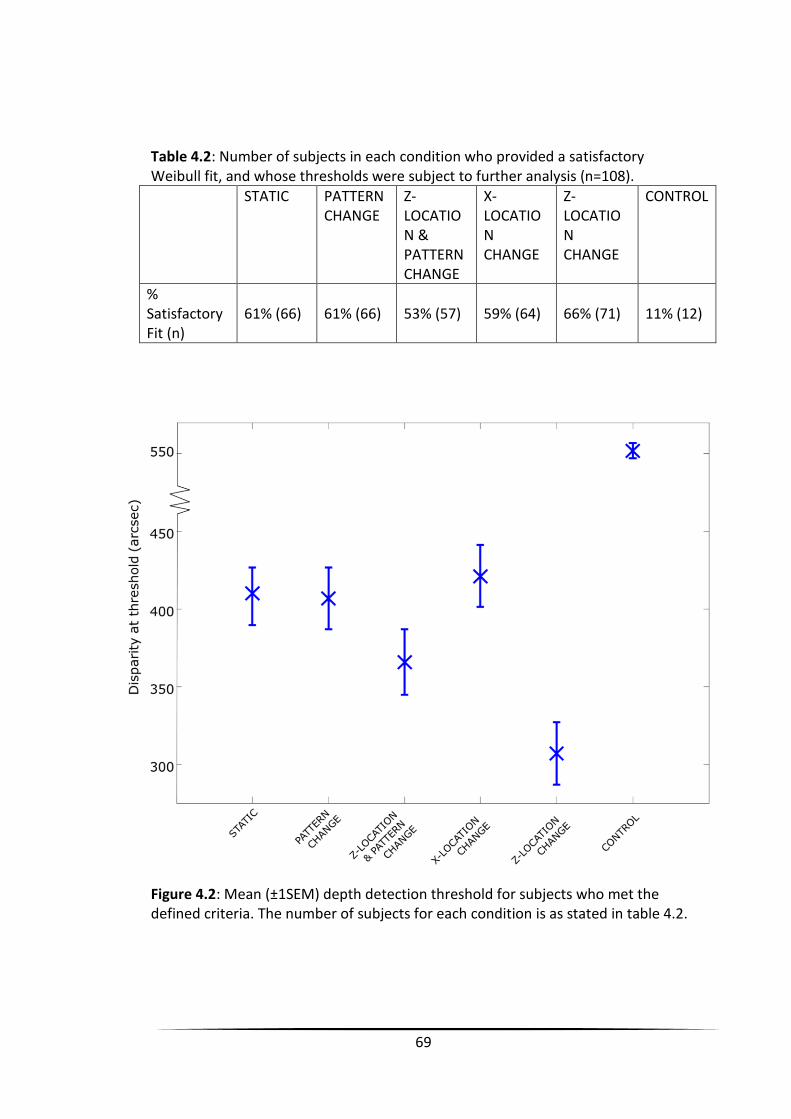
69
Table 4.2: Number of subjects in each condition who provided a satisfactory Weibull fit, and whose thresholds were subject to further analysis (n=108).
STATIC PATTERN CHANGE
Z-LOCATION & PATTERN CHANGE
X-LOCATION CHANGE
Z-LOCATION CHANGE
CONTROL
% Satisfactory Fit (n)
61% (66) 61% (66) 53% (57) 59% (64) 66% (71) 11% (12)
Figure 4.2: Mean (±1SEM) depth detection threshold for subjects who met the defined criteria. The number of subjects for each condition is as stated in table 4.2.
70
Do dynamic stimuli results in lower depth detection thresholds than static stimuli?
Neither the comparison between the STATIC and PATTERN CHANGE (t(43)=0.37,
p=0.71) conditions, nor the comparison between STATIC vs. X-LOCATION CHANGE
(t(47)=-0.84, p=0.405) conditions showed a significant difference. However, a
different pattern emerged for stimuli that featured motion in depth. A comparison
between STATIC vs. Z-LOCATION CHANGE conditions showed a significant
difference between thresholds (t(46)=6.55, p<0.001), while the Z-LOCATION &
PATTERN CHANGE stimulus also yields a significantly lower threshold than the
STATIC condition (t(42)=5.40, p<0.001). This indicates that the presence of changing
disparity enhances the detection of depth, while there is no evidence of any such
enhancement for changing stimulus patterns or for stimuli moving laterally.
Factorial combination of pattern and z-location change
The factors of Z-LOCATION CHANGE and pattern change were subjected to
additional scrutiny in a 2x2 within subjects ANOVA to assess their effects and the
possibility of interactions. Of the 108 subjects, 27 were able to provide a reliable
threshold in each condition included in this analysis. Data are represented in Figure
4.3. Here, thresholds were lower for conditions involving changing depth: an
observation that was confirmed by the presence of a statistically significant main
effect of Depth (F(1,104)=8.23, p=0.005). No main effect of Pattern was found, as
indicated by the similar thresholds for the two plots (p=0.947). The interaction
between Pattern and Depth was not significant (p=0.757), indicating that the
enhancements brought by changing depth apply equally to all stimuli regardless of
the persistence of the pattern.
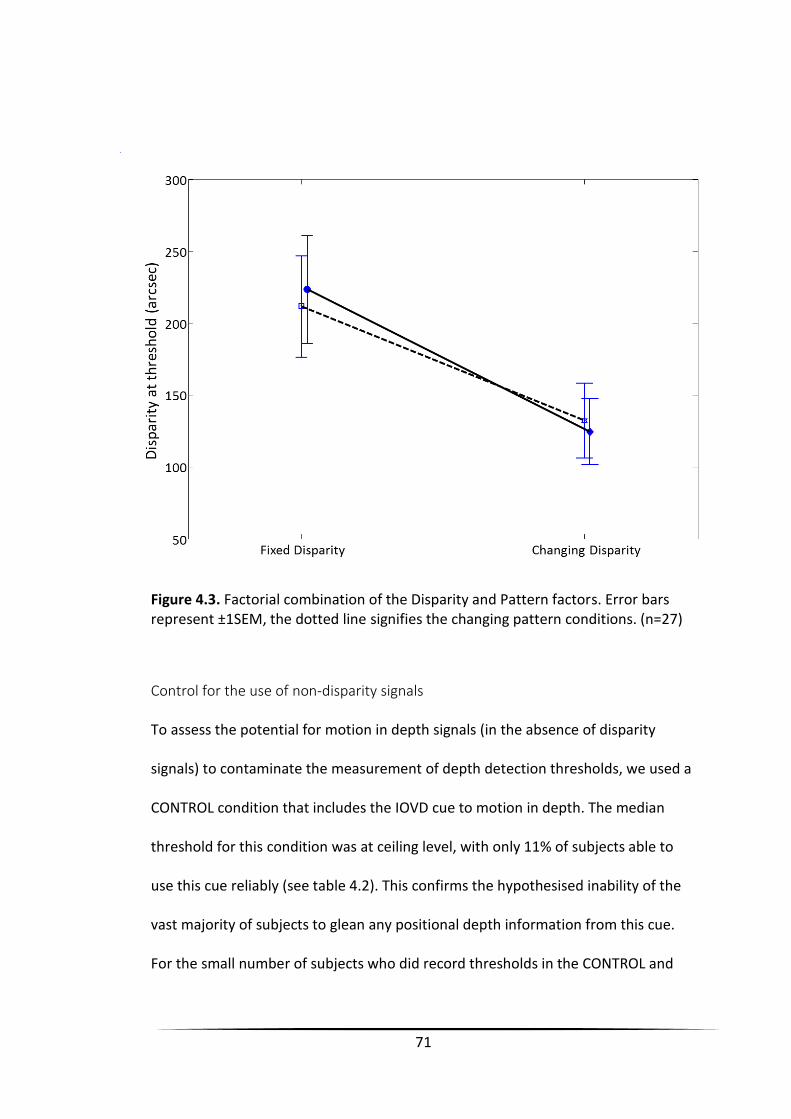
71
Figure 4.3. Factorial combination of the Disparity and Pattern factors. Error bars represent ±1SEM, the dotted line signifies the changing pattern conditions. (n=27)
Control for the use of non-disparity signals
To assess the potential for motion in depth signals (in the absence of disparity
signals) to contaminate the measurement of depth detection thresholds, we used a
CONTROL condition that includes the IOVD cue to motion in depth. The median
threshold for this condition was at ceiling level, with only 11% of subjects able to
use this cue reliably (see table 4.2). This confirms the hypothesised inability of the
vast majority of subjects to glean any positional depth information from this cue.
For the small number of subjects who did record thresholds in the CONTROL and
72
STATIC condition, they were significantly higher than for the STATIC condition
(t(7)=-3.67, p=0.008).
To ensure that no monocular cues were used to identify the target stimuli, a small
group of subjects (n=3) participated in an additional control experiment, where all
conditions were viewed as described above with additional occlusion of one eye.
Under these monocular conditions, no subject was able to perform the task in any
condition, demonstrating that there were no informative monocular depth cues
present.
Discussion
Dynamic stereoscopic stimuli and the perception of depth
The experience of depth perception during stereoscopic film/TV viewing has been
reported in observers lacking clinically measurable stereoacuity. (31) In the
aforementioned study, no attempt was made to identify the factors that may
contribute to the perception of depth in dynamic displays. The aim of the current
study was to isolate the characteristics of dynamic stereoscopic stimuli and to
establish their contribution to depth detection. While there have been reports of
dynamic stimuli resulting in better stereoscopic performance, (11-14) (in terms of
preserved ability to detect stereoscopic motion in depth, despite the absence of
static stereopsis), to the best of our knowledge our study is the first direct
comparison of depth detection between static and dynamic stimuli. We have
shown that for some dynamic stimuli, lower thresholds are common for many
73
observers. This advantage for dynamic disparity information is specific to motion in
depth and does not occur for patterns moving horizontally, or for those that change
their surface pattern over time (temporally decorrelated).
Task Difficulty
Of the 127 subjects, we excluded 19 from the analysis as these subjects failed to
provide reliable responses in any condition. We were interested in testing depth
detection performance in a representative sample of a normal population, where a
number of participants are unable to perform psychophysical experiments, (2)
whereas these types of studies are often performed on a small set of highly
experienced observers. (43) All subjects demonstrated the presence of stereoscopic
vision during screening (stereo fly test circles <200”) but only 61% of subjects were
able to provide a reliable response in the STATIC condition. The reason for this
could again highlight the non-comparability of stereotests but there are a number
of other reasons for this.
It could be suggested that subjects did not understand the task, did not comply with
instructions given or were unable to detect any depth within the one second
presentation. As shown in table 4.2, no condition yielded satisfactory fits for all
subjects, with 53-66% meeting our criterion in the first five conditions, suggesting
similar task difficulty across these conditions. The variability in the percentage of
reliable fits follow a similar pattern to the thresholds, e.g. the most reliable
condition was the one in which depth detection thresholds were lowest.
To further ensure the exclusion were not an artefact of the Weibull fitting
procedure, we verified that using the last four reversals of each condition as the
74
threshold for each of the 127 subjects tested (converging at 79.4%), yielded
thresholds similar to fitting the Weibull (threshold is defined as the disparity
corresponding to 72.4% correct). The discrepancy between these two methods was
always less than 6.5%, and the pattern of the results is not affected by the method
used to derive the threshold.
Further, to ensure our arbitrary cut off criteria of r2=0.3 did not represent heavy
filtering which may bias our results, we repeated the analysis. This demonstrated
that the analysis is robust and does not depend on the exact value of r2 used as a
cut off; the conclusions do not change when an r2 of 0 is used.
The average level of stereoacuity in the population tested may seem poor (ranging
from 180” to 351” across conditions), compared to previously published thresholds
of less than 5”. (44) A recent large scale study of 1060 participants however, shows
that the median, stereoacuity score on the TNO stereo tests are 60”, and 88” in a
adaptive staircase test with a similar eccentricity in stimuli as used in this thesis.
(45) However, our intention was to test a large sample of observers with differing
levels of stereoscopic proficiency. In addition, our experiment was not designed to
measure the limits of stereoacuity under optimal conditions, (42) but rather to
examine the relative effectiveness of dynamic vs. static cues to depth. Even so, ten
subjects were able to perform with high precision at one pixel disparity (18.1”), the
minimum disparity presented. This level of acuity falls within the range of 12” to
37” in other population studies of stereoacuity in adults considered as normal. (46-
48) Other potential reasons for the increased thresholds, may be in part due to the
depth cue conflicts present in the stimuli, due to the removal of other cues to
75
depth, such as changing size. As is common in studies of stereo/stereomotion,
monocular cues to depth are removed with the aim of isolating the cue of interest
for investigation. Other factors such as a limited display time, eccentricity of target
and spatial parameters may also contribute to the large thresholds measured in this
study.
Disparity thresholds depend on spatial frequency with peak stereoacuity (3-4”)
found at 0.3 cycles per degree when sinusoids are used. (49) Our stimuli are more
broadband (in frequency space) and shifted to higher spatial frequencies, well
beyond the optimal spatial frequency for stereoacuity. Further it has been
demonstrated that stereoscopic discrimination thresholds increase as eccentricity
increases, (50,51) with low threshold demonstrated when the subject can fixate
directly on the target and comparator with no time constraint. (52)
Facilitation specific to disparity change
To test whether the detection of depth in moving stimuli was specific to motion in
depth rather than to moving stimuli in general, a condition using lateral motion
with fixed disparity was included (X-LOCATION CHANGE). We found that unlike
changing depth, adding lateral motion to a fixed disparity stimulus does not
improve stereoacuity compared to a static stimulus with fixed disparity. These
findings are in line with previous studies, as the velocities used here are below 2o, a
level above which depth detection thresholds worsen. (40) In addition, the effect of
changing dot patterns was assessed in a 2x2 ANOVA, which showed neither an
effect of changing pattern nor an interaction between changing depth and changing
76
pattern. As such, the effect of changing depth is able to account for all examples of
enhanced depth detection compared to the STATIC condition.
A potential confound relating to the z-location change conditions (Z-LOCATION
CHANGE, Z-LOCATION CHANGE & PATTERN CHANGE) is that the target stimulus did
not contain lateral motion, whereas the distractor stimuli did, to prevent their
identification through monocular viewing. The lack of objective lateral motion in
the target stimuli could, in principle, reveal the correct answer. However, it has
been documented that observers often perceive such stimuli to have a degree of
lateral motion (due to a bias in the perceived speed of one of the half images), just
as the distractors do, hence preventing subjects from using this cue. Even if this had
not been the case, we believe that the use of this cue is unlikely, as not only would
these two conditions have to be identified out of the six interleaved, but any lateral
motion perceived in the motion in depth stimuli would need to be ignored, the
change in binocular disparity ignored, and solely the difference in lateral motion be
identified.
Methods to avoid this potential confound would introduce further confounds; by
adding lateral motion to the distractors and target, there would still be a greater
amount of lateral motion in the target stimuli. If a random amount of lateral motion
were added to the distractors and target patch a random trajectory for the patch
moving in depth would be introduced, and hence a lack of standardisation of this
stimulus condition. A random amount of lateral motion added to the distractors,
but a constant amount added to the target would result in the speed of lateral
77
translation of the target patch differing from the controls, again providing a method
of identifying the target by artifactual means. Additionally, and perhaps most
importantly, adding any lateral motion to the target would prevent the research
question from being answered; it would produce an oblique trajectory with both x
and z motion, preventing the isolation of z-location change.
A further modification could be the use of a random dot background. This was
considered during the development of the experiment, but it was difficult to
maintain a consistent relationship between the various stimuli features and the
background. For example, the introduction and appearance of monocular zones
would vary more in the target stimuli, as the half images move in opposing
directions.
The possible influence of IOVD on depth detection in the absence of binocular
disparity signals was assessed using the CONTROL condition. In this condition, the
relative motion of the target compared to distractors is effectively doubled, given
that motion of the distractors was equal and opposite to the motion of the target
patch. The IOVD cue is most effective in simulating motion in depth when
contrasting, or relative motion is present. (53) Alongside controlling for monocular
and diplopic cues, the use of doubled stimuli provides the opportunity for good
performance in this condition, if the recognition of motion in depth were reported
by the subjects rather than depth. Although targets in this condition may have
appeared to move in depth, few subjects could give reliable responses, and for the
latter, thresholds were high. Of the 11% of subjects who provided a reliable ‘depth
discrimination’ threshold, only three were able to provide a threshold below ceiling
78
(543”), with a threshold of 161”, 477” and 512”. It is possible that these three
subjects interpreted motion towards themselves as being ‘closer in depth’ than the
distractor stimuli, as they were asked to identify the patch that appeared closest to
them in space. As soon as the target approached it would have appeared closer
than the distractors, and as a binocular response was required to correctly identify
this, this was defined as a correct response. Feedback was provided in the same
manner as in other conditions; we interpreted the identification of the approaching
patch as the closest patch as a correct answer and provided positive feedback.
While one subject recorded a threshold of 161” (191” in Z-LOCATION CHANGE &
PATTERN CHANGE and 182” in Z-LOCATION CHANGE), the other two subjects
provided their highest threshold in the CONTROL condition. This lends confidence in
our results, confirming that the IOVD cue did not contaminate the conditions in
which depth appeared to change over time.
When considering the literature on the ability to detect a change in direction of
motion through depth, rather than the detection of depth in moving stimuli, several
studies have shown examples of stereomotion blindness with intact static depth
perception. This has been demonstrated to coincide in specific areas of a single
subject's visual field, though normal performance may be possible in other areas.
This 'area' can be either a location in a fronto-parallel plane or a range of
disparities. (4,17-19) Cases of intact stereomotion perception in areas where
subjects are unable to detect differences in static depth have also been presented
in the peripheral visual field of strabismic subjects. (11,16) This evidence is

79
complementary to present findings showing sensitivity to dynamic stereo in the
absence of static stereopsis.
80
Conclusion
We have shown the importance of dynamic stimulus characteristics – particularly of
changing disparity – in binocular depth perception. Based on our sample (n=108) of
subjects with measurable stereovision, we conclude that this stimulus attribute is a
likely candidate to explain some of the discrepancy between some observers’ ability
to enjoy enhanced depth simulation in 3D movies despite their diagnosis of
“stereoblindness”. Although it has previously been shown that some stereo-
deficient subjects can detect motion in depth from stimuli that approach or recede
(11-16,18,37), this is the first study to show that performance for detecting depth
through the CDOT cue, is improved under such circumstances, while other dynamic
Characteristics such as horizontal motion and varying stimulus pattern have no
measureable effect.
Our findings have implications for neurobiological models of binocular vision by
providing useful constraints on the relative importance of static vs dynamic
disparity signals for depth perception. They suggest that the detection of binocular
disparity in z-motion is superior to serial detection of changing static disparities.
Dynamic disparity changes (condition 4: Z-LOCATION CHANGE) are ecologically valid
signals that arise either from self-motion or from object motion towards the
observer; our data show that these dynamic disparity signals are associated with
the highest performance for depth detection, consistent with their ecological
validity.
Given the omission of changes of disparity, currently used static stereoacuity tests
may underestimate the degree of binocular function. With this in mind, the present
81
study constitutes an important first step toward the development of a clinically
useful test of dynamic stereoacuity, to reflect real world interactions with depth.
(54-58)
82
Chapter Five - The effect of induced fusional demand on static
and dynamic stereoacuity thresholds
Introduction
High grade stereo acuity requires the precise alignment of the visual axis, and the
sensory ability to determine the presence of binocular disparity between the left
and right visual fields, and use this information to extract depth information. The
binocular neurones that detect depth are sensitive to retinal information,
regardless of how it is presented: (59) “if fusion is achieved, stereopsis is typically
apparent”. (60)
In subjects with good binocular control, the motor fusion system responds to any
diplopia perceived, ensuring the visual axis are positioned on the point of fixation,
resulting in zero retinal disparity at fixation. However, many individuals experience
difficulty with ocular motor control, with varying impact on levels of stereoacuity,
for example, the deterioration of fusional control in intermittent exotropia, can
lead to in an increase in threshold. (61-64) While the consequences of a breakdown
in ocular motor control are seen clinically with patients reporting a variety of
symptoms resulting from the effort of maintaining binocular vision, the impact of
exerting motor fusion on stereoacuity is not clear, and experiments designed to
determine the importance of motor control have resulted in conflicting conclusions.

83
Studies have investigated the effect of fusional stress on stereopsis by simulating
exodeviations of up to 40 prism dioptres (PD) and assessing stereoacuity using the Frisby
Davis Distance test (FD2) and the Distance Randot® (DR) test with or without hysteresis.
(65,66) Whilst some subjects demonstrated no reduction in stereoacuity as long as no
diplopia was present, findings were variable. In other subjects, fusional stress reduced the
level of stereoacuity to the next banding of stereoacuity. The choice of stereoacuity test
may have contributed to the variability in response, as any change may be encompassed by
test/re-test variability. For a ‘real’ change in stereoacuity to be detected using the DR and
FD2 tests, at least a doubling of threshold must be measured. (67-69) This suggests that
current clinical tests may not be sensitive enough to detect a change introduced by fusional
stress.
In the afore mentioned studies, (65,66) the resolution of this detail has been lost by
banding moderate stereoacuity the range of 80-200”, and only using the 60”, 100” and
200” levels of the DR. This is because clinical stereotests are designed to quantify the
degree of impairment rather than measure the abilities of a healthy subject. Using fixed
points of fusional stress also introduces variability across subjects as motor fusion varies
considerably across subjects meaning that the task would be easy for some, but hard for
others. The hysteresis effect allows the achievement of higher levels of motor fusion, which
could be easily achieved by others without employing this.
It has been suggested that reduced stereoacuity under forced vergence may be due
in part, to the necessity of fine motor movements to perceive fine stereopsis being
compromised by fusional demand. (61) If this were the case, it could follow that the
84
effect would be exacerbated if the stereoscopic targets were moving through
depth, if vergence tracking were indeed used. It was demonstrated earlier in this
thesis that smaller amounts of binocular depth are detected in conditions where
stereoscopic targets move through depth, (35) which both suggests that the
changing retinal location of the stimulus does not adversely impact acuity, and if
stereopsis is perturbed by fusional demand, that vergence is not used to detect
depth in stereomotion stimuli.
A difficulty with previous testing has been the use of prisms to induce fusional
stress. Aside from the difficulty of positioning and steadily maintaining the position
of the prism, an amount of optical degradation would occur, uneven between the
eyes unless the prism were split. This could contribute to any effect found. The
synoptophore lends itself to maintaining a steady amount of fusional stress, with
optically clear and equal optical paths, however the levels of stereoacuity testable
on the device are limited in standard configuration. Modified versions are available
however that contain computer controlled displays allowing accurate assessment of
stereoacuity threshold.
This study therefore aims to evaluate the effect of the fusional stress on
stereoacuity in both static and dynamic presentations controlled with a
computerised staircase procedure with the ability to present numerous levels of
disparity, in subjects undergoing similar stress on fusional control.
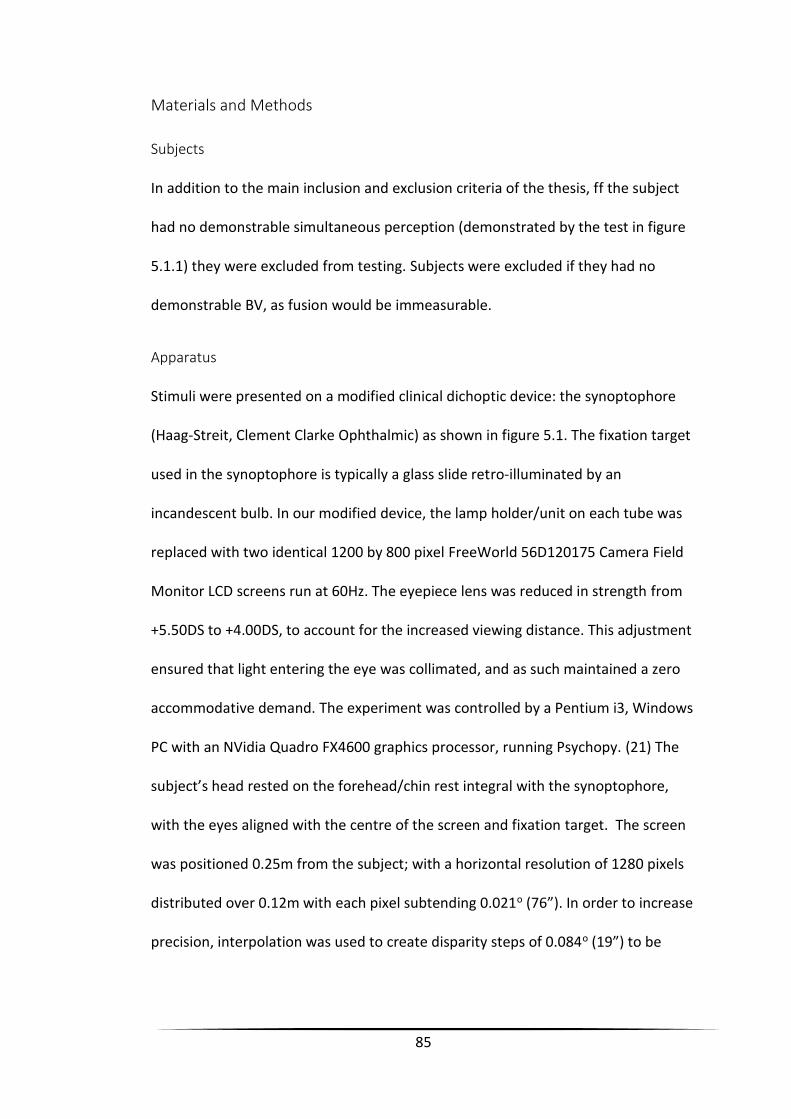
85
Materials and Methods
Subjects
In addition to the main inclusion and exclusion criteria of the thesis, ff the subject
had no demonstrable simultaneous perception (demonstrated by the test in figure
5.1.1) they were excluded from testing. Subjects were excluded if they had no
demonstrable BV, as fusion would be immeasurable.
Apparatus
Stimuli were presented on a modified clinical dichoptic device: the synoptophore
(Haag-Streit, Clement Clarke Ophthalmic) as shown in figure 5.1. The fixation target
used in the synoptophore is typically a glass slide retro-illuminated by an
incandescent bulb. In our modified device, the lamp holder/unit on each tube was
replaced with two identical 1200 by 800 pixel FreeWorld 56D120175 Camera Field
Monitor LCD screens run at 60Hz. The eyepiece lens was reduced in strength from
+5.50DS to +4.00DS, to account for the increased viewing distance. This adjustment
ensured that light entering the eye was collimated, and as such maintained a zero
accommodative demand. The experiment was controlled by a Pentium i3, Windows
PC with an NVidia Quadro FX4600 graphics processor, running Psychopy. (21) The
subject’s head rested on the forehead/chin rest integral with the synoptophore,
with the eyes aligned with the centre of the screen and fixation target. The screen
was positioned 0.25m from the subject; with a horizontal resolution of 1280 pixels
distributed over 0.12m with each pixel subtending 0.021o (76”). In order to increase
precision, interpolation was used to create disparity steps of 0.084o (19”) to be
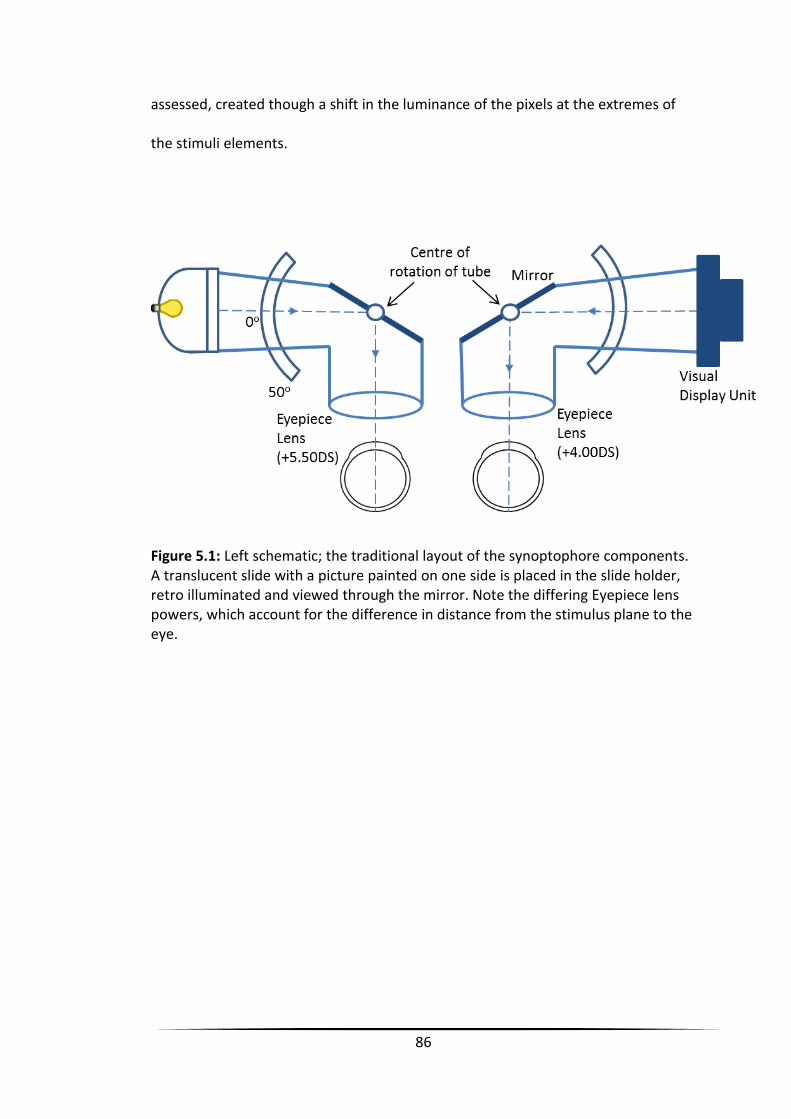
86
assessed, created though a shift in the luminance of the pixels at the extremes of
the stimuli elements.
Figure 5.1: Left schematic; the traditional layout of the synoptophore components. A translucent slide with a picture painted on one side is placed in the slide holder, retro illuminated and viewed through the mirror. Note the differing Eyepiece lens powers, which account for the difference in distance from the stimulus plane to the eye.
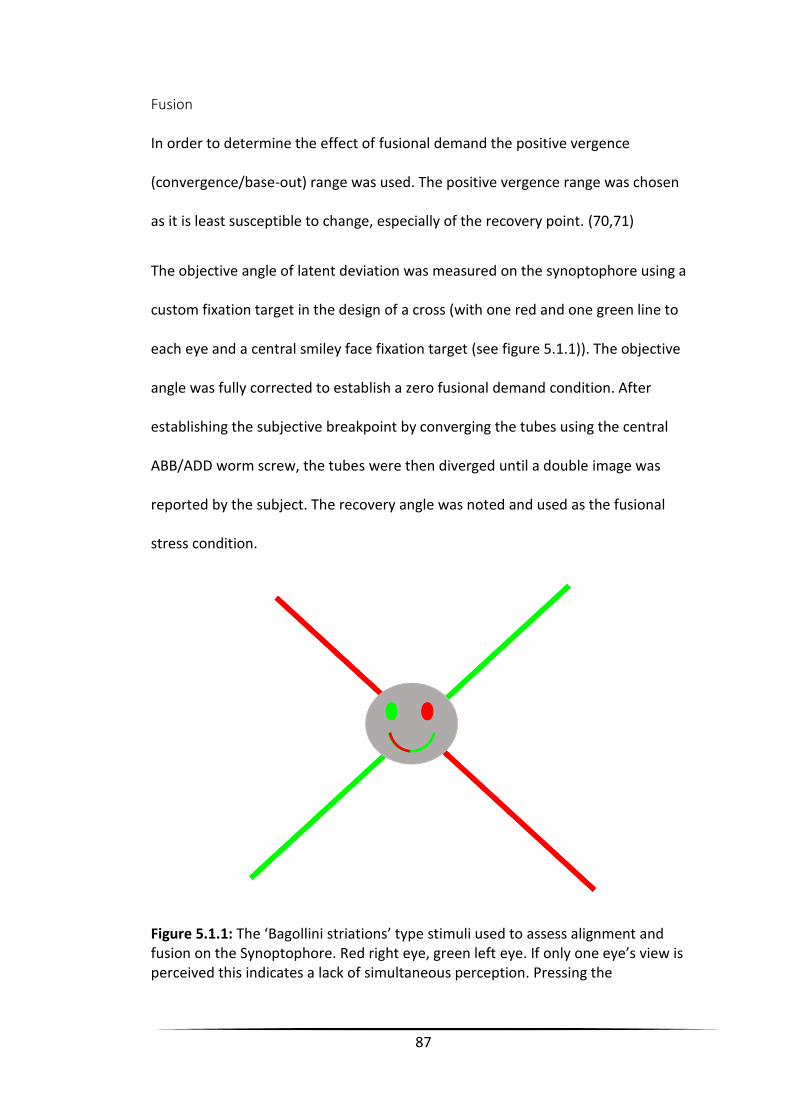
87
Fusion
In order to determine the effect of fusional demand the positive vergence
(convergence/base-out) range was used. The positive vergence range was chosen
as it is least susceptible to change, especially of the recovery point. (70,71)
The objective angle of latent deviation was measured on the synoptophore using a
custom fixation target in the design of a cross (with one red and one green line to
each eye and a central smiley face fixation target (see figure 5.1.1)). The objective
angle was fully corrected to establish a zero fusional demand condition. After
establishing the subjective breakpoint by converging the tubes using the central
ABB/ADD worm screw, the tubes were then diverged until a double image was
reported by the subject. The recovery angle was noted and used as the fusional
stress condition.
Figure 5.1.1: The ‘Bagollini striations’ type stimuli used to assess alignment and fusion on the Synoptophore. Red right eye, green left eye. If only one eye’s view is perceived this indicates a lack of simultaneous perception. Pressing the
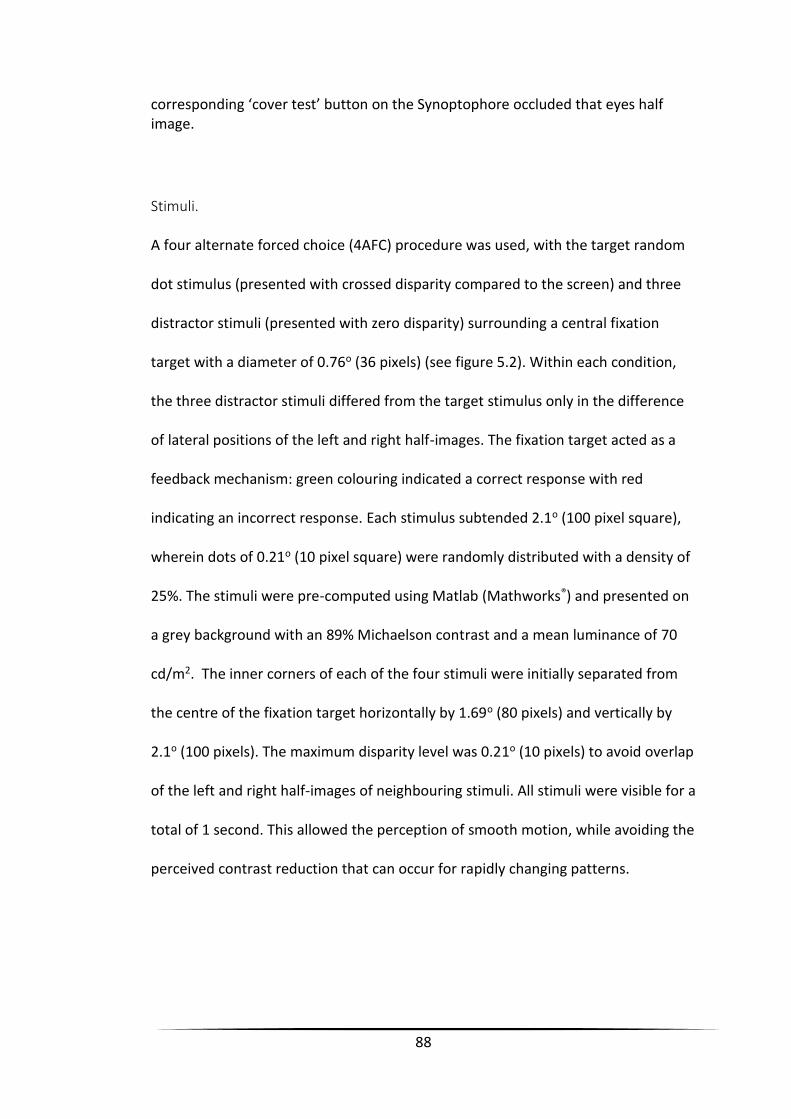
88
corresponding ‘cover test’ button on the Synoptophore occluded that eyes half image.
Stimuli.
A four alternate forced choice (4AFC) procedure was used, with the target random
dot stimulus (presented with crossed disparity compared to the screen) and three
distractor stimuli (presented with zero disparity) surrounding a central fixation
target with a diameter of 0.76o (36 pixels) (see figure 5.2). Within each condition,
the three distractor stimuli differed from the target stimulus only in the difference
of lateral positions of the left and right half-images. The fixation target acted as a
feedback mechanism: green colouring indicated a correct response with red
indicating an incorrect response. Each stimulus subtended 2.1o (100 pixel square),
wherein dots of 0.21o (10 pixel square) were randomly distributed with a density of
25%. The stimuli were pre-computed using Matlab (Mathworks®) and presented on
a grey background with an 89% Michaelson contrast and a mean luminance of 70
cd/m2. The inner corners of each of the four stimuli were initially separated from
the centre of the fixation target horizontally by 1.69o (80 pixels) and vertically by
2.1o (100 pixels). The maximum disparity level was 0.21o (10 pixels) to avoid overlap
of the left and right half-images of neighbouring stimuli. All stimuli were visible for a
total of 1 second. This allowed the perception of smooth motion, while avoiding the
perceived contrast reduction that can occur for rapidly changing patterns.
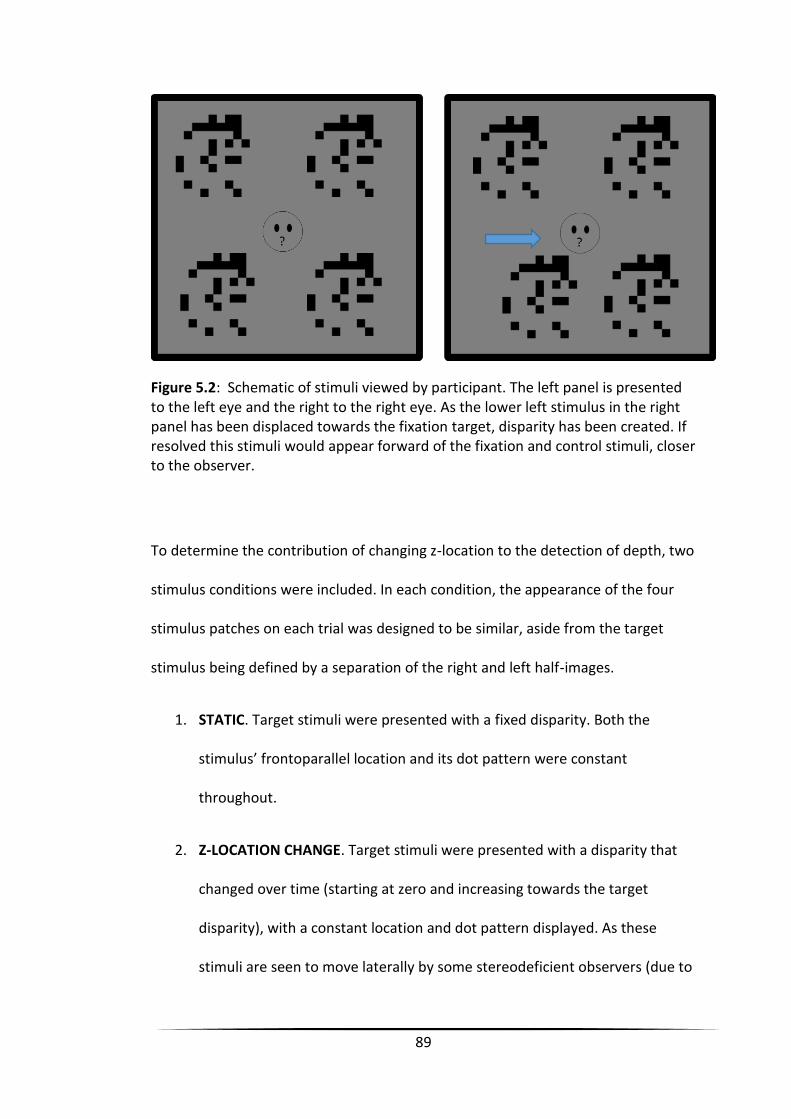
89
Figure 5.2: Schematic of stimuli viewed by participant. The left panel is presented to the left eye and the right to the right eye. As the lower left stimulus in the right panel has been displaced towards the fixation target, disparity has been created. If resolved this stimuli would appear forward of the fixation and control stimuli, closer to the observer.
To determine the contribution of changing z-location to the detection of depth, two
stimulus conditions were included. In each condition, the appearance of the four
stimulus patches on each trial was designed to be similar, aside from the target
stimulus being defined by a separation of the right and left half-images.
1. STATIC. Target stimuli were presented with a fixed disparity. Both the
stimulus’ frontoparallel location and its dot pattern were constant
throughout.
2. Z-LOCATION CHANGE. Target stimuli were presented with a disparity that
changed over time (starting at zero and increasing towards the target
disparity), with a constant location and dot pattern displayed. As these
stimuli are seen to move laterally by some stereodeficient observers (due to
90
substantial suppression of one eye’s input), to ensure that this percept
could not be used to provide the correct answer in our 4AFC task,
randomised rightward or leftward motion was added to the three distractor
stimuli. The two half-images of each individual distractor stimulus moved
simultaneously in the same direction and by the same distance as the target
stimulus’ half images.
Procedure
Once the equipment was adjusted for inter-pupillary distance, the subject’s
simultaneous perception (using the custom target), positive vergence range and
any phoria was assessed on the Synoptophore using the target pictured in figure
5.1.1. The alternate cover test was performed using the buttons on the
Synoptophore to correspond to a keyboard key press to remove the image
presented to the corresponding eye. Fusion range was assessed using the fusion
worm screw with both targets simultaneously presented (complete cross with
smiley face control). The screw was turned to converge the tubes until the subject
reported a double image, or the suppression of one eye (indicated by the
perceptual loss of the complete cross/face). The tubes were then diverged until the
complete, single percept of a face and cross returned. This was recorded as the
‘recovery’ angle.
A trial version of the experiment was run in order to familiarise the subject with the
task, this involved completing a single staircase of the STATIC and Z-LOCATION
CHANGE in habitual primary position.
91
The experiment was performed under standard clinical lighting conditions. The
subjects received standardised instructions to maintain fixation on the central
target, and to use a response box (formatted in the same layout as targets on the
screen) to “choose the patch that appears closest to you in space”.
The order of testing was balanced between the four conditions, STATIC Stressed &
Unstressed, Z-LOCATION CHANGE Stressed and Unstressed.
Threshold estimation
A total of four variations were tested in a blocked format; STATIC or Z-LOCATION
CHANGE in either with or without fusional stress. Three thresholds were estimated
for each condition by separate staircases (Multistair handler functional of
Psychopy), (21) starting at 0.08o, 0.06o and 0.004o respectively. The initial step size
was 0.04o, which after one reversal reduced to 0.02o. After a further two reversals
the step size was reduced to the minimum step size of 0.004o. A three-down-one-
up method was used so that the staircase converged to a performance of 79.4%
correct. (22) Thresholds were calculated as previous chapters.
Statistical Analysis
A 2x2 ANOVA was performed to examine the factorial combination of the two
independent variables of depth (fixed/changing) and fusional stress (zero/recovery
point). Only subjects who provided a reliable response in every condition were
included in the ANOVA. Persons product moment correlation was performed to
assess if any relationship existed between the variable angle of fusional recovery
and stereoacuity levels with no fusional stress induced.
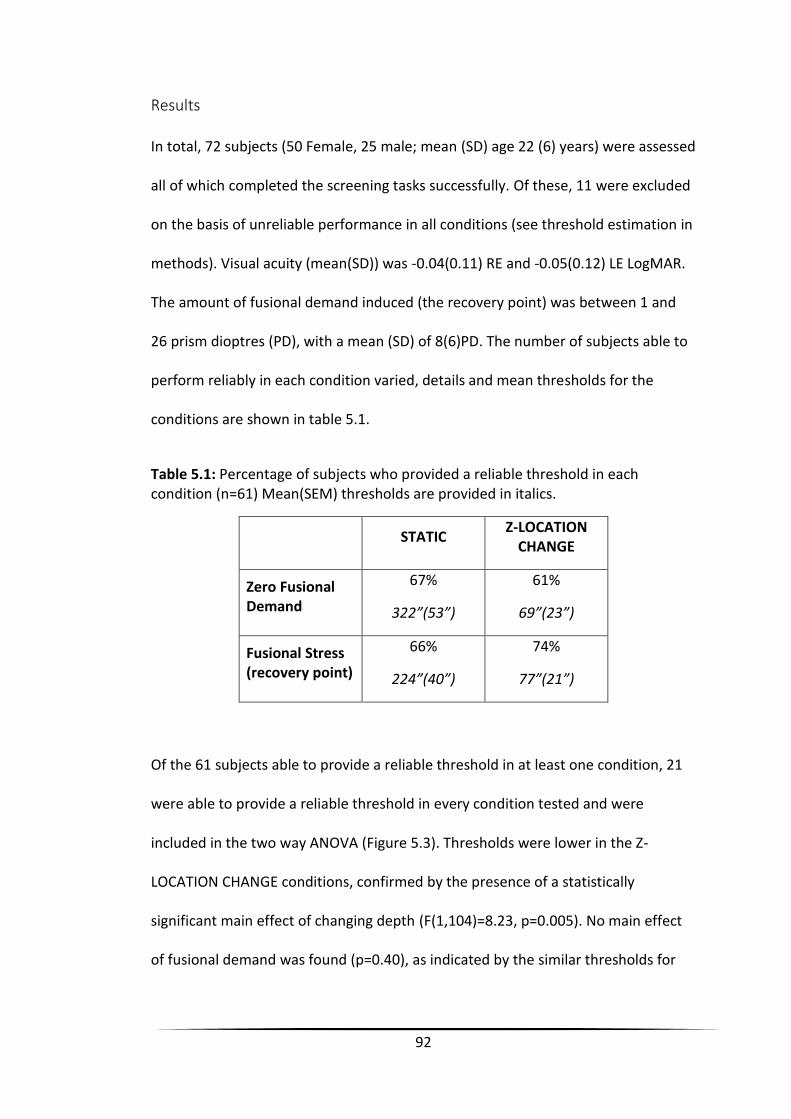
92
Results
In total, 72 subjects (50 Female, 25 male; mean (SD) age 22 (6) years) were assessed
all of which completed the screening tasks successfully. Of these, 11 were excluded
on the basis of unreliable performance in all conditions (see threshold estimation in
methods). Visual acuity (mean(SD)) was -0.04(0.11) RE and -0.05(0.12) LE LogMAR.
The amount of fusional demand induced (the recovery point) was between 1 and
26 prism dioptres (PD), with a mean (SD) of 8(6)PD. The number of subjects able to
perform reliably in each condition varied, details and mean thresholds for the
conditions are shown in table 5.1.
Table 5.1: Percentage of subjects who provided a reliable threshold in each condition (n=61) Mean(SEM) thresholds are provided in italics.
STATIC Z-LOCATION
CHANGE
Zero Fusional Demand
67%
322”(53”)
61%
69”(23”)
Fusional Stress (recovery point)
66%
224”(40”)
74%
77”(21”)
Of the 61 subjects able to provide a reliable threshold in at least one condition, 21
were able to provide a reliable threshold in every condition tested and were
included in the two way ANOVA (Figure 5.3). Thresholds were lower in the Z-
LOCATION CHANGE conditions, confirmed by the presence of a statistically
significant main effect of changing depth (F(1,104)=8.23, p=0.005). No main effect
of fusional demand was found (p=0.40), as indicated by the similar thresholds for
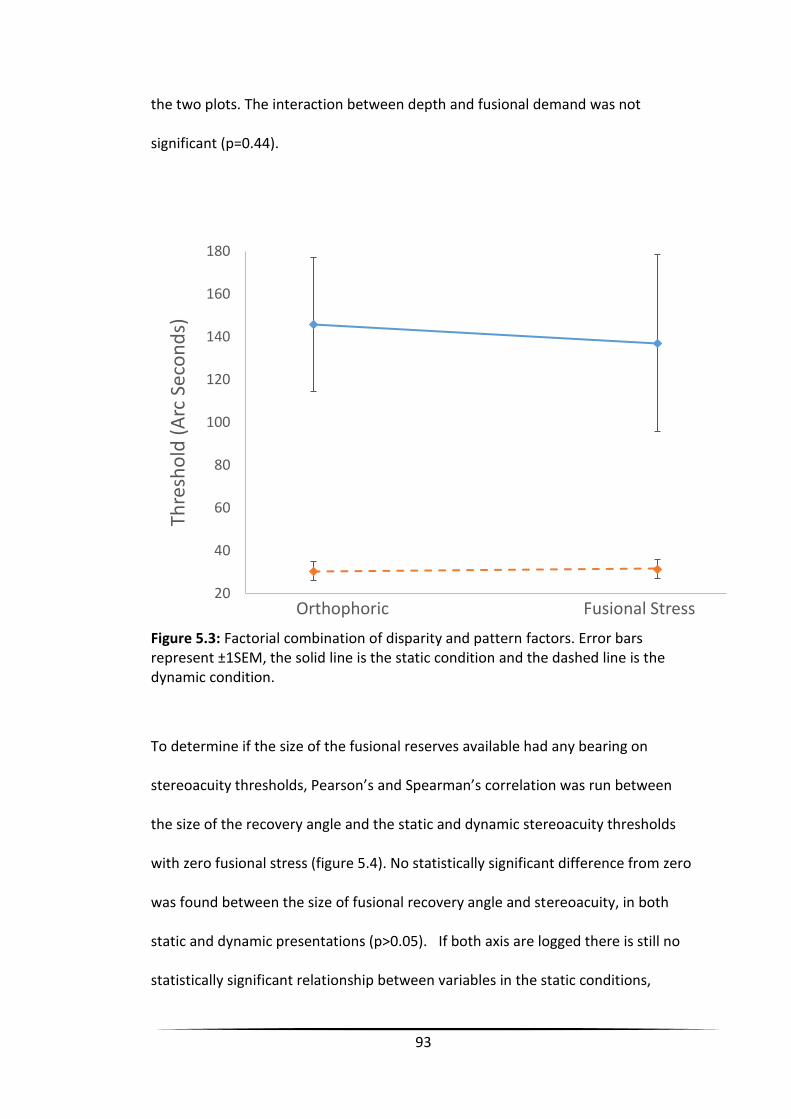
93
the two plots. The interaction between depth and fusional demand was not
significant (p=0.44).
Figure 5.3: Factorial combination of disparity and pattern factors. Error bars represent ±1SEM, the solid line is the static condition and the dashed line is the dynamic condition.
To determine if the size of the fusional reserves available had any bearing on
stereoacuity thresholds, Pearson’s and Spearman’s correlation was run between
the size of the recovery angle and the static and dynamic stereoacuity thresholds
with zero fusional stress (figure 5.4). No statistically significant difference from zero
was found between the size of fusional recovery angle and stereoacuity, in both
static and dynamic presentations (p>0.05). If both axis are logged there is still no
statistically significant relationship between variables in the static conditions,
20
40
60
80
100
120
140
160
180
Thre
sho
ld (
Arc
Sec
on
ds)
Orthophoric Fusional Stress
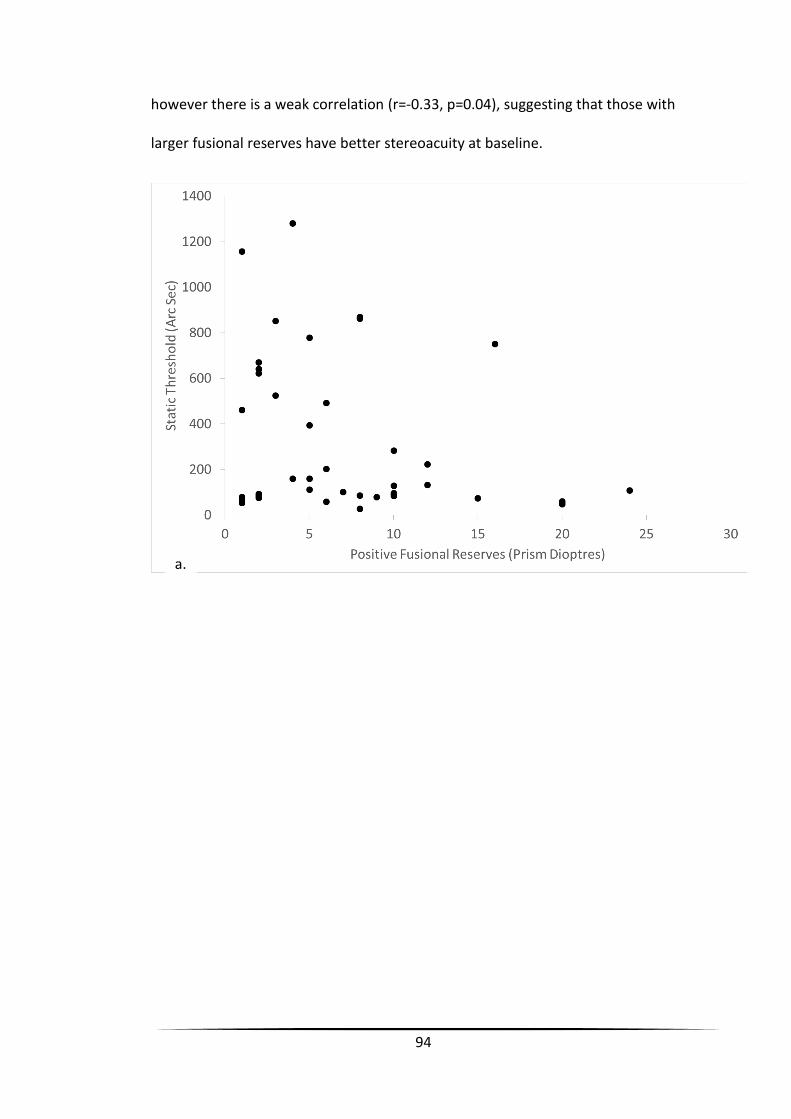
94
however there is a weak correlation (r=-0.33, p=0.04), suggesting that those with
larger fusional reserves have better stereoacuity at baseline.
a.
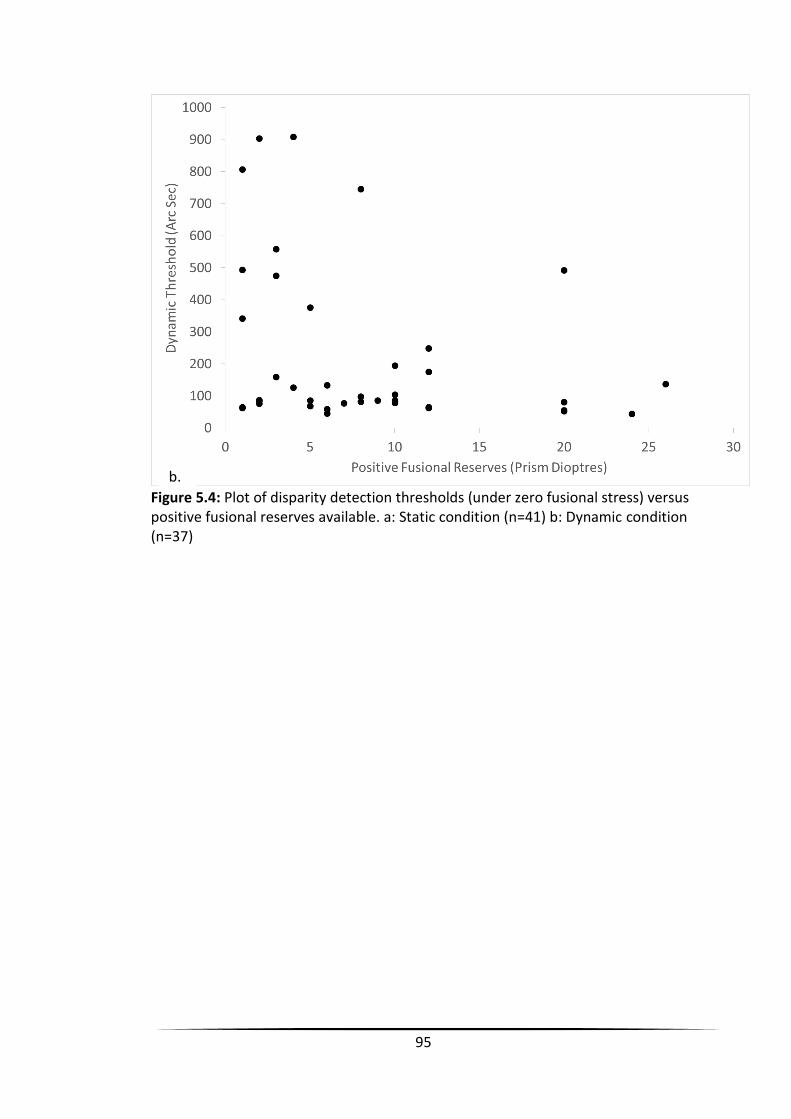
95
Figure 5.4: Plot of disparity detection thresholds (under zero fusional stress) versus positive fusional reserves available. a: Static condition (n=41) b: Dynamic condition (n=37)
b.
96
Discussion
There is no statistically significant difference between stereoacuity thresholds in
the fusional stress and zero fusional demand conditions, for both static and
dynamic presentations. This indicates that fusional stress up to the recovery angle
does not affect stereoacuity thresholds. Whilst the size of recovery angle varied in
the population tested, the size of the recovery angle had no relationship with
stereoacuity threshold measured; showing that as long as a phoria is well
controlled, stereoacuity levels will not be affected by the fusional load. This
supports the assertion by Worth (1901); if fusion is achieved, stereopsis is typically
apparent, (60) and findings that stereoacuity is either normal or absent in
intermittent exotropia. (72) We demonstrate that the presentations with changing
disparity result in lower thresholds than static presentations, in line with previous
findings (9,10,35)
Our results differ at first glance, to those found by Laird et al. where a ‘reduced’
level of stereoacuity was found in up to 92% and 56% of subjects tested with the
FD2 and DR at the point where single vision occurred (the fusional recovery point).
(66) The recovery point was much higher (median (IQR) 20(4) PD) than in the
present study (mean (SD) 8(6) PD), which may be due to the differing methods
used. Laird et al. used prisms in free space, where peripheral cues were available to
aid fusion, whereas the current study used a dissociative central target (custom
Bagollini striations on the synoptophore). When the study by Laird et al. was
repeated encompassing the hysteresis effect (increasing the strength of prisms

97
from nil up to 40 PD), fusion was maintained with good stereoacuity by all but one
of the 20 subjects, until the first significant drop in stereoacuity to 200” by to 10%
of subjects at 30 PD on the FD2 and 20% at 35 PD on the DR. A worsening of
stereoacuity (from 60” to 100”) was reported earlier at 6 PD (FD2) and 16 PD (DR)
for one of the subjects, but as previously noted, this worsening does not represent
a real change in stereoacuity using these clinical tests. (67-69) The variation
between subjects who demonstrated a reduction in stereoacuity and those who did
not in these studies could be attributed to variation in the impact of fusional stress.
Fusional stress of 10 PD may appear to be controlled by two individuals, but the
demand on vergence systems may differ. The hysteresis effect may have been
employed to achieve fusion at 10 PD by one individual with a recovery or re-fusion
point of 8 PD, whereas the recovery point for another individual could be 20 PD.
Both of these individuals were able to fuse 10 PD, but may provide differing
stereoacuity results, based on fusional demands; the individual with a re-fusion
point of 8PD would have less control at 10PD, than the individual that had good
control up to 20 PD. The use of the recovery angle to introduce fusional stress in
the present study, aimed to control these discrepancies, using a stable point
relative between individuals.
The amount of fusional demand induced based on recovery points of the fusion
range were between one and 26 PD. By comparing the size of recovery angle to the
baseline stereoacuity, we determined that there was no relationship between the
98
two. This further demonstrates that stereoacuity is unaffected by well controlled
fusional demand.
As the amount of disparity increases during presentation in the dynamic condition,
the effect of changing the stimuli position on the retina did not result in raised
thresholds, in either the stressed or unstressed condition. This could suggest that it
is unlikely that the visual system requires the ability to finely control ocular
movements to maintain fine stereopsis as previously suggested, (61) however, it is
possible that our participants were able to track the stimulus in depth via additional
vergences movements, despite the 1s presentation time and fixation on the central
target.
Another major factor that differed between this study and previous studies is the
use of a computer controlled staircase procedure to determine stereoacuity level.
In combination with the ability to present a higher number of disparity levels than
available in book based clinical testing, the randomisation of the order of testing to
avoid adaption bias (to the induced angle), any clinician bias and order of testing
biases, the threshold measured is more reliable than that achieved with clinical
testing. This allowed us to statistically compare the levels of stereoacuity directly,
increasing sensitivity to any change in threshold.
These findings show that inducing stress to fusional control at the recovery limit of
fusion does not result in reduced stereoacuity thresholds. Inducing fusional stress
99
beyond this amount may result in a reduction of stereoacuity thresholds, however
this would employ the hysteresis effect, which is unlikely to be accessible by
individuals with intermittent distance exotropia, more likely in the case of
decompensating phorias, where the limits of control are noticeably reached.
100
Chapter Six – Control experiments
Chapter six consists of a series of small experiments designed to investigate
potential confounds within the main experiments. These are: the presence of
spurious temporal correlations in the spatial correspondence only (CDOT)
conditions, and differences in target patch speeds as a result of carrying the
disparity level with a fixed presentation time. A further two experiments investigate
the effect of varying the ratio of CDOT and IOVD cues present in the stimuli,
including ‘reconstituting’ the isolated IOVD and CDOT cues.
Chapter 6a – Spurious Temporal Correlation
To isolate the CDOT or IOVD cues, stimuli have been designed to deliver a clear
peak in the cross-correlation, either for spatial correlation between the eyes, or
temporally in each eye, but not both.
In the case of an IOVD stimuli, spurious spatial correlations can occur which may
contribute to an improvement in threshold. (2,38) The inclusion of these random
correlations are unavoidable in the IOVD stimuli, as the stimuli pattern must be
constant in order to preserve temporal correlation between the eyes. However, any
spurious spatial correlation would appear as a ‘cloud’ of disparity, of both crossed
and uncrossed configurations, with no clear signal to depth. The findings of chapter
four show the largest thresholds (if achieved at all) are recorded for the IOVD
condition (CONTROL), with the CDOT only cue providing lower thresholds (Z-
101
LOCATION + PATTERN CHANGE). This suggests that the presence of spurious spatial
disparity signals were not informative to the detection of depth.
The findings of chapter four however, also show that the lowest thresholds
achieved are in the Z-LOCATION CHANGE only conditions, where both CDOT and
IOVD cues are present. As we show that a pattern change has no significant effect
on depth detection thresholds, the presence of the IOVD signal may contribute to
the lower thresholds recorded. It is possible that spurious temporal information is
included in the Z-LOCATION + PATTERN CHANGE stimuli, as well as other CDOT
stimuli used in other studies. (73) It is speculated that because the CDOT signal
appears to be more powerful than the IOVD signal (lower thresholds), (2) any
spurious temporal correlations won’t have an effect.
The aim of this chapter is to investigate whether any spurious temporal correlations
improve an individual’s disparity detection threshold, by comparing a CDOT stimuli,
to a CDOT stimuli where the potential for temporal correlation is eliminated. As any
signalled temporal change would be larger at a closer viewing distance the
comparisons were repeated at 3m and 1.5m.
Materials and Methods
Stimulus Design
Each pattern consisted of 25 black dots arranged in a 10 by 10 grid, with each grid
subtending 0.5o. The dots subtended 0.05o and were randomly distributed in one
set of the stimuli (CDOT Random).
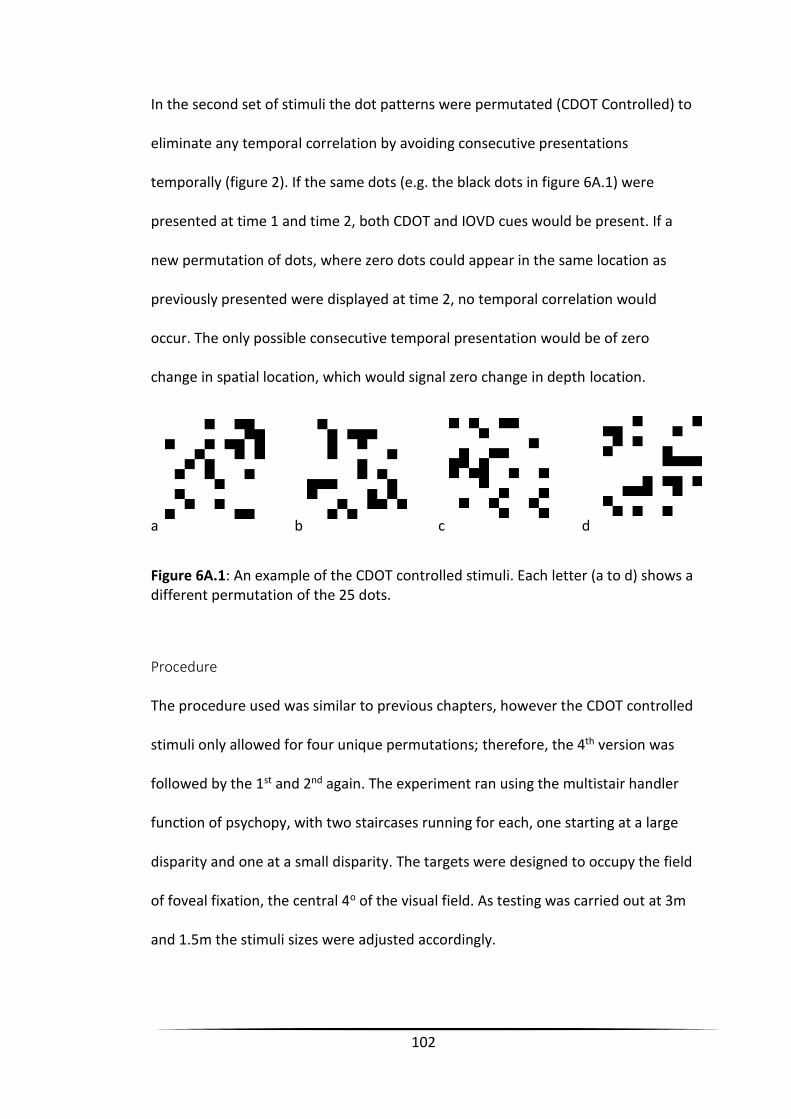
102
In the second set of stimuli the dot patterns were permutated (CDOT Controlled) to
eliminate any temporal correlation by avoiding consecutive presentations
temporally (figure 2). If the same dots (e.g. the black dots in figure 6A.1) were
presented at time 1 and time 2, both CDOT and IOVD cues would be present. If a
new permutation of dots, where zero dots could appear in the same location as
previously presented were displayed at time 2, no temporal correlation would
occur. The only possible consecutive temporal presentation would be of zero
change in spatial location, which would signal zero change in depth location.
a b c d
Figure 6A.1: An example of the CDOT controlled stimuli. Each letter (a to d) shows a different permutation of the 25 dots.
Procedure
The procedure used was similar to previous chapters, however the CDOT controlled
stimuli only allowed for four unique permutations; therefore, the 4th version was
followed by the 1st and 2nd again. The experiment ran using the multistair handler
function of psychopy, with two staircases running for each, one starting at a large
disparity and one at a small disparity. The targets were designed to occupy the field
of foveal fixation, the central 4o of the visual field. As testing was carried out at 3m
and 1.5m the stimuli sizes were adjusted accordingly.
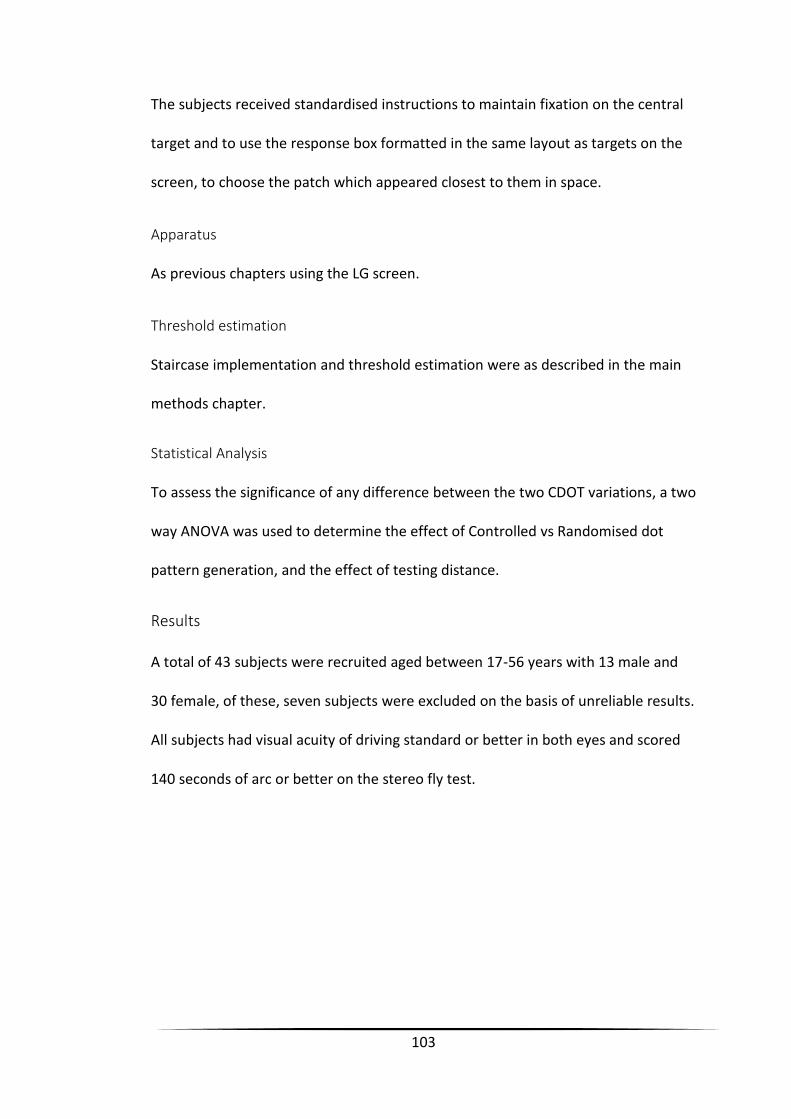
103
The subjects received standardised instructions to maintain fixation on the central
target and to use the response box formatted in the same layout as targets on the
screen, to choose the patch which appeared closest to them in space.
Apparatus
As previous chapters using the LG screen.
Threshold estimation
Staircase implementation and threshold estimation were as described in the main
methods chapter.
Statistical Analysis
To assess the significance of any difference between the two CDOT variations, a two
way ANOVA was used to determine the effect of Controlled vs Randomised dot
pattern generation, and the effect of testing distance.
Results
A total of 43 subjects were recruited aged between 17-56 years with 13 male and
30 female, of these, seven subjects were excluded on the basis of unreliable results.
All subjects had visual acuity of driving standard or better in both eyes and scored
140 seconds of arc or better on the stereo fly test.
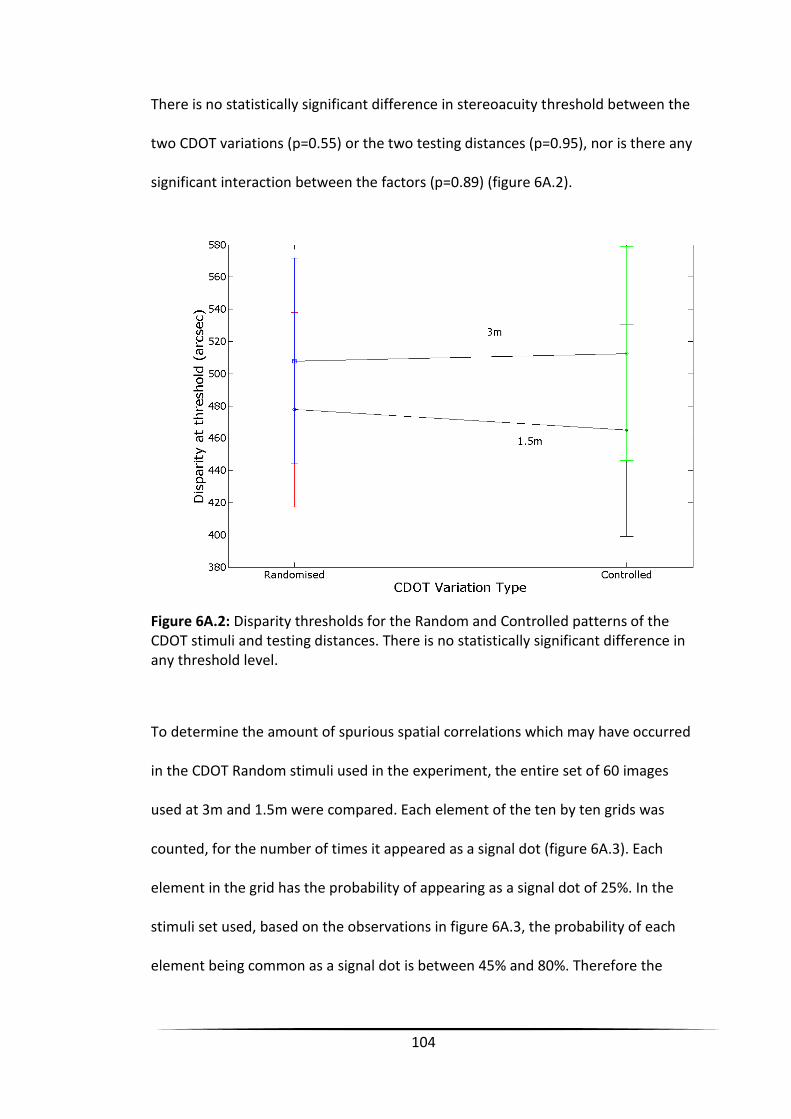
104
There is no statistically significant difference in stereoacuity threshold between the
two CDOT variations (p=0.55) or the two testing distances (p=0.95), nor is there any
significant interaction between the factors (p=0.89) (figure 6A.2).
Figure 6A.2: Disparity thresholds for the Random and Controlled patterns of the CDOT stimuli and testing distances. There is no statistically significant difference in any threshold level.
To determine the amount of spurious spatial correlations which may have occurred
in the CDOT Random stimuli used in the experiment, the entire set of 60 images
used at 3m and 1.5m were compared. Each element of the ten by ten grids was
counted, for the number of times it appeared as a signal dot (figure 6A.3). Each
element in the grid has the probability of appearing as a signal dot of 25%. In the
stimuli set used, based on the observations in figure 6A.3, the probability of each
element being common as a signal dot is between 45% and 80%. Therefore the
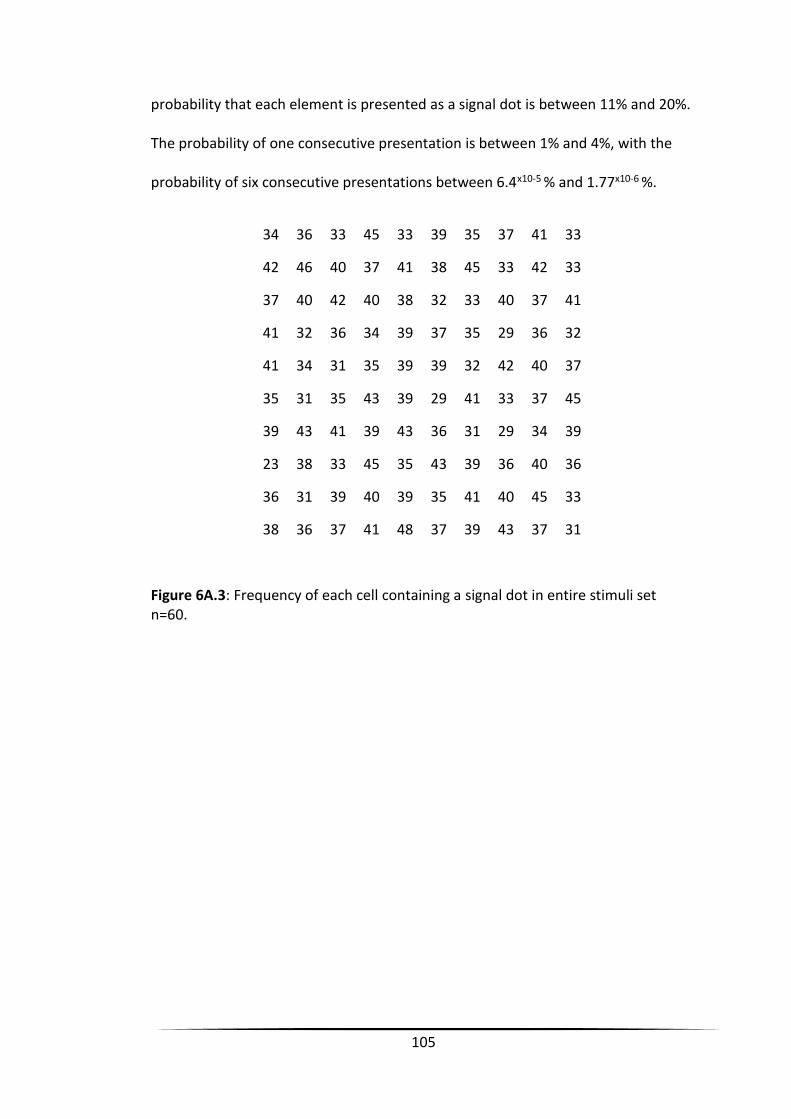
105
probability that each element is presented as a signal dot is between 11% and 20%.
The probability of one consecutive presentation is between 1% and 4%, with the
probability of six consecutive presentations between 6.4x10⁻⁵ % and 1.77x10⁻⁶ %.
34 36 33 45 33 39 35 37 41 33
42 46 40 37 41 38 45 33 42 33
37 40 42 40 38 32 33 40 37 41
41 32 36 34 39 37 35 29 36 32
41 34 31 35 39 39 32 42 40 37
35 31 35 43 39 29 41 33 37 45
39 43 41 39 43 36 31 29 34 39
23 38 33 45 35 43 39 36 40 36
36 31 39 40 39 35 41 40 45 33
38 36 37 41 48 37 39 43 37 31
Figure 6A.3: Frequency of each cell containing a signal dot in entire stimuli set n=60.
106
As the recognition of motion in depth is improved in many individuals when IOVD is
present(2,3) the subjects were divided into those who performed better with the
presence of IOVD and those who performed better in the absence of the IOVD cue.
There was no significant difference found (p>0.15) between these groups at 1.5m
or 3m.
Discussion
This experiment suggests that any spurious temporal correlations that randomly
occur during the generation of stimuli for the isolation of changing disparity over
time, do not provide an additionally useful cue for the extraction of depth
information. Whilst the presence of spurious spatial correlations in the display of
interocular velocity difference stimuli have been previously described as a
beneficial for the recognition of motion in depth, it appears that any random
appearance of a temporal cue in a changing disparity over time stimuli has no
significant effect.
These data show that there is no significant effect on stereoacuity threshold of
varying test distance between 3m and 1.5m. Whilst the difference in
accommodative demand is only +0.50DS and the closer distance is not considered a
‘near’ test, it is still within the range of the Frisby StereotestTM, which is considered
a ‘near’ vision test (range of 0.3 to 1.5m). The Frisby test tends to provide a
threshold of 15” higher than the distance version, the FD2, (46) and whilst this may
be attributed to the limited testing range of the FD2, the tests also differ in their
design. The Frisby test is a location identification task, with the disparity target
107
circle defined by a number of small shapes (multiple boundaries), the other is a
shape identification task, with the disparity target a solid shape with only one
boundary. The assessment of threshold stereoacuity used in this study was identical
in design for each distance tested; include the size of the test stimuli, which was
kept consistent with testing distance. Whilst the distances tested were limited, and
with the changes in distance unlikely to affect any underlying binocular alignment
problems, these data suggest that stereoacuity thresholds do not vary over
distance.
Previous studies have shown that stereoacuity thresholds increased as viewing
distance decreased from 57cm to 28.5cm, a limit which the authors attribute to a
minimum physical depth, based on the high-level combination of multiple depth
cues. (74) Other authors consider this data further and discuss that stereoscopic
thresholds are elevated in the presence of vergences variability and fixation
disparity, (75) at first glance, in contradiction to my findings in chapter five.
However, the effect of thresholds increasing with a close viewing distance appears
only to have an effect below 57cm. Indeed, this is supported by earlier work which
demonstrated no change in stereoscopic acuity beyond 50cm. (76) These studies
support the finding of no effect of varying test distance between 150 and 300cm.
The probabilities discussed in the results section, are directly applicable to the
‘random CDOT’ stimuli used in the experiment, which were generated using the
uniform distributer pseudo-randomisation function of MATLAB, however, the
probabilities will apply to other randomly created stimuli (using the default random
number generator seed). Given the uniform nature of the randomisation function,

108
it can be concluded that the presence between two frames of 1% to 4% of temporal
correlation is insufficient to benefit the detection of motion in depth. Even if these
percentages of the IOVD cue benefited the detection of motion in depth, the
probability of temporal correlation across numerous frames is highly improbable.
It is possible that the population tested were insensitive to the IOVD cue to depth,
as it has been previously shown that individuals can have a bias towards being able
to use a particular cue. (2) This is further supported by the results of chapter four,
which shows that out of 127 subjects only 11 were able to perform reliably in this
condition, with the majority only providing the ceiling value as threshold level.
Chapter 6B – Rate of change of disparity
The rate of disparity change, or equivalently the speed along the z-axis, varied in all
previous experiments depending on the target disparity level of the trial being
tested. The presentation time was always fixed at 1 second, therefore all changes in
z-position had to occur within this time resulting in a range of speeds; the larger the
disparity the more rapid the change in depth. There are situations in which the
CDOT and IOVD mechanisms might differ in their utility; it has been suggested that
IOVD is an important cue for speed discrimination. (3,77-79) This however is
suggested to favour higher speeds of motion in depth, of above 1800” per second.
(73) The maximum thresholds tested in the one second presentation time were
543”, which suggests that any effect should not be marked.
To assess this effect an experiment was designed to determine if the rate of change
of disparity (Z-location change) determined depth detection thresholds.
109
Materials and Methods
Ethical approval and inclusion/exclusion criteria were as previous.
Apparatus
As Previous
Stimuli
The experiment included two main conditions, an isolation of the CDOT cue
(CHANGING DISPARITY, CHANGING PATTERN – see chapter 4) and an isolation of
the IOVD cue (CONTROL – see chapter 4). Each of these were tested at four
different speeds (rate of Z-location change); 450, 900, 1800 and 3600 arc seconds
per second. The lack of binocular correlation means that there is no coherent
disparity in the IOVD condition, which should make a depth identification task
impossible. However, the dots of the stimuli on the left and right retinae move in
the same way as they would in the CDOT conditions to reach their target relative
displacement, so the rate of change and displacement will be considered
analogous. An important difference in this experiment is that the number of stimuli
patches/changes in on screen disparity was halved to three instead of the six used
in the rest of this thesis.
Threshold estimation
Three staircases were run for each of the speeds within conditions; one starting
with a high (1692”), medium (1354”) and low (1015”) disparity. Step sizes for the
eight reversals were in order 846”, 846”, 338”, 338”, 169”, 169”, 169” and 169”. A

110
three up-one-down procedure was used;(22) after three consecutive correct
responses the disparity level was decreased, after one incorrect response the
disparity level was increased. A total of eight reversals were required for each
staircase to end. If after 150 trials, the required number of reversals were not met
an interval was offered to the subject. The conditions were blocked in relation to
either containing the CDOT or IOVD only, but the three staircases and different
speeds were interleaved randomly.
Procedure
At all times, subjects wore their habitual correction appropriate for distance
underneath the polarising glasses with the +3.00 DS add.
Statistical Analysis
To assess the significance of any effect of speed on depth detection thresholds,
linear regression was used. The same inclusion and psychometric fitting procedure
was used as in all previous experiments.
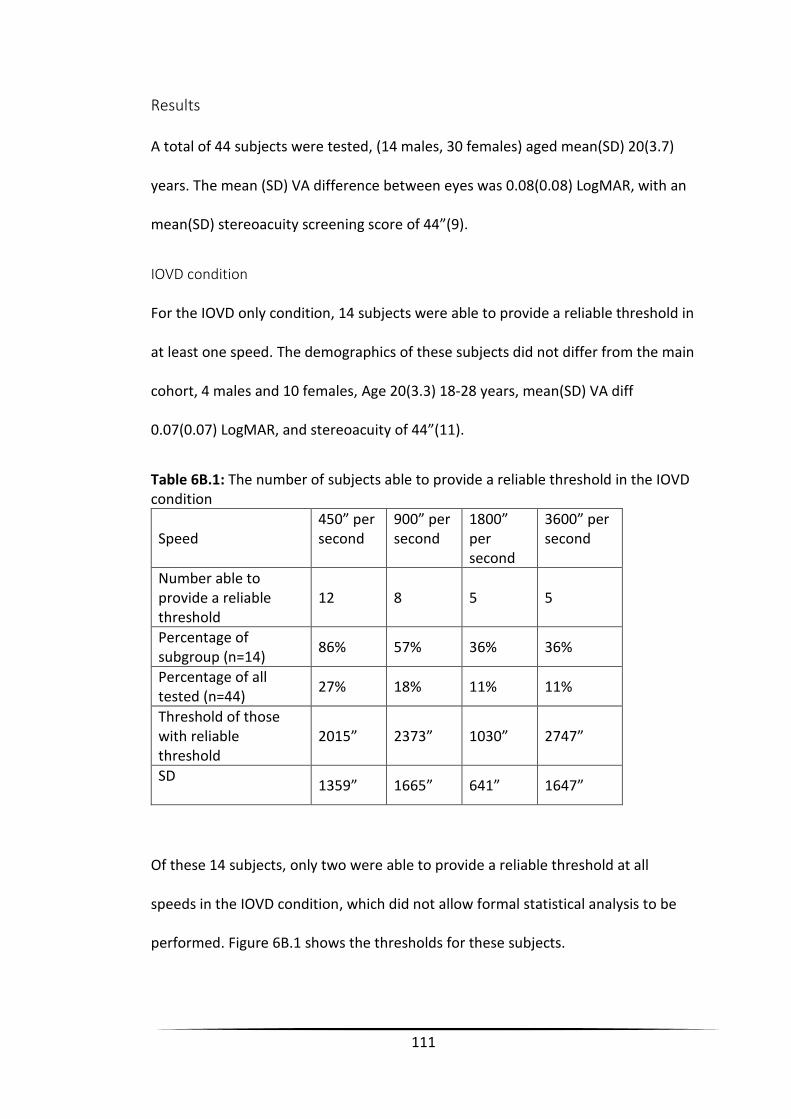
111
Results
A total of 44 subjects were tested, (14 males, 30 females) aged mean(SD) 20(3.7)
years. The mean (SD) VA difference between eyes was 0.08(0.08) LogMAR, with an
mean(SD) stereoacuity screening score of 44”(9).
IOVD condition
For the IOVD only condition, 14 subjects were able to provide a reliable threshold in
at least one speed. The demographics of these subjects did not differ from the main
cohort, 4 males and 10 females, Age 20(3.3) 18-28 years, mean(SD) VA diff
0.07(0.07) LogMAR, and stereoacuity of 44”(11).
Table 6B.1: The number of subjects able to provide a reliable threshold in the IOVD condition
Speed 450” per second
900” per second
1800” per second
3600” per second
Number able to provide a reliable threshold
12 8 5 5
Percentage of subgroup (n=14)
86% 57% 36% 36%
Percentage of all tested (n=44)
27% 18% 11% 11%
Threshold of those with reliable threshold
2015” 2373” 1030” 2747”
SD
1359” 1665” 641” 1647”
Of these 14 subjects, only two were able to provide a reliable threshold at all
speeds in the IOVD condition, which did not allow formal statistical analysis to be
performed. Figure 6B.1 shows the thresholds for these subjects.
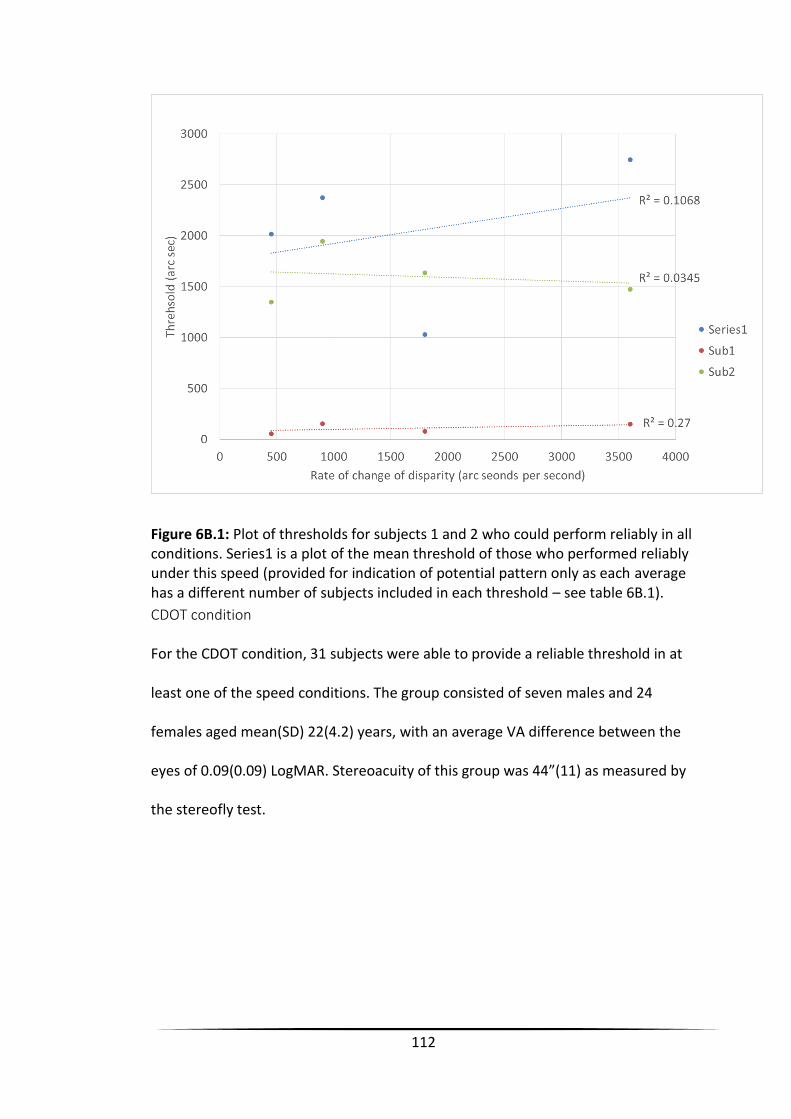
112
Figure 6B.1: Plot of thresholds for subjects 1 and 2 who could perform reliably in all conditions. Series1 is a plot of the mean threshold of those who performed reliably under this speed (provided for indication of potential pattern only as each average has a different number of subjects included in each threshold – see table 6B.1).
CDOT condition
For the CDOT condition, 31 subjects were able to provide a reliable threshold in at
least one of the speed conditions. The group consisted of seven males and 24
females aged mean(SD) 22(4.2) years, with an average VA difference between the
eyes of 0.09(0.09) LogMAR. Stereoacuity of this group was 44”(11) as measured by
the stereofly test.
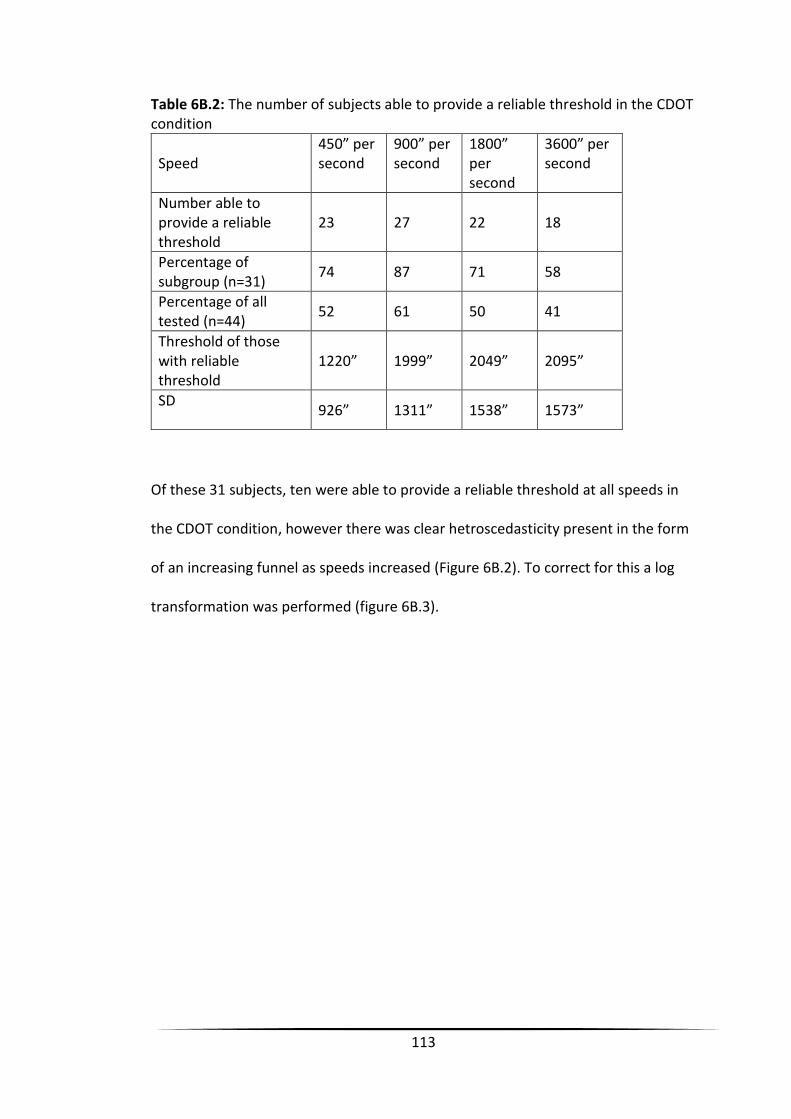
113
Table 6B.2: The number of subjects able to provide a reliable threshold in the CDOT condition
Speed 450” per second
900” per second
1800” per second
3600” per second
Number able to provide a reliable threshold
23 27 22 18
Percentage of subgroup (n=31)
74 87 71 58
Percentage of all tested (n=44)
52 61 50 41
Threshold of those with reliable threshold
1220” 1999” 2049” 2095”
SD
926” 1311” 1538” 1573”
Of these 31 subjects, ten were able to provide a reliable threshold at all speeds in
the CDOT condition, however there was clear hetroscedasticity present in the form
of an increasing funnel as speeds increased (Figure 6B.2). To correct for this a log
transformation was performed (figure 6B.3).
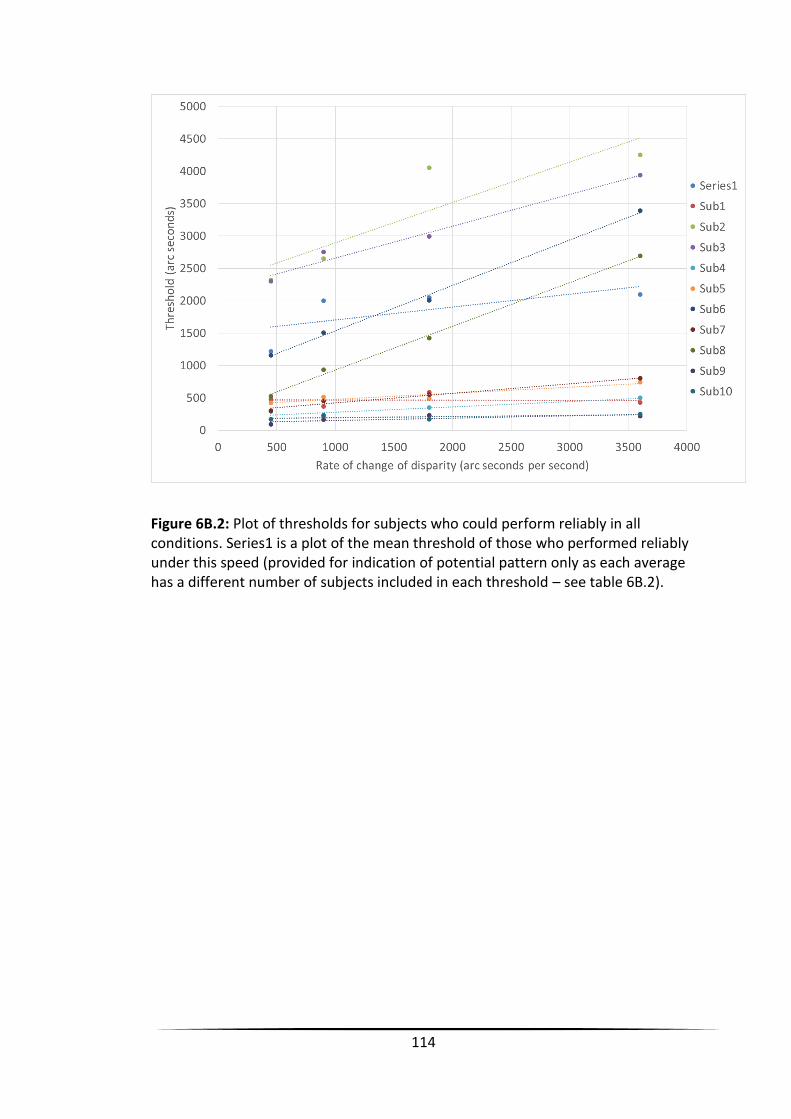
114
Figure 6B.2: Plot of thresholds for subjects who could perform reliably in all conditions. Series1 is a plot of the mean threshold of those who performed reliably under this speed (provided for indication of potential pattern only as each average has a different number of subjects included in each threshold – see table 6B.2).
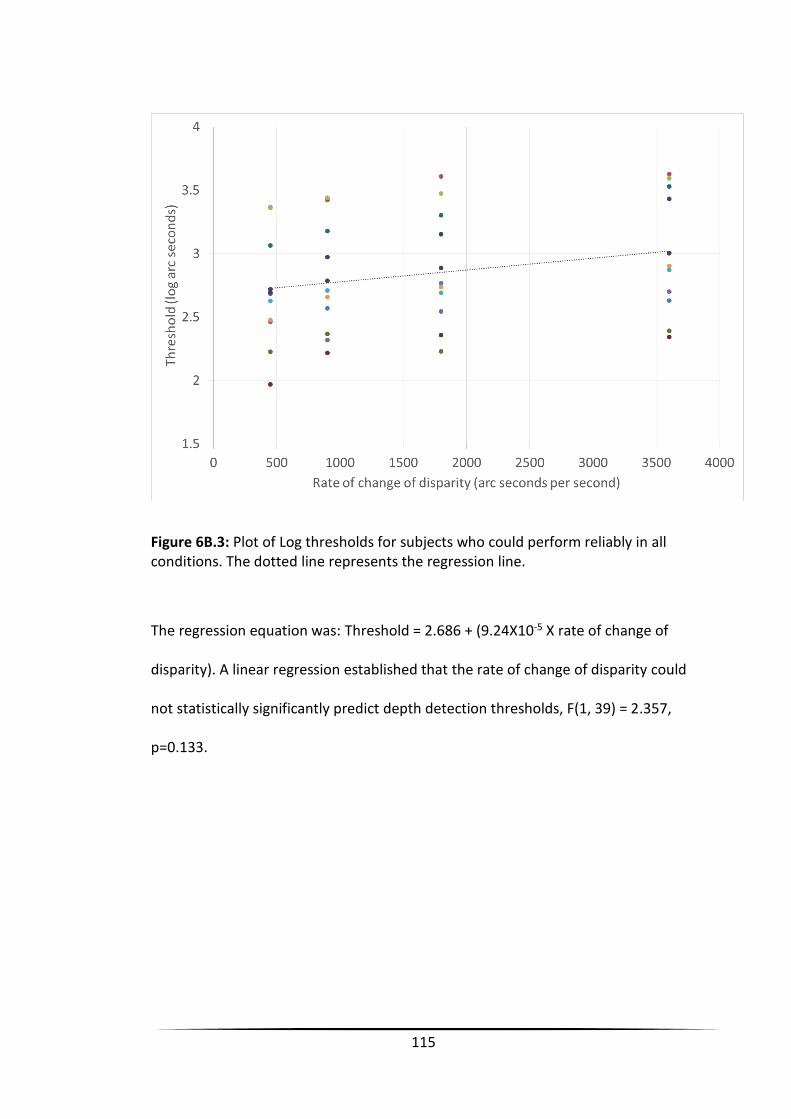
115
Figure 6B.3: Plot of Log thresholds for subjects who could perform reliably in all conditions. The dotted line represents the regression line.
The regression equation was: Threshold = 2.686 + (9.24X10⁻⁵ X rate of change of
disparity). A linear regression established that the rate of change of disparity could
not statistically significantly predict depth detection thresholds, F(1, 39) = 2.357,
p=0.133.
116
Discussion
This experiment demonstrated no effect of the rate of change of disparity on
threshold, and confirmed previous findings of lower thresholds in the CDOT
condition versus the IOVD condition. These results are limited however by the small
number of participants able to perform reliably in all conditions. There are a
number of unique features in this experiment compared to previous chapters that
may have contributed to a low rate of reliable response.
The close proximity of the screen, and reduction to three from six different
patterns/on screen disparities was necessary as the screen refresh rate was limited
to 60Hz. This close proximity, even with the provision of optical correction, was
anecdotally uncomfortable for the participants and may have reduced
concentration during testing. Any subject with a weakness of convergence may
have found this task especially difficult. It is unlikely that reducing to three
presentations would have an impact on the perception of depth, as with only two
frames, the percept is clearly recognisable. (1,2)
As a greater amount of the participants’ visual field was taken up by the display,
(even though all experiments were performed in darkness) peripheral fusion may
have been hampered by the lack of cues. This was also the case in chapter five, as
only central fusion was employed when using the synoptophore. However chapter
five did show that even under duress from fusional stress, stereoacuity levels are
unaffected.
The rate of change of disparity varied over a relatively small range. Slower speeds
were assessed during the pilot phase of this experiment, but the length of the trial
117
was deemed too long. Faster speeds were not possible due to the low refresh rate
of the display used in all experiments.
It is possible that participants were blind to stereo motion, however, stereo motion
suppression, if an issue, would only effect small disparities near threshold. The
faster speeds present at the higher thresholds in chapter four (543” per second)
would be most likely to benefit the IOVD condition. However only a small number
of the respondents in chapter four were able to provide a reliable threshold (many
at 543”). Even if it were the case that higher speeds increases the utility of the IOVD
cue, in this experiment, the greatest number able to perform reliably were in the
slowest IOVD condition.
These findings suggests that depth detection thresholds are not affected by the
speed of presentation. It is unlikely that the variations in speed would have had any
impact on the results of the previous experiments in the previous chapters.
118
Chapter 6C – The ratio of cues
Experiments that aim to investigate the cues to motion in depth, isolate the unique
features of each, namely disparity only, and motion only cues by rendering one
source of information noninformative. To isolate the CDOT or IOVD cues, stimuli
have been designed to deliver a clear peak in the cross-correlation, either for
spatial correlation between the eyes, or temporally in each eye, but not both.
These are described in various ways with the cue to changing disparity over time
investigated using Dynamic Random Dot Stereograms (DRDS) – that is our
CHANGING Z-LOCATION, CHANGING PATTERN stimuli. The stimuli are identical in
that the elements defining successive frames do not contain the same pattern of
elements as previously displayed. In terms of dots, the dots are randomly reordered
to a new spatial location. This cue is not common in nature except where elements
of a lager object would change in configuration, such as in a swarm of bees moving
through depth whilst changing lateral location (ignoring any change in element
size).
The interocular velocity difference cue, investigated using Time Correlated Random
Dot Stereograms (TCRDS); an example used is the CONTROL condition in chapter
four. The elements of the stimuli are presented to only one eye, so in a pattern of
26 dots 13 are presented to the right eye, and a different 13 are presented to the
left eye. The pattern remains constant. Again this in not a common cue in isolation
in nature as the overlapping of visual fields would need to be prevented, e.g.
viewing a large object moving toward or away from the observer, from behind a
pillar such as a scaffolding pole.
119
The use of the cues is isolation have been clearly demonstrated, but the lowest
thresholds are always found when both cues are present. This condition is referred
to as dynamic random dot (DRS) in the literature, and the condition we refer to as
CHANGING Z-LOCATION. It is the most ecologically valid cue investigated as both
cues are presented by the same elements of an object approaching in depth,
without the inclusion of monocular cues such as looming.
Throughout all previous chapters, the lowest depth detection thresholds have
always been achieved in the COMBINED condition with both cues present. The aim
of this experiment is to compare the depth detection thresholds of conditions
where the ratio of CDOT and IOVD cues are varied are varied to the COMBINED
condition.
Materials and Methods
Ethical approval and inclusion/exclusion criteria were as previous. The data were
collected by second and third year undergraduate students as part of a research
project.
Stimuli Design
Part one
Experiment one consisted of seven different conditions. The three baseline
conditions were: CHANGING DEPTH (CDOT + IOVD), CHANGING PATTERN,
CHANGING DEPTH (CDOT only) and CONTROL (IOVD only) – (for full description see
chapter four). Four different ratios of IOVD to CDOT were included 16% IOVD, 48%
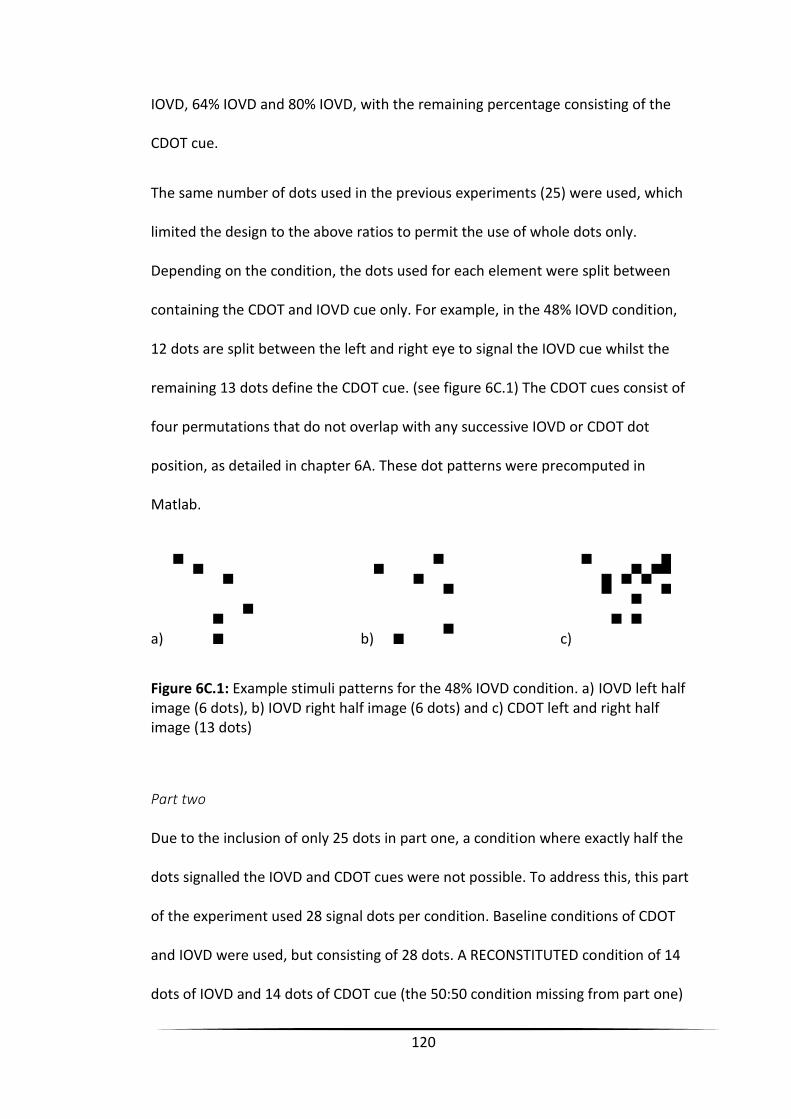
120
IOVD, 64% IOVD and 80% IOVD, with the remaining percentage consisting of the
CDOT cue.
The same number of dots used in the previous experiments (25) were used, which
limited the design to the above ratios to permit the use of whole dots only.
Depending on the condition, the dots used for each element were split between
containing the CDOT and IOVD cue only. For example, in the 48% IOVD condition,
12 dots are split between the left and right eye to signal the IOVD cue whilst the
remaining 13 dots define the CDOT cue. (see figure 6C.1) The CDOT cues consist of
four permutations that do not overlap with any successive IOVD or CDOT dot
position, as detailed in chapter 6A. These dot patterns were precomputed in
Matlab.
a) b) c)
Figure 6C.1: Example stimuli patterns for the 48% IOVD condition. a) IOVD left half image (6 dots), b) IOVD right half image (6 dots) and c) CDOT left and right half image (13 dots)
Part two
Due to the inclusion of only 25 dots in part one, a condition where exactly half the
dots signalled the IOVD and CDOT cues were not possible. To address this, this part
of the experiment used 28 signal dots per condition. Baseline conditions of CDOT
and IOVD were used, but consisting of 28 dots. A RECONSTITUTED condition of 14
dots of IOVD and 14 dots of CDOT cue (the 50:50 condition missing from part one)
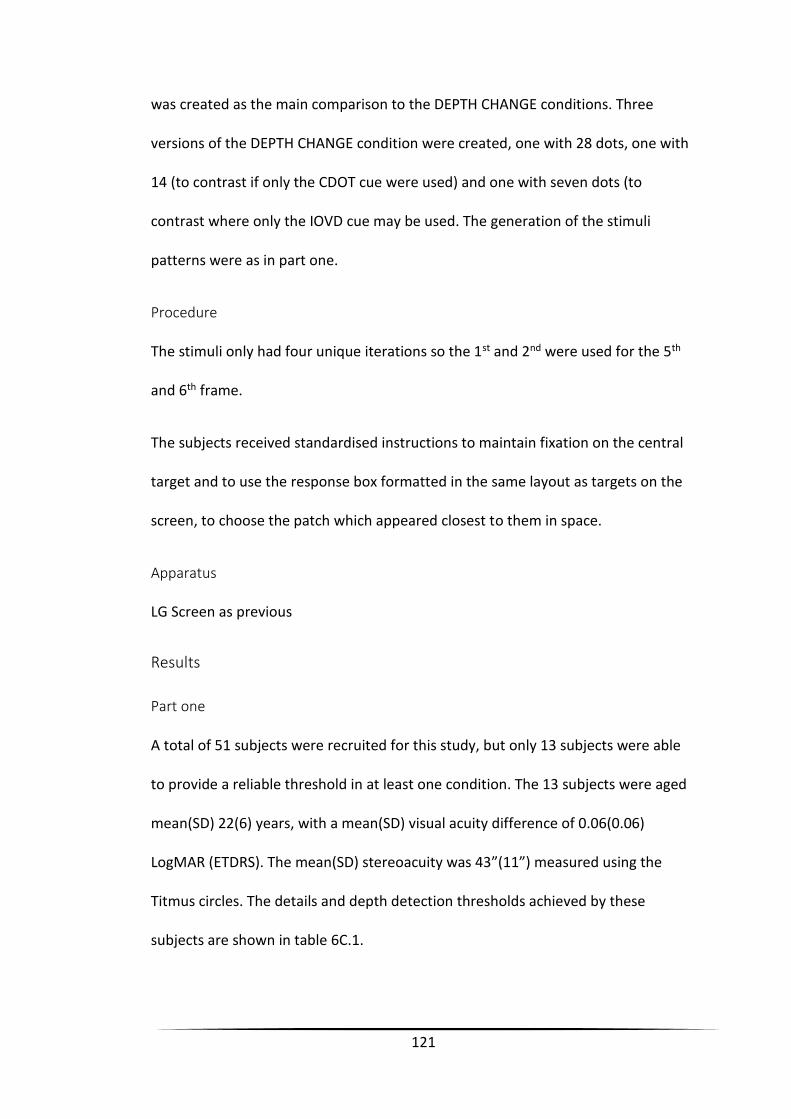
121
was created as the main comparison to the DEPTH CHANGE conditions. Three
versions of the DEPTH CHANGE condition were created, one with 28 dots, one with
14 (to contrast if only the CDOT cue were used) and one with seven dots (to
contrast where only the IOVD cue may be used. The generation of the stimuli
patterns were as in part one.
Procedure
The stimuli only had four unique iterations so the 1st and 2nd were used for the 5th
and 6th frame.
The subjects received standardised instructions to maintain fixation on the central
target and to use the response box formatted in the same layout as targets on the
screen, to choose the patch which appeared closest to them in space.
Apparatus
LG Screen as previous
Results
Part one
A total of 51 subjects were recruited for this study, but only 13 subjects were able
to provide a reliable threshold in at least one condition. The 13 subjects were aged
mean(SD) 22(6) years, with a mean(SD) visual acuity difference of 0.06(0.06)
LogMAR (ETDRS). The mean(SD) stereoacuity was 43”(11”) measured using the
Titmus circles. The details and depth detection thresholds achieved by these
subjects are shown in table 6C.1.
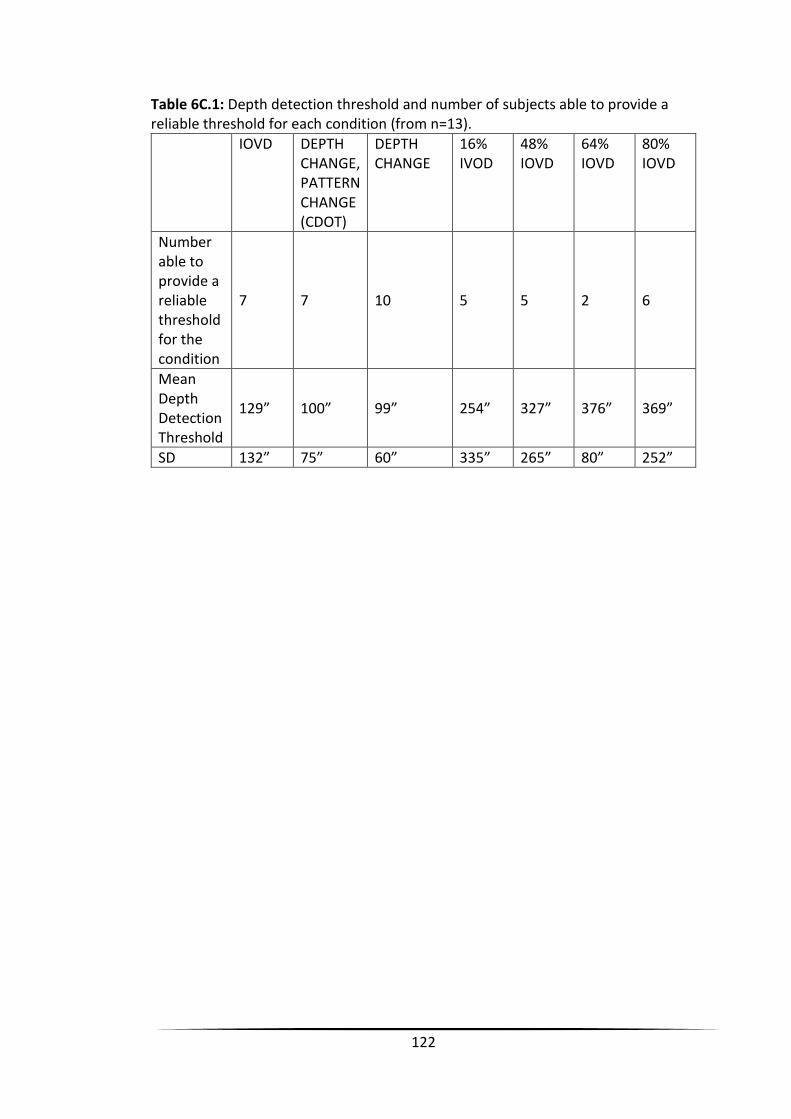
122
Table 6C.1: Depth detection threshold and number of subjects able to provide a reliable threshold for each condition (from n=13).
IOVD DEPTH CHANGE, PATTERN CHANGE (CDOT)
DEPTH CHANGE
16% IVOD
48% IOVD
64% IOVD
80% IOVD
Number able to provide a reliable threshold for the condition
7 7 10 5 5 2 6
Mean Depth Detection Threshold
129” 100” 99” 254” 327” 376” 369”
SD 132” 75” 60” 335” 265” 80” 252”
123
Of these 13 subjects only two were able to provide a reliable threshold in all
conditions. The thresholds measured are shown in figure 6C.1.
Figure 6C.1: Plot of thresholds of the two subjects who could provide a reliable threshold in all conditions.
With an n of two, any regression model has no explanatory power (F(1,6) = 0.78, p =
0.412).
Part two
A total of 41 subjects were tested with 14 able to provide a reliable threshold in at
least one condition. The 14 subjects were aged mean (SD) 22(4) years, with a mean
(SD) visual acuity difference of 0.06(0.05) LogMAR (ETDRS) between eyes, mean
(SD) stereoacuity was 44”(8”) Titmus circles. The number who could provide a
R² = 0.3395
R² = 0.9385
0
100
200
300
400
500
600
0 20 40 60 80 100
Thre
sho
ld (
arc
sec
)
Percentage of IOVD in stimuli
Sub 1
Sub2
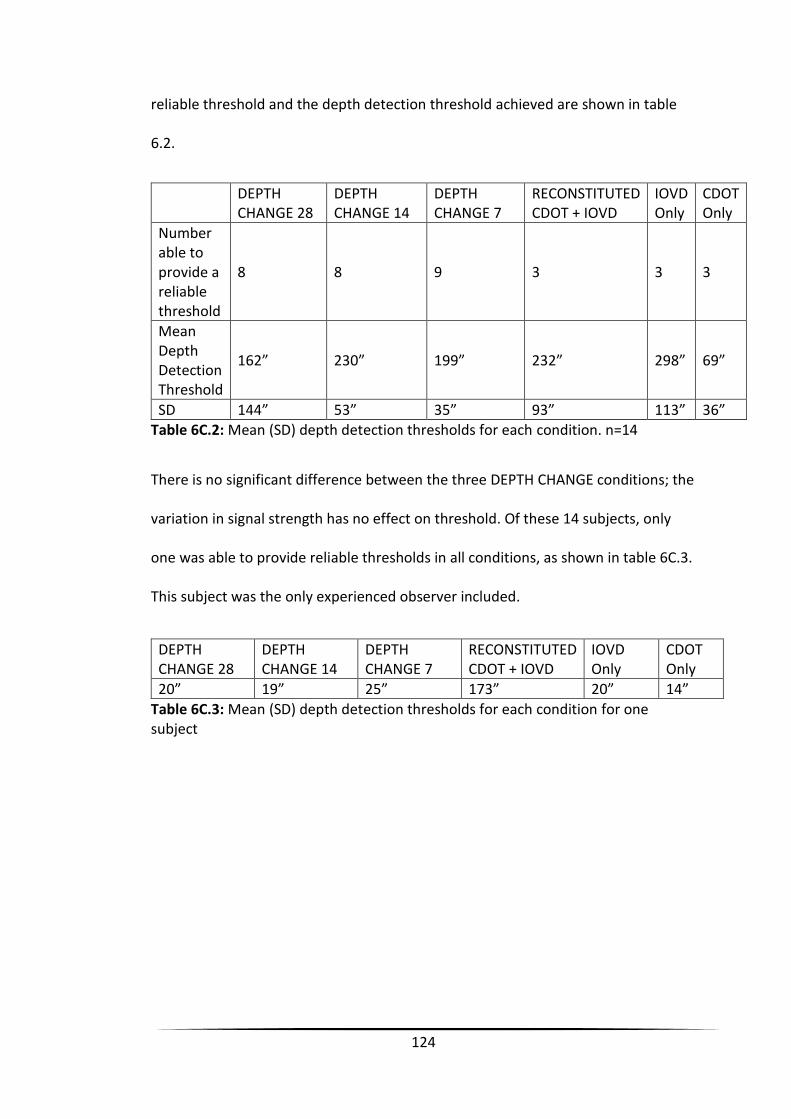
124
reliable threshold and the depth detection threshold achieved are shown in table
6.2.
DEPTH CHANGE 28
DEPTH CHANGE 14
DEPTH CHANGE 7
RECONSTITUTED CDOT + IOVD
IOVD Only
CDOT Only
Number able to provide a reliable threshold
8 8 9 3 3 3
Mean Depth Detection Threshold
162” 230” 199” 232” 298” 69”
SD 144” 53” 35” 93” 113” 36” Table 6C.2: Mean (SD) depth detection thresholds for each condition. n=14
There is no significant difference between the three DEPTH CHANGE conditions; the
variation in signal strength has no effect on threshold. Of these 14 subjects, only
one was able to provide reliable thresholds in all conditions, as shown in table 6C.3.
This subject was the only experienced observer included.
DEPTH CHANGE 28
DEPTH CHANGE 14
DEPTH CHANGE 7
RECONSTITUTED CDOT + IOVD
IOVD Only
CDOT Only
20” 19” 25” 173” 20” 14”
Table 6C.3: Mean (SD) depth detection thresholds for each condition for one subject
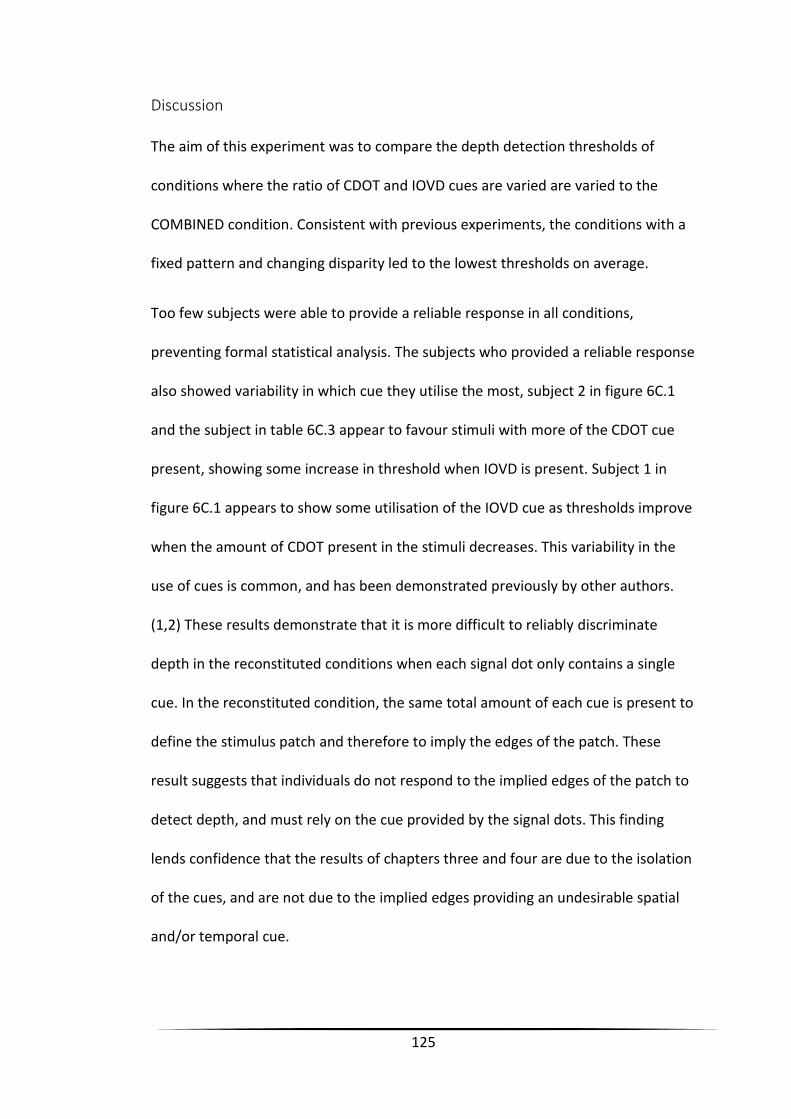
125
Discussion
The aim of this experiment was to compare the depth detection thresholds of
conditions where the ratio of CDOT and IOVD cues are varied are varied to the
COMBINED condition. Consistent with previous experiments, the conditions with a
fixed pattern and changing disparity led to the lowest thresholds on average.
Too few subjects were able to provide a reliable response in all conditions,
preventing formal statistical analysis. The subjects who provided a reliable response
also showed variability in which cue they utilise the most, subject 2 in figure 6C.1
and the subject in table 6C.3 appear to favour stimuli with more of the CDOT cue
present, showing some increase in threshold when IOVD is present. Subject 1 in
figure 6C.1 appears to show some utilisation of the IOVD cue as thresholds improve
when the amount of CDOT present in the stimuli decreases. This variability in the
use of cues is common, and has been demonstrated previously by other authors.
(1,2) These results demonstrate that it is more difficult to reliably discriminate
depth in the reconstituted conditions when each signal dot only contains a single
cue. In the reconstituted condition, the same total amount of each cue is present to
define the stimulus patch and therefore to imply the edges of the patch. These
result suggests that individuals do not respond to the implied edges of the patch to
detect depth, and must rely on the cue provided by the signal dots. This finding
lends confidence that the results of chapters three and four are due to the isolation
of the cues, and are not due to the implied edges providing an undesirable spatial
and/or temporal cue.
126
The clearest results in this experiment come from experienced, practised observers
(who expectedly appear to favour the CDOT cue for the detection of depth). This,
combined with the low number of subjects able to perform this experiment,
favours investigation in trained and practised observers, rather than the naïve
population tested. Some complication may have been introduced through using
undergraduate students to collect the data, however as the instructions for the
experiment were displayed by the programme, this should have been consistent
across all individuals.
For the lowest thresholds, the two cues to motion in depth must be present in the
elements defining the stimulus patch, and not separate elements defining the same
patch.
Conclusion
These control experiments suggest that the findings of the previous chapters are
robust and cannot be explained by the presence of spurious temporal correlation in
the CHANGING PATTERN, CHANGING DEPTH (CDOT) cue, or the variation in speed
between different levels of disparity. The final control experiment shows that the
task to detect depth is not reliant on the implied edges of the patch, which
theoretically contain both cues.
127
Chapter Seven - General Discussion
Summary
There are anecdotal and qualitative reports of 3D depth being revealed when
viewing entertainment media such as 3D films at the cinema, to those who are not
clinically expected to perceive it. (30,80-82) The aim of this thesis is to
quantitatively test these findings. Stimuli were designed to isolate any monocular
cue to depth, to ensure that binocular processing was necessary to determine the
presence of depth. Further, the dynamic nature of 3D films include stimuli that
move across the screen as well as through depth, necessitating investigation. The
preceding chapters have presented evidence, to support the idea that depth is
more easily identifiable in the presence of motion.
By systematically isolating the characteristics of dynamic stereoscopic stimuli it has
been demonstrated that for some dynamic stimuli, depth detection thresholds are
lower than for static stimuli, common across many observers. The specific dynamic
facet which leads to lower thresholds is a change in z-location, which is movement
through depth towards the observer as demonstrated in chapter three and chapter
four. Chapter six shows these findings are unlikely to have been contaminated by
spurious temporal correlation, variation in distance, or variations in speed of z-
location change during stimulus presentation. Chapter six also showed that if the
two cues to motion in depth were present in the stimuli, but defined by different
dot elements the threshold of depth detection was much higher than if a single
element contained both cues. This remains the case even if the signal strength of
128
the z-location change condition is reduced to a quarter of that of the reconstituted
cue.
As the level of stereoacuity measurable may change based on fusional load,
dynamic stimuli may have been harder for individuals to fuse, thus reducing any
difference between static and dynamic stimuli. Chapter five shows that the
maintenance of fusion during stereoscopic viewing, including the use of positive
relative vergence, does not have a negative impact on stereoacuity thresholds
under static of dynamic presentation.
These findings support the reports of depth being more easily perceived in moving
3D scenes, (8,30,31,83) specifically attributable to approaching changes in depth. If
binocular disparity is presented below an individual’s static stereoacuity level, they
will not perceive any depth. However, if the stimulus was to move through depth,
depth may be perceived. This could lead to the classification of some individuals as
‘stereoblind’ based on static test methods, and so may be too conservative;
dynamic testing could reveal the ability to detect binocular depth.
Comparison to previous studies on depth detection in moving stimuli
Our results provide quantitative support for the anecdotal evidence that depth
“appears of a greater magnitude” in dynamic stereoscopic three-dimensional
images than in static images, (8) that is depth is more apparent in dynamic stimuli.
Similarly, the time taken to recognise a difference in depth is shorter and accuracy
is improved when changes in depth are included in the stimuli. (9) The results
presented here add to these findings by isolating the cues to depth & motion in
129
depth, investigating them directly against controls by measuring depth detection
thresholds using adaptive procedures.
A previous study investigated the association between the amount of time taken to
identify differences in disparity on a moving target and stereoacuity measured
using TNO/Titmus test, but no correlation was found between the two variables.
(10) Whilst this null result was most likely due to methodology (the actual task was
to identify a relatively small static relative disparity whilst approaching the subject)
rather than there being no difference between static and dynamic stimuli, the
results presented here clearly demonstrate that a smaller amount of retinal
disparity is required to see depth, when a target approaches, countering any
ambiguity caused by the afore mentioned study.
Methodology
The following discussed a number of potential confounds that may occur in
methodology.
Lateral Motion
Lateral motion was added to the distractors in each of the 4AFC tasks, in order to
prevent the monocular identification of the target patch (one eye viewing of a half
image would present as lateral motion). This may result in the inverse of this
problem, as it is possible that no lateral motion would be perceived in the stimuli
including depth. As complete control of all aspects of stereoscopic motion in depth
stimuli is an intractable task, I have attempted to balance the stimuli by controlling
130
the most crucial aspects. When a stimulus translates directly towards the observer
in depth, its right and left eye half-images drift with opposite horizontal directional
components on each retina. As such, consideration of the presence of motion
either on the left or the right retina would reveal which stimulus is moving in depth.
Even during binocular fusion by highly stereo-able observers, a degree of lateral
motion is frequently perceived, as noted during the pilot stage of the experiment.
This has been noted in the stereoscopic literature by Cumming & Parker, (6) who
added lateral motion (x-motion) to the “distractor” to prevent responding on the
basis of monocular retinal motion alone. Similar considerations, controlling for the
influence of monocular motion, have been included in stereomotion studies
following Cumming & Parker’s seminal study (3,84). If lateral motion had not been
added to the distractor stimuli, the subject’s task would have been made trivially
easy, in that they would simply be required to select the stimulus that appeared to
contain any form of motion.
Lateral motion could have been added to the target, as well as the distractors in
varying ways. If lateral motion was added to the distractors and target however,
there would still be a greater amount of lateral motion in the target stimuli. If a
random amount of lateral motion were added to the distractors and target, it
would introduce a random trajectory for motion in depth. If a random amount were
added to the distractors, but a constant amount to the target, the speed of lateral
translation would be different in the target also, again providing a method of
identifying the target by artifactual means. Additionally, and perhaps most
importantly, adding any lateral motion to the target would prevent the research
131
question from being answered; it would produce an oblique trajectory with both z
and x motion, preventing the isolation of z-location change.
On balance, the approach adopted offered the best stimulus control while allowing
the research question to be addressed. Also, as conditions were interleaved (other
than in the first experiment (chapter three), where findings were similar to the
main experiment (chapter four)), it is unlikely that the subjects learnt to identify the
target through lack of lateral motion, ignoring any implied lateral motion and z-
location change in this condition only, while continuing to identify the nearest
stimulus in all five other conditions. The task was not possible under monocular
viewing, and viewed binocularly it would seem unlikely that the change in z-location
was not the identifying feature. Regarding chapter three, some element of learning
may be evident in the constant stimulus pattern conditions, as the worsening of
depth detection threshold caused by changing stimulus pattern is significant in the
first experiment. As mentioned, the potential confound of using lateral motion,
which may have been more apparent with a constant stimulus pattern did not
impact on the main findings in either experiment, any learning effect demonstrated
in the first experiment was clearly negated by the interleaving of the conditions in
the second experiment (chapter 4).
The Control Stimulus in Chapter four
The control stimulus, an isolation of the IOVD cue, contained no coherent disparity
signal over time – suggesting that the subjects would be unable to perform the task
of identifying depth, and if they provided an answer it would be based on
discriminating receding from approaching stereomotion rather than depth. This
132
stimulus contained cues that were also available in some of the experimental
stimulus, but that were judged as being unlikely to substantially influence
performance. As such, observers were not expected to be able to perform this task,
and this hypothesis was confirmed by the universally poor performance of
observers: in other words, the observers did not make use of this cue.
One way that the stimulus that is closest in depth could have been identified is
through the binocular matching of second-order (or “texture defined”) features; the
defined edges. (85-87) Although the benefit of this was considered unlikely,
effective use of this cue would be revealed by good performance in the control
condition of chapter four. Furthermore, observers in conditions four or five may
have simply selected the stimulus that was moving in depth (perhaps using the
IOVD cue to stereomotion), hence answering the question of which stimulus
appeared closer without actually processing any disparity information per se.
It is important also to consider that in the control condition, the relative motion of
the target compared to distractors is effectively doubled, given that motion of the
distractors was equal and opposite to the motion of the target patch. This was in
acknowledgement of early work specifying that the IOVD cue is most effective in
simulating motion in depth when contrasting, or relative motion is present. (53)
Here, an additional opportunity for high performance in this task is being offered,
which might cast doubt on responding in other conditions that included a motion in
depth percept. However, as previously stated performance was poor in this
condition, even for the small minority of participants for whom reliable curve fits
were possible (12 of 127 subjects included in chapter four). Hence, it seems that
133
participants were unable to make use either of second-order disparity signals, or
motion in depth signals provided by the IOVD cue in this condition, it is equally
unlikely that these cues contaminated responses in the other experimental
conditions.
Implied shape as a potential cue
While the dot elements which defined the individual cues were not evenly
distributed within the patch, they conformed to the same boundary, and this
“second order” boundary may have implied both temporal and spatial correlation
between the eyes. If this cue was used to perform the task, it should have been
more marked in the conditions containing a change in pattern. This, however, was
not the case. Conditions with changing patterns had on average a higher threshold
than the non-changing pattern versions. As discussed above, the performance for
the control stimuli containing only IOVD (chapter 4), did not benefit from any
implied spatial correlation. Further evidence against this is provided in chapter six,
where the ‘reconstitution’ of the changing disparity and velocity difference cues
provided significantly higher depth detection thresholds than stimuli patches with a
quarter of the signal dots (but each dot contained both cues).
Signal doubling and cross talk
As mentioned in the above section, the stimuli in the control condition were
‘doubled’: the half images of the target were crossed (motion out of the screen),
and the distractors were uncrossed (motion into the screen). This was not the case
in all other conditions in the thesis. Arguably cross talk between the right and left
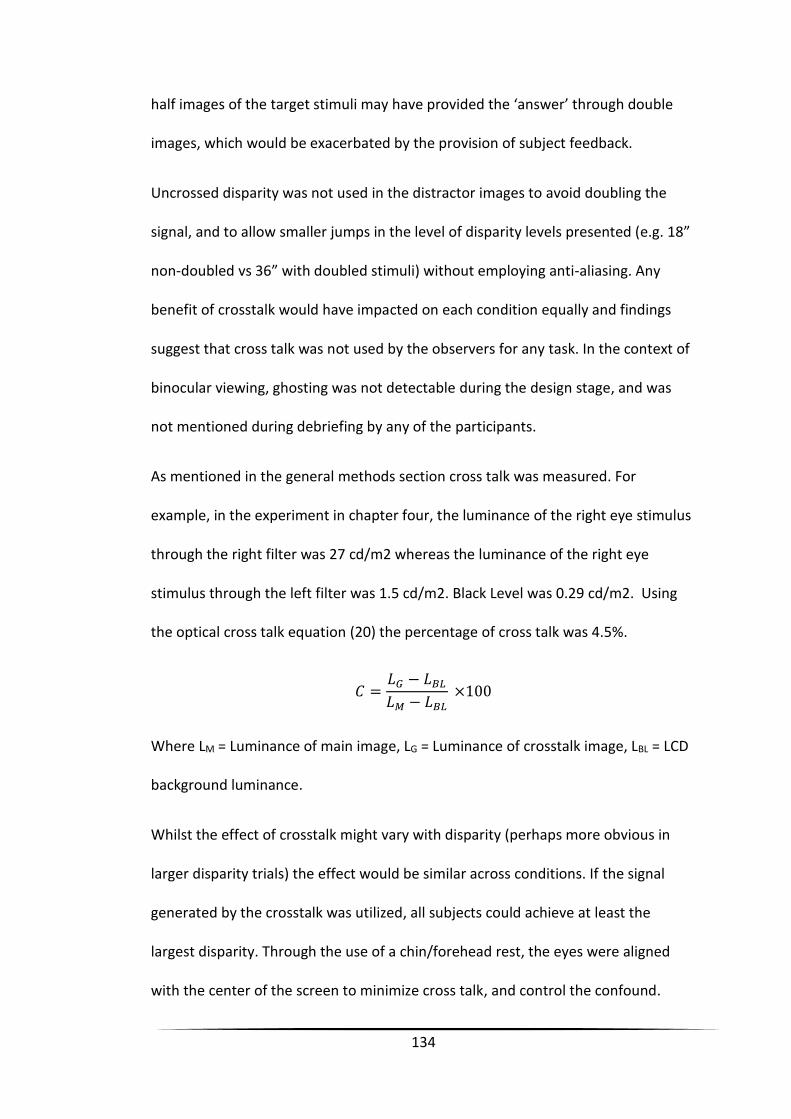
134
half images of the target stimuli may have provided the ‘answer’ through double
images, which would be exacerbated by the provision of subject feedback.
Uncrossed disparity was not used in the distractor images to avoid doubling the
signal, and to allow smaller jumps in the level of disparity levels presented (e.g. 18”
non-doubled vs 36” with doubled stimuli) without employing anti-aliasing. Any
benefit of crosstalk would have impacted on each condition equally and findings
suggest that cross talk was not used by the observers for any task. In the context of
binocular viewing, ghosting was not detectable during the design stage, and was
not mentioned during debriefing by any of the participants.
As mentioned in the general methods section cross talk was measured. For
example, in the experiment in chapter four, the luminance of the right eye stimulus
through the right filter was 27 cd/m2 whereas the luminance of the right eye
stimulus through the left filter was 1.5 cd/m2. Black Level was 0.29 cd/m2. Using
the optical cross talk equation (20) the percentage of cross talk was 4.5%.
𝐶 =𝐿𝐺 − 𝐿𝐵𝐿
𝐿𝑀 − 𝐿𝐵𝐿 ×100
Where LM = Luminance of main image, LG = Luminance of crosstalk image, LBL = LCD
background luminance.
Whilst the effect of crosstalk might vary with disparity (perhaps more obvious in
larger disparity trials) the effect would be similar across conditions. If the signal
generated by the crosstalk was utilized, all subjects could achieve at least the
largest disparity. Through the use of a chin/forehead rest, the eyes were aligned
with the center of the screen to minimize cross talk, and control the confound.
135
Subjects were unable to make use of this to provide reliable thresholds, and even if
employed to some extent, the effect would be consistent across conditions.
Choice of adaptive procedure and threshold estimation
The detection threshold was not the disparity converged on by the adaptive
procedure during the experiment; instead it was calculated by fitting a
psychometric curve after the experiment was completed. The average number of
trials was for each condition in every experiment was between 50 and 150, which is
an appropriate number for threshold estimation. (88) To use an adaptive procedure
for stimulus placement, but not for the estimation of the final threshold estimation
is also common, with the advantage that by fitting the psychometric function ‘off-
line’, data across different sessions can be combined and goodness-of-fit can be
evaluated. (89)
As a check, the threshold values that the staircases converged on were compared
to those estimated from the fitted Weibull functions. The average, of the average of
the last four reversals for each staircase (starting at 10 and 20 pixel disparity) in
each condition were calculated (Table 7.1). The average difference between the
threshold estimated by the Weibull function and averaging thresholds was on
average 20” (7”) (mean(SD)) higher using the Weibull method, however, this
difference was only statistically significant in the IOVD/CONTROL condition when
Bonferroni corrections were made, showing that our results are robust.
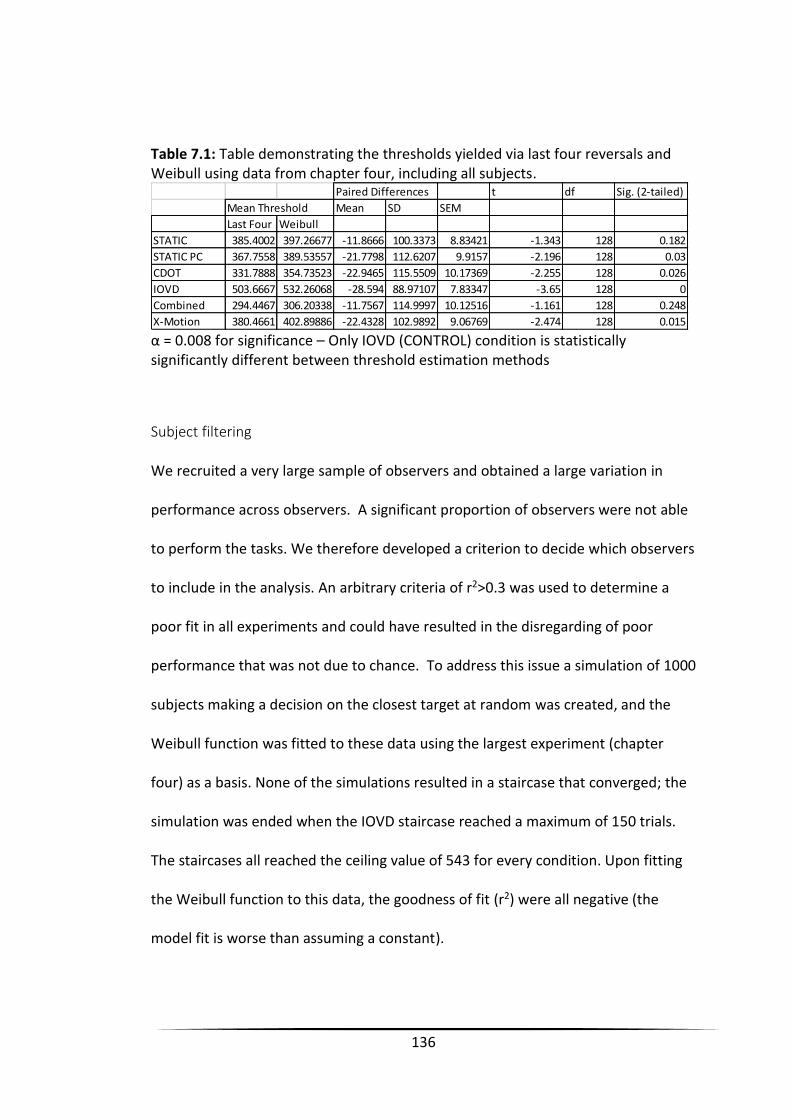
136
Table 7.1: Table demonstrating the thresholds yielded via last four reversals and Weibull using data from chapter four, including all subjects.
α = 0.008 for significance – Only IOVD (CONTROL) condition is statistically significantly different between threshold estimation methods
Subject filtering
We recruited a very large sample of observers and obtained a large variation in
performance across observers. A significant proportion of observers were not able
to perform the tasks. We therefore developed a criterion to decide which observers
to include in the analysis. An arbitrary criteria of r2>0.3 was used to determine a
poor fit in all experiments and could have resulted in the disregarding of poor
performance that was not due to chance. To address this issue a simulation of 1000
subjects making a decision on the closest target at random was created, and the
Weibull function was fitted to these data using the largest experiment (chapter
four) as a basis. None of the simulations resulted in a staircase that converged; the
simulation was ended when the IOVD staircase reached a maximum of 150 trials.
The staircases all reached the ceiling value of 543 for every condition. Upon fitting
the Weibull function to this data, the goodness of fit (r2) were all negative (the
model fit is worse than assuming a constant).
Paired Differences t df Sig. (2-tailed)
Mean Threshold Mean SD SEM
Last Four Weibull
STATIC 385.4002 397.26677 -11.8666 100.3373 8.83421 -1.343 128 0.182
STATIC PC 367.7558 389.53557 -21.7798 112.6207 9.9157 -2.196 128 0.03
CDOT 331.7888 354.73523 -22.9465 115.5509 10.17369 -2.255 128 0.026
IOVD 503.6667 532.26068 -28.594 88.97107 7.83347 -3.65 128 0
Combined 294.4467 306.20338 -11.7567 114.9997 10.12516 -1.161 128 0.248
X-Motion 380.4661 402.89886 -22.4328 102.9892 9.06769 -2.474 128 0.015
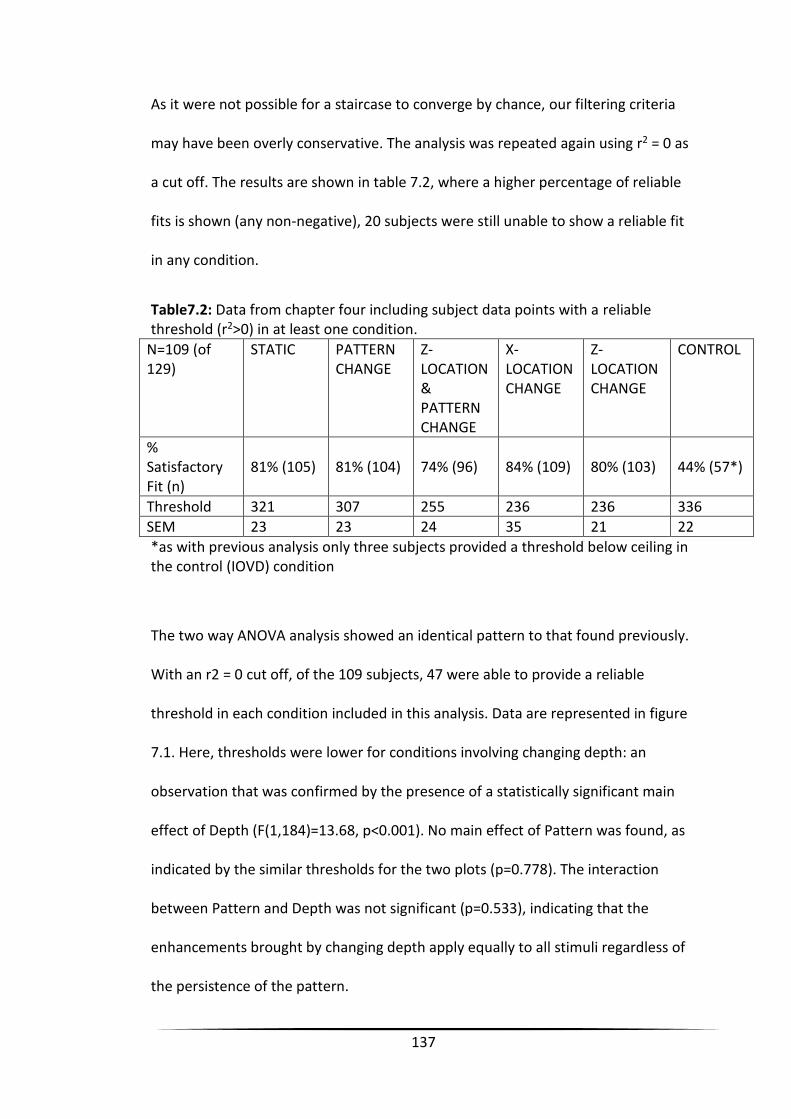
137
As it were not possible for a staircase to converge by chance, our filtering criteria
may have been overly conservative. The analysis was repeated again using r2 = 0 as
a cut off. The results are shown in table 7.2, where a higher percentage of reliable
fits is shown (any non-negative), 20 subjects were still unable to show a reliable fit
in any condition.
Table7.2: Data from chapter four including subject data points with a reliable threshold (r2>0) in at least one condition.
N=109 (of 129)
STATIC PATTERN CHANGE
Z-LOCATION & PATTERN CHANGE
X-LOCATION CHANGE
Z-LOCATION CHANGE
CONTROL
% Satisfactory Fit (n)
81% (105) 81% (104) 74% (96) 84% (109) 80% (103) 44% (57*)
Threshold 321 307 255 236 236 336
SEM 23 23 24 35 21 22
*as with previous analysis only three subjects provided a threshold below ceiling in the control (IOVD) condition
The two way ANOVA analysis showed an identical pattern to that found previously.
With an r2 = 0 cut off, of the 109 subjects, 47 were able to provide a reliable
threshold in each condition included in this analysis. Data are represented in figure
7.1. Here, thresholds were lower for conditions involving changing depth: an
observation that was confirmed by the presence of a statistically significant main
effect of Depth (F(1,184)=13.68, p<0.001). No main effect of Pattern was found, as
indicated by the similar thresholds for the two plots (p=0.778). The interaction
between Pattern and Depth was not significant (p=0.533), indicating that the
enhancements brought by changing depth apply equally to all stimuli regardless of
the persistence of the pattern.
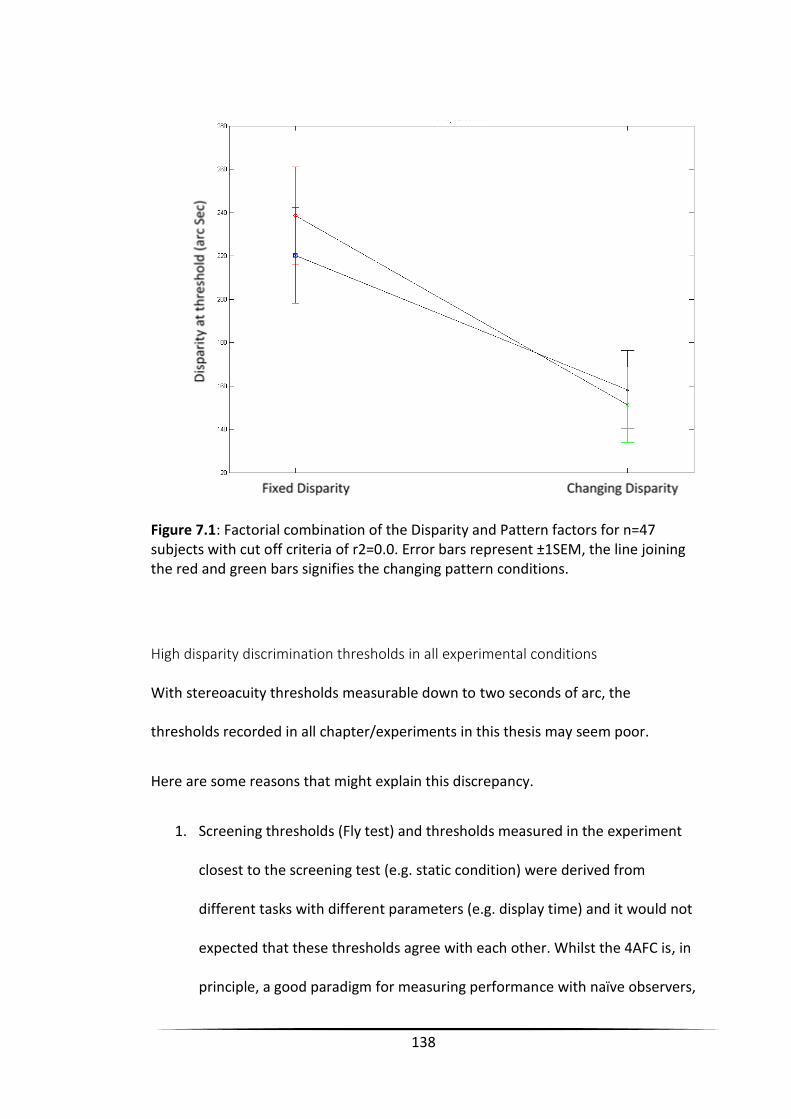
138
Figure 7.1: Factorial combination of the Disparity and Pattern factors for n=47 subjects with cut off criteria of r2=0.0. Error bars represent ±1SEM, the line joining the red and green bars signifies the changing pattern conditions.
High disparity discrimination thresholds in all experimental conditions
With stereoacuity thresholds measurable down to two seconds of arc, the
thresholds recorded in all chapter/experiments in this thesis may seem poor.
Here are some reasons that might explain this discrepancy.
1. Screening thresholds (Fly test) and thresholds measured in the experiment
closest to the screening test (e.g. static condition) were derived from
different tasks with different parameters (e.g. display time) and it would not
expected that these thresholds agree with each other. Whilst the 4AFC is, in
principle, a good paradigm for measuring performance with naïve observers,
139
the task in all experiments was more difficult than the simple Fly test, and
therefore observers that pass the fly test would not necessarily produce
reliable thresholds in the experimental conditions. Other differences such as
eccentricity, display time, and spatial parameters may also contribute and
are discussed below.
2. The aim was not to measure the limiting stereoacuity performance, but
allow conditions to be comparable without floor or ceiling effects.
3. Display time in the experiments were limited to one second, whereas the fly
test has no time restriction.
4. Disparity thresholds depend on spatial frequency, with peak stereoacuity (3-
4 arc sec) found at 0.3 cpd when sinusoids are used. (49) The experimental
stimuli used here are more broadband (in frequency space) and shifted to
higher spatial frequencies, well beyond the optimal spatial frequency for
stereoacuity.
5. Stereoscopic discrimination thresholds increase as eccentricity increases.
Rawlings and Shipley (1969) demonstrated that from an average threshold
of 25”, introducing an eccentricity from fixation to target of 4o increased
threshold to 150”. (50) The inner corners of each of the four stimuli were
initially separated from the centre of the fixation target horizontally by 0.6o
(120 pixels) and vertically by 0.68o (135 pixels). Similar dependency on
eccentricity has been reported for different spatial frequencies (0.5 to
8cpd). (51) As for display time and spatial frequency, our stimuli were not
optimised to measure limiting stereo-acuity performance, but rather
compare static and dynamic conditions.
140
The results in this thesis demonstrate a large variability for stereovision, and hence
the need for a large sample to address any research question relating to it. The aim
was to obtain a representative estimate of the population performance.
Cue conflict
One theoretical comment that could be addressed is the increased (or at least
different) cue conflict introduced by the stereomotion stimuli. In all the
experiments there was a monocular cue conflict and this could contribute to
insensitivity of the stereotests. As the target approaches, it would be expected to
increase in size. As with the vast majority of experiments, the binocular display used
here contains a depth cue conflict which is often a consequence of isolating a
particular cue. In these experiments, the conflict between the monocular and
binocular cues are present in all conditions and so is unlikely to have had an impact
on the results.
Clinical Implications and future plans
Returning to the premise that approaching motion could be responsible for the
compelling perception of volumetric depth described in the introduction to this
thesis, the evidence here arguably support this theory. It could be claimed however,
that there is no direct relationship between how ‘compelling’ depth is and depth
perception at threshold, and so these findings may not predict how “compelling”
depth appears to an observer based on stereo discrimination thresholds. It can be
assumed however, that whilst subthreshold stimulus attributes may not contribute
to conscious perception, supra-threshold attributes do. Lower thresholds hence
141
imply a larger range of stimuli will appear to have stereoscopic depth, while higher
thresholds imply the opposite.
These experiments have shown that individuals with demonstrable stereoacuity
using standard clinical testing, demonstrate lower thresholds when the stimuli
contain changes in disparity. The next step will be to carry this forward into a
clinically deliverable test, to assess individuals without readily demonstrable
stereoacuity using static methods. The limitation of current clinical test methods as
mentioned previously, are the limited range and large steps between threshold
levels tested. With depth more apparent using dynamic stimuli, smaller disparities
may be needed for individuals to appreciate depth. Combined with digital
presentation methods to allow dynamic presentation, the incorporation of
automatic staircase procedures would also provide a far superior assessment of
stereoacuity.
Standard testing to assess binocular potential prior to surgical management often
includes a correction of any angle of deviation and assessment of binocular
function. (90) As shown in chapter five, as long as comfortable fusion is achieved,
thresholds are not significantly different to those achieved when orthophoria is
achieved, therefore this alignment should offer a good indication of any binocular
potential. Binocularity is not always readily demonstrated however, potentially as
only a limited number of binocular processing areas are stimulated, or as
binocularity is actively suppressed to prevent diplopia.
142
Neurophysical evidence has demonstrated that neurones in V1 do not directly
account for many perceptual features, with neurophysical evidence showing that
neurones in the striate cortex are tuned to static disparities, and are insensitive to
disparity changes over time. (91) The neurones in the primary visual cortex appear
to use static disparities only to solve the correspondence problem. (92) This further
supports the notion that the detection of depth within stereomotion stimuli occurs
in areas beyond the primary visual cortex. Whilst the work by Nienborg et al.
suggests an insensitivity to stereomotion, low spatial frequency stimuli were used
in their experiment. The stimuli used in this thesis are not sinusoidal gratings, but
checkerboard stimuli with a fairly broad spatio-temporal frequency spectrum. A
direct comparison with simple spatial (or temporal) sinusoidal stimuli is not
straightforward. . Similarly, Kane et al. show that individuals are better at detection
disparity at lower temporal frequencies, (93) contrary to our findings. Again
however, our stimuli was not of a single frequency, and even our static stimuli had
a sharp on and off-set, which make our findings difficult to compare.
The processing of static disparity occurs in a number of other visual areas as shown
by fMRI scanning: V1, V2 and V3 provide small responses to absolute and relative
disparity, V3A, MT and V7 respond more markedly to absolute disparity and V4 and
V8 respond equally to both. (94) Whilst all these areas would respond to the
disparity in standard clinical tests, a further area anterior to MT has been shown to
respond to motion through depth specifically. (95-97) Assessment of binocular
potential using dynamic stimuli may offer extra opportunities for the visual system
to demonstrate binocular potential.
143
Whilst the motion centre, MT, was previously considered a static disparity
processing area, (96) that processes structure from motion. (98)
Electrophysiological results in Macaques provided evidence that neurones in MT
are in fact tuned for motion through depth, distinct from tuning to binocular
disparity. (97) By assessing the ability of an individual to detect frontoparallel
motion, and therefore recognise depth, all areas of binocular processing are
assessed, proving a more complete assessment of binocular potential, in turn
guiding the functional correction of strabismus.
Correction of an angle of deviation on its own arguably has little effect of
countering any interocular suppression present. The process of preventing
binocular responsiveness is an active one, (99) that can be reversed
pharmacologically, (100) or by restoring contrast summation through attenuating
signal strength to the non-amblyopic eye. (101) This suggests that in order to fully
investigate any binocular potential the signals to both eyes should be balanced to
account for any suppression present, be that facultative to prevent diplopia or
amblyopia.
This feeds into two different applications where the investigation or intervention
could be delivered by a similar methodology, namely the treatment of amblyopia
and the investigation of binocular potential thought the use of a dichoptic display.
As technology progresses and becomes more mainstream the cost of the consumer
items reduce. The paradigm of domestic stereoscopic displays have shifted from 3D
televisual devices towards virtual reality headsets. These offer a presentation
144
similar to the synoptophore / wheatstone stereoscope in that two separate images
are displayed to each eye individually, with zero risk of cross talk.
Whilst binocular balancing has been approached through augmentation of contrast,
(101-103) the deficit to vision in amblyopia is not limited to just contrast, the
perceived ‘structure’ of the image is impaired, (104) formalised as a reduction in
optotype, grating and Vernier acuity. (105) All of these visual deficits could be
simulated using virtual reality headsets. This offers an evolution from the use of
total occlusion, form occlusion, neutral density filters and reducing luminance to
degrade the signal to the dominant eye, allowing binocular treatment and
assessment.
145
Conclusion
Approaching motion, motion in depth, motion through depth or z-location changes
are interchangeably used to describe variations along the z-axis of a moving
stimulus. These changes allow for depth to be perceived at smaller thresholds than
static disparity displays alone. This suggests that the systems for detecting changes
in disparity can make use of extra information beyond the systems that detect
static disparity. This is unsurprising, as in real life, disparity is rarely static, and the
information we gain from binocular processing is used to navigate and survive
interactions in the real world. By only assessing static disparity, we do not fully
assess the binocular abilities of an individual. Binocular vision must be assessed and
treated in more depth.

146
Appendices

147
Appendix I – Ethical Approval
From: IPHS Ethics Sent: 09 April 2013 11:17 To: Wuerger, Sophie Subject: IPHS-1213-LB-064-Stereoscopic vision research including clinical assessment of visual function Dear Sophie I am pleased to inform you that IPHS Research Ethics Committee has approved your application for ethical approval. Details and conditions of the approval can be found below. Ref: IPHS-1213-LB-064 PI / Supervisor: Sophie Wuerger Title: Stereoscopic vision research including clinical assessment of visual function First Reviewer: Laurence Alison Second Reviewer: Ian Donald Third Reviewer (if applicable): N/A Date of Approval: 09.04.13 The application was APPROVED subject to the following conditions: Conditions 1 All serious adverse events must be reported to the Sub-Committee within 24 hours of their occurrence, via the Research Governance Officer ([email protected]). 2 This approval applies for the duration of the research. If it is proposed to extend the duration of the study as specified in the application form, IPHS REC should be notified as follows. If it is proposed to make an amendment to the research, you should notify IPHS REC by following the Notice of Amendment procedure outlined at http://www.liv.ac.uk/researchethics/amendment%20procedure%209-08.doc. 3 If the named PI / Supervisor leaves the employment of the University during the course of this approval, the approval will lapse. Therefore please contact the Institute’s Research Ethics Office at [email protected] in order to notify them of a change in PI / Supervisor. Best Wishes John Downes Chair, Ethics Committee

148
Appendix II – Planar System example
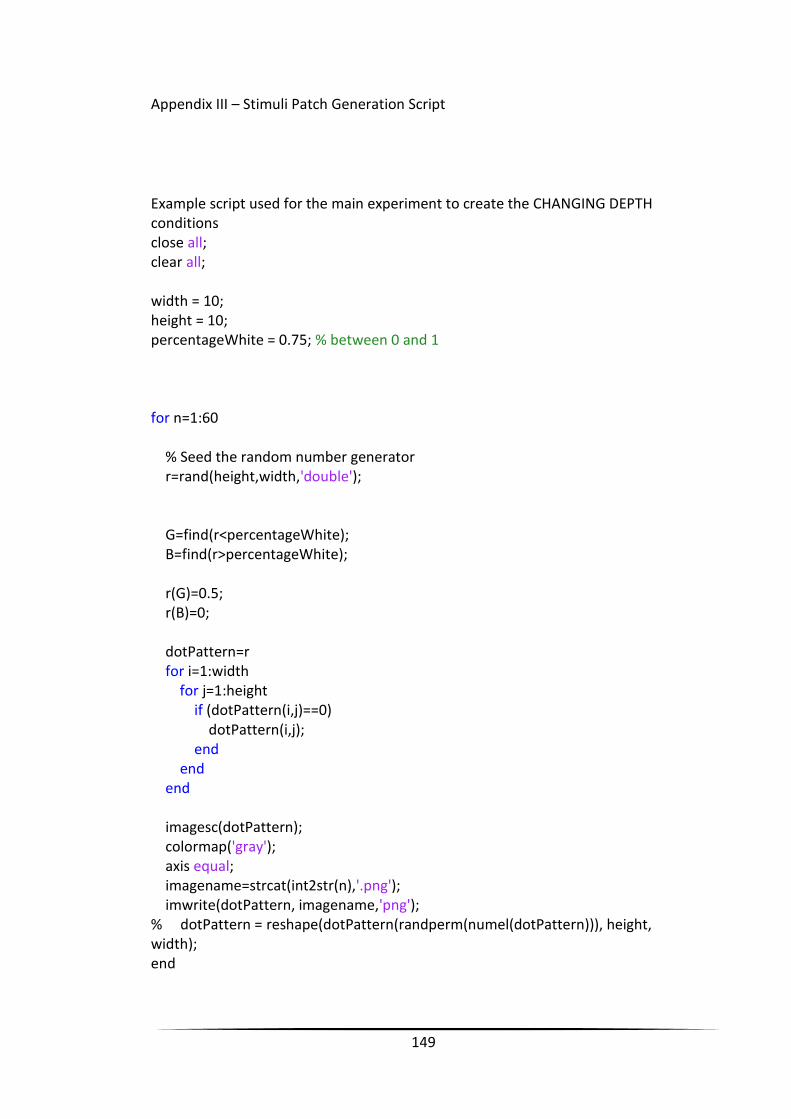
149
Appendix III – Stimuli Patch Generation Script
Example script used for the main experiment to create the CHANGING DEPTH conditions close all; clear all; width = 10; height = 10; percentageWhite = 0.75; % between 0 and 1 for n=1:60 % Seed the random number generator r=rand(height,width,'double'); G=find(r<percentageWhite); B=find(r>percentageWhite); r(G)=0.5; r(B)=0; dotPattern=r for i=1:width for j=1:height if (dotPattern(i,j)==0) dotPattern(i,j); end end end imagesc(dotPattern); colormap('gray'); axis equal; imagename=strcat(int2str(n),'.png'); imwrite(dotPattern, imagename,'png'); % dotPattern = reshape(dotPattern(randperm(numel(dotPattern))), height, width); end
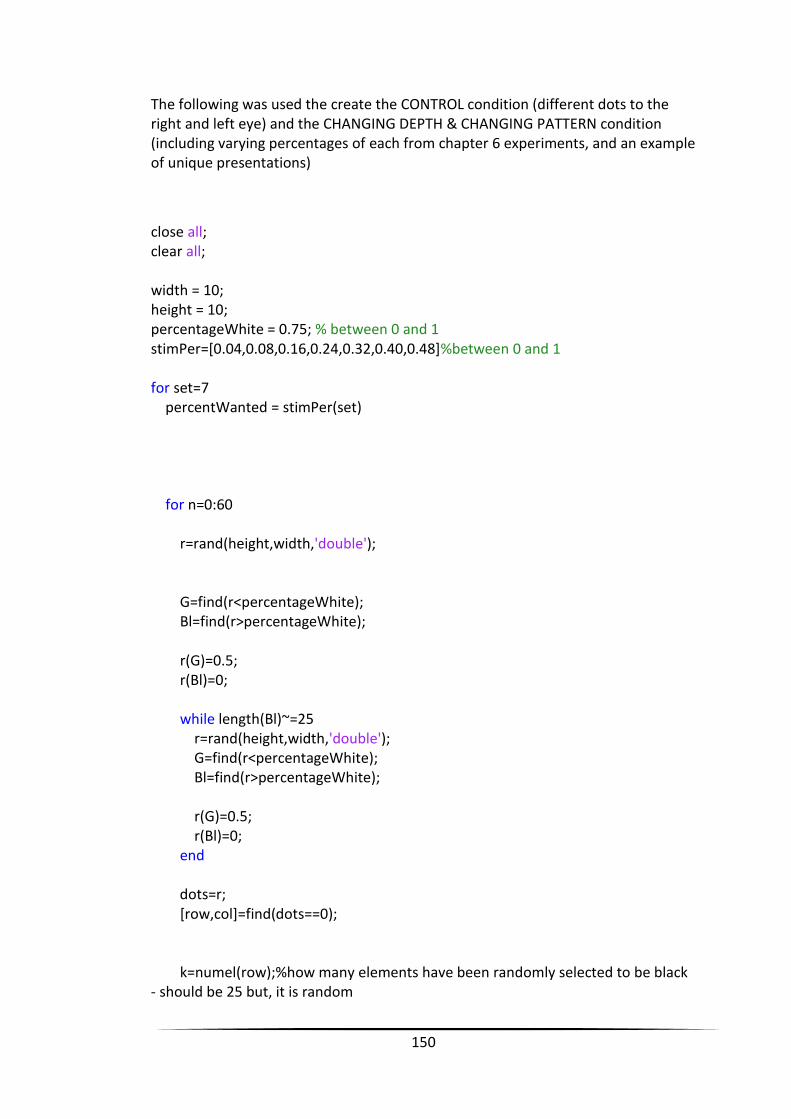
150
The following was used the create the CONTROL condition (different dots to the right and left eye) and the CHANGING DEPTH & CHANGING PATTERN condition (including varying percentages of each from chapter 6 experiments, and an example of unique presentations)
close all; clear all; width = 10; height = 10; percentageWhite = 0.75; % between 0 and 1 stimPer=[0.04,0.08,0.16,0.24,0.32,0.40,0.48]%between 0 and 1 for set=7 percentWanted = stimPer(set) for n=0:60 r=rand(height,width,'double'); G=find(r<percentageWhite); Bl=find(r>percentageWhite); r(G)=0.5; r(Bl)=0; while length(Bl)~=25 r=rand(height,width,'double'); G=find(r<percentageWhite); Bl=find(r>percentageWhite); r(G)=0.5; r(Bl)=0; end dots=r; [row,col]=find(dots==0); k=numel(row);%how many elements have been randomly selected to be black - should be 25 but, it is random
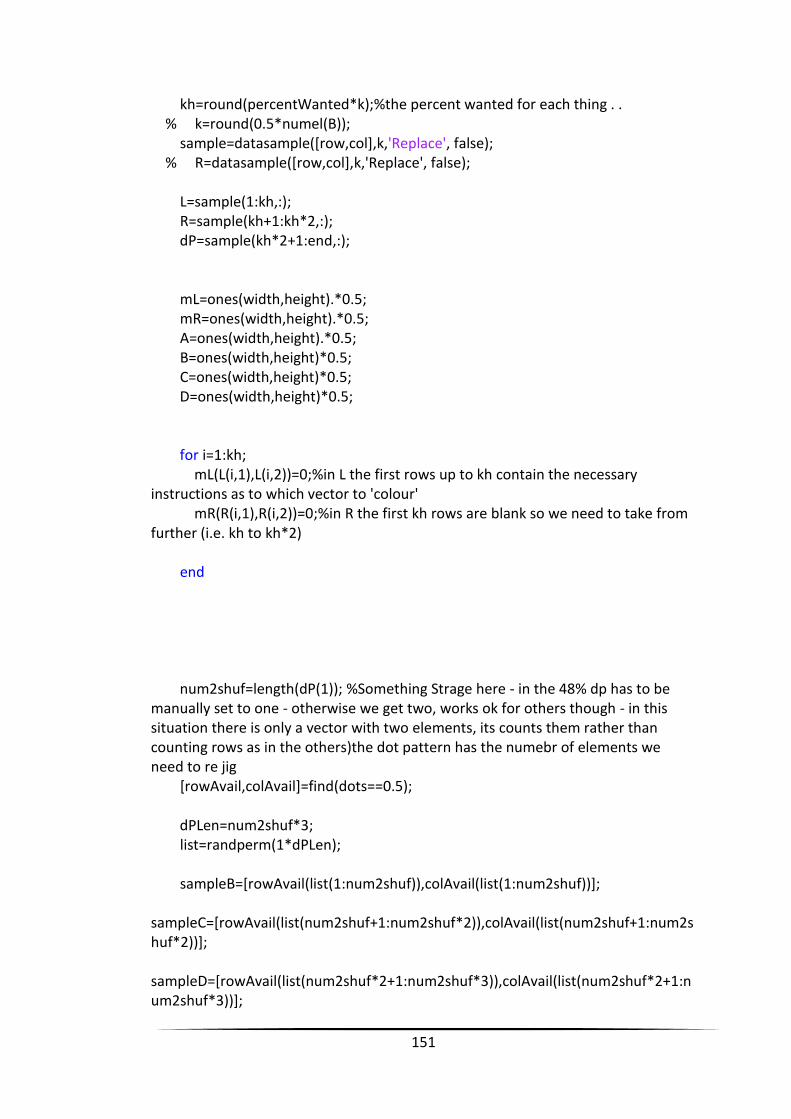
151
kh=round(percentWanted*k);%the percent wanted for each thing . . % k=round(0.5*numel(B)); sample=datasample([row,col],k,'Replace', false); % R=datasample([row,col],k,'Replace', false); L=sample(1:kh,:); R=sample(kh+1:kh*2,:); dP=sample(kh*2+1:end,:); mL=ones(width,height).*0.5; mR=ones(width,height).*0.5; A=ones(width,height).*0.5; B=ones(width,height)*0.5; C=ones(width,height)*0.5; D=ones(width,height)*0.5; for i=1:kh; mL(L(i,1),L(i,2))=0;%in L the first rows up to kh contain the necessary instructions as to which vector to 'colour' mR(R(i,1),R(i,2))=0;%in R the first kh rows are blank so we need to take from further (i.e. kh to kh*2) end num2shuf=length(dP(1)); %Something Strage here - in the 48% dp has to be manually set to one - otherwise we get two, works ok for others though - in this situation there is only a vector with two elements, its counts them rather than counting rows as in the others)the dot pattern has the numebr of elements we need to re jig [rowAvail,colAvail]=find(dots==0.5); dPLen=num2shuf*3; list=randperm(1*dPLen); sampleB=[rowAvail(list(1:num2shuf)),colAvail(list(1:num2shuf))]; sampleC=[rowAvail(list(num2shuf+1:num2shuf*2)),colAvail(list(num2shuf+1:num2shuf*2))]; sampleD=[rowAvail(list(num2shuf*2+1:num2shuf*3)),colAvail(list(num2shuf*2+1:num2shuf*3))];
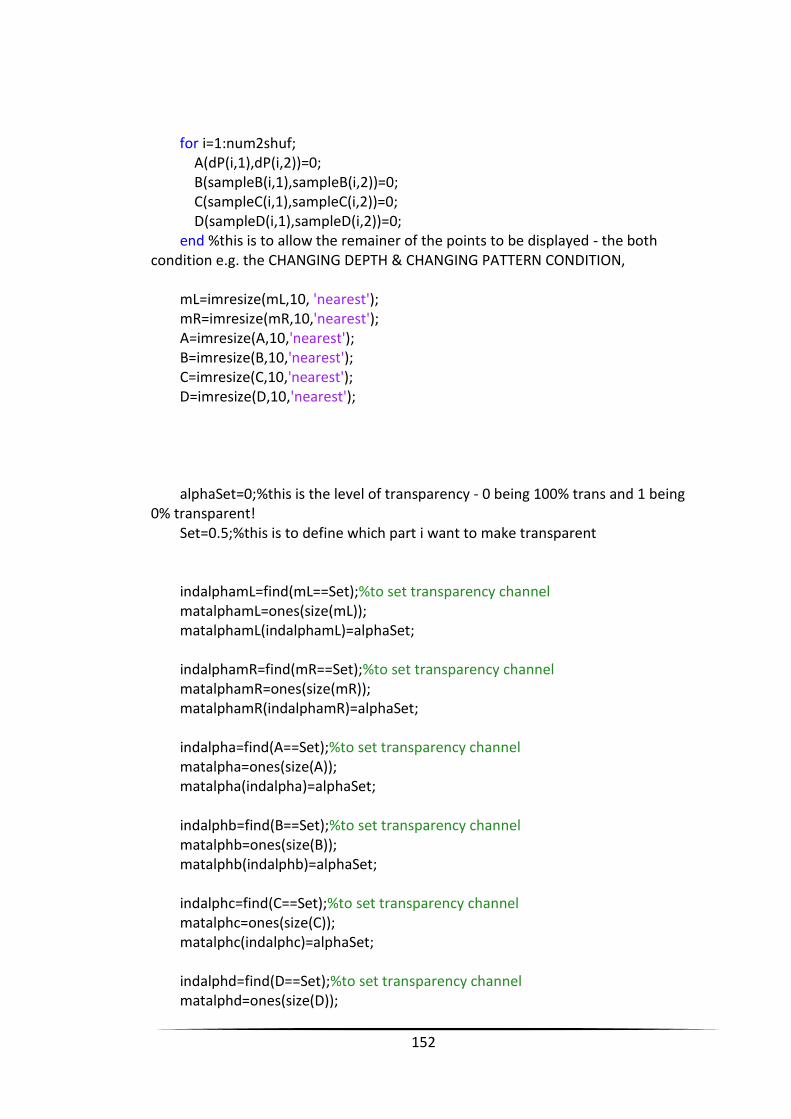
152
for i=1:num2shuf; A(dP(i,1),dP(i,2))=0; B(sampleB(i,1),sampleB(i,2))=0; C(sampleC(i,1),sampleC(i,2))=0; D(sampleD(i,1),sampleD(i,2))=0; end %this is to allow the remainer of the points to be displayed - the both condition e.g. the CHANGING DEPTH & CHANGING PATTERN CONDITION, mL=imresize(mL,10, 'nearest'); mR=imresize(mR,10,'nearest'); A=imresize(A,10,'nearest'); B=imresize(B,10,'nearest'); C=imresize(C,10,'nearest'); D=imresize(D,10,'nearest'); alphaSet=0;%this is the level of transparency - 0 being 100% trans and 1 being 0% transparent! Set=0.5;%this is to define which part i want to make transparent indalphamL=find(mL==Set);%to set transparency channel matalphamL=ones(size(mL)); matalphamL(indalphamL)=alphaSet; indalphamR=find(mR==Set);%to set transparency channel matalphamR=ones(size(mR)); matalphamR(indalphamR)=alphaSet; indalpha=find(A==Set);%to set transparency channel matalpha=ones(size(A)); matalpha(indalpha)=alphaSet; indalphb=find(B==Set);%to set transparency channel matalphb=ones(size(B)); matalphb(indalphb)=alphaSet; indalphc=find(C==Set);%to set transparency channel matalphc=ones(size(C)); matalphc(indalphc)=alphaSet; indalphd=find(D==Set);%to set transparency channel matalphd=ones(size(D));
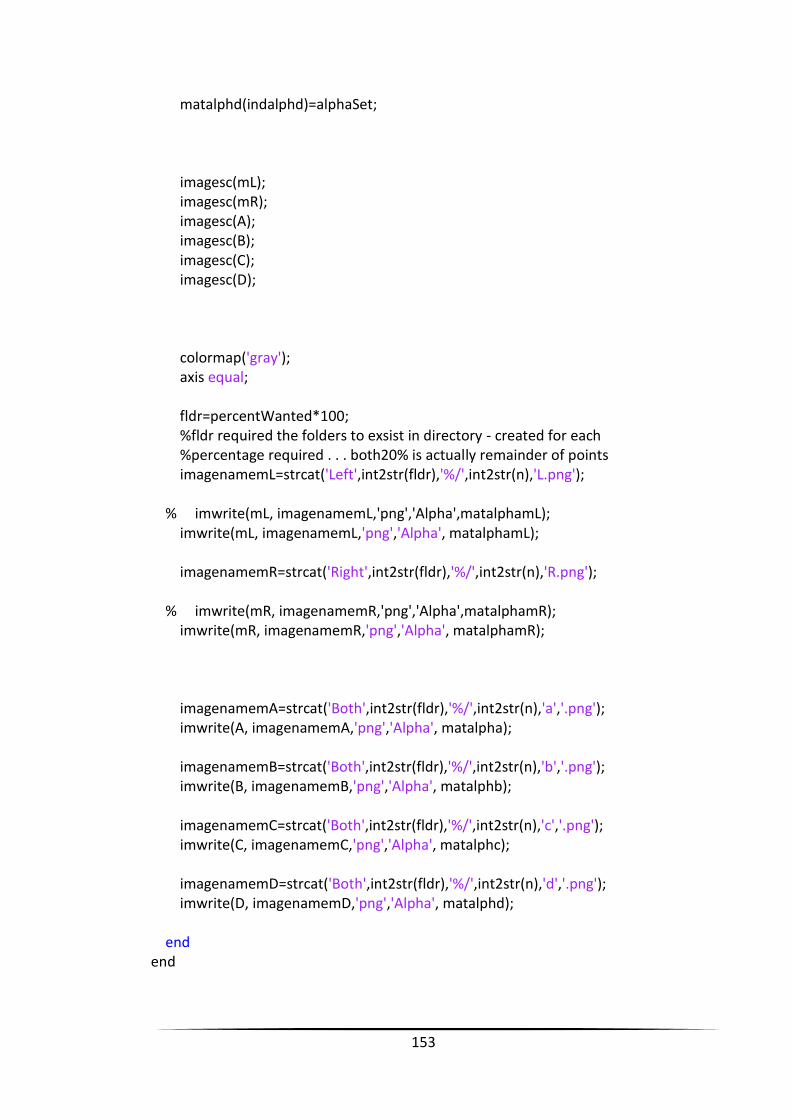
153
matalphd(indalphd)=alphaSet; imagesc(mL); imagesc(mR); imagesc(A); imagesc(B); imagesc(C); imagesc(D); colormap('gray'); axis equal; fldr=percentWanted*100; %fldr required the folders to exsist in directory - created for each %percentage required . . . both20% is actually remainder of points imagenamemL=strcat('Left',int2str(fldr),'%/',int2str(n),'L.png'); % imwrite(mL, imagenamemL,'png','Alpha',matalphamL); imwrite(mL, imagenamemL,'png','Alpha', matalphamL); imagenamemR=strcat('Right',int2str(fldr),'%/',int2str(n),'R.png'); % imwrite(mR, imagenamemR,'png','Alpha',matalphamR); imwrite(mR, imagenamemR,'png','Alpha', matalphamR); imagenamemA=strcat('Both',int2str(fldr),'%/',int2str(n),'a','.png'); imwrite(A, imagenamemA,'png','Alpha', matalpha); imagenamemB=strcat('Both',int2str(fldr),'%/',int2str(n),'b','.png'); imwrite(B, imagenamemB,'png','Alpha', matalphb); imagenamemC=strcat('Both',int2str(fldr),'%/',int2str(n),'c','.png'); imwrite(C, imagenamemC,'png','Alpha', matalphc); imagenamemD=strcat('Both',int2str(fldr),'%/',int2str(n),'d','.png'); imwrite(D, imagenamemD,'png','Alpha', matalphd); end end
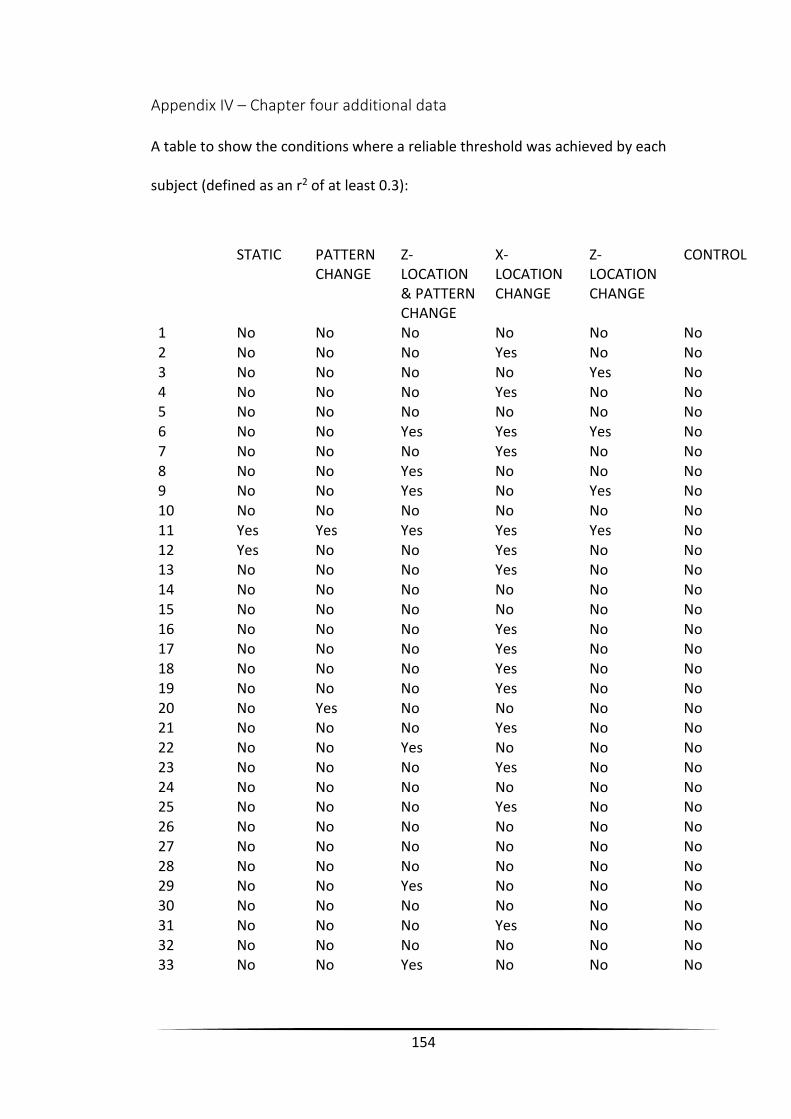
154
Appendix IV – Chapter four additional data
A table to show the conditions where a reliable threshold was achieved by each
subject (defined as an r2 of at least 0.3):
STATIC PATTERN
CHANGE Z-LOCATION & PATTERN CHANGE
X-LOCATION CHANGE
Z-LOCATION CHANGE
CONTROL
1 No No No No No No 2 No No No Yes No No 3 No No No No Yes No 4 No No No Yes No No 5 No No No No No No 6 No No Yes Yes Yes No 7 No No No Yes No No 8 No No Yes No No No 9 No No Yes No Yes No 10 No No No No No No 11 Yes Yes Yes Yes Yes No 12 Yes No No Yes No No 13 No No No Yes No No 14 No No No No No No 15 No No No No No No 16 No No No Yes No No 17 No No No Yes No No 18 No No No Yes No No 19 No No No Yes No No 20 No Yes No No No No 21 No No No Yes No No 22 No No Yes No No No 23 No No No Yes No No 24 No No No No No No 25 No No No Yes No No 26 No No No No No No 27 No No No No No No 28 No No No No No No 29 No No Yes No No No 30 No No No No No No 31 No No No Yes No No 32 No No No No No No 33 No No Yes No No No
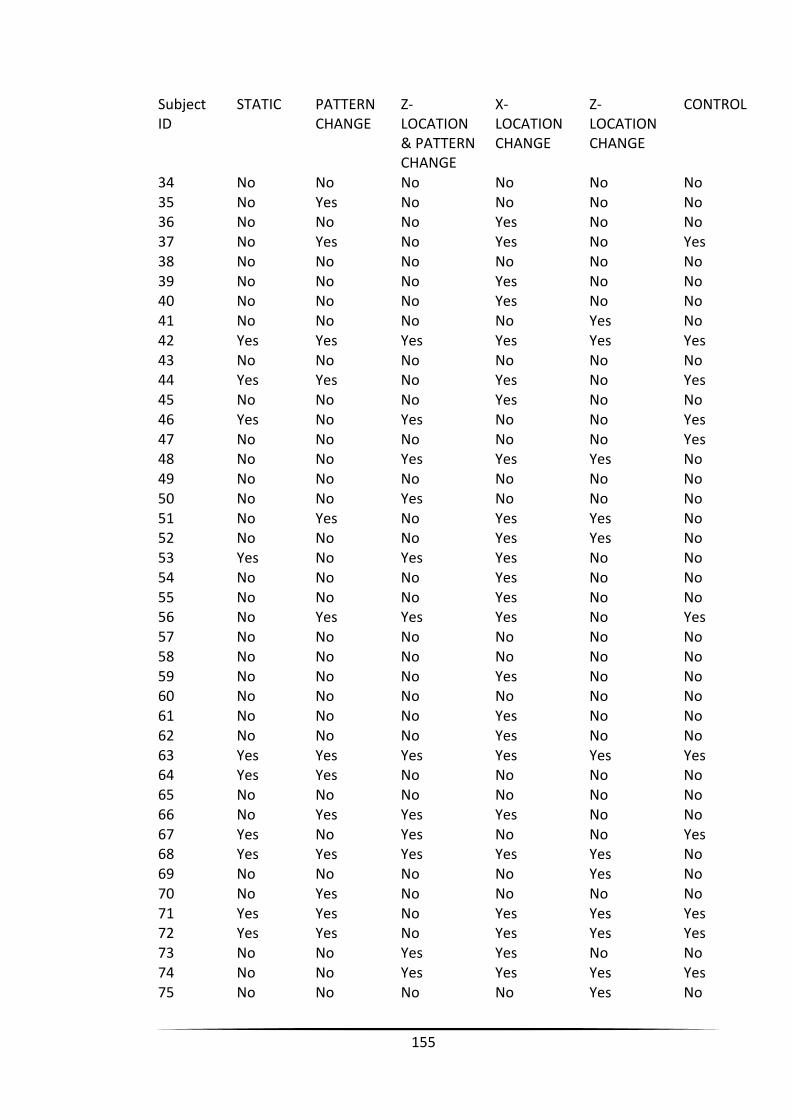
155
Subject ID
STATIC PATTERN CHANGE
Z-LOCATION & PATTERN CHANGE
X-LOCATION CHANGE
Z-LOCATION CHANGE
CONTROL
34 No No No No No No 35 No Yes No No No No 36 No No No Yes No No 37 No Yes No Yes No Yes 38 No No No No No No 39 No No No Yes No No 40 No No No Yes No No 41 No No No No Yes No 42 Yes Yes Yes Yes Yes Yes 43 No No No No No No 44 Yes Yes No Yes No Yes 45 No No No Yes No No 46 Yes No Yes No No Yes 47 No No No No No Yes 48 No No Yes Yes Yes No 49 No No No No No No 50 No No Yes No No No 51 No Yes No Yes Yes No 52 No No No Yes Yes No 53 Yes No Yes Yes No No 54 No No No Yes No No 55 No No No Yes No No 56 No Yes Yes Yes No Yes 57 No No No No No No 58 No No No No No No 59 No No No Yes No No 60 No No No No No No 61 No No No Yes No No 62 No No No Yes No No 63 Yes Yes Yes Yes Yes Yes 64 Yes Yes No No No No 65 No No No No No No 66 No Yes Yes Yes No No 67 Yes No Yes No No Yes 68 Yes Yes Yes Yes Yes No 69 No No No No Yes No 70 No Yes No No No No 71 Yes Yes No Yes Yes Yes 72 Yes Yes No Yes Yes Yes 73 No No Yes Yes No No 74 No No Yes Yes Yes Yes 75 No No No No Yes No
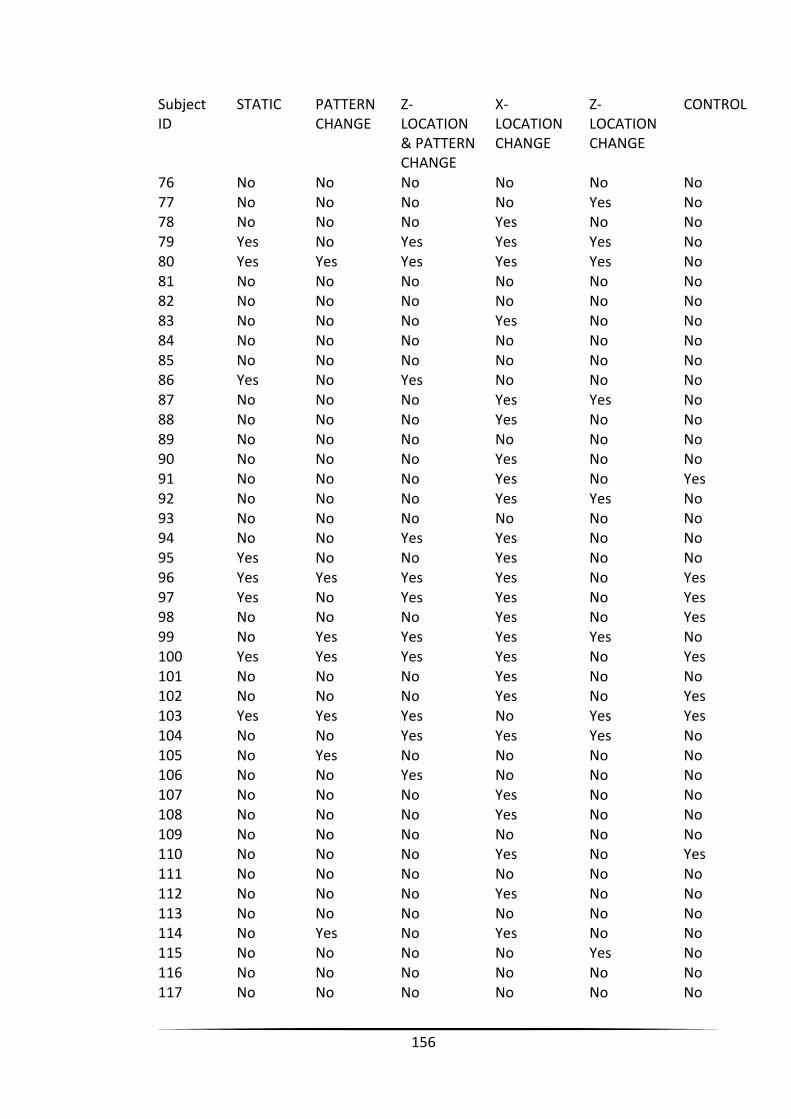
156
Subject ID
STATIC PATTERN CHANGE
Z-LOCATION & PATTERN CHANGE
X-LOCATION CHANGE
Z-LOCATION CHANGE
CONTROL
76 No No No No No No 77 No No No No Yes No 78 No No No Yes No No 79 Yes No Yes Yes Yes No 80 Yes Yes Yes Yes Yes No 81 No No No No No No 82 No No No No No No 83 No No No Yes No No 84 No No No No No No 85 No No No No No No 86 Yes No Yes No No No 87 No No No Yes Yes No 88 No No No Yes No No 89 No No No No No No 90 No No No Yes No No 91 No No No Yes No Yes 92 No No No Yes Yes No 93 No No No No No No 94 No No Yes Yes No No 95 Yes No No Yes No No 96 Yes Yes Yes Yes No Yes 97 Yes No Yes Yes No Yes 98 No No No Yes No Yes 99 No Yes Yes Yes Yes No 100 Yes Yes Yes Yes No Yes 101 No No No Yes No No 102 No No No Yes No Yes 103 Yes Yes Yes No Yes Yes 104 No No Yes Yes Yes No 105 No Yes No No No No 106 No No Yes No No No 107 No No No Yes No No 108 No No No Yes No No 109 No No No No No No 110 No No No Yes No Yes 111 No No No No No No 112 No No No Yes No No 113 No No No No No No 114 No Yes No Yes No No 115 No No No No Yes No 116 No No No No No No 117 No No No No No No
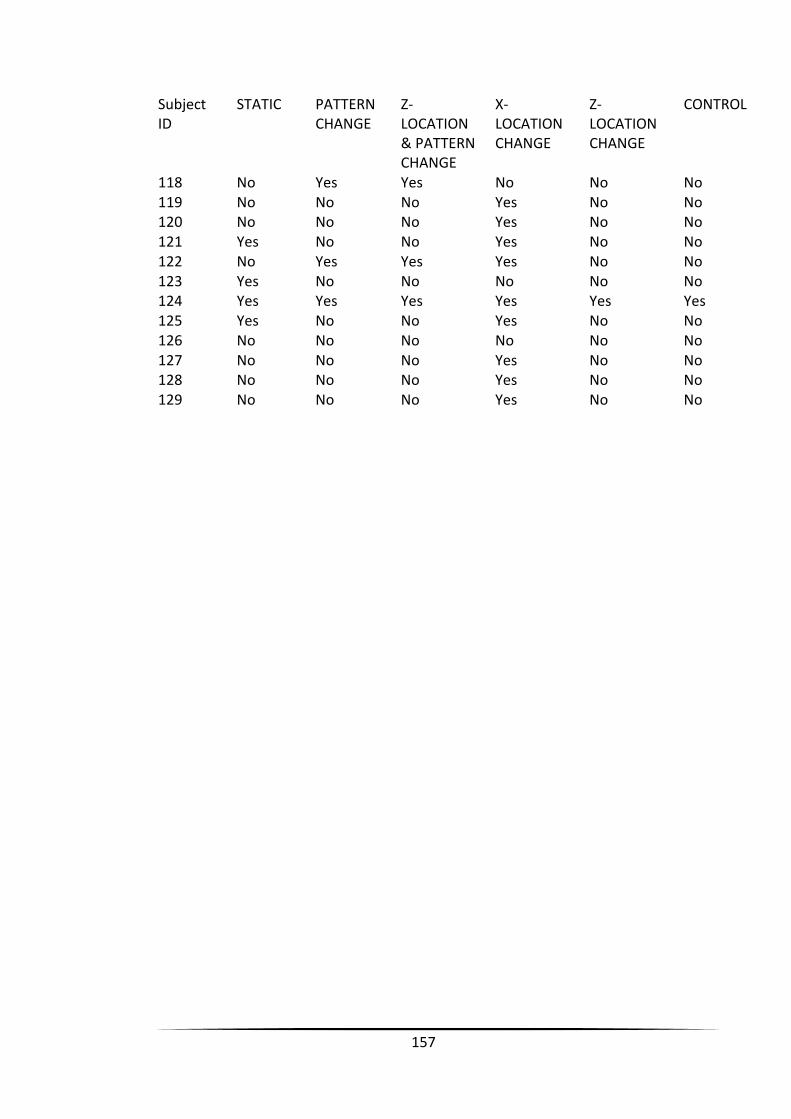
157
Subject ID
STATIC PATTERN CHANGE
Z-LOCATION & PATTERN CHANGE
X-LOCATION CHANGE
Z-LOCATION CHANGE
CONTROL
118 No Yes Yes No No No 119 No No No Yes No No 120 No No No Yes No No 121 Yes No No Yes No No 122 No Yes Yes Yes No No 123 Yes No No No No No 124 Yes Yes Yes Yes Yes Yes 125 Yes No No Yes No No 126 No No No No No No 127 No No No Yes No No 128 No No No Yes No No 129 No No No Yes No No

158
Appendix V –Sections as published
The sections of the published papers appear in sections, as detailed in bold.
Chapter Three: Tidbury LP, O'Connor AR, Wuerger SM. Dynamic Cues to Binocular
Depth. Br Ir Orthopt J 2016;13.
All areas of project carried out by LT, with review and advice from AOC and SW. This
paper forms chapter three of the thesis.
Chapter Four: Tidbury LP, Brooks KR, O’Connor AR, Wuerger SM. A systematic
comparison of static and dynamic cues for depth perception. Invest Ophthalmol Vis
Sci 2016;57(8):3545-3553.
All areas of project carried out by LT, with review and advice from AOC, SW and KB. The paper forms chapter four of the thesis.
159
References
(1) Nefs HT, Harris JM. What visual information is used for stereoscopic depth displacement discrimination? Perception 2010;39(6):727-744.
(2) Nefs HT, O'Hare L, Harris JM. Two independent mechanisms for motion-in-depth perception: Evidence from individual differences. Front Psychology 2010;1.
(3) Brooks KR, Stone LS. Stereomotion speed perception: Contributions from both changing disparity and interocular velocity difference over a range of relative disparities. Journal of Vision 2004;4(12):1061-1079.
(4) Regan D, Erkelens CJ, Collewijn H. Necessary conditions for the perception of motion in depth. Invest Ophthalmol Visual Sci 1986;27(4):584-597.
(5) Regan D, Beverley KI. Some dynamic features of depth perception. Vision Res 1973;13(12):2369-2379.
(6) Cumming B, Parker A. Binocular Mechanisms for Detecting Motion-In-Depth. Vision Res 1994 Feb;34(4):483-495.
(7) Brooks KR. Interocular velocity difference contributes to stereomotion speed perception. Journal of Vision 2002;2(3):218-231.
(8) Tai Y-, Gowrisankaran S, Yang S-, Sheedy JE, Hayes JR, Younkin AC, et al. Depth perception from stationary and moving stereoscopic threedimensional images. Proc SPIE-Int Soc Opt Eng 2013;8648.
(9) Weldon RJ, Slingerland DA, Myers JT. Induced stereoscopic motion as an aid in the search for tall targets. Hum Factors 1968;10(4):385-392.
(10) Zinn WJ, Solomon H. A comparison of static and dynamic stereoacuity. J Am Optom Assoc 1985;56(9):712-715.
(11) Mollenhauer KA, Haase W. Preliminary report: Dynamic stereopsis in patients with impaired binocular function. Strabismus 2000;8(4):275-281.
(12) Fujikado T, Hosohata J, Ohmi G, Asonuma S, Yamada T, Maeda N, et al. Use of dynamic and colored stereogram to measure stereopsis in strabismic patients. Jpn J Ophthalmol 1998;42(2):101-107.
(13) Watanabe Y, Kezuka T, Harasawa K, Usui M, Yaguchi H, Shioiri S. A new method for assessing motion-in-depth perception in strabismic patients. Br J Ophthalmol 2008;92(1):47-50.
160
(14) Maeda M, Sato M, Ohmura T, Miyazaki Y, Wang A-, Awaya S. Binocular depth-from-motion in infantile and late-onset esotropia patients with poor stereopsis. Invest Ophthalmol Visual Sci 1999;40(12):3031-3036.
(15) Hess RF, Mansouri B, Thompson B, Gheorghiu E. Latent stereopsis for motion in depth in Strabismic Amblyopia. Invest Ophthalmol Visual Sci 2009;50(10):5006-5016.
(16) Kitaoji H, Toyama K. Preservation of position and motion stereopsis in strabismic subjects. Invest Ophthalmol Vis Sci 1987 Aug;28(8):1260-1267.
(17) Hong X, Regan D. Visual-Field Defects for Unidirectional and Oscillatory Motion in Depth. Vision Res 1989;29(7):809-819.
(18) Richards W, Regan D. A stereo field map with implications for disparity processing. Invest Ophthalmol 1973;12(12):904-909.
(19) Barendregt M, Dumoulin SO, Rokers B. Stereomotion scotomas occur after binocular combination. Vis Res 2014;105:92-99.
(20) - Pala S, - Stevens R, - Surman P. - Optical cross-talk and visual comfort of a stereoscopic display used in a real-time application. - 2007;- 6490(-):- 649011.
(21) Peirce JW. PsychoPy-Psychophysics software in Python. J Neurosci Methods 2007;162(1-2):8-13.
(22) Levitt H. Transformed up- down methods in psychoacoustics. J Acoust Soc Am 1971;49(2 pt 2):467-477.
(23) Brooks KR, Gillam BJ. The swinging doors of perception: Stereomotion without binocular matching. Journal of Vision 2006;6(7):685-695.
(24) Brooks KR, Gillam BJ. Stereomotion perception for a monocularly camouflaged stimulus. Journal of Vision 2007;7(13).
(25) Ruppertsberg A, Wuerger SM, Bertamini M. S-cone input into global motion processing. Journal of Vision 2003;3(9).
(26) Multi-ethnic Pediatric Eye Disease Study Group. Prevalence of amblyopia and strabismus in African American and Hispanic children ages 6 to 72 months the multi-ethnic pediatric eye disease study. Ophthalmology 2008 Jul;115(7):1229-1236.e1.
(27) Williams C, Northstone K, Howard M, Harvey I, Harrad RA, Sparrow JM. Prevalence and risk factors for common vision problems in children: data from the ALSPAC study. Br J Ophthalmol 2008 Jul;92(7):959-964.
161
(28) Friedman DS, Repka MX, Katz J, Giordano L, Ibironke J, Hawse P, et al. Prevalence of amblyopia and strabismus in white and African American children aged 6 through 71 months the Baltimore Pediatric Eye Disease Study. Ophthalmology 2009 Nov;116(11):2128-34.e1-2.
(29) McKean-Cowdin R, Cotter SA, Tarczy-Hornoch K, Wen G, Kim J, Borchert M, et al. Prevalence of amblyopia or strabismus in asian and non-Hispanic white preschool children: multi-ethnic pediatric eye disease study. Ophthalmology 2013 Oct;120(10):2117-2124.
(30) Arnold RW, Davidson S, Madigan WP. Stereopsis and 3-D movies. J Pediatr Ophthalmol Strabismus 2011;48(4):199-201.
(31) Tidbury LP, Black RH, O'Connor AR. Perceiving 3D in the Absence of Measurable Stereoacuity. Br Ir Orthopt J 2014;11.
(32) Tidbury LP, Black RH, O'Connor AR. Clinical Assessment of Stereoacuity and 3D Stereoscopic Entertainment. Strabismus 2015;23(4):164-169.
(33) Vishwanath D, Hibbard PB. Seeing in 3-D With Just One Eye: Stereopsis Without Binocular Vision. Psychological Science 2013;24(9):1673-1685.
(34) Regan D. Binocular correlates of the direction of motion in depth. Vision Res 1993;33(16):2359-2360.
(35) Tidbury LP, Brooks KR, O’Connor AR, Wuerger SM. A systematic comparison of static and dynamic cues for depth perception. Invest Ophthalmol Vis Sci 2016;57(8):3545-3553.
(36) Harris JM, McKee SP, Watamaniuk SN. Visual search for motion-in-depth: stereomotion does not 'pop out' from disparity noise. Nat Neurosci 1998 Jun;1(2):165-168.
(37) Rouse MW, Tittle JS, Braunstein ML. Stereoscopic depth perception by static stereo-deficient observers in dynamic displays with constant and changing disparity. Optometry Vision Sci 1989;66(6):355-362.
(38) Allison RS, Howard IP. Stereopsis with persisting and dynamic textures. Vision Res 2000 12;40(28):3823-3827.
(39) Ziegler LR, Roy J-. Large scale stereopsis and optic flow: Depth enhanced by speed and opponent-motion. Vision Res 1998;38(9):1199-1209.
(40) Ramamurthy M, Bedell HE, Patel SS. Stereothresholds for moving line stimuli for a range of velocities. Vision Res 2005;45(6):789-799.
162
(41) Hall C. The relationship between clinical stereotests. Ophthalmic Physiol Opt 1982;2(2):135-143.
(42) Westheimer G. Clinical evaluation of stereopsis. Vision Res 2013;90:38-42.
(43) Heron S, Lages M. Screening and sampling in studies of binocular vision. Vision Res 2012;62:228-234.
(44) McKee SP. The spatial requirements for fine stereoacuity. Vision Res 1983;23(2):191-198.
(45) Bosten JM, Goodbourn PT, Lawrance-Owen AJ, Bargary G, Hogg RE, Mollon JD. A population study of binocular function. Vis Res 2015(Part A):34-50.
(46) Bohr I, Read JCA. Stereoacuity with frisby and revised FD2 stereo tests. PLoS ONE 2013;8(12).
(47) Coutant BE, Westheimer G. Population distribution of stereoscopic ability. Ophthalmic Physiol Opt 1993;13(1):3-7.
(48) Zaroff CM, Knutelska M, Frumkes TE. Variation in stereoacuity: Normative description, fixation disparity, and the roles of aging and gender. Invest Ophthalmol Vis Sci 2003;44(2):891-900.
(49) Bradshaw MF, Rogers BJ. Sensitivity to horizontal and vertical corrugations defined by binocular disparity. Vis Res 1999;39(18):3049-3056.
(50) Rawlings SC, Shipley T. Stereoscopic Acuity and Horizontal Angular Distance from Fixation. J Opt Soc Amer 1969;59(8 pt 1):991-993.
(51) Siderov J, Harwerth RS. Stereopsis, spatial frequency and retinal eccentricity. Vis Res 1995;35(16):2329-2337.
(52) Howard HT. A test for the judgment of distance. Am J Ophthalmol 1919;2(9):656-675.
(53) Shioiri S, Saisho H, Yaguchi H. Motion in depth based on inter-ocular velocity differences. Vision Res 2000;40(19):2565-2572.
(54) O'Connor AR, Birch EE, Anderson S, Draper H. The functional significance of stereopsis. Invest Ophthalmol Visual Sci 2010;51(4):2019-2023.
(55) Piano ME, O'Connor AR. The effect of degrading binocular single vision upon fine motor skill task performance. Invest Ophthalmol Vis Sci 2013 Nov 12;54(13).
163
(56) Grant S, Suttle C, Melmoth DR, Conway ML, Sloper JJ. Age- and Stereovision-Dependent Eye-Hand Coordination Deficits in Children With Amblyopia and Abnormal Binocularity. IOVS 2014 SEP;55(9):5687-5701.
(57) Biddle M, Hamid S, Ali N. An evaluation of stereoacuity (3D vision) in practising surgeons across a range of surgical specialities. The Surgeon 2014 FEB;12(1):7-10.
(58) Read JCA, Begum SF, McDonald A, Trowbridge J. The binocular advantage in visuomotor tasks involving tools. i-Perception 2013;4(2):101-110.
(59) Cumming BG, Parker AJ. Local disparity not perceived depth is signaled by binocular neurons in cortical area V1 of the macaque. J Neurosci 2000;20(12):4758-4767.
(60) Worth C. The orthoptic treatment of convergent squint in young children. Trans Ophthalmol Soc U K 1901;21:245-258.
(61) Holmes JM, Birch EE, Leske DA, Fu VL, Mohney BG. New Tests of Distance Stereoacuity and Their Role in Evaluating Intermittent Exotropia. Ophthalmology 2007;114(6):1215-1220.
(62) Stathacopoulos RA, Rosenbaum AL, Zanoni D, Stager DR, McCall LC, Ziffer AJ, et al. Distance stereoacuity: Assessing control in intermittent exotropia. Ophthalmology 1993;100(4):495-500.
(63) Fu VLN, Stager DR, Birch EE. Progression of intermittent, small-angle, and variable esotropia in infancy. Invest Ophthalmol Vis Sci 2007;48(2):661-664.
(64) O'Neal TD, Rosenbaum AL, Stathacopoulos RA. Distance stereo acuity improvement in intermittent exotropic patients following strabismus surgery. J Pediatr Ophthal Strabismus 1995;32(6):353-357.
(65) Laird PW, Hatt SR, Leske DA, Holmes JM. Distance stereoacuity in prism-induced convergence stress. Journal of AAPOS 2008;12(4):370-374.
(66) Laird PW, Hatt SR, Leske DA, Holmes JM. Stereoacuity and binocular visual acuity in prism-induced exodeviation. J AAPOS 2007;11(4):362-366.
(67) Adams WE, Leske DA, Hatt SR, Holmes JM. Defining Real Change in Measures of Stereoacuity. Ophthalmology 2009;116(2):281-285.
(68) Fawcett SL, Birch EE. Interobserver test-retest reliability of the Randot Preschool Stereoacuity test. J AAPOS 2000;4(6):354-358.
(69) Vision in Preschoolers Study Group. Random Dot E stereotest: Testability and reliability in 3- to 5-year-old children. J AAPOS 2006;10(6):507-514.
164
(70) Fray KJ. Fusional amplitudes: Exploring where fusion falters. Am Orthopt J 2013;63(1):41-54.
(71) Rosenfield M, Ciuffreda KJ, Ong E, Super S. Vergence adaptation and the order of clinical vergence range testing. Optometry Vision Sci 1995;72(4):219-223.
(72) Hatt SR, Haggerty H, Buck D, Adams W, Strong NP, Clarke MP. Distance stereoacuity in intermittent exotropia. Br J Ophthalmol 2007;91(2):219-221.
(73) Harris JM, Nefs HT, Grafton CE. Binocular vision and motion-in-depth. Spat Vis 2008;21(6):531-547.
(74) Bradshaw MF, Glennerster A. Stereoscopic acuity and observation distance. Spat Vision 2006;19(1):21-36.
(75) Ukwade MT, Harwerth RS, Bedell HE. Stereoscopic acuity, observation distance and fixation disparity: A commentary on 'Stereoscopic acuity and observation distance' by Bradshaw and Glennerster (2006). Spat Vision 2007;20(5):489-492.
(76) Brown JP, Ogle KN, Reiher L. Stereoscopic acuity and observation distance. Invest Ophthalmol 1965;4(5):894-900.
(77) Brooks KR, Stone LS. Stereomotion suppression and the perception of speed: Accuracy and precision as a function of 3D trajectory. Journal of Vision 2006;6(11):1214-1223.
(78) Fernandez JM, Farell B. Motion in depth from interocular velocity differences revealed by differential motion aftereffect. Vision Res 2006;46(8-9):1307-1317.
(79) Wardle SG, Alais D. Evidence for speed sensitivity to motion in depth from binocular cues. J Vis 2013;13(1).
(80) Blackwolf B. I Am Stereoblind, But The Oculus Rift Is My Corrective Lens. 2013; Available at: http://www.vognetwork.com/rifting-to-a-new-reality/118/I-Am-Stereoblind-But-The-Oculus-Rift-Is-My-Corrective-Lens/. Accessed Feb/01, 2014.
(81) Child B. 3D movie improves man's vision after lifetime of impairment. 2013; Available at: http://www.theguardian.com/film/2013/jun/17/3d-movie-hugo-improves-mans-vision. Accessed Feb/01, 2014.
(82) Kokoris G. I Am Stereoblind, But the 3DS Lets Me See the World as Others See It. 2013; Available at: http://kotaku.com/i-am-stereoblind-but-the-3ds-lets-me-see-the-world-as-484508038. Accessed Feb/01, 2014.
(83) Tidbury L, Black R, O'Connor A. Clinical Assessment of Stereoacuity and 3D Stereoscopic Entertainment. Strabismus 2015.
165
(84) Harris JM, Watamaniuk SNJ. Speed discrimination of motion-in-depth using binocular cues. Vision Res 1995;35(7):885-896.
(85) Wilcox LM. First and second-order contributions to surface interpolation. Vis Res 1999;39(14):2335-2347.
(86) Wilcox LM, Elder JH, Hess RF. The effect of stimulus blur and size on stereoacuity. Invest Ophthalmol Vis Sci 1996;37(3).
(87) Ziegler LR, Hess RF. Stereoscopic depth but not shape perception from second-order stimuli. Vis Res 1999;39(8):1491-1507.
(88) Kaernbach C. Simple adaptive testing with the weighted up-down method. Percept Psychophys 1991;49(3):227-229.
(89) Treutwein B. Adaptive psychophysical procedures. Vis Res 1995;35(17):2503-2522.
(90) Ansons AM, Davis H. Diagnosis and management of ocular motility disorders. Chichester, West Sussex, UK: John Wiley & Sons, Ltd; 2014.
(91) Nienborg H, Bridge H, Parker AJ, Cumming BG. Neuronal computation of disparity in V1 limits temporal resolution for detecting disparity modulation. J Neurosci 2005;25(44):10207-10219.
(92) Henriksen S, Tanabe S, Cumming B. Disparity processing in primary visual cortex. Philos Trans R Soc B Biol Sci 2016;371(1697).
(93) Kane D, Guan P, Banks MS. The limits of human stereopsis in space and time. J Neurosci 2014;34(4):1397-1408.
(94) Neri P, Bridge H, Heeger DJ. Stereoscopic processing of absolute and relative disparity in human visual cortex. J Neurophysiol 2004;92(3):1880-1891.
(95) Is the hMT+/V5 complex in the human brain involved in stereomotion perception? An fMRI study. Proceedings of SPIE - The International Society for Optical Engineering; 2004.
(96) Likova LT, Tyler CW. Stereomotion processing in the human occipital cortex. Neuroimage 2007;38(2):293-305.
(97) Czuba TB, Huk AC, Cormack LK, Kohn A. Area MT encodes three-dimensional motion. J Neurosci 2014;34(47):15522-15533.
(98) Orban GA, Sunaert S, Todd JT, Van Hecke P, Marchal G. Human cortical regions involved in extracting depth from motion. Neuron 1999;24(4):929-940.
166
(99) Sengpiel F, Jirmann K-, Vorobyov V, Eysel UT. Strabismic suppression is mediated by inhibitory interactions in the primary visual cortex. Cereb Cortex 2006;16(12):1750-1758.
(100) Mower GD, Chen L. Laminar distribution of NMDA receptor subunit (NR1, NR2A, NR2B) expression during the critical period in cat visual cortex. Mol Brain Res 2003 11/6;119(1):19-27.
(101) Baker DH, Meese TS, Mansouri B, Hess RF. Binocular summation of contrast remains intact in strabismic amblyopia. Invest Ophthalmol Vis Sci 2007;48(11):5332-5338.
(102) Hess RF, Mansouri B, Thompson B. Restoration of binocular vision in amblyopia. Strabismus 2011;19(3):110-118.
(103) Hess RF, Mansouri B, Thompson B. A binocular approach to treating amblyopia: Antisuppression therapy. Optometry Vision Sci 2010;87(9):697-704.
(104) Treutwein B, Rentschler I, Zetzsche C, Scheidler M, Boergen K-. Amblyopic quasi-blindness for image structure. VIS RES 1996;36(14):2211-2228.
(105) McKee SP, Levi DM, Movshon JA. The pattern of visual deficits in amblyopia. J Vis 2003;3(5):380-405.


![Binocular Photometric Stereo - duhao.org · Real Data - Comparing with [Nehab’05]. Our method simultaneously optimizes correspondence and normal cues, therefore it operates effectively](https://img.pdfslide.us/doc/110x75/5ba1d30709d3f2716b8d33bb/binocular-photometric-stereo-duhao-real-data-comparing-with-nehab05.jpg)