Embed Size (px)
Citation preview
Ninth Canadian Conference on Earthquake Engineering Ottawa, Ontario, Canada
26-29 June 2007
DYNAMIC ANALYSIS OF GRAVITY DAMS BY FINITE ELEMENT METHOD
A.C. Adya1 and S.N. Madhekar
2
ABSTRACT
Concerns about the seismic safety of concrete dams have been growing during recent years. Seismic design concepts in use, at the time most existing dams were built, were inadequate. To account for the analytical and design uncertainties, a large factor of safety has been used in the design of many dams. But this does not necessarily ensure a safe and at the same time, efficient design. This paper tries to address such issues by simulating realistic conditions for seismic analysis of gravity dams.
Introduction
While codes of practice provide strict design guidance, they are not a replacement for a detailed analysis based on conceptual application of advanced techniques of structural analysis. The pseudostatic analysis carried out as per the guidelines of IS 1893 (1984) does not fairly represent the stress distribution resulting from true dynamic behaviour. This has led to significant structural inadequacies in many Indian dams. Thus a detailed computational analysis simulating a more acceptable dynamic behaviour is necessary. While doing so, due care has to be taken, in light of dynamic behaviour, to make realistic assumptions as regards fixation of boundary conditions, material properties, nonlinear behaviour, earthquake simulation mechanisms, hydrodynamic forces, uplift forces, etc. In this paper, a special investigation has been made regarding the seismic vulnerability of the spillway of a major Indian gravity dam- the Koyna dam situated at Koynanagar in Maharashtra. Sufficiency of proposed strengthening has been checked and some specific as well as generic conclusions have been drawn.
Details of the dam and proposed changes
It is a straight gravity dam structure made of rubble concrete. The last six monoliths near the left bank are not made of rubble concrete, but of hand laid rubble masonry. The general plan and elevation of the dam are shown in the figures. The entire dam is about 854 m long, 103 m high above the deepest foundation and 85 m high above the river bed. The spillway is about 91 m long. In view of past seismic activity and damages caused by them it is proposed to strengthen the dam by increasing its cross sectional area. The configuration of proposed new profile was governed by hydraulic parameters and it had to be checked for structural adequacy.
1
Structural Engineer, Fluor Daniel India Pvt. Ltd., India. 2
Professor, Department of Applied Mechanics, College of Engineering, Pune , University of Pune, India.
1782
Behaviour of the unstrengthened dam
The dam had been subjected to an earthquake of Richter magnitude 6.5 and the peak acceleration of ground motion recorded during the earthquake were 0.63g in the longitudinal direction, 0.34g in the vertical direction and 0.49g in the transverse direction. Though significant structural damages, in the form of horizontal cracks, were observed on various non-overflow monoliths, no major damages were reported for the spillway. Monolith 18 suffered the worst damage, which may have been due to several factors. It is unsymmetrical, with half of it being overflow and the remaining nonoverflow. There were evidences of relative movement between adjacent monoliths. This is to be expected because the monoliths have different heights, and therefore have different periods of vibrations which may have resulted during different motions of the earthquake. According to post earthquake studies, a crude estimation was that maximum dynamic tensile stress at the upstream face was about 2 MPa. More importantly, there was no stress concentration at the downstream face at any point and the maximum tensile stress was about 1.72 MPa. If the increase in stresses due to hydrodynamic effects is considered, the maximum tensile strength would be about 2.4 MPa which is consistent with observed behaviour of minor cracking at locations of stress concentration.
Pseudostatic Rigid Body Analysis Basic procedure
In the simplest efforts to represent the effects of earthquakes, the dam is considered to be a rigid system supported on a rigid foundation. Thus, the earthquake forces acting in the structure could be expressed as the product of the earthquake acceleration and the mass of the corresponding part of the structure. All other forces such as the those due to self weight, hydrostatic pressure, hydrodynamic pressure, uplift, etc. have been calculated as per IS 6512 (1984). For preliminary investigations, by making some simplifying assumptions, stability analysis by simple arithmetic calculations has been done. Load combinations
The design of a gravity dam is based on the most adverse combination of the loads acting on it, which includes only those loads having a reasonable probability of simultaneous occurrence. The combination of transient loads such as those due to maximum flood and earthquake are not considered because the probability of individual occurrence of each of these phenomenon is quite low and hence the probability of their simultaneous occurrence is negligible. Thus for gravity dams IS: 6512 (1984) specifies the load combination A, B, C, D, E, F and G as indicated below. 1. Load combination A : (Construction condition or empty reservoir condition) Dam completed but no water in the reservoir and no tail water. 2. Load combination B : (Normal operating condition) Full reservoir elevation (or top of gates at crest), normal dry weather tailwater, normal uplift, ice and silt if applicable. 3. Load Combination C : (Flood Discharge condition) Reservoir at maximum flood pool elevation, all gates open, tailwater at flood elevation, normal uplift and silt if applicable. 4. Load combination D : Combination A with earthquake. 5. Load combination E : Combination B with earthquake but no ice. 6. Load Combination F : Combination C, but with extreme uplift (drains inoperative). 7. Load combination G : Combination E but with extreme uplift Results of the pseudostatic analysis
Though a detailed calculation for all load cases to find out the stresses at various elevations was done, for the purpose of brevity, only the results of Load Case E (Normal Operating Condition) have been presented here graphically.
1783
The conventional pseudostatic analysis is essentially a rigid body analysis. Though it gives a good idea about the variation of vertical stresses for various load conditions and how the strengthening is effective, it is silent about the nature of elastic deformations in the dam structure leading to very crude estimation of stress distribution in the dam. Further, flexibility of the foundation is not taken into account as it is assumed that the dam rests on a rigid base. Dynamic forces acting on the dam, due to the Earthquake are considered in the form of concentrated horizontal inertial forces. As the inertia forces are distributed throughout the dam body, this does not represent the true dynamic behaviour of the dam.
Static Analysis by Finite Element Method
In view of the limitations of the conventional pseudostatic rigid body analysis, a finite element stress analysis was carried out in order to take into account the elastic deformations of the dam. The Load Condition B (FRL and Normal Uplift) and E (FRL, Normal Uplift and Earthquake) have been considered. The foundation block extending upto 150 m on both sides and 300 m deep is considered. The simulation model is considered to be constituted as a plain strain problem, with following material properties:
Modulus of elasticity of concrete = 250000 kg/sq cm. Density of concrete=0.0024 kg/sq cm. Poisson’s ratio for concrete = 0.18 Modulus of elasticity of foundation rock = 520000 kg/sq cm. Poisson’s ratio for rock = 0.15
The foundation block is considered to be massless and only the effect of its flexibility is considered. Results of the 2D analysis
The results of the 2D analysis are shown in Fig. 4. Results of the 3D Analysis
The results of the 3D analysis are shown in Fig. 5.
Linear Dynamic Analysis
The pseudostatic analysis, whether according to the provisions of IS 1893 (1984) or by the finite element method, do not give an idea about the variation with time, of the stresses in the dam. In view of the requirement to understand the dynamic behaviour in detail, an acceleration time history analysis was done. Static and dynamic stresses have been calculated separately. Static stresses are assumed to be constant during the entire time over which the earthquake occurs for all practical purposes. By knowing the difference between total permissible stresses and the static stress, a safety criterion has been established for the dynamic stresses. The critical results have been presented in the form of stress versus time graphs at selected nodes and stress contours over the dam at selected time steps. Analysis considerations
The accelerogram used is a record of the response of monolith 1A at about mid height. If this monolith was free standing it would have a natural period of about 0.1 sec. As such, it is a rather rigid structure. It is restrained significantly in the longitudinal (along the dam) axis direction by near abutment and earth fills on both sides. For the purpose of this analysis, this accelerogram has been applied at the base of the finite element model. Hydrodynamic forces have been calculated by Westergaard’s method. Rayleigh Modal Damping parameters α and β have been calculated and used in the analysis. They are 8.83x10
-1 and
2.37x10⁻³
for the unstrengthened dam and 1.13 and 1.84x10⁻³
for the strengthened dam, respectively.
1784
The acceleration time-history analysis has been carried out by ‘Direct Numerical Integration Method’ (Bathe and Wilson 1973, Newmark 1959) and more specifically by Newmark- β Method (Bathe and Wilson 1973). Newmark’s equations for approximating the velocity and displacement of a SDOF are as follows:
..............Eq 1
………..Eq 2 The parameter produces numerical (or algorithmic) damping within the j
th time step. If it is taken to be
less than 0.5, an artificial negative damping results. On the other hand, if it is greater than 0.5, such damping is positive. To avoid numerical damping altogether in the analysis presented in this paper, the value of is taken equal to 0.5. Newmark’s method is then equivalent to the trapezoidal rule. The parameter β controls the variation of acceleration within the time step. For the purpose of this analysis its value is taken as 0.25 which ensures average acceleration method. It offers the highest accuracy of the available methods, but may permit excessive vibrations in the higher frequency modes, i.e., those modes with periods of the same order as or less than the time-step size .The time step is chosen to be 0.02 sec which has been chosen to achieve a substantial solution. Results of 2D linear dynamic analysis
It was seen from the results the 2D liner transient dynamic analysis that quite high stresses are induced at the spillway pier junction. Thus the assumption of a plain strain behaviour for the section considered for the 2D analysis is questionable and is subject to the nature of dynamic behaviour of individual monoliths. A 3D Analysis of one spillway monolith was further carried out. In view of the limitations of computational facilities available for the work for the purpose of this investigation, no foundation block has been considered for the 3D analysis. Results of the 2D linear dynamic time-history analysis are shown in Fig. 7.
Results of 3D Analysis
Results of the 3D linear dynamic time history analysis are shown in Fig. 9.
Conclusions and Remarks Effectiveness of the type of analysis
1. The pseudostatic rigid body analysis may be considered acceptable for preliminary calculations and static loading cases. However, it severely underestimates the dynamic stresses. Comparisons of vertical (normal stresses) computed from the pseudo-static method with principal stresses from a FE analysis should be done with caution. The orientation of the principal stresses might be different than that of lift joints which are usually considered as planes of weakness, making an anisotropic structure. However, in this analysis the vertical stress results by FEA are within the conservative limits.
2. Though a pseudostatic analysis by finite element method can be considered as better, the only advantage it offers over the conventional pseudostatic method is, the inclusion of material elasticity as the mechanism of including the effect of the earthquake is essentially the same.
3. The transient dynamic analysis by giving the acceleration time history is best suited for computational simulation of an earthquake in the most realistic way.
Effectiveness of Strengthening
1. About 22 percent increase in the cross sectional area of the spillway has been effective in reducing the critical tensile stresses in the dam by about 30 percent thus bringing them with permissible Limit of tensile stress. As per the recommendations of C.D.O. at Nasik in India, the maximum permissible
1785
stresses in concrete a gravity dam is 1/8th to 1/10
th of ultimate crushing strength of concrete for
tension and 1/3rd
of the ultimate crushing strength of concrete for compression. The permissible values of tensile and compressive stresses for the dam under consideration are 2 MPa and 7 MPa respectively.
2. The maximum crest displacement has been brought down from about 2.7 cm to 1 cm. This reduction (about 55 percent) is important for the safety of the bridge which spans over the spillway piers. The maximum acceleration at the top of the dam has been reduced to about 1.1g as compared to 3g in the unstrengthened dam.
3. The strengthening has resulted in a considerable decrease in the stress concentration at critical points in the dam. A more uniform stress distribution has ensured better overall utilisation of material both, in transient as well as long term stress effects.
Shortcomings and further work
1. The sliding friction factors for the dam foundation interface, as calculated by the pseudostatic method, were quite conservative. Also, shear keys provided at selected monoliths had been adequately designed to assume a complete force transfer between the dam and the foundation. But the validity of this assumption needs to be tested. Although substantial tensile stresses might be mobilised in mass concrete, this might not be the case at the dam-foundation interface or in the rock mass just below the dam. To account for the realistic behaviour of the dam foundation interface, a more appropriate computational model needs to be prepared and investigated.
2. The comparison of results of 2D and 3D analysis, while changing the foundation conditions needs to be further substantiated. Due to limitations on computational facilities available for this work, foundation flexibility in the form of a foundation block could not be considered for the 3D analysis. Considering the dam to be fixed at base has further introduced the shortcoming of not being able to consider the effect of uplift pressure in the 3D model. It has been assumed that these assumptions have led to a conservative design. However, this is a possible area of further investigation.
3. A prerecorded accelerogram has been used for the purpose of this analysis. The assumption that this represents the free field time history needs further investigation. Use of a synthetic accelerogram, specific to the site conditions and corrected for smoothening of the response spectrum would produce more reliable results.
4. In this paper the criterion is to produce a design that will remain in the elastic range under average ground motions. However, when subjected to more severe ground motions, permissible minor cracking may be there. This needs to be further investigated with a non-linear analysis.
References
IS 1893, 1984. Criteria for Design of Earthquake Resistant Structures. IS 6512, 1984. Criteria for Design of Solid Gravity Dams. Bathe, K.J., and Wilson, E.L., 1973.”Stability and Accuracy Analysis of Direct Integration Methods,”
Earthquake Eng. Struct. Dyn., Vol. 1, No.3. pp. 241-252 Newmark, N.M., 1959. ”A Method of Computation for Structural Dynamics,” ASCE J. Eng. Mech. Div., Vol.
85, No. EM3, pp. 67-94. Report No. EERC 71-1, Earthquake Eng. Research Centre, A.K. Chopra and P. Chakrabarti, University of
California Berkeley.
1786
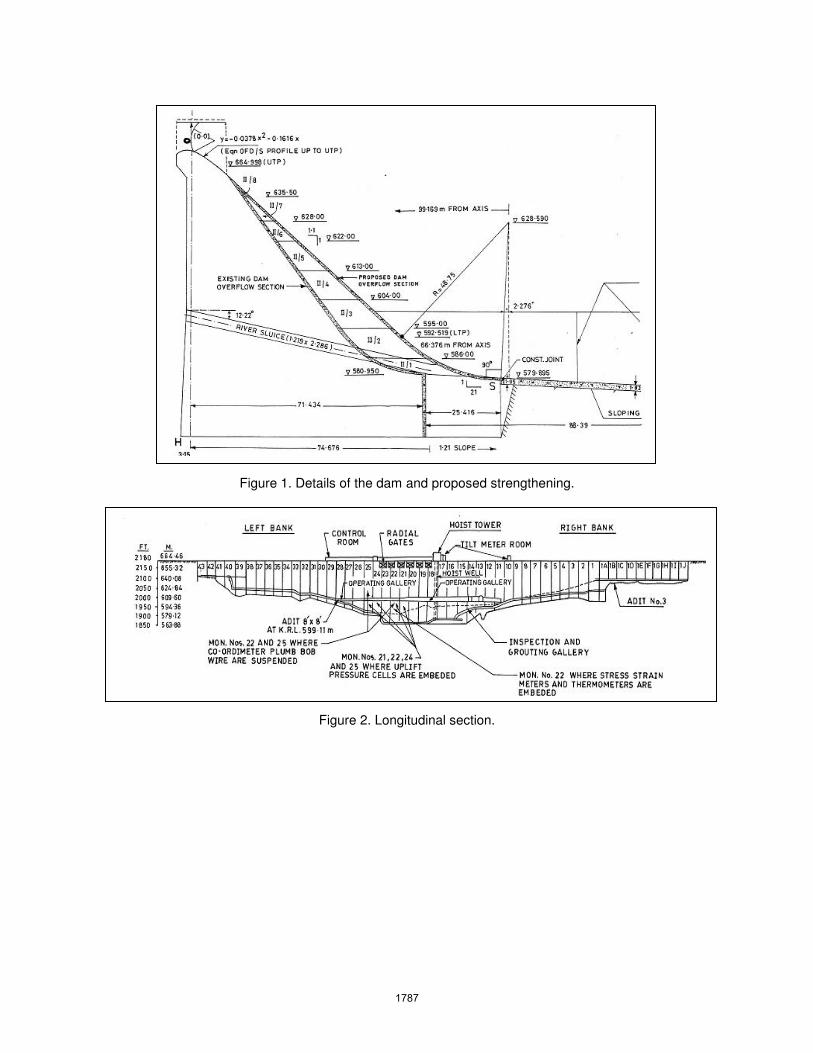
Figure 1. Details of the dam and proposed strengthening.
Figure 2. Longitudinal section.
1787
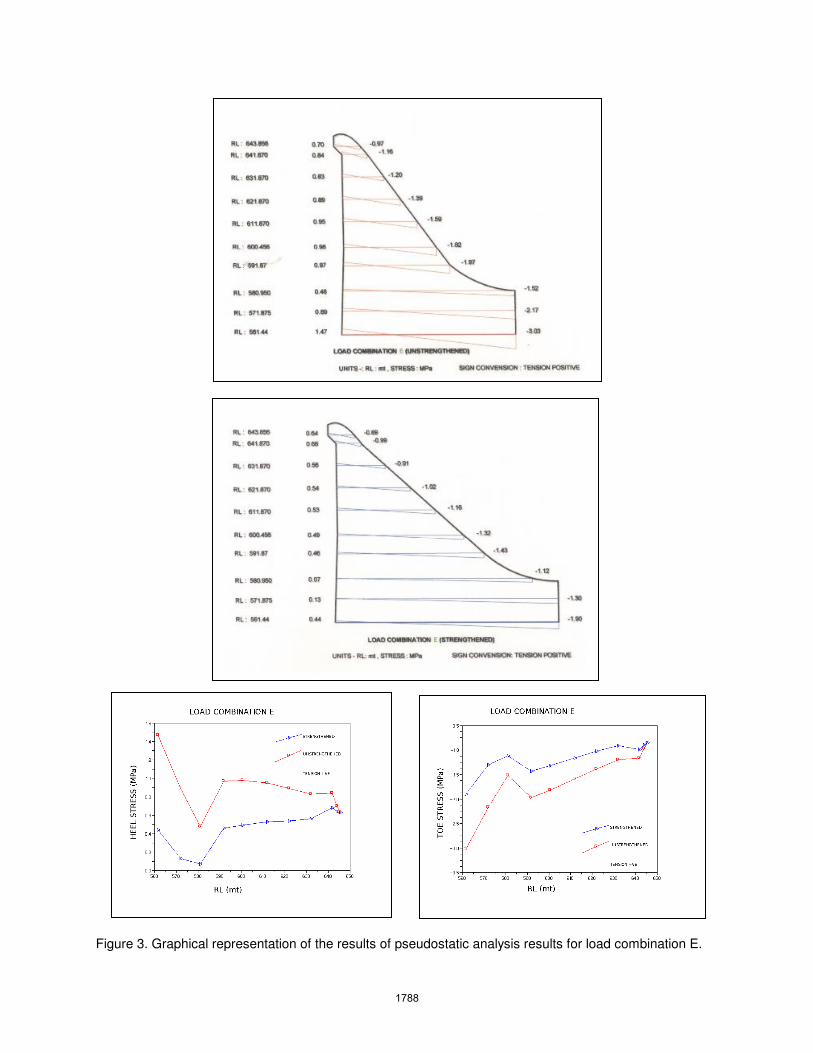
Figure 3. Graphical representation of the results of pseudostatic analysis results for load combination E.
1788
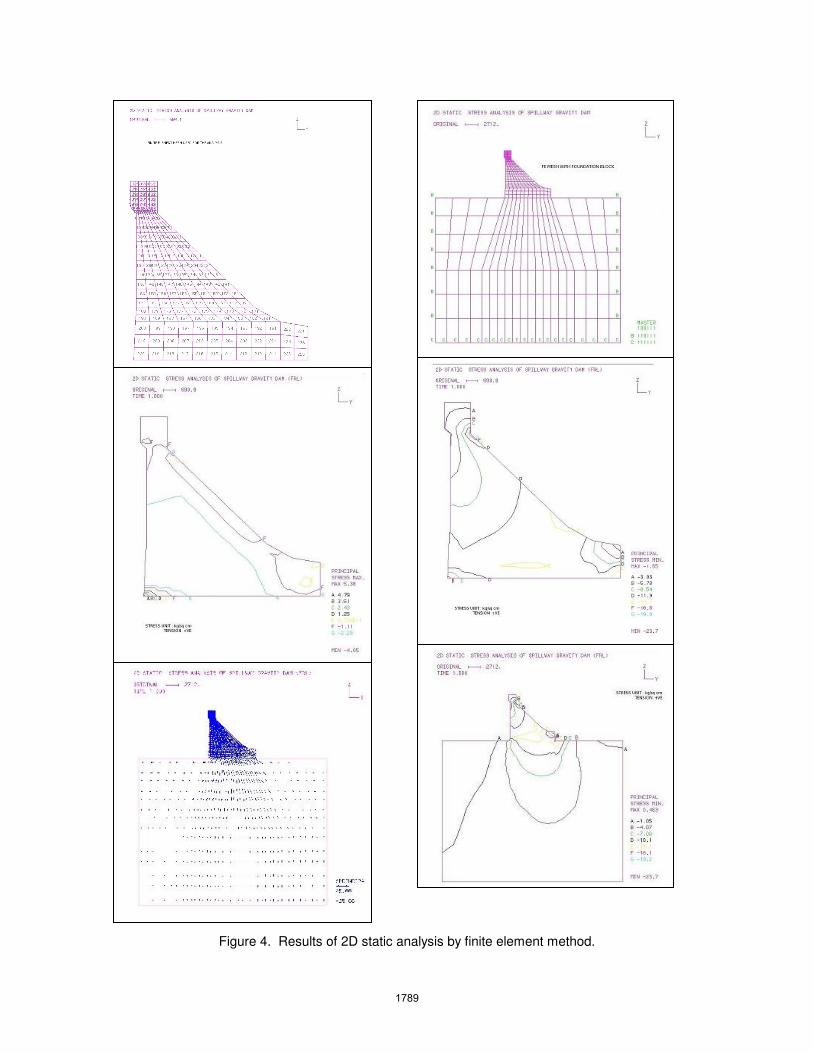
Figure 4. Results of 2D static analysis by finite element method.
1789
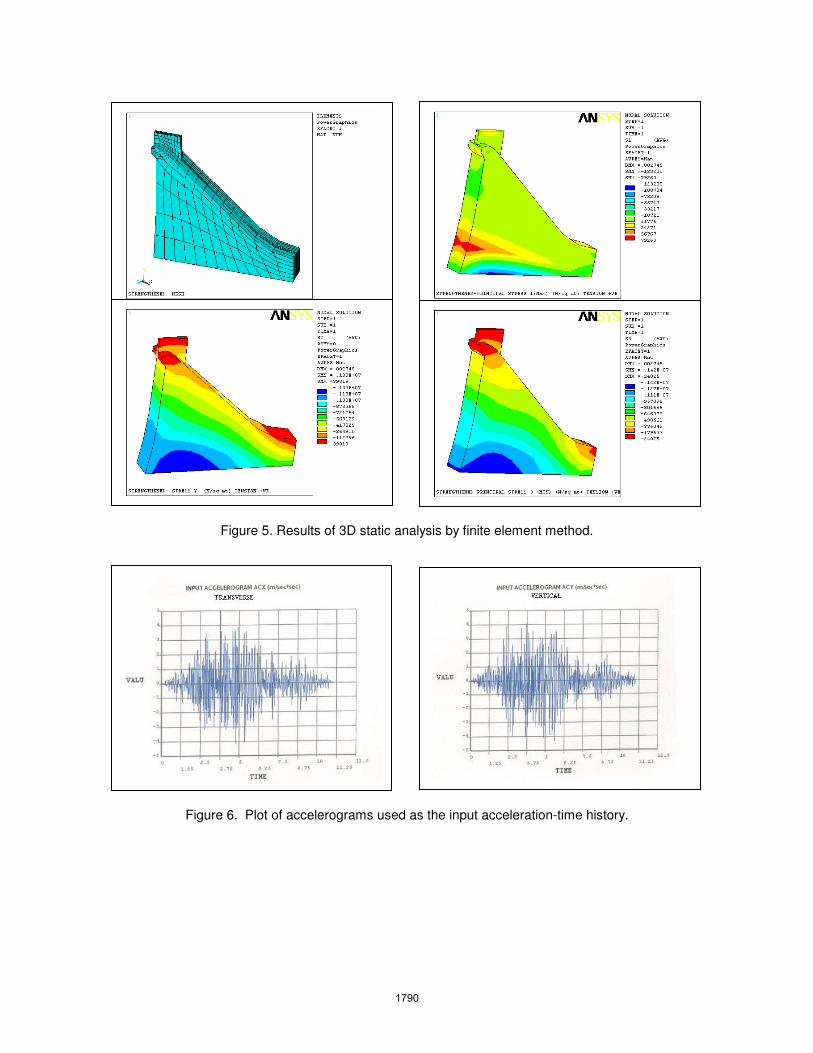
Figure 5. Results of 3D static analysis by finite element method.
Figure 6. Plot of accelerograms used as the input acceleration-time history.
1790
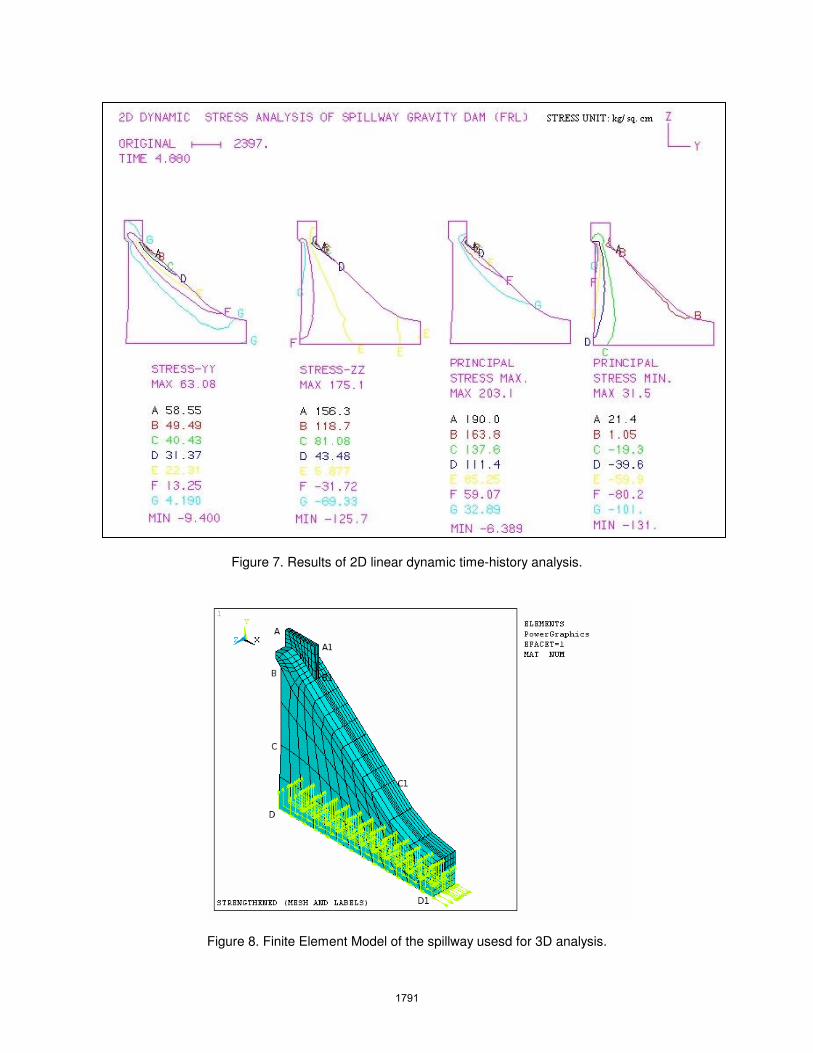
Figure 7. Results of 2D linear dynamic time-history analysis.
Figure 8. Finite Element Model of the spillway usesd for 3D analysis.
1791
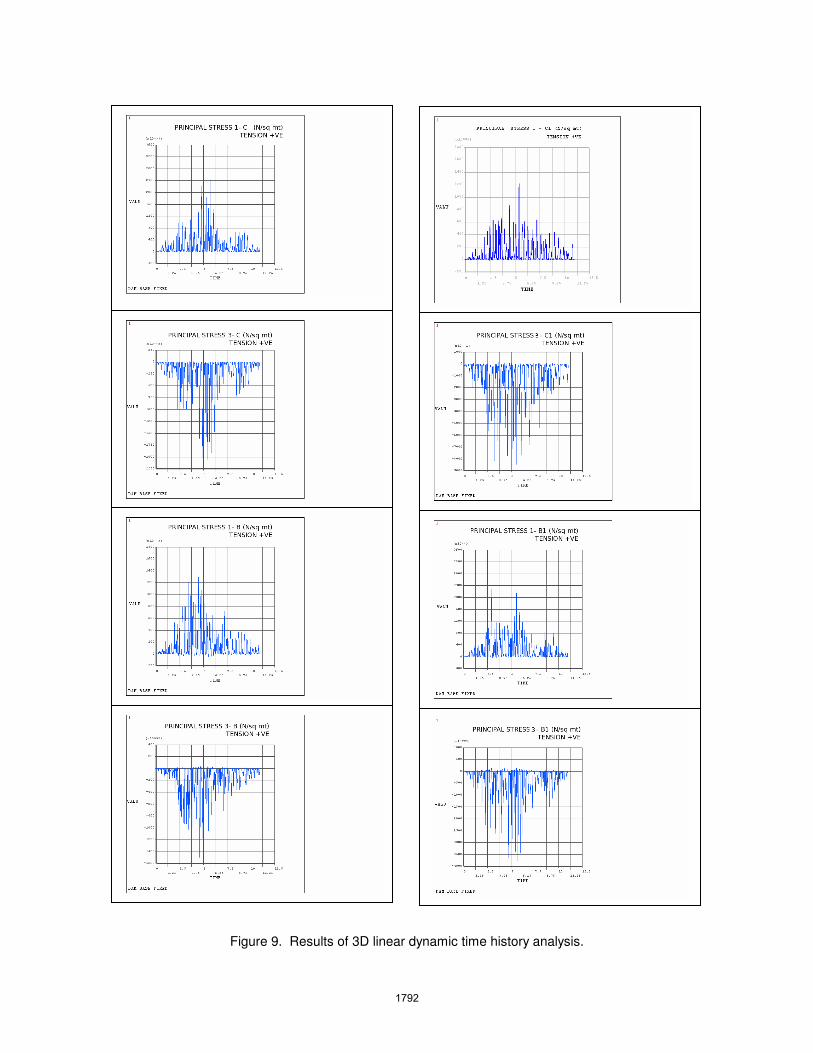
Figure 9. Results of 3D linear dynamic time history analysis.
1792
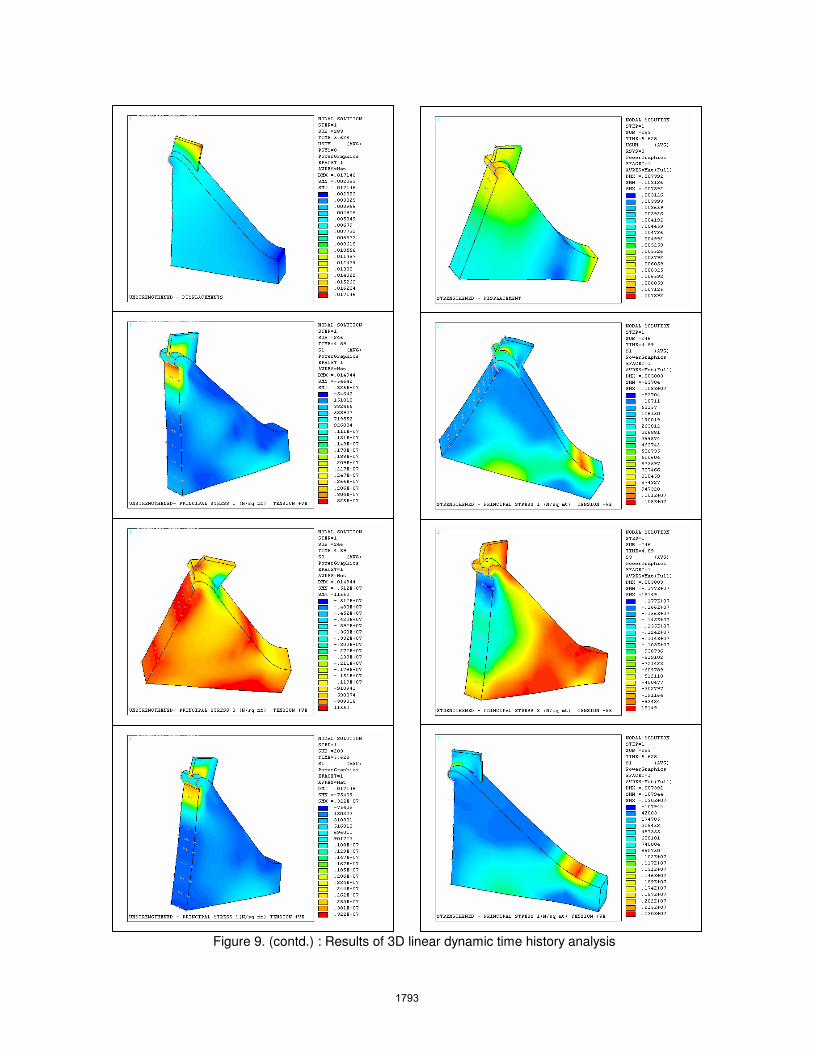
Figure 9. (contd.) : Results of 3D linear dynamic time history analysis
1793
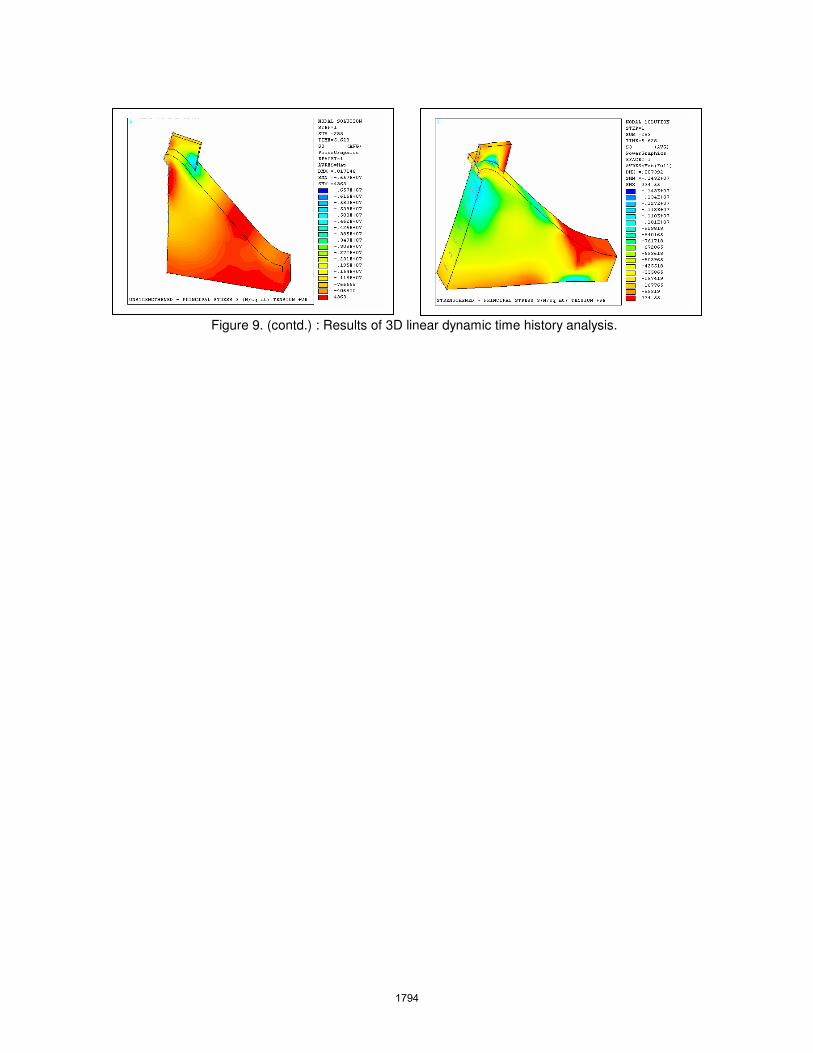
Figure 9. (contd.) : Results of 3D linear dynamic time history analysis.
1794