Embed Size (px)
Citation preview
Jurnal Mekanikal
June 2013, No 36, 72-85
72
DYNAMIC ANALYSIS OF AN AIR HANDLING UNIT
Abang Mohamad Aizuddin bin Abg. Mohd. Mohtar, Raja Ishak bin Raja Hamzah,
Mohd. Yunus bin Abdullah
Faculty of Mechanical Engineering,
Universiti Teknologi Malaysia,
UTM 81310, Skudai,
Johor Bahru, Malaysia
ABSTRACT
In this paper, vibration methods were conducted for an air-handling unit (AHU) assembly that
experiences a vibration-related problem. The methods that were utilised are the Finite Element
Analysis (FEA), the Experimental Modal Analysis (EMA) and the Operating Deflection Shapes
(ODS). Mathematical and analytical modelling were also done before the experimental methods
where they are used as reference for estimation of the results. Results between the theoretical
and experimental methodologies were compared for analysis. The corresponding mode shapes
were used as reference for finding the relevant experimental mode shapes of the AHU. The ODS
results show the belt pulley system that connects the motor and the fan of the AHU experienced
a strong axial vibration as supported by the initial vibration testing results. It was hypothesised
that the AHU might be suffering from belt misalignment problem that introduces vibration to the
whole AHU structure resulting in high vibration displacements.
Keywords : Vibration analysis, Finite element analysis, Operational deflection shape,
Experimental modal analysis, Air handling unit.
1. INTRODUCTION
In plants and factories, there are many types of machinery that are in operation. Every
machinery has their own purpose and thus works differently. The common thing for mechanical
machineries are that they have moving parts which can introduce dynamic vibration as well as
induced fatigue over high load of operation cycles. In the industry, the original equipment
manufacturers (OEM) and the equipment users have employed vibration measurement and
analysis methods to observe any vibration-related abnormality on their machineries. Vibration
testing will be conducted during the transient (during start up of the machine) and the steady
state conditions of the machine. Most of the problems are common misalignment, imbalance
and bearing damages where those problems can be resolved directly. Some also implements a
continuous vibration monitoring on their machineries especially if the machineries are very
sensitive to excessive vibrations (i.e. running at very high speeds) and demand high
expenditures on repair costs for the damages. The downside to this method is its costly
maintenance and therefore should not be applied to more robust equipments. Another method is
only conducting vibration testing to the machinery when experiencing a faulty problem. After
conducting the necessary analysis, the problem will be solved appropriately usually using a
heuristic (trial-and-error) method. This step is where finite element analysis (FEA) can be
implemented to predict the outcome of any solutions which can save time and costs.Lots of
research has been done on the finite element analysis and the modal analysis of a structure or a
system. This either involves the theoretical aspects as well as the experimental part of solving a
vibration problem in structures. Numerous textbook on vibration explain these theories and the
__________________________________
Corresponding author : [email protected]

Jurnal Mekanikal June 2013
73
relevant experimental procedures. A number of works have been dedicated to solve vibration
problems in pumps which involve rotating machineries. Marscher [1] has published an article on
how to utilise modal testing to solve vibration in pumps. Onari and Boyadjis [2] have carried
out a lot of FEA and EMA in order to solve various practical machinery problems. In their
journal publication, they presented four case studies that involve pumps and motor turbines
which experienced high vibration problems. The problems were then solved using a
combination of FEA and EMA. They mentioned that the importance of vibration data gathered
at the attachments such as flanges and interface areas to identify any separation between parts of
the structures/machines. They concluded their research by stating the significance of the ODS as
a powerful troubleshooting tool to understand a practical vibration problem. Combining the
ODS, EMA and the FEA will result in more rapid problem diagnosis and proposed solutions.
Some relevant works on fans were also done by Wang and Pan [3]. They conducted an EMA on
a centrifugal fan with an operating range of 100-2400 rev/min, which is a part of a harvester
threshing machine. They obtained the fan resonance frequency in the region of 125 Hz. The
natural frequencies of motors were also investigated as done by Wang and Lai [4]. They
concluded their research by stating that the structural details of the induction motor should be
modelled as closed to the actual dimensions and features to obtain a better approximation of the
natural frequencies and mode shapes. They found that the experimental natural frequencies of
the 2.2kW 50 Hz three pole induction motor are determined by the individual parts of the motor.
The fundamental frequency caused by the rotor is around 295 Hz and the fundamental
frequency of the stator and casing is around 390 Hz. However another research conducted by
Tonoki et. al. [5] established the fundamental frequency of an induction 2.2 kW general purpose
motor as 1250 Hz.
2. CASE STUDY
The AHU is currently in operation in circulating air-conditioned air in a large office building.
The mechanical assembly of the AHU comprises of a fan, a motor positioned on beams on top
of a beam frame structure. The frame is positioned on top of four vibration spring isolators at its
corners. The motor is the driving component of the AHU which in turn drives the fan via a
belting or pulley system. The dimensions of the components were measured manually since they
are not readily available in the manual provided. The vibration spring isolators specifications are
also unavailable and therefore an approximation based on other colour coded factory
manufactured springs were referred for future calculations. Figure 1 shows the AHU
components.
Figure 1 : View of the inner components of the AHU.
A. Initial Vibration Assessment
Motor
Fan
blower
Frame
structure
Belt pulley

Jurnal Mekanikal June 2013
74
The preliminary testing conducted were done in accordance to the British Standards BS7854-6
(1996) titled "Mechanical vibration - Evaluation of machine vibration by measurements on non-
rotating parts: Part 6 Reciprocating machines with power ratings above 100kW" where the
overall r.m.s. velocity measurements were obtained at seven selected locations at the
components of the AHU assembly. The vibration severity is based on the highest overall r.m.s.
vibration velocity amplitudes at any given axis of the particular component. They are then
graded based on the severity chart available in BS7854-6 (1996) which also takes into account
the machinery class (categorised by its power rating) and classified into 'zones'. Both the motor
and fan are classified as Zone D which is defined in the standards as 'Vibration values within
this zone are normally considered to be of sufficient severity to cause damage to the machine' as
shown in Table 1.
Table 1 : Vibration severity assessment of the motor and fan of the AHU.
Machine
Overall
R.M.S.
Velocity
(mm/s)
Axis Vibration
Grade
Vibration
Severity
Motor 9.46 Axial 11 Zone D
Fan 12.67 Axial 11 Zone D
METHODOLOGY
There are numerous methodology that will be described further on which are used to analyse the
AHU analytically, using FEA method and also experimental methods such as ODS and EMA.
B. Analytical Analysis
There are three main analytical models used for comparison with FEA and experimental results.
Two of them are fundamental natural frequency estimators which are the Dunkerley's equation
and the Rayleigh's energy method. The other model is the Euler-Bernoulli beam theory under
transverse vibration to estimate the mode shape profile of the AHU frame structure.
The fundamental frequency and the mode shape can be approximated by using the Dunkerley's
equation with the assumptions that the masses are of concentrated mass where in this case the
mass of blower and mass of motor, and the boundary conditions of the beam are clamped at
both ends. The approximation is a lower bound approximation to the exact solution.
Equation 2.9 shows the Dunkerley's equation where represents the fundamental frequency of
the whole system and , , and so on represents the natural frequency of each individual
mass without the effect of other masses.
(1)
There are three natural frequencies for consideration which are the frame's natural frequency
and the natural frequencies due to the position of mass of the fan and the motor. The stiffness of
the beam due to the masses was calculated using the stiffness of the beam equation obtained
from Table 6-1 [6].
Rayleigh's method can be used to estimate the fundamental natural frequency of continuous
structures. As shown by Rao [7], this is done by equating the maximum kinetic and potential
energies and Rayleigh's quotient.
Weaver et. al. [8] used the Rayleigh technique and derived an expression calculating the
fundamental natural frequency and the corresponding mode shape of a beam under transverse
vibration with a concentrated mass with fixed-fixed boundary conditions as shown in Figure 2.

Jurnal Mekanikal June 2013
75
Equation (2) shows the natural frequency and Equation (3) shows the corresponding mode
shape equations.
Figure 2 A beam with fixed-fixed boundary conditions with an external mass undergoing
lateral vibration.
where
(2)
(3)
Below are the assumptions done for the Rayleigh's Technique analysis for the AHU case study:
The assumptions of a Euler-Bernoulli beam are applied.
The material of the beam is of the same material to galvanised steel.
The area moment of inertia is calculated by taking into account the U-shaped cross section
of the beam using Blevins’s qu ti ns [6].
An external mass assumed to be of the combination of the fan and the motor is located
at 0.5 m from the first clamped end.
The theory that can be used to describe a beam structure which undergoes a transverse or lateral
vibration is by assuming the Euler-Bernoulli Beam theory [7]. The general assumptions are
stated by Blevins [6] as follows:
The beams are uniform along the span and are composed of linear, homogenous, isotropic
elastic material.
a
Fixed Fixed
b
Mass

Jurnal Mekanikal June 2013
76
The beams are considered as slender beams. There is no other mass acting on the beam.
No axial loads are acting on the beam.
The shear centre of the beam cross section is on the same point with the centre of mass of the
beam.
where
The solutions for free vibration wave equations as shown in Equation (4) gives the eigenvalue
and eigenvector solutions which represent the natural frequencies and mode shapes respectively.
For a fixed-fixed beam, the natural frequencies and mode shapes are given by Equation (5) and
(6).
(5)
(6)
Below are the assumptions done for the Euler-Bernoulli Beam theory analysis for the AHU case
study:
The assumptions of Euler-Bernoulli beam are applied.
The material of the beam is of the same material to galvanised steel.
The area moment of inertia is calculated by taking into account the U-shaped cross section of
the beam using equations by [6].
C. Finite Element Analysis (FEA) Method
The FEA is based on the finite element method (FEM). This method was first developed in the
1940s to investigate structural mechanics [9-11]. The limitations of the FEM were liberated by
the emergence of digital computers in the 1950s to allow computational of solving stiffness
equations in the matrix form [12-14].
The CAD modelling was done using the SolidWorks 2011 software. The AHU dimensions were
measured manually and transferred to the CAD model. Nevertheless the model is not a perfect
model. Assumptions were made to the model as listed below:
The particular details of the motor were assumed to be a solid. This means the armatures, the
rotating shaft, the shell thickness of the motor and other components of the motor were
ignored.
The insides dimensions and the rotating shaft and vane blades of the fan were not modelled.
The fan was modelled as a solid.
The belt pulley was not modelled although it is one of the connections between the motor
and the fan.The mass of the motor and the blower in the CAD model is different from
the mass specified in the technical specification manual of the AHU.
The flow chart of the process for FEA is as shown in Figure 3.
(4)

Jurnal Mekanikal June 2013
77
Figure 3 Diagram of the data acquisition setup for EMA method.
The model from SolidWorks 2011 was imported to the ABAQUS CAE software for FE analysis.
ABAQUS was able to retain the information from the imported file such as the geometry and
acknowledges the individual parts of the assembly. The material properties, boundary
conditions and meshing properties were set. The final step for the pre-processing which is
submitting the job for analysis in the Job module were done to obtain the natural frequencies
and the corresponding mode shapes for the AHU model.
D. Experimental Modal Analysis (EMA)
According to Fu and He [15], modal analysis can be defined as the process of determining the
inherent dynamic characteristics of a system in the form of natural frequencies and mode shapes.
This analysis can then be used to obtain the mathematical model for the system's dynamic
behaviour. The analysis are both theoretical and experimental in nature.
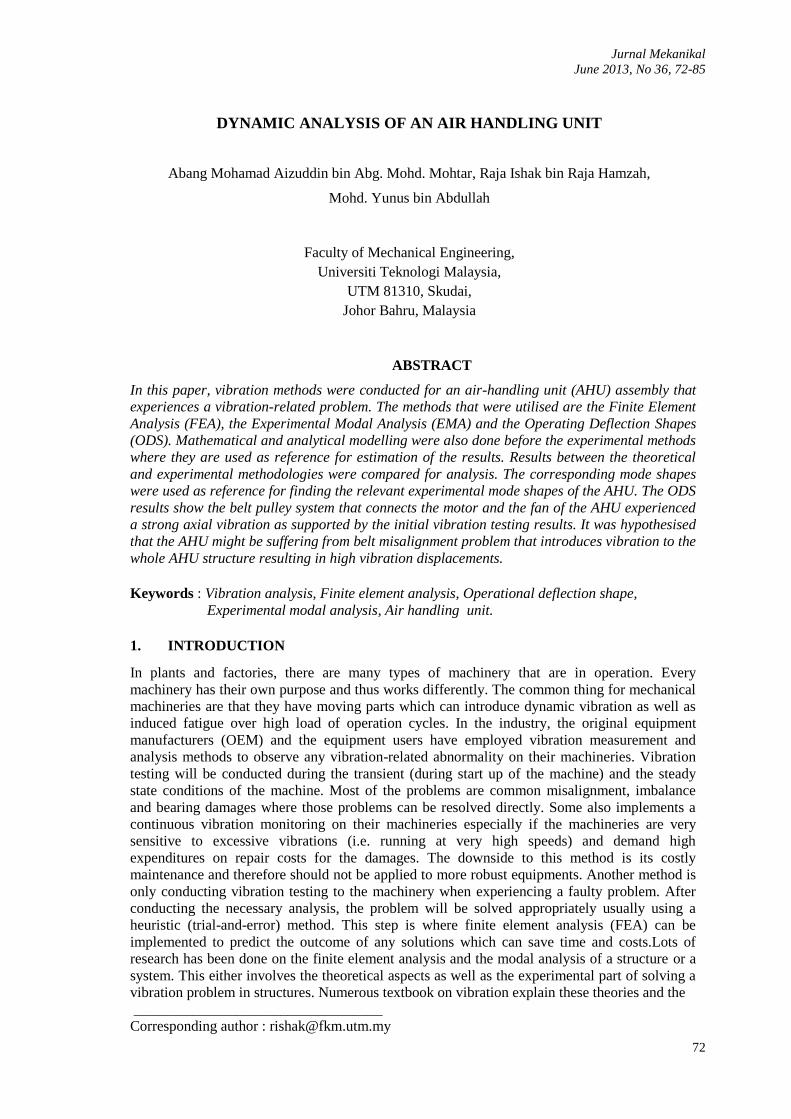
The data acquisition setup for EMA method is as shown in Figure 4. A roving tri-axial
accelerometer was used to measure the AHU vibrations while the AHU is in free conditions (i.e.
shut down) with a force impact hammer used as the excitation force. The data acquisition
software DeweFRF was used to capture frequency response functions (FRFs) signals while the
analysis was done using the Me'scopeVES v5.
Create model in Solidworks
Export it to ABAQUS software as Parasolid file
Assign material properties
Create modal analysis step with appropriate solver
Set boundary conditions
Create contact pairs between components
Meshing each components
Run Analysis
Jurnal Mekanikal June 2013
78
Figure 4 Diagram of the data acquisition setup for EMA method.
A minimum of five 'good' impacts from the hammer were needed for the averaging of the FRFs
for one location. Characteristics of a 'good' impact test are as follows:
There are no double hits or bad hits. This can be observed in the time and spectrum domain
of the impact excitation force. A bad hit will introduce ripples in the force spectrum and
double hits can be observed in the time domain as well.
Excellent coherence. The coherence after each hit can be observed in the GUI. A value of
one (unity) is ideal to ensure excellent relationship between input and output.
Smooth FRFs obtained after the five impact tests.
The EMA then proceeded to the next stage which was the assignment of the measurement FRFs
equations to the relevant points in the structure model. The option of creating interpolating
equations was also used in order to create a smoother animation of the modes for the AHU.
The next step of analysis is determining the mode natural frequencies and its relevant mode
shapes of the AHU. This required a good analysis of the Bode plot which is the magnitude and
phase analysis of the FRFs. Also, the coherence of the FRFs were observed to ensure the
reliability of the data measured for analysis. Four basic requirements in the Bode plot and
coherence analysis was needed to identify the AHU's natural frequencies which are:
There is a significant peak in the FRFs magnitude plot
There is a phase shift occurring at the assumed resonance peaks
Ideally the resonance peaks will have a 180° phase shift
The coherence is ideally is a value of 1 (unity) at the peaks
The author's judgement in deciding the appropriate natural frequencies that reflect the resonance
frequencies of the associated whole frame structure to the beam theory was required. Natural
frequencies of individual components were ignored. Once the natural frequencies are
determined, quick fitting method was used to compare and quick fitting all the FRFs to obtain a
more precise and accurate natural frequency together with its damping properties. Then the
residues (mode shapes) at the frequencies can also be calculated and shown visually in the
structure model after the necessary measurement equations were created.
E. Operation Deflection Shapes (ODS) Method
This is a dynamic testing method that finds the deformation shape of a structure/machinery that
is operating at its operating frequency (steady-state conditions). According to Boyadjis and
Onari [2], the ODS method is performed on the entire unit structure and done at its worst case
dynamic conditions within range of its operating frequencies.
For the AHU case study, the data acquisition setup for ODS analysis is as shown in Figure 5. A
roving triaxial accelerometer was used to measure the AHU vibrations while in operating
conditions with a uniaxial accelerometer used as reference. The data acquisition software
DeweFRF was used to capture the vibration time signals while the analysis was done using the
Me'scopeVES v5.

Jurnal Mekanikal June 2013
79
Figure 5 Diagram of the data acquisition setup for ODS analysis.
The measurement locations for the reference and roving accelerometers were established. It was
advised to position the reference accelerometer at the most significant deflected part of the
structure to obtain a good phase comparison with other measurement locations as were done by
Boyadjis and Onari [2]. Therefore for this reason the non-driving-end (NDE) of the motor was
chosen as the position for the reference accelerometer. A total number of 23 roving
accelerometer locations were done.
The time domain signal files will then be imported into the software via a Data Block file for the
project and each channel will be assigned with its specific Degree-of-Freedom (DOF)
information and linked to their respective measurement locations. For example, the DOF
properties of a x-axis channel with its respective reference accelerometer measured at the z-axis
plane at location or point 1 will be named '1X : 1Z'.
The ODS Frequency Response Function (FRF) are needed for a frequency based ODS analysis.
Me'scopeVES enables users to calculate ODS FRFs from various inputs. One of such inputs is
the time domain signal. Therefore, the time domain signal data block file is then transformed
into an ODS FRF data block file using the software features.
The new ODS FRF data block file will be then be used to match with the measurement locations
in AHU model of the structure file. Since the structure file has all the relevant ODS FRF
information at all its points, then the animation of the AHU's operating shapes can be done
using the 'Draw | Animate Shapes' function available in the structure file options. The behaviour
of the AHU was investigated based on the ODS FRF resonance peaks. ODS FRFs graphs and
the relevant animations were recorded and stored for analysis. The vibration auto spectrums
were also calculated from the time domain signals obtained from the tri-axial accelerometer
measurements.
3. RESULTS AND DISCUSSION
The results from the various methods were compared and used to analysed the vibration-related
problem of the AHU.
A. Comparison of Theoretical and Experimental Results
The most significant component of the AHU structure for comparison purposes with the
analytical beam theory in this study was identified to be the frame structure that supports the
motor and fan blower components. Figure 6 and Figure 7 shows the comparisons of the mode
shape profiles of the AHU frame structure.

Jurnal Mekanikal June 2013
80
(a) (b)
Figure 6 The resulting mode shapes of the Euler-Bernoulli beam
a) first mode shape at 206.2 Hz
b) second mode shape at 568.4 Hz for fixed-fixed boundary conditions.
(a) (b)
(c) (d)
Figure 7 Similarities between associated mode shapes profiles with the beam theory
obtained from finite element analysis and experimental modal analysis
a) first associated mode shape FEA
b) first associated mode shape EMA
c) second associated mode shape FEA
d) second associated mode shape EMA.
Comparisons of the theoretical results for the Dunkerley's, Euler-Bernoulli Beam
theory, the Rayleigh's methods and FEA methods with the experimental results were
made as shown in Table 2.
Table 2 Comparison of theoretical results with experimental values
Methodology
First
mode
shape
Difference
to
experiment
value (%)
Second
mode
shape
Difference
to
experiment
value (%)
Experimental
Modal Analysis 50.6 - 228.0 -
Dunkerley's
Equation 43.7 9.7 - -
Euler
B rn ulli’s
Beam
206.2 -307.5 568.4 -149.3
R yl ig ’s
Method 41.9 17.2 - -
Finite Element
Method 43.7 13.7 175.0 23.2

Jurnal Mekanikal June 2013
81
The Dunkerley's method gives the best estimation of the fundamental frequency for a fixed-
fixed beam with the masses on the beam. A difference percentage of 9.7% between the
fundamental frequency (45.7 Hz) and the associated experimental natural frequency of the
frame structure (50.6 Hz) was obtained. Therefore, it can be said that it could be a good
estimator for future problems that involves structures made up predominantly by beams. An
analyst can use this method as a basis for knowing the fundamental frequency of the problem
and use it as a reference before experimentation. Nevertheless, the weakness of the Dunkerley's
method is that it only calculates the fundamental frequency and also does not give out any mode
shapes for comparisons.
The Euler-Bernoulli Beam theory gives high difference percentages compared to the
experimental natural frequencies which are -307.5% for the first associated natural frequency
(206.2 Hz) and -149.3% for the second associated natural frequency (568.4 Hz) of the AHU.
The negative percentages means that the theoretical values are higher than the experimental
values. This is not surprising since that the beam was assumed not supporting the mass of the
motor and the fan which is not the case for the real structure. The added mass will further reduce
the natural frequencies of the system especially since the mass combination of the motor and fan
is far heavier than the whole frame structure.
The difference percentages are caused by the oversimplification and assumptions made for each
analytical method that makes them not resembling the true case study of the AHU. However, it
can be concluded that the Dunkerley's and Rayleigh's methods can be used to estimate the
fundamental frequency of a lightly damped beam structure. The corresponding mode shapes can
be estimated by checking with the Euler-Bernoulli and Rayleigh's technique mode shapes as the
references for experimental analysis.
More comprehensive analytical methods can be applied to this project. Further works can be
done to improved the analytical study for the AHU problem based on transverse vibrations on
beams with concentrated masses in two and three dimensional planes and solutions obtained
using computational numerical methods. The author acknowledges the limitations of the
analytical solutions that they will never provide the exact solutions to real case studies due to
the complexities and non linearity available in real life problems as well as the various
assumptions made in the analytical models. Even so, better analytical models and solutions may
provide better base reference for analyst to approach a vibration problem before conducting the
experiments.
For the FEA results, the percentage differences are below 20% for the first natural frequency
and slightly above 20% for the second natural frequency. FEA modifications were done to
investigate the varying of Young's Modulus of the frame structure material, the spring's stiffness
as well as the mass of the fan. It was found that increasing the Young's Modulus of the material
improved the results. Doubling the spring's stiffness has no effect on the natural frequencies.
Higher mass values for the fan reduces the FEA natural frequencies and this increases the
percentage difference. Nevertheless, the percentage difference is predictable since that the FEA
model is bounded by limitations, assumptions and thus errors can be introduce into the results.
The limitations and errors that arise from the comparisons might be caused by the
oversimplification of the modelling process for the FE analysis. The model was not sketched
precisely as the AHU structure due to lack of drawings information. The motor and fan blower
were modelled as a lump mass with a user defined material to be calibrated to the actual mass of
these components. The cross section shape of the frame structure was also simplified and the
bolts and connectors were modelled not according to specification. The connectors were also
assumed to be bonded to the frame structure. The boundary conditions between the components

Jurnal Mekanikal June 2013
82
might also vary. The spring stiffness was estimated based on product catalogues. This
uncertainties add up to make the percentage difference of the results.
It is important to note that the FEA methods is actually best utilised at the design stage of
building a structure where the intrinsic material properties and the specifications can be
determined precisely and accurate. FEA in approaching a real vibration problem is quite
difficult unless there are sufficient information regarding all the materials and connections of
intricate parts of the machines and structures. Even FEA modifications can be a complicated job
due to the limitations that has been previously mentioned. On the other hand, FEA can be a
great tool to assist analyst to further predict any structural dynamics modifications if the need
arises.
B. Dynamic Analysis of AHU
The forcing excitation frequencies were identified from the vibration auto spectrums calculated
from the ODS analysis and tabulated as shown in Table 3. The location 1 which is the driving
end (DE) of the motor was chosen as the vibration spectrum analysis due to its proximity to the
belt pulley which drives the fan blower. The peaks representing the driver and driven frequency
can be observed in the vibration spectrums including their harmonics. There are also many other
peaks that cannot be described due to lack of information regarding the motor and blower
specifications. It can be assumed that some of this harmonics represents the bearings passing
frequencies inside the motor and also other internal moving parts. The vane pass frequency was
calculated to be around 1114 Hz. Nonetheless, there are no evident peaks in the vibration auto
spectrum at measurement location 1.
Table 3 Observed forcing excitation frequencies in the axial and vertical vibration auto
spectrum at location 1.
Force excitation description Observed
frequency (Hz)
Driver frequency 1X (motor) 21.5
Driven frequency 1X (fan) 26.0
Harmonics of driver frequency
(2X, 3X ..) 43, 64, 85.5
Harmonics of driven frequency
(2X, 3X ..) 53.5, 77.5, 104
Driver frequency 1X (motor) 21.5
Judging from the ODS shapes in the Figure 8 and Figure 9 show the motor is moving axially
away from the blower (where the belting connection is located) at the driver frequency, 21.5 Hz.
At the 26 Hz driven frequency, the fan blower panels are moving flexibly like a thin plate and
the motor experiences axial and horizontal vibrations.

Jurnal Mekanikal June 2013
83
Figure 8 Four views (top, 3D, front and side clockwise) of the operating deflection
shapes motion of the AHU
structure at the driver frequency 21.5 Hz.
Figure 9 Four views (top, 3D, front and side clockwise) of the operating deflection
shapes motion of the AHU
structure at the driver frequency 26 Hz.
There were also extra information regarding the AHU servicing history. The AHU broke down
in August 2012 which was after the initial vibration testing measurements were conducted and
the problem was the belting failure. The belt had failed maybe after prolong expanding and
twisting motions during the AHU operating conditions. Figure 10 shows the condition of the
broken belt.
Figure 10 Picture of the broken belt.
It is inferred that the belt may suffer a fatigue type failure caused by misalignment of the belting
system by [16]. The author's hypothesis is that there is possibly an offset misalignment that
shows an increase of the axial vibrations especially at the driver or driven frequency. Based on
Axial
vibration at belts
Axial and
horizontal
vibration at motor

Jurnal Mekanikal June 2013
84
the high axial overall vibrations measured at the fan blower and DE of the motor during the
initial vibration testing (as referred to Table I) before the belt failure, it can be assumed that this
is the most probable diagnose of the vibration problem experienced by the AHU. The
misalignment will cause the motor and fan moving axially thus the vibration propagates
throughout the whole AHU structure. It is assumed that it is not a resonance effect especially for
the frame structure because the operating conditions are well below the first natural frequency
of the AHU supporting frame structure which are around 48% (driven fan blower frequency)
and 58% (driver motor frequency).
For further works, there is no requirement for any structural modifications for the AHU. Instead,
proper installation and alignment of the belt pulley system will ensure a longer lasting machine
life. Regular servicing may also be needed to clear the dusts that accumulate in the fan blower
because higher mass will reduce the natural frequency of the system. Although the loss of the
belt system is relatively cheap, however the belt misalignment can induce vibrations to the
whole structure which may cut short its working life conditions of the motor and the blower. For
expensive structures such as turbines in oil and gas industries, simple problems such as
misalignments, looseness and others will prove to be catastrophic in financial terms.
Strictly speaking this is still a hypothesis and must be proven by doing further works in
checking whether the motor and fan pulley is truly misaligned. If the pulleys are not misaligned,
therefore the hypothesis will be proved incorrect and another theory can be hypothesised that
the operating conditions might be exciting other natural frequencies that may belong to the
motor and fan or any other components of the AHU structure. This in turn provides the motion
described by the ODS results where the resonance affects axial vibrations at the belting pulley
system and causes it to experience fatigue failure. Other further works that can be done is to
simulate the rotational force of the belting system in the FEA model and tune it to the ODS
results to obtain a better simulation behaviour of the AHU under different conditions. This
method was consistently used by [2] for approaching vibration problems in pumps. Therefore
the utilisation of the analytical, FEA and experimental methods which are the modal and
operating deflection shapes analysis are important as tools to solve vibration problems.
4.0 CONCLUSIONS
Theoretical analysis was done and results were compared with experimental values. No proposal
of design modifications using FEA were done due to the time constraint and the author's
conclusion that the problem of the AHU structure is hypothetically caused by the misalignment
of the belt pulley system.
ACKNOWLEDGMENT
The authors would like to thank all the technical staffs from Universiti Malaysia Sarawak
(UNIMAS) and Universiti Teknologi Malaysia (UTM) involved in the project. The authors
would also like to acknowledge UTM for their continuous support in the research work.

Jurnal Mekanikal June 2013
85
REFERENCES
1. W. D. Marsc r “H w t Us Im ct T sting t lv Pum Vibr ti n Pr bl m ” in
Proceedings EPRI Power Plant Pumps Symposium, Florida, 1991.
2. M. M. Onari and P. A. Boyadjis, “ lving tructur l Vibr ti n Pr bl ms Using
O r ting D fl cti n n FInit El m nt An lysis ” in Pr c ings f t
Twenty-Fifth International Pump Users Symposium , 2009
3. L. Wang n Z. P n “Ex rim nt l l An lysis of Fan Vibration Frequ ncy ”
Applied Mechanics and Materials, pp. pp. 138-139, 2012.
4. C. Wang n J. C. . L i “Vibr ti n An lysis f n In ucti n t r ” J urn l f
Sound and Vibration, pp. pp. 733-756, 1999
5. F. Is ib s i . tsus it . N n K. T n ki “C ange of Mechanical Natural
Fr qu nci s f In ucti n t r ” IEEE Tr ns cti ns n In ustry A lic ti ns . .
922-927, 2010.
6. R. D. Blevins, Formulas for Natural Frequency and Mode Shape, New York: Van
Nostrand Reinhold Company, 1979.
7. S. Rao, Mechanical Vibrations: Fifth Edition, New Jersey: Prentice Hall, 2011
8. S. Timoshenko, D. H. Young and J. W. Weaver, Vibration Problems in
Engineering (4th ed.), New York: John Wiley, 1974.
9. A. Hr nnik ff “ luti n f Pr bl ms in El sticity by t Fr m W rk t ”
Journal of Applied Mechanics, vol. Vol. 8, no. No. 4, pp. pp. 169-175, December 1941
10. D. cH nry “A L ttic An l gy f r t luti n f Pl n tr ss Pr bl ms ” J urn l f
Institution of Civil Engineers, vol. Vol. 21, pp. pp. 59-82, 194.
11. N. M. N wm rk “Num ric l Et s f An lysis in B rs Pl t s n El stic B i s ”
in Numerical Methods in Analysis in Engineering, Macmillan, 1949.
12. . L vy “ tructur l An lysis n Influ nc C ffici nts f r D lt Wings ” J urn l f
Aeronautical Sciences, vol. Vol. 20, no. 7, pp. pp. 449-454, 1953.
13. J.H. Argyris “En rgy T r ms n tructur l An lysis ” in Aircr ft Engin ring
1955.
14. J. H. Argyris and S. Kelsey, Energy Theorems and Structural ANalysis, London:
Butterworth, 1960.
15. J. He and Z.-F. Fu, Modal Analysis, Oxford: Butterworth-Heinemann, 2001.
16. C. Scheffer and P. Girdhar, Practical Machinery Vibration Analysis & Predictive
Maintenance, MA: Elsevier, 2004.