Embed Size (px)
Citation preview
-1-Copyright © 2007 by Dynaflow Engineering B.V. All rights reserved
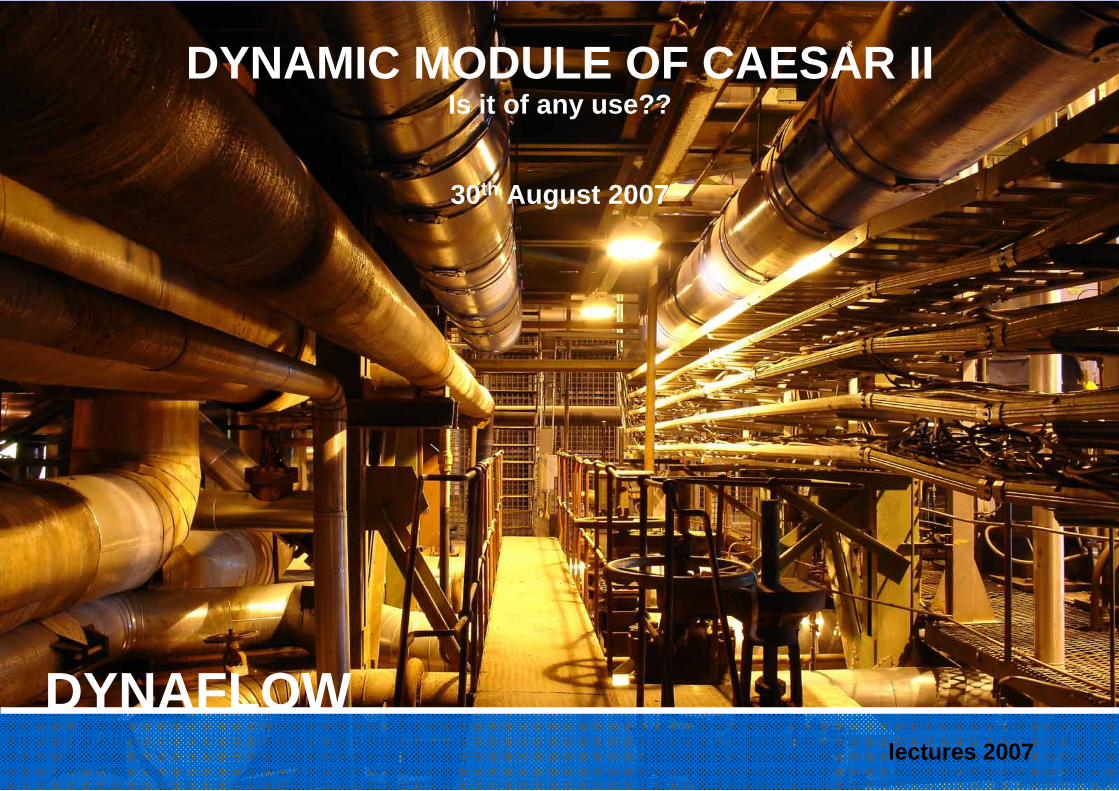
DYNAMIC MODULE OF CAESAR IIIs it of any use??
lectures 2007
DYNAFLOW
30th August 2007
-2-Copyright © 2007 by Dynaflow Engineering B.V. All rights reserved
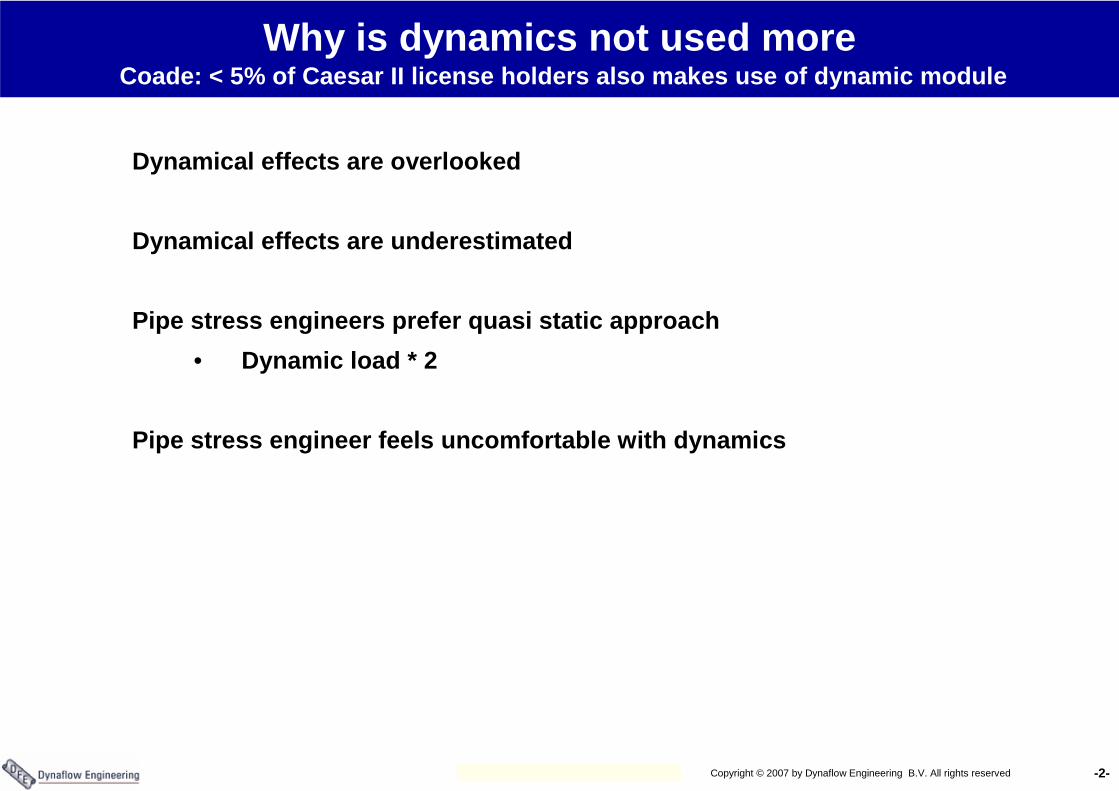
Why is dynamics not used moreCoade: < 5% of Caesar II license holders also makes use of dynamic module
Dynamical effects are overlooked
Dynamical effects are underestimated
Pipe stress engineers prefer quasi static approach• Dynamic load * 2
Pipe stress engineer feels uncomfortable with dynamics
-3-Copyright © 2007 by Dynaflow Engineering B.V. All rights reserved
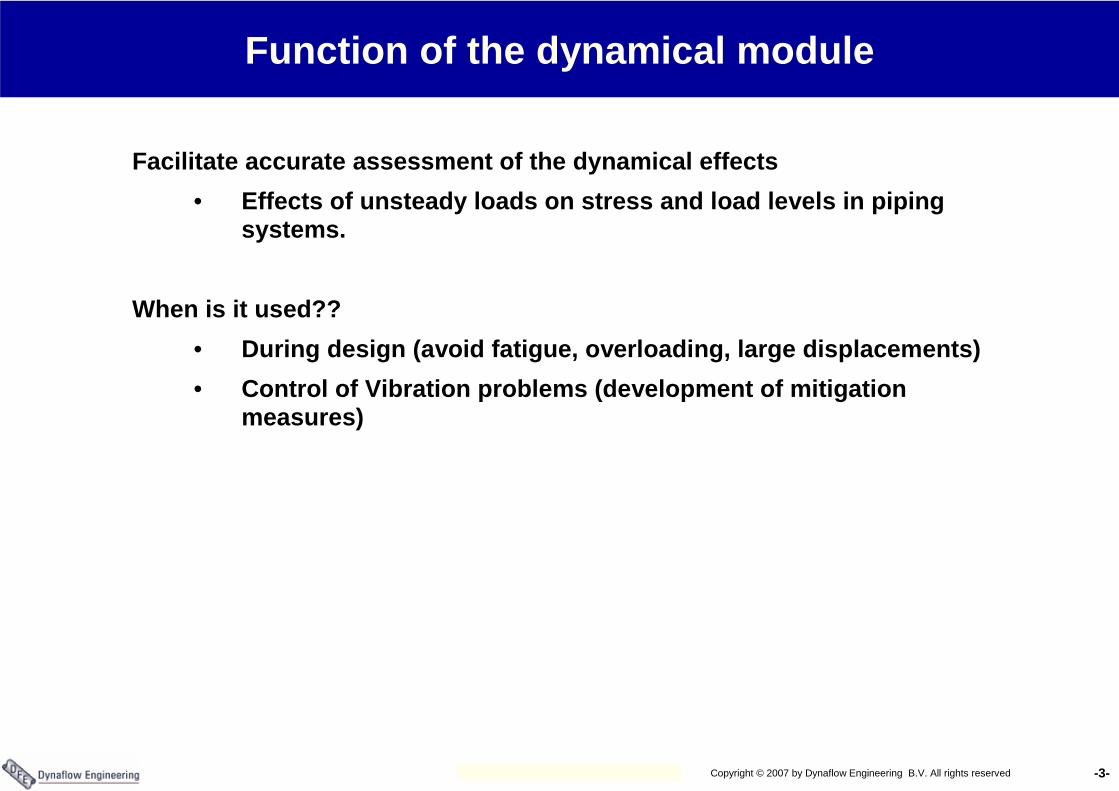
Function of the dynamical module
Facilitate accurate assessment of the dynamical effects • Effects of unsteady loads on stress and load levels in piping
systems.
When is it used??• During design (avoid fatigue, overloading, large displacements)• Control of Vibration problems (development of mitigation
measures)
-4-Copyright © 2007 by Dynaflow Engineering B.V. All rights reserved
Piping Incidents due to dynamic loads
Few examples of what might go wrong!!
-5-Copyright © 2007 by Dynaflow Engineering B.V. All rights reserved
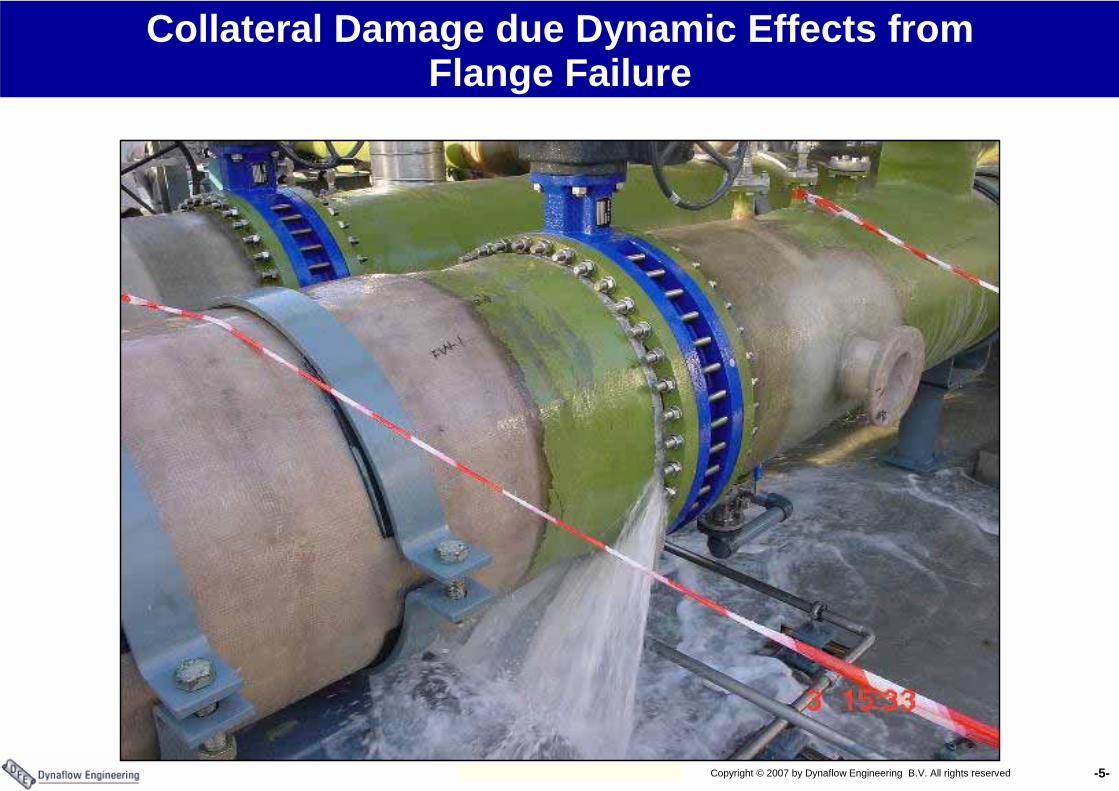
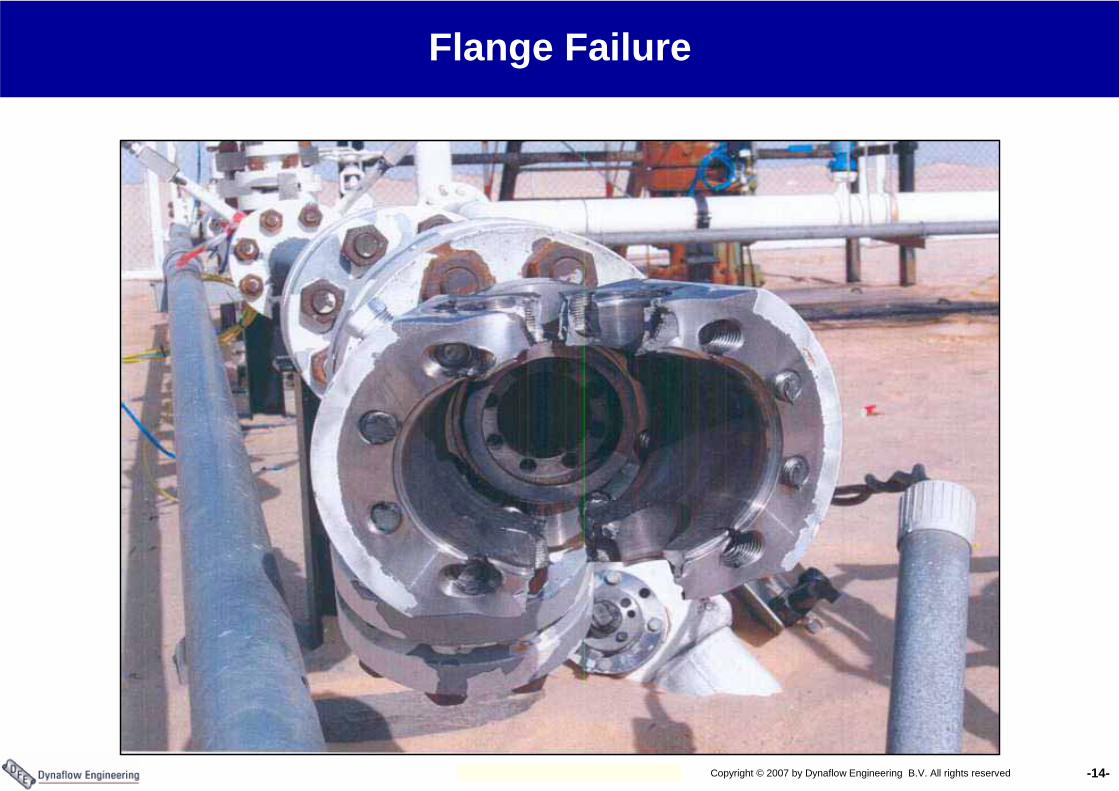
Collateral Damage due Dynamic Effects fromFlange Failure
-6-Copyright © 2007 by Dynaflow Engineering B.V. All rights reserved
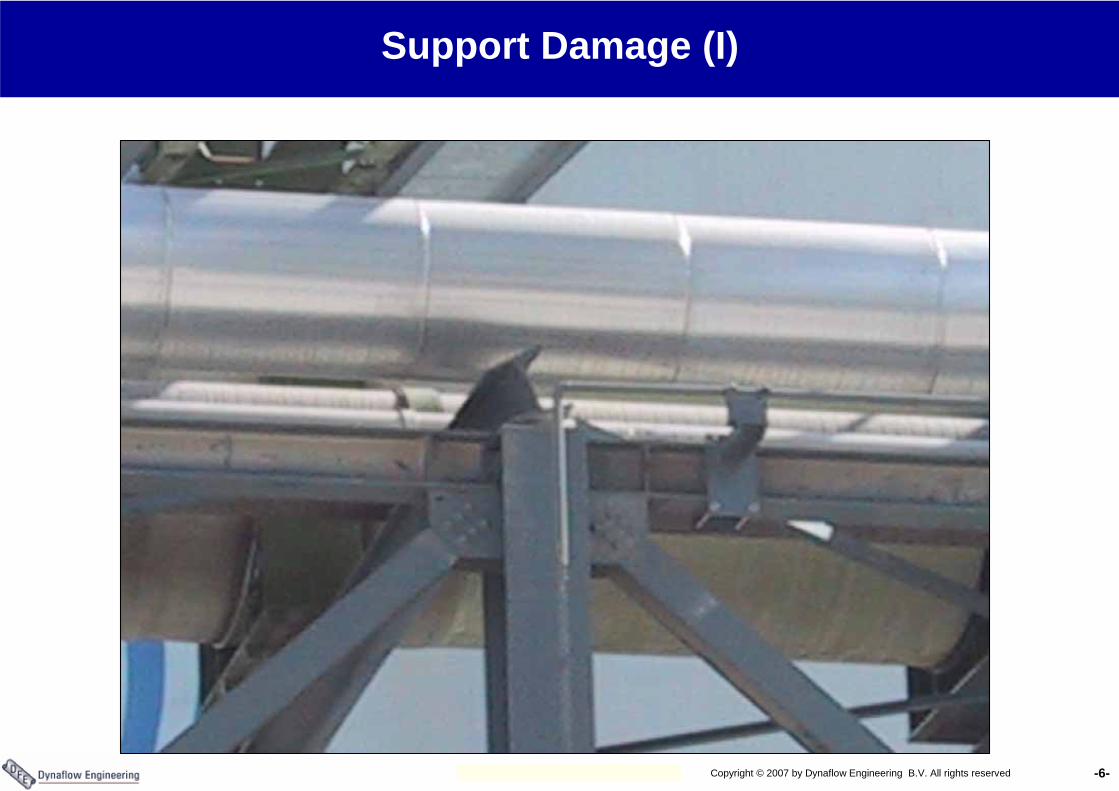
Support Damage (I)
-7-Copyright © 2007 by Dynaflow Engineering B.V. All rights reserved
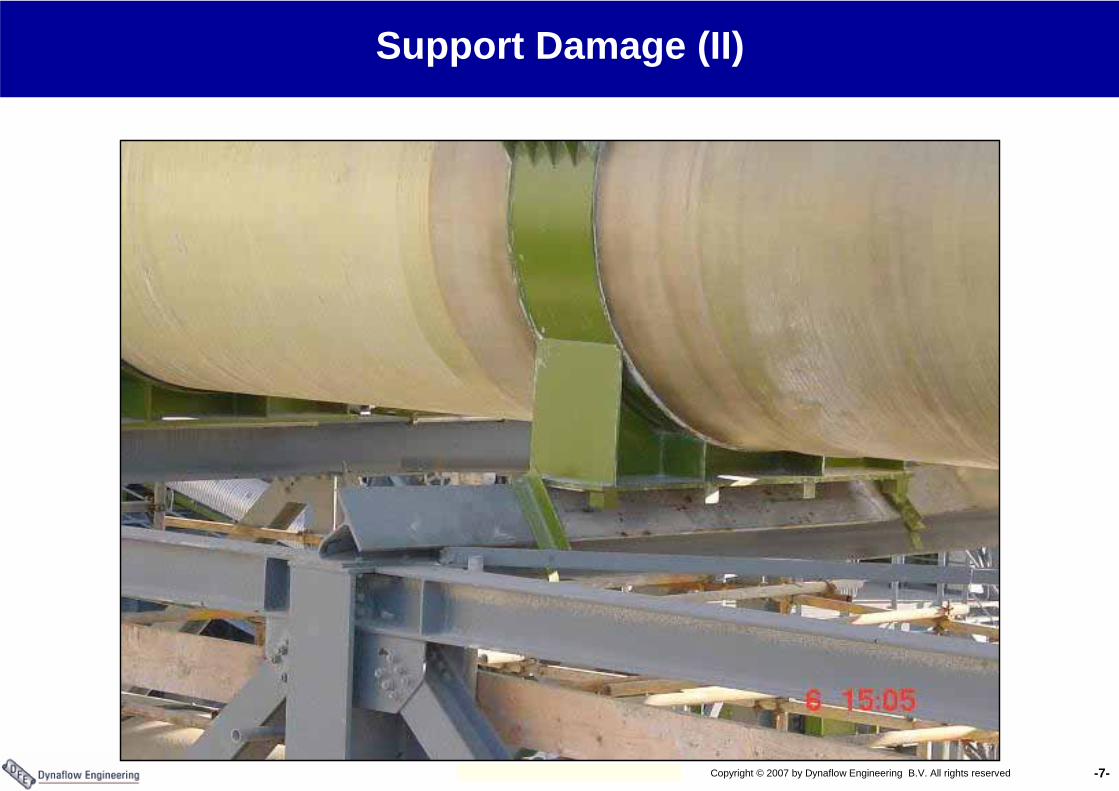
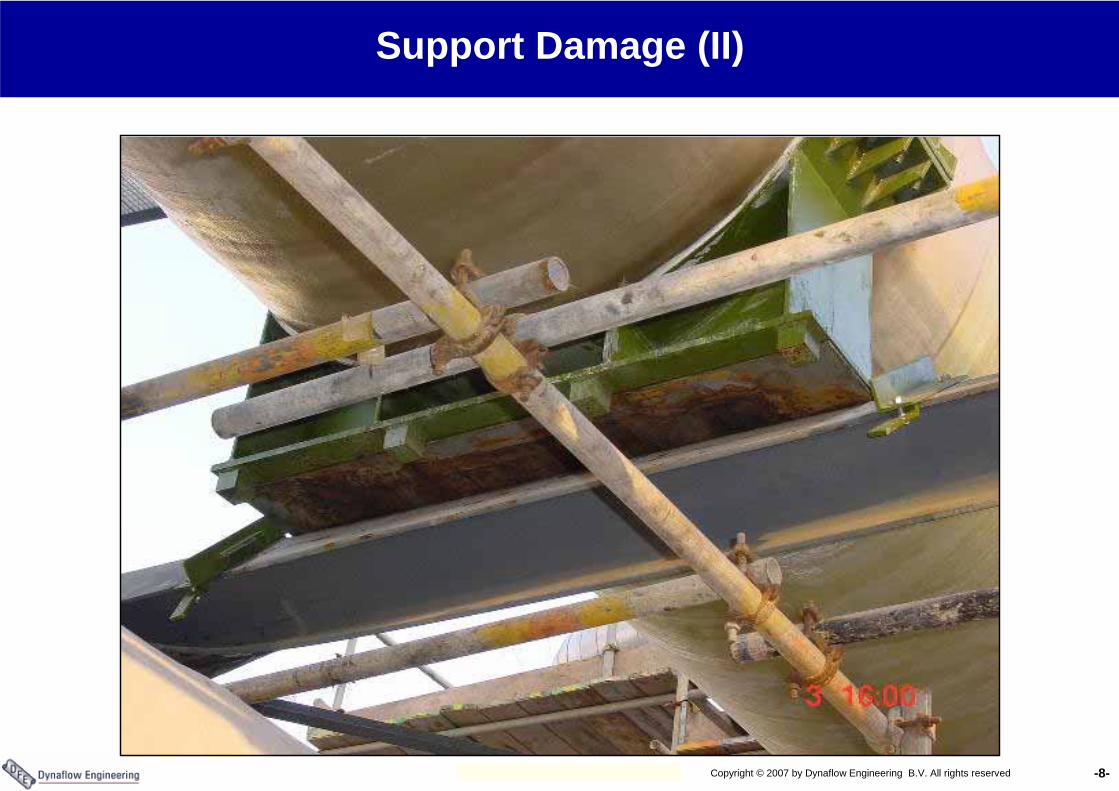
Support Damage (II)
-8-Copyright © 2007 by Dynaflow Engineering B.V. All rights reserved
Support Damage (II)
-9-Copyright © 2007 by Dynaflow Engineering B.V. All rights reserved
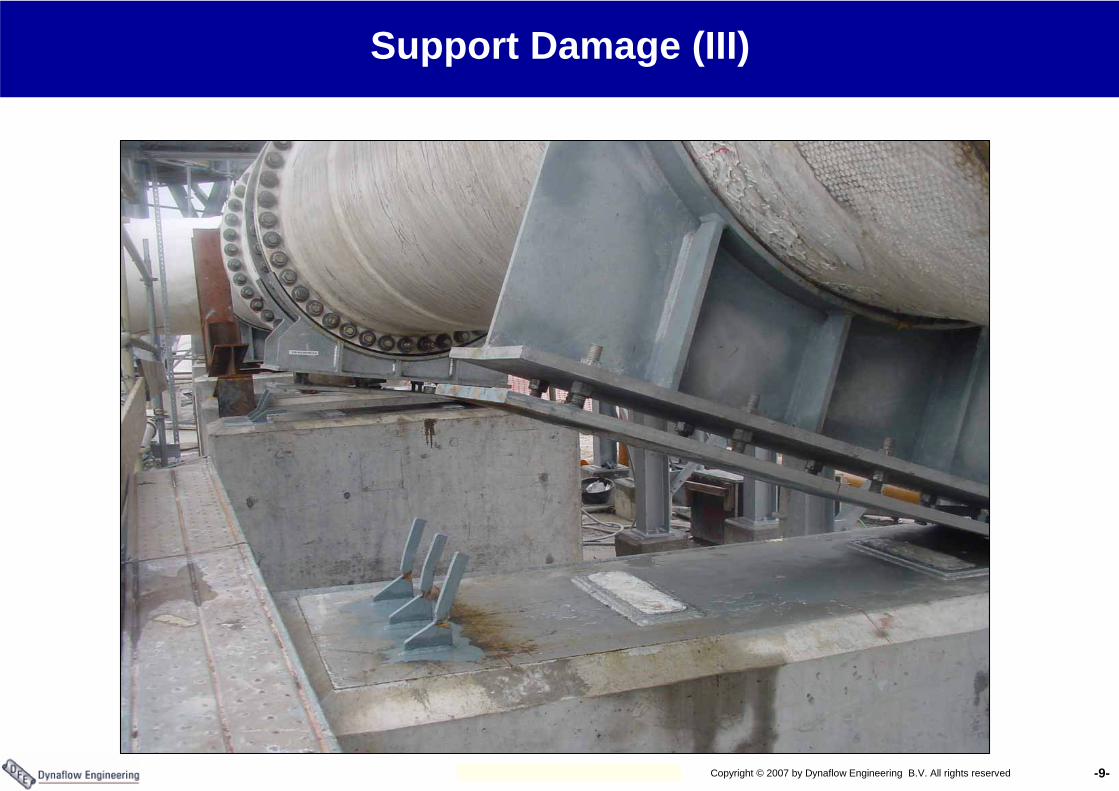
Support Damage (III)
-10-Copyright © 2007 by Dynaflow Engineering B.V. All rights reserved
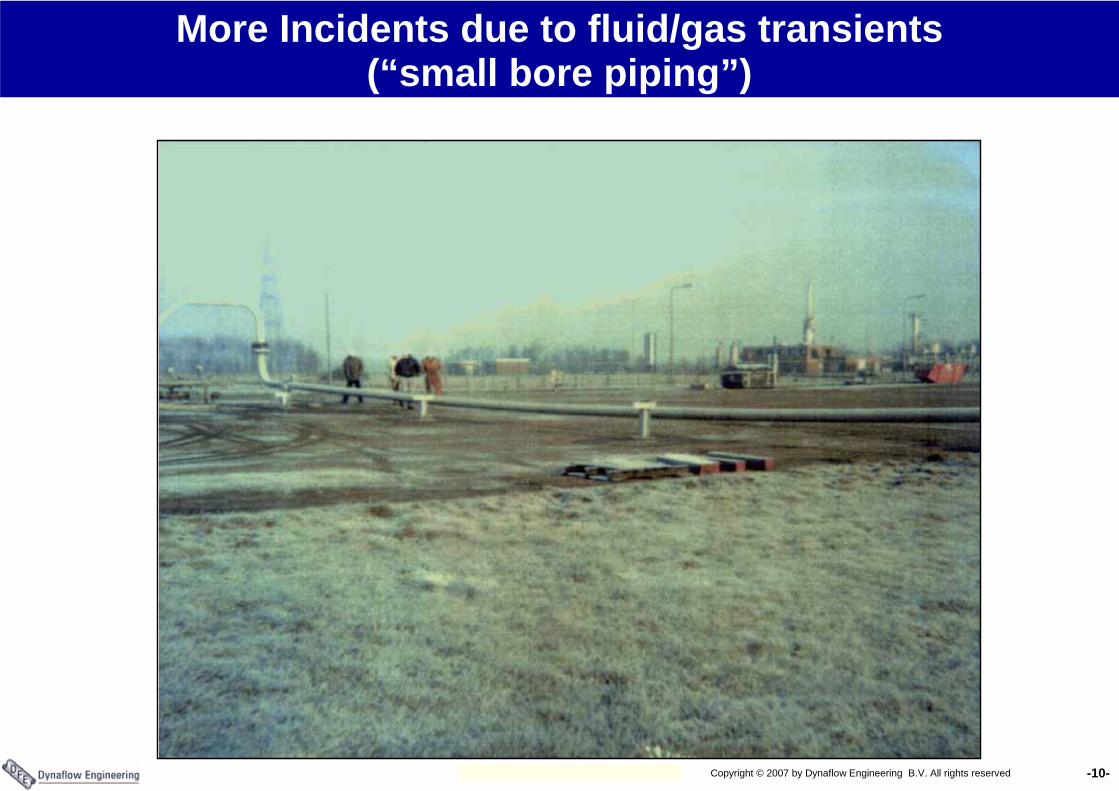
More Incidents due to fluid/gas transients (“small bore piping”)
-11-Copyright © 2007 by Dynaflow Engineering B.V. All rights reserved
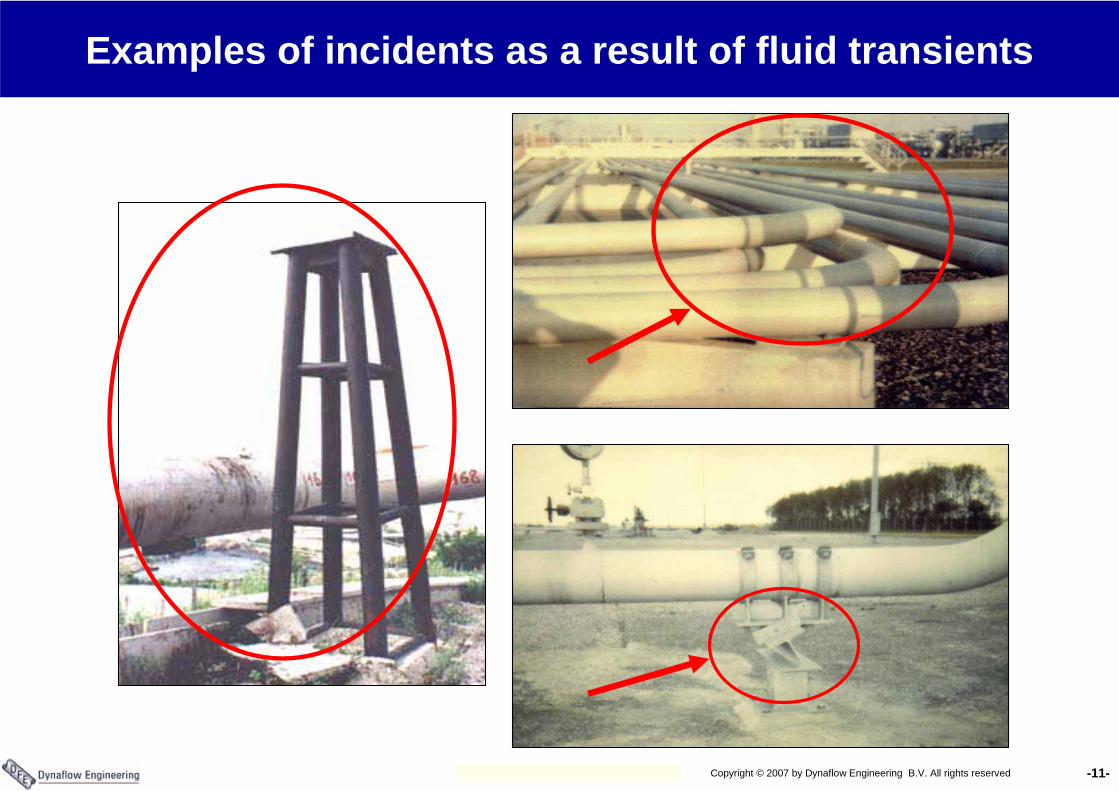
Examples of incidents as a result of fluid transients
-12-Copyright © 2007 by Dynaflow Engineering B.V. All rights reserved
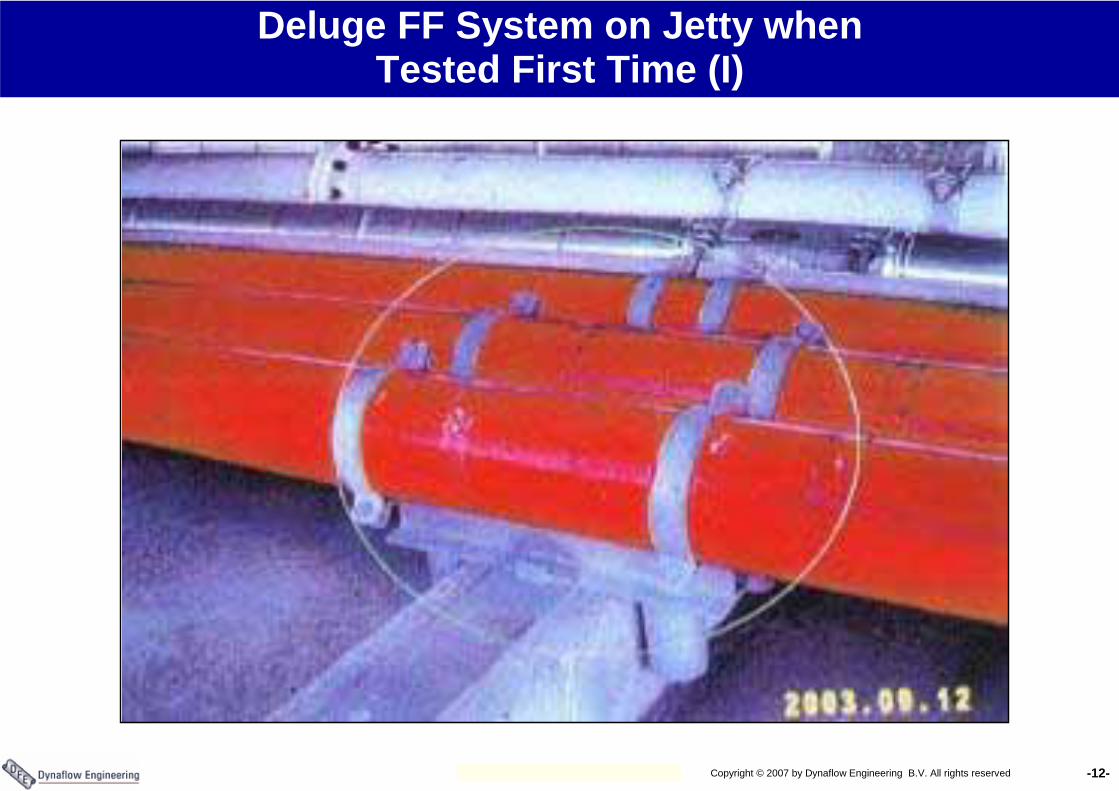
Deluge FF System on Jetty whenTested First Time (I)
-13-Copyright © 2007 by Dynaflow Engineering B.V. All rights reserved
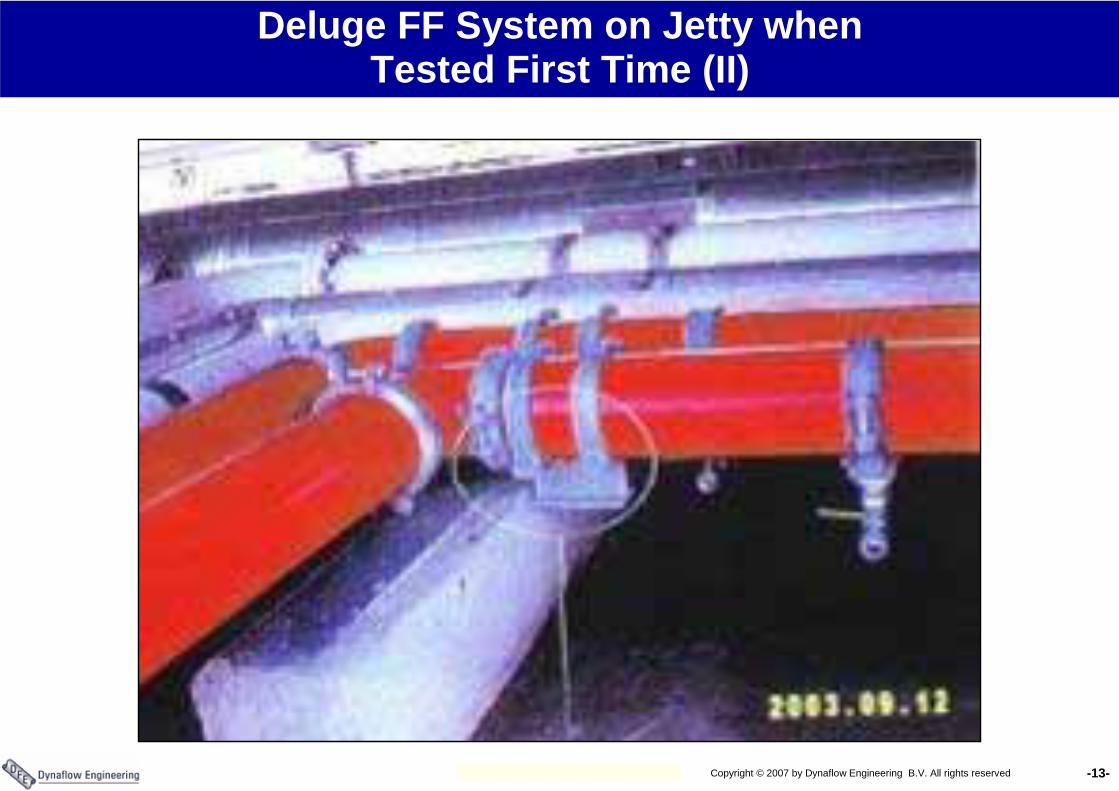
Deluge FF System on Jetty whenTested First Time (II)
-14-Copyright © 2007 by Dynaflow Engineering B.V. All rights reserved
Flange Failure
-15-Copyright © 2007 by Dynaflow Engineering B.V. All rights reserved
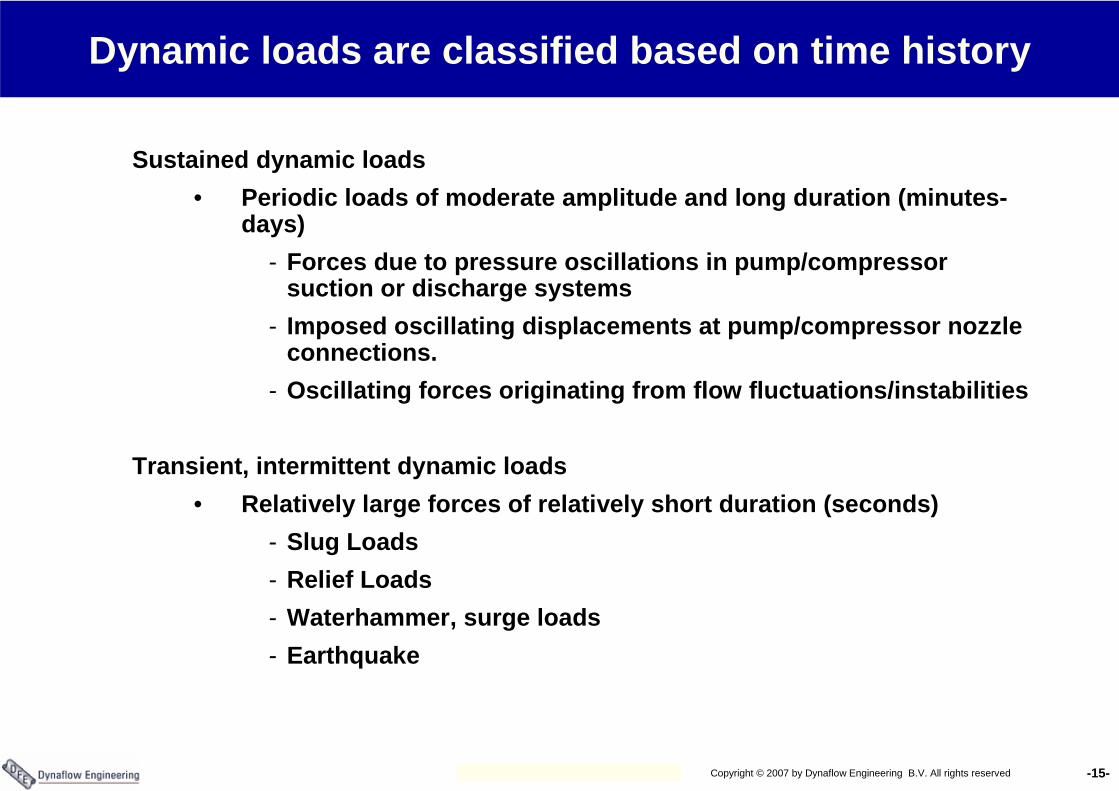
Dynamic loads are classified based on time history
Sustained dynamic loads• Periodic loads of moderate amplitude and long duration (minutes-
days)- Forces due to pressure oscillations in pump/compressor
suction or discharge systems- Imposed oscillating displacements at pump/compressor nozzle
connections.- Oscillating forces originating from flow fluctuations/instabilities
Transient, intermittent dynamic loads• Relatively large forces of relatively short duration (seconds)
- Slug Loads- Relief Loads- Waterhammer, surge loads- Earthquake
-16-Copyright © 2007 by Dynaflow Engineering B.V. All rights reserved
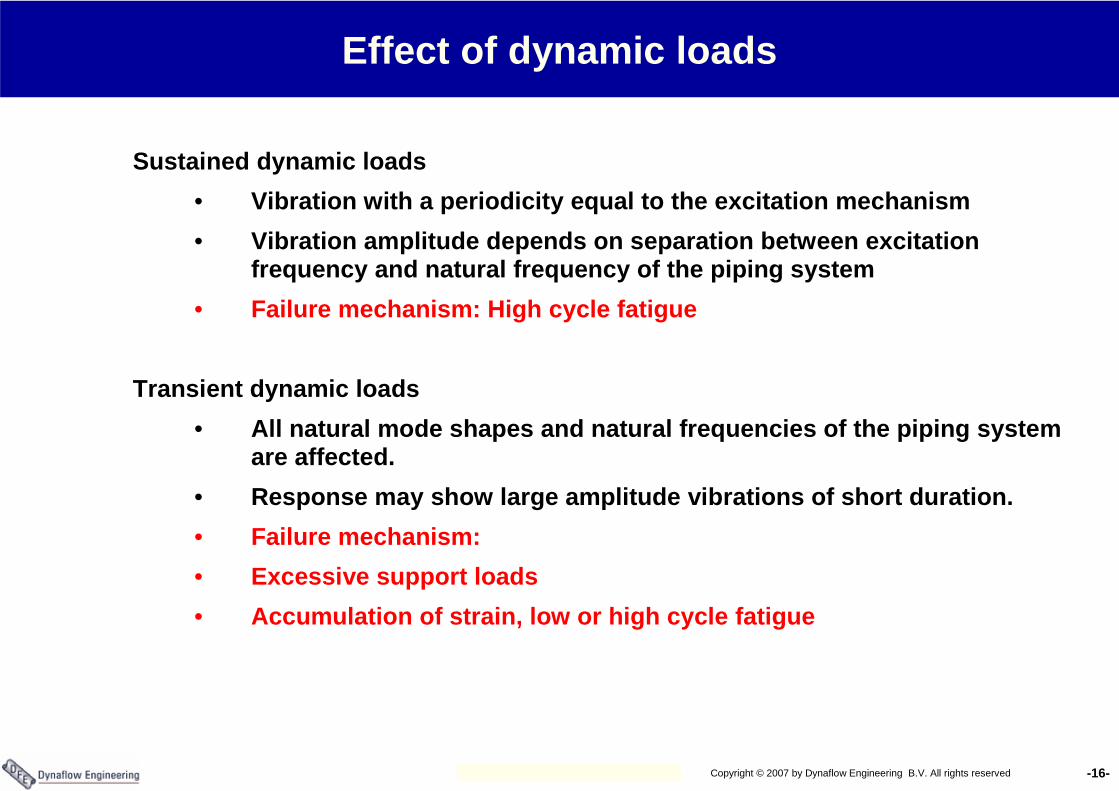
Effect of dynamic loads
Sustained dynamic loads• Vibration with a periodicity equal to the excitation mechanism• Vibration amplitude depends on separation between excitation
frequency and natural frequency of the piping system• Failure mechanism: High cycle fatigue
Transient dynamic loads• All natural mode shapes and natural frequencies of the piping system
are affected.• Response may show large amplitude vibrations of short duration.• Failure mechanism: • Excessive support loads• Accumulation of strain, low or high cycle fatigue
-17-Copyright © 2007 by Dynaflow Engineering B.V. All rights reserved
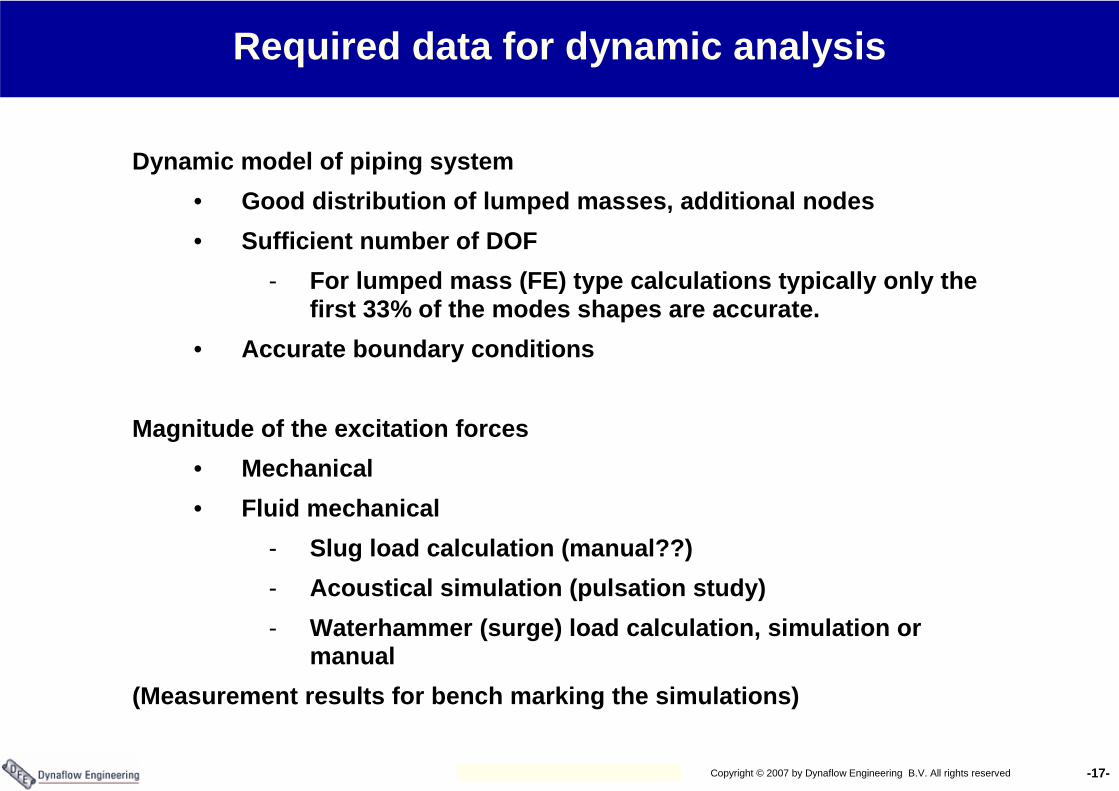
Required data for dynamic analysis
Dynamic model of piping system• Good distribution of lumped masses, additional nodes• Sufficient number of DOF
- For lumped mass (FE) type calculations typically only the first 33% of the modes shapes are accurate.
• Accurate boundary conditions
Magnitude of the excitation forces• Mechanical• Fluid mechanical
- Slug load calculation (manual??)- Acoustical simulation (pulsation study)- Waterhammer (surge) load calculation, simulation or
manual(Measurement results for bench marking the simulations)
-18-Copyright © 2007 by Dynaflow Engineering B.V. All rights reserved
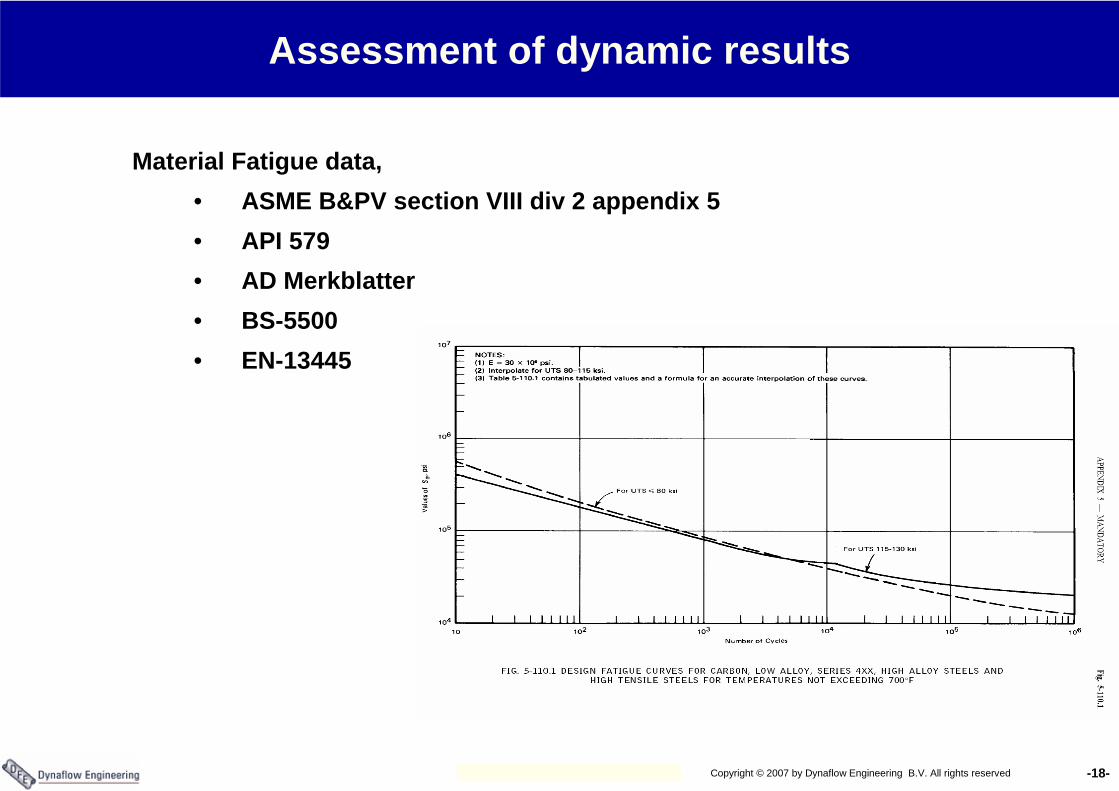
Assessment of dynamic results
Material Fatigue data,• ASME B&PV section VIII div 2 appendix 5• API 579• AD Merkblatter• BS-5500• EN-13445
-19-Copyright © 2007 by Dynaflow Engineering B.V. All rights reserved
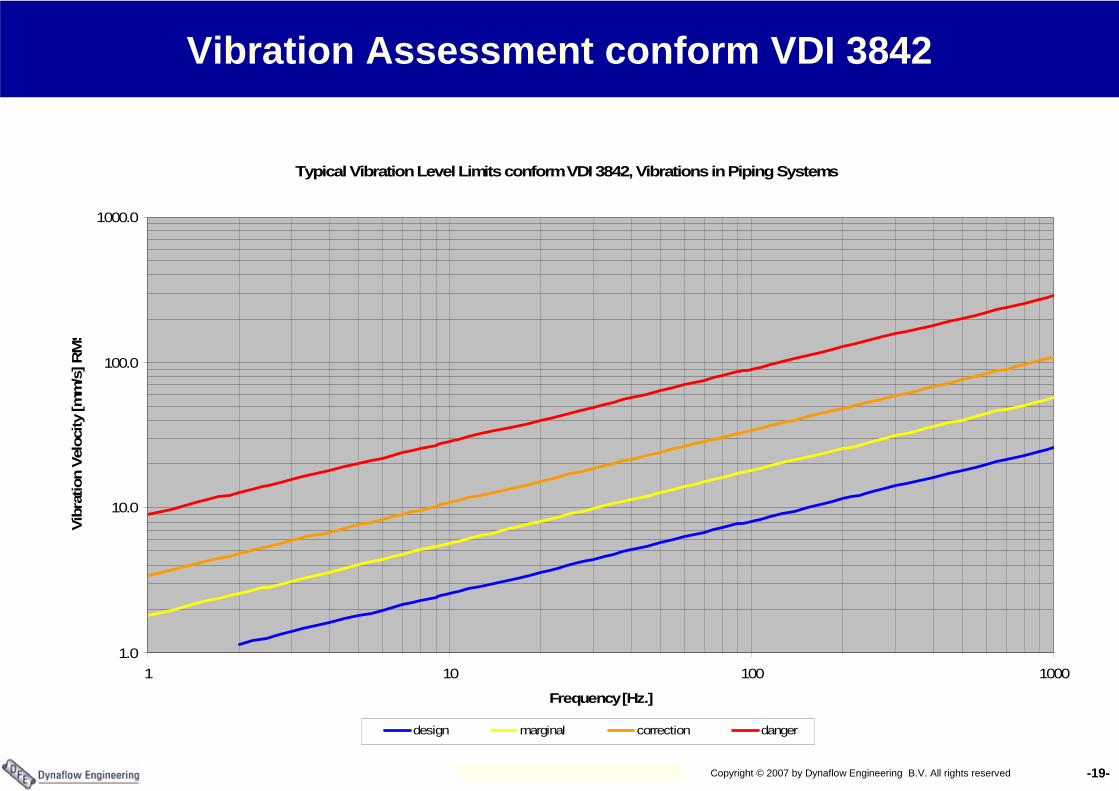
Vibration Assessment conform VDI 3842
Typical Vibration Level Limits conform VDI 3842, Vibrations in Piping Systems
1.0
10.0
100.0
1000.0
1 10 100 1000
Frequency [Hz.]
Vibr
atio
n Ve
loci
ty [m
m/s
] RM
S
design marginal correction danger
-20-Copyright © 2007 by Dynaflow Engineering B.V. All rights reserved
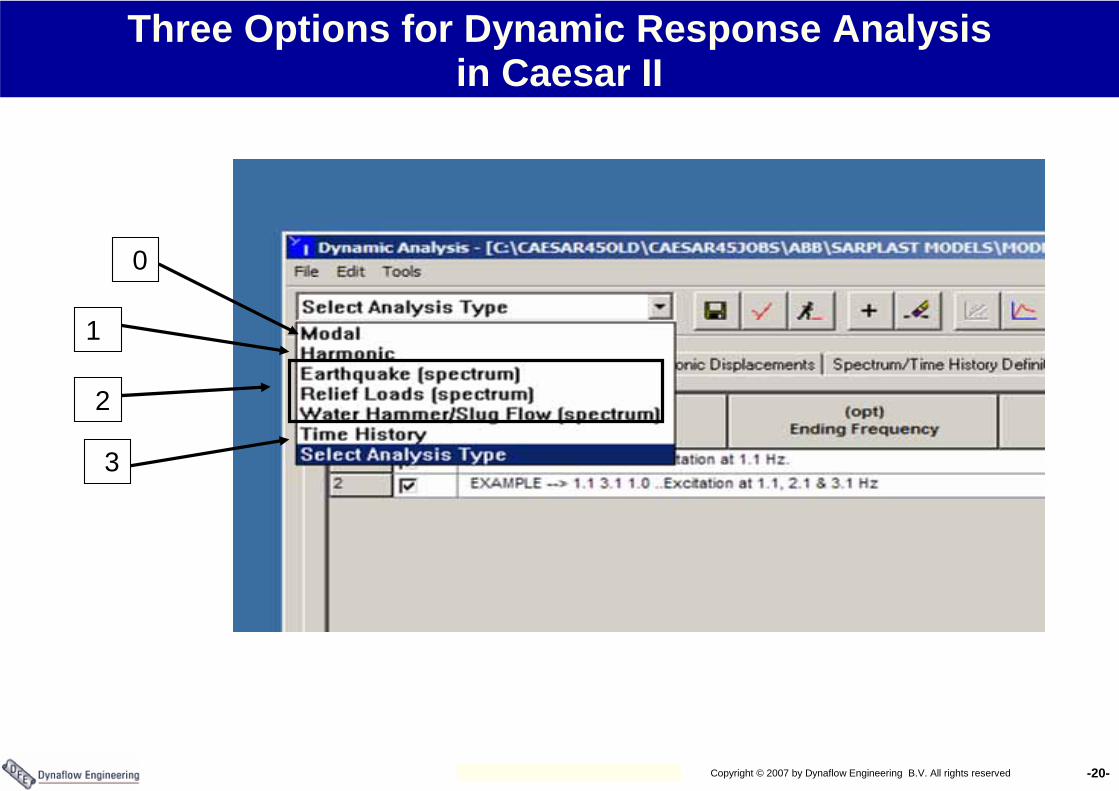
Three Options for Dynamic Response Analysisin Caesar II
1
2
3
0
-21-Copyright © 2007 by Dynaflow Engineering B.V. All rights reserved
Harmonic analysis
Application• Sustained vibrations (compressors & pumps)
Input• Periodic Loads can be applied at any node in the system• Per load case one excitation frequency• Many load cases are possible
Solution method• Since response frequency equals excitation frequency solution
procedure is quasi static (fast)
Output• Stress, displacement and load amplitude per frequency
-22-Copyright © 2007 by Dynaflow Engineering B.V. All rights reserved
Spectrum Analysis
Application• Transient vibrations: slug, waterhammer, relief
Input• Load time histories at many nodes in the system
Calculation method• Load time histories are translated into response spectra (time
phase between different loads is lost)• Natural frequencies and mode shapes are calculated• Response for each mode shape is determined• Mode shape responses are combined into a final system
response
Output • Maximum stress, largest modal contribution • Maximum loads, largest modal contribution• Maximum displacements
-23-Copyright © 2007 by Dynaflow Engineering B.V. All rights reserved
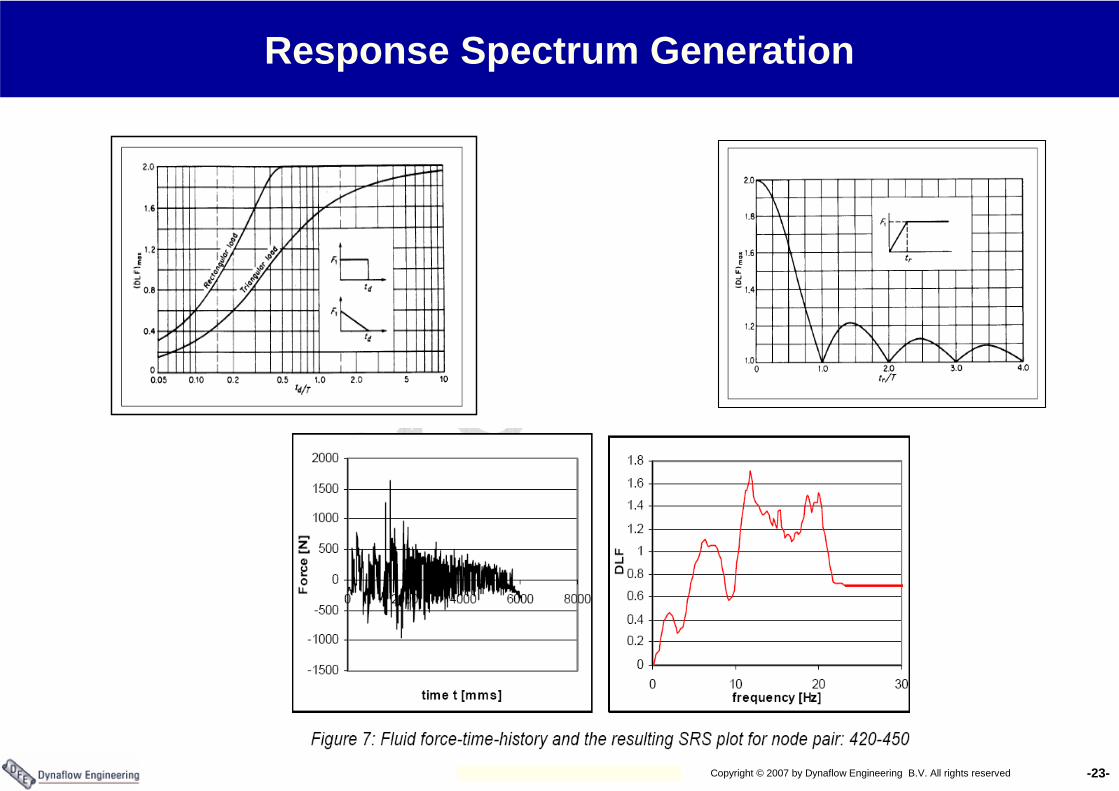
Response Spectrum Generation
-24-Copyright © 2007 by Dynaflow Engineering B.V. All rights reserved
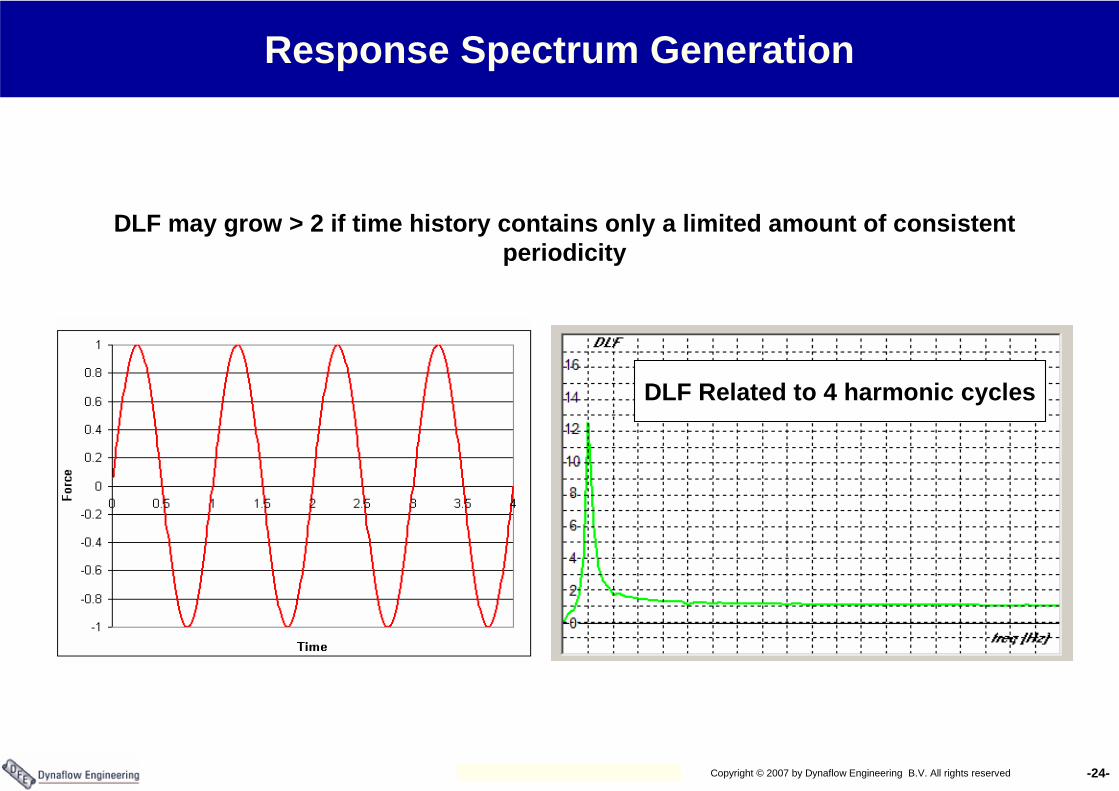
Response Spectrum Generation
DLF Related to 4 harmonic cycles
DLF may grow > 2 if time history contains only a limited amount of consistent periodicity
-25-Copyright © 2007 by Dynaflow Engineering B.V. All rights reserved
Time History Analysis
Application• Transient vibrations: slug, waterhammer, relief
Input• Load time histories at many nodes in the system
Calculation method• Load time histories are maintained (time phase between different loads is
conserved)• Natural frequencies and mode shapes are calculated• Response of each mode shape is determined• Mode shape responses are combined into a final system response
Output • Maximum stress, actual stress at user defined times (snapshots)• Maximum loads, actual load at user defined times• Maximum displacements, actual displacement at user defined times• By combination of several runs a time history of stress, loads
displacements can be composed
-26-Copyright © 2007 by Dynaflow Engineering B.V. All rights reserved
Missing Mass correction
Only limited number of mode shapes are extracted and participating in the response
Only a fraction (preferably close to 100%) of the system mass isparticipating
Only a fraction of the total excitation force is participating
The missing force fraction is calculated and applied statically after multiplication by the largest DLF value above the frequency cut-off.
Important when large axial loads are applied (axial mode shapes have relatively high natural frequencies.
-27-Copyright © 2007 by Dynaflow Engineering B.V. All rights reserved
Spectrum versus Time History
Spectrum• Frequency domain• Conservative results: only maximum response per mode shape is
calculated and combined in system response• Mode making maximum contribution is identified (advantage for
vibration control)• Only maxima are calculated, time phase is lost• Number of participating modes is finite (missing mass)
Time history• Time domain• More accurate results: time history response per mode is
conserved and time phasing between model maxima is maintained during combination.
• Load, stress time histories (enables fatigue assessment by meansof cumulative damage, counting of cycles)
• Graphical response is possible• Modal info is not available• Calculation is memory intensive (limits simulation duration,
number of participating modes, time step resolution)• Number of participating modes is finite (missing mass)
-28-Copyright © 2007 by Dynaflow Engineering B.V. All rights reserved
Quasi-Static Approach
Dynamic Load amplitude (maximum) * DLF=2 as static load
Quasi static approach is simple and fast
Quasi static approach works when there is only one dominant modeshape that is excited
Quasi static approach focuses on loads (dynamic response is not considered), i.e. solution by change/elimination of modes is not possible.
-29-Copyright © 2007 by Dynaflow Engineering B.V. All rights reserved
Best Method for Transient (Impact) Loads Analysis
Quasi static• Simple but only if there is one dominant mode shape
Spectrum• Time phase between several impacts on one system is lost (e.g.
slug hitting consecutive elbows)• Conservative but output provides clues for problem solving.
Mode with largest contribution is identified.
Time history• Exact, timing relation between impacts is maintained (slug,
waterhammer)• Clues for diagnosis are less obvious
For transient loads a combination of spectrum and time history runs provides the best opportunities
-30-Copyright © 2007 by Dynaflow Engineering B.V. All rights reserved
Protective Measures
Sustained dynamic loads• Control of mechanical natural frequencies of the piping system
in relation to the excitation frequency• Support functions and support stiffness (in general high
stiffness)• Analysis accuracy is increased if support structure is included
in the modelTransient dynamic loads
• Control of support and nozzle loads• Support flexibility is sometimes useful• Elimination of damaging mode shapes
Protective measures for dynamics may be conflicting with statics
-31-Copyright © 2007 by Dynaflow Engineering B.V. All rights reserved
-32-Copyright © 2007 by Dynaflow Engineering B.V. All rights reserved
-33-Copyright © 2007 by Dynaflow Engineering B.V. All rights reserved
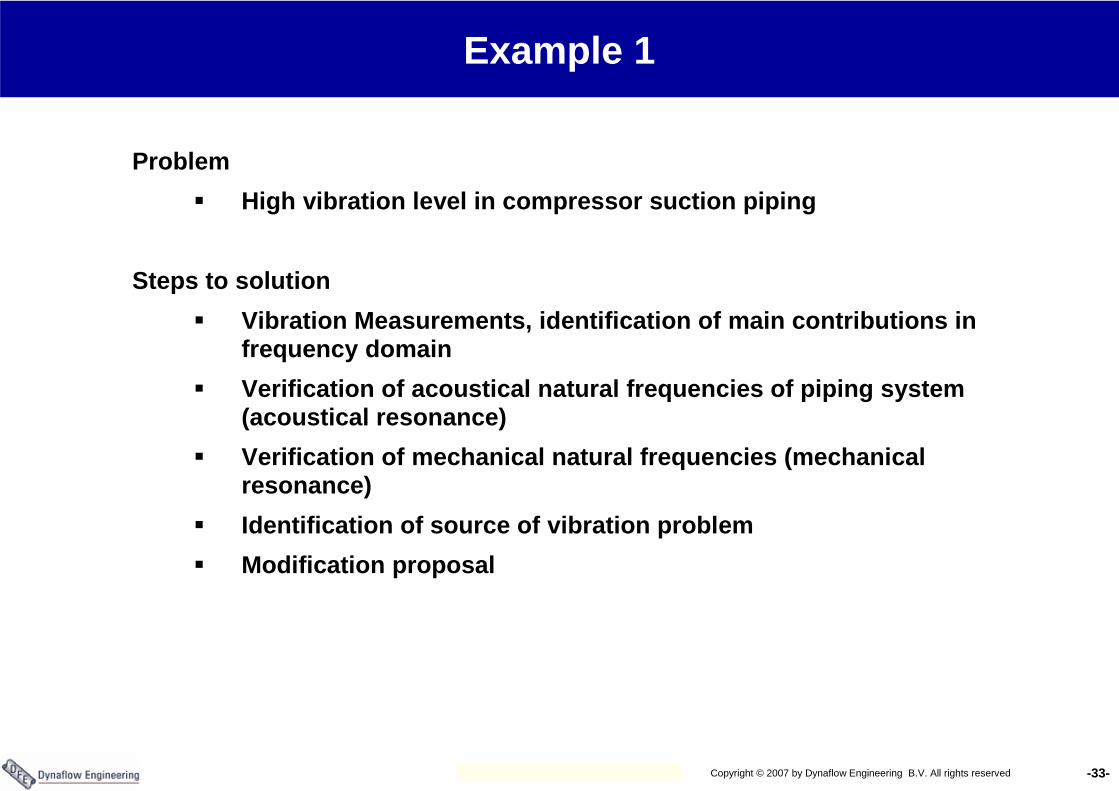
Example 1
ProblemHigh vibration level in compressor suction piping
Steps to solutionVibration Measurements, identification of main contributions in frequency domainVerification of acoustical natural frequencies of piping system (acoustical resonance)Verification of mechanical natural frequencies (mechanical resonance)Identification of source of vibration problemModification proposal
-34-Copyright © 2007 by Dynaflow Engineering B.V. All rights reserved
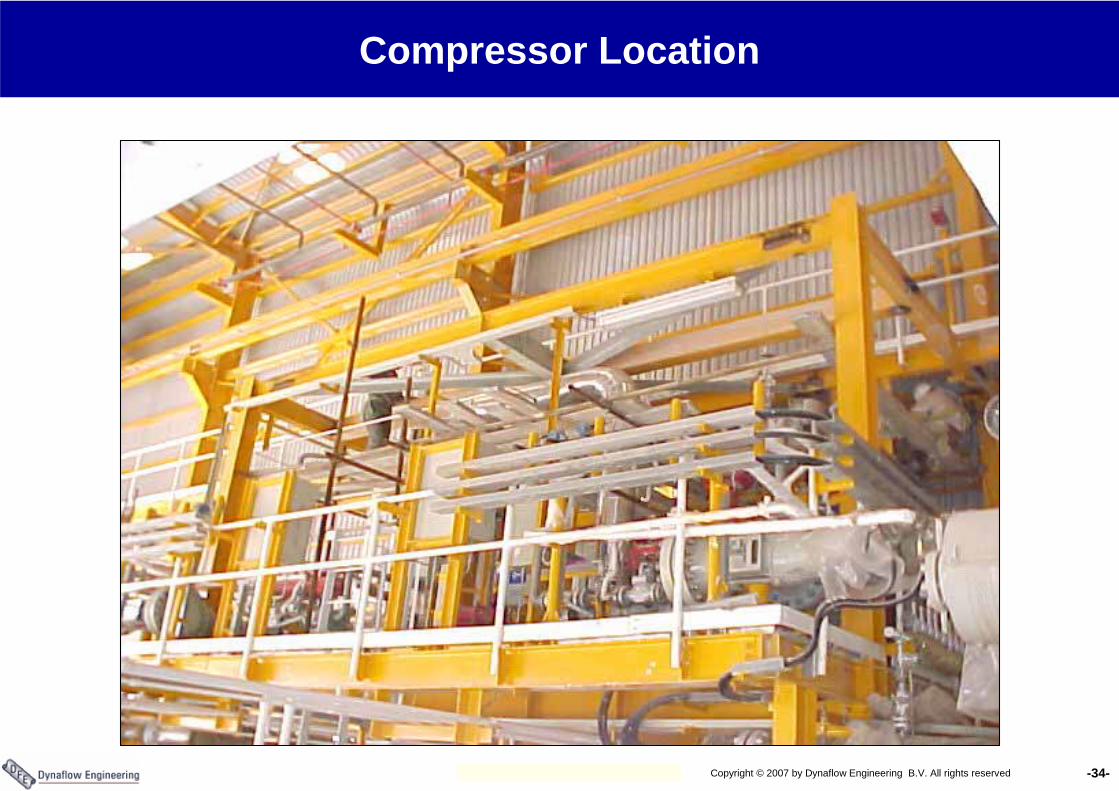
Compressor Location
-35-Copyright © 2007 by Dynaflow Engineering B.V. All rights reserved
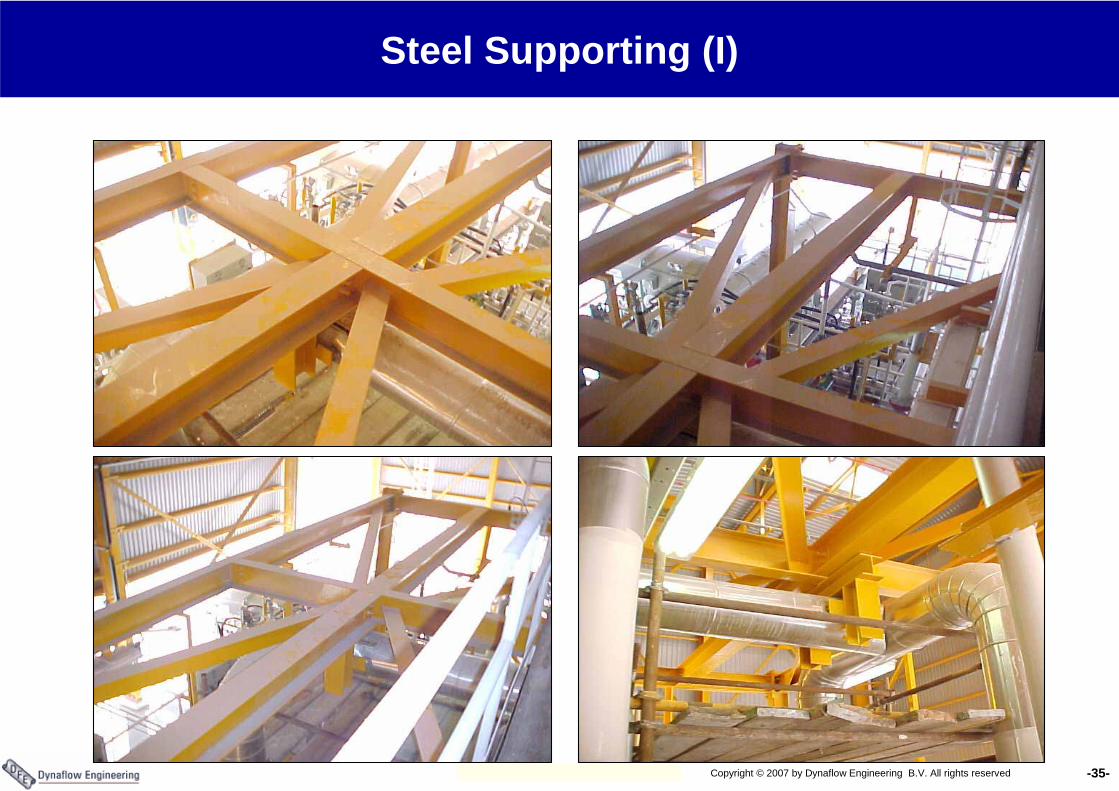
Steel Supporting (I)
-36-Copyright © 2007 by Dynaflow Engineering B.V. All rights reserved
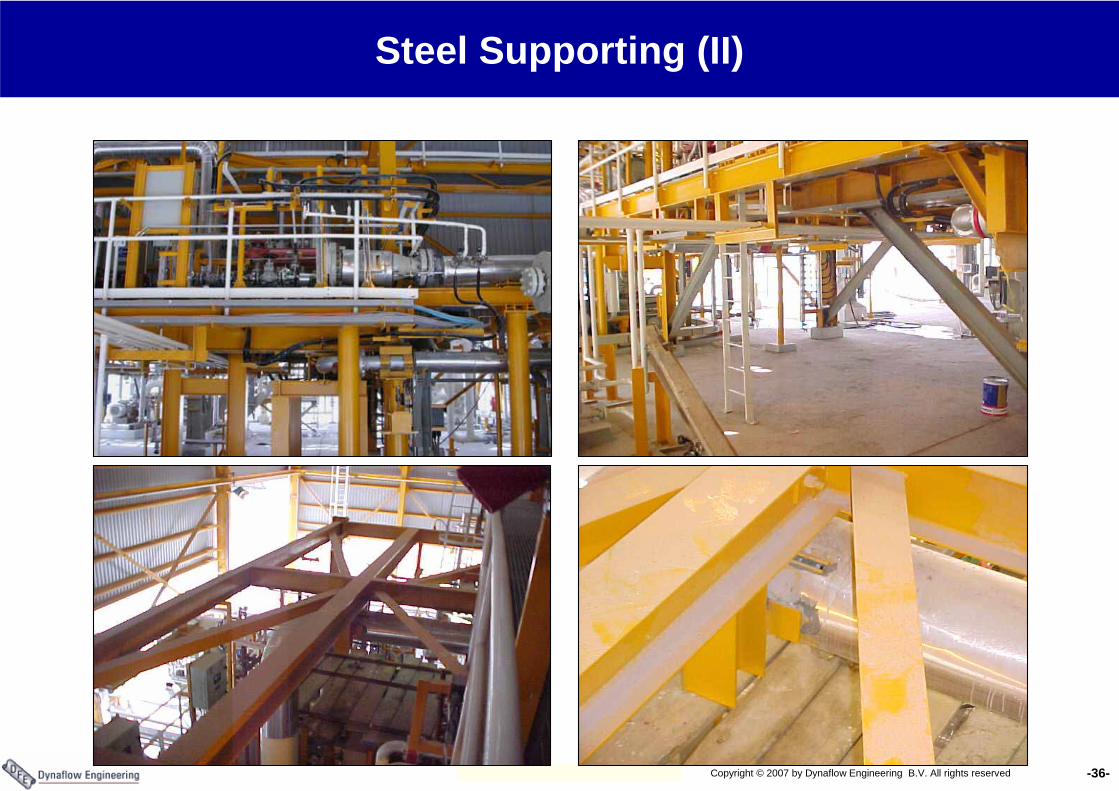
Steel Supporting (II)
-37-Copyright © 2007 by Dynaflow Engineering B.V. All rights reserved
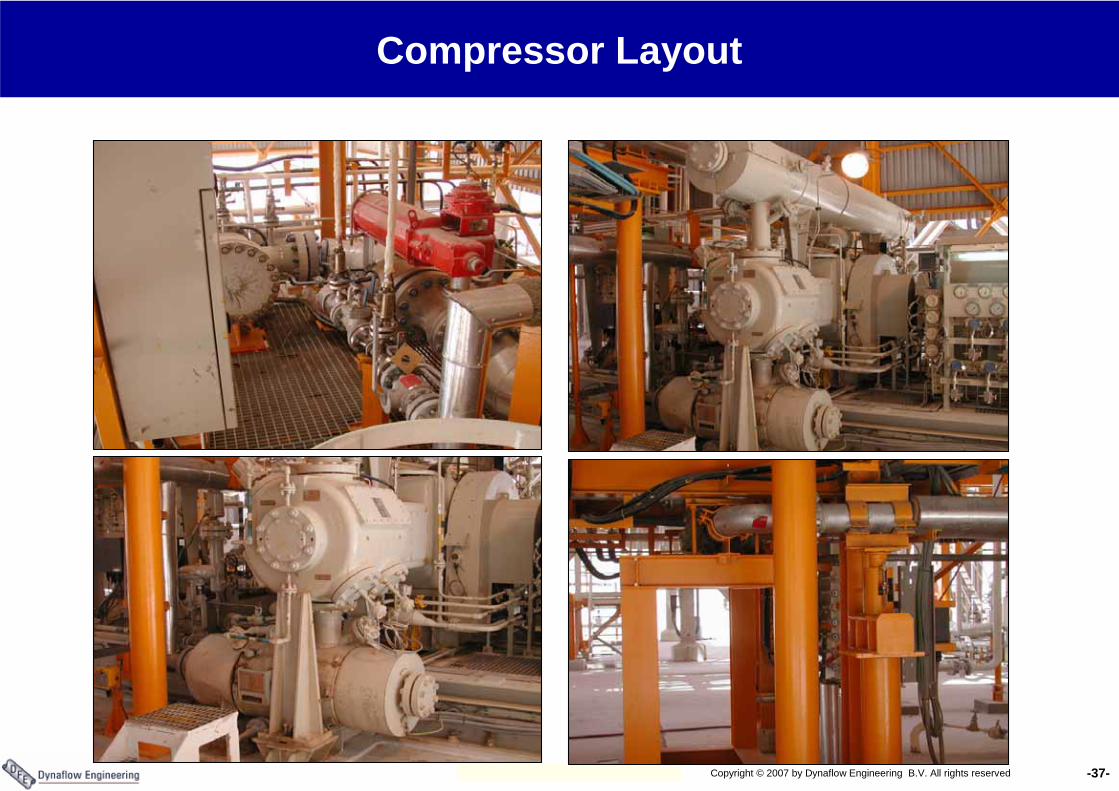
Compressor Layout
-38-Copyright © 2007 by Dynaflow Engineering B.V. All rights reserved
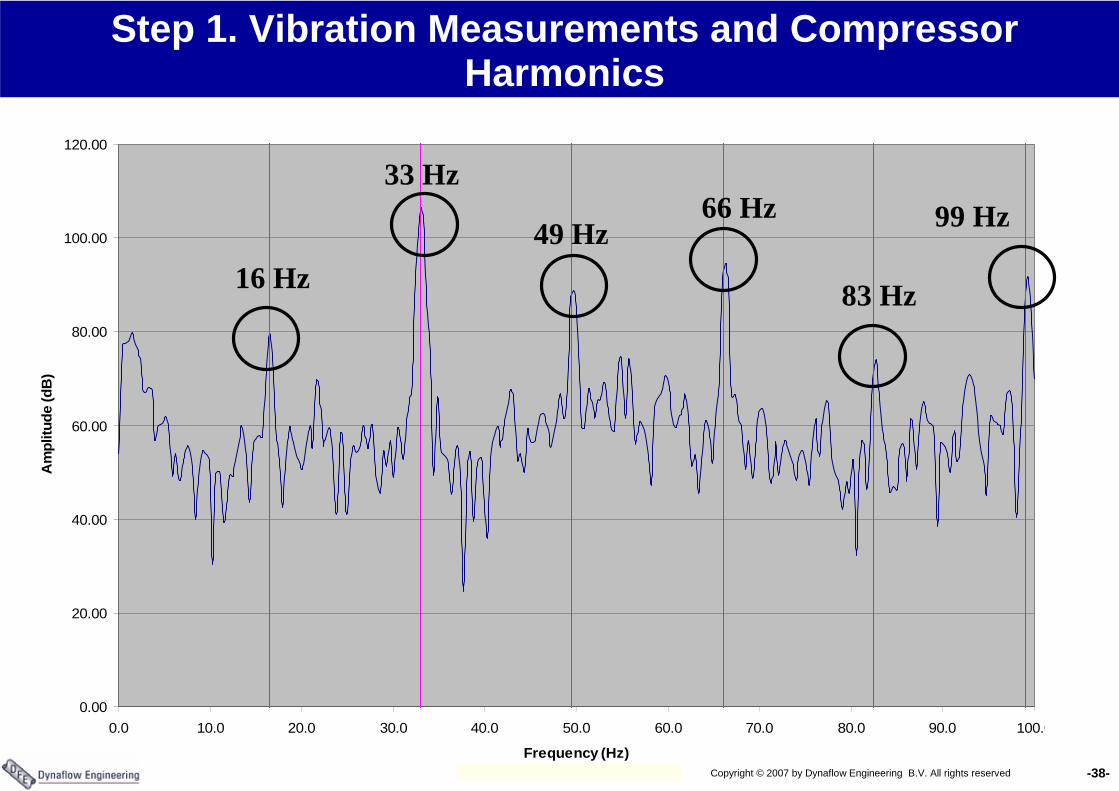
Step 1. Vibration Measurements and Compressor Harmonics
0.00
20.00
40.00
60.00
80.00
100.00
120.00
0.0 10.0 20.0 30.0 40.0 50.0 60.0 70.0 80.0 90.0 100.0
Frequency (Hz)
Am
plitu
de (d
B)
66 Hz 99 Hz49 Hz
33 Hz
83 Hz16 Hz
-39-Copyright © 2007 by Dynaflow Engineering B.V. All rights reserved
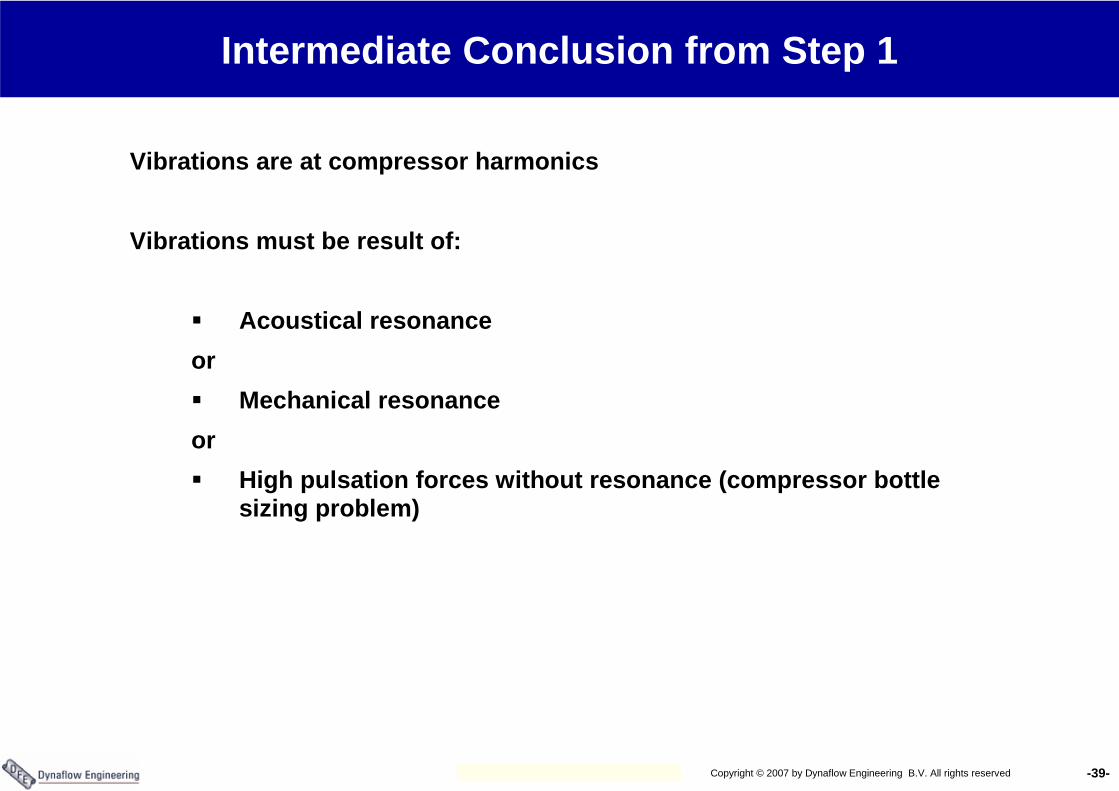
Intermediate Conclusion from Step 1
Vibrations are at compressor harmonics
Vibrations must be result of:
Acoustical resonanceor
Mechanical resonanceor
High pulsation forces without resonance (compressor bottle sizing problem)
-40-Copyright © 2007 by Dynaflow Engineering B.V. All rights reserved
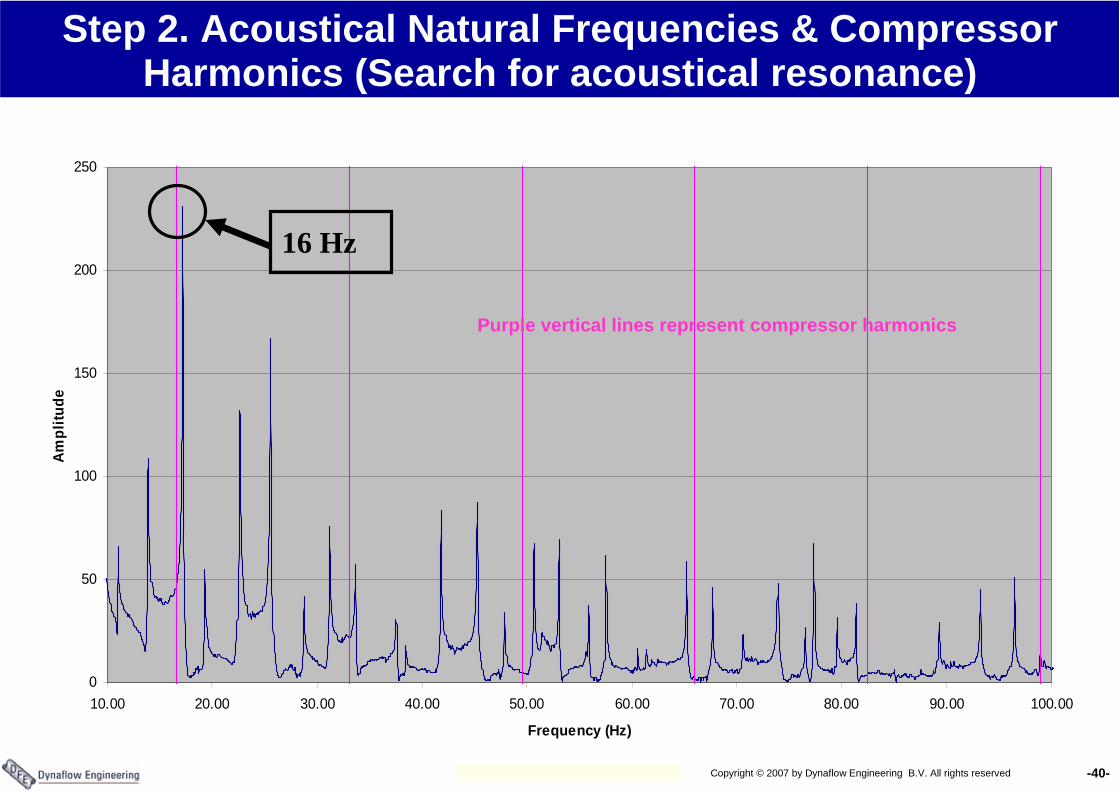
Step 2. Acoustical Natural Frequencies & Compressor Harmonics (Search for acoustical resonance)
0
50
100
150
200
250
10.00 20.00 30.00 40.00 50.00 60.00 70.00 80.00 90.00 100.00
Frequency (Hz)
Ampl
itude
16 Hz
Purple vertical lines represent compressor harmonics
-41-Copyright © 2007 by Dynaflow Engineering B.V. All rights reserved
Intermediate Conclusion from Step 2
Maybe near to resonance condition at first compressor harmonic (16.5 Hz.).
No further acoustical resonance
Vibration peak at 16.5 Hz, most probably is due high shaking forces as a result of near resonant condition.
The other vibration peaks must be the result of: Mechanical resonance
orHigh pulsation forces without resonance (compressor bottle sizing problem)
-42-Copyright © 2007 by Dynaflow Engineering B.V. All rights reserved
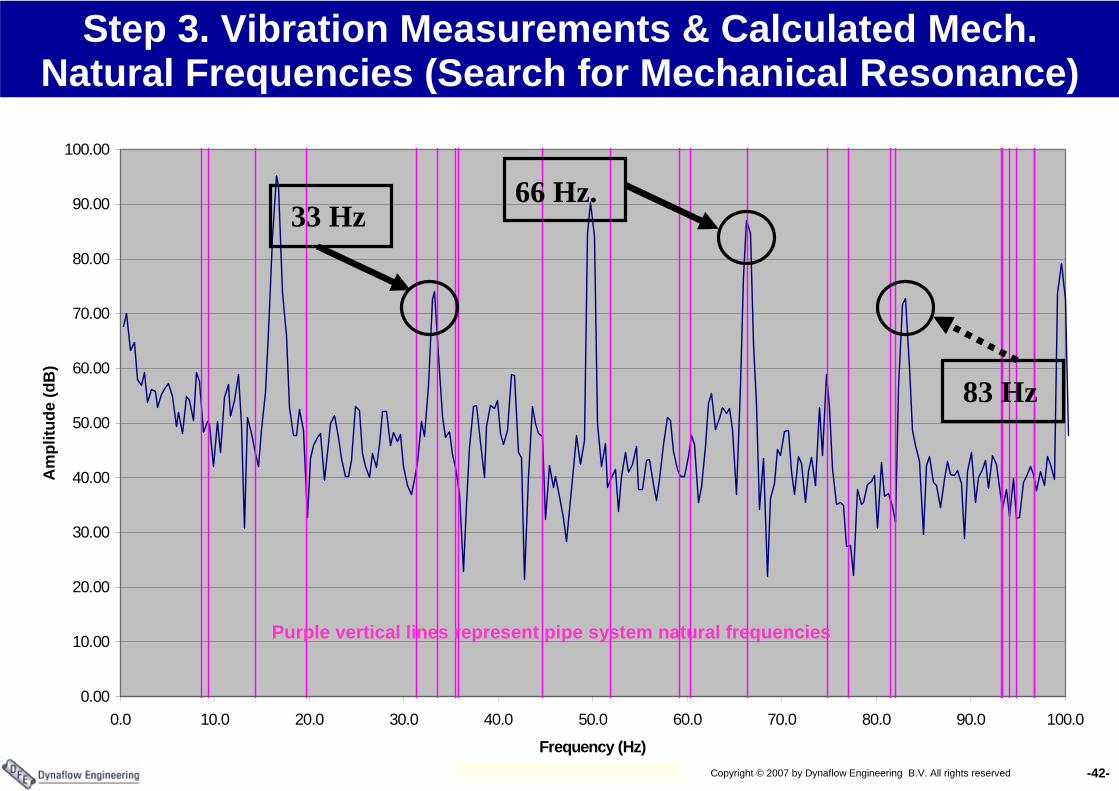
Step 3. Vibration Measurements & Calculated Mech. Natural Frequencies (Search for Mechanical Resonance)
0.00
10.00
20.00
30.00
40.00
50.00
60.00
70.00
80.00
90.00
100.00
0.0 10.0 20.0 30.0 40.0 50.0 60.0 70.0 80.0 90.0 100.0
Frequency (Hz)
Am
plitu
de (d
B)
66 Hz.33 Hz
83 Hz
Purple vertical lines represent pipe system natural frequencies
-43-Copyright © 2007 by Dynaflow Engineering B.V. All rights reserved
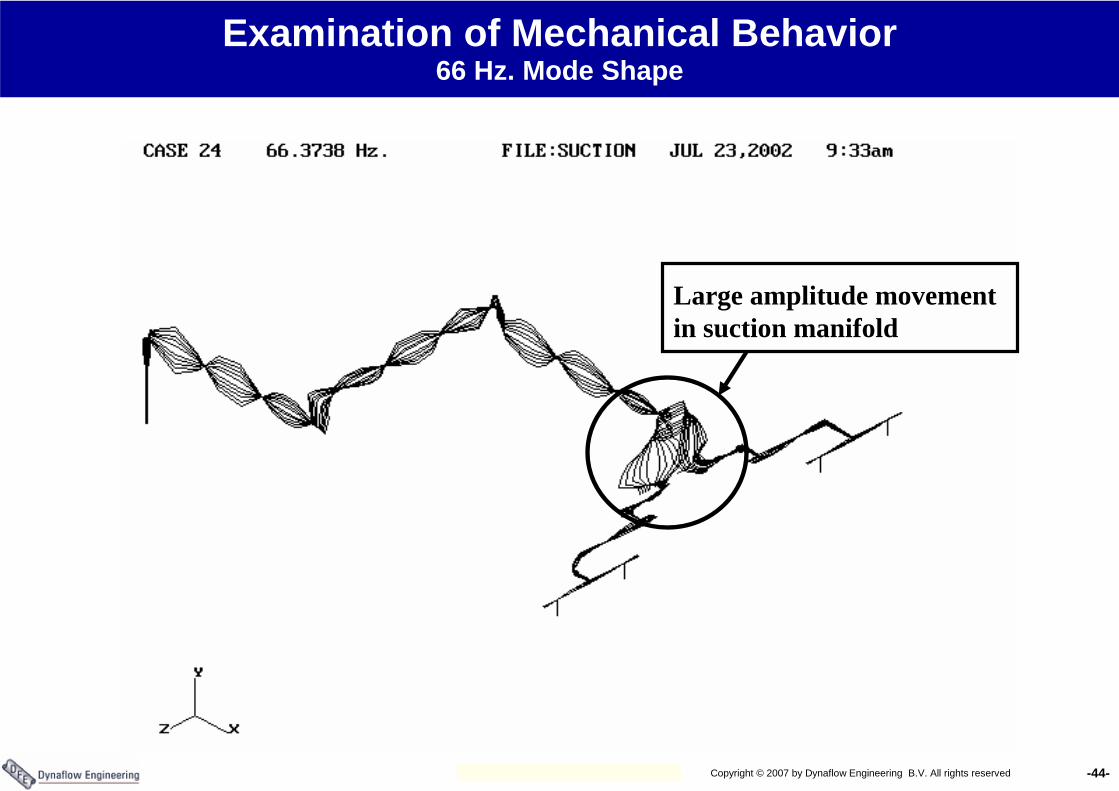
Conclusion from Step 3 & Identification Cause of Vibration Problem
Apparently there is mechanical resonance at 33 Hz and 66 Hz and near mechanical resonance at 83 Hz.
No mechanical resonance condition at the first compressor harmonic (16.5 Hz.) and at 49 Hz. and 99 Hz.
The high vibration levels 33 Hz, 66 Hz and 83 Hz are of mechanical nature.
The high vibration level at 16.5 Hz most probably is an acoustical resonance problem.
The high vibration level at 49 Hz and 99 Hz. must be the result of:High pulsation forces without resonance (compressor bottle sizing problem)
-44-Copyright © 2007 by Dynaflow Engineering B.V. All rights reserved
Examination of Mechanical Behavior 66 Hz. Mode Shape
Large amplitude movement in suction manifold
-45-Copyright © 2007 by Dynaflow Engineering B.V. All rights reserved
Step 4. Modifications
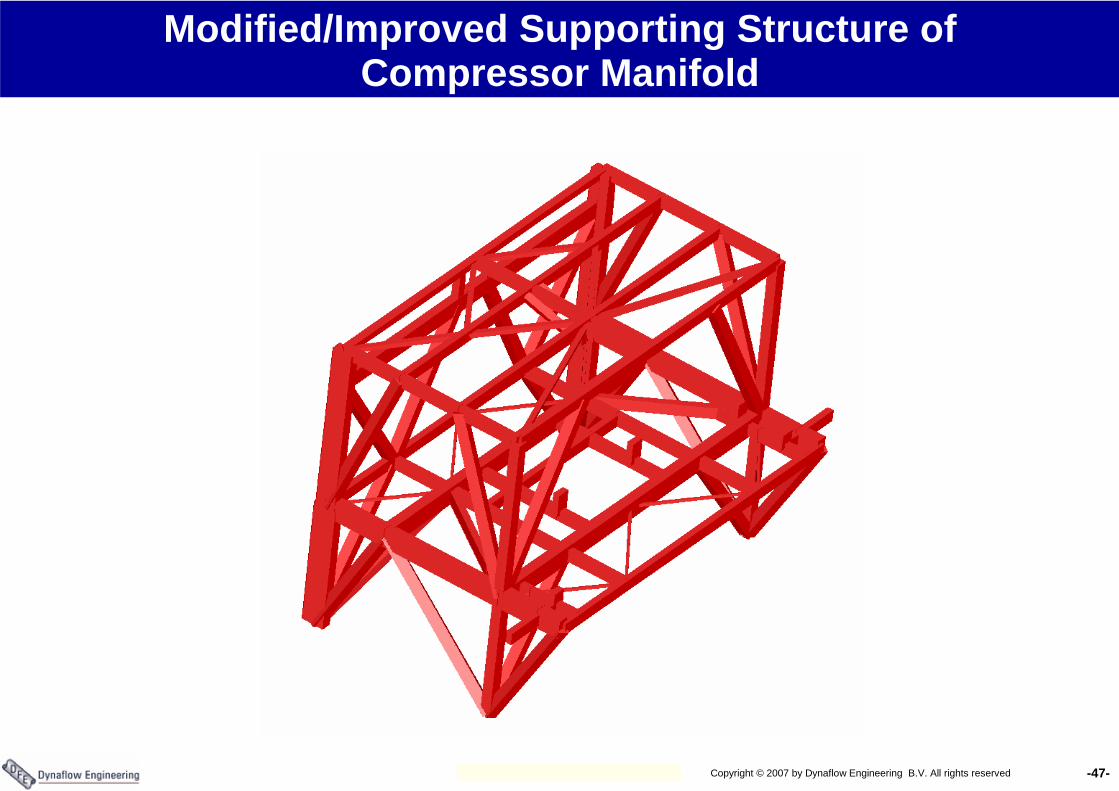
The high vibration levels 33 Hz, 66 Hz and 83 Hz are of mechanical nature and need a mechanical solution
Better supportingImproved support stiffness
The high vibration level at 16.5 Hz is due to acoustical resonance and needs an acoustical solution, I.e. different bottles and/or orifice plates to introduce more damping
The high vibration level at 49 Hz and 99 Hz. are the result of high pulsation forces without resonance and must be resolved by compressor bottle (re)sizing.
-46-Copyright © 2007 by Dynaflow Engineering B.V. All rights reserved
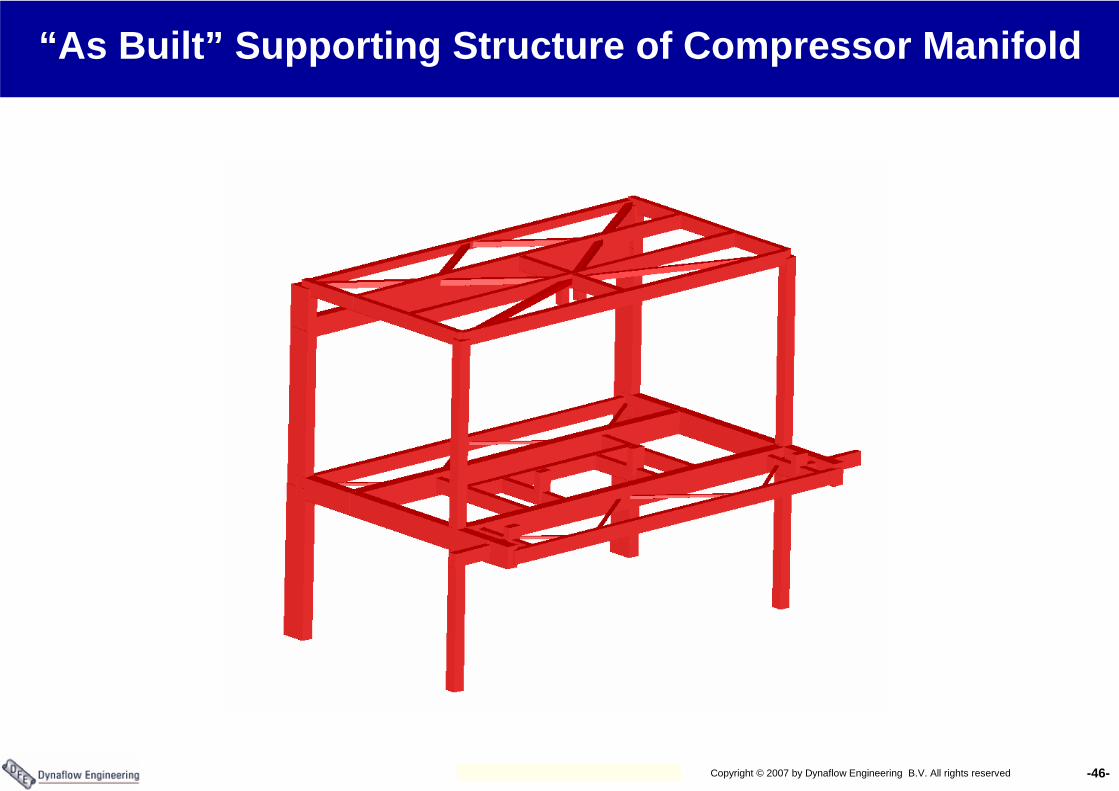
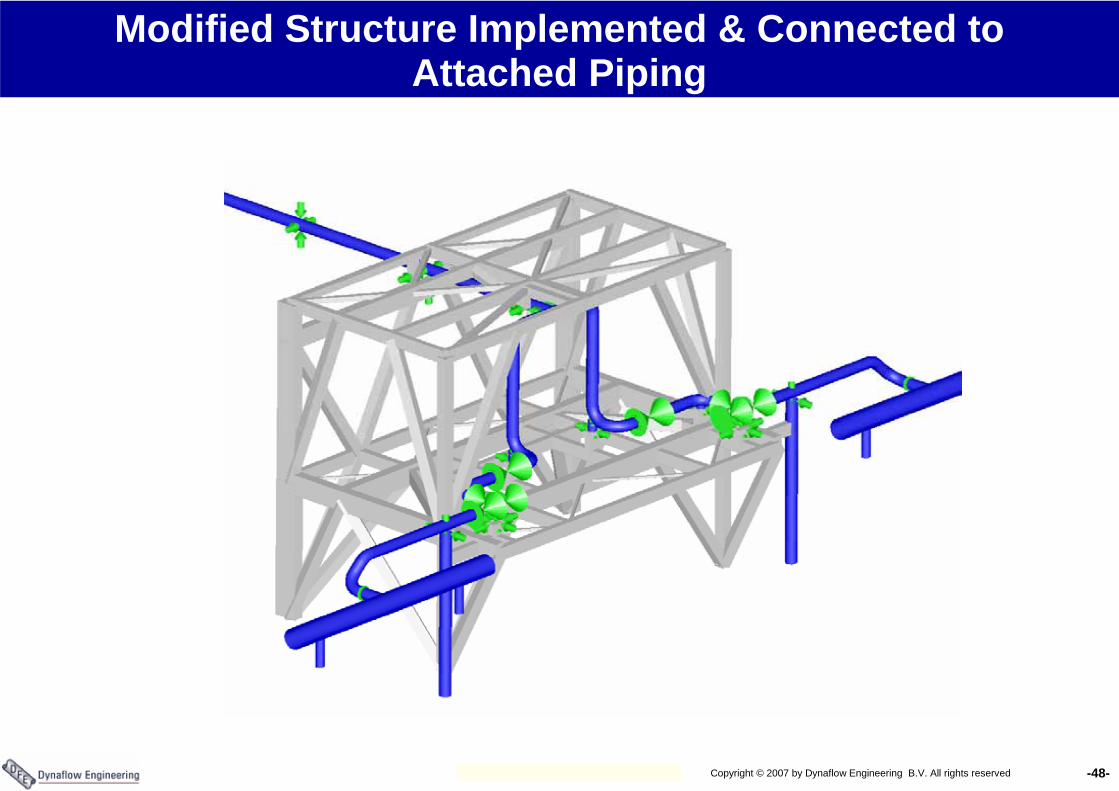
“As Built” Supporting Structure of Compressor Manifold
-47-Copyright © 2007 by Dynaflow Engineering B.V. All rights reserved
Modified/Improved Supporting Structure ofCompressor Manifold
-48-Copyright © 2007 by Dynaflow Engineering B.V. All rights reserved
Modified Structure Implemented & Connected to Attached Piping
-49-Copyright © 2007 by Dynaflow Engineering B.V. All rights reserved
Conclusion from Example 1
Compressor vibration problems are of a mixed nature• Part is mechanical• Part is acoustical
Each category requires a different approach and result in different solutions
Not all vibration problems can be solved by mechanical measures.
-50-Copyright © 2007 by Dynaflow Engineering B.V. All rights reserved
Example 2
ProblemFailure in cooling pump discharge line (possibly vibration induced)
Steps to solutionNo vibration measurements just visual observationIdentification of excitation mechanism thru fluid simulations (pump trips & start-up and check valve closures)Time history mechanical simulation to verify stress levelsIdentification of source of vibration problemModification proposal
-51-Copyright © 2007 by Dynaflow Engineering B.V. All rights reserved
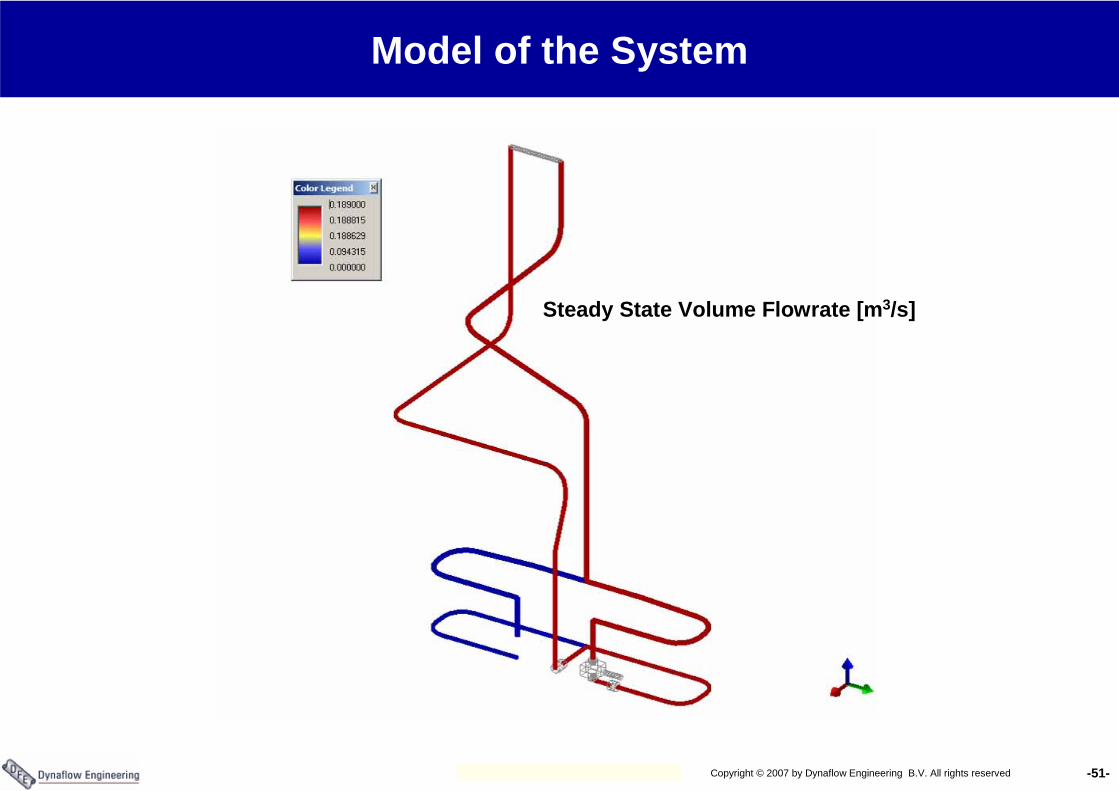
Steady State Volume Flowrate [m3/s]
Model of the System
-52-Copyright © 2007 by Dynaflow Engineering B.V. All rights reserved
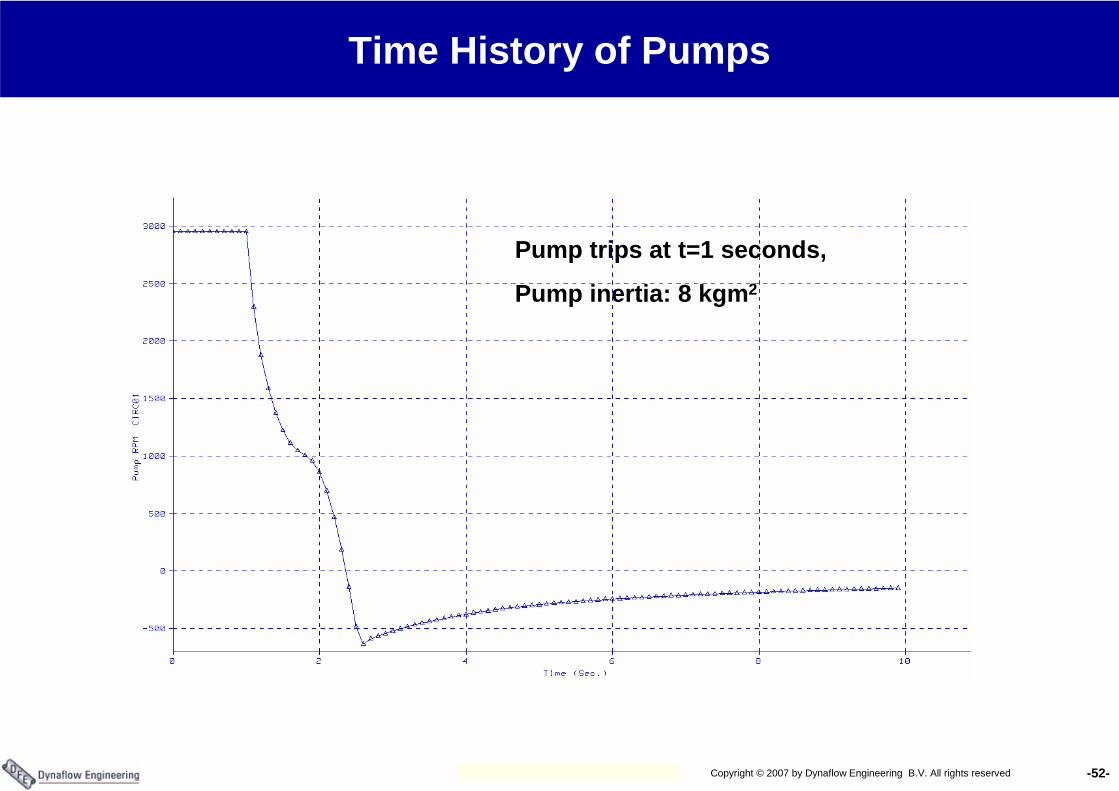
Pump trips at t=1 seconds,
Pump inertia: 8 kgm2
Time History of Pumps
-53-Copyright © 2007 by Dynaflow Engineering B.V. All rights reserved
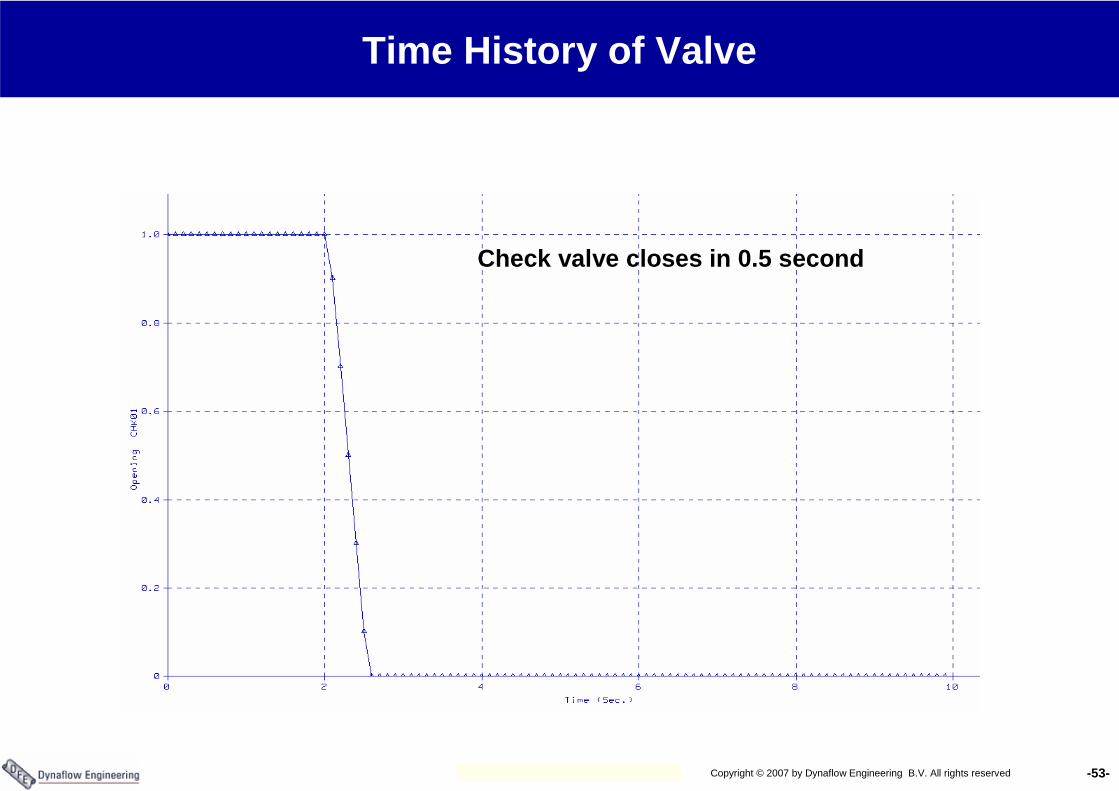
Check valve closes in 0.5 second
Time History of Valve
-54-Copyright © 2007 by Dynaflow Engineering B.V. All rights reserved
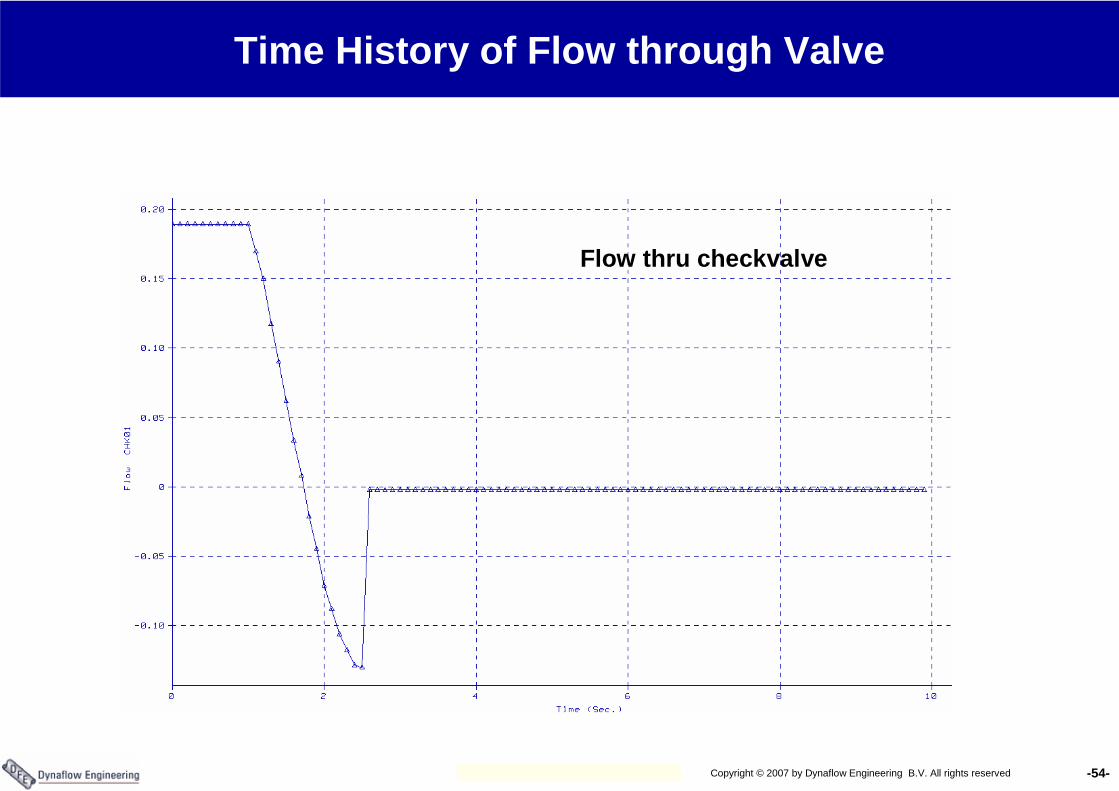
Flow thru checkvalve
Time History of Flow through Valve
-55-Copyright © 2007 by Dynaflow Engineering B.V. All rights reserved
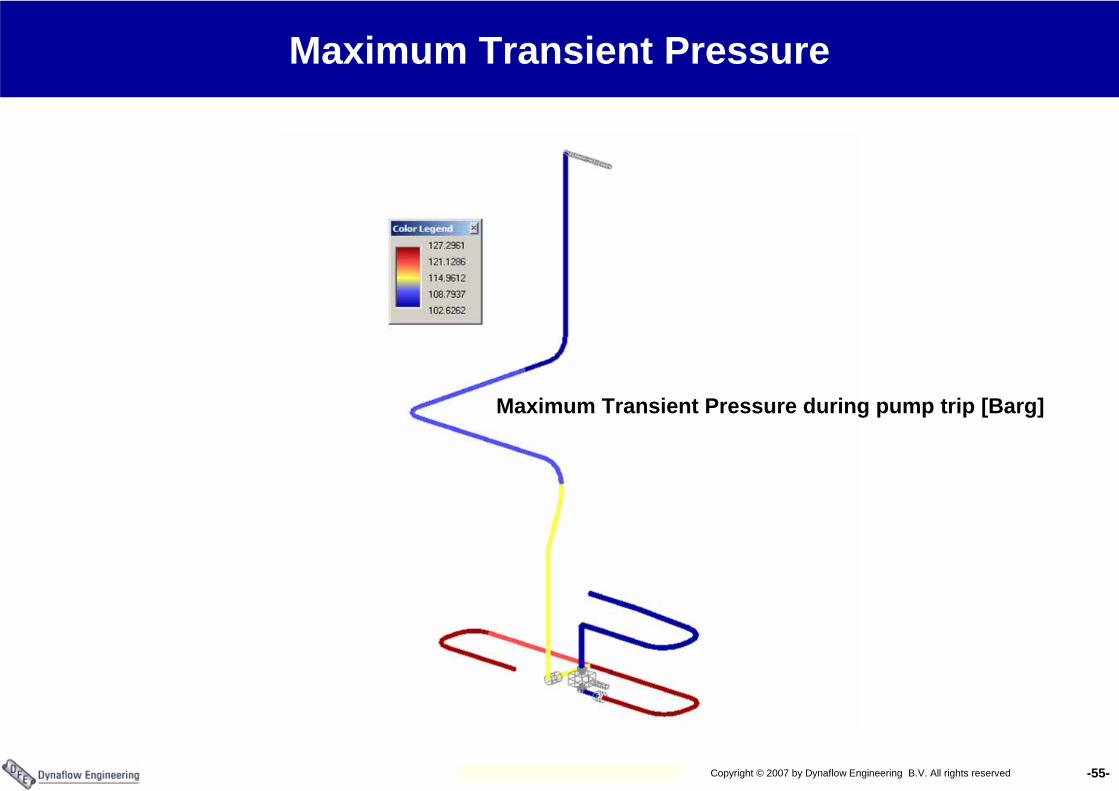
Maximum Transient Pressure during pump trip [Barg]
Maximum Transient Pressure
-56-Copyright © 2007 by Dynaflow Engineering B.V. All rights reserved
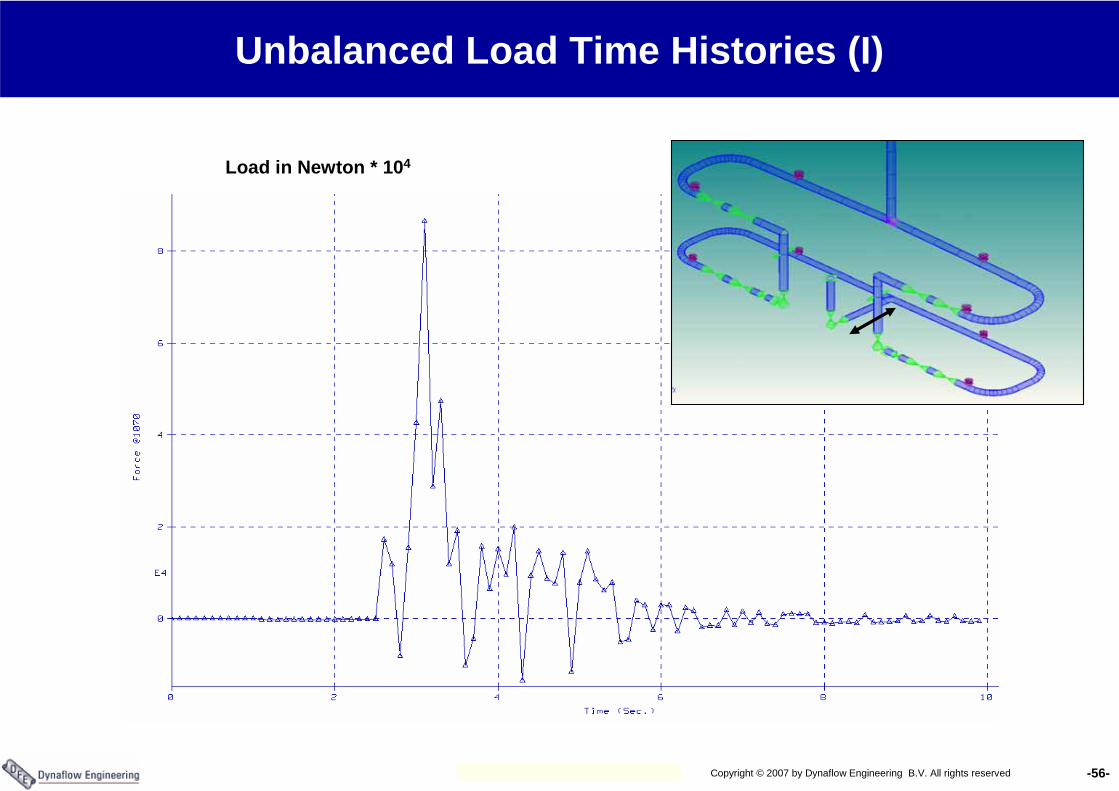
Unbalanced Load Time Histories (I)
Load in Newton * 104
-57-Copyright © 2007 by Dynaflow Engineering B.V. All rights reserved
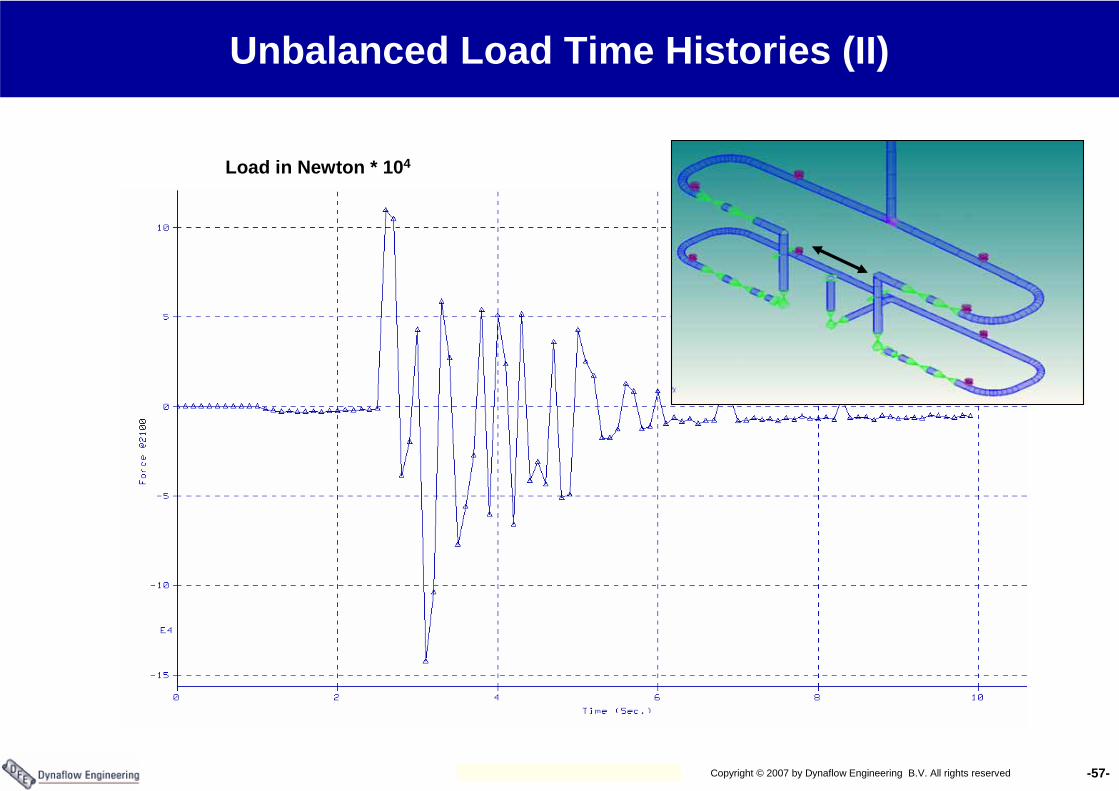
Load in Newton * 104
Unbalanced Load Time Histories (II)
-58-Copyright © 2007 by Dynaflow Engineering B.V. All rights reserved
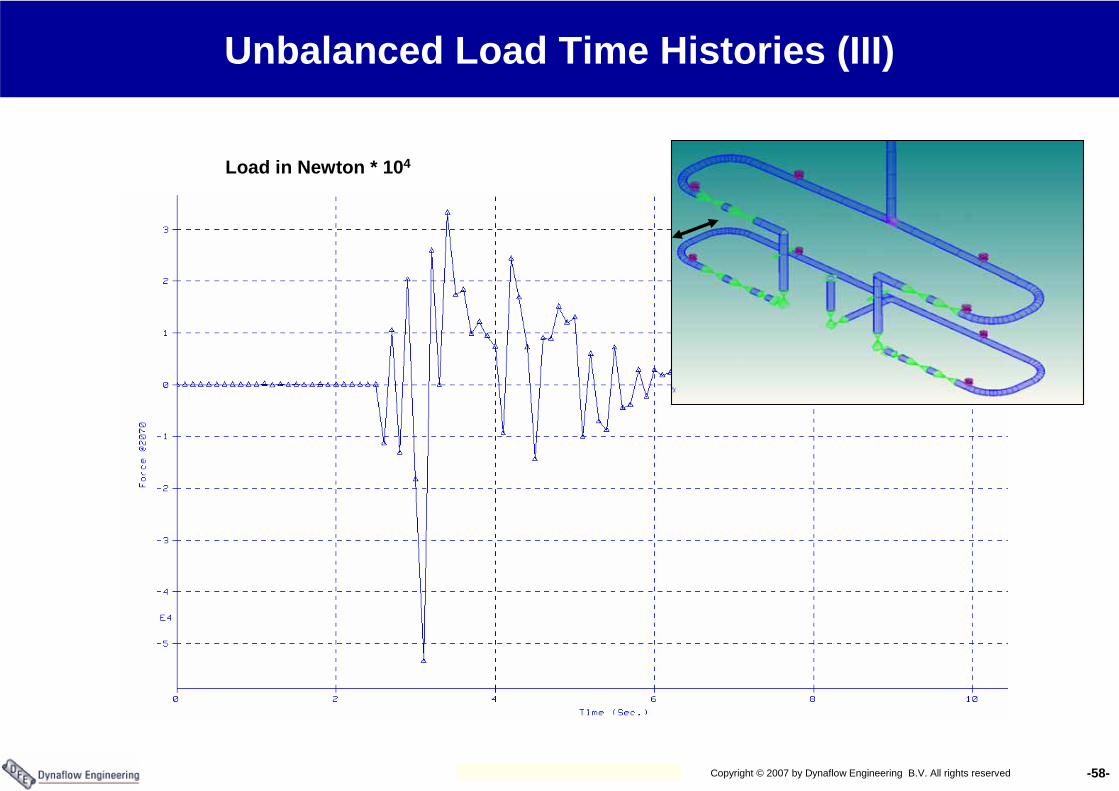
Load in Newton * 104
Unbalanced Load Time Histories (III)
-59-Copyright © 2007 by Dynaflow Engineering B.V. All rights reserved
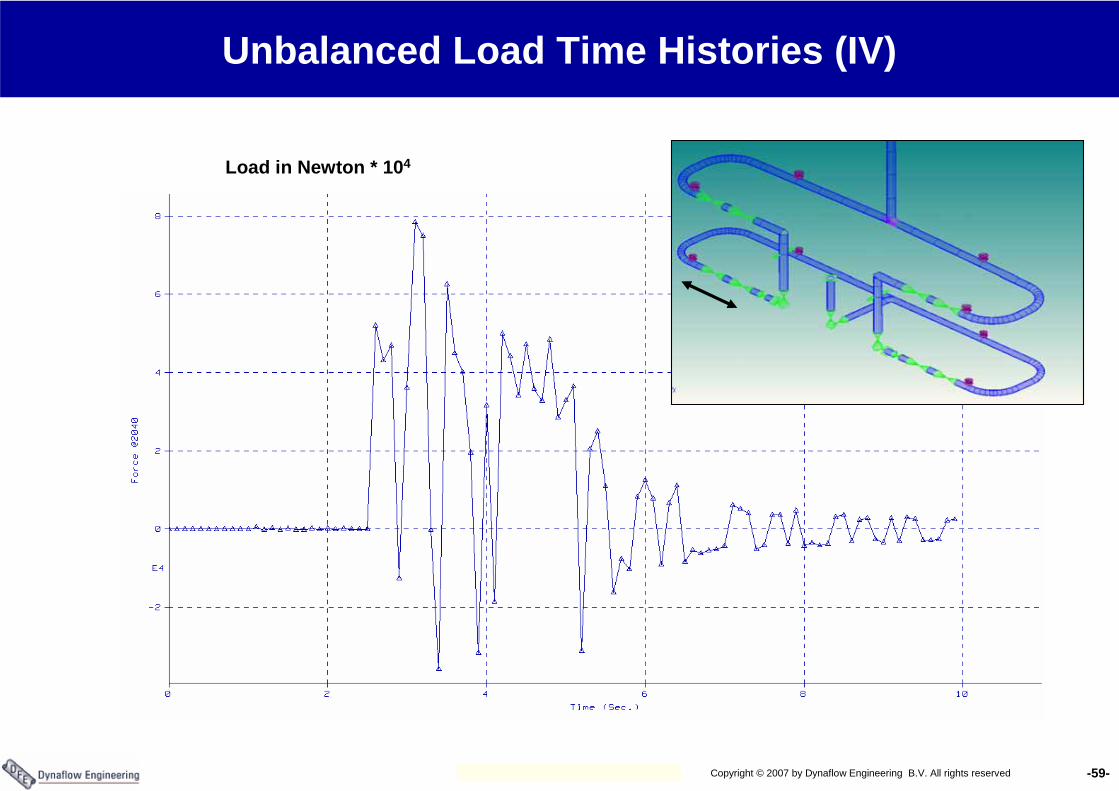
Load in Newton * 104
Unbalanced Load Time Histories (IV)
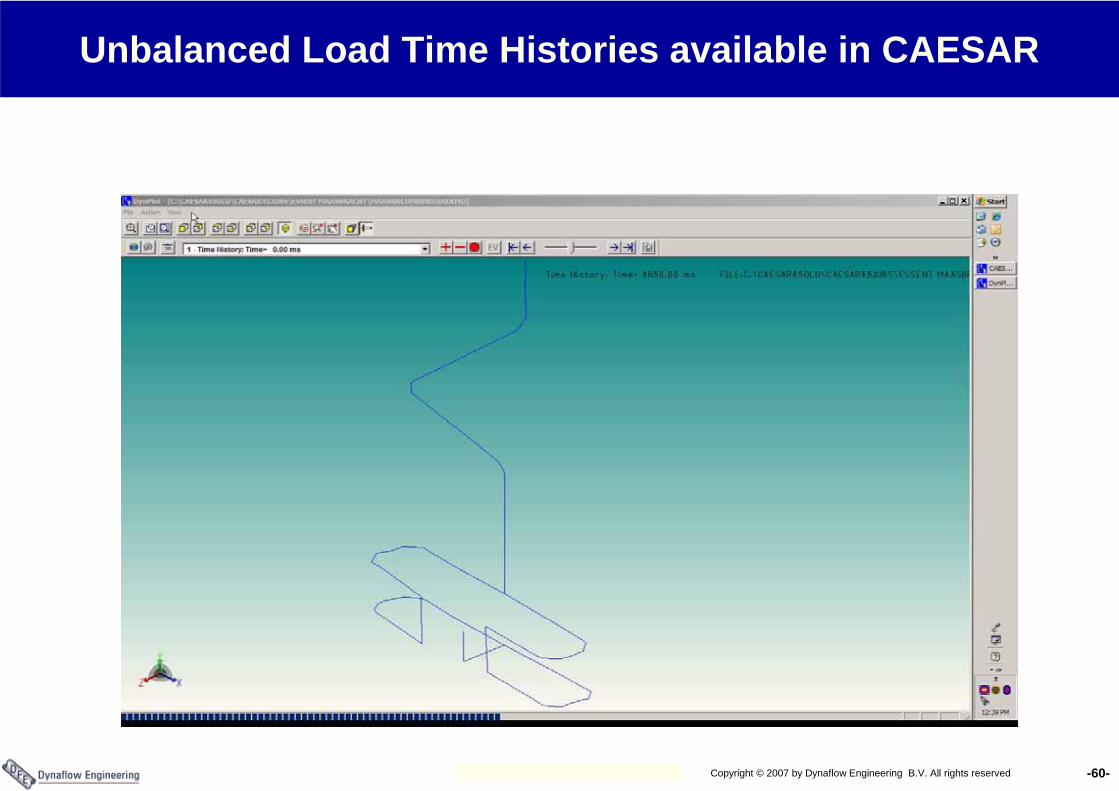
-60-Copyright © 2007 by Dynaflow Engineering B.V. All rights reserved
Unbalanced Load Time Histories available in CAESAR
-61-Copyright © 2007 by Dynaflow Engineering B.V. All rights reserved
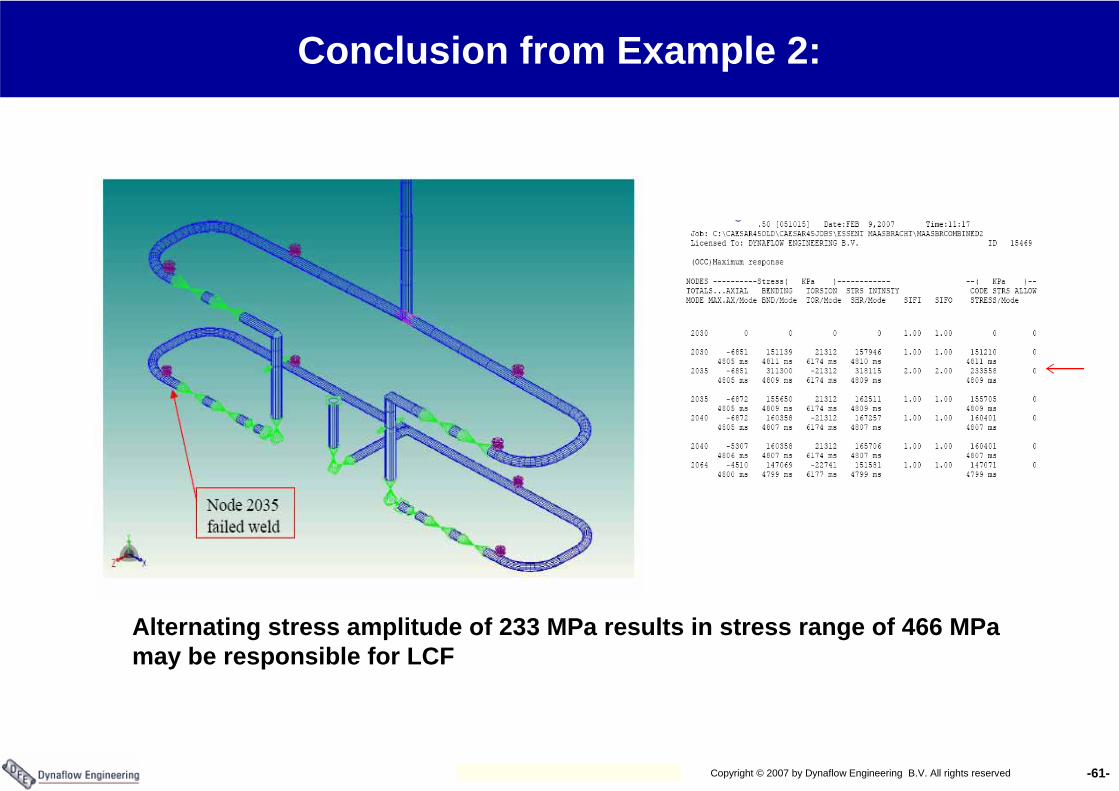
Conclusion from Example 2:
Alternating stress amplitude of 233 MPa results in stress range of 466 MPamay be responsible for LCF
-62-Copyright © 2007 by Dynaflow Engineering B.V. All rights reserved
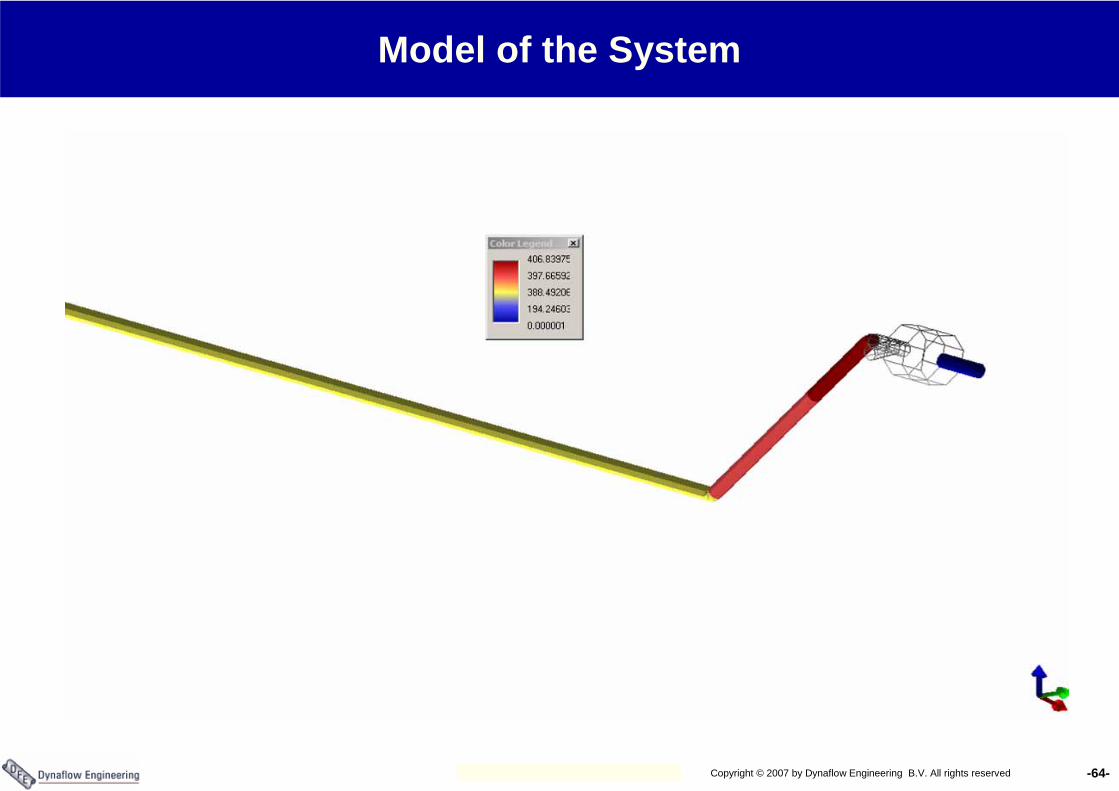
Example 3
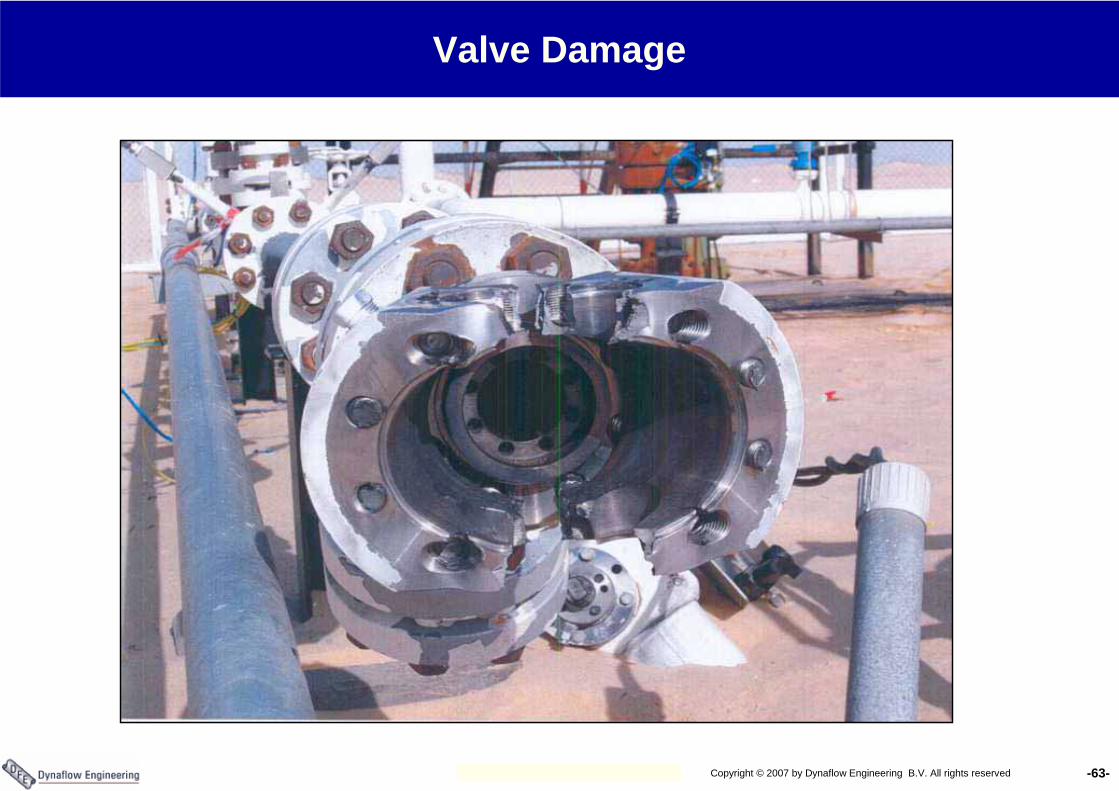
ProblemExcessive pressure in injection line.
Steps to solutionAssumed mechanism entrapped (undrained) fluid propelled by gas at gas velocity during start-up hits valve that is cracked openIdentification of source of problem thru simulation
-63-Copyright © 2007 by Dynaflow Engineering B.V. All rights reserved
Valve Damage
-64-Copyright © 2007 by Dynaflow Engineering B.V. All rights reserved
Model of the System
-65-Copyright © 2007 by Dynaflow Engineering B.V. All rights reserved
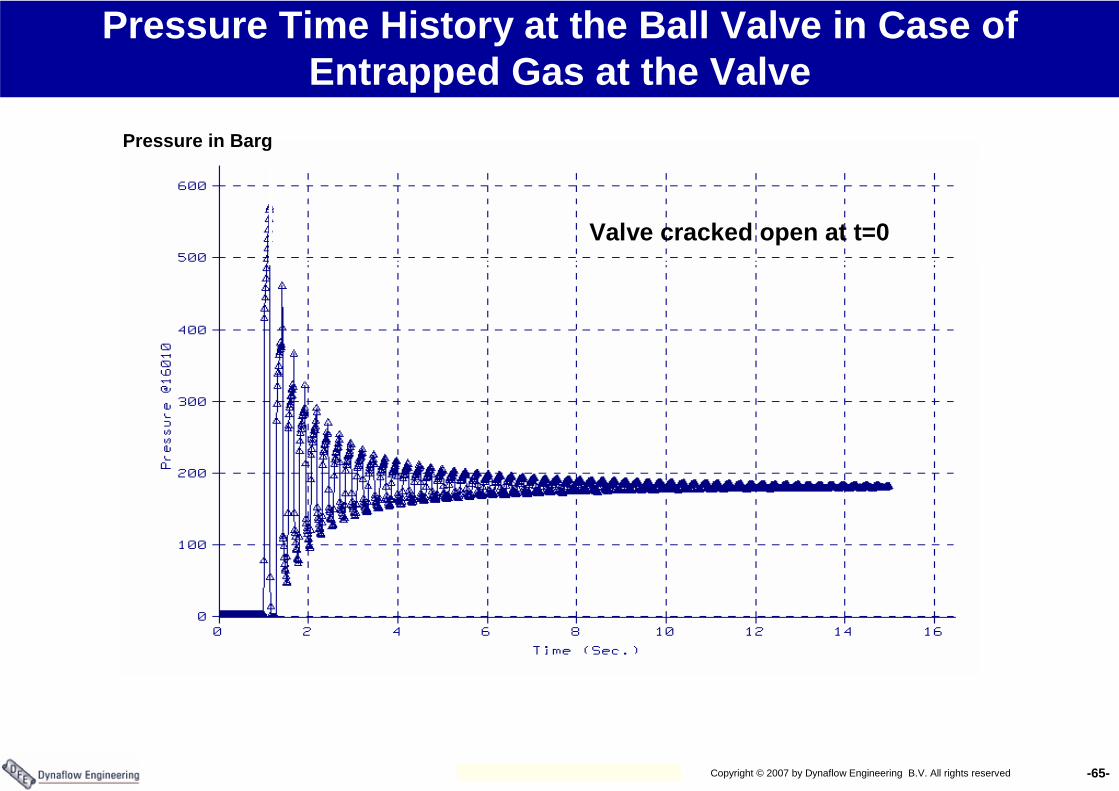
Pressure Time History at the Ball Valve in Case of Entrapped Gas at the Valve
Valve cracked open at t=0
Pressure in Barg
-66-Copyright © 2007 by Dynaflow Engineering B.V. All rights reserved
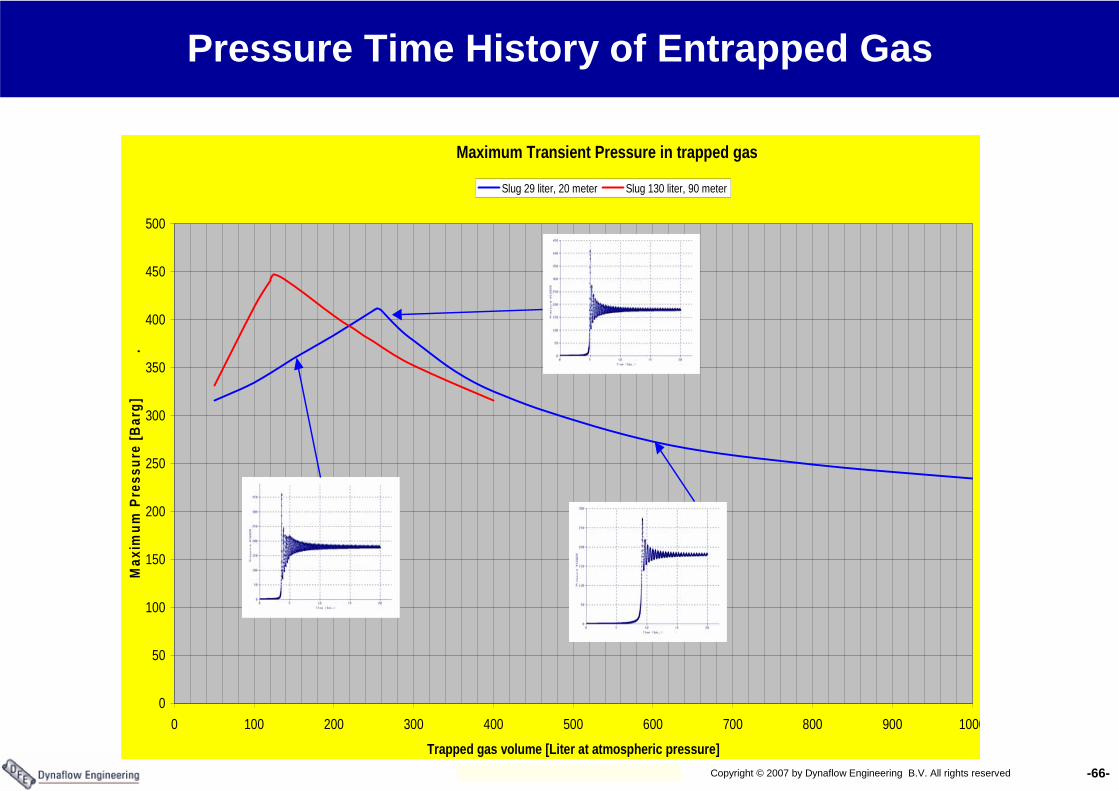
Maximum Transient Pressure in trapped gas
0
50
100
150
200
250
300
350
400
450
500
0 100 200 300 400 500 600 700 800 900 1000
Trapped gas volume [Liter at atmospheric pressure]
Max
imum
Pre
ssur
e [B
arg]
.
Slug 29 liter, 20 meter Slug 130 liter, 90 meter
Pressure Time History of Entrapped Gas
-67-Copyright © 2007 by Dynaflow Engineering B.V. All rights reserved
Conclusions for presentation
Dynamic analysis is an important and sometimes a critical element in integrity analysis
• Many failure modes are to be addressed• Excessive loads are to be handled
CAESAR offers several types of dynamic analyses to assist in thedemonstration of integrity:
1. Harmonic Analysis2. Spectrum Analysis3. Time History Analysis
Solutions to possible problems are often found by introduction of the right supporting and/or supporting steel structure
-68-Copyright © 2007 by Dynaflow Engineering B.V. All rights reserved
END
Thank you for your attention