Embed Size (px)
Citation preview

Dye Tracing in Karst Terrain
Dye Tracing in Karst Terrain
John Hoffelt, PGJohn Hoffelt, PG
Karst Hydrogeologist Tennessee Division of Superfund
Karst Hydrogeologist Tennessee Division of Superfund

What Is Karst?
Karst is a landform characterized by subsurface
drainage.

Sinkholes
Springs
Sinking Streams
Caves Common Features of Karst

Carbon DioxideCarbon Dioxide ++++ WaterWater
Carbonic AcidCarbonic Acid
Limestone
Dissolves
Geochemical Processes in Karst

This action is responsible for forming solutionally enlarged conduits that can become a network of caves and
subsurface drainage systems.
This action is responsible for forming solutionally enlarged conduits that can become a network of caves and
subsurface drainage systems.

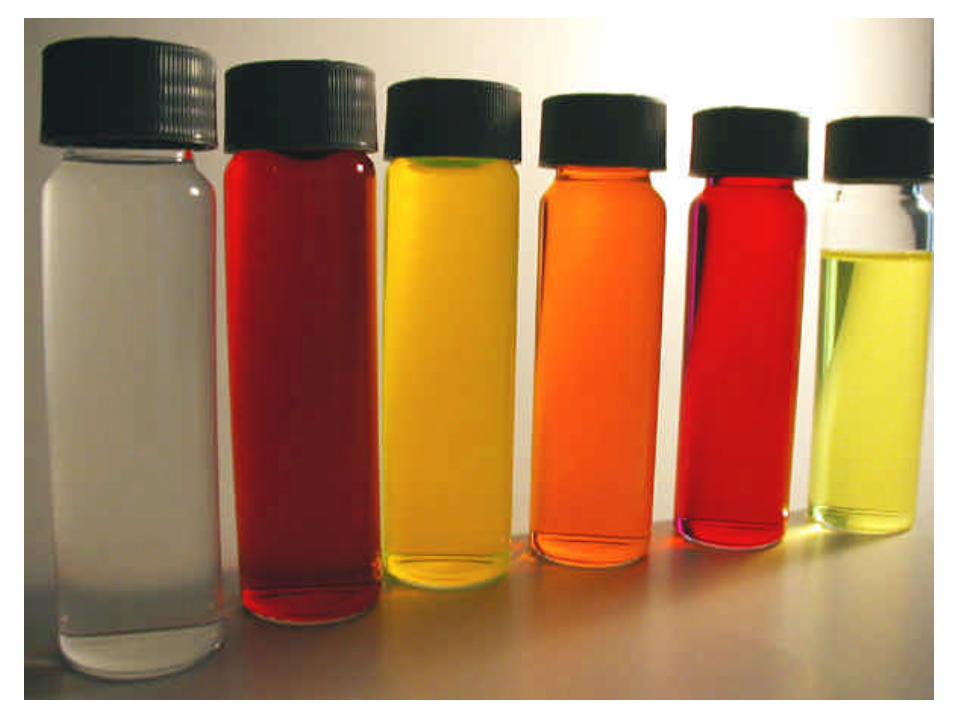
Investigation ToolsInvestigation Tools
Inorganic SaltInorganic Salt
Fluorescent DyeFluorescent Dye
Biologic AgentBiologic Agent

Fluorescent Dye Injection

Viewed Under Incandescent Light
Viewed Under Incandescent Light
Viewed Under Ultraviolet LightViewed Under Ultraviolet Light

Optical Brighteners on Cotton
Incandescent
UltravioletUltraviolet

Monitor wells and springs to show hydrologic
connection
Monitor wells and springs to show hydrologic
connection

Field
Laboratory
Reporting
Karst Inventory
Analyze Samples
Evaluate Data and Provide Maps
Collect Data
Collect Samples

Sinking Streams
Caves
Springs
Sinking Streams
Caves
Springs
Karst InventoryKarst Inventory
Identify:Identify:

Cave MappingCave Mapping
Stream SurveyStream Survey

Well HouseWell House

Water Level Contours

Note: Sycamore Tree

Note: Sycamore Tree

Automatic Water Sampling
Step 3
Passive Dye ReceptorsPassive Dye Receptors
Dye Tracing - Field WorkDye Tracing - Field Work


Dye Injection Into a Sinking
Stream
Dye Injection Into a Sinking
Stream

DYE WAVELENGTH INFORMATION
EXCITATION WAVELENGTH
EMISSION WAVELENGTHDYE
Water Elutant Water Elutant Optical Brightener
Tinopal 382 380 397 398
Direct Yellow Direct Yellow 96
435 440 450 458
Fluorescein CI Acid Yellow 73
492 498 507 516
Eosine OJ CI Acid Red 87
521 524 536 542
D&C Red 28 CI Acid Red 92
538 545 553 563
Rhodamine WT CI Acid Red 388
558 551 573 569
Sulphorhodamine B CI Acid Red 52
567 560 582 578
Note: Wavelength information provided in nanometers for typical dye batches analyzed under specified settings.

Well InjectionWell Injection
Trench InjectionTrench Injection

Lab analysis using a scanning spectrofluorophotometer
Lab analysis using a scanning spectrofluorophotometer

Dye recovery at Big Swamp Spring over 10day interval in Nov, 2000. Rainfall of
2 to 3 inches over Nov 8 - Nov 10.
0
1
2
3
4
5
6
475 500 525 550 575 600 625
Wavelength (nanometers)
Flu
ore
scen
ce u
nit
s7-Nov AM
8-Nov PM
9-Nov AM
10-Nov AM
10-Nov PM
11-Nov AM
12-Nov PM
14-Nov PM
15_Nov PM
17-Nov PM
Relative Fluorescence Spectrum

Dye Breakthrough Curve
500
Fluo
resc
ence
uni
ts 400
300
200
100
0
0 20 40 60 80 100 120 140 160
Time (hours)

Dye Trace and Data Narrative
Dye Trace and Data Narrative
Karst Inventory MapKarst Inventory Map
Area Well InformationArea Well Information
Water Level and Flow Information Water Level and Flow Information
Groundwater Flow Routes
Groundwater Flow Routes
The Final Evaluation
Report Should
Provide...

Karst Areas of the US

Thank YouThank You
John Hoffelt, PGJohn Hoffelt, PG
Karst Hydrogeologist Tennessee Division of Superfund
Karst Hydrogeologist Tennessee Division of Superfund