Embed Size (px)
Citation preview
DX University: Smith Charts 2010 August 9
Sponsored by the
Kai Siwiak, [email protected] Ed Callaway, [email protected]
2010 Aug 9
Kai, KE4PT; Ed, N4II
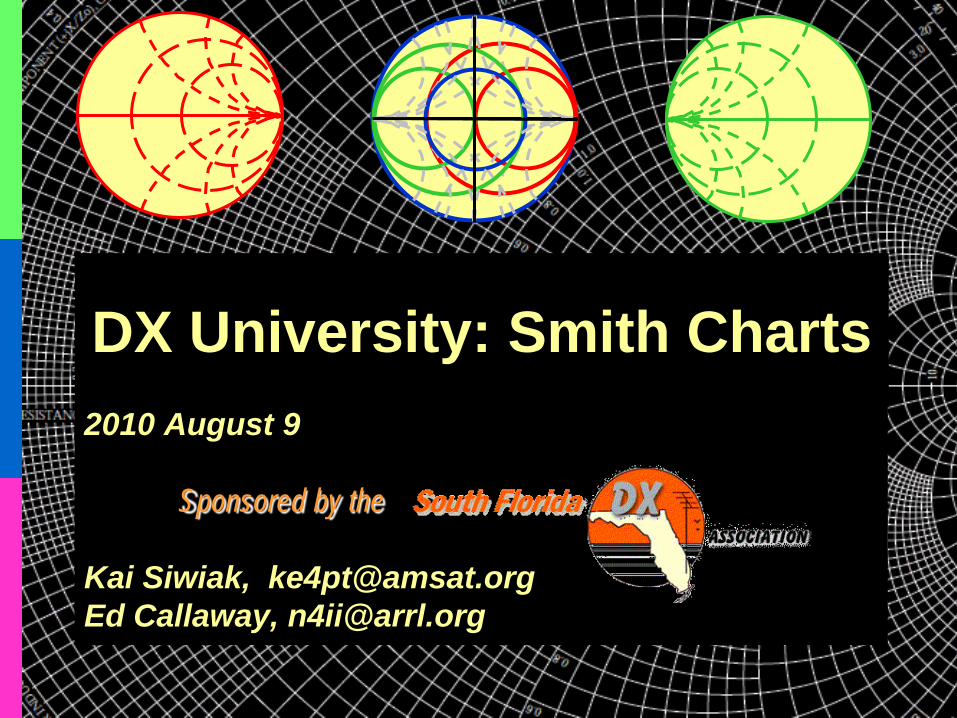
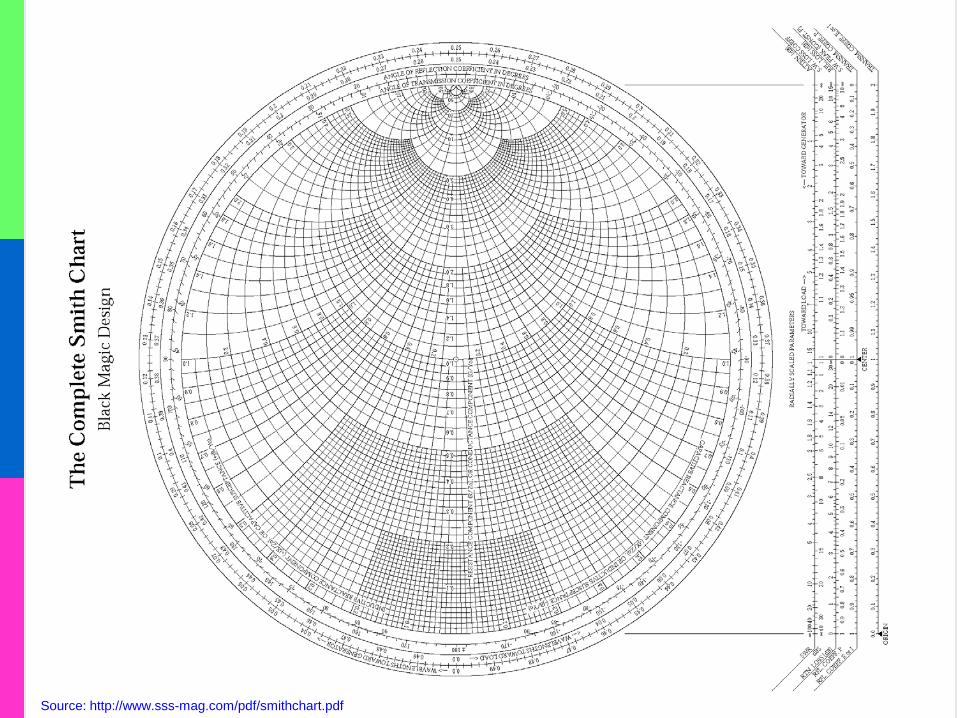
2 Source: http://www.sss-mag.com/pdf/smithchart.pdf
2010 Aug 9
Kai, KE4PT; Ed, N4II
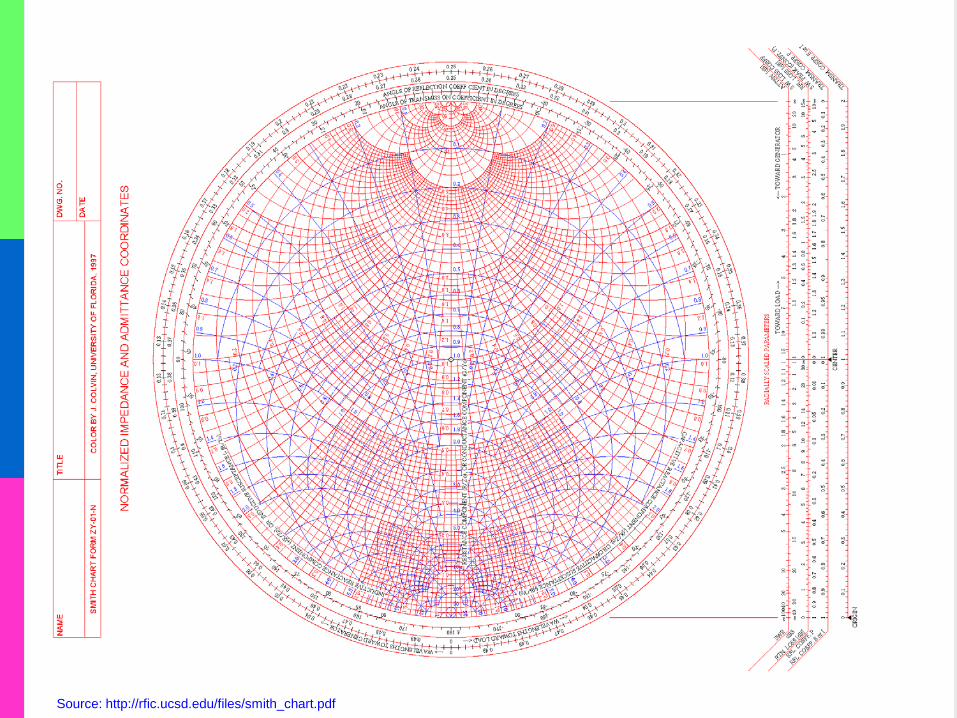
3 Source: http://www.sss-mag.com/pdf/smithchart.pdf Source: http://rfic.ucsd.edu/files/smith_chart.pdf
2010 Aug 9
Kai, KE4PT; Ed, N4II
4
Contents • Smith Chart is a graphical aid for impedance
matching using series/parallel Inductors, Capacitors and Transmission Lines – The Smith Chart was developed by Phillip H. Smith
during the 1930s – Others, including Wheeler, developed similar charts
• Smith Chart based on Reflection Coefficient • Impedance (0 ≤ R ≤ +∞ and −∞ ≤ X ≤ +∞),
admittance, VSWR, voltage reflection coefficient (Γ), all are in “the chart”
• Live examples • Some observations
"Smith" was a registered trademark of Analog Instruments Company, cancelled May 22, 2010
2010 Aug 9
Kai, KE4PT; Ed, N4II
5
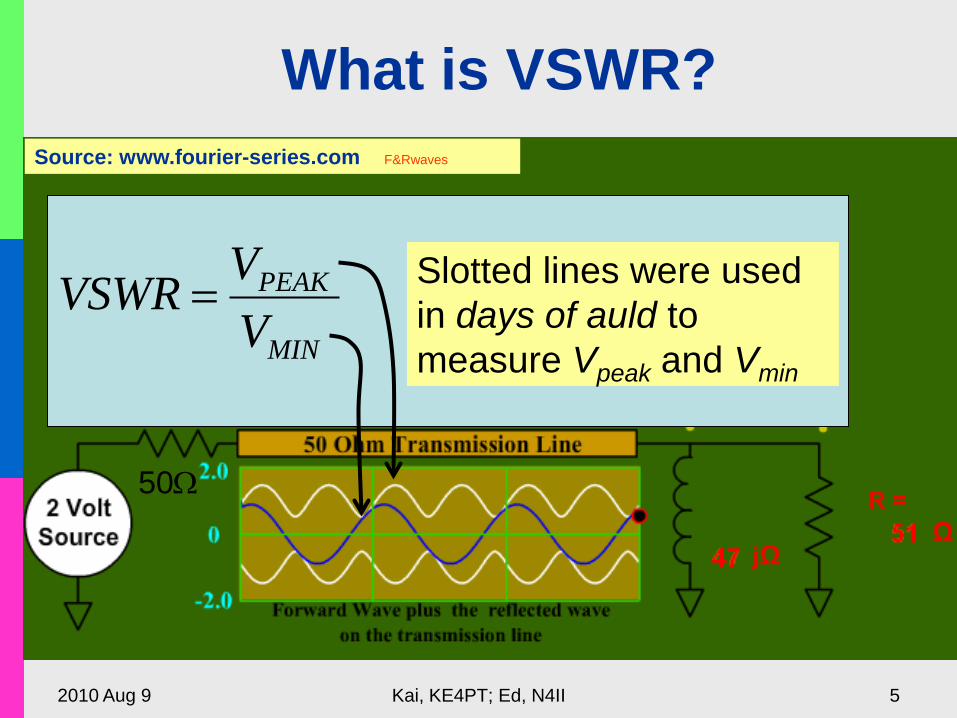
What is VSWR?
50Ω
MIN
PEAK
VVVSWR =
Source: www.fourier-series.com F&Rwaves
Slotted lines were used in days of auld to measure Vpeak and Vmin
2010 Aug 9
Kai, KE4PT; Ed, N4II
6
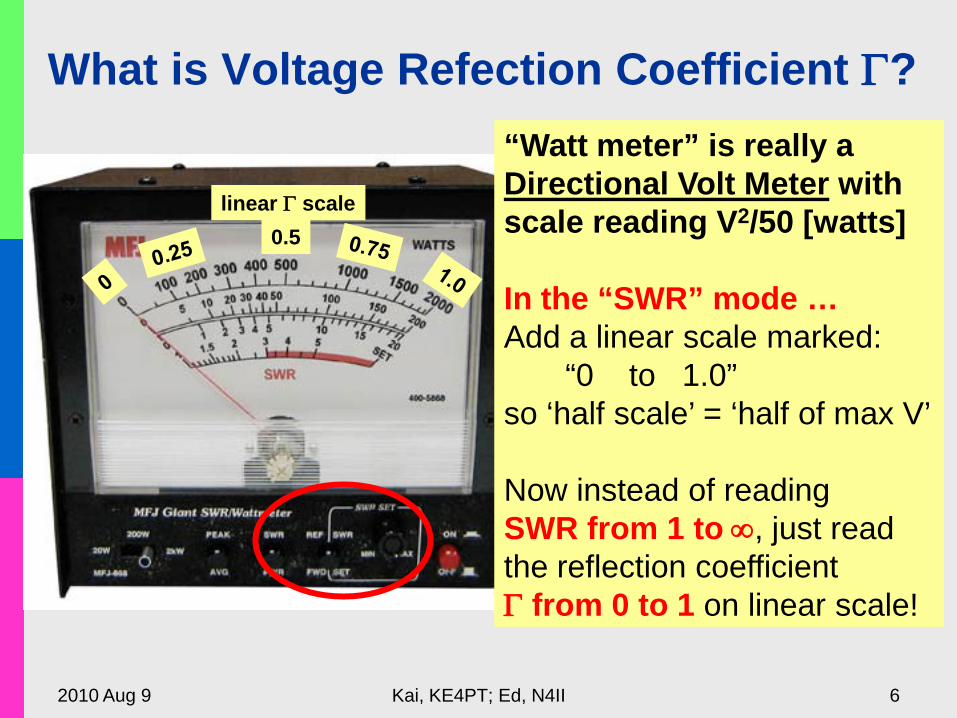
What is Voltage Refection Coefficient Γ? “Watt meter” is really a Directional Volt Meter with scale reading V2/50 [watts] In the “SWR” mode … Add a linear scale marked: “0 to 1.0” so ‘half scale’ = ‘half of max V’ Now instead of reading SWR from 1 to ∞, just read the reflection coefficient Γ from 0 to 1 on linear scale!
0.5 linear Γ scale
2010 Aug 9
Kai, KE4PT; Ed, N4II
7
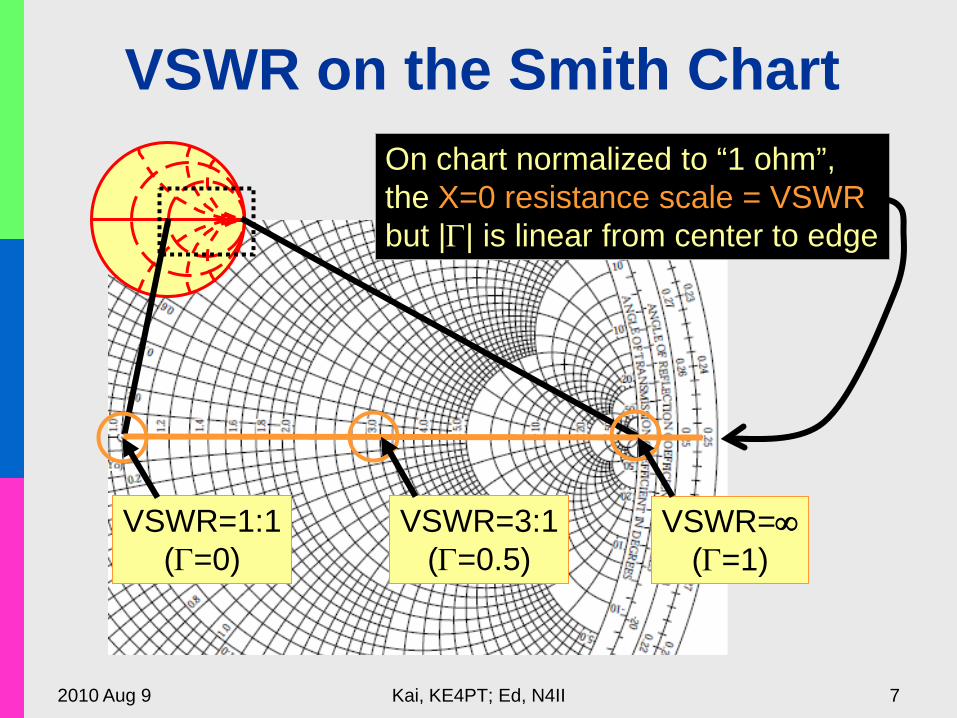
VSWR on the Smith Chart On chart normalized to “1 ohm”, the X=0 resistance scale = VSWR but |Γ| is linear from center to edge
VSWR=1:1 (Γ=0)
VSWR=3:1 (Γ=0.5)
VSWR=∞ (Γ=1)
2010 Aug 9
Kai, KE4PT; Ed, N4II
8
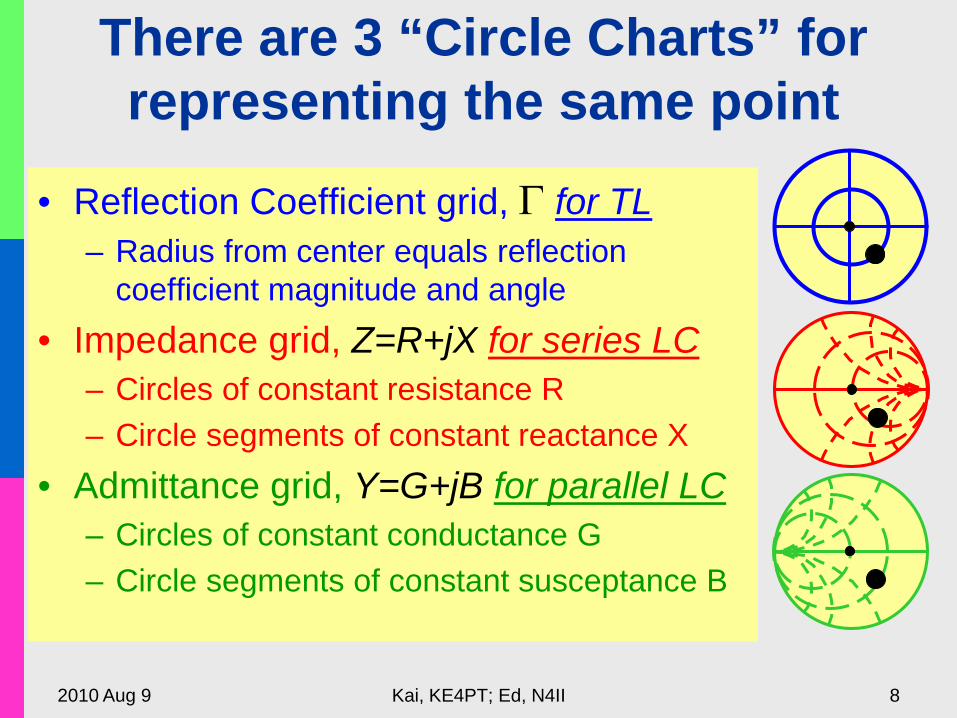
There are 3 “Circle Charts” for representing the same point
• Reflection Coefficient grid, Γ for TL – Radius from center equals reflection
coefficient magnitude and angle • Impedance grid, Z=R+jX for series LC
– Circles of constant resistance R – Circle segments of constant reactance X
• Admittance grid, Y=G+jB for parallel LC – Circles of constant conductance G – Circle segments of constant susceptance B
2010 Aug 9
Kai, KE4PT; Ed, N4II
9
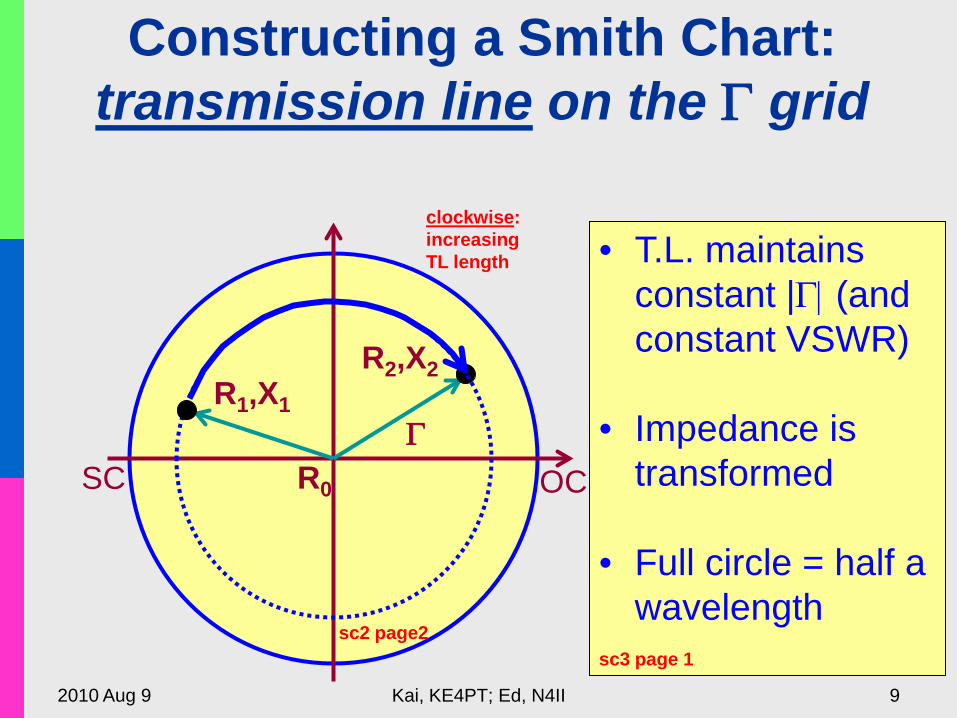
Constructing a Smith Chart: transmission line on the Γ grid
• T.L. maintains constant |Γ| (and constant VSWR)
• Impedance is transformed
• Full circle = half a wavelength
sc3 page 1
Γ
R2,X2 R1,X1
R0 OC SC
sc2 page2
clockwise: increasing TL length
2010 Aug 9
Kai, KE4PT; Ed, N4II
10
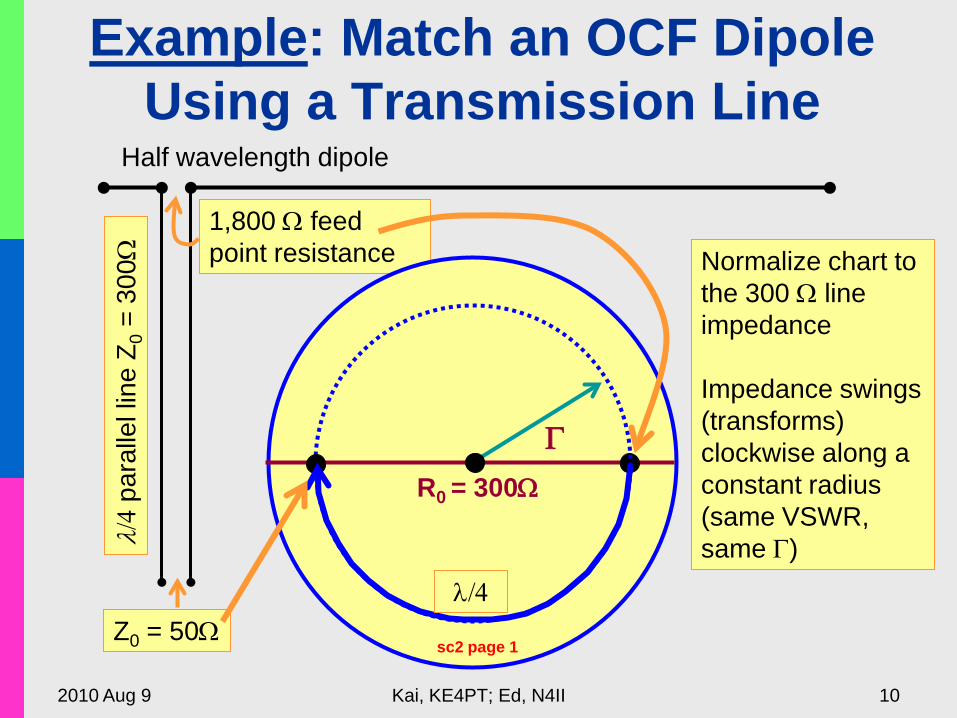
Example: Match an OCF Dipole Using a Transmission Line
Half wavelength dipole λ/
4 pa
ralle
l lin
e Z 0
= 3
00Ω
1,800 Ω feed point resistance
Γ R0 = 300Ω
Z0 = 50Ω λ/4
sc2 page 1
Normalize chart to the 300 Ω line impedance Impedance swings (transforms) clockwise along a constant radius (same VSWR, same Γ)
2010 Aug 9
Kai, KE4PT; Ed, N4II
11
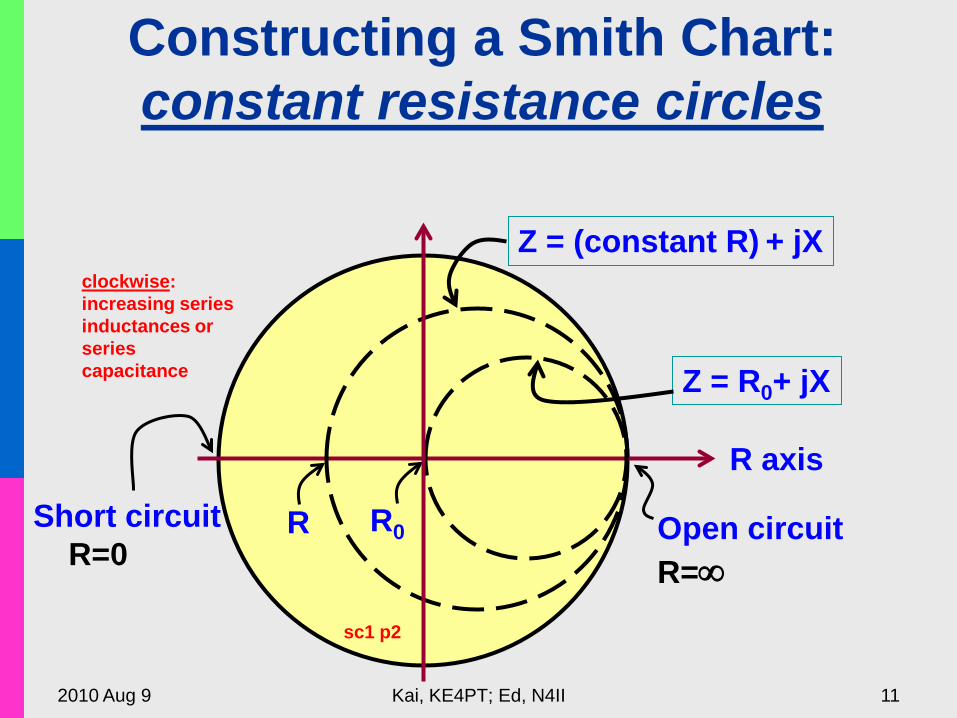
Constructing a Smith Chart: constant resistance circles
Open circuit R=∞
Short circuit R=0
R axis
R0
Z = R0+ jX
Z = (constant R) + jX
R
sc1 p2
clockwise: increasing series inductances or series capacitance
2010 Aug 9
Kai, KE4PT; Ed, N4II
12
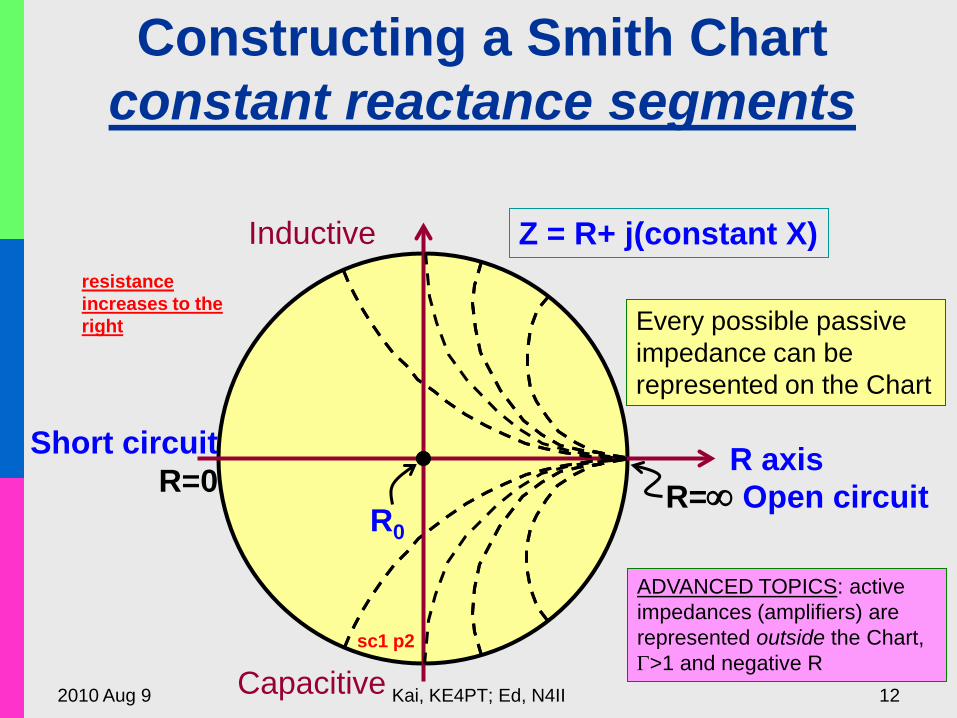
Constructing a Smith Chart constant reactance segments
R axis
R0
Z = R+ j(constant X)
sc1 p2
resistance increases to the right
Short circuit R=0 R=∞ Open circuit
Every possible passive impedance can be represented on the Chart
ADVANCED TOPICS: active impedances (amplifiers) are represented outside the Chart, Γ>1 and negative R
Inductive
Capacitive
2010 Aug 9
Kai, KE4PT; Ed, N4II
13
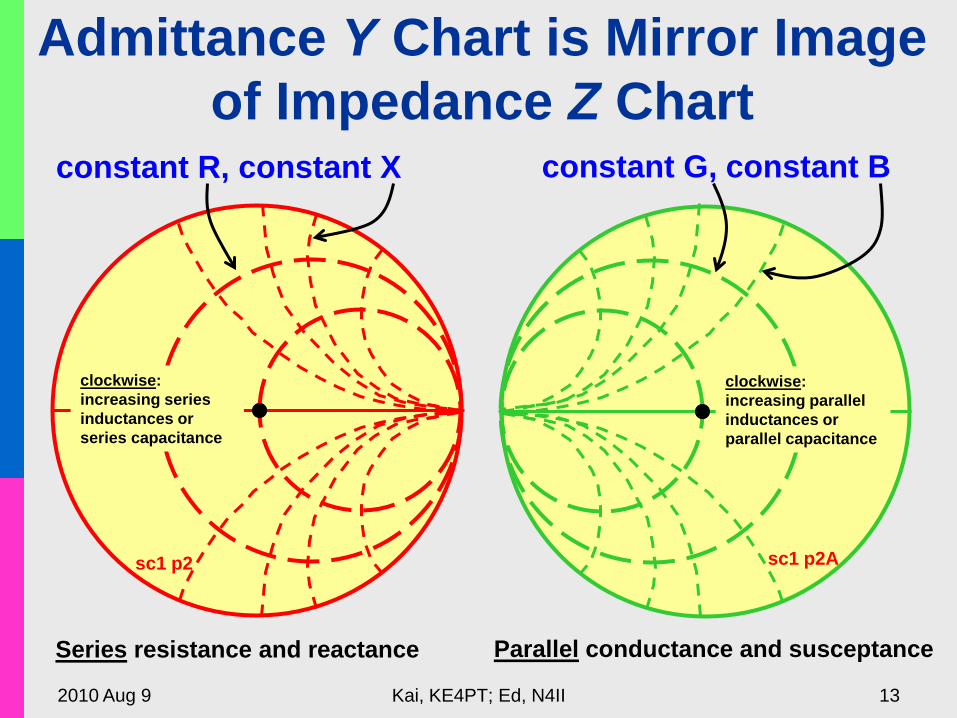
Admittance Y Chart is Mirror Image of Impedance Z Chart
constant R, constant X constant G, constant B
Series resistance and reactance Parallel conductance and susceptance
sc1 p2A sc1 p2
clockwise: increasing series inductances or series capacitance
clockwise: increasing parallel inductances or parallel capacitance
2010 Aug 9
Kai, KE4PT; Ed, N4II
14
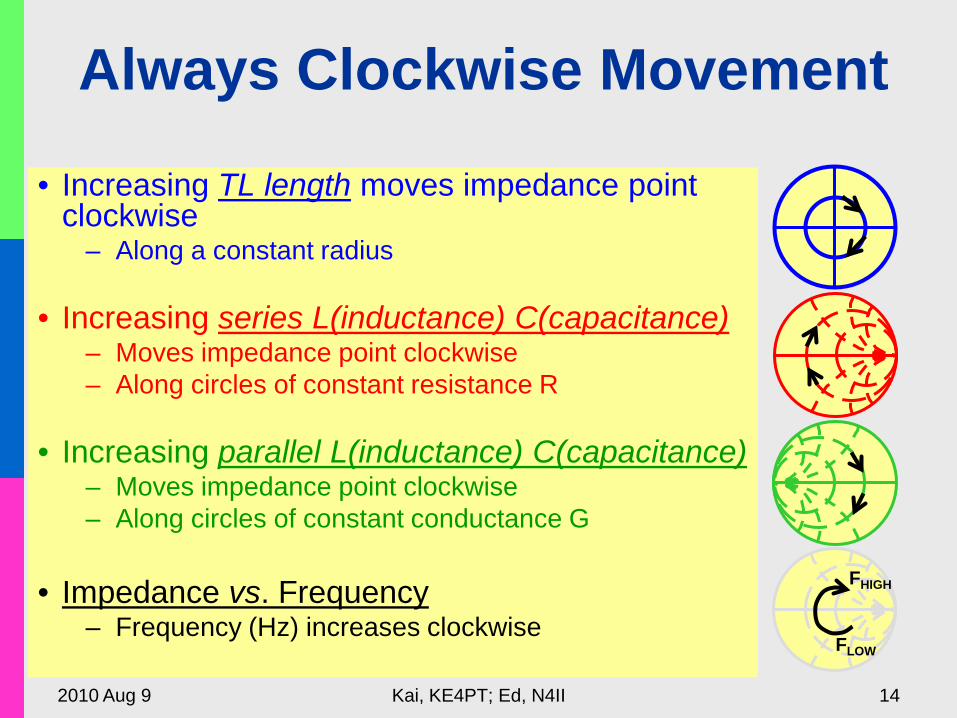
Always Clockwise Movement
• Increasing TL length moves impedance point clockwise
– Along a constant radius
• Increasing series L(inductance) C(capacitance) – Moves impedance point clockwise – Along circles of constant resistance R
• Increasing parallel L(inductance) C(capacitance) – Moves impedance point clockwise – Along circles of constant conductance G
• Impedance vs. Frequency
– Frequency (Hz) increases clockwise FLOW
FHIGH
2010 Aug 9
Kai, KE4PT; Ed, N4II
15
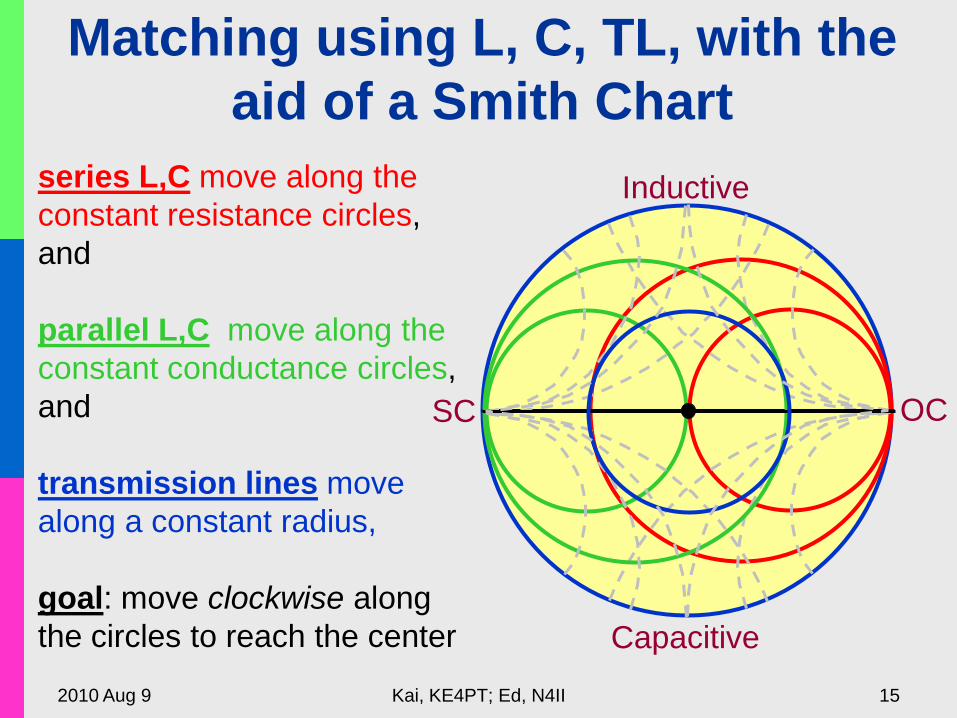
Matching using L, C, TL, with the aid of a Smith Chart
series L,C move along the constant resistance circles, and parallel L,C move along the constant conductance circles, and transmission lines move along a constant radius, goal: move clockwise along the circles to reach the center
Inductive
Capacitive
OC SC
2010 Aug 9
Kai, KE4PT; Ed, N4II
16
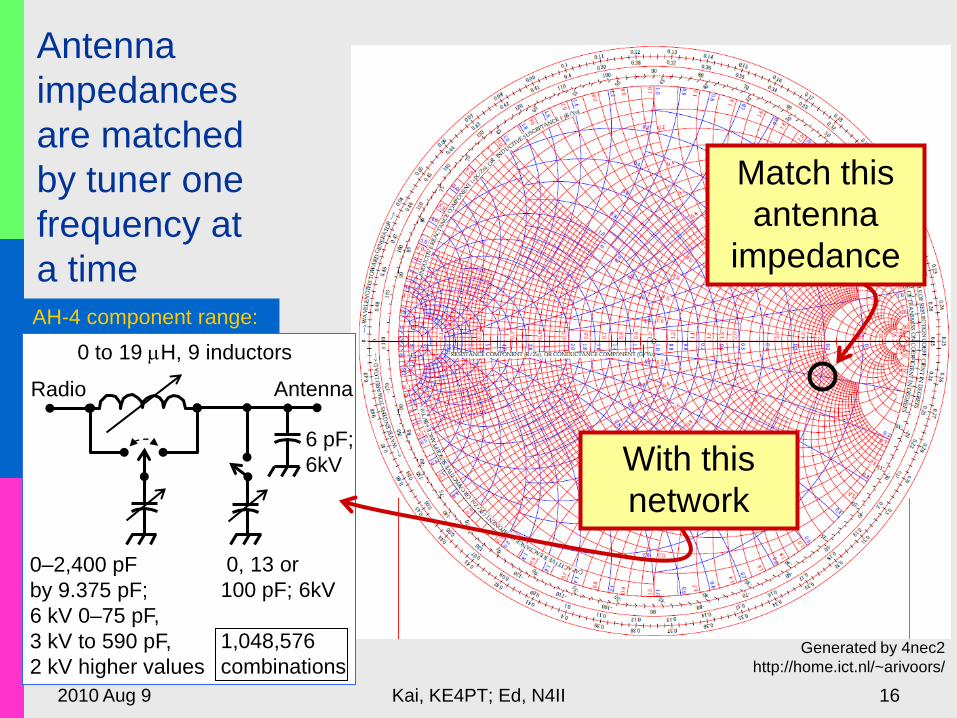
Antenna impedances are matched by tuner one frequency at a time
Generated by 4nec2 http://home.ict.nl/~arivoors/
Match this antenna
impedance AH-4 component range:
0 to 19 µH, 9 inductors
0–2,400 pF by 9.375 pF; 6 kV 0–75 pF, 3 kV to 590 pF, 2 kV higher values
6 pF; 6kV
0, 13 or 100 pF; 6kV 1,048,576 combinations
Antenna Radio
With this network
2010 Aug 9
Kai, KE4PT; Ed, N4II
17
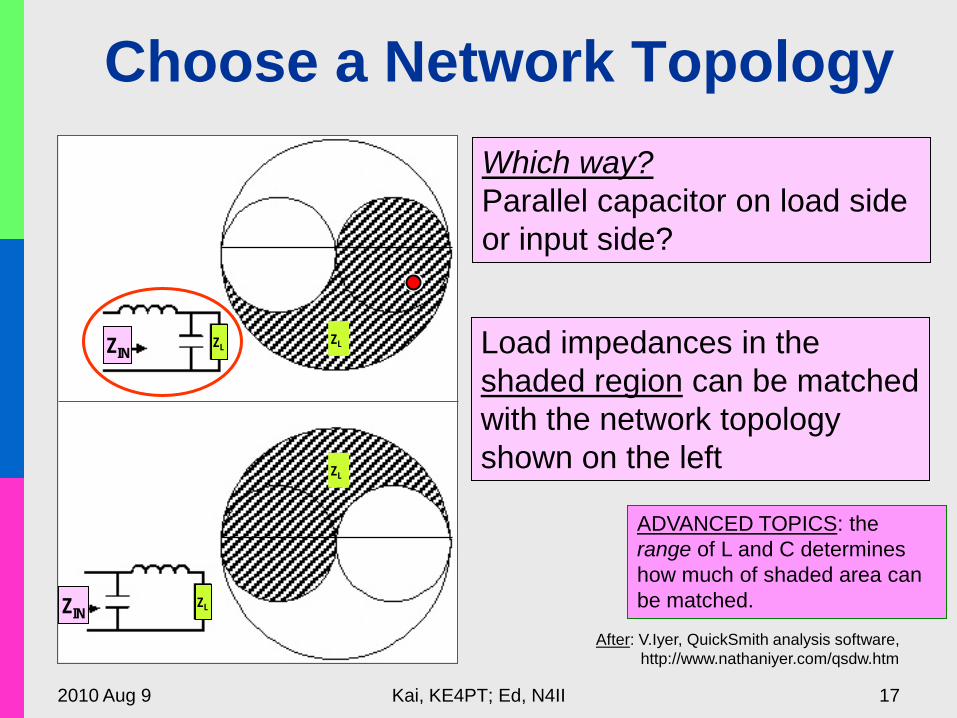
Choose a Network Topology
Load impedances in the shaded region can be matched with the network topology shown on the left
Which way? Parallel capacitor on load side or input side?
After: V.Iyer, QuickSmith analysis software, http://www.nathaniyer.com/qsdw.htm
ADVANCED TOPICS: the range of L and C determines how much of shaded area can be matched.
ZIN
ZIN
ZL
ZL
ZL
ZL
2010 Aug 9
Kai, KE4PT; Ed, N4II
18
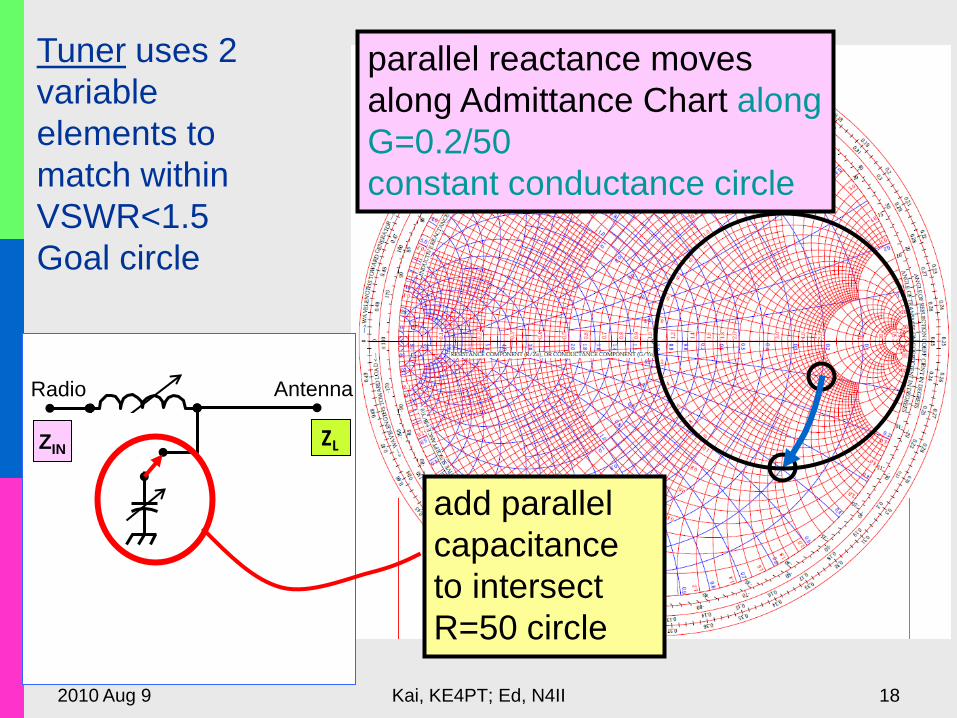
Tuner uses 2 variable elements to match within VSWR<1.5 Goal circle
Antenna Radio
add parallel capacitance to intersect R=50 circle
parallel reactance moves along Admittance Chart along G=0.2/50 constant conductance circle
ZIN ZL
2010 Aug 9
Kai, KE4PT; Ed, N4II
19
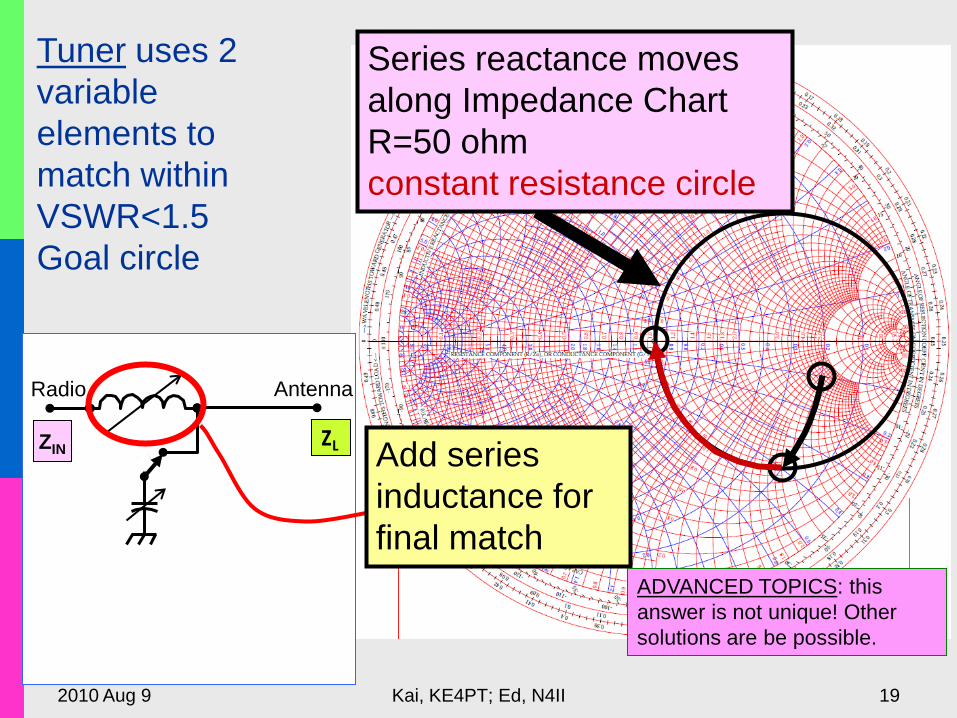
Antenna Radio
Tuner uses 2 variable elements to match within VSWR<1.5 Goal circle
Add series inductance for final match
Series reactance moves along Impedance Chart R=50 ohm constant resistance circle
ADVANCED TOPICS: this answer is not unique! Other solutions are be possible.
ZIN ZL
2010 Aug 9
Kai, KE4PT; Ed, N4II
20
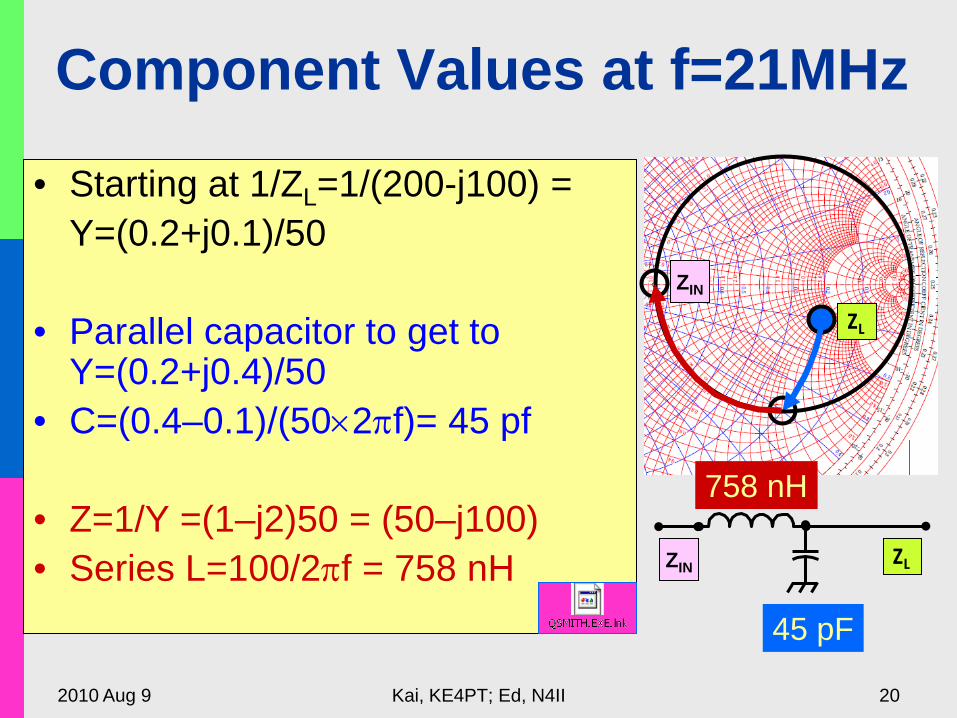
Component Values at f=21MHz
• Starting at 1/ZL=1/(200-j100) = Y=(0.2+j0.1)/50
• Parallel capacitor to get to
Y=(0.2+j0.4)/50 • C=(0.4–0.1)/(50×2πf)= 45 pf • Z=1/Y =(1–j2)50 = (50–j100) • Series L=100/2πf = 758 nH ZIN ZL
45 pF
758 nH
ZL
ZIN
2010 Aug 9
Kai, KE4PT; Ed, N4II
21
Matching over a Bandwidth
• Impedance vs. frequency trace moves in a clockwise direction
• An ideal match at mid frequency is not the same as a band – optimized match
ADVANCED TOPICS: Optimization can be done over a bandwidth; different criteria yield different results
2010 Aug 9
Kai, KE4PT; Ed, N4II
22
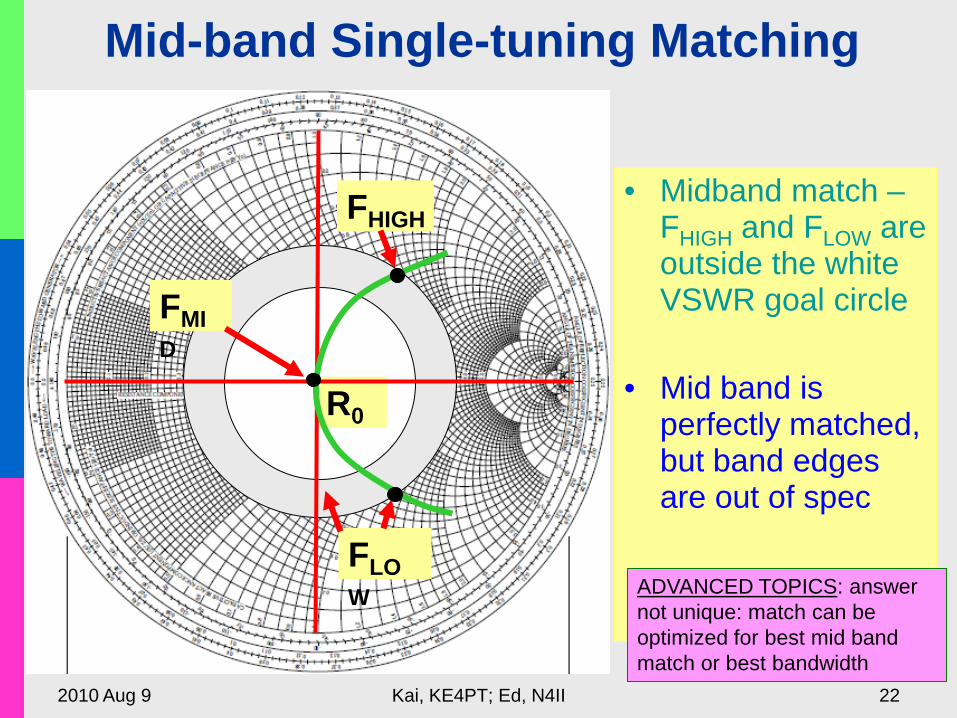
Mid-band Single-tuning Matching
• Midband match – FHIGH and FLOW are outside the white VSWR goal circle
• Mid band is
perfectly matched, but band edges are out of spec
FHIGH
FMID
FLOW
R0
ADVANCED TOPICS: answer not unique: match can be optimized for best mid band match or best bandwidth
2010 Aug 9
Kai, KE4PT; Ed, N4II
23
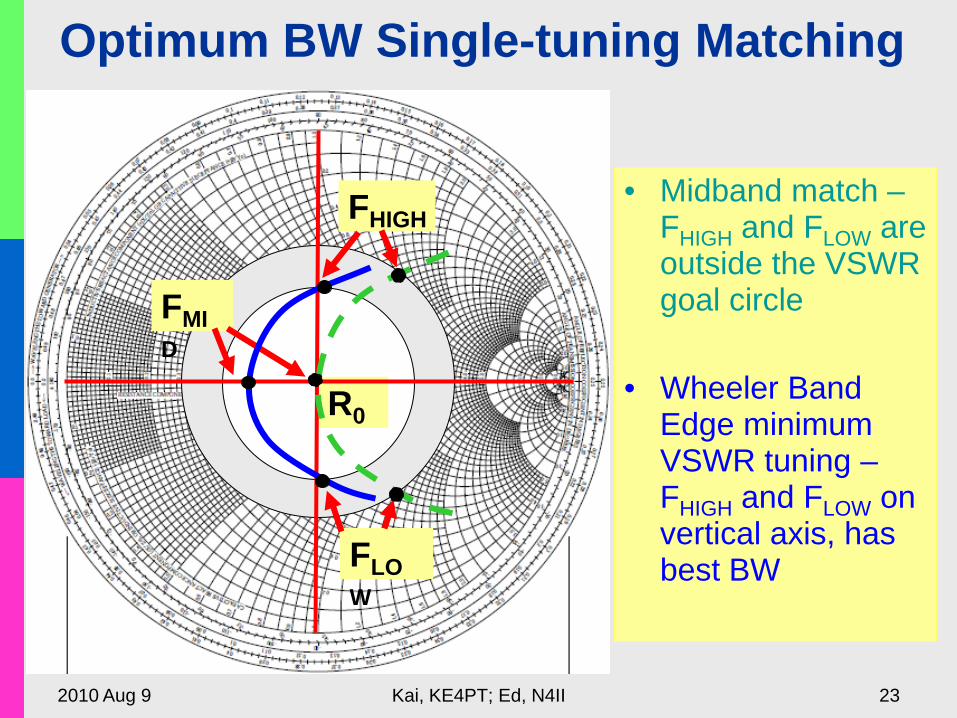
Optimum BW Single-tuning Matching
• Midband match – FHIGH and FLOW are outside the VSWR goal circle
• Wheeler Band
Edge minimum VSWR tuning – FHIGH and FLOW on vertical axis, has best BW
FHIGH
FMID
FLOW
R0
2010 Aug 9
Kai, KE4PT; Ed, N4II
24
Resources: http://www.fourier-series.com • Reflection.swf
– Reflection and transmission coefficient • smithchart1.swf
– Mapping resistance and reactance • smithchart2.swf
– Adding a transmission line • smithchart_L_C_match.swf
– Parallel and Series equivalent – Match Circuit with 2 lumped elements
• smithchart3.swf – Transmission line, and matching stub
• smithchart4.swf – T.L. and a series/parallel element – Relation to circuit element
2010 Aug 9
Kai, KE4PT; Ed, N4II
25
More Resources: • QuickSmith, by V. Iyer, Smith Chart based linear circuit
simulation software program for Microsoft Windows – http://www.nathaniyer.com/qsdw.htm
• "How does a Smith Chart Work?" Rick Nelson, Test and
Measurement World, July 2001 – http://www.sss-mag.com/pdf/smith_chart_basics.pdf
• Images of a Smith Charts:
– Impedance: http://www.sss-mag.com/pdf/smithchart.pdf – Immittance: http://rfic.ucsd.edu/files/smith_chart.pdf
• "ARRL Radio Designer and the Circles Utility Part 1:
Smith Chart Basics", W. E. Sabin, WØIYH: QEX, Sept/Oct 1998, pp.3-9 – http://www.sss-mag.com/pdf/arrl_circles.pdf
2010 Aug 9
Kai, KE4PT; Ed, N4II
26
Summary • Smith Chart – a graphical tool for matching • Combinations of transmission lines,
series/parallel inductors/capacitors are used • Examples illustrate some matching uses of the
Smith Chart • Best match over a bandwidth and perfect match
at one frequency are not the same! • See ‘Resources’ for additional information • Advanced topics: –R = amplifier, outside chart;
optimization vs. frequency; range of matching components; using TL stubs
2010 Aug 9
Kai, KE4PT; Ed, N4II
27
Extra Slides
2010 Aug 9
Kai, KE4PT; Ed, N4II
28
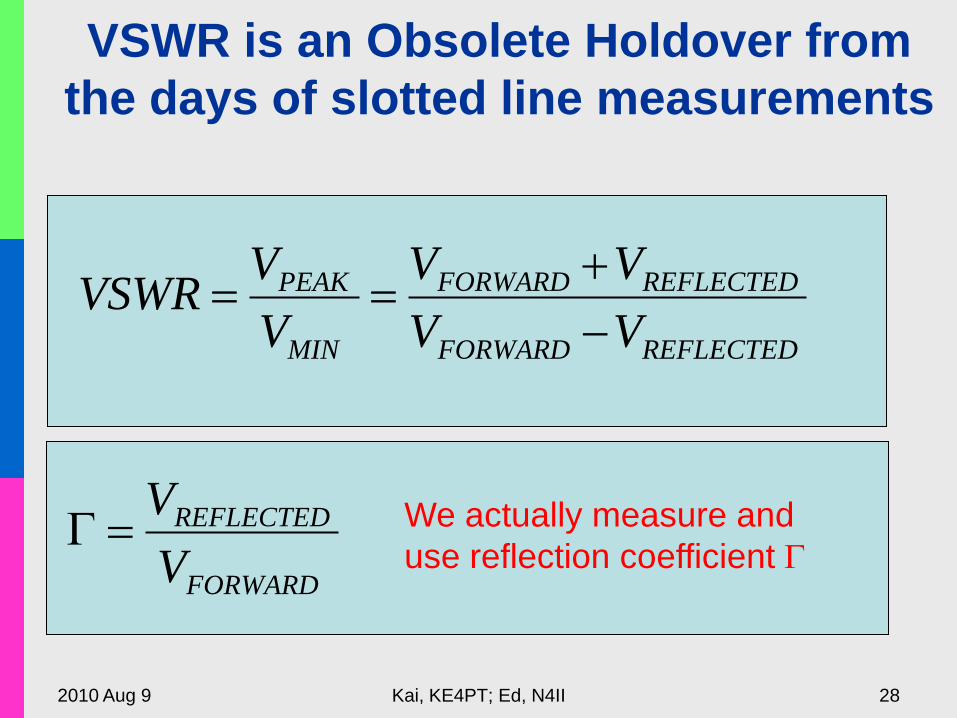
VSWR is an Obsolete Holdover from the days of slotted line measurements
REFLECTEDFORWARD
REFLECTEDFORWARD
MIN
PEAK
VVVV
VVVSWR
−+
==
FORWARD
REFLECTED
VV
=Γ We actually measure and use reflection coefficient Γ
2010 Aug 9
Kai, KE4PT; Ed, N4II
29
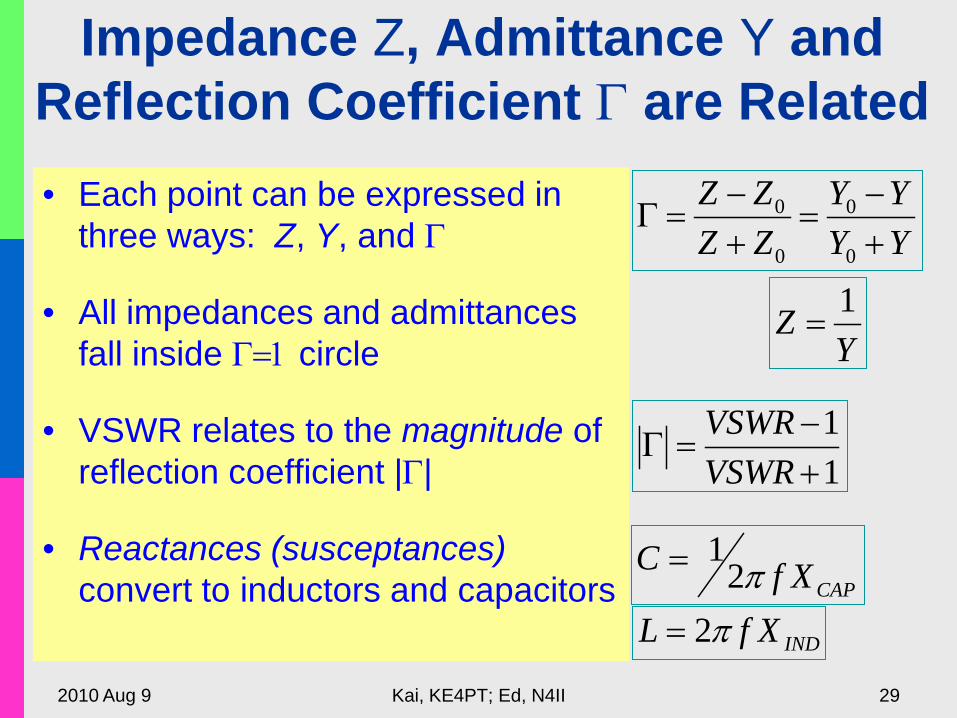
Impedance Z, Admittance Y and Reflection Coefficient Γ are Related • Each point can be expressed in
three ways: Z, Y, and Γ
• All impedances and admittances fall inside Γ=1 circle
• VSWR relates to the magnitude of reflection coefficient |Γ|
• Reactances (susceptances) convert to inductors and capacitors
YYYY
ZZZZ
+−
=+−
=Γ0
0
0
0
11
+−
=ΓVSWRVSWR
YZ 1
=
CAPXfC π21=
INDXfL π2=
2010 Aug 9
Kai, KE4PT; Ed, N4II
30
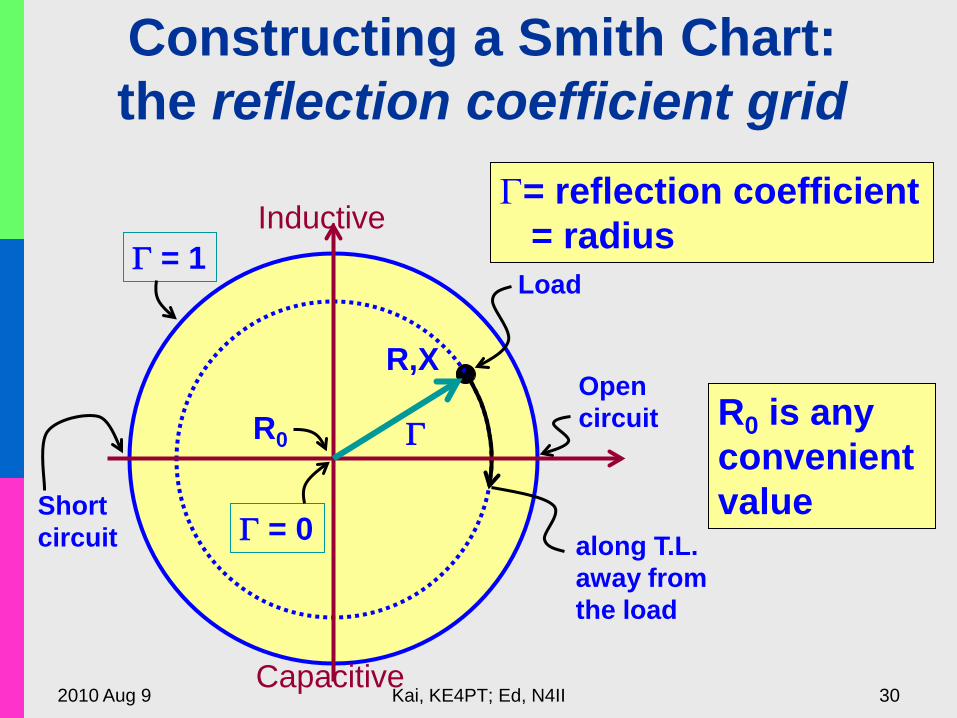
Constructing a Smith Chart: the reflection coefficient grid
Open circuit
Short circuit
Γ= reflection coefficient = radius
Γ
Γ = 1
Γ = 0
R,X
R0
along T.L. away from the load
Load
R0 is any convenient value
Inductive
Capacitive
2010 Aug 9
Kai, KE4PT; Ed, N4II
31
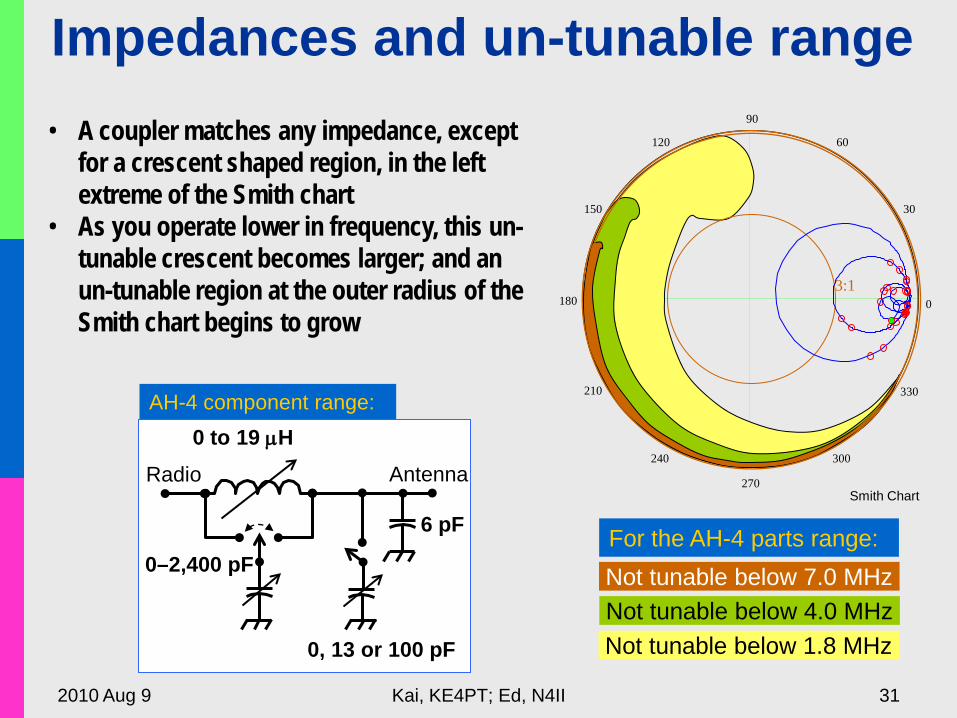
Impedances and un-tunable range
Smith Chart
0
30
60
90
120
150
180
210
240
270
300
330
3:1
• A coupler matches any impedance, except for a crescent shaped region, in the left extreme of the Smith chart
• As you operate lower in frequency, this un-tunable crescent becomes larger; and an un-tunable region at the outer radius of the Smith chart begins to grow
AH-4 component range: 0 to 19 µH
0–2,400 pF
6 pF
0, 13 or 100 pF
Antenna Radio
Not tunable below 1.8 MHz Not tunable below 4.0 MHz Not tunable below 7.0 MHz For the AH-4 parts range:


![Ed Callaway, N4II N4II@arrl.net South Florida DX Association · Today’s Program • References – Books, web sites, videos, and other publications ... are] dark mysteries to most](https://img.pdfslide.us/doc/110x75/601812630e970f67882e394d/ed-callaway-n4ii-n4iiarrlnet-south-florida-dx-todayas-program-a-references.jpg)