Embed Size (px)
Citation preview

M. Serdar Kabukçuoğlu
Dr. Oktay Küçükkiremitçi
Tirana, Albania, 10-11 November 2014 1

Credit Modelling and Validation Seminar
Tiran, Albania, 10-11 November 2014
2 2
Structure and Approach to Seminar
Interactivity
Sharing
Group working

Credit Modelling and Validation Seminar
Tiran, Albania, 10-11 November 2014
3 3
General Approach to Company Lending

Credit Modelling and Validation Seminar
Tiran, Albania, 10-11 November 2014
4 4
Business Life Cycle and Financing
Investment Decision
Operational and Financial Management
Start-up Finance
Investment Finance
Operational or Growth Finance
Operational Finance
Reinvestment Finance Finance What?
Ba ker’s Perspective
Evaulate What? • Investment Cost
• Fı a ial Requirements
• Financial Viability
• Debt Capacity
• Working Capital Requirement
• Financial Performance
• Growth strategy
• Projections
• Debt Capacity
• Working Capital Requirement
• Financial Performance
• Projections
• Debt Capacity
Loan Transactions
Extending Loans
Investment Decision and/or Exit Strategy
• Investment Cost
• Fı a ial Requirements
• Financial Viability
• Debt Capacity

Credit Modelling and Validation Seminar
Tiran, Albania, 10-11 November 2014
5
Credit Risk
Risk is inherent in all loan transactions. It is not good business practice to reject all risks.
Analyzing what constitutes an acceptable degree / amount of risks involves finding answers to the
following questions?
• Is the risk acceptable?
• If the risk is satisfactory, to what extent should loan be extended?
• Under what conditions or upon what terms shall be loan be extended?

Credit Modelling and Validation Seminar
Tiran, Albania, 10-11 November 2014
6 6
Credit Risk
Non-payment
Late Payment
Unable to pay
Unwilling to pay
Can the borrower pay?
Will the borrower pay?

Credit Modelling and Validation Seminar
Tiran, Albania, 10-11 November 2014
7
Credit Risk
Evaluating
the financials
Evaluating the
non- financials
Environmental
Risks
Industry Risks
Country Risks
Financial
Viability
Financial
Performance
Macro
Environment
Projected
Past
Operating
Environment
Financial Health
Financial
Needs
Owner Risks
Company Risks
• Analysis of Financial Statements
• Trends
• Success/failure
• Performance
• Determining financial needs
• Financial projections/viability analysis
• Sensitivity analysis
• Determining external / general economic trends and
• Environmental Risks
• Determining sectoral and company risks
• Owners/Investors honesty, trade references, experiences
• Management and technical capability

Credit Modelling and Validation Seminar
Tiran, Albania, 10-11 November 2014
8
Debt Capacity
Simple Balance of Finance

Credit Modelling and Validation Seminar
Tiran, Albania, 10-11 November 2014
9
Debt Capacity
Simple Balance of Finance

Credit Modelling and Validation Seminar
Tiran, Albania, 10-11 November 2014
10
Debt Capacity
Equity
50-85 %
15-50 %
Simple Balance of Finance

Credit Modelling and Validation Seminar
Tiran, Albania, 10-11 November 2014
11
Debt Capacity
Characteristics of Debt
• Commitment to make fixed payments of various combination of principle payments
and interest payments in the future
• Interest payments are tax deductible
• Failure to make the payments can lead to either default or loss of control of the firm
to the party to whom payments are overdue.

Credit Modelling and Validation Seminar
Tiran, Albania, 10-11 November 2014
12
Debt Capacity
What is Debt Capacity?
• Appropriate debt limit
• Ability to borrow
• Optimal debt level at;
owhich earnings per share is maximum
owhich average cost of sources minimum

Credit Modelling and Validation Seminar
Tiran, Albania, 10-11 November 2014
13
Debt Capacity
The Cost of Capital Approach: The optimal debt ratio is the one that
minimizes the cost of capital for a firm.
The Sector Approach: The optimal debt ratio is the one that brings the
firm closes to its peer group in terms of financing mix.
The Adjusted Present Value Approach: The optimal debt ratio is the one
that maximizes the overall value of the firm.
The Life Cycle Approach: The optimal debt ratio is the one that best suits
where the firm is in its life cycle.
Optimal Debt Level/theory-approaches

Credit Modelling and Validation Seminar
Tiran, Albania, 10-11 November 2014
14
Debt Capacity
Assumptions for Optimal Debt Level
• There are no taxes
• Ma agers ha e sto kholders i terest at hear a d do hat s est for sto kholders.
• No firm ever goes bankrupt
• Equity investors are honest with lenders; there is no subterfuge or attempt to find
loopholes in loan agreements
• Firms know their future financing needs with certainty
Credit Modelling and Validation Seminar
Tiran, Albania, 10-11 November 2014
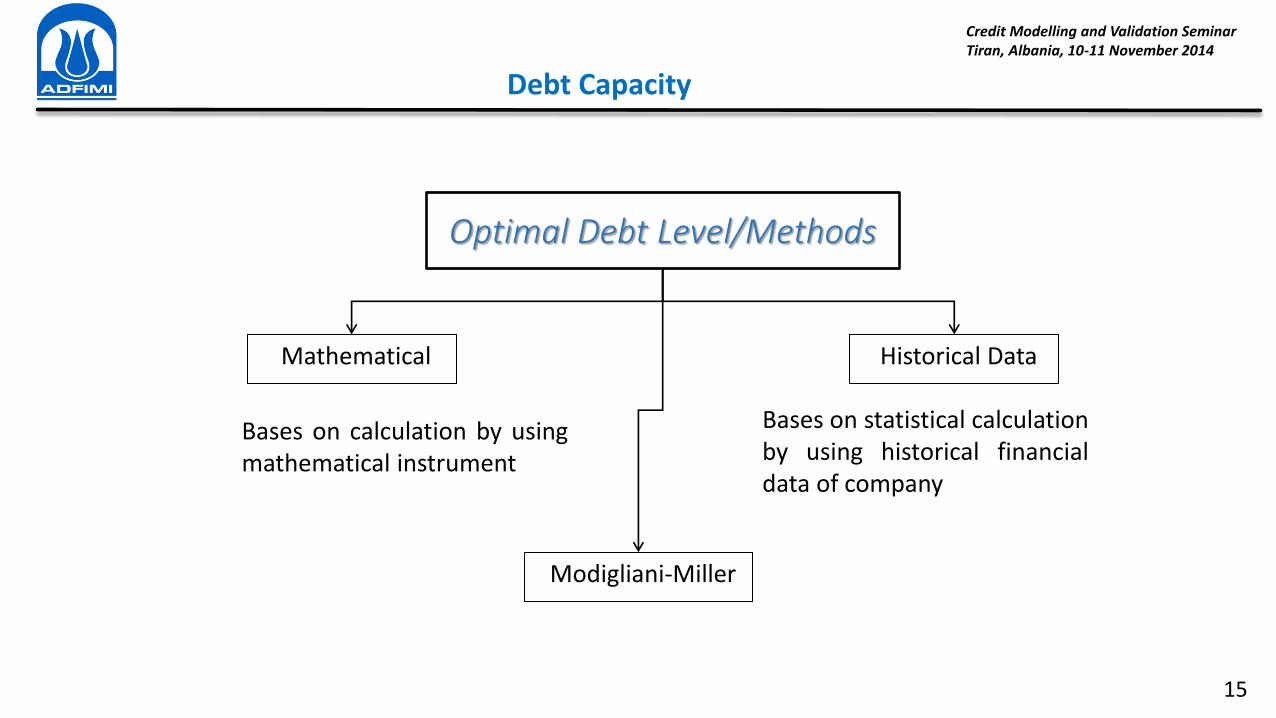
15
Debt Capacity
Optimal Debt Level/Methods
Mathematical Historical Data
Bases on calculation by using
mathematical instrument
Bases on statistical calculation
by using historical financial
data of company
Modigliani-Miller
Credit Modelling and Validation Seminar
Tiran, Albania, 10-11 November 2014
16
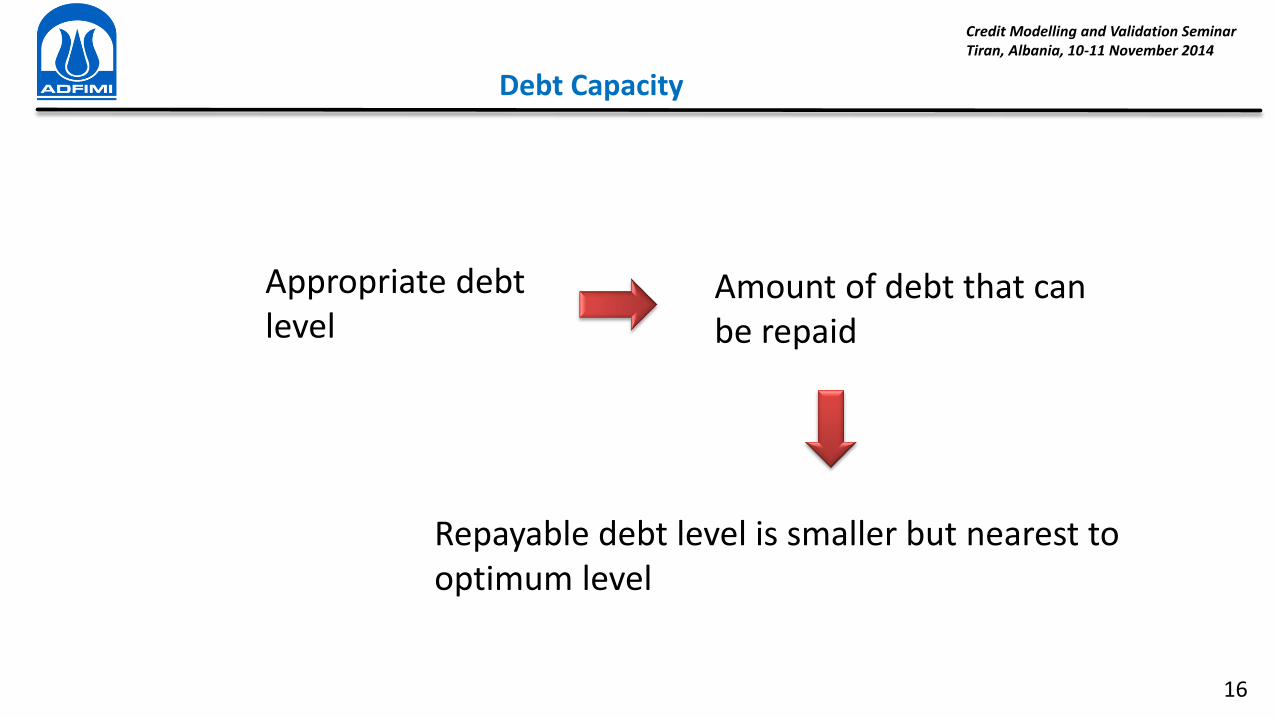
Debt Capacity
Repayable debt level is smaller but nearest to
optimum level
Amount of debt that can
be repaid
Appropriate debt
level

Credit Modelling and Validation Seminar
Tiran, Albania, 10-11 November 2014
17
Debt Capacity
Total Financial Requirements 350
Loan Amount 200
Equity 150
Possible Loan Amount 100
Equity 150
Possible Investment 250
Total Value of Collaterals 100

Credit Modelling and Validation Seminar
Tiran, Albania, 10-11 November 2014
18
Debt Capacity
20%

Credit Modelling and Validation Seminar
Tiran, Albania, 10-11 November 2014
19
END OF SESSION I
Comments ???
Questions ???

Credit Modelling and Validation Seminar
Tiran, Albania, 10-11 November 2014
20
Description of Product(s) (*)
The identification/definition of the product to be produced
Application areas of the product (areas of usage)
The detailed characteristics of the product (physical, chemical properties,
related national and international quality standards, level of quality,
appearance, composition, dimensions, tolerances etc.)
Competing / substitute and complementary goods
(*) This session notes are prepared with the contribution of Mr. İ rahi Sevin, Director od Technology Monitoring
and Research Departmant

Credit Modelling and Validation Seminar
Tiran, Albania, 10-11 November 2014
21
Description of Product(s)
The definition of the sector and the product according to the different
international classification (NACE, ISIC, STIC etc)
• To analyze the "right" sector
• To determine the substitute and/or complementary sectors
• To determine the demand analysis (derivative demand, intermediary demand, final demand etc)
• To determine the "final shape" of the product (packaging, assembling, distributing channels etc)
As an example let s think about CaCO3 production; The definition of it in wikipedia is given below :
Calcium carbonate is a chemical compound with the formula CaCO3. It is a common substance found in rocks in all parts of the world, and is the
main component of shells of marine organisms, snails, coal balls, pearls, and eggshells. Calcium carbonate is the active ingredient in agricultural lime,
and is usually the principal cause of hard water. It is commonly used medicinally as a calcium supplement or as an antacid.
fillers
viscosity control
Adhesives & Sealants Animal & Pet Feeds
calcium source digestion
aid
filler for concrete,
grout & asphalt
fillers in roofing
materials
Construction
natural alkali source
fire suppressant
Environment Fertilisers Food & Household
calcium source
filler
calcium source
mild abrasive
Credit Modelling and Validation Seminar
Tiran, Albania, 10-11 November 2014
22
Description of Product(s)
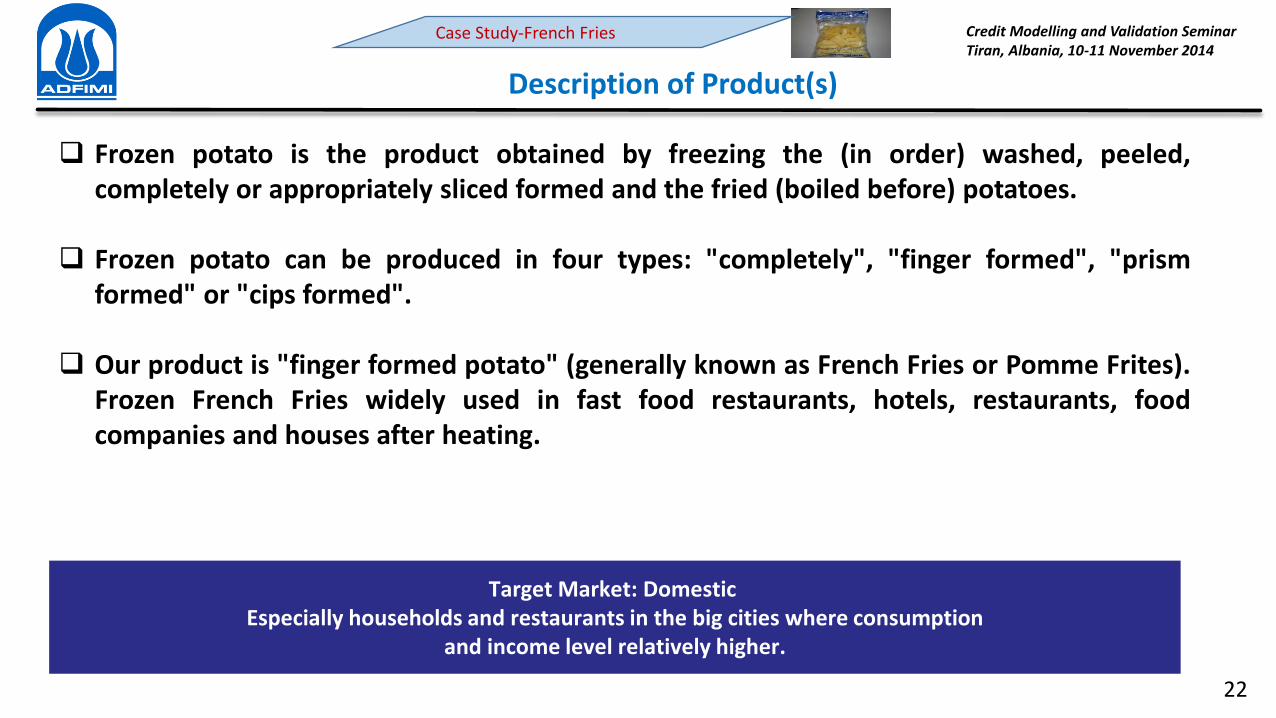
Frozen potato is the product obtained by freezing the (in order) washed, peeled,
completely or appropriately sliced formed and the fried (boiled before) potatoes.
Frozen potato can be produced in four types: "completely", "finger formed", "prism
formed" or "cips formed".
Our product is "finger formed potato" (generally known as French Fries or Pomme Frites).
Frozen French Fries widely used in fast food restaurants, hotels, restaurants, food
companies and houses after heating.
Target Market: Domestic
Especially households and restaurants in the big cities where consumption
and income level relatively higher.
Case Study-French Fries
Credit Modelling and Validation Seminar
Tiran, Albania, 10-11 November 2014
23
Description of Product(s)
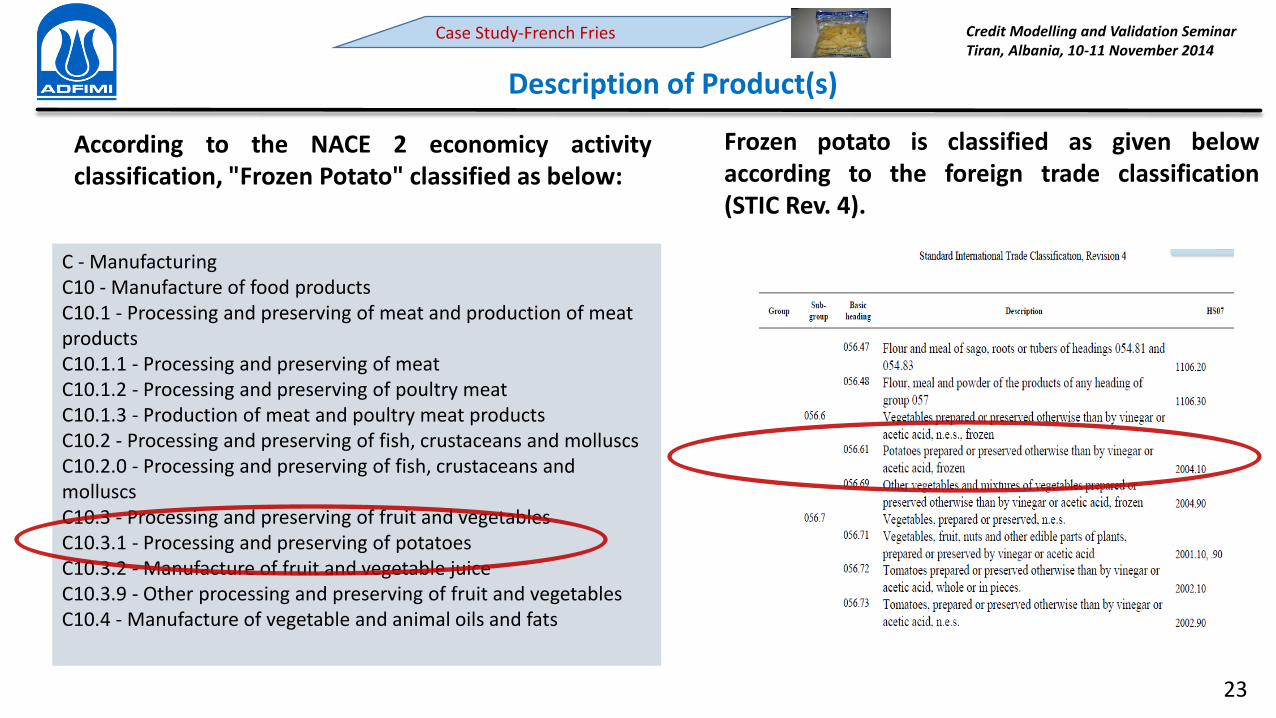
C - Manufacturing
C10 - Manufacture of food products
C10.1 - Processing and preserving of meat and production of meat
products
C10.1.1 - Processing and preserving of meat
C10.1.2 - Processing and preserving of poultry meat
C10.1.3 - Production of meat and poultry meat products
C10.2 - Processing and preserving of fish, crustaceans and molluscs
C10.2.0 - Processing and preserving of fish, crustaceans and
molluscs
C10.3 - Processing and preserving of fruit and vegetables
C10.3.1 - Processing and preserving of potatoes
C10.3.2 - Manufacture of fruit and vegetable juice
C10.3.9 - Other processing and preserving of fruit and vegetables
C10.4 - Manufacture of vegetable and animal oils and fats
According to the NACE 2 economicy activity
classification, "Frozen Potato" classified as below:
Frozen potato is classified as given below
according to the foreign trade classification
(STIC Rev. 4).
Case Study-French Fries
Credit Modelling and Validation Seminar
Tiran, Albania, 10-11 November 2014
24
Installed Capacity and Capacity Selection
Capacity is the maximum output rate of a facility for a given time period.
Capacity planning is deciding on the maximum output rate of a facility.
Importance of Capacity Decisions
Impacts ability to meet future demands
Affects operating costs
Major determinant of initial costs
Involves long-term commitment
Affects competitiveness
Affects ease of management

Credit Modelling and Validation Seminar
Tiran, Albania, 10-11 November 2014
25
Installed Capacity and Capacity Selection
Capacity Measures and Related Concepts
Design (Theoritical) capacity : Maximum output rate under ideal conditions.
Effective capacity: Maximum output rate under normal (realistic) conditions.
Actual output: Rate of output actually achieved—cannot exceed effective capacity
Utilization: Actual or expected output as a percent of design capacity (Actual output / Design
capacity)
Efficiency: Actual or expected output as a percent of effective capacity (Actual output / Effective
capacity)
Optimum capacity: The capacity where unit cost (fixed+variable) is minimum. It is amount of
production with minimum unit cost and assumed to be equal to effective capacity.
Minimum capacity: The capacity that incomes cover costs.

Credit Modelling and Validation Seminar
Tiran, Albania, 10-11 November 2014
26
Technology & Process - Technology Trends

27
Let’s think about industrialized potato productions & technologies
Industrial Potato Products
Products For Human Consumption
Alcohol Starch Animal Food
Alcohol Produced from potato residuary and wastes. Mainly ethanol. Used
as petrol additive
Starch
Produced from potato peels, residuary and processing water.
Advantages over corn & wheat starch are many but expensive.
Approximately 1 kg is produced from 5 kgs potatoes.
Animal Food
Low quality whole potatoes , potato peels and potato wastes are
used. But no income achieved, because main purpose is to
eliminate those wastes.
Credit Modelling and Validation Seminar
Tiran, Albania, 10-11 November 2014
Technology & Process Selection
Case Study-French Fries

Credit Modelling and Validation Seminar
Tiran, Albania, 10-11 November 2014
28
Technology & Process Selection
Potato products for human consumption
Washing
Peeling
Cutting Boiling
Cooking
Pressing Mixing
Drying
Flakes
Washing
Peeling
Cutting Boiling
Cooking
Pressing Mixing
Conditioning
Drying
Granules
Washing
Peeling
Cutting
Boiling Cooking
Pressing
Mixing
Conditioning
Forming
Frying
Cooling
Freezing
Croquettes
Washing
Peeling
Cutting
Boiling Cooking
Pressing
Mixing
Conditioning
Forming
Drying
Frying
Cooling Freezing French Fries
Washing
Peeling
Cutting Boiling
Frying
Spices Adding
Chips
Case Study-French Fries

Credit Modelling and Validation Seminar
Tiran, Albania, 10-11 November 2014
29
Technology & Process Selection

Credit Modelling and Validation Seminar
Tiran, Albania, 10-11 November 2014
30
Technology & Process – Material Balance
5,970 kg
5,250 kg
4,650 kg
3,480 kg
3,000 kg
3,000 kg
3,000 kg
Russet Potatoes
(6,000 kg/h)
Receiving-Grading Stone, soil (30 kg)
Washing & Peeling Waste Peel (720 kg)
Slicing-Sliver Removal-
Sizing Loss (600 kg)
Boiling
Frying-Oil Draining
SAPP (2.33 kg)
Drying Moisture (1,170 kg)
Packaging
Storing & Transportation
Moisture (630 kg)
Waste Oil (60 kg) Vegetable Oil (210 kg)
IQF Freezing
PE Films (35 kg)
Box (306 Pieces)
Waste SAPP (2.33 kg)
4,650 kg
Russet potatoes with contract farming will be used
They contain %80 water and %20 dry material and end
product will be mc-fries quality with %64 water, %31 dry
matter and %5 oil
Through out july-october they processed frehsly and rest of
the year stocked ones will be used
As seen from material balance sheet to produce 1 kg frozen
french fries 2 kgs fresh potato needed. This ratio increases 1 to
2.5 for stored potatoes (storage losses)
At full capacity the plant will work 2 shifts per day 300
days/year and produce frozen french fries 3 tons/h
Need for stored potatoes : . ∗ ∗ ℎ �� ∗ �� � � ∗ = , � �
Need for fresh potatoes : ∗ ∗ ℎ �� ∗ �� � � ∗ = , � � Total :
33,600 � � russet potatoes needed
Inputs Production/hour Production/year
Russet Potatoes 6.000,00 Kg/h 33.600 Tons/year
Fryer Vegetable Oil 210,00 Kg/h 1.008 Tons/year
Sodium Acid Pyro
Phosphate 2,33 Kg/h 11,2 Tons/year
Polietilen Film 35,00 Kg/h 168 Tons/year
Carton Box 306,00 Boxes/h 1.468.800 Boxes/year
Output
Frozen French Fries 3.000,00 Kg/h 14.400 Tons/year
Case Study-French Fries

Credit Modelling and Validation Seminar
Tiran, Albania, 10-11 November 2014
31
Implementation & Total Investment Costs
1 2 3 4 5 6 7 8 9 10 11 12 1 2 3 4 5 6 7 8 9 10 11 12
1. Land Acquisition
2. Pre invesment & Support Studies
3. Site Preparation & Development
4. Civil Works
5. Machinery & Equipment
6. Freight & Insurance
7. Erection
8. Vehicles & Fixtures
9. Start-Up
Fixed Investment Items1. Year 2.Year
Frozen french fries implementation plan
Distribution of total investment costs troughout construction period is made according to the
implementation plan .
This distrubition is done with the assumption that financial resources are ready at the indicated
time with the implementation plan. Mostly this is not the case so implementation plans are
generally revised.
Case Study-French Fries

Credit Modelling and Validation Seminar
Tiran, Albania, 10-11 November 2014
32
Implementation & Total Investment Costs
Fixed Investment (including
Land)
Working Capital
Total Investment

Credit Modelling and Validation Seminar
Tiran, Albania, 10-11 November 2014
33
Implementation & Total Investment Costs
INVESTMENT ITEMS TOTAL 1. YEAR 2. YEAR 3. YEAR 4. YEAR
A – Land Acquisition
B – Fixed Invesments
1 – Pre-investment and Support Studies
2 – Technical Consulting, Royalty and Know-How
3 – Site preparation and development
4 – Civil Works
5 – Machinery and Equipment
6 – Freight and Insurance
7 - Import Costs and Customs Clearence
8 – Erection and Comissioning
9 – Vehicles and Fixtures
10 – Trial Runs and Start Up
11 – General Expenses
12 – Contingencies
FIXED INVESTMENT COST (Land included)
C – Working Capital Investment
TOTAL INVESTMENT COST

Credit Modelling and Validation Seminar
Tiran, Albania, 10-11 November 2014
34
Implementation & Total Investment Costs
YEARS TOTAL (USD) FIRST YEAR (USD) SECOND YEAR (USD)
INVESTMENT ITEMS TOTAL DOMESTIC FOREIGN DOMESTIC FOREIGN DOMESTIC FOREIGN
A. Land Acquisition 400.000 400.000 0 400.000 0 0 0
B. Fixed Investment 11.568.612 3.988.687 7.579.925 1.278.250 2.989.370 2.710.437 4.590.555
1.Pre-investment and support studies 115.000 50.000 65.000 50.000 65.000 0 0
2. Know-How-Patent and Royalties 0 0 0 0 0
3. Civil Works 1.311.000 1.311.000 0 983.250 0 327.750 0
4. Plant Machinery and Equipment (Inc.Auxiliary) 7.832.112 876.187 6.955.925 0 2.782.370 876.187 4.173.555
5.Freight and insurance 405.000 370.000 35.000 0 0 370.000 35.000
6.Import commissioning and customs clearence 70.000 70.000 0 0 0 70.000 0
7.Installation - erection 553.000 390.000 163.000 0 0 390.000 163.000
8. Vehicles and Fixtures 387.500 387.500 0 30.000 0 357.500 0
9. Start up 100.000 100.000 0 0 0 100.000 0
10.Overheads 225.000 225.000 0 135.000 0 90.000 0
11.Contingencies 570.000 209.000 361.000 80.000 142.000 129.000 219.000
TOTAL FIXED COST 11.968.612 4.388.687 7.579.925 1.678.250 2.989.370 2.710.437 4.590.555
B. WORKING CAPITAL 3.008.249 3.008.249 0 0 0 3.008.249 0
TOTAL INVESTMENT COST (USD) 14.976.861 7.396.936 7.579.925 1.678.250 2.989.370 5.718.686 4.590.555
Frozen french fries production plant total investment cost and distrubition over years
Case Study-French Fries

Credit Modelling and Validation Seminar
Tiran, Albania, 10-11 November 2014
35
Operational Costs at Full Capacity
Credit Modelling and Validation Seminar
Tiran, Albania, 10-11 November 2014
36
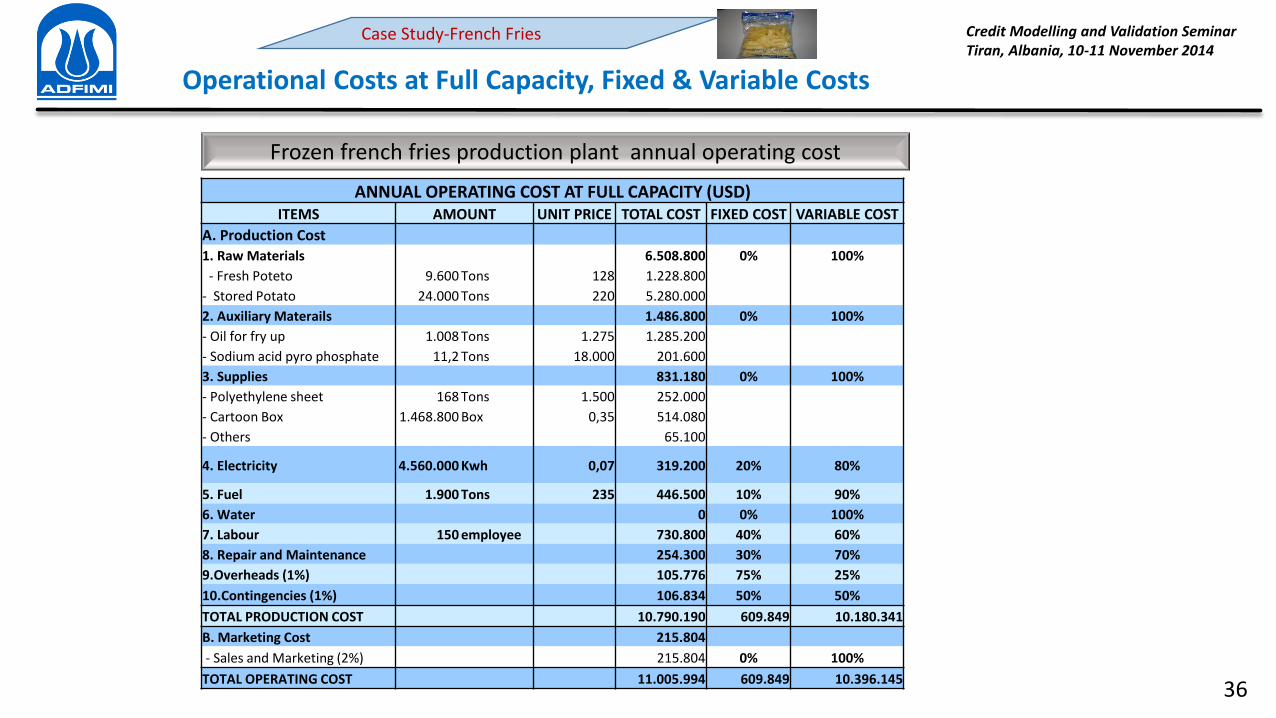
Operational Costs at Full Capacity, Fixed & Variable Costs
ANNUAL OPERATING COST AT FULL CAPACITY (USD)
ITEMS AMOUNT UNIT PRICE TOTAL COST FIXED COST VARIABLE COST
A. Production Cost
1. Raw Materials 6.508.800 0% 100%
- Fresh Poteto 9.600 Tons 128 1.228.800
- Stored Potato 24.000 Tons 220 5.280.000
2. Auxiliary Materails 1.486.800 0% 100%
- Oil for fry up 1.008 Tons 1.275 1.285.200
- Sodium acid pyro phosphate 11,2 Tons 18.000 201.600
3. Supplies 831.180 0% 100%
- Polyethylene sheet 168 Tons 1.500 252.000
- Cartoon Box 1.468.800 Box 0,35 514.080
- Others 65.100
4. Electricity 4.560.000 Kwh 0,07 319.200 20% 80%
5. Fuel 1.900 Tons 235 446.500 10% 90%
6. Water 0 0% 100%
7. Labour 150 employee 730.800 40% 60%
8. Repair and Maintenance 254.300 30% 70%
9.Overheads (1%) 105.776 75% 25%
10.Contingencies (1%) 106.834 50% 50%
TOTAL PRODUCTION COST 10.790.190 609.849 10.180.341
B. Marketing Cost 215.804
- Sales and Marketing (2%) 215.804 0% 100%
TOTAL OPERATING COST 11.005.994 609.849 10.396.145
Frozen french fries production plant annual operating cost
Case Study-French Fries

Credit Modelling and Validation Seminar
Tiran, Albania, 10-11 November 2014
37
Sales and Income at Full Capacity
Frozen french fries production plant annual sales income at full capacity
SALES INCOME AT FULL CAPACITY (USD)
Product Quantity Unit Price Sales Income
Mc-Fries Frozen French Fries 14.400 Tons 1.200 17.280.000
TOTAL 17.280.000
Investment Items Costs Salvage Value
(USD) (%) (USD)
Land 400.000 100 400.000
Civil Works 1.311.000 50 655.500
Other Fixed Investments 10.257.612 10 1.025.761
TOTAL 11.968.612 17 2.081.261
Frozen french fries production plant salvage value
Economical life of the plant was determined as 20 years
Case Study-French Fries

Credit Modelling and Validation Seminar
Tiran, Albania, 10-11 November 2014
38
END OF SESSION II
Comments ???
Questions ???

Credit Modelling and Validation Seminar
Tiran, Albania, 10-11 November 2014
39
Working Capital
What is Working Capital?

Credit Modelling and Validation Seminar
Tiran, Albania, 10-11 November 2014
40
Working Capital
• Working capital refers to current assets that sustain day to day business
operations.
• These are also named as revolving or circulating capital or short-term capital.
• The relationship between current assets and current liabilities plays a majorr
role in establishing financial management policies .
• Working capital management is usually described as involving the
administration of cash, marketable securities, receivables, and inventories
What is Working Capital?

Credit Modelling and Validation Seminar
Tiran, Albania, 10-11 November 2014
41
Working Capital
What is Working Capital?

Credit Modelling and Validation Seminar
Tiran, Albania, 10-11 November 2014
42
Working Capital
Main Approaches to Working Capital
Working Capital
Dynamic
Operating Cycle Basis
Static
Balance Sheet Basis
Gross
Working Capital
Net
Working Capital
Variable
Working Capital
Permanent
Working Capital
Reserve
Working Capital
Regular
Working Capital

Credit Modelling and Validation Seminar
Tiran, Albania, 10-11 November 2014
43
Working Capital
Main Approaches to Working Capital/Balance Sheet Basis
Gross Working Capital
Current Assets (C.A.) Current Liabilities (C.L.)
Net Working Capital
C.A. – C.L. = Positive Working Capital Surplus
C.A. – C.L. = Negative Working Capital Deficit

Credit Modelling and Validation Seminar
Tiran, Albania, 10-11 November 2014
44
Working Capital
Main Approaches to Working Capital/Balance Sheet Basis
Current Assets 150 Short Term Liabilities 80
Gross working capital
Net working capital
150
70
Current Assets 80 Short Term Liabilities 150
Gross working capital
Net working capital
80
-70
If expected growth in business is 25%,
Additional working capital is 70*0,25= 17,5
If expected growth in business is 25%,
Additional working capital = ?

Credit Modelling and Validation Seminar
Tiran, Albania, 10-11 November 2014
45
Working Capital
Accounts
Payable
Cash
Raw
Materials
Semi-Finished Goods
Finished
Goods Sales
+ operating supplies
+ electricity
+ fuel
+ water
+ labor costs
+ Contingencies
+ general expenses
+ administration expenses
+ general marketing costs
+ contingencies
+
Accounts Receivable

Credit Modelling and Validation Seminar
Tiran, Albania, 10-11 November 2014
46
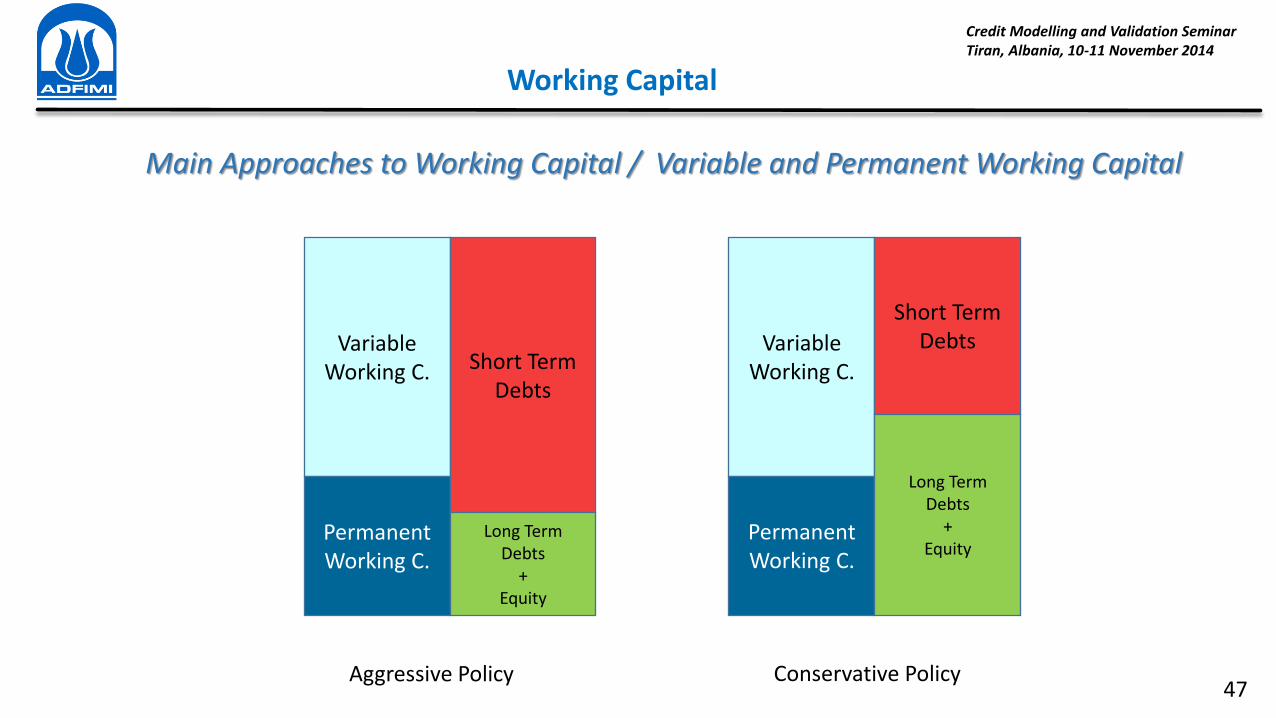
Working Capital
Main Approaches to Working Capital / Variable and Permanent Working Capital
Permanent Working Capital
Variable Working Capital
Amount
C.U.R.
Short-Term Debt
Long-Term Debt + Equity
Credit Modelling and Validation Seminar
Tiran, Albania, 10-11 November 2014
47
Working Capital
Main Approaches to Working Capital / Variable and Permanent Working Capital
Variable
Working C.
Permanent
Working C.
Short Term
Debts
Long Term
Debts
+
Equity
Aggressive Policy
Variable
Working C.
Permanent
Working C.
Short Term
Debts
Long Term
Debts
+
Equity
Conservative Policy

Credit Modelling and Validation Seminar
Tiran, Albania, 10-11 November 2014
48
Working Capital
Calculation of Working Capital Requirements
+ operating supplies
+ electricity
+ fuel
+ water
+ labor costs
+ contingencies
+ general expenses
+ administration expenses
+ general marketing costs
+ contingencies
Material Balance Working Capital Calculation

Credit Modelling and Validation Seminar
Tiran, Albania, 10-11 November 2014
49
Working Capital
Material Balance
5,970 kg
5,250 kg
4,650 kg
3,480 kg
3,000 kg
3,000 kg
3,000 kg
Russet Potatoes
(6,000 kg/h)
Receiving-Grading Stone, soil (30 kg)
Washing & Peeling Waste Peel (720 kg)
Slicing-Sliver Removal-Sizing Loss (600 kg)
Boiling
Frying-Oil Draining
SAPP (2.33 kg)
Drying Moisture (1,170 kg)
Packaging
Storing & Transportation
Moisture (630 kg)
Waste Oil (60 kg) Vegetable Oil (210 kg)
IQF Freezing
PE Films (35 kg)
Box (306 Pieces)
Waste SAPP (2.33 kg)
4,650 kg
Case Study-French Fries

Credit Modelling and Validation Seminar
Tiran, Albania, 10-11 November 2014
50
Working Capital
Case Study-French Fries
Working Capital Requirement at Full Capacity
ITEMS MATURITY
(DAYS)
1. RAW MATERIALS 150
2. AUXILIARY MATERIALS 30
3. SUPPLIES 30
4. FINISHED PRODUCT 15
5. WORK IN PROGRESS 0
6. FUEL 30
7. ACCOUNTS
RECEIVABLE 45
8. CASH IN HAND 30
TOTAL (USD)
ANNUAL COST
(FIXED)
ANNUAL COST
(VARIABLE)
0 6.508.800
0 1.486.800
0 831.180
609.849 10.180.341
0 0
44.650 401.850
609.849 10.396.145
565.199 1.167.515
1.829.546 30.972.630

Credit Modelling and Validation Seminar
Tiran, Albania, 10-11 November 2014
51
Working Capital
Working Capital Requirement at Full Capacity
Case Study-French Fries
ANNUAL WORKING CAPITAL AT FULL CAPACITY (USD)
ITEMS MATURITY
(DAYS)
ANNUAL COST
(FIXED)
ANNUAL COST
(VARIABLE)
WORKING
CAPITAL (FIXED)
WORKING
CAPITAL
(VARIABLE)
TOTAL WORKING
CAPITAL
1. RAW MATERIALS 150 0 6.508.800 0 2.712.000 2.712.000
2. AUXILIARY MATERIALS 30 0 1.486.800 0 123.900 123.900
3. SUPPLIES 30 0 831.180 0 69.265 69.265
4. FINISHED PRODUCT 15 609.849 10.180.341 25.410 424.181 449.591
5. WORK IN PROGRESS 0 0 0 0 0 0
6. FUEL 30 44.650 401.850 3.721 33.488 37.208
7. ACCOUNTS RECEIVABLE 45 609.849 10.396.145 76.231 1.299.518 1.375.749
8. CASH IN HAND 30 565.199 1.167.515 47.100 97.293 144.393
TOTAL (USD) 1.829.546 30.972.630 152.462 4.759.644 4.912.106
(6.508.800/360)*150=2.712.000

Credit Modelling and Validation Seminar
Tiran, Albania, 10-11 November 2014
52
Working Capital
Calculation of Working Capital Requirements/Additional Working Capital
CUR
WCR
%40 %60
A
B

Credit Modelling and Validation Seminar
Tiran, Albania, 10-11 November 2014
53
Working Capital
Calculation of Working Capital Requirements/Additional Working Capital
CUR
WCR
%40 %60
A
B

Credit Modelling and Validation Seminar
Tiran, Albania, 10-11 November 2014
54
Working Capital
Calculation of Working Capital Requirements/Additional Working Capital
ANNUAL WORKING CAPITAL NEEDS (USD)
(By Capacity Utilization Ratio)
YEARS CAPACITY UTILIZATION RATIO WORKING
CAPITAL NEEDS CUMULATIVE
3 60% 3.008.249 3.008.249
4 65% 237.982 3.246.231
5 70% 237.982 3.484.213
6 75% 237.982 3.722.105
7 80% 237.982 3.959.997
Case Study-French Fries
(4.759.644*0.60)+152.462=3.008.248

Credit Modelling and Validation Seminar
Tiran, Albania, 10-11 November 2014
55
END OF SESSION III
Comments ???
Questions ???

Credit Modelling and Validation Seminar
Tiran, Albania, 10-11 November 2014
56
GROUP WORKING

57
Objective
Evaluate the competitiveness of the sector/product
Assess the competitors and business environment (foreign&domestic)
Predict the performance of the company
Decide if the company would be operate effectively and efficiently
Credit Modelling and Validation Seminar
Tiran, Albania, 10-11 November 2014
Economic Analysis- Sector Appraisal

58
ECONOMIC ANALYSIS
SE
CT
OR
AL
AN
ALY
SIS
FIR
M A
NA
LYS
IS
SP
AT
IAL
AN
ALY
SIS
Credit Modelling and Validation Seminar
Tiran, Albania, 10-11 November 2014
Economic Analysis – Sector Appraisal

59
CURRENT CONDITIONS OF SECTOR
1. # and Capacity of Producers (Ton, Number, Meter etc)
2. Production Amount
3. Capacity Utilization Ratios
5. Domestic Demand
ECONOMIC APPRAISAL
1. Input Prices and Input Conditions
2. Output Prices and Market Conditions
3. Projected CUR for the Firm
POTENTIAL OF SECTOR
1. Expectation on Installed Capacity
2. Expectation on Domestic Demand
3. Import Projections
4. Export Projections
FIRM ANALYSIS
1. Current Position in Sector
2. Competition
3. Orders
4. Sales (production) Forecasting
Credit Modelling and Validation Seminar
Tiran, Albania, 10-11 November 2014
Economic Analysis – Sector Appraisal

60
Main Steps
Sectoral Assessment
Forecasting, Estimating and Projecting
Firm Based Evaluation
Collecting Data
Projections Concerned with the Firm
Credit Modelling and Validation Seminar
Tiran, Albania, 10-11 November 2014
Economic Analysis – Sector Appraisal

61
Scope of Market
Analysis
Market and Client
Analysis
• Market Figures
• Qualification of Goods&Services
• # of Clients
• Consumer Income
• Future Demand
Market and Producers
(Competitors) Analysis
• # of Firms
• Installed (and projected) Capacity
• Production Figures
• Amount and Characteristics of Import
• Amount and Characteristics of Export
Credit Modelling and Validation Seminar
Tiran, Albania, 10-11 November 2014
Market Analysis

62
What We Produce and for Whom?
OUTPUTS
• Input Prices
• Input Supply Conditions
• Output Prices (Selling Prices)
• Selling Conditions (Maturity)
• Projected Capacity Utilization Ratios for the
Firm
INPUTS
• Operating Costs at Full Capacity (Technical App.)
• Working Capital Requirement (Technical App.)
• Operating Income at Full Capacity (Technical App.)
• Cost of Goods Sold (Financial App.)
• Income Statement (Financial App.)
• Cash Flow Statement (Financial App.)
Credit Modelling and Validation Seminar
Tiran, Albania, 10-11 November 2014
63
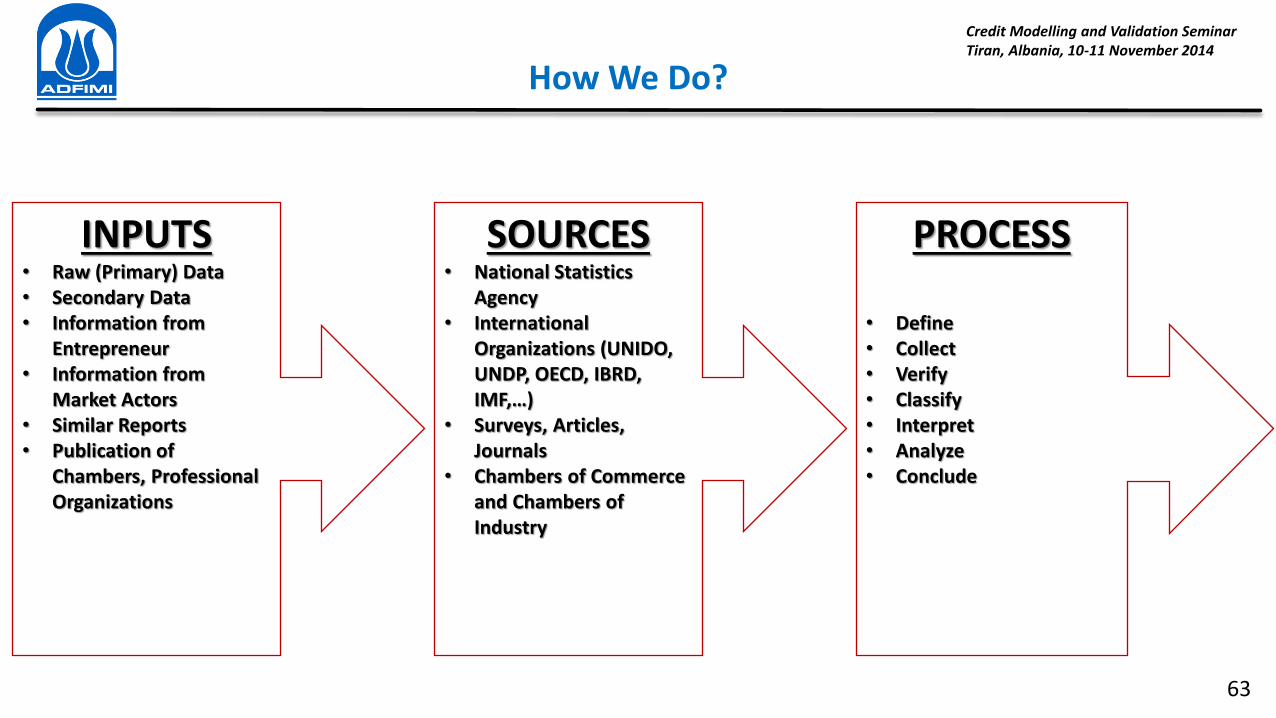
How We Do?
INPUTS • Raw (Primary) Data
• Secondary Data
• Information from
Entrepreneur
• Information from
Market Actors
• Similar Reports
• Publication of
Chambers, Professional
Organizations
SOURCES • National Statistics
Agency
• International
Organizations (UNIDO,
UNDP, OECD, IBRD,
IMF,…
• Surveys, Articles,
Journals
• Chambers of Commerce
and Chambers of
Industry
PROCESS
• Define
• Collect
• Verify
• Classify
• Interpret
• Analyze
• Conclude
Credit Modelling and Validation Seminar
Tiran, Albania, 10-11 November 2014
64
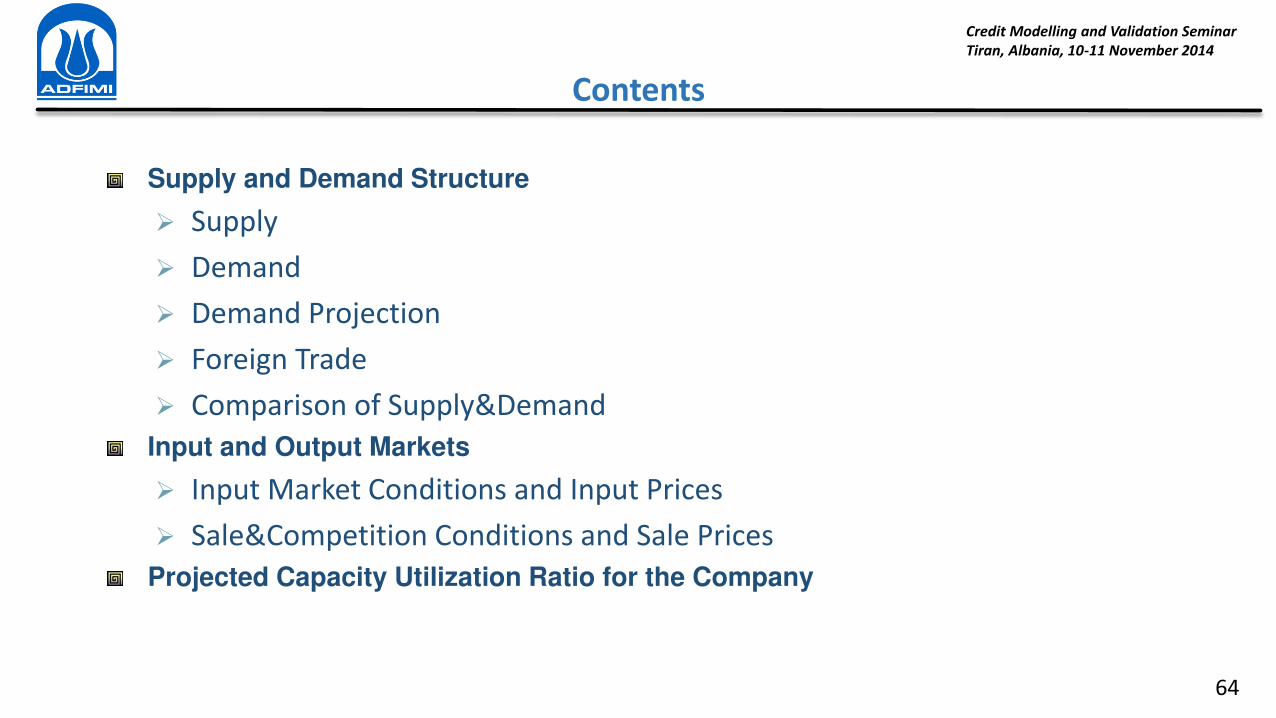
Contents
Supply and Demand Structure
Supply
Demand
Demand Projection
Foreign Trade
Comparison of Supply&Demand
Input and Output Markets
Input Market Conditions and Input Prices
Sale&Competition Conditions and Sale Prices
Projected Capacity Utilization Ratio for the Company
Credit Modelling and Validation Seminar
Tiran, Albania, 10-11 November 2014

65
Supply and Demand Analysis (S&D)
Both for current and future period
The components of the supply and demand must be analyzed
Both for domestic and foreign markets and clients
Credit Modelling and Validation Seminar
Tiran, Albania, 10-11 November 2014

66
Supply Analysis
SUPPLY (INSTALLED CAPACITY, PRODUCTION, CUR, EXPECTATION ON INSTALLED CAPACITY)
Scope: Obtaining actual and projected total potential supply figures
First Phase: Defining actual total installed capacity of the firms in the sector
Second Phase: Defining sectoral production and CUR for the current and past period
Third Phase: Estimating future period installed capacity
Credit Modelling and Validation Seminar
Tiran, Albania, 10-11 November 2014

67
Supply Analysis (For Market)
CAPACITY UTILIZATION RATIO (CUR)
ACTUAL
PRODUCTION
INSTALLED
CAPACITY CUR (%)
Credit Modelling and Validation Seminar
Tiran, Albania, 10-11 November 2014

68
Supply Analysis (Expected Installed Capacity)
Scope: Estimating installed capacity for the next period
Method 1: Calculating capacity increase by defining investment projects which have
Investment Incentive Certificate
Method 2: Estimating next period installed capacity by using past period trend
Data Source : Ministry of Economy, Directorate of Incentive Implementation and Foreign
Investments
Credit Modelling and Validation Seminar
Tiran, Albania, 10-11 November 2014
69
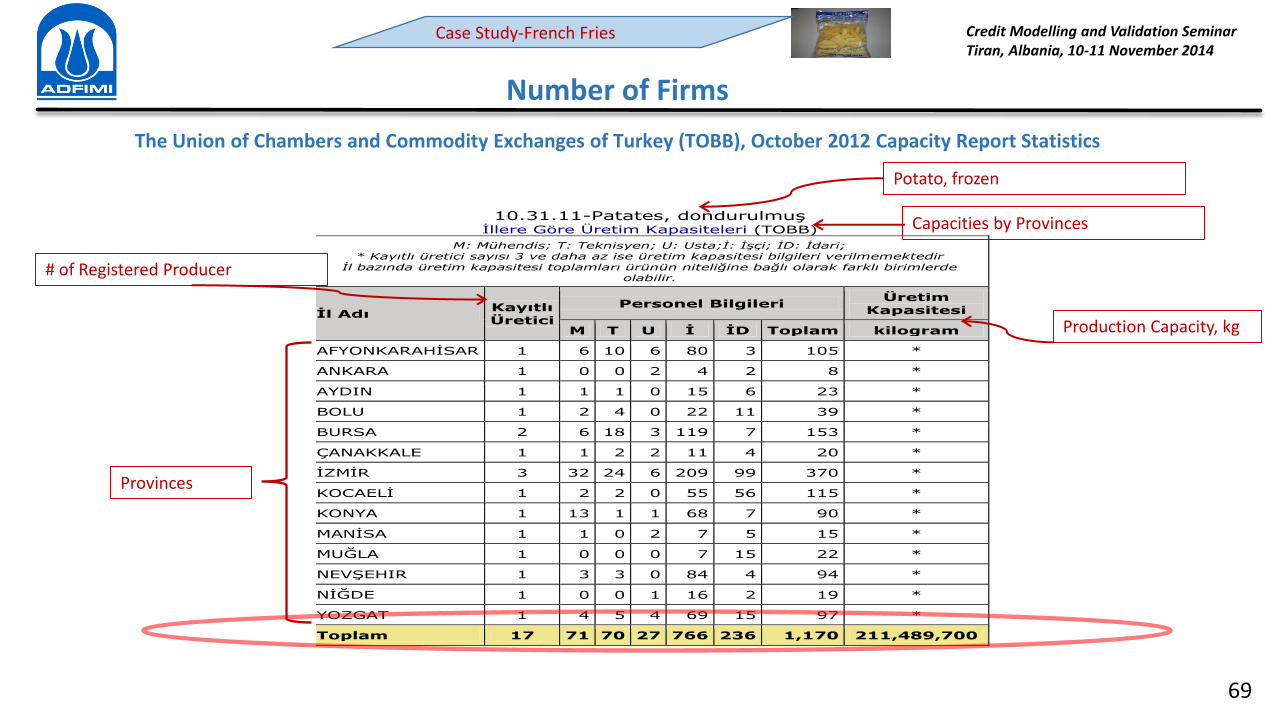
Number of Firms
The Union of Chambers and Commodity Exchanges of Turkey (TOBB), October 2012 Capacity Report Statistics
10.31.11-Patates, dondurulmuş
İllere Göre Üretim Kapasiteleri (TOBB)
M: Mühendis; T: Teknisyen; U: Usta;İ: İşçi; İD: İdari; * Kayıtlı üretici sayısı 3 ve daha az ise üretim kapasitesi bilgileri verilmemektedir
İl bazında üretim kapasitesi toplamları ürünün niteliğine bağlı olarak farklı birimlerde olabilir.
İl Adı Kayıtlı Üretici
Personel Bilgileri Üretim
Kapasitesi
M T U İ İD Toplam kilogram
AFYONKARAHİSAR 1 6 10 6 80 3 105 *
ANKARA 1 0 0 2 4 2 8 *
AYDIN 1 1 1 0 15 6 23 *
BOLU 1 2 4 0 22 11 39 *
BURSA 2 6 18 3 119 7 153 *
ÇANAKKALE 1 1 2 2 11 4 20 *
İZMİR 3 32 24 6 209 99 370 *
KOCAELİ 1 2 2 0 55 56 115 *
KONYA 1 13 1 1 68 7 90 *
MANİSA 1 1 0 2 7 5 15 *
MUĞLA 1 0 0 0 7 15 22 *
NEVŞEHIR 1 3 3 0 84 4 94 *
NİĞDE 1 0 0 1 16 2 19 *
YOZGAT 1 4 5 4 69 15 97 *
Toplam 17 71 70 27 766 236 1,170 211,489,700
Potato, frozen
Capacities by Provinces
Provinces
# of Registered Producer
Production Capacity, kg
Case Study-French Fries Credit Modelling and Validation Seminar
Tiran, Albania, 10-11 November 2014
70
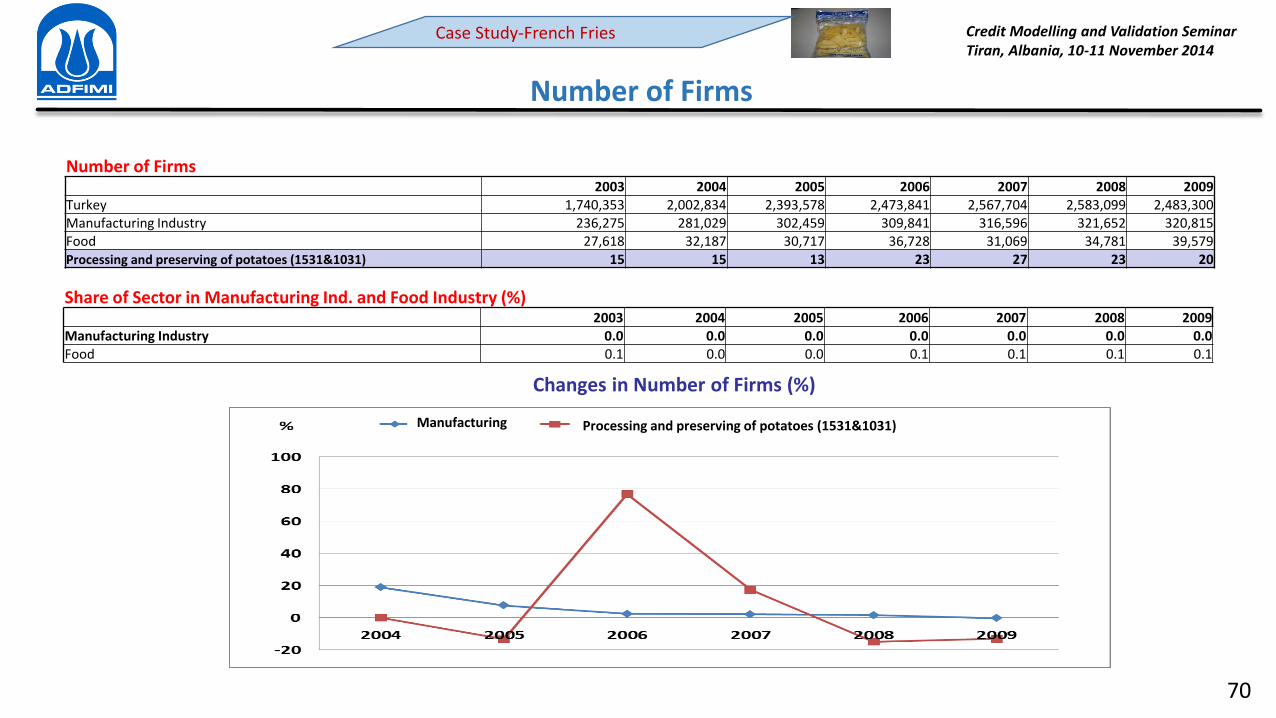
Number of Firms
Number of Firms 2003 2004 2005 2006 2007 2008 2009
Turkey 1,740,353 2,002,834 2,393,578 2,473,841 2,567,704 2,583,099 2,483,300
Manufacturing Industry 236,275 281,029 302,459 309,841 316,596 321,652 320,815
Food 27,618 32,187 30,717 36,728 31,069 34,781 39,579
Processing and preserving of potatoes (1531&1031) 15 15 13 23 27 23 20
Share of Sector in Manufacturing Ind. and Food Industry (%) 2003 2004 2005 2006 2007 2008 2009
Manufacturing Industry 0.0 0.0 0.0 0.0 0.0 0.0 0.0
Food 0.1 0.0 0.0 0.1 0.1 0.1 0.1
Changes in Number of Firms (%)
Manufacturing Processing and preserving of potatoes (1531&1031)
Case Study-French Fries Credit Modelling and Validation Seminar
Tiran, Albania, 10-11 November 2014

71
Number of Employee
Total Employee Turkey 2003 2004 2005 2006 2007 2008 2009
Manufacturing Industry 2,181,718 2,404,342 2,583,747 2,684,240 2,776,303 2,858,485 2,584,773
Food 275,773 285,073 290,810 315,196 311,791 328,653 337,176
Processing and preserving of potatoes (1531&1031) 1,219 975 1,385 1,562 1,947 2,114 2,149
Share of Sector in Manufacturing Ind. and Food Industry (%) 2003 2004 2005 2006 2007 2008 2009
Manufacturing Industry 0.1 0.0 0.1 0.1 0.1 0.1 0.1
Food 0.4 0.3 0.5 0.5 0.6 0.6 0.6
Changes in Number of Employee (%)
Manufacturing Processing and preserving of potatoes (1531&1031)
Case Study-French Fries Credit Modelling and Validation Seminar
Tiran, Albania, 10-11 November 2014

72
Employment Index by Years
Employment Index (2005=100) 2005 2006 2007 2008 2009 2010 2011 2012 (6 m)
Manufacturing Industry 100.0 102.5 106.3 106.0 95.5 100.1 105.9 109.1
Food 100.0 104.8 111.0 116.1 118.3 124.1 128.8 132.2
Processing and preserving of potatoes (1031) 100.0 107.4 109.8 122.0 154.3 147.8 146.0 150.5
Manufacturing Processing and preserving of potatoes (1031) Food
Case Study-French Fries Credit Modelling and Validation Seminar
Tiran, Albania, 10-11 November 2014

73
Production Value
Production Value (Million TRL) 2003 2004 2005 2006 2007 2008 2009
Manufacturing Industry 224,285 285,330 311,885 379,215 414,733 477,137 420,381
Food 34,069 40,583 46,006 50,075 56,406 66,732 64,664
Processing and preserving of potatoes (1531&1031) (***) 380 (***) 459 623 665 714
Share of Sector in Manufacturing Ind. and Food Industry (%) 2003 2004 2005 2006 2007 2008 2009
Manufacturing Industry 0.1 0.1 0.2 0.1 0.2
10- Food Products 0.9 0.9 1.1 1.0 1.1
Case Study-French Fries Credit Modelling and Validation Seminar
Tiran, Albania, 10-11 November 2014

74
Development of Production Value and Production Amount of Frozen Potato
Source : Turkish Statistical Institute, Business Statistics, Annual Business Statistics, Annual Industrial Products Statistics
Years # of Firms Production Production
(Ton) Change (%) (Million TL) Change (%)
2005 6 42,756 - 61.2 -
2006 6 56,829 32.9 78.2 27.8
2007 5 73,172 28.8 112.5 43.9
2008 5 67,511 -7.7 112.7 0.2
2009 8 73,311 8.6 130.4 15.7
2010 9 101,264 38.1 182.5 40.0
Case Study-French Fries Credit Modelling and Validation Seminar
Tiran, Albania, 10-11 November 2014

75
Production Amount (Information)
A biggest firm in Konya has the share of 25 % of total market volume by the brand of Pratiko, will increase its
capacity.
This firm is the leader of the market. Last year (2011) it produced 25 K ton frozen potato, after capacity increasing
this production amount will reached 50 K ton.
Case Study-French Fries Credit Modelling and Validation Seminar
Tiran, Albania, 10-11 November 2014

76
Development of Production Index
Production Index (2005=100) 2005 2006 2007 2008 2009 2010 2011 2012 (8 m.)
Manufacturing Industry 100.0 107.2 114.4 112.7 99.9 114.3 124.8 123.5
Food 100.0 105.9 109.1 112.7 112.3 120.5 128.0 123.5
Processing and preserving of potatoes (1531&1031) 100.0 133.8 180.6 189.1 179.2 194.0 223.6 213.1
Manufacturing Processing and preserving of potatoes (1531&1031) Food
Case Study-French Fries Credit Modelling and Validation Seminar
Tiran, Albania, 10-11 November 2014

77
Turnover (Sales Revenue)
Turnover (Million TRL) 2003 2004 2005 2006 2007 2008 2009
Manufacturing Industry 230,691 298,230 328,781 397,917 435,893 499,431 449,457
10- Food Products 34,355 42,024 48,155 52,410 58,306 69,918 68,524
Processing and preserving of potatoes (1531) 446 449 507 629 731
Share of Sector in Manufacturing Ind. and Food Industry (%) 2003 2004 2005 2006 2007 2008 2009
Manufacturing Industry NA 0.1 0.1 0.1 0.1 NA 0.2
10- Food Products NA 1.1 0.9 1.0 1.1 NA 1.1
Case Study-French Fries Credit Modelling and Validation Seminar
Tiran, Albania, 10-11 November 2014

78
S&D- Demand Conditions
Scope: Defining actual level of demand and forecasting demand for the next years
First Phase: Determining demand components for both current and future period. In general,
previous period production and foreign trade figures are used and domestic and total demands
are calculated by assuming production is equal to sales.
Second Phase : Forecasting demand for the future period by employing demand forecasting
techniques.
Credit Modelling and Validation Seminar
Tiran, Albania, 10-11 November 2014

79
S&D- Demand Conditions
Actual Consumption Level (production=sale, ΔInventory generally omitted)
Domestic Market (size and structure)
Foreign Markets (size, qualification of the goods, export figures, destination countries,
target countries, selling price)
Historical background of the demand
Import Substitution Possibilities
Product Diversification Possibilities
Credit Modelling and Validation Seminar
Tiran, Albania, 10-11 November 2014

80
S&D- Demand Conditions
DEMAND
ANALYSIS
Structure & Size of Domestic Market
Increasing in Domestic Demand
Excess Domestic Demand
Structure and Size of Export Markets
Spesification of Export Goods
Possibility of Import Substitution
Possibility of Product Diversification
Size of Import
Credit Modelling and Validation Seminar
Tiran, Albania, 10-11 November 2014

81
S&D- Demand Conditions
Production Import
Domestic
Demand Production Import Export
Domestic
Demand Export
TOTAL DEMAND
Credit Modelling and Validation Seminar
Tiran, Albania, 10-11 November 2014
TOTAL SUPPLY

82
Factors Effect Frozen Potato Demand:
Frozen French
Fries Demand
POSITIVE FACTORS:
1. Increasing number of international fast-food
chains
2. Developments of tourism sector
3. Increasing ıu er of tourists
4. Urbanization
5. Increasing number of working women
6. Development of frozen chain
(increasing number of malls, supermarket chains)
7. Increasing Income level
NEGATIVE FACTORS:
1. Consuming habits
2. Possibility to get fresh potato every season
3. Income distribution
Case Study-French Fries Credit Modelling and Validation Seminar
Tiran, Albania, 10-11 November 2014

83
Domestic Demand
Production of frozen potato mainly targets domestic market, export values are negligible.
Approximately 1-2 % of production is being exported, rest of production is consumed in domestic
market. Import is also negligible.
Years Production
(Ton)
Import
(Ton)
Export
(Ton)
Domestic Consumption
(Ton) Change %
2005 42,756 505 1,842 41,419 -
2006 56,829 133 1,818 55,144 33.1
2007 73,172 299 5,411 68,060 23.4
2008 67,511 850 816 67,545 -0.8
2009 73,311 342 830 72,823 7.8
2010 101,264 212 686 100,790 38.4
Case Study-French Fries Credit Modelling and Validation Seminar
Tiran, Albania, 10-11 November 2014
84
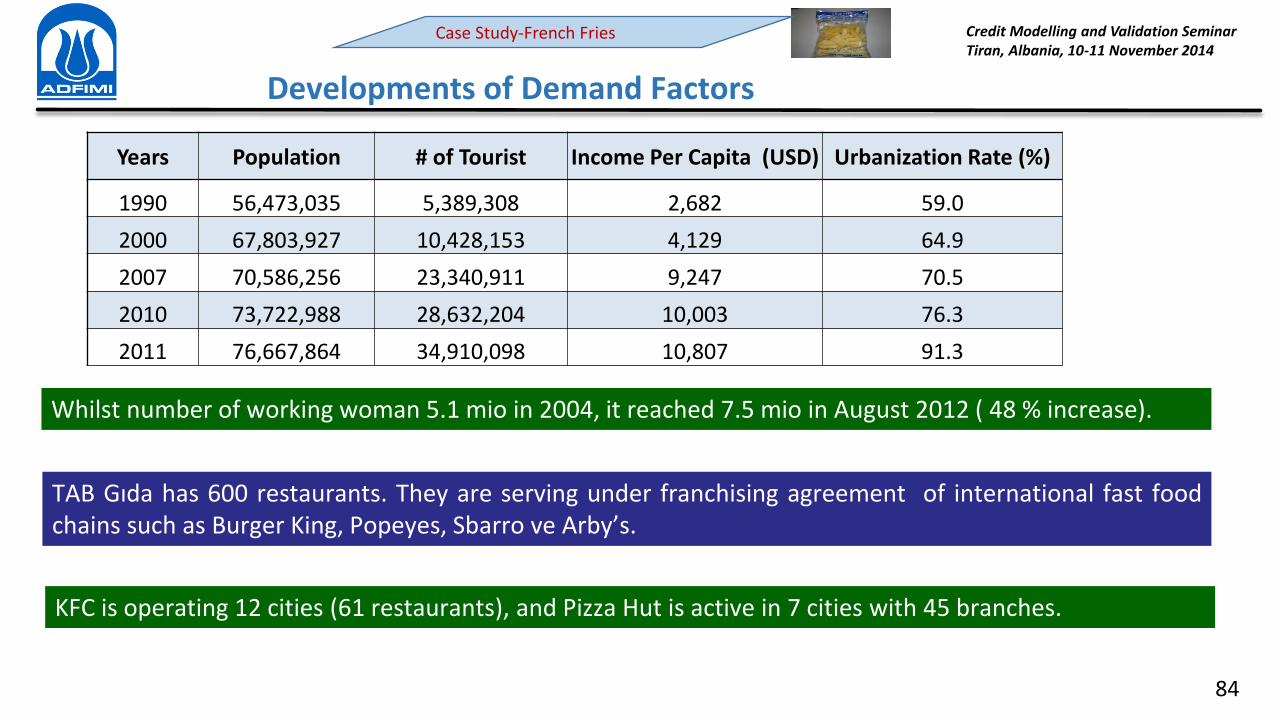
Whilst number of working woman 5.1 mio in 2004, it reached 7.5 mio in August 2012 ( 48 % increase).
TAB Gıda has 600 restaurants. They are serving under franchising agreement of international fast food
chains such as Burger King, Popeyes, Sbarro ve Ar y s.
KFC is operating 12 cities (61 restaurants), and Pizza Hut is active in 7 cities with 45 branches.
Case Study-French Fries Credit Modelling and Validation Seminar
Tiran, Albania, 10-11 November 2014
Developments of Demand Factors
Years Population # of Tourist Income Per Capita (USD) Urbanization Rate (%)
1990 56,473,035 5,389,308 2,682 59.0
2000 67,803,927 10,428,153 4,129 64.9
2007 70,586,256 23,340,911 9,247 70.5
2010 73,722,988 28,632,204 10,003 76.3
2011 76,667,864 34,910,098 10,807 91.3

85
Development of Number of Firms
NACE Classification 2003 2004 2005 2006 2007 2008 2009 Change in Period
(%)
Hotels and Motels 6,854 8,413 8,737 10,560 10,616 10,771 11,038 61.0
Restaurants, patisseries, cafes etc. 54,153 66,038 67,361 75,147 76,148 76,903 79,103 46.1
Catering firms 1,096 1,110 1,282 1,367 1,540 1,962 1,745 59.2
Case Study-French Fries Credit Modelling and Validation Seminar
Tiran, Albania, 10-11 November 2014
Developments of Demand Factors

86
S&D- Demand Forecasting Techniques
There is no "one fits all" technique
Time Series Analysis vs Cross Section Analysis (or both?, Panel Data Analysis)
Restriction of the chosen techniques (confidence level, accurate data, number of data,
econometric and statistical problems)
"Driving the Car by Looking at Rear-View Mirror" (Lucas Critique, Changes in
Individual Behavioral Pattern and Expectation, Structure of the Production)
Anyway, some mostly used techniques are;
Credit Modelling and Validation Seminar
Tiran, Albania, 10-11 November 2014
87
S&D- Demand Forecasting Techniques
Will be a boom in french fries demand.
Guess Who ?
Credit Modelling and Validation Seminar
Tiran, Albania, 10-11 November 2014

88
S&D- Demand Forecasting Techniques (cont'd)
Decomposition Analysis of Time Series, is the decompose of the any time series into
main four components, seasonal effects, trend, conjunctural effects (business cycle)
and error term
Yt = f (Trt, Snt, Clt, εt), where, • Trt is trend component,
• Snt is the seasonal component,
• Clt is the conjunctural component
• Εt is the error term.
While we assume Clt is constant (in fact, it is not, remember the Global Crisis) we may
find appropriate form of the other three components
Credit Modelling and Validation Seminar
Tiran, Albania, 10-11 November 2014

89
Trend Analysis by using OLS (demand is the function of the time, T)
Linear (Yt=β0 + β1 Tt)
Quadratic (Yt=β0 + β1 Tt + β2 Tt2 )
Exponential
S&D- Demand Forecasting Techniques (cont'd)
T
tββY 10 TβLnβY
t 10lnln
Credit Modelling and Validation Seminar
Tiran, Albania, 10-11 November 2014
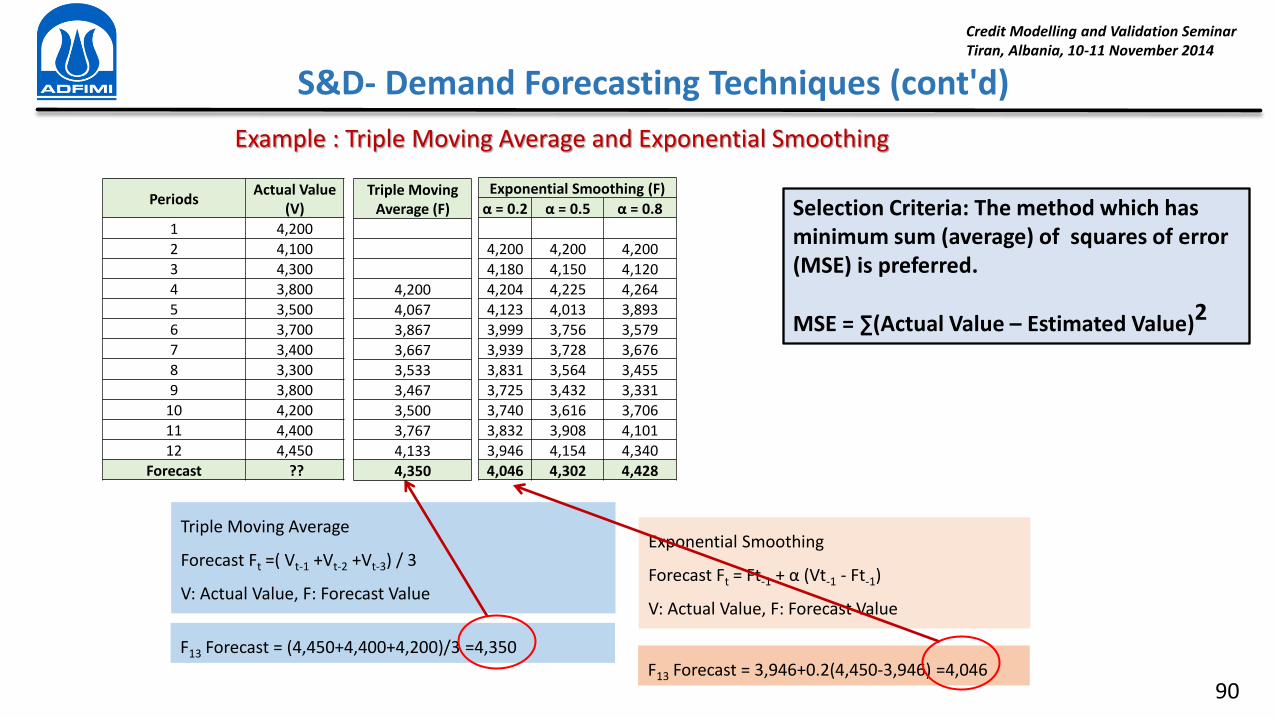
90
S&D- Demand Forecasting Techniques (cont'd)
Credit Modelling and Validation Seminar
Tiran, Albania, 10-11 November 2014
Periods Actual Value
(V)
1 4,200
2 4,100
3 4,300
4 3,800
5 3,500
6 3,700
7 3,400
8 3,300
9 3,800
10 4,200
11 4,400
12 4,450
Forecast ??
Triple Moving Average
Forecast Ft =( Vt-1 +Vt-2 +Vt-3) / 3
V: Actual Value, F: Forecast Value
Exponential Smoothing
Forecast Ft = Ft-1 + α Vt-1 - Ft-1)
V: Actual Value, F: Forecast Value
Triple Moving
Average (F)
4,200
4,067
3,867
3,667
3,533
3,467
3,500
3,767
4,133
4,350
Exponential Smoothing (F)
α = 0.2 α = 0.5 α = 0.8
4,200 4,200 4,200
4,180 4,150 4,120
4,204 4,225 4,264
4,123 4,013 3,893
3,999 3,756 3,579
3,939 3,728 3,676
3,831 3,564 3,455
3,725 3,432 3,331
3,740 3,616 3,706
3,832 3,908 4,101
3,946 4,154 4,340
4,046 4,302 4,428
F13 Forecast = (4,450+4,400+4,200)/3 =4,350
F13 Forecast = 3,946+0.2(4,450-3,946) =4,046
Example : Triple Moving Average and Exponential Smoothing
Selection Criteria: The method which has
minimum sum (average) of squares of error
(MSE) is preferred.
MSE = ∑ Actual Value – Estimated Value)2

91
S&D- Demand Forecasting Techniques (cont'd)
Credit Modelling and Validation Seminar
Tiran, Albania, 10-11 November 2014
Example ; Trend
Actual and Estimated Values
Periods Actual Value
1 4,200
2 4,100
3 4,300
4 3,800
5 3,500
6 3,700
7 3,400
8 3,300
9 3,800
10 4,200
11 4,400
12 4,450
Regression Statistics
Multiple R 0.121607264
R Square 0.014788327
Adjusted R Square -0.083732841
Standard Error 415.4970764
Observation 12
F Statistics 0.150103
P Value 0.706555
Coefficients Standard Error t Stat P-Value
Intercept 3841.666667 255.7207732 15.0229 3.45E-08
t 13.46153846 34.74561103 0.387431 0.706555
y= 3841.667+ 13.46154 t
(15.02) (0.39)
1-α = 0.95 P-Value must be < 0.05 (Confidence Interval)
Estimation
3,855
3,869
3,882
3,896
3,909
3,922
3,936
3,949
3,963
3,976
3,990
4,003
Error
345
231
418
-96
-409
-222
-536
-649
-163
224
410
447
3.000
3.250
3.500
3.750
4.000
4.250
4.500
1 2 3 4 5 6 7 8 9 10 11 12
Gerçekleşe Değer Tah i DeğeriActual Value Fitted Value (Model Estimation)

92
S&D- Demand Forecasting Techniques (cont'd)
Credit Modelling and Validation Seminar
Tiran, Albania, 10-11 November 2014
Actual and Estimated Values
Periods Actual Value
1 4,200
2 4,300
3 4,450
4 4,600
5 4,550
6 4,625
7 4,650
8 4,750
9 4,800
10 4,900
11 4,850
12 4,950
y= 4226.894+ 62.8497 t
(114.93) (12.57)
4.000
4.250
4.500
4.750
5.000
1 2 3 4 5 6 7 8 9 10 11 12
Gerçekleşe Değer Tah i Değeri
Regression Statistics
Multiple R 0.969813026
R Square 0.940537305
Adjusted R Square 0.934591036
Standard Error 59.7592538
Observation 12
F Statistics 158.1727
P Value 1.8766E-07
Coefficients Standard Error t Stat P-Value
Intercept 4226.893939 36.77928 114.926 6.1E-17
t 62.84965035 4.99732 12.57667 1.88E-07
Estimation
4,290
4,353
4,415
4,478
4,541
4,604
4,667
4,730
4,793
4,855
4,918
4,981
Error
-90
-53
35
122
9
21
-17
20
7
45
-68
-31 Actual Value Fitted Value (Model Estimation)
1-α = 0.95 P-Value must be < 0.05 (Confidence Interval)
Example ; Trend (2)

93
Econometric Models, are built for three purposes; • Structural Analysis (growth of GDP vs M1)
• Forecasting (growth of GDP vs growth of manufacturing output)
• Simulation (growth of GDP vs # of Incentive Certificates)
Commonly known and used technique is Regression Analysis (also using OLS and in
different forms)
Yt=β0 + β1 X1t + β2 X2t
Means that Y (dependent variable) is the function of X1 and X2 (explanatory-
independent variables)
S&D- Demand Forecasting Techniques (cont'd)
Credit Modelling and Validation Seminar
Tiran, Albania, 10-11 November 2014

94
Survey (questionnaire)
Leading Indicators
Elasticity of demand (income and price elasticity)
Benchmarking
Non-parametric techniques (such as Delphi)
Etc..
S&D- Demand Forecasting Techniques (cont'd)
Credit Modelling and Validation Seminar
Tiran, Albania, 10-11 November 2014

95
Demand Estimation (Consumption per capita)
Consumption of the frozen potato (as well as per capita terms) has risen by years in Turkey.
Years Mid Year Population
(Thousand) Domestic Cons. (Ton) Per capita Consump. (Kg)
2005 68,566 41,419 0.6
2006 69,395 55,144 0.8
2007 70,215 68,060 1.0
2008 71,095 67,545 1.0
2009 72,050 72,823 1.0
2010 73,003 100,790 1.4
While average per capita consumption of frozen potato in EU countries is about 20 kg, it is 50 kg in US.
The reason of having lower per capita consumption figures in Turkey is, traditional nutrition habits.
Case Study-French Fries Credit Modelling and Validation Seminar
Tiran, Albania, 10-11 November 2014

96
Mid Year Population (Thousand
Person) Per Capita Cons. (kg) Domestic Cons. (ton)
2012 74,885 1.5 112,328
2013 75,811 1.5 113,717
2014 76,707 1.5 115,061
2015 77,601 1.5 116,402
2016 78,478 1.7 133,413
2017 79,337 1.7 134,873
2018 80,173 1.7 136,294
2019 80,983 1.7 137,671
2020 81,778 1.7 139,023
Domestic Demand = Mid Year Population Estimation X Per capita Consumption
Case Study-French Fries
Demand Estimation (Consumption per capita)
Credit Modelling and Validation Seminar
Tiran, Albania, 10-11 November 2014
Credit Modelling and Validation Seminar
Tiran, Albania, 10-11 November 2014
97
END OF SESSION IV
Comments ???
Questions ???

98
Foreign Trade
Scope; Defining foreign trade components (Import&Export) which effect supply and demand
Components:
Import
Export
Import: Imported goods are crucial and good indicator of market conditions in case of;
lack of domestic supply
Huge difference between domestic and imported goods in terms of price and/or quality
Export: Export is important part of total demand and alternative market in case of volatile domestic demand
Method: Analyzing import and export figures by volume and quality
Data Source: Turkish Statistical Institute
Credit Modelling and Validation Seminar
Tiran, Albania, 10-11 November 2014

99
Export amount and value of the frozen potato is as follows according to the TSI data:
Source: TSI, Foreign Trade Statistics
Case Study-French Fries
Export (000 USD) (ISIC REV. 3)
2005 2006 2007 2008 2009 2010 2011 2012 (8 m)
Manufacturing Industry 68,813,408 80,246,109 101,081,873 125,187,659 95,449,246 105,466,686 125,962,537 94,299,792
10- Food Products 4,271,660 4,339,135 5,164,489 6,475,836 5,931,131 6,702,887 8,880,453 6,019,309
Processing and preserving of potatoes (STIC 20410) 1,423 1,484 5,401 917 912 843 2,469 1,955
Years
Export
Ton Thousand USD
2005 1,842 1,423
2006 1,818 1,484
2007 5,411 5,401
2008 816 917
2009 830 912
2010 686 843
2011 2,251 2,469
2012 1,843 1,955
Export
Credit Modelling and Validation Seminar
Tiran, Albania, 10-11 November 2014

100
Import
Import amount and value of the frozen potato is as follows according to the TSI data:
Source: TSI, Foreign Trade Statistics
Import (000 USD) (ISIC REV. 3)
2005 2006 2007 2008 2009 2010 2011 2012 (8 m)
Manufacturing Industry 94,208,255 110,378,826 133,938,136 150,252,335 111,030,525 145,366,975 183,930,287 117,034,287
10- Food Products 2,114,179 2,453,059 2,660,999 3,763,099 2,907,764 3,429,465 4,904,769 3,417,040
Processing and preserving of potatoes (STIC 20410) 517 205 510 1,344 632 366 753 1,034
Years
Import
Ton Thousand USD
2005 505 517
2006 133 205
2007 299 510
2008 850 1,344
2009 342 632
2010 212 366
2011 345 753
2012 513 1,034
Case Study-French Fries Credit Modelling and Validation Seminar
Tiran, Albania, 10-11 November 2014

101
Comparison of Supply and Demand
Scope: To determine the supply/demand balance by taking into account the current and future
levels of them.
Method: Comparing the current and future installed capacity figures by current and projected
demand figures.
Data Source: Data obtained in the supply and demand sections.
Credit Modelling and Validation Seminar
Tiran, Albania, 10-11 November 2014
102
Past performance of the sector&product (comparison of historical figures of S&D and obtaining
historical values of CUR)
Do not forget foreign trade figures (import is the part of supply and export is the component of the
demand)
Combine two part of reports (expected supply and projected demand) and obtain near future scenario
(forecasting of CUR)
Sectoral CUR is an important indicator of demand/supply surplus and a good benchmark for the
expected CUR for the firm
Comparison of Supply and Demand
Credit Modelling and Validation Seminar
Tiran, Albania, 10-11 November 2014

103
Development of Capacity Utilization Ratios
CUR (%) 2007 2008 2009 2010 2011 2012 (7 m)
Manufacturing 80.2 76.7 65.2 72.6 75.4 74.2
10 – Food Industry 76.0 73.6 68.4 70.3 70.2 70.4
Processing and preserving of fruits&vegetables (103) 68.1 64.2 60.9 62.2 62.7 60.2
Manufacturing Processing and preserving of fruits&vegetables (103) Food
Case Study-French Fries Credit Modelling and Validation Seminar
Tiran, Albania, 10-11 November 2014

104
Are the inputs (raw, auxiliary goods) depend on import
Structure of the input market (monoply, oligopoly etc.)
Restrictions on procurement (related to the level of the inventory for input)
Prices of the inputs (related to the profit margin of the firm)
Maturity of the input items (related to the working capital requirement)
Input Market and Input Prices
Credit Modelling and Validation Seminar
Tiran, Albania, 10-11 November 2014

105
Inputs and
Input Markets
RAW/AUXILIARY/WORKING MATERIALS:
Major raw materials?
Auxiliary materials?
Working materials define the final
shape/condition of goods
PROCUREMENT (SUPPLY) :
Where? (Region, other regions,import))
Structure of input market?
(Monopoly, oligopoly, perfect competition)
Problems in procurement raw materials?
INPUT PRICES AND MATURITY:
All-in cost prices of Inputs (VAT excluded)
Maturity terms in Input Market
Input Market and Input Prices
Credit Modelling and Validation Seminar
Tiran, Albania, 10-11 November 2014

106
Main raw material is potato (33,600 Ton), besides some auxiliary materials such as water, oil etc. and working
materials such as packaging materials are used in production process.
According to the target market, there are two main types of Frozen French Fries;
Standard
Mc-Fries
Product Type Target Market Sale Price Raw Quality Technology Cost Productivity Packaging
Type
Standard Quality Household Low Normal-Standard Low-Medium Low High Consumer
Mc-Fries Quality Fast food High High High High Low Industrial
Main Characteristics of Frozen French Fries
Case Study-French Fries Credit Modelling and Validation Seminar
Tiran, Albania, 10-11 November 2014
Input Market and Input Prices

107
Years
POTATO PRODUCTION IN TURKEY (TON)
Potato (Other Type) Potato (Sweet) Total
2000 5,370,000 - 5,370,000
2001 5,000,000 - 5,000,000
2002 5,200,000 - 5,200,000
2003 5,300,000 - 5,300,000
2004 4,770,000 30,000 4,800,000
2005 4,060,000 30,000 4,090,000
2006 4,366,180 31,125 4,397,305
2007 4,227,726 18,481 4,246,207
2008 4,196,522 28,646 4,225,168
2009 4,397,711 27,728 4,425,439
2010 4,513,453 34,930 4,548,383
2011 4,613,071 35,010 4,648,081
Source: TSI
Case Study-French Fries Credit Modelling and Validation Seminar
Tiran, Albania, 10-11 November 2014
Input Market and Input Prices

108 Share of potato production of Niğde province in Turkey is about 16 %.
Years
PRODUCTION (TON)
Potato
(Other Type)
Potato
(Sweet) Total
2000 1,296,020 - 24.1
2001 1,095,249 -15.5 21.9
2002 1,206,876 10.2 23.2
2003 1,293,694 7.2 24.4
2004 929,256 -28.2 19.4
2005 712,865 -23.3 17.4
2006 721,360 1.2 16.4
2007 793,401 10.0 18.7
2008 722,482 -8.9 17.1
2009 715,849 -0.9 16.2
2010 728,564 1.8 16.0
2011 731,270 0.4 15.7
Source : TSI
POTATO PRODUCTION OF NİĞDE PROVINCE
Case Study-French Fries Credit Modelling and Validation Seminar
Tiran, Albania, 10-11 November 2014
Input Market and Input Prices

109
Inputs
MAIN RAW MATERIALS:
Fresh Potato: 128 USD/Ton
Stored Potato: 220 USD/Ton
AUXILIARY MATERIALS:
Frying Oil: 1,250 USD/Ton
Sodium Acid Pryophospate: 18,000 USD/Ton
WORKING MATERIALS:
Polyethylene film: 1,500 USD/Ton
Cardboard box: 0.30 USD/Item
Maturity: All inputs paid in advance.
Case Study-French Fries Credit Modelling and Validation Seminar
Tiran, Albania, 10-11 November 2014
Input Market and Input Prices

110
Case Study-French Fries Credit Modelling and Validation Seminar
Tiran, Albania, 10-11 November 2014
Sectoral Independencies and Sectoral Interactions
VALUE ADDED CHAIN (TOTAL BACKWARD LINKAGE)
Final demand of F&B increased 1 unit
F&B sectoral output increased 1 unit to meet the increased final demand
Input requirement of F&B from other sectors, increased
Input provider sectors' (suppliers) own production increased
Suppliers needed more input to meet the new own production level,
their suppliers' production (including F&B), increased
All suppliers production increased to meet the their customer's demand

111
Case Study-French Fries Credit Modelling and Validation Seminar
Tiran, Albania, 10-11 November 2014
Sectoral Independencies and Sectoral Interactions
Sector 1 2 3 4 5 … Total
Food& Bevevarge Coefficient 1.186 0.542 0.140 0.127 0.110 …
2.498
Sector F&B Agriculture Trade Logistics Oil …
Final demand of F&B increased 1 unit
Total production in the whole economy increased 2.498 unit
VALUE ADDED CHAIN (TOTAL BACKWARD LINKAGE)

Sector 1 2 … Total
Coeff. 0.4411 0.1842 …NACE Code 0105-Agricult. 1516-F&B …Coeff. 0.3265 0.1449 …NACE Code 19-Apparel 1516-F&B …Coeff. 0.2043 0.1126 …NACE Code 1516-F&B 0105-Agricult. …
1516-F&B
19-Leather Prod.
55-Hotel&Rest.
0.7747
0.7477
0.5566
112
Case Study-French Fries Credit Modelling and Validation Seminar
Tiran, Albania, 10-11 November 2014
Sectoral Independencies and Sectoral Interactions
THREE SECTORS WHICH F&B IS THE IMPORTANT SUPPLIER
Three sectors' (F&B, Leather Products and Hotel&Restaurants) final demand increased 1 unit
Those 3 sectors increased their production to meet the increased demand
3 sectors demanded more output (supply) from the F&B (as seen on the above table, Direct Backward Linkage)
F&B production increased
F&B needed more input, F&B's input demand increased, (including from F&B, as seen on the above table)
The production of suppliers of F&B (including if any F&B) increased
INDUCED PRODUCTION INCREASE (TOTAL FORWARD LINKAGE)
Direct Backward
Linkage Coefficients

113
Case Study-French Fries Credit Modelling and Validation Seminar
Tiran, Albania, 10-11 November 2014
Legal Framework - Incentives
Regional and/or sectoral incentives, provided by local/central government, may effect
the profitability of the investment and unit cost/selling price of the products to be
produced
• Follow up laws and regulations
• The importance of correct definition of the sector and products
• The differentations of the implementation period of the incentives (during the investment period
and operating period
• International trade restrictions (tariffs, quotas, custom policies etc.)

114
Case Study-French Fries Credit Modelling and Validation Seminar
Tiran, Albania, 10-11 November 2014
Legal Framework - Incentives
INCENTIVES
INVESTMENT PHASE
1. Custom Tax Exemption
2. Investment Place Allocation
3. VAT Exception
4. Interest Rate Discount
5. Tax Deduction
"
OPERATION PHASE
1. Tax Deduction
2. Employer's Social Insurance Premium
Deduction
3. Interest Rate Discount
4. Employee's Social Insurance Premium
Deduction
INVESTMENT INCENTIVE SYSTEM IN TURKEY

115
Case Study-French Fries Credit Modelling and Validation Seminar
Tiran, Albania, 10-11 November 2014
Legal Framework - Incentives
INVESTMENT INCENTIVE SCHEME MAP
Niğde, i Region 5
116
Case Study-French Fries Credit Modelling and Validation Seminar
Tiran, Albania, 10-11 November 2014
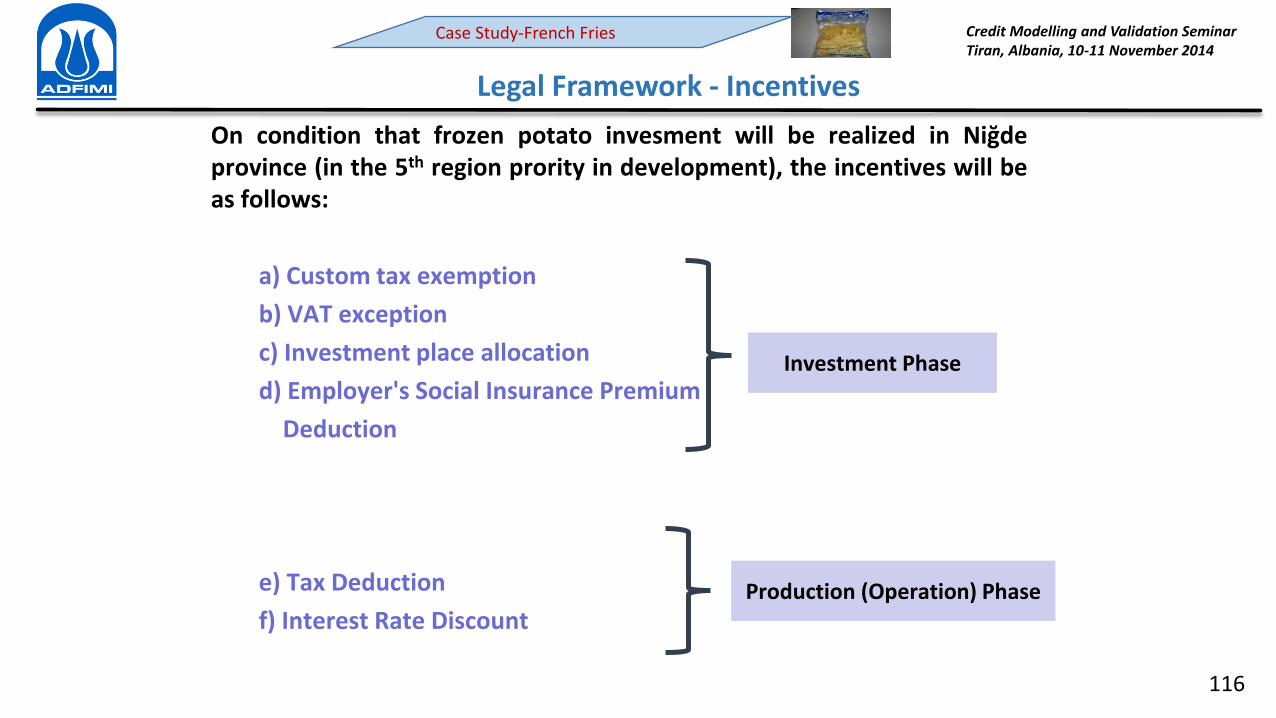
Legal Framework - Incentives
On condition that frozen potato invesment will be realized in Niğde
province (in the 5th region prority in development), the incentives will be
as follows:
a) Custom tax exemption
b) VAT exception
c) Investment place allocation
d) Employer's Social Insurance Premium
Deduction
e) Tax Deduction
f) Interest Rate Discount
Investment Phase
Production (Operation) Phase

117
Characteristic of the distribution channel in the sector
Availability of the proper conditions of the firm in terms of sale conditions in the
market
Standards of the product
Strategies of competitors
Structure of the market (monopoly, oligopoly, full competition)
Selling prices and maturity of goods to be sold
Role of the advertisement and promotion in the market
Existence of "leader firm or brand"
Has the firm any "guaranteed selling contract" agreement?
Output Market and Sale Conditions
Credit Modelling and Validation Seminar
Tiran, Albania, 10-11 November 2014

118
Selling price of frozen potato: 1,200 USD/Ton
Average maturity on sales is 45 days.
Case Study-French Fries Credit Modelling and Validation Seminar
Tiran, Albania, 10-11 November 2014
Sale Conditions

119
Concerning all the data and results obtained by the appraisal
Will define the "power of the competition" of the firm
Must be given in same terms (ratio, kg, item etc) in parallel with the technical expert
Projected CUR for the Firm
Being "septic" (not pessimistic) rather than "optimistic", is more "realistic",
considering most of the analyze depends on estimation, survey, sampling
figures….
Credit Modelling and Validation Seminar
Tiran, Albania, 10-11 November 2014

120
Installed capacity of the firm : 14,400 ton /year (2 shifts/day, 300 day/year)
Years 1st Year 2nd Year 3rd Year 4th Year 5th Year+
CUR (%) 60 65 70 75 80
Production (ton) 8,640 9,360 10,080 10,800 11,520
Case Study-French Fries Credit Modelling and Validation Seminar
Tiran, Albania, 10-11 November 2014
Projected CUR for the Firm

Credit Modelling and Validation Seminar
Tiran, Albania, 10-11 November 2014
121
END OF SESSION V
Comments ???
Questions ???

Credit Modelling and Validation Seminar
Tiran, Albania, 10-11 November 2014
122
Credit Rating/Scoring
• Scoring is to sort to the elements of a group from "the best" to "the
worsts" by means of certain criteria set.
• The relative position of the firms in the (main, pre-analysis) group
defined by this ranking.

Credit Modelling and Validation Seminar
Tiran, Albania, 10-11 November 2014
123
Credit Rating/Scoring - Aims
1. To measure the strengths of the firms in a standard
form by different criteria set
2. To compare the firms
3. Early warning
4. To monitor and manage the risk
5. To define the loan conditions (price, collateral etc)

Credit Modelling and Validation Seminar
Tiran, Albania, 10-11 November 2014
124
Credit Rating/Scoring For …..
Loan Allication Decision
Defining the Risk Level
Pricing
Collateralization
Early Warning Model

Credit Modelling and Validation Seminar
Tiran, Albania, 10-11 November 2014
125
Credit Rating/Scoring - Models
Mathematical- Statistical Models
Models Depend on Expert Judgement
Hybrid (Mixed) Models

Credit Modelling and Validation Seminar
Tiran, Albania, 10-11 November 2014
126
Credit Rating/Scoring – DBT Model
Hybrid Model
Qualitative Modules Set Up by Expert Judgements
Statistical Models Employed in Quantatitive Modules
Credit Modelling and Validation Seminar
Tiran, Albania, 10-11 November 2014
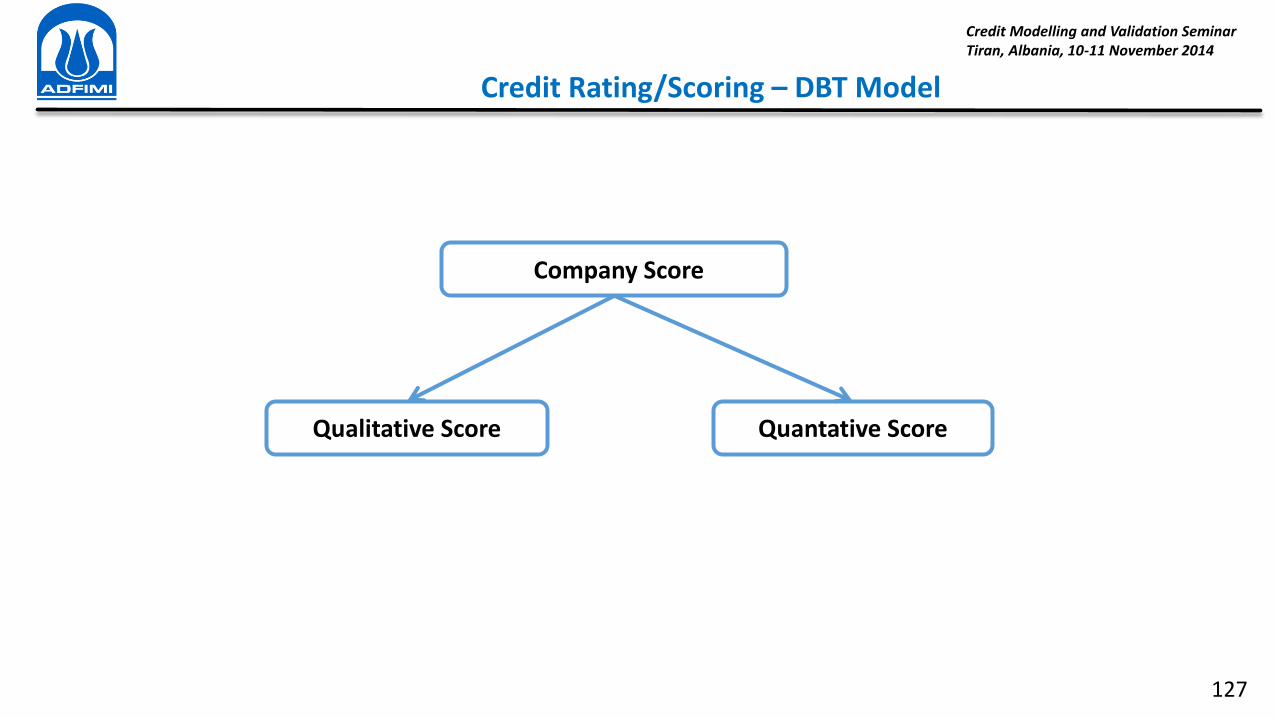
127
Credit Rating/Scoring – DBT Model
Company Score
Qualitative Score Quantative Score

Credit Modelling and Validation Seminar
Tiran, Albania, 10-11 November 2014
128
Credit Rating/Scoring – DBT Model
DBT's Qualitative Module has 9 sub modules
Shareholders Info
Management and Organization
Operating Period and Capacity
State of Business and Reputation
Conglomerate Companys
Fixed Assets (Real Estate Properties)
Company's Financial Relations
Sister Companies' Financial Relations
Legal Entity Shareholders' Assessment

Credit Modelling and Validation Seminar
Tiran, Albania, 10-11 November 2014
129
Credit Rating/Scoring – DBT Model
Qualitative Assessment Templates
State of Entity Investment Operating
Legal Entity Shareholder Exist None
Conglomerate Co. Exist None
Letter of Guarantee Exist None
Turnover ≥ 75 mio <75 mio
Co. Financing Exist None
Group Finance Exist None

Credit Modelling and Validation Seminar
Tiran, Albania, 10-11 November 2014
130
Credit Rating/Scoring – DBT Model
QUANTATIVE
ANALYSIS
Liquidity
15 %
Profitability
25 %
Financial
Structure 40 %
Activity
% 20
DBT's Quantative Module has 4 sub modules

Credit Modelling and Validation Seminar
Tiran, Albania, 10-11 November 2014
131
Credit Rating/Scoring – DBT Model
Liquidity
Profitability
Financial
Structure
Activity
3 ratios
9 ratios
5 ratios
7 ratios
TOTAL
24 RATIOS
Quantative Sub-Modules have 24 financial ratios

Credit Modelling and Validation Seminar
Tiran, Albania, 10-11 November 2014
132
Credit Rating/Scoring – DBT Model
• Defining the sector of the company
• Financial tables of the sector for 4 groups (24 ratios) (including
quartiles) accepted as charactestic table
• Company's calculated ratios convert to the score by interpolation
method (according to the ratios' relative position in the sector
characteristic table)
Quantative Sub-Modules Scoring Procedure/Algorithm
Credit Modelling and Validation Seminar
Tiran, Albania, 10-11 November 2014
133
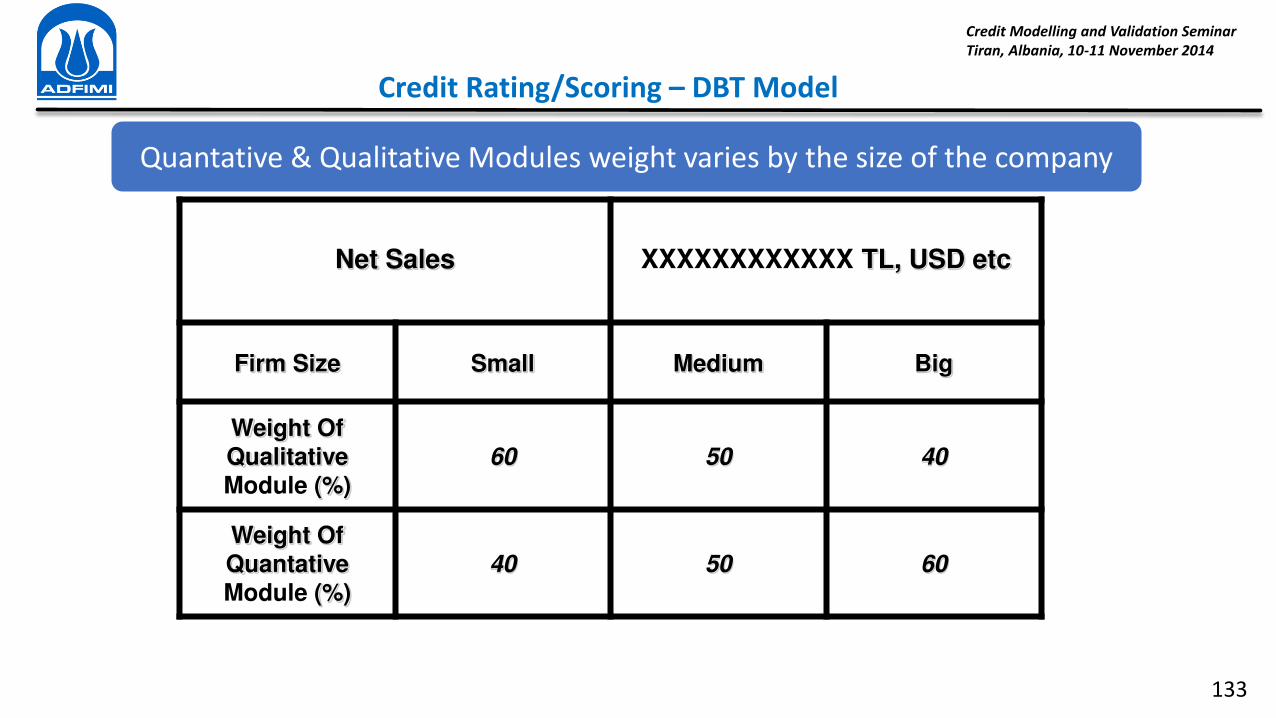
Credit Rating/Scoring – DBT Model
Net Sales
XXXXXXXXXXXX TL, USD etc
Firm Size Small Medium Big
Weight Of
Qualitative Module (%)
60
50
40
Weight Of
Quantative
Module (%)
40
50
60
Quantative & Qualitative Modules weight varies by the size of the company

Credit Modelling and Validation Seminar
Tiran, Albania, 10-11 November 2014
134
Credit Rating/Scoring – DBT Model
Rates Score Interval # of default Probability of
Default
Risk Premium
A+ 90-100 0 % 0.00 % 0.00
A- 80-90 2 % 1.32 % 0.39
A- 70-80 4 % 2.63 % 0.79
B+ 60-70 4 % 2.63 % 0.79
B- 50-60 10 % 6.58 % 1.97
B- 40-50 19 % 12.50 % 3.75
C+ 30-40 34 % 22.37 % 6.71
C- 20-30 36 % 23.68 % 7.11
C- 10-20 37 % 24.34 % 7.30
D 0-10 37 % 24.34 % 7.30
Scoring Rating Pricing Collateralizing

Credit Modelling and Validation Seminar
Tiran, Albania, 10-11 November 2014
135
Credit Rating/Scoring – Case Study
Rating # of Company
(*)
Total Loan
Amount
Average Loan
Amount # of Default
Average Loss
(**)
Total Loss
(**)
Interest Payment
(**)
Total Loss (Inc. Interest)
(**)
Risk Premium (%)
(*)
AAA 10,000 10,000,000 1,000 10 300 3,000 150 3,150 0.03
AA 5,000 10,000,000 2,000 25 600 15,000 750 15,750 0.15
A 10,000 10,000,000 1,000 80 300 24,000 1,200 25,200 0.24
BBB 20,000 10,000,000 500 400 150 60,000 3,000 63,000 0.6
BB 20,000 10,000,000 500 800 150 120,000 6,000 126,000 1.2
B 30,000 30,000,000 1,000 1,800 300 540,000 27,000 567,000 1.8
CCC 10,000 5,000,000 500 1,000 150 150,000 7,500 157,500 3
CC 5,000 1,000,000 200 600 60 36,000 1,800 37,800 3.6
C 5,000 1,000,000 200 1,000 60 60,000 3,000 63,000 6
D 1,000 200,000 200 300 60 18,000 900 18,900 9
Total 116,000 87,200,000 6,015 1,026,000 51,300 1,077,300
Notes:
(*) : At the beginning of the period
(**) : At the end of the period (in 6th month)
1. Risk free annual interest rate is assumed 10 %
2. Loss ratio on default is accepted 30 %
3. All the calculations are made semi-annually

Credit Modelling and Validation Seminar
Tiran, Albania, 10-11 November 2014
136
END OF SEMINAR
Comments ???
Questions ???

Credit Modelling and Validation Seminar
Tiran, Albania, 10-11 November 2014
137
Financial Appraisal
Purposes
Determining convenient debt/equity level of financial requirements
calculating cash flows by the years to support financial decisions

Credit Modelling and Validation Seminar
Tiran, Albania, 10-11 November 2014
138
Financial Appraisal
Basic Steps
Financial
Requirements
Financial
Resource
Amortization
Tables
Cash Flows
Analysis
Cash Flows

Credit Modelling and Validation Seminar
Tiran, Albania, 10-11 November 2014
139
Financial Appraisal
Financial Table
TOTAL FINANCIAL NEEDS CUMULATIVE 1 2
TOTAL DOMESTIC FOREIGN DOMESTIC FOREIGN DOMESTIC FOREIGN
A - Land 400.000 400.000 0 400.000 0 0 0
B - Fixed Investment 11.568.612 3.988.687 7.579.925 1.278.250 2.989.370 2.710.437 4.590.555
C - Fi a ial Costs ı terests 397.500 397.500 82.500 315.000
Total Fixed Investment 12.366.112 4.786.187 7.579.925 1.760.750 2.989.370 3.025.437 4.590.555
D -Working Capital 3.008.249 3.008.249 0 0 3.008.249 0
E - Others 717.964 717.964 230.085 0 487.879 0
TOTAL 16.092.325 8.512.400 7.579.925 1.990.835 2.989.370 6.521.565 4.590.555
TOTAL DOMESTIC FOREIGN DOMESTIC FOREIGN DOMESTIC FOREIGN
A - Equity 52%
8.342.325 7.512.400 829.925 1.990.835 239.370 5.521.565 590.555
B - Liabilities 48% 7.750.000 1.000.000 6.750.000 0 2.750.000 1.000.000 4.000.000
7.750.000 1.000.000 6.750.000 0 2.750.000 1.000.000 4.000.000
2.1 - Proposed Bank Loans 7.750.000 1.000.000 6.750.000 0 2.750.000 1.000.000 4.000.000
2.750.000 0 2.750.000 2.750.000
5.000.000 1.000.000 4.000.000 1.000.000 4.000.000
16.092.325 8.512.400 7.579.925 1.990.835 2.989.370 6.521.565 4.590.555
1-Short Term Liabilities
Kalkı a I vest e t Loa -I
CUMULATIVE
TOTAL
2-Medium and Long Term Liabilities
Kalkı a I vest e t Loa -II
TOTAL FINANCIAL SOURCES1 2
1 - Capital
• Equity available?
Factors
• Funds available?
• Any other funds?
• Project funds?
Case Study-French Fries

Credit Modelling and Validation Seminar
Tiran, Albania, 10-11 November 2014
140
Financial Appraisal
Depreciation Table
TABLE 6: DEPRECIATION COST USD
FIXED ASSETSInput
TableAmount Dep. Rate Dep. Amount
Civil Works T1 1.311.000 2,00% 26.220
Plant Machinery and Equipment T1 8.860.112 5,00% 443.006
Vehicles and Fixtures T1 387.500 25,00% 96.875
Others T1 895.000 10,00% 89.500
Total 11.453.612 655.601
Weighted Dep. Rate 5,72%
Fixed Assets to be amortised
Input
Table Amount Year Dep. Amount
Net Fixed Assets
to be amortised
1 678.353 11.172.759
Fixed Investment T1 11.453.612 2 678.353 10.494.405
Financial Cost T5 397.500 3 678.353 9.816.052
4 678.353 9.137.699
Total 11.851.112 5 678.353 8.459.345
(-) accumulated depreciation 0 6 678.353 7.780.992
7 678.353 7.102.639
Net Fixed Assets to be amortised 11.851.112 8 678.353 6.424.285
9 678.353 5.745.932
Annual Weighted Average Dep. Amount 678.353 10 678.353 5.067.578
11 678.353 4.389.225
12 678.353 3.710.872
13 678.353 3.032.518
14 678.353 2.354.165
15 678.353 1.675.812
16 678.353 997.458
17 678.353 319.105
18 319.105 (0)
Case Study-French Fries

Credit Modelling and Validation Seminar
Tiran, Albania, 10-11 November 2014
141
Financial Appraisal
Amortization Tables
LOAN AMOUNT 2.750.000 USD
DISBURSEMENT DATE
MATURITY 7 YEARS
GRACE PERIOD 2 YEARS
REMAINING DUE
06/01 2.750.000 0 0 0
12/01 2.750.000 0 82.500 82.500
06/02 2.750.000 0 82.500 82.500
12/02 2.750.000 0 82.500 82.500
06/03 2.500.000 250.000 82.500 332.500
12/03 2.250.000 250.000 75.000 325.000
06/04 2.000.000 250.000 67.500 317.500
12/04 1.750.000 250.000 60.000 310.000
06/05 1.500.000 250.000 52.500 302.500
12/05 1.250.000 250.000 45.000 295.000
06/06 1.000.000 250.000 37.500 287.500
12/06 750.000 250.000 30.000 280.000
06/07 500.000 250.000 22.500 272.500
12/07 250.000 250.000 15.000 265.000
06/08 0 250.000 7.500 257.500
TOTAL 2.750.000 742.500 3.492.500
Interest Rate 6%
Month/YearLOAN
INTEREST TOTAL PAYMENT
Loan 1
June/First year
LOAN AMOUNT 5.000.000 USD
DISBURSEMENT DATE
MATURITY 7 YEARS
GRACE PERIOD 2 YEARS
REMAINING DUE
06/02 5.000.000 0 0 0
12/02 5.000.000 0 150.000 150.000
06/03 5.000.000 0 150.000 150.000
12/03 5.000.000 0 150.000 150.000
06/04 4.545.455 454.545 150.000 604.545
12/04 4.090.909 454.545 136.364 590.909
06/05 3.636.364 454.545 122.727 577.273
12/05 3.181.818 454.545 109.091 563.636
06/06 2.727.273 454.545 95.455 550.000
12/06 2.272.727 454.545 81.818 536.364
06/07 1.818.182 454.545 68.182 522.727
12/07 1.363.636 454.545 54.545 509.091
06/08 909.091 454.545 40.909 495.455
12/08 454.545 454.545 27.273 481.818
06/09 0 454.545 13.636 468.182
TOTAL 5.000.000 1.350.000 6.350.000
Month/YearLOAN
INTEREST TOTAL PAYMENT
6%
Loan 2
June/Second year
Case Study-French Fries
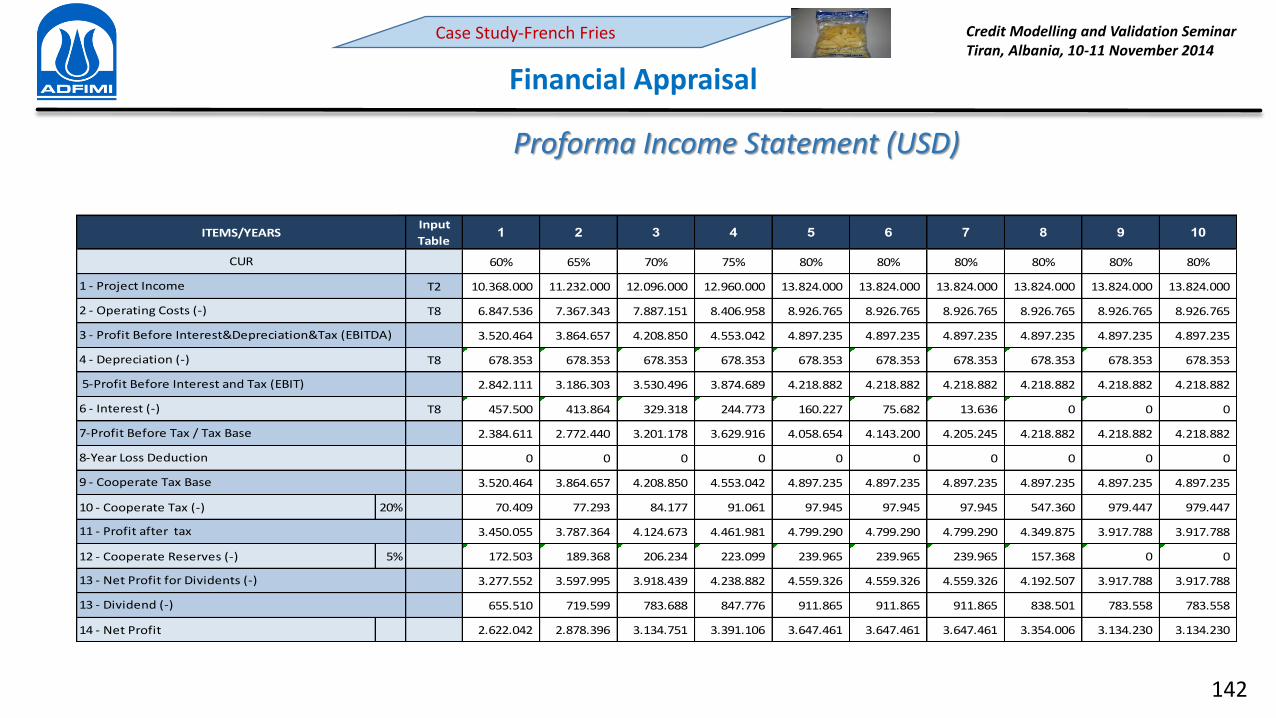
Credit Modelling and Validation Seminar
Tiran, Albania, 10-11 November 2014
142
Financial Appraisal
Proforma Income Statement (USD)
TABLE 9: PROFORMA INCOME STATEMENT (USD)
Input
Table1 2 3 4 5 6 7 8 9 10
60% 65% 70% 75% 80% 80% 80% 80% 80% 80%
T2 10.368.000 11.232.000 12.096.000 12.960.000 13.824.000 13.824.000 13.824.000 13.824.000 13.824.000 13.824.000
T8 6.847.536 7.367.343 7.887.151 8.406.958 8.926.765 8.926.765 8.926.765 8.926.765 8.926.765 8.926.765
3.520.464 3.864.657 4.208.850 4.553.042 4.897.235 4.897.235 4.897.235 4.897.235 4.897.235 4.897.235
T8 678.353 678.353 678.353 678.353 678.353 678.353 678.353 678.353 678.353 678.353
2.842.111 3.186.303 3.530.496 3.874.689 4.218.882 4.218.882 4.218.882 4.218.882 4.218.882 4.218.882
T8 457.500 413.864 329.318 244.773 160.227 75.682 13.636 0 0 0
2.384.611 2.772.440 3.201.178 3.629.916 4.058.654 4.143.200 4.205.245 4.218.882 4.218.882 4.218.882
0 0 0 0 0 0 0 0 0 0
3.520.464 3.864.657 4.208.850 4.553.042 4.897.235 4.897.235 4.897.235 4.897.235 4.897.235 4.897.235
10 - Cooperate Tax (-) 20% 70.409 77.293 84.177 91.061 97.945 97.945 97.945 547.360 979.447 979.447
3.450.055 3.787.364 4.124.673 4.461.981 4.799.290 4.799.290 4.799.290 4.349.875 3.917.788 3.917.788
12 - Cooperate Reserves (-) 5% 172.503 189.368 206.234 223.099 239.965 239.965 239.965 157.368 0 0
3.277.552 3.597.995 3.918.439 4.238.882 4.559.326 4.559.326 4.559.326 4.192.507 3.917.788 3.917.788
655.510 719.599 783.688 847.776 911.865 911.865 911.865 838.501 783.558 783.558
14 - Net Profit 2.622.042 2.878.396 3.134.751 3.391.106 3.647.461 3.647.461 3.647.461 3.354.006 3.134.230 3.134.230
1 - Project Income
CUR
6 - Interest (-)
5-Profit Before Interest and Tax (EBIT)
7-Profit Before Tax / Tax Base
13 - Dividend (-)
13 - Net Profit for Dividents (-)
ITEMS/YEARS
2 - Operating Costs (-)
3 - Profit Before Interest&Depreciation&Tax (EBITDA)
8-Year Loss Deduction
9 - Cooperate Tax Base
11 - Profit after tax
4 - Depreciation (-)
Case Study-French Fries

Credit Modelling and Validation Seminar
Tiran, Albania, 10-11 November 2014
143
Financial Appraisal
Proforma Cash Flow Statement (USD) TABLE 10: PROFORMA CASH FLOW STATEMENT
Input
Table1 2 3 4 5 6 7 8 9 10
CUR 60% 65% 70% 75% 80% 80% 80% 80% 80% 80%
9.524.731 11.293.939 11.988.000 12.852.000 13.716.000 13.824.000 13.824.000 13.824.000 13.824.000 13.824.000
9.072.000 11.124.000 11.988.000 12.852.000 13.716.000 13.824.000 13.824.000 13.824.000 13.824.000 13.824.000
Gross Revenues T2 10.368.000 11.232.000 12.096.000 12.960.000 13.824.000 13.824.000 13.824.000 13.824.000 13.824.000 13.824.000
Accounts Reciviable (-) T3 1.296.000 108.000 108.000 108.000 108.000 0 0 0 0 0
T1 452.731 169.939
7.203.262 10.090.573 10.596.807 11.103.041 11.371.293 11.171.348 10.404.757 9.936.575 10.312.627 10.689.770
T3 237.982 237.982 237.982 237.982 0
6.007.779 7.303.716 7.823.523 8.343.331 8.863.138 8.926.765 8.926.765 8.926.765 8.926.765 8.926.765
Gross Operating Costs T4 6.847.536 7.367.343 7.887.151 8.406.958 8.926.765 8.926.765 8.926.765 8.926.765 8.926.765 8.926.765
Accounts Reciviable (-) T3 839.757 63.627 63.627 63.627 63.627 0 0 0 0 0
0 725.920 796.892 867.865 938.837 1.009.810 1.009.810 1.009.810 1.385.862 1.763.005
T9 0 70.409 77.293 84.177 91.061 97.945 97.945 97.945 547.360 979.447
T9 0 655.510 719.599 783.688 847.776 911.865 911.865 911.865 838.501 783.558
957.500 1.822.955 1.738.409 1.653.864 1.569.318 1.234.773 468.182 0 0 0
T7 457.500 413.864 329.318 244.773 160.227 75.682 13.636 0 0 0
T7 500.000 1.409.091 1.409.091 1.409.091 1.409.091 1.159.091 454.545 0
2.321.469 1.203.366 1.391.193 1.748.959 2.344.707 2.652.652 3.419.243 3.887.425 3.511.373 3.134.230
3,42 1,66 1,80 2,06 2,49 3,15
b . Dividend
B - Cash Outflows
ITEMS/YEARS
A - Cash Inflows
1. Revenues
2 -Other Cash Inflows (Grants, VAT)
4 - Loan Payments
a . Interest
b . Installment
C - Net Cash Flow (A-B)
D - Debt-Service Coverage Ratio
1 - Working Capital Investment
2 - Net Operating Cost
3 - Financial Payments
a . Cooperation Tax
Case Study-French Fries

Credit Modelling and Validation Seminar
Tiran, Albania, 10-11 November 2014
144
Financial Appraisal
Analysis Based on Cash Flows
Techniques
Ignoring
Time Value of Money
Techniques
Considaring
Time Value of Money
• Average rate of return
• Payback period
• NPV: Net Present Value
• IRR: Internal Rate of Return
• MIRR: Modified IRR

Credit Modelling and Validation Seminar
Tiran, Albania, 10-11 November 2014
145
Financial Appraisal
Average Rate of Return
This ratio represents the ratio of the average annual profit after taxes to investment amount
Total Net Incomes
-------------------------------
Number of Years
Average Rate of Return = -----------------------------------------------
Investment Amount

Credit Modelling and Validation Seminar
Tiran, Albania, 10-11 November 2014
146
Financial Appraisal
Payback Period
The pay back period gives the number of years required to recover initial cash investments
PROJECT#1
0 500.000
1 120.000
2 150.000
3 170.000
4 250.000
PROJECT#2
0 750.000
1 150.000
2 200.000
3 300.000
4 300.000
120.000
270.000
440.000
690.000
150.000
350.000
650.000
950.000
3 Years + 3 Months 3 Years + 4 Months

Credit Modelling and Validation Seminar
Tiran, Albania, 10-11 November 2014
147
Financial Appraisal
Net Present Value
NPV is a discounted cash flow approach to capital budgeting. In this method all cash flows by the years are
discounted to present value, using the required rate of return.

Credit Modelling and Validation Seminar
Tiran, Albania, 10-11 November 2014
148
Financial Appraisal
Internal Rate of Return
Internal Rate of Return (IRR) is a discount rate that equates the present value of the expected cash inflows
with present value of the expected outflows.
IRR expresses itself as a percentage measure of project performance; it also provides a useful tool to
measure headroo when negotiating with suppliers of funds.

Credit Modelling and Validation Seminar
Tiran, Albania, 10-11 November 2014
149
Financial Appraisal
NPV or IRR?
• On theoretical view NPV is better approach for financial decisions.
• Since business people interest rate of return rather than actual money
amounts, in practical view IRR is more valuable for financial managers.
In USA,
Researchers Walker, Burns and Denson studied 213 private manufacturing firms
with fewer than 500 employees.
• 9% used discounted cash flows
• 66% are unaware of NPV method
• 26% are familier with NPV but do not use it for several reasons

Credit Modelling and Validation Seminar
Tiran, Albania, 10-11 November 2014
150
Financial Appraisal
Modified IRR
While the internal rate of return (IRR) assumes the cash flows from a project are reinvested at the IRR, the
modified IRR assumes that positive cash flows are reinvested at the firm's cost of capital, and the initial
outlays are financed at the firm's financing cost. Therefore, MIRR more accurately reflects the cost and
profitability of a project.

Credit Modelling and Validation Seminar
Tiran, Albania, 10-11 November 2014
151
Scenario Analysis
Scenario analysis is a process of analysing possible future events by considering alternative possible
outcomes
The scenario analysis, which is a main method of projections, does not try to show one exact picture of the future
Sensitivity Analysis
Credit Modelling and Strategies

Credit Modelling and Validation Seminar
Tiran, Albania, 10-11 November 2014
152
Input prices
Sales (CUR)
Interest rate
Unplanned investments
Project Framework
Unplanned loans
Investor Framework
Macroeconomic Framework
Financial crisis
Political crisis
Ownership changing
Unregistered debts Legal Framework
Unregistered debts
Unvaluable guarantees
Changes in regulations (commercial code, tax rate, banking
regulations etc.)
Sale price
Exchange rate
Scenario Analysis
Credit Modelling and Strategies

Credit Modelling and Validation Seminar
Tiran, Albania, 10-11 November 2014
153
In Turkey Sectoral Breakdown of GDP between the Years 1998-2010 (%)
Credit Modelling and Strategies
Manufacturing & Service Sectors/Why is Service Sector is Important?
SECTORS 2005 2006 2007 2008 2009 2010 2011 2012
Services 59,4 71,6 72,4 72,6 72,6 68,8 68,5 69,4
Agriculture 11,4 8,3 7,6 7,6 8,3 9,4 9,0 8,8
Industry 29,2 20,1 20,0 19,8 19,1 21,8 22,5 21,8
Total 100,0 100,0 100,0 100,0 100,0 100,0 100,0 100,0

Credit Modelling and Validation Seminar
Tiran, Albania, 10-11 November 2014
154
Investment Amount (in $) for Create One Job (August 2014)
Agriculture Mining Manufacturing Energy Services
Investment/Per
Employee 125.764 239.299 169.239 2.133.258 153.889
Credit Modelling and Strategies
Manufacturing & Service Sectors/Why is Service Sector is Important?

Credit Modelling and Validation Seminar
Tiran, Albania, 10-11 November 2014
155
Manufacturing & Service Sectors/What is Service Sector?
Services are intangible economic activities which are commercial and has a market price.
Services are a diverse group of economic activities not directly associated with the
manufacture of goods.
They typically involve the provision of human value added in the form of labor, advice,
managerial skill, entertainment, training, intermediation and the like.
Credit Modelling and Strategies

Credit Modelling and Validation Seminar
Tiran, Albania, 10-11 November 2014
156
• The manufacturing industry came to prominence in the United States during the 19th
century.
• Spurred by technological advances that were occurring in Britain in Western Europe.
• It arose in conjunction with the advent of the steam engine, the extensive mining and use
of coal and the building of railroads.
• Manufacturing was the dominant industry sector for much of the 20th century.
• Service industry jobs have existed for centuries, the prominence of the service industry
sector is more recent.
• Beginning in the mid-1980s, service jobs such as medical, educational, food services and
hospitality, pulled even with manufacturing in the total number of jobs by category in the
United States.
• By 1999, however, the service industry employed about twice as many workers as the
manufacturing industry.
Credit Modelling and Strategies
Manufacturing & Service Sectors/Historical Perspective
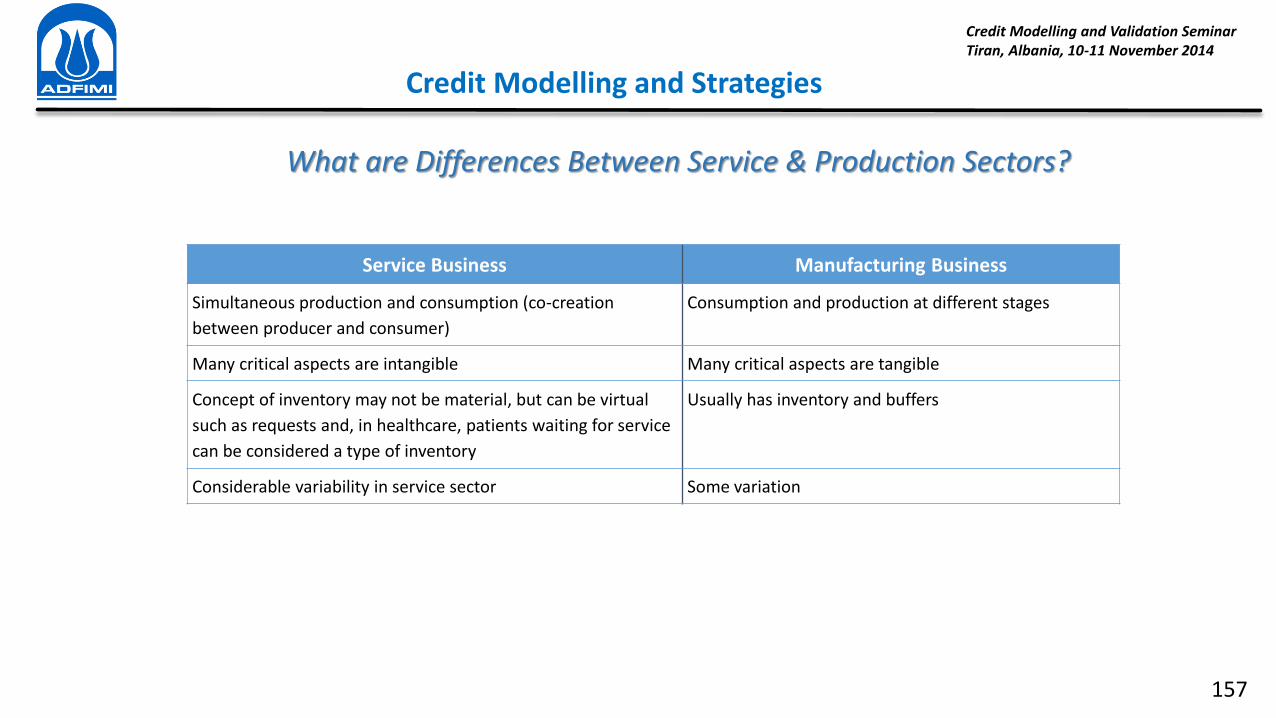
Credit Modelling and Validation Seminar
Tiran, Albania, 10-11 November 2014
157
What are Differences Between Service & Production Sectors?
Service Business Manufacturing Business
Simultaneous production and consumption (co-creation
between producer and consumer)
Consumption and production at different stages
Many critical aspects are intangible Many critical aspects are tangible
Concept of inventory may not be material, but can be virtual
such as requests and, in healthcare, patients waiting for service
can be considered a type of inventory
Usually has inventory and buffers
Considerable variability in service sector Some variation
Credit Modelling and Strategies
Credit Modelling and Validation Seminar
Tiran, Albania, 10-11 November 2014
158
A d ore…
• Calculation of the costs are not easy for suppliers compare with manufacturers.
• It is impossible to evaluate quality before supply for any service. But manufacturers can
test the quality before sell any product.
• Since the average establishment in most service industries is small, the employment per
establishment is also small
• Measurement of innovation in services, however, is not as straightforward as in
manufacturing, which makes it difficult to evaluate the extent to which it is occurring.
Credit Modelling and Strategies

Credit Modelling and Validation Seminar
Tiran, Albania, 10-11 November 2014
159
Importances of Understanding Characteristics of Service Sector
Financial Risks
Intangibility
(instability)
Intangible assets increases the risk. This can be regarded as an adverse situation for
i estor s a alysis of se urities.
Simultaneously
Production and Consumption
To ear o delay i reases the risk of suffi ie t tur o er.
Heterogeneity Due to heterogeneity, profitability may occure in long term
Variable Demand Any contraction in demand may increase the financial risk, in the situation of
unsufficient working capital.
Intensity of Labor and Relationship
Any quality losses, due to human errors, makes fragile the business and the financial
balance continuity.
Wages, social security spending and overtime expenditures must planning well in
advance and all costs must be taken into consideration while pricing.
Limited Ability to Control Quantify The Quality Quality costs and losses of labor should be controlled.
Difficult to Make Cost Calculations Pricing policies and financial monitoring must be conducted together.
Usually Close to The Market.
Proximity to market, increase the effectiveness of pricing policies.
Difficult to Define The Target Market.
It is difficult to determine the amount of optimal investment amount and number labor
For this reason it is difficult to determine the breakeven point and to ensure financial
stability.
Credit Modelling and Strategies

Credit Modelling and Validation Seminar
Tiran, Albania, 10-11 November 2014
160
Amortization Tables & Effects to Cash Flows
0
1
2
3
4
5
6
7
8
9
10
1 2 3 4 5 6 7 8 9 10 11 12 13 14 15 16 17 18 19 20 21 22 23 24 25 26 27 28 29 30
Interest Payment
Principal Repayment
Years
Mil
lio
ns
of
US
D
Grace Period Repayment of Principal
Level
(30-year maturity including 5 years of grace period)
Credit Modelling and Strategies

Credit Modelling and Validation Seminar
Tiran, Albania, 10-11 November 2014
161
Years Loan Principal Interest Total
2014 103.317.185 0 0 0
2015 103.317.185 0 12.398.062 12.398.062
2016 103.317.185 0 12.398.062 12.398.062
2017 103.317.185 17.219.531 12.398.062 29.617.593
2018 86.097.654 17.219.531 12.398.062 29.617.593
2019 68.878.123 17.219.531 10.331.718 27.551.249
2020 51.658.592 17.219.531 8.265.375 25.484.906
2021 34.439.062 17.219.531 6.199.031 23.418.562
2022 17.219.531 17.219.531 4.132.687 21.352.218
Total 103.317.185 78.521.060 181.838.245
Credit Modelling and Strategies
Amortization Tables & Effects to Cash Flows

Credit Modelling and Validation Seminar
Tiran, Albania, 10-11 November 2014
162
0
10
20
30
40
50
60
70
80
90
100
110
1 2 3 4 5 6 7 8 9 10 11 12 13 14 15 16 17 18
Interest Payment
Principal Repayment
Years
Mill
ions
of U
SD
Bullet
(18-year)
Credit Modelling and Strategies
Amortization Tables & Effects to Cash Flows
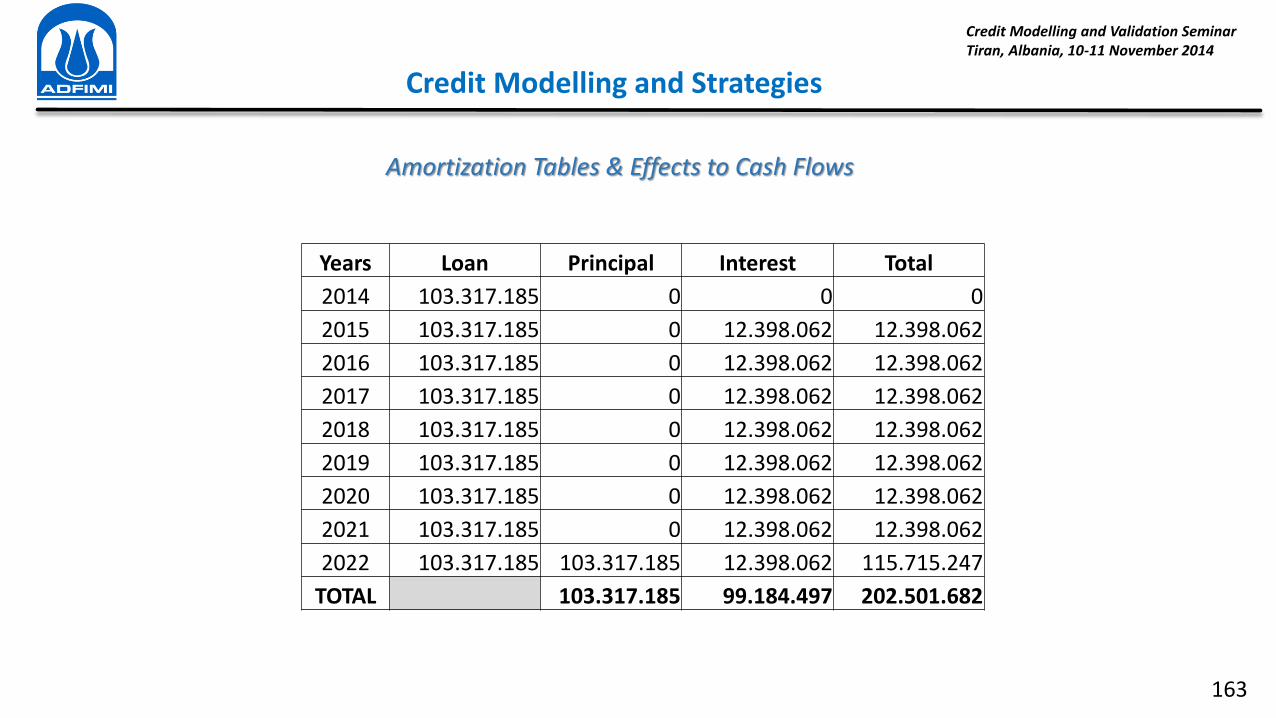
Credit Modelling and Validation Seminar
Tiran, Albania, 10-11 November 2014
163
Years Loan Principal Interest Total
2014 103.317.185 0 0 0
2015 103.317.185 0 12.398.062 12.398.062
2016 103.317.185 0 12.398.062 12.398.062
2017 103.317.185 0 12.398.062 12.398.062
2018 103.317.185 0 12.398.062 12.398.062
2019 103.317.185 0 12.398.062 12.398.062
2020 103.317.185 0 12.398.062 12.398.062
2021 103.317.185 0 12.398.062 12.398.062
2022 103.317.185 103.317.185 12.398.062 115.715.247
TOTAL 103.317.185 99.184.497 202.501.682
Credit Modelling and Strategies
Amortization Tables & Effects to Cash Flows

Credit Modelling and Validation Seminar
Tiran, Albania, 10-11 November 2014
164
0
1
2
3
4
5
6
7
8
9
10
1 2 3 4 5 6 7 8 9 10 11 12 13 14 15 16 17 18 19 20 21 22 23 24 25
Interest Payment
Principal Repayment
Years
Mill
ion
s o
f U
SD
Grace PeriodRepayment of Principal
Annuity
(25-year maturity including 8 years of grace period)
Credit Modelling and Strategies
Amortization Tables & Effects to Cash Flows

Credit Modelling and Validation Seminar
Tiran, Albania, 10-11 November 2014
165
Loan Interest Principal Total
0 100.000 0
1 92.954 3.000 7.046 10.046
2 85.696 2.789 7.258 10.046
3 78.221 2.571 7.475 10.046
4 70.521 2.347 7.700 10.046
5 62.591 2.116 7.931 10.046
6 54.422 1.878 8.168 10.046
7 46.009 1.633 8.414 10.046
8 37.343 1.380 8.666 10.046
9 28.417 1.120 8.926 10.046
10 19.223 853 9.194 10.046
11 9.754 577 9.470 10.046
12 0 293 9.754 10.046
20.555 100.000 120.555
Loan Amount : 100.000 TL
Interest Rate : 3% Monthly
Duration : 12 Months
Amortization Tables & Effects to Cash Flows
P. (1 + i)n * i A = -----------------------------
[ (1 + i)n - 1 ]
Credit Modelling and Strategies

Credit Modelling and Validation Seminar
Tiran, Albania, 10-11 November 2014
166
0
2
4
6
8
10
12
14
1 2 3 4 5 6 7 8 9 10 11 12 13 14 15 16 17 18 19 20 21 22 23 24 25 26 27 28 29 30
Interest Payment
Principal Repayment
No payments
Years
Mill
ion
s o
f U
SD
Grace Period
Credit Modelling and Strategies
Amortization Tables & Effects to Cash Flows

Credit Modelling and Validation Seminar
Tiran, Albania, 10-11 November 2014
167
Years Loan Principal Interest Total
2015 103.317.185 0 12.398.062 12.398.062
2016 103.317.185 0 12.398.062 12.398.062
2017 103.317.185 17.219.531 12.398.062 29.617.593
2018 86.097.654 17.219.531 12.398.062 29.617.593
2019 68.878.123 17.219.531 10.331.718 27.551.249
2020 51.658.592 17.219.531 8.265.375 25.484.906
2021 34.439.062 17.219.531 6.199.031 23.418.562
2022 17.219.531 17.219.531 4.132.687 21.352.218
Total 103.317.185 78.521.060 181.838.245
Credit Modelling and Strategies
Capitalization
Years Loan Principal Interest Total
2015 103.317.185 0 0 0
2016 115.715.247 0 0 0
2017 129.601.077 21.600.179 15.552.129 37.152.309
2018 108.000.897 21.600.179 12.960.108 34.560.287
2019 86.400.718 21.600.179 10.368.086 31.968.266
2020 64.800.538 21.600.179 7.776.065 29.376.244
2021 43.200.359 21.600.179 5.184.043 26.784.223
2022 21.600.179 21.600.179 2.592.022 24.192.201
Total 129.601.077 54.432.452 184.033.529
(115.715.247*0,12)+115.715.247 103.317.185+12.398.062

Credit Modelling and Validation Seminar
Tiran, Albania, 10-11 November 2014
168
END OF SESSION VI
Comments ???
Questions ???

Credit Modelling and Validation Seminar
Tiran, Albania, 10-11 November 2014
169
GROUP WORKING

Credit Modelling and Validation Seminar
Tiran, Albania, 10-11 November 2014
170
Thank you for your attention, patience and contributions
Dr. Oktay Küçükkiremitçi [email protected] +90-312 4182167
M. “erdar Ka ukçuoğlu [email protected] +90-312 4187209
![pET Express & Purify Kits User Manual - Takara Bio Manual/PT5018-1.pdf15 µl pET6xHN-C Vector (In-Fusion Ready) [100 ng/µl] 10 µl pET6xHN-GFPuv Vector [500 ng/µl] 15 µl 1.1 kb](https://img.pdfslide.us/doc/110x75/5e7b57982623d66a901d15a7/pet-express-purify-kits-user-manual-takara-bio-manualpt5018-1pdf-15-l.jpg)

![1.Set up 110 µl mix for each primer/DNA combo on ice! 1.1.1 µl 100x F primer (1 pMol/µl = 1µM final []) 2.1.1 µl 100x R primer 3.11 µl 10x PCR buffer 4.2.2](https://img.pdfslide.us/doc/110x75/56649ce05503460f949aa81d/1set-up-110-l-mix-for-each-primerdna-combo-on-ice-111-l-100x-f-primer.jpg)