Embed Size (px)
Citation preview

ADVISORY BOARD OF INDIAN EDUCATIONAL REVIEW
PROFESSOR G. RAVINDRA
DirectorNCERT, Sri Aurobindo Marg, New Delhi 110 016
Members
PROFESSOR ANGELA LITTLE
Institute of EducationUniverisity of London20 Bedford WayLondon WCI HOALUnited Kingdoms
PROFESSOR D.N. DHANAGARE
B-7, Divya Kunj Apartment1076, Gokhale RoadModel Colony P.O.Pune 411 016, India
PROFESSOR GEETHA NAMBISSAN
Jawahar Lal Nehru UniversityNew Delhi 110 067, India
PROFESSOR GOPINATHAN
Nanyang Technological UniversitySingapore 637 616
DR. HIDEAKI SHIBUYA
Tokyo Gakugei University4-1-1, Nukui-Kita-MachiKognei-shi,Tokyo, 184-8501, Japan
DR. HRIDAYA RATNA BAJRACHARYA
CERID, Tribhuvan UniversityP.O. Box No. 2161Balkhu, KathmanduNepal
DR. MALAVIKA KARLEKAR
Centre for Women’s Development Studies25, Bhai Veer Singh MargGole Market, New Delhi, India
DR. MATHEW ZACHARIAH
25, Scimitar Heath NWCalgary AB T3L 2EI, Canada
PROFESSOR M.S. YADAV
C-3/3038, Vasant KunjNew Delhi 110 070, India
PROFESSOR N. JAYARAM
Tata Institute of Social SciencesV.N. Purav Marg, DeonarMumbai 40 088, India
PROFESSOR NARGIS PANCHAPAKESAN
K-110, Hauz Khas EnclaveNew Delhi 110016, India
PROFESSOR NIRMALANGSHU MUKHERJI
Department of PhilosophyUniversity of Delhi, India
SHRI SAMIR R. NATH
BARC75, Mohakali, Dhaka, Bangladesh
PROFESSOR SWARNA WIJETUNGE
University of ColomboColombo, Sri Lanka
Academic EditorPOONAM AGRAWAL

GUIDELINES FOR AUTHORS
The articles received for publication in the IER are reviewed by oneor more referees for their relevance, clarity, length and style. Theopinion expressed in the IER does not necessarily reflect the opinionsof the National Council of Educational Research and Training. TheIER policy prohibits an author from submitting the same manuscriptfor concurrent consideration by any other publication.
Articles should be sent in English, typed in double space, on oneside of A-4 paper with sufficient margins, to the Academic Editor IER,DERPP, National Council of Educational Research and Training, SriAurobindo Marg, New Delhi 110 016, Tel 26563980 e-mail:[email protected]. All finalised articles should be submittedboth in Soft (floppy/CD) and Hard Copy format.
References should be listed at the end of the article, inalphabetical order, as follows:
LANIER, J. and LITTLE, J. 1986. Research on teacher education. InM. WITTROCK (Ed.), Handbook of Research on Teaching, 3rd ed.Macmillan, New York.
NARAYAN, JAYANTHI and AJIT, M. 1991. Development of skills in amentally retarded child: The effect of home training. Indian EducationalReview. Vol. 28. No. 3. pp. 29-41.
Diagram or line drawings should be complete and suppliedseparately, numbered neatly for identification and their position inthe text clearly indicated. Tables can be given as part of the text.Captions should be supplied wherever necessary.
In order to prepare the manuscripts, authors are requested tofollow the directions in the Publication Manual of the AmericanPsychological Association (1983, 3rd ed.). Specifically, the followingpoints may be taken care of before the typescript is sent to the editorialoffice:— Leave a margin of at least one inch on all sides of the paper.— Double space everything, including references, footnotes, tables
and figure captions.— Type the title of the work, corresponding author’s name, complete
address, phone number, fax number on a separate page afterthe title page of the manuscript.
— An abstract of the paper in not more than 120 words should besent with each manuscript.
— Authors may provide brief descriptions about themselves alongwith areas of their specialisations.
The views expressed by individual authors are their own and do notnecessarily reflect the policies of the NCERT, or the views of the editor.

CONTENTSEDITORIAL 3
RESEARCH PAPERS
Promoting Academic Competence in School Adolescents: 5Results of 15-day Life Style Intervention ProgrammeARUN PRATAP SINGH AND GIRISHWAR MISRA
Nutritional Health Status of Primary School Children 18A study in Bareilly DistrictMEHROTRA MONIKA, ARORA SANTOSH AND NAGAR VEENU
A Critical Appraisal of General Science 30Content of Class VII TextbooksSWATI SINGH
RESEARCH NOTES
Quest Over Courses of Study: 56Deciding for Teacher Rating ScaleSUDESHNA LAHIRI
The Effect of Excessive Use of 71Internet upon AdolescentsMRIDULA BHADAURIA,RASHMI GORE AND DHEERAJ PANDEY
Resources in Primary Schools: 84A Challenge for IndiaV. K. JAIN AND MAMTA AGRAWAL
A Comparative Study of Pre-Service 96Teacher Education Programme atSecondary Stage in Bangladesh,India, Pakistan and Sri LankaS.K. YADAV
HALF-YEARLY JOURNAL OF EDUCATIONAL RESEARCH
INDIAN EDUCATIONAL REVIEWVolume 48 Number 1 January 2011
ISSN 0972-561X

Less Familiar Pathways in Constructivism 111B. K. PARIDA, J. K. MOHAPATRA AND M. MAHAPATRA
Socio-Psychological Factors Influencing the 127Choice of Teaching as a Career:A Study of Post Graduate Students in DelhiVINEETA SIROHI
ERIC PROJECTS COMPLETED
Effect of Self Regulatory Strategies on 138Enhancing Teaching Competence amongB.Ed StudentsProject InvestigatorBEGUM, A. J. (2009)
Availability and Use of ICT in Schools in Delhi 140Project InvestigatorsSIDDIQUE, M. A. AND ABRAHAM, J. (2010)

EDITORIAL
Writing a research article, research paper or research notes is not merely adissemination of work, but is actually a forum to open a dialogue betweenthe work and the scholar. Research writing opens a scope for reflection,discussion and undertaking further research leading to dynamism anddevelopment. It explores new ideas, creates new knowledge and leads topersonal as well as collective professional development. Research writing ismore than any other writing as it is a communication channel between theresearcher and the outside world making the work lively. With this visionand mission, Indian Educational Review – a prestigious internationalresearch journal of NCERT strives to provide effective communication betweenthe researchers and the professionals exchanging the research experiences.
The present issue of the journal contains research papers, researchnotes and abstracts of the researches funded by ERIC. Researchers in theirpapers have probed lot of issues that may be of interest to the literaryworld. These include constructivism, academic competence of schooladolescents, nutritional and health status, science contents in books,excessive use of internet, resources in primary schools, teacher educationand factors influencing carrier choice etc. The ERIC studies include selfregulatory strategies and use of ICT facilities in the schools.
We wish a happy and prosperous new year to all our contributors, readersand the subscribers. We intend to offer a window to our readers throughwhich their ideas, views, suggestions and comments could be obtained on aregular basis. This will not only increase interaction but also provide usfeedback for further improvement of the journal. Any specific opinion orexperience on significant issues is always welcomed. We seek yourcooperation and views on improvement of the journal and research initiatives.
POONAM AGRAWAL
Academic Editor

Indian Educational ReviewIndian Educational Review aims to enhance the theory and practiceof research in education. It is a journal of opinion and research inthe field of education. Contributions may comprise scholarlydiscussion of new issues, reports of research, reviews of researchesin particular field, reports of developments, and debate on educationalresearch generally or on specific issues. Contributions are also invitedreporting all kinds of empirical research in education, whethersociological, psychological, economic or organisational. The journal isintended to cover a wide range, including interdisciplinary studies.
In addition, the purpose of this journal is to provide a medium fordissemination of educational research and exchange of experiencesamong research workers, scholars, teacher educators, teachers andothers interested in educational research and related fields andprofessions.
Indian Educational Review is published half-yearly, in January andJuly by the National Council of Educational Research and Training(NCERT), New Delhi. Copyright of the articles published in the Journalwill vest with the NCERT and requests for reproducing the materialshould be addressed to the Academic Editor. The journal is indexed inIndian Psychological Abstracts and Reviews, Sociological Abstracts andContents Pages in Education (U.K.).
Academic Editor
POONAM AGRAWAL
Publication Team
Head : NEERJA SHUKLA
Chief Production Officer : SHIV KUMAR
Chief Editor : SHVETA UPPAL
Chief Business Manager : GAUTAM GANGULY
Asstt. Editor : BIJNAN SUTAR
Asstt. Production Officer : ATUL KUMAR SAXENA
Cover Design
AMIT KUMAR SRIVASTAVA
OFFICES OF THE PUBLICATIONDEPARTMENT, NCERT
NCERT CampusSri Aurobindo MargNew Delhi 110 016 Phone: 011-26562708
108, 100 Feet RoadHosdakere Halli ExtensionBanashankari III StageBangalore 560 085 Phone: 080-26725740
Navjivan Trust BuildingP.O. NavjivanAhmedabad 380 014 Phone: 079-27541446
CWC CampusOpp. Dhankal Bus StopPanihatiKolkata 700 114 Phone: 033-25530454
CWC ComplexMaligaonGuwahati 781 021 Phone: 0361-2674869
Price: Single Copy: ` 50.00; Annual Subscription: ` 100.00

Research Papers
*Doctoral student, Department of Psychology, University of Delhi, Delhi-07**Professor, Department of Psychology, University of Delhi, Delhi-07
Promoting Academic Competence inSchool Adolescents: Results of 15-day Life
Style Intervention Programme
ARUN PRATAP SINGH* AND GIRISHWAR MISRA**
ABSTRACT
There has been paucity of theory-based life style interventions to improveacademic competence among school adolescents. Therefore, presentstudy examined the effect of Life Style Intervention Programme (LSIP)introduced through a psycho-education programme on academiccompetence in a sample (N = 100) of students in a residential schoollocated at Mankapur, Gonda in Uttar Pradesh, India. Academiccompetence (AC) was evaluated through a self-report measure. Theresults indicated that adolescents who participated in a 15-day LSIPreported of increased AC. Also, some of the aspects significant foracademic performance (i.e., self-esteem, anxiety, depression, optimism)as secondary outcomes were also assessed. The findings haveimplications for life style education efforts in schools, which could havea major impact on the academic performance of students.
Introduction
In India, the main documented concern for many ailments amongschool adolescents is for academic achievement (Deb, 2001). Eachyear, failures and lesser scores in exams than expected, consummatesthe lives of many students (National Crime Records Bureau, Ministryof Home Affairs, Government of India, 2000). For majority of schooladolescents, anxiety, depression and lack of optimism becomehallmark of periods after examination (Deb, Chatterjee & Walsh, 2010).In order to enhance academic competence and alleviate negativeeffects in academic process, existing approaches in the stream ofpsychology and other related disciplines remain preoccupied with

Promoting Academic Competence in School Adolescents...
Indian Educational Review, Vol. 48, No.1, January 20116
changing pedagogy, refining process of examination and cultivatingpsychological skills among students. While educational reforms dohave some roles to play, psychological assistance requires a greatdeal of expertise, resources and infrastructure in schools(Ponnuswami, 2000). Further, addressing concerns related to ACthrough individual counselling to larger segment of school adolescentis an arduous task. In view of limitations of traditional approaches,proactive efforts are often recognised of robust importance to dealwith multiple concerns related to academic performance (Deb, et al.,2010). Especially, due to evidences of deterioration of life style inadolescents and consequent constraints imposed in daily functioning,capacities, abilities and competence (Leventhal, Prohaska &Hirschman, 1985); it has become emergent to address it (Hans &Mahajan, 1994).
Previous studies indicate that life style practices related to Yoga(Kauts & Sharma, 2010), intake of positive food items (i.e., fruits,vegetables) (Maclellan, Taylor, Wood, 2008), appropriate sleep (Dahl& Lewin, 2002), and religious involvement (Milot & Ludden, 2008;Sharma & Sharma, 2006) may be effective in promoting competenceamong school adolescents in several areas. Several instances inreligious texts suggest that ancient school system of education(Gurukul) in India, imbibed many of life style practices in its’educational programme (Koller, 2006). A close observation of Ayurvedaby Indian and western scholars reveals that it emphasised life stylepractices related to nutrition (ahar), sleep (shayan) and use of leisurehours (vihar) for holistic development of individual (Dwivedi, 2005;Fields, 2002; Mishra, 2005; Parashar, 2000; Sastri & Chaturvedi,1989; Vidyalankar, 1968). Yet, although the idea that competence isassociated with life style practices and functioning is a not new,empirical study linking these phenomena are exceedingly limited inboth the eastern and western context.
Against this backdrop, the purpose of present study was to assessthe effectiveness of life style changes in improving AC and othersignificant variables pertaining to academic performance. BecauseAC in this study was assessed primarily within the school setting, itwas defined as adolescent’s ability to memorise, concentrate, interestin studies and learning capacity required for educationalperformance. The componential structure of LSIP was based onAyurvedic and Yogic notions of life style (Parashar, 2000; Dwivedi,2005). It was hypothesised that LSIP would promote AC in theintervention group among boys and girls both. Besides, it also would

Promoting Academic Competence in School Adolescents...
Indian Educational Review, Vol. 48, No.1, January 2011 7
enhance self-esteem and optimism while reducing the degree ofdepression and anxiety.
Module of Life Style Intervention Programme (LSIP)
The development of intervention programme (LSIP) consisted ofmultiple phases of insightful thought through literature review andalso negotiations and discussion with several concerned persons.Firstly, prominent adolescent health concerns in recent literatureand themes related to life style in Ayurvedic and Yogic texts (CharakaSamhita, Sushruta Samhita, Gita, Taitryopanisha, Chandogyopanishad,Yoga Darsan etc.) were explored. In light of this review, the researcherhimself went through self-revelations about own experiences relatedto effect of life style changes during adolescence. After that a focusgroup discussion with teachers (n = 5) and students (n = 5) in aresidential school was conducted to understand their experiences inlife. Conclusively, the detailed components of LSIP were identifiedon the basis of expert advice about their feasibility and relevance toadolescent’s health concerns. It was planned to include dietary andsleep regimen based on Ayurveda and also certain postures (Asanas),deep breathing practices (Pranayama), meditation (Dhyan), andchanting of mantras as recommended in the system of Yoga in theframework of LSIP. Many of the theoretical and practical issues relatedto capability of the participants to adhere with LSIP, school routine,and availability of adolescents for Yoga training programme were alsotaken under consideration during the rigorous process of its’development.
The operationalistion of LSIP was carried out through someinsights derived from theoretical models of behavioural change. Basedon these insights, LSIP was introduced to adolescents through animproved form of psycho education. It intended to inform, persuadeand assist the adolescents to adopt healthy dietary habit, sleeproutine, Yoga and religious practices. The processes of LSIP includedestablishment of personal rapport, increasing awareness, persuasion,orientation, assessment, training and persistence for the change. Itwas undertaken in three stages (i.e., preparation, introduction andimplementation). In the first stage, firstly rapport was establishedwith adolescents. Latter on guided by cognitive dissonance theory,participants were provided informational inputs about the risks ofpractising unhealthy habits and benefits of practicing positive lifestyle behaviours interactive session. In subsequent stage ofintroduction, based on social learning theory (Bandura, 1977), a power

Promoting Academic Competence in School Adolescents...
Indian Educational Review, Vol. 48, No.1, January 20118
point presentation and a film about practising of some componentsof LSIP by some of the popular role models (film, sports and publiclife) were shown. Deriving ideas from theory of reasoned action (Ajzen& Fishbein, 1980), in the second step of same stage participants insmall group were made to engage in addressing the pros and cons ofchanging life style with the investigator. In the next stage i.e.,implementation, Yoga training programme was run for about twoweeks besides assuring the compliance for change in dietary habits,avoidance of unhealthy items and sleep. Giving personal regards forchanging their life style each day after Yoga training programmereinforced the participants. During the end-up session of intervention,their participation and performance were recognised through video-recording and positive approval by principal and the staff of school.
Each day of LSIP began with a Yoga session of 45 minutes speciallydesigned for this study on the basis of expert advice, feasibility andrelevance to concerns related to academic competence. It includedpractices related to Yoga i.e., Asanas, Pranayama, Shavasana andchanting of Mantras (i.e., Om, Allahoo, and O Christ) included fromdifferent religious traditions. The details of Yoga training programmeare given Appendix-2. In summary, intervention group participantswere engaged in positive change of their dietary habits, avoidunhealthy food items, and follow proper sleep habits and performYoga for two weeks (as given in Appendix - 1).
MethodParticipants
The sample consisted of 100 school-going adolescents (50 boys and50 girls) enrolled in junior and senior secondary classes in aresidential school participated in the study. There was equal numberof adolescents in intervention (n = 50) and control (n = 50) groups.The two groups were matched for gender, age and grade. The age ofparticipants ranged from 12-18 (M = 14.4 years; SD = 1.89). Theselection in the study was based on two criteria: (1) participantsshould not have been exposed to the contents of LSIP during the lastthree months, and (2) they should not be suffering from any disease(e.g., physical disability, chronic diseases, fever etc.) which mayimpair adherence to the LSIP.
Measures
Academic competence: The assessment of AC included rating on itemsmeasuring the student’s ability to learn, memorise, concentrate and

Promoting Academic Competence in School Adolescents...
Indian Educational Review, Vol. 48, No.1, January 2011 9
interest in studies on five-point scale ranging from never (1) to always(5). The cronbach alpha of the scale with this sample was = .66.Anxiety: The items related to anxiety were adapted from 100-itemSinha Anxiety Scale Sinha (1968). The internal consistency in thissample of study was ( = .56).Depression: It was evaluated through 21-item Beck DepressionInventory (Beck et. al, 1996). This scale has satisfactory test-retestreliability (.90) and internal consistency ( = .86). Self-esteem: The 10-item Rosenberg Self Esteem Scale (Rosenberg,1965) is a well-known valid and reliable measure of self-esteem. Thescale generally has high reliability with test-retest correlationstypically in the range of .82 to .88, and Cronbach’s in the rangeof .77 to .88.Optimism: It was measured through Life Orientation Test (Scheier,Carver & Bridges, 1994) consisting of 8 items. Psychometrically, thescale has proved to be reasonably sound. The internal consistencyof the scale is adequate (� = .72), as is its test-retest reliability (r = .77over a four-week interval).Life Style Change Inventory: The compliance on aspects of LSIP wasassessed through a self-report inventory on 7-point rating scale. Therespondents were asked of reporting their adherence to the changesduring a usual week in last one year. The researcher for use in thepresent study developed it.
Design
Participants allocated to intervention and control group of both thegender rated their well-being before and after LSIP, yielding a 2 (typeof group) x 2 (type of gender) x 2 (testing occasions) factorial design.Participants of both groups were matched in their gender and age.
Procedure
After seeking formal permission from governing body of the school, theresearcher got introduced to the students during prayer session byprincipal of the school. It was followed by informal interaction withteachers and students of the school. After establishing appropriaterapport, firstly the students were provided with informational inputsabout effects of specific life style aspects in an informal discussion inclassrooms. In subsequent sessions, they were shown a short filmand power-point presentation about the popular acceptance of Yogaamong celebrities such as actors, models, players and by the generalpublic. Latter on, the adolescents were asked to indicate their

Promoting Academic Competence in School Adolescents...
Indian Educational Review, Vol. 48, No.1, January 201110
willingness to join the LSIP. Among consenting students, those whomet with the criteria were recruited in the study and got allocated inintervention or control group according to design of the study.
After group allocation, measures were administered amongintervention and control participants in a hall for pre-test. At thesame time, they were given a self-compliance diary in which theynoted down their daily engagements in various life style activities. Insubsequent phase, the intervention group participants were engagedin small group discussions to share their concerns and experiencesrelated to health and life style. Then, LSIP sessions were run six daysin a week over a 2-week period in a hall in the school premises. Onesession of LSIP lasted for about one hour. The control group participantswere engaged in a dialogue for the same duration. The compliance wasassessed through personal monitoring by researcher, self-report andattendance in Yoga training programme. The participants againcompleted the measures after the intervention. After three months ofconduct of LSIP, a follow-up was done. It (n = 46) involved administrationof a checklist of life style change inventory.
Results
Table 1 displays the mean scores and Standard Deviations on thescales of academic competence, depression, anxiety, optimism andself-esteem as function of type of goup, gender and testing occasions.It is apparent from that higher mean scores were found for interventiongroup at the post-test for academic competence, self-esteem, andoptimism and lower mean scores for depression and anxiety incomparison to the control group among boys and girls both.
TABLE 1Means and SDs of Scores on the Measures of Academic
Competence, Self-Esteem, Depression, Anxiety and Anxiety byType of Group, Gender and Testing Occasions
MeasuresIntervention Group Control Group
Boys (n = 25) Girls (n = 25) Boys (n = 25) Girls (n = 25)
Pre-test Post-test Pre-test Post-test Pre-test Post-test Pre-test Post-test
Academic 12.72 16.04 12.48 15.68 13.72 13.76 14.24 14.84Competence (3.33) (3.11) (3.04) (1.86) (3.87) (3.41) (2.55) (3.19)
Depression 7.68 6.72 7.68 7.60 8.32 7.72 8.16 7.96(2.24) (1.54) (1.65) (1.15) (2.15) (2.01) (1.92) (1.61)
Anxiety 9.16 6.56 8.00 6.40 8.00 7.24 8.04 7.64(2.88) (2.87) (2.53) (1.60) (2.90) (2.81) (1.81) (1.93)
Optimism 20.56 23.48 20.00 22.92 18.92 19.72 20.04 20.52(4.23) (3.70) (2.67) (2.37) (3.74) (2.99) (2.83) (3.24)
Self-esteem 10.56 12.00 10.40 12.52 10.28 10.36 10.80 10.48(2.81) (2.08) (2.43) (1.53) (2.42) (2.09) (2.39) (2.70)
Note: SDs are in parenthesis

Promoting Academic Competence in School Adolescents...
Indian Educational Review, Vol. 48, No.1, January 2011 11
Subsequently, the mean scores on academic competence, self-esteem, optimism, anxiety and depression were subjected to separate2 2 2 ANOVAs with repeated measure on third factor (testingoccasions). The 2 2 2 analysis partitioned variation due todifferences between groups into each pair of independent variablesas well as the main effects. All analysis were evaluated at alpha levelsof p <.05, p <.01 & p <.001. Table 2 shows the main effects of the typeof group, gender and testing occasions for academic competence,anxiety, depression, self-esteem and optimism.
TABLE 2
ANOVA Summaries of Main Effects of Type of Group, Genderand Testing Occasions Performed for Academic Competence,
Depression, Anxiety, Optimism and Self-esteem Variables Type of Group Gender Testing occasions
INT CON MS F Boy Girl MS F PRE POST MS F(1,99) (1,99) (1,99)
Academic 28.46 28.28 .40 .03 28.12 28.62 3.12 .21 13.29 15.08 160.20 3.49***Competence (4.73) (5.91) (5.96) (4.66) (3.26) (3.04)
Depression 14.84 16.08 19.22 3.90 15.22 15.70 2.88 .58 7.96 7.50 10.58 6.17*(2.89) (3.33) (3.54) (2.74) (1.99) (1.65)
Anxiety 15.06 15.46 2.00 .22 15.48 15.04 2.42 .27 8.30 6.96 89.78 26.91***(4.15) (4.25) (4.92) (3.33) (2.58) (2.39)
Optimism 43.48 39.60 188.1812.52** 41.34 41.7 42.0 0.13 19.88 21.66 158.42 24.49***(4.79) (6.10) (6.70) (4.77) (3.43) (3.45)
Self-Esteem 22.74 20.96 39.60 5.17* 21.60 22.10 3.12.41 10.51 11.34 34.44 10.39**
(3.61) (4.13) (3.90) (4.05) (2.49) (2.31)
Note: SDs in parenthesis. *p <.05, **p <.01, ***p <. 001
The results showed significant main effects for Type of Group
and Testing Occasions both on the scale of optimism but only forTesting occasions on academic competence, depression, anxiety andself-esteem. This indicated that optimism differed significantlybetween groups as well as across Testing Occasions but variation inacademic competence, depression, anxiety and self-esteem was laidout only according to testing occasions.
The results also indicated interactions that qualified the maineffects stated above. Figure 1 shows mean scores of academiccompetence as a function of testing occasions and type of group. Itreveals that reported level of academic competence somehow remainsstable among control group but increased substantially amongintervention group participants (F
(1,96)= 22.58, p < .001).

Promoting Academic Competence in School Adolescents...
Indian Educational Review, Vol. 48, No.1, January 201112
Figure 2 displays mean scores of anxiety as a function of testingoccasions and type of group. It suggests that decrement in anxietyamong intervention group partcipants was significantly greater thancontrol group participants (F
(1, 96) = 8.65, p < .01).
20.00—
15.00—
10.00—
5.00—
0.00—
Pre-test Post-test
Testing Occasions
Fig. 1: Mean Scores of Academic Competence as a Function of Testing Occasions and Type of Group
—Intervention group
—Control group
Aca
dem
ic C
om
pet
ence
(Mea
n S
core
s)
9.00—
8.50—
8.00—
7.50—
7.00—
6.50—
6.00—
Pre-test Post-testTesting Occasions
Fig. 2: Mean Scores of Anxiety as a Function of Testing Occasions and Type of Group
—Intervention group
—Control group
An
xiet
y (M
ean
Sco
res)
25.00—
20.00—
15.00—
10.00—
5.00—
0.50—
Pre-test Post-test
Testing Occasions
Fig. 3: Mean Scores of Optimism as a Function of Testing Occasionsand Type of Group
—Intervention group
—Control group
Opti
mis
m (
Mea
n S
core
s)

Promoting Academic Competence in School Adolescents...
Indian Educational Review, Vol. 48, No.1, January 2011 13
Figure 3 presents mean scores of optimism as a function of testingoccasions and type of group. It indicates that optimism remainedrelatively stable among control group participants but increasedsignificantly among adolescents exposed to LSIP(F
(1,96)= 10.05, p < .01).
As seen in Figure 4, the results suggested significantenhancement in self-esteem among intervention participants incomparison to control group participants (F (1, 96) = 13.62, p < .001).
Follow-up
A follow-up of the adolescents who participated in the interventionwas undertaken after a period of 3 months. To this end, theparticipants were asked to report the extent to which they wereobserving the various aspects of life style change which wereintroduced during the two weeks of LSIP. The compliance for life stylechanges was noted substantially during follow-up. Gender was foundto be insignificant in terms of compliance for changes in life styleafter three months of LSIP. The results suggested continuation of lifestyle changes in many of related components (72.7% avoiding waterduring meals, 100% avoiding fast foods, 93.2% avoiding tea, 78.6%getting up before sun rise, 72.7% sleeping before 10 p.m., 72.7% doingYoga, 91.9% reciting mantras) for at least once a week.
Discussion
Findings from this study provided an empirical support for efficacy ofpositive life style changes (i.e., dietary habits, food consumption, sleephabits, yoga and religiosity) for academic competence and othersecondary outcomes (i.e., anxiety, optimism and self-esteem)
12.00—
10.00—
8.00—
6.00—
4.00—
2.50—
0.00—
Pre-test Post-test
Testing Occasions
Fig. 4: Mean Scores of Self-Esteem as a Function of Testing Occasionsand Type of Group
—Intervention group
—Control group
Opti
mis
m (
Mea
n S
core
s)

Promoting Academic Competence in School Adolescents...
Indian Educational Review, Vol. 48, No.1, January 201114
significant for academic performance among adolescents. The resultsindicated that LSIP led to enhancement in health and well-beingamong boys as well as girls. There was no significant gender differencewith respect to the impact of LSIP. The results contained in improvedscores on measures of academic competence, anxiety, self-esteemand optimism evinced evidence for increased concentration, memory,interest in studies, optimistic view, self-confidence and decrease inembarrassment among adolescents as a result of LSIP. These findingssupport a few other rudimentary studies that have found positiveoutcomes in academic performance of students practicing Yoga (Kauts& Sharma, 2010), regular sleep habits (Dahl & Lewin, 2002), intakeof positive food items (Maclellan, Taylor, Wood, 2008) and involved inreligiosity (Sharma & Sharma, 2006).
In summary, the present study yielded empirical evidence that aholistic intervention with a focus on life style does contribute toacademic competence of adolescents and the effect was almost similarfor boys and girls. The participants of intervention and control groupwere matched in age and gender of whom latter group displayed lowerlevel of gains on the different measures. The LSIP was multifacetedin its composition. It had elements of psycho-education, yoga, dietarycontrol and managing daily routine activities in life. The participantsof intervention group underwent adherence to avoidance of unhealthyfood items (i.e., fast food, cold drink, and tea/coffee) and practicing ofpositive dietary habits (i.e., eating appropriately, not taking excessivewater during meals). The participants followed sleep regime practices(i.e., going to bed for sleep before 10 p.m. and waking before sunrise)during intervention period. They also participated in a Yoga trainingprogramme conducted at 5:30 a.m. daily for 45 minutes and practisedchanting of mantras from different religious traditions. Thecompliance for all the changes in life style was strictly monitored bythe researcher with the support of teachers and staff of the school.Thus LSIP attended to diverse aspects of life in a concerted fashion.
Another feature of the programme was that it continued for twoweeks in a set up where continuous monitoring, guidance and supportwas available in a residential set up. This promoted a conductiveclimate for the participants. The entire group was active participantand had access to each other as well as the resource person for theprogramme. The present researcher acted as the instructor andresource for the intervention. He stayed in the school premises andobserved the participants on different occasions during the entireduration of intervention. It was observed by researcher that continuity

Promoting Academic Competence in School Adolescents...
Indian Educational Review, Vol. 48, No.1, January 2011 15
in time and space was particularly helpful in achieving the goals ofintervention. The activities of the programme were made part andparcel of the routine. The experiences of participants revealed thatthey liked the programme and enthusiastically invested their energy.The follow-up results suggested that the effect of intervention wasnot a momentary one. It continued and persisted. A higher proportionof adolescents complied with several life style changes (i.e., avoidingfast foods, avoiding intake of tea and cold drinks, getting up beforesunrise and doing Yoga) during the follow-up period of three months.
The study demonstrated effectively the efficacy of a psycho-socialintervention in the lives of adolescents in a residential school setting.The study has implications for extension of such intervention on abroader scale with suitable modification as per the requirements ofthe specific settings. The involvement of peers and teachers in theprogramme works as a source of motivation and support. Being acollectivistic culture the impact of such intervention increases if thechanges take place in-group context. However, a close scrutiny ofthe programme revealed that its goals might be attained moreeffectively if the parents and teachers too are addressed and theirattitude toward life style is changed. The study also very clearlybrought out the argument that academic competence can not benurtured merely by counseling but also can be enhanced bycultivating some change in life style with support from the socialcontext in which adolescents live.
Conclusion
The results showed that academic competence can be enhancedthrough positive changes in life style. Given the emphasis onalterations in current adolescent life style, the conduct of LSIP has apotential to make a unique contribution to improvement in academicperformance. Since adolescence is very critical for academicdevelopment and parents often emphasise enhancement of academicskills, the school curriculum needs to have some scope for promotingpositive life style (Hamburg, 1990). A close perusal of the details ofthe present study indicates that while it has expanded the scope ofacademic competence by relating it with life style there remain someissues, which deserve attention of researchers and policy makers.There is need for thorough investigation for the role of dietary andsleep habits in academic performance. The role of religiousinvolvement, although little understood and considered, continuesits presence in human life. There is need for proper understanding

Promoting Academic Competence in School Adolescents...
Indian Educational Review, Vol. 48, No.1, January 201116
of religio-spirtual activities at home and its relationship withconcomitant aspects of AC. While the study has focused on schoolcontext the issue of life style requires the involvement of parents.Therefore, it would be pertinent to extend the scope of inquiry toinclude the parental perspectives on adolescent life style.
The present study offered new possibilities about emergence ofthe area of life style counselling to deal with multiple concerns relatedto academic competence, examination anxiety, lack of self-esteemand pessimism among adolescents. The success of intervention pointsout the possibility that schools offer an ideal setting for teaching andcreating environment for compliance of behavioral practices embeddedin cultural context of India to adolescents in large groups. Recentlylife skills education has been introduced for optimising adolescentdevelopment. It may be extended to incorporate life style behaviourssignificant for their academic achievement and thus for career goalin life at large.
REFERENCES
AJZEN, I., and FISHBEIN, M. 1980. Understanding attitudes and predictingsocial behaviour. Englewood Cliffs, NJ: Prentice Hall
BANDURA, A. 1977. Self-efficacy: Toward a unifying theory of behavioural change.Psychological Review, 84, 191-215.
BECK AT, STEER RA. and BALL R, RANIERI W 1996. “Comparison of Beck DepressionInventories -IA and -II in psychiatric outpatients”. Journal of PersonalityAssessment 67 (3): 588–97.
DAHL, R.E. and LEWIN, D.S. 2002. Pathways to adolescent health: Sleepregulation and behaviour. Journal of Adolescent Health, 31, 175-184.
FIELDS, G.P. 2002. Religious therapeutics: Body and health in Yoga, Ayurvedaand Tantra. New York: State University of New York Press.
MACLELLAN D, TAYLOR J, WOOD K 2008. Food intake and academic performanceamong adolescents. Canadian Journal of Dietetic Practice and Research,69 (3): 141-4.
DEB, S. 2001. A study on the negative effects of academic stress. Paper presentedat the International Seminar on Learning and Motivation, Kedah DarulAman, Malaysia.
DEB, S., CHATTERJEE, P., and WALSH, K. 2010. Anxiety among high school studentsin India: Comparisons across gender, school type, social strata andperceptions of quality time with parents. Australian Journal ofEducational and Developmental Psychology. 10, 18 – 31.
DWIVEDI, C. B. 2005. Swasthavrtta: The Ayurvedic model of health and well-being. In R. Singh; A. Yadav, and N. Sharma (eds.), Health psychology(354-371). New Delhi: Global Vision.

Promoting Academic Competence in School Adolescents...
Indian Educational Review, Vol. 48, No.1, January 2011 17
HANS, G. and MAHAJAN, L.1994. Youth lifestyles: A health perspective. A studyof students in the states of Maharashtra and Goa. Unpublished researchreport. Bombay: Tata Institute of Social Sciences.
KAUTS, A. and SHARMA, N.2010. Effect of Yoga on academic performance inrelation to stress. International Journal of Yoga, 2 (1), 39-43.
Koller, J. M. 2006. The Indian way: An introduction of the philosophies andreligions of India,. Delhi: Pearson Education.
LEVENTHALL, H., PROHASKA, T.R., and HIRSCHMAN, R.S.1985. Preventive healthbehaviour across the lifespan. In J.C. Rosen and L. J. Solomon (Eds.),Prevention in health psychology (pp.191-235). Hanover, NH: UniversityPress of New England.
MILOT, A. S. and LUDDEN, A.B. 2008. The effects of religion and gender on well-being, substance use, and academic engagement among rural adolescents.Youth and Society,100 (10), 1-23. downloaded from http://yas.sagepub.com/cgi/rapidpdf/0044118X08316668v1.pdf on April, 23,2010.
MISRA, G. 2005. From disease to well being: perspectives from indigenoustradition. In R. Singh; A. Yadav , and N. Sharma (eds.), Health psychology(281-302). New Delhi: Global Vision.
NATIONAL CRIME RECORDS BUREAU. 2000. Accidental deaths and suicides in India:2000. Delhi, India: Ministry of Home Affairs, Government of India.
PARASHER, K.P. 2000. Life style for perfect health, Psychological studies 45(3),167-172.
PONNUSWAMI, S. 2000. Community care for mental health. Psychological Studies,45, 173-177.
ROSENBERG, M. 1965. Society and the adolescent child. Princeton, N. J.:Princeton University Press.
SASTRI, K. N., and CHATURVEDI, G. N. 1989 Charak samhita of Agnivesa.Varanasi: Chaukhambha Bharati Academy.
SCHEIR, M. F., CARVER, C.S., and BRIDGES, M.W.1994. Distinguishing optimismfrom neuroticism (and trait anxiety, self-mastery, and self-esteem): Areevaluation of the life orientation test. Journal of Personality and SocialPsychology, 67(6), 1063-1078.
SHARMA, S., and SHARMA, M. 2006. Sustaining and enhancing health /well-beingof Indian students: The role of certain spiritual and religious interventions.Psychological Studies, 51(2-3), 113-118.
SINHA, D. 1968. Manual for Sinha Anxiety Scale. Varanasi: Rupa PsychologicalCorporation.
SMITH, C. 2003. Theorising religious effects among American adolescents.Journal for Scientific Study of Religion, 42(1), 17-30.
VIDYALANKAR, A.1968. Susruta samhita. Varanasi: Motilal Banarasidas.

Nutritional Health Status of Primary School Children
Indian Educational Review, Vol. 48, No.1, January 201118
Nutritional Health Status ofPrimary School ChildrenA study in Bareilly District
MEHROTRA MONIKA*, ARORA SANTOSH**, AND NAGAR VEENU***
ABSTRACT
The future of the society depends on the quality of life of the children.Nutritional needs change throughout life, depending on genetics, rateof growth, activity and many other factors. Nutritional status is thecondition of health of the individual as influenced by the utilisationof nutrients. Nutritional needs also vary from individual to individual.The major objective of this research is “to assess the nutritional healthstatus of primary school children of rural and urban areas”, byassessing their clinical health status and the quantity and quality offood intake by the children in both the areas of study. Four hundredchildren of 7-9 years of age were selected from the rural and urbanareas of Bareilly district. They were assessed for nutritional healthstatus by applying Clinical Nutrition Survey Chart; 24-hr recall methodand Food Frequency Questionnaire. The nutritional deficiency signsand symptoms were observed more in rural children than the urbanchildren. Nutrient intake and consumption frequency of all the 6 foodgroups was more among the urban children compared to their ruralcounterparts.
Introduction
Since 1947, India has made substantial progress in humandevelopment. Still the manifestations of malnutrition are at* Research scholar;** Supervisor, Reader MJP Rohilkhand University;***Co-Supervisor, Reader and Head Home Science Department, NKBMG College,
Chandausi.

Nutritional Health Status of Primary School Children
Indian Educational Review, Vol. 48, No.1, January 2011 19
unacceptable levels. Nineteen per cent of world’s children live inIndia. India is a home to more than one billion people, of which42 per cent are children. More broadly, malnutrition in India is ina state of silent emergency and thereby demands greater prioritythan ever before. The nutritional status of population is thereforecritical to the development and well being of the nation (NationalNutrition Policy, 1993 Government of India). The present status ofmalnutrition in India is that a devastating half of all the newbornsare malnourished and 30 per cent are born underweight makingthem more vulnerable to further malnutrition and diseases. Toevaluate nutritional status, assessors can use measure of bodycomposition and development (anthropometric measurements) ormeasures of how well the body performs certain tasks (functionaltests of nutrition status). Anthropometric measurements andfunctional tests useful in nutritional assessment indicate that eachmeasurement depends on adequate nutrition. Poor growth inchildren indicates malnutrition. Malnutrition is an impairment ofhealth resulting from deficiency of calories and/or more essentialnutrients, and over nutrition, which is an excess of one or morenutrients and usually of calories.
Under nutrition is a major public health problem worldwide,particularly in developing countries (Onis et. al.). One third of thechildren under 5 years old worldwide are moderately or severelyundernourished. Under nutrition impairs physical, mental andbehavioural development of millions of children and is a major causeof child death (World Bank, 1993, Falkner, 1991).
Shrivastava, Rahul (2008) - according to ‘National Sample SurveyOrganisation’, twenty per cent people in rural India earn only 12 aday, of which each person spends just ` 7 on food. In Orissa andChhattisgarh, 44 per cent people suffer from such a devastatingsituation. Ever wondered why people migrate from villages to cities?The survey says life is a shade better in urban India where 22 percent people spend ` 19 daily. In urban Bihar, 56 per cent live onthis amount.
“Nations where the human resource is undervalued and materialresources are overvalued always remain poor.” India stands 25th onthe Global hunger Index with 46 per cent of underweight childrenbelow 5 years of age. (State of World Children, 2008).

Nutritional Health Status of Primary School Children
Indian Educational Review, Vol. 48, No.1, January 201120
This perhaps holds good especially for a State like Uttar Pradeshwhich, with a population of about 18 crore, is home to about one-sixthof country’s population. Every sixth malnourished child in India livesin U. P. Fifty Seven per cent children born to malnourished mothersare underweight. In Uttar Pradesh the under- nutrition figure is ashigh as 72 per cent.
Therefore, the major objective of the present study is to assessthe nutritional health status of the primary School Children in therural and urban areas of Bareilly district.
Methodology
The study was undertaken with the objective “to assess thenutritional health status of children in Bareilly district”. Assessmentof nutritional status is the first step in the formulation of any publichealth strategy to combat malnutrition. The children with in 7-9 yearsof age were selected randomly from the identified schools. Twohundred children from rural and urban areas each constituted thetotal sample of 400. Three tools were used in the study to assess thenutritional health status- Clinical Nutrition Survey Chart, 24-hrrecall method, Food frequency questionnaire.
Clinical examination is commonly used in survey, since it isrelatively simple and do not call for sophisticated equipment. It revealsthe anatomical changes due to malnutrition that can be diagnosedby the naked eyes.
24-hr recall method is generally used by dietician to obtain ageneral picture of person’s food intake. It is used to elicit an accuratepicture of the diet history. In 24-hr recall method, the actual foodand drink consumed in the immediate past 24 hours is recorded.Sometimes, a longer period may be used. The recorded food consumedin the last 24 hours is then converted to the nutrients available ineach food item used in preparing it and then compared with theRecommended Dietary Allowances.
Food Frequency Questionnaire is either interviewer administeredor self-completed. A detailed questionnaire includes the list of foodsand the subject answers as to how often and in what quantity eachfood is eaten per day, per week and per month. The collectedinformation of the food consumed is then checked with theRecommended Dietary Allowances (RDA by ICMR, 1990). It gives anestimate of the amount and frequency of the various nutrientsconsumed by the individual.

Nutritional Health Status of Primary School Children
Indian Educational Review, Vol. 48, No.1, January 2011 21
Results and Discussion
The results of the present study conducted on the primary schoolchildren are discussed below:
TABLE 1Clinical Nutritional Survey Chart of Rural and Urban Children
Clinical Signs Category Rural UrbanGeneral Appearance Good 6% 97%
Fair 45% 3%Poor 45% -
Very Poor 4% -Hair Normal 37.5% 99.5%
Loss of Luster 51% 0.5%Discolored & Dry 13.5% -Sparse & Brittle 21.5% -
Eye Discharge Absent 99% 100%Watery 1% -
Mucopurulent - -Lips Normal 6.5% 98%
Angular Stomatitis, Mild 65% 2%Angular Stomatitis, Marked 17.5% -
Gums Normal 94.5% 98.5%Bleeding 4.5% 1.5%
Pyorrhoea - -Retracted 1% -
Teeth Absent 21% 98%Chalky Teeth 44% 2%
Pitting of Teeth 8.5% -Discoloured 26.5% -
Skin Normal 46.5% 99.5%Loss of Luster 49.5% -Dry & Rough 4% 0.5%
Hyperkeratosis - -Bones Normal 100% 100%
Rickets
Source: FAO/ WHO Expert Committee on Medical Assessment of Nutritional Status,WHO Tech. Rep. Ser. 258.
Interpretation
Table 1, shows the percentage distribution of the nutritional deficiencysigns amongst rural and urban respondents. The description of therural children is as follows- General Appearance: A majority of the ruralrespondents (90%) were classified as fair, (45%) and poor (45%). Eyes:

Nutritional Health Status of Primary School Children
Indian Educational Review, Vol. 48, No.1, January 201122
99 per cent of rural respondents had normal eyes with no presence ofdischarge, only 1 per cent having watery eyes. Lips: 65 per cent of thechildren were observed to suffer mild Angular Stomatitis and close to17.5 per cent had marked Angular Stomatitis. Gums: were observednormal in 94.5 per cent of the rural respondents, while 4.5 per cent ofthem had bleeding gums. Teeth: 44 per cent of the rural children hadchalky teeth confirming the deficiency of Calcium, 26.5 per cent haddiscolored teeth which could be a result of poor dental care. Hair: 37.5per cent of rural children had normal hair. However, 51 per cent haddull hair or hair without luster. 13.5 per cent of the respondents haddiscolored and dry hair and 21.5 per cent had sparse and brittle hair.A not so encouraging hair condition of the respondents indicates asignificant deficiency of protein amongst the rural respondents. Bones:were found normal. None of the children had Rickets or any other visibleorthopedic problem. Skin appearance: was normal in 46.5 per cent,dull in luster in 49.5 per cent. The balance 4 per cent of therespondents had dry and rough skin. Hyperkeratosis was not observedin any respondent.
Table 1, also exhibits the status of urban respondents on clinicalsigns and symptoms. General Appearance: 97 per cent of therespondents appeared good while 3 per cent were fair. Eyes: All therespondents had healthy eyes with no discharge. Lips: 98 per centof the respondents exhibited normal condition of lips and only 2 percent of them had mild angular stomatitis. Gums: 98.5 per cent ofthe urban respondents had normal gums while a minor fraction,1.5 per cent, had bleeding gums indicating lack of dental careawareness. Teeth: Flurosis was absent in all the children while only2 per cent had discolored teeth. Hair & Bones: Almost all therespondents had normal hair and bones. Skin Appearance: Theskin appearance of urban respondents was normal. Only 0.5 percent of the respondents had dry and rough skin which could be aresult of the stringent climatic consideration/s.
TABLE 2Percentage distribution of children according todeficient nutrient intake within last 24 hours
Rural Urban S. No. Nutrient RDA* % Average % Average
Deficient Intake (g/day) Deficient Intake(g/day)1. Protein (g/day) 41 20.0% 27 6% 34 2. Fat (g/day) 25 15.3% 18 - -3. Carbohydrates 390 96.0% 249 53.3% 296
(kcal/day)

Nutritional Health Status of Primary School Children
Indian Educational Review, Vol. 48, No.1, January 2011 23
4. Energy (kcal/day) 1,950 54.0% 1,418 11.3% 1,650 5. Calcium (mg/day) 400 76.0% 229 1.3% 186 6. Iron (mg/day) 26 42.0% 16 70% 16
* Recommended Dietary Allowance/sby ICMR 1990.
Interpretation
The 24-hr recall method was used to find out the amount of essentialnutrients intake by the respondents. The percentage of the ruraland urban children deficient in the six major nutrients is given inTable 2. The table illustrates that 20.0 per cent rural children weredeficient in Protein intake than the recommended amount (41g/day). The average intake by the deficient respondents was 27g/day.15.3 per cent of the respondents did not consume the recommendedamount of Fat (25g/day). The average consumption of fat by theserespondents was 18g/day. A majority of the respondents (96.0%) haddeficient Carbohydrate consumption, average of 249 kcal/daycompared to 390 kcal/day recommended. Energy deficiency wasexhibited by 54.0 per cent of rural respondents. Calcium is animportant nutrient for the children of this age as they are growingchildren and calcium is required for the building and growth ofstature. However, 76.0 per cent of rural respondents exhibitedcalcium deficiency. The average intake of calcium was 229 mg/dayinspite the recommended amount of 400mg/day. Also, 42.0 per centof the rural respondents did not consume the daily recommendedIron (26 mg/day). Their consumption was limited to 16mg/day.
Among the urban children 6 per cent of the respondents exhibiteddeficient consumption i.e. only 34 g/day of their daily requirement ofProtein (41 g/day). All urban respondents were well fed with Fats.Carbohydrate was one nutrient on which both rural as well as urbanrespondents were found deficient with about 53.3 per cent urbanrespondents missing the recommended daily carbohydrateconsumption of 390 kcal/day. The average consumption ofcarbohydrates was 296 kcal/day by them. 11.3 per cent of the urbanrespondents did not consume the recommended daily Energyrequirement, as over half of the children were lacking carbohydrateintake. Proteins, fats and carbohydrates together make up for thedaily requirement of energy. 1.3 per cent of the respondents wereCalcium deficient and 70 per cent were not consuming the dailyrecommended amount of Iron (26mg/day). The average calcium andiron intake by the deficient urban respondents was 186mg/day and16mg/day respectively.

Nutritional Health Status of Primary School Children
Indian Educational Review, Vol. 48, No.1, January 201124
The findings of the researcher in this particular study about thedeficiency of nutrient intake amongst rural and urban children arewell supported by a research article published in the Mint, June 1,2007. The article states that the consumption of protein came downto 57.0 g/day in 2004-05 from 59.0 g/day during 1999-2000. Therehas always been a deficiency in the consumption of calories in ruraland urban population since 1972. In urban India, proteinconsumption fell from 58.5 g/day to 57.0 g/day during the abovestated period. Fat intake in rural areas fell from 36.0 g/day to 35.5g/day and in urban areas it declined from 50.0 g/day to 47.5 g/day.A study conducted by Awasthi and Kumar in the year 1999 on 110primary school children of Kumaon Hills, Uttaranchal reveals thatthe energy intake of more than half of the sample size was50-75 per cent of the RDA standards.
TABLE 3 (A)Percentage Distribution of Rural Children based on Frequency
of Food groups’ intakeS. No. Food Groups Daily Weekly Twice a month Monthly
1. Pulses and Legumes 64% 22% 12% 2%
2. Cereals 100% - - -
3. Milk & Milk products 44% 39% - -
4. Green Leafy Vegetables 68% 26% 6% 0%
5. Fats & Oils 56% 12% - -
6. Meat, Fish & Poultry 19% 27% 5% -
Interpretation
Table 3 (a) details the frequency at which rural respondents consumevarious food groups constituents- 64 per cent of the rural respondentsconsume pulses and legumes daily, 22 per cent of the respondentsconsume it weekly, 12 per cent consume it twice a month and thebalance 2 per cent of the respondents consumed pulses and legumeson a monthly basis. All the children consume cereals on a daily basis.These children may not be consuming all the cereals as a part oftheir daily diet, however, wheat and rice constitute staple food. Lessthan 50 per cent of the total rural respondents consume milk andmilk products on a daily basis, about 44 per cent of them consumemilk daily, 39 per cent consume it weekly, and the rest do not recallconsuming milk and milk products. Though many of the respondentsconsume milk as a constituent of tea everyday, however, that is notconsidered as a source of rich lact-protein. Green leafy vegetables

Nutritional Health Status of Primary School Children
Indian Educational Review, Vol. 48, No.1, January 2011 25
are consumed by a fairly large number of rural respondents on adaily basis (68%), 26 per cent consume these weekly, and the balance6 per cent consume them twice a month. Green leafy vegetables aregrown and, therefore, readily available in rural destinations ateconomical prices than other vegetables and, therefore this could beone of the reasons of its higher consumption by rural respondents.56 per cent rural children recalled consuming foods containing fatand oils like samosa, paratha, puri or any other fried food in theirdaily diet while 12 per cent consume it weekly. Fat is used for cookingfood, however, the researcher wanted to know if respondents consumefat and oil from foods other than cooking oils as a part of their diet.19 per cent of the rural respondents consumed non-vegetarian foodsconstituting either or a mix of meat, fish, poultry on a daily basis. 27 per cent of the respondents consume non-vegetarian foods weekly,while 5 per cent consume it only twice a month. All respondentsdidn’t respond to this query, implying they could be vegetarians.
TABLE 3 (B)
Percentage Distribution of Urban Children based onFrequency of Food groups’ intake
S. No. Food Groups Daily Weekly Twice a month Monthly
1. Pulses and Legumes 92% 8% - -
2. Cereals 100% - - -
3. Milk & Milk products 96% 4% - -
4. Green Leafy Vegetables 60% 3% - -
5. Fats & Oils 92% 6% 2% -
6. Meat, Fish & Poultry 38% 16% 4% -
InterpretationTable 3(b) shows the percentage frequency of consuming various foodgroups for urban child respondents. The diet intake of the urbanchildren was found to be good and better than their ruralcounterparts. Pulses and legumes were consumed by 92 per centchildren on a daily basis while the rest consumed it weekly. Cerealswere consumed by all the respondents on a daily basis, possibly inthe form of chapatti/s. Milk was also consumed by a majority ofrespondents on a daily basis with only 4 per cent consuming it weekly.Green leafy vegetables were not found to be preferred by urbanrespondents as much as their rural counterparts. Only 63 per centof the urban respondents recall consuming green leafy vegetables ofwhich 60 per cent consumed it daily and 3 per cent consumed itweekly. Consumption of fats was high amongst urban respondents.

Nutritional Health Status of Primary School Children
Indian Educational Review, Vol. 48, No.1, January 201126
In addition to cooking oil/s they consume fats in the form of butter orghee with chapatti, dal and also fried and junk food/s. 92 per cent ofthe respondents consumed visible fats daily. Only 58 per cent urbanchildren recalled consuming non- vegetarian foods. 38 per centconsumed it daily (primarily eggs for breakfast), 16 per cent consumedthese weekly and 4 per cent consumed these fortnightly. A researchstudy is conducted.
Findings of the Study
To meet the objective of the present study “To assess the NutritionalHealth Status of Primary School Children in rural and urban areas”the nutritional health analysis tools were used and the status ofnutritional health was assessed. On observing the rural children forany nutritional deficiency signs and symptoms, mild angularstomatitis, loss of luster of hair and skin indicates protein and energydeficiencies, chalky teeth shows calcium deficiency among them. Theywere also short of carbohydrates requirements. The urban children’snutritional analysis shows a normal appearance; no prominentnutritional deficiency signs were seen. The urban children were alsonot meeting the RDA of carbohydrates and iron but the consumptionwas not poor enough to create deficiency in the body. The deficiencysigns indicate the poor diet intake, inappropriate amount of food andnon- nutritious food. They might tend to eat whatever is locally orcheaply available, a complete meal is lacking in their diet schedule.The urban children were lacking in iron, which indicates that thechildren might be reluctant in consuming iron rich food like greenleafy vegetables, jaggery etc. whereas these are locally available andconstitute the major proportion of the rural diet.
A research work is said to be successful if it can make a differenceto the society or can bring a change in the ongoing practices. Duringthe research the researcher realised that certain improvements bythe Government of India, administrators and policy makers shouldbe made in the ongoing welfare programme and new comprehensiveprogrammes should be developed to improve the overall health of thechildren of India and elevate the position of India in the HumanDevelopment Index.
Implications
The nutritional health analysis shows signs of deficiencies amongthe rural children. The frequency of essential food intake like milkand complex carbohydrates is also poor among the rural children

Nutritional Health Status of Primary School Children
Indian Educational Review, Vol. 48, No.1, January 2011 27
studied. Therefore, their energy requirement is not met by their dailydiet. After doing this detailed study it is recommended that thesupplementary meal provided by the Government under the mid-day meal scheme should be enough in portion and nutrition to supportthe daily Recommended Dietary Allowances given by ICMR, for thegrowing children of this age. The investigations indicate that theporridge, khichadi and rice puffs, generally given under the mid-daymeal scheme do not suffice for the nutritional needs of the children,therefore the food with a mixture of highly nutritive or fortified byessential nutrients like Iron, Calcium and Carbohydrates should bedistributed in schools or should be made readily available atsubsidised rates.
It is not only the rural children but a nutritional gap is also seenamong the urban children, hence imparting nutrition knowledge andfollow-up of the running nutritional programme should be done. Inthe urban schools where children bring their own lunch boxes toschools, parents should be counseled about nutrition and a monthlydiet plan should be advised to the parents according to therequirement of the child. This can keep a check as well as will helpin modifying the diet of the child and the family as well. Thegovernment should have a budget to run a comprehensive nutritioneducation programme in all the schools.
The researcher recommends that the food provided to the childrenunder Mid-day Meal programme should be a mixture of all the essentialnutrients. It should be cooked by a trained cook in a separate cookingarea, so that the students are not involved in cooking and thenutrients of the food are restored by applying appropriate cookingmethods. The cooking utensils and the cooking area should be cleanand well ventilated to maintain the hygiene.
Regular weight and height measurements should be taken inthe school so that a regular check can be kept on the development ofthe children. Based on the need of the children of a particular schoolintervention programmes should be developed and implemented. Theneed of the date is to keep children free from all diseases and providethem a healthy and hygienic environment, so that the future of thecountry is secured.
REFERENCES
ALBERTO, G. and FRANCESCO, S. 2007. Child malnutrition and mortality indeveloping countries: Evidence from a cross country analysis. PolytechnicUniversity of Marche, University of Rome “La Sapienta” and UNCTAD-Un. P- 2.

Nutritional Health Status of Primary School Children
Indian Educational Review, Vol. 48, No.1, January 201128
AWASTHI, N. 1996. Nutritional status of primary school children of Kumaun hills,M. Sc., G. B. Pant University of Agriculture & Technology, Pantnagar
AWASTHI, N. and KUMAR, A. R. 1999. Nutritional status of hill primary schoolchildren. The Indian Journal of Nutrition and Dietetics, 36, pp. 453- 460.
AWASTHI, S., DAS, R., VERMA, T. and VIR, S. 2003. Anemia and under nutritionamong pre-school children in Uttar Pradesh, India, Indian Pediatrics,40 (10): 985-990.
BAMJI, M. S., RAO, N. P, and REDDY, V. 1996. Textbook of Human Nutrition,New Delhi: Oxford and IBH Publishing Co. Pvt. Ltd. pp. 153-167.
CHAUHAN, C., New Delhi, Hindustan Times. June 4, 2008. India Malnourished:Government to form nutrition mission. P.10.
FALKNER, F. Malnutrition and growth. Int Child Health 1991; 11:8-11.
GARG, S. K., SINGH, J. V., BHATNAGAR, M., CHOPRA, H. 1997. Nutritional statusof children (1-6 yrs) in slums of Ghaziabad city, Indian Journal ofCommunity Medicine, April- June 1997, 22(2): 70-3.
GARZA, C. 2002. The nutrition situation: An overview. Food and NutritionBulletin, 23, (4), pp. 343-345.
GOPALAN, C., SHASHTRI, R. B. V., and BALASUBRAMANIAN, S. C. 1999. Nutritivevalue of Indian foods, Hyderabad: National Institute of Nutrition.
ICMR. 1990. Nutrient requirement and RDA for Indians. Hyderabad,National Institute of Nutrition, P. 83.
KAPIL, U. and PRADHAN, R. 1999. Integrated Child Development Servicesscheme (ICDS) and its impact on nutritional status of children inIndia and recent initiatives. Indian Journal of Public Health, Jan-March;43 (1); 21-5.
LEVITSKY, D. A. 1989. Malnutrition and Hunger to learn. Malnutrition,Environment and Behaviour. Ithaca, New York: Cornell University Press.
MAHAR, P. 1998. Nutritional profile of hill primary school children. Thesis M.Sc.,G.B. Pant. University of Agriculture and Technology, Pantnagar.
MARTORELL, R. 1999. The nature of child malnutrition and its long-termimplications. Food and Nutrition Bulletin, 20,(3), pp. 288-291.
MASON, J. B., HUNT, J., PARKER, D. and JONSON, U. 1999. Investing in childnutrition in Asia. Asian Development Review, 17 (1, 2),1-32 .
MISHRA, R. N., MISHRA, C. P., SEN, P., SINGH, T. B. (n.d.). Nutritional statusand dietary intake of pre-school children in urban Slums of Varanasi.Indian Journal of Community Medicine, 26(2), (2001-04-2001-06).
MISHRA, V. K., LAHIRI, S. and LUTHER N. K. 1999. NFHS Subject Report No.14,Child Nutrition in India.

Nutritional Health Status of Primary School Children
Indian Educational Review, Vol. 48, No.1, January 2011 29
National Family Health Survey. June 30, 2005. India child malnutrition.Attaining Millennium Goals in India. 1993.
National Family Health Survey, NFHS-3. 2005-06. Fact Sheet, UttarPradesh (Provisional Data), Ministry of Health and Family Welfare,Government of India.
National Nutrition Monitoring Bureau. 1988-90. Report of repeat survey,National Institute of Nutrition, ICMR. NIN press, Hyderabad 1991,22-29.
National Nutrition Monitoring Bureau. 1999. Report of Second RepeatSurvey: Rural (1996-1997). Hyderabad: NIN.
National Nutrition Policy. 1993. Government of India, Department of womenand child development, Ministry of human resource development, NewDelhi.
ONIS DE M, MONTEIRO C, AKRE J, GLUSTON G. 1993. The worldwide magnitude ofprotein-energy malnutrition: an overview from the WHO Global Databaseon Child growth. Bull WHO; 71:703-12.
SHRIVASTAVA, RAHUL. 2008. A Suffering Bharat vs Shining India. One WorldSouth Asia. National Sample Survey Organisation. NDTV.
SINGH, P., MINT. 2007. India’s overall nutrition level not improving, says report.
SMITH, L. C. and HADDAD. 1998. Explaining child nutrition in developingcountries. A cross country analysis. International Food Policy andResearch Institute, Washington D.C.
State of World Children. 2008. A Matter of Magnitude. The Impact of OneEconomic Crisis on women and Children in South Africa. Unicef,Rosa.
SUTIR, T. 2007. Hunger Pangs, Hindustan Times, p. 16.
TOMKINS, A. 2001. Vitamin and mineral nutrition for the health anddevelopment of the children of Europe. Public Health Nutrition, 4(1A),pp. 91-99.
UNICEF. 2008. The state of the world’s children, Table 2, pp. 111-123.
VASHISTH, R. N. et. al. 2005. Physical growth and nutritional status of Garhwaligirls. The Indian Journal of Pediatrics, 72,( 7), pp. 573-578.
VENKIAH, K.,DAMYANTI, K., NAYAK, M. U., VIJAYRAGHWAN, K. 2002. Diet andnutritional status of rural adolescents in India. European Journal ofClinical Nutrition, 56,(11), pp. 1119-1125.
World Bank, World Development Report. 1993. Investing in health. OxfordUniversity Press, New York.

A Critical Appraisal of General Science Content of Class VII Textbooks
Indian Educational Review, Vol. 48, No.1, January 201130
L
A Critical Appraisal ofGeneral Science Content of
Class VII Textbooks
SWATI SINGH*
ABSTRACT
General Science is being taught as an integral part of general education,as it equips the learner with the basic awareness of his physical andbiological environment. In this Endeavour, the ‘Content’ aspect of GeneralScience plays a crucial role as it provides a theme or keynote for theinstructional process. Thus the effectiveness of any instructional processis largely determined by the content and it presentation. Content ofGeneral Science with special emphasis on the term ‘General’ is a finestessence of those scientific facts, concepts and principles that are ofgeneral importance to a learner, providing general awareness of hisenvironment. In order to remain realistic it needs to accommodate theongoing changes in the environment to let the learner be conscious ofrecent evolution occurring as a result of scientific and technologicalprogress. It is its auto accelerating nature and the fact that nothing isabsolute in science that makes an urgent and recurring demand forperiodical updating of its content. Thus to remain relevant andmeaningful, content needs to be critically evaluated, updated andrestructured on the regular basis. Textbooks being an effective tool topresent the content, researcher felt the need to critically appraise theGeneral Science content of Class VII textbooks prescribed by RajasthanBoard of Education in terms of its relevance and adequacy. Contentwas found to be environment oriented making an attempt to develop abasic awareness and understanding of the environment in the learner.
Introduction
General Science is now being treated as one of the curricular areasthat are indispensable for any school curriculum. It provides thelearner with the ability to identify various phenomena (biological aswell as physical) operating in his environment and understand their* 15-16, Jhalana Doongri, Jaipur

A Critical Appraisal of General Science Content of Class VII Textbooks
Indian Educational Review, Vol. 48, No.1, January 2011 31
casual relationships, classify, interpret and make reasonableconclusions. In this endeavour, the ‘content’ aspect of General Scienceplays a crucial role as it forms the pivot around which teachinglearning process facilitates. It provides a theme or keynote for theinstructional process. It is a medium through which a teacherinteracts and communicates subject knowledge to a learner. So theeffectiveness of the instructional process largely depends on theworthwhileness of the content in any discipline in context of objectivesto be fulfilled through its transaction. Thus, Content in order toremain realistic and meaningful needs to be restructured on theregular basis. Such restructuring should be done on the basis of theoutcomes of critical evaluation of the content.
Important considerations for critical appraisal of General Science‘content’ at Upper Primary Stage (Class VII) are as follows:
(a) Nature of content in General Science at upper primary stage
The understanding of nature and structural arrangement of scientificknowledge can become a framework for planning, evaluation andconsequent, restructuring of the content. Content of General Scienceis an ordered knowledge of natural phenomena and relations betweenthe concepts and conceptual schemes that have developed as a resultof experimentation and observation and thus explains the objectsand events with in our natural environment. Looking deeply into thestructure of general science content, its components can be visualisedin a hierarchical arrangement where the smallest unit but largest innumber are facts. Innumerable facts when organised have led tothe forming of various concepts which are abstract idea aboutcomplex phenomena. In trying to understand the behaviour oroccurrences of these concepts in various interrelationships, certainconstructs are created. On the basis of experimentation, withempirical proof, principle and laws governing phenomena have beenidentified. When these stated in a complete universally applicableand proven explanation these are called theory.
TheoryPrinciplesConstructsConcepts
Facts
Hierarchical arrangement of knowledge in Science

A Critical Appraisal of General Science Content of Class VII Textbooks
Indian Educational Review, Vol. 48, No.1, January 201132
Content of General science is an accumulated systematised bodyof knowledge including facts, concepts, principles, formulae, figureand diagrams etc. All these form the product of science which hasdeveloped as a result of experimentations observations andmeasurements called process of science in the course of explainingevents within our natural environment. Products of science are neverfinal, but in fact they are fluid in nature and tentative. Theories andlaws which are proved wrong in the course of time are discarded orreplaced by new ones. Science is not only a product but also a processby which this product of science is obtained. Science as a processinvolves classification, experimentation and measurement etc.
Thus, an ideal General Science content should have a close linkbetween the conclusions of science (science product) and inquirythat produced them (science process).This can be achieved if thecontent have along with adequate amount of conceptual input, lot ofpicture illustrations and variety of activities and experimentations.
(b) Learner’s characteristic at upper primary stage
The learner’s maturity level (psychomotor ability and stage of cognitivedevelopment) make a very important point of consideration forplanning and evaluating the content. Learners learning ability, hislimitations and strength determine the expected learning outcomes.What to expect say from a child of 3 or 5 can only be determined,keeping in mind the level of development of child. The objectives ofteaching the content, difficulty level of the elements of content andthe content presentation should be determined on the basis oflearner’s maturity level. How relevant and appropriate is the contentin the context of stage of development it is meant for, forms theimportant criterion for the evaluation of the content. In the presentpaper researcher is dealing with the upper primary stage(11 to 14years of age). As per the Piagetian theory of intellectual development,in Class VII (upper primary stage) child is in formal operational stage.He is no longer tied to concrete situation and capable of developingconceptual understanding of the general science content. Studentat this age has an ability to conceptualise the way in which thecomponent parts of the General Science content are interlinked, soas to draw a meaningful idea about it. This should be an ultimateaim of General Science teaching at upper primary stage.
Thus, an ideal science contents should have appropriate andadequate conceptual input to enable the child to conceptualise anddraw a meaningful idea about it.

A Critical Appraisal of General Science Content of Class VII Textbooks
Indian Educational Review, Vol. 48, No.1, January 2011 33
(c) Objectives of General Science teaching at Upper Primary Stage
Critical evaluation of content should be done in the light of objectivesof teaching it, which in turn need to be appropriate in context ofNational development goals, pedagogical goals and educationalpriorities. Therefore researcher made a comprehensive survey ofliterature to find out the objectives of Science teaching at upperprimary level. Education commission (1964-66) in its reportmentioned the objective of teaching science at upper primary stageas to develop among children a proper understanding of main facts,concepts, principles and process in the environment. Objectivementioned in the guidelines and syllabi for upper primary stageprepared by NCERT in 1988 was to acquaint students with somebasic concepts, principles, laws of science relevant for understandingand interacting with the environment. According to Narendra Vaidya(1971), to develop functional understanding of scientific facts,concepts, conceptual schemes and their application to newphenomena is an important objective of teaching science at thislevel. Having studied the reports of various other committees andcommissions as well as suggestion by eminent scientist, researcherconcluded that ‘Attainment of science concepts’ should be anobjective of science teaching at this level.
Thus, Ideal General Science content at upper primary stageshould enable a child not only to recall, recognise and define conceptsbut also to understand, interpret, explain and apply his conceptualunderstanding in new situations.
Having studied the philosophical and psychological basis ofGeneral Science content, researcher decided to critically appraisethe General Science content in respect of following:
(a) Is Content Relevant?
Content is relevant if it makes sense to a learner at this stage. Itshould be complete in itself and should be capable of forming logicallya properly organised ‘Whole’ or a meaningful ‘Gestalt’ in the mind ofa child. Relevance can be assessed in terms of the amount ofinterrelatedness with in the content. Inter linking with in the contentshould be such that learning of one concept leads to the developmentof second, second into third and so on, until the main idea of thatunit is eventually attained. For e.g. a conceptual statement like‘energy can change from one form to another’ summarises a greatnumber of concepts

A Critical Appraisal of General Science Content of Class VII Textbooks
Indian Educational Review, Vol. 48, No.1, January 201134
Kinetic Energy Potential Energy
Energy
Chemical energy Mechanical energy
Conceptual statement (idea) � � � � � Energy can change fromone form to another
(b) Is content Adequate?
Content is adequate if it is provided with broad and variety of learningexperiences. To develop and understanding of any idea it is requiredto provide adequate learning experiences so that one can recogniseand apply the concept being used. Along with the adequate theconceptual input it should be supplied with adequate number ofpicture and verbal illustrations. Figures and diagrams, presents thecontent in the concrete form, performing activities would provide firsthand experience and increase students participation, thus help indeveloping and idea about the concept. Ideal science content has anadequate amount of conceptual input along with adequate numberof picture illustrations (figures and diagrams), verbal illustrations(activities) and thought provoking questions. Conceptual learning ofthe content can only occur if it is adequate in terms of the above.Researcher would judge the adequacy of the content in terms ofamount of conceptual inputs, amount of its being activity orientedand number of figure and diagram been presented.
RATIONALE
If the content is evaluated and restructured on the above parameters,there are maximum possibilities that learner having studied GeneralScience for 10 years of General education will come out with fullscientific understanding of the environment. But in order to havedeveloped such strong understanding of science, one needs to havestrong scientific base. Thus one of the basic priorities is to review thescience status at lower levels of academic set up like ‘upper primarylevel’ where the foundations for the scientific understanding can bestrengthened. This is why this stage was chosen for study by theresearcher.

A Critical Appraisal of General Science Content of Class VII Textbooks
Indian Educational Review, Vol. 48, No.1, January 2011 35
STATEMENT OF THE PROBLEM
A critical appraisal of General Science content of Class VII textbooks
OBJECTIVE OF THE STUDY
To critically appraise the Class VII General Science content in respectof its relevance and adequacy.
HYPOTHESIS
Content of General Science of Class VII is relevant and adequate.
POPULATION
Textbooks of Class VII of all boards of education in India.
SAMPLE
Textbook of Class VII prescribed by Rajasthan Board of Educationpublished by Rajasthan Rajya Pathyapustak Mandal, Jaipur.
DELIMITATION OF THE STUDY
The researcher was fully conscious of the wide scope of subject areaas well as various constraints and so the study was delimited interms of follows:1. The study was conducted only on Class VII content of General
Science.
2. The study was conducted only on General Science textbook ofRajasthan Board of Education.
SOURCE OF DATA
In the present study, researcher analysed the substantive dimensionof the General Science curriculum at upper primary stage. Thusthe source of data was the content of General Science textbook ofClass VII of Rajasthan Board of Education.
TOOL FOR THE DATA COLLECTION
As the objective of the study was to critically appraise the content ofgeneral science at upper primary level, it was essential to analyse it,for which the content analysis was done. Thus the tool used for thecollection of the data was the content analysis Performa and thetechnique used was qualitative content analysis.

A Critical Appraisal of General Science Content of Class VII Textbooks
Indian Educational Review, Vol. 48, No.1, January 201136
(a) Qualitative Content Analysis
It is a qualitative research technique in which researcher analysesthe presence, meanings and relationships of concepts. To conduct acontent analysis on any textbook content, it is broken down, intomanageable categories on a variety of levels to identify the conceptsand then relationships are examined among concepts. In structuralterms, content refers to organised set of statements or propositionand in General science content these statements are aboutinterrelated scientific facts, concepts and principals that are of generalimportance to a child. Thus, in order to make a qualitative Generalscience content analysis, General Science textbook of Class VII wasexamined and distilled (analysed) thoroughly for facts, concepts,laws/principles, process (cyclic and linear processes), relationships(direct, inverse, concurrent and cause-effect relationships) andcategorisations with the help of Content Analysis Proforma. Data thusobtained as a result of such exhaustive content analysis was toomassive. Therefore, compilation of data was done where all theconcepts as well as ideas were sorted out from the above Proformaand tabulated. From the above tabulated data concept clusters wereidentified where each concept cluster comprised of a ‘central’ conceptand various related concepts and ideas clustered around it. Therewere total 14 concept clusters identified where each concept clusterseemed to be complete in itself and conveying some meaningful ideas.Interrelationship among various concept clusters was identified tojudge the interrelatedness within the content and how far it issuccessful in forming a meaningful ‘Gestaltic’ view of the environmentin the mind of the child. This enabled researcher to assess therelevance of the content with respect to learner at upper primarystage. Below each concept cluster a table was formed which depictedthe concepts and ideas involved in the cluster and nature of detailsbeen provided for each one of them in the textbook. This enabledresearcher to assess the adequacy of the conceptual input. Figureand diagram analysis was done to assess the adequacy of the pictureand verbal illustration.
(b) Content Analysis Proforma
This was the tool used for data collection. It was a tabular presentationof the content. It was divided into six columns namely Facts, Concepts,and Laws, process, Relationships and categorisation. Relationshipscolumn was further divided into concurrent, inverse and cause effectrelationships columns while process column was further divided into

A Critical Appraisal of General Science Content of Class VII Textbooks
Indian Educational Review, Vol. 48, No.1, January 2011 37
cyclic and linear process. All the facts found were listed under thecolumns of facts, all concepts found were listed under concept columnand so forth in the content analysis Performa as shown in the TableNo.1:
TABLE 1Content Analysis Proforma
Facts Concepts Laws Process Relationships Catego-
Cyclic Linear Direct Inverse Concurrent Cause- risation
effect
NATURE OF DATA
Data obtained after the systematic and detailed examination andanalysis of the content of General Science textbooks of Class VII ofabove mentioned Board was found to be purely qualitative in nature.
PROCEDURAL DETAILS
Procedural details have been elaborated in what follows:
(a) Content Analysis
Content of General Science textbook was found to have been presentedin a topical fashion. There were 20 chapters in the textbook. Contentanalysis was done chapter wise. Each chapter was analysedthoroughly for facts, concepts, laws/principles, process (cyclic andlinear processes), relationships (direct, inverse, concurrent andcause-effect relationships) and categorisations. All the facts foundwere listed under the columns of facts, all concepts found were listedunder concept column and so forth in the content analysis Proforma.Data thus obtained as a result of such exhaustive content analysisreflected each and every aspect of the content of textbook but at thesame time it was too massive. Researcher found it impractical topresent it in its original form, thus compilation of data was done.
(b) Compilation of Data
In order to make the data obtained, more refined and presentable,all the concepts as well as ideas were sorted out from the aboveProforma and tabulated. Two tables exhibiting all the concepts andideas along with their way of presentation in the book were prepared(Appendix II-A & II-B). Framework of the table is as follows:

A Critical Appraisal of General Science Content of Class VII Textbooks
Indian Educational Review, Vol. 48, No.1, January 201138
TABLE 2Concepts Definitions Descriptions Differentiation/ Process Relationship
Categorisations
TABLE 3
Ideas Mode of Presentation
Illustrative Descriptive Explanatory
(c) Identification of Concept Clusters
On the basis of tabulated data obtained from the preceding step,researcher tried to represent the content in more meaningful pictorialformat i.e. in the form of concept clusters. Each concept clustercomprised of a ‘central’ concept and various related concepts andideas clustered around it. Each concept cluster seemed to be completein itself and conveying some meaningful ideas. The assumptionsbehind the clustering of concepts and ideas were that various conceptsand ideas in the content are interrelated.
(d) Tabulation of Nature of Details in Each Concept Cluster
Below each concept cluster a table was formed which depicted theconcepts and ideas involved in the cluster and nature of details beenprovided for each one of them in the textbook.
Concepts/Ideas Nature of Details
(e) Interlinking of Concept Cluster
An attempt was made to identify interrelationship among variousconcept clusters. This was done to judge the interrelatedness withinthe content and how far it is successful in forming a meaningful‘Gestaltic’ view of the environment in the mind of the child.
(f) Figure and Diagram Analysis
This was done in order to determine adequacy of the content in respectof figurative component. Each figure and diagram was analysed andassigned to one or more of the following categories:(i) Figures used strictly for illustrative purpose.
(ii) Figures requiring students to perform some activity or to usedata.

A Critical Appraisal of General Science Content of Class VII Textbooks
Indian Educational Review, Vol. 48, No.1, January 2011 39
(iii) Figures illustrating setting up the apparatus for an activity.
Data obtained on figures and diagram analysis has been presentedin Appendix III.
DATA ANALYSIS
General Science textbook of Class VII, fourteen concept clusters wereidentified. Each concept cluster could be characterised distinctly andfound to be conveying a meaningful idea.
Identification of Concept Cluster
Concept cluster no. 1 (Life Processes) was ‘process’ centeredconveying an idea, that various life processes allow life to continue.Concept cluster no. 2 (Heat) is ‘relational’ type conveying an idea ofcause and effect relationship among various phenomena operatingin the environment. This cluster showed Melting, boiling, expansionand change of state as the effect of heating .Concept cluster no. 3(Electric Current) was ‘categorisation’ based conveying an idea thatmaterials can be categorised into good or bad conductor as per theirability to conduct electric charge. Concept Cluster no. 4 (LivingOrganism) was found to be ‘organisation’ based projecting an ideathat our body is an organised structure where cell as a structuralunit is organised into tissues, tissues into organs and organs intoorgan system. Finally proper organisation of organ systems makesan individual. Concept cluster no. 5 (Matter) was ‘classification’type depicting an idea that matter can be classified into elements,compound and mixture all of which are made of atoms and molecules.Concept Cluster no. 6 (Chemical Representation) was based on‘symbolic representation’ giving an idea that chemical can berepresented by symbols and chemical equation is nothing butsymbolic representation of chemical reaction. Concept Cluster no.7 (Cell) was ‘function’ based giving an idea that cell is a functionalunit of organism. A cell functions through its different organelleslike mitochondria, ribosome, centrosome etc. in such a way that wholeorganism continues living and reproduce through mitotic and meioticcellular division. Concept Cluster no. 8 (Constituents of Air) was‘composition’ based giving an idea that air is a mixture of gases.Concept Cluster no. 09 (Chemical Reaction) was ‘Reaction’ baseddepicting various reactions occurring naturally like nitrogen fixation,photosynthesis, oxidation etc. Concept Cluster no. 10 (Diseases)was ‘relational’ type giving an idea of disease, its causes, symptoms

A Critical Appraisal of General Science Content of Class VII Textbooks
Indian Educational Review, Vol. 48, No.1, January 201140
and precautions. Concept Cluster no. 11 (Imbalance in Nature)was again ‘relational’ conveying an idea of interdependence of livingand nonliving components of nature thus emphasising onenvironmental consciousness. Concept Cluster no. 12 and 13(Sound and Light) gave an idea that light as well as sound travels inall direction from their source where sound needs medium while lightcan propagate without medium. Concept Cluster no. 14 (Machines)generated an idea that machine makes our work easier.
Below each concept cluster a table was presented that mentionedwhether the concepts in the cluster had been presented in contentas description, definitions, relationships, process, and categorisation.With the help of the table, researcher could make out whether thedetails been provided regarding concept cluster (all concepts withinthe cluster) were adequate and appropriate to develop the idea thateach cluster seemed to be conveying.
Interrelationship among Concept Clusters
All the fourteen concept clusters were identified to be interrelatedgenerating one major idea of ‘unity of biological, physical andchemical phenomena operating in the environment’. Theinterrelationship among these concept cluster have been presentedin the Figure-1
This figure depicted the conceptual interlinkage with in thecontent. These relationships were identified in the following manner.As shown in Concept Cluster no.1(Life Processes) all livingorganisms perform various life processes like respiration, nutrition,excretion etc. to keep themselves alive. They require energy to performthese life processes which is obtained from food through chemicalreactions. In order to get chemical energy from food, it has to be brokeninto smaller and soluble molecules through the process of digestion.These smaller molecules as described in Concept Clusterno. 09 (chemical reactions) then take part in chemical reactioncalled oxidation that take place in mitochondria of the cell as describedin Concept Cluster no. 7 (Cell). Food molecules are oxidised withoxygen taken up by the organism through aerobic respiration fromair. The oxygen percentage in the air maintained through anotherchemical reaction called photosynthesis as described in ConceptCluster no. 09 (Chemical reactions). During this process greenplants synthesise an organic compound called carbohydrate usingcarbon dioxide and water from the environment and heat energy fromsunlight, as described in Concept cluster no. 2 (Heat) facilitate these

A Critical Appraisal of General Science Content of Class VII Textbooks
Indian Educational Review, Vol. 48, No.1, January 2011 41
chemical reactions. Oxygen is released in this process. Chemicalrepresentation as described in Concept Cluster no. 6 (Chemicalrepresentation) of this process can be done as following chemicalequation.
Sun Light2 2 6 12 6 26CO + 6H O C H O + 6O + Energy
Oxygen thus released causes food molecules to oxide and releaseenergy which is used for various life processes to carry on amongwhich are mitosis and meiosis. Mitosis helps in growth anddevelopment from cell to organ system while meiosis causes organismto reproduce its own kind leading to population growth as describedin Concept Cluster no. 7(Cell). The uncontrolled exploitation ofnatural resources by human population has led to environmentalpollution as described in Concept Cluster no. 11 (Imbalance innature). Although machines make our work easier as described inConcept Cluster no. 14 (Machines) but indiscriminate use ofmachines leads to enormous sound ,water and air pollution.Consequently, the natural composition of air as described in ConceptCluster no. 8 (Constituents in air) has been disturbed due to mixingof various harmful gases and compounds .This in turn are affectingall living organism, various life process and causing various diseasesamong human population .
Figure and Diagram Analysis
Overall ninety five figures and diagram were found in the contentthat was covered in 17 chapters as shown in Appendix III. Not evena single chapter was without figure. There were 7 chapters whichhad large number of figures and four chapters which had very lessnumber of figures. Sixty five figures were presented for only illustrativepurpose. There were twenty one figures which required students toperform activity while fifteen figures illustrated the way of setting upapparatus for activity. Ratio of figures for illustrative purpose only tothe figures calling for performing some kind of activity was (65:36). Insome chapters figures were lacking in clarity for eg. Figure exhibitinghuman respiratory system in chapter 7, figure for human heart etc.
DATA INTERPRETATION
Thus, overall it was found that content of General Science textbookrendered itself for meaningful representation in the form of fourteen‘consistent wholes’ which were referred to as ‘concept clusters’. Eachone of these conveyed some meaningful idea about the content. This

A Critical Appraisal of General Science Content of Class VII Textbooks
Indian Educational Review, Vol. 48, No.1, January 201142
proves the relevance of the content to an extent. When seen in totality,all the above fourteen concepts clusters were found to be interrelatedforming a ‘Gestaltic’ view of the content in general science textbookof Class VII. One major idea found to be emerging out was environmentbeing an integrated whole comprising physical, biological, andchemical phenomena.
RESULTS
Overall content was found to be relevant. It was complete in itselfforming logically a properly organised ‘Whole’ or a meaningful ‘Gestalt’in the mind of a learner. Interrelatedness with in the content wassuch that learning of one concept leads to the development of second,the second into a third and so on eventually emerging into one majoridea i.e. “There is oneness and unity in all nature”. Content wasadequate except few concepts like atoms, load, fulcrum, work etc.found to be lacking adequate description. Content was adequate inits figurative component but proportion of illustrative figures washigher than activity based figures. Content was appropriate exceptfew concepts like machines, kinds of asexual reproduction whosedescription seemed to be too heavy and vast for the upper primarystage. But still textbook was found to be bit authoritative and lessinvestigative offering few challenges to students
BIBLIOGRAPHY
1. BEGUM, K. 2000. Problem of teaching new Science syllabus forstandard VII in Andhra Pradesh and their impact on pupilsachievement. NCERT, Fifth Survey of Educational Research,Vol. II, NCERT, p.1238.
2. BHARTI, M. 2000. Uchch Madhyamic star Par gruha VigyanPathaykram Ka Samalochnatmak Vishileshan. UnpublishedM.Ed dissertation submitted to Banasthali Vidyapith.
3. CHHIKARA, M.S. 1991. An investigation into the relationship ofreasoning abilities with achievement of concepts in life sciences.Buch, M.B. (ed.), Fourth Survey of Research in Education,NCERT, p. 820.
4. DAS, AJIT.K. 2000. Modernisation themes in primary textbooks.Fifth Survey of Educatonal Research,Vol.II, NCERT, p.1234.

A Critical Appraisal of General Science Content of Class VII Textbooks
Indian Educational Review, Vol. 48, No.1, January 2011 43
5. EDWARDS, CLIFFORD H., ROBERT L. 1977. Teaching Elementary SchoolScience: A Comparative Study. Praeger, New York.
6. GOPAL KRISHNAN, K.R. 1987.Critical analysis of the new Mathematicssyllabus and textbook in upper primary classes in Kerela. Buch,M.B., Third Survey of Research in Education, NCERT, p. 565.
7. JOSHI, B.P. 1991. Development of Science Education for upperprimary classes based on the environment approach. Buch,M.B. (ed.), Fourth Survey of Research in Education, Vol. I,NCERT, p. 735.
8. JOSHI, M.G. 1987. Content analysis of General Science textbookfor standard IV. Buch, M.B. (ed.), Third Survey of Research inEducation, NCERT, p. 541.
9. MASIH, A. 1998. New Trends in Science Curriculum. Manak,New Delhi .
10. MASIH, S. 2000. A study of attitude towards Science,understanding the nature of and concept attainment in Scienceof middle school students in M.P. : A Comparison of effects ofHSTP Curriculum and NCERT. (adopted) Curriculum. FifthSurvey of Education Research, Vol. II, NCERT, p. 1267.
11. MOHAN, R. 2000. Effective Concept learning in Science Education: A theoretical instructional mode. NCERT, Fifth Survey ofEducational Research, Vol. II, NCERT, p. 1252.
12. MOHANTY, S. 2000. An appraisal of teaching science in the highschools of Cuttack city. NCERT, Fifth Survey of EducationResearch , Vol.-II, NCERT, p. 1253.
13. MUKHOPADHYAY, B.1991. The relationship betweenComprehensibility of language used in the Science textbook andScience achievement in terms of learning objectives at primarylevel in state of Rajasthan. Buch, M.B. (ed.), Fourth Survey ofResearch in Education, Vol. I, NCERT, p. 735.
14. NCERT 1985. Curriculum load at the School level: A quickappraisal. NCERT.
15. NCERT 1991. Minimum level of learning at primary stage – Reportof the committees set up by the HRD ministry (Department ofEducation) Government of India. NCERT.
16. NCERT 1990. Science Teaching Guidelines for EducationalFunctionaries of states. NCERT, New Delhi, 1990

A Critical Appraisal of General Science Content of Class VII Textbooks
Indian Educational Review, Vol. 48, No.1, January 201144
17. POKHRANA, KAMAL, PRATAPMAL, DEVPURA, NAND KISHORE SRIVASTAVA: Vigyan,Kaksha 7, Rajasthan Rajya Pathaypustak Mandal, Jaipur, 2001
18. RICHMOND, P, E. (ed.). 1973. New trends in Integrated Scienceteaching. Vol. II, UNESCO, Paris .
19. ROMEY D. WILLIAM .1968. Inquiry Techniques for teaching Science.Prentice-hall, New Jersey, U.S.A.
20. SCERT (A.P.) 1987. Evaluatory study of in service of Secondaryschool teachers in Science teaching centers attached to collegesof Education. Buch M.B., Third Survey of Research in Education,NCERT, p.561.
21. SCERT (A.P.) 1991. Evaluatory study of textbooks in Environmentstudies of classes III & V based on revised curriculum in Science.Buch M.B., Fourth Survey of Research in Education, p.745.
22. SAXENA, A.B. 2000. A Critical study of textbooks for environmentalstudies at the primary level. Journal of Indian Education Vol. II,NCERT , p.79.
23. SHISTA, R. 2000. An Investigation into the effectiveness of guideddiscovery learning vis-à-vis the conventional approach to theteaching of scientific concepts in life Sciences. Fifth Survey ofEducational Research, Vol. II, NCERT, p.1262.
24. SRIVASTAVA, K. 2000. Impact of Science teaching on the child’sconcept of physical causality: An experimental study. Fifth Surveyof Educational Research, Vol. II, NCERT, p. 1266.
25. SWARNAMMA, G. 1987. An Inquiry into the teaching of Biology inupper primary school of Kerela. Buch, M.B (ed.), Third Survey ofResearch in Education, NCERT, p.568.
26. VAIDYA, N. 1996 .Science teaching for the 21st Century, Deep &Deep Ltd., New Delhi.
27. VAIDYA, N. 1970. Some aspects of Piaget’s Work and ScienceTeaching, S. Chand and Co. Ltd., New Delhi.
28. WALVALKAR, Y.N. 1987. Critical evaluation of mathematics textbooksfor standard II, III & IV. Buch, M.B., Third Survey of Research inEducation, NCERT, p. 542.

A Critical Appraisal of General Science Content of Class VII Textbooks
Indian Educational Review, Vol. 48, No.1, January 2011 45
Concept Cluster No. 1
S. No. Concepts/Ideas Nature of Details
1. tSaafod fØ;k,¡ Descriptions
2. ikpu Process
3. vkWDlh 'olu Process
4. tuu Process,Categorisation
5. iks"k.k Process,Categorisation
6. vukWDlh 'olu Process
7. mRltZu Process
8. 'olu Process
9. ifjlapj.k Process
Concept Cluster No. 2
S. No. Concepts/Ideas Nature of Details
1. m"ek Descriptions
2. DoFku Descriptions,Definition
3. xyu Descriptions,Definition
4. xyukad Descriptions,Definition
5. rki Definition
6. Lopkfyr fo|qqr bL=kh Description
7. Lopkfyr vfXu&lapsrd Description
8. Å"eh; izlj.k Description
Concept Cluster No. 3
tSfodfØ;k,¡
ifjlapj.k
mRltZu
tuu 'olu
iks"k.k ikpu
vukWDlh
'olu vkWDlh 'olu
Å"ek
Å"Ekh; izlkj.k
Lopkfyr fo|qr bL=kh
DoFkukad rki
xyukad Lopkfyr vfXu&lapsrd
DoFkkad xyu
fo|qr /kjk
fo|qr vkos'k
fLFkj fo|qr
fo|qr jks/h fo|qr pkyd

A Critical Appraisal of General Science Content of Class VII Textbooks
Indian Educational Review, Vol. 48, No.1, January 201146
S. No. Concepts/Ideas Nature of Details
1. fo|qqr vkos'k Definition,Descriptions,Categorisation
2. fo|qqrjks/h Definition
3. fLFkj fo|qqr Description definition
4. fo|qqr izokg Definition
5. fo|qqr pkyd Definition
Concept Cluster No. 4
S. No. Concepts/Ideas Nature of Details
1. Lktho cgqdks'kh; Descriptions,Definition,Categorisation
2. dksf'kdk Descriptions,Definition,
3. ÅÙkd Descriptions,Definition,
4. vax Descriptions,Definition,
5. ra=k Descriptions,Definition,
Concept Cluster No. 5
S. No. Concepts/Ideas Nature of Details
1. inkFkZ Descriptions, Categorisation Definition,
2. rRo Descriptions,Definition, Categorisation
3. feJ.k Descriptions,Definition, Categorisation
4. ;kSfxd Descriptions,Definition, Categorisation
5. ijek.kq Definition,
6. v.kq Definition,
Concept Cluster No. 6
lthocgqdks'kh;
dksf'kdk
vax
ra=k ÅÙkd
ijek.kq;kSfxd v.kq
rRo feJ.k
inkFkZ
lw=k
jklk;fud lehdj.k izrhdjklk;fudHkk"kk

A Critical Appraisal of General Science Content of Class VII Textbooks
Indian Educational Review, Vol. 48, No.1, January 2011 47
S. No. Concepts/Ideas Nature of Details
1. jklk;fud Hkk"kk Descriptions, Definition,
2. lw=k Descriptions, Definition,
3. izrhd Descriptions, Definition,
4. jklk;fud lehdj.k Descriptions, Definition,
Concept Cluster No. 7
S. No. Concepts/Ideas Nature of Details
1. dksf'kdk Descriptions, Definition,
2. ekbVªksdksfUMª;k Descriptions, Definition,
3. lsaVªkslkse Descriptions, Definition,
4. v/Zlw=kh foHkktu Descriptions, Definition,Process
5. lelw=kh foHkktu Descriptions, Definition,Process
6. xkkWYthdk; Definition
7. jkbckslksEl Descriptions, Definition,
8. fjfDrdk Descriptions, Definition,
Concept Cluster No. 8
S. No. Concepts/Ideas Nature of Details
1. ok;q osQ vo;o Descriptions,
2. Okk;q osQ lfØ; Hkkx vkWDlhtu gS Descriptions,
3. Okk;q esa tyok"Ik vkSj fuf"Ø; xSlsa Descriptions,
4. Okk;q esa tyok"i vkSj dkcZUk MkbZvkWDlkbZM gS Descriptions,
5 ukbVªkstu Okk;q dk lokZf/d Hkkx Descriptions,
dksf'kdk
osaQnzd
xkWYthdk;
lsaVªkslkse fjfDrdk,¡
ekbVªksdksfUMª;k jkbckslksEl
v/Zlw=kh foHkktu lelw=kh foHkktu

A Critical Appraisal of General Science Content of Class VII Textbooks
Indian Educational Review, Vol. 48, No.1, January 201148
Concept Cluster No. 9
S. No. Concepts/Ideas Nature of Details
1. jklk;fud fØ;k,¡ Descriptions
2. ukbVªkstu ;kSfxdhdj.k Descriptions , Definition
3. mnklhuhdj.k Description, Definition
4. [kk| la'ys"k.k Description, Definition
5. vkDWlhdj.k Description
Concept Cluster No. 10
S. No. Concepts/Ideas Nature of Details
1. jksx Descriptions
2. jksxk.kq Descriptions
3. larqfyr Hkkstu Description
4. gekjk LokLF; vkSj Hkkstu Description
5. fOkfHkUu izdkj osQ jksx ,oa mipkj Description
6. jksx osQ i'pkr~ ,oa y{k.k Description
Concept Cluster No. 11
S. No. Concepts/Ideas Nature of Details
1. izkoQfrd vlarqyu Descriptions
2. i;kZoj.k iznw"k.k Descriptions, Example
3. lalk/ukas dk ßkl Description
4. cnyrk i;kZoj.k Description

A Critical Appraisal of General Science Content of Class VII Textbooks
Indian Educational Review, Vol. 48, No.1, January 2011 49
Concept Cluster No. 12
S. No. Concepts/Ideas Nature of Details
1. èofu Descriptions, Categorisation
2. izfrèofu Descriptions
3. èofu osQ fy;s ekè;e vko';d Description, Example
4. èofu lapj.k Description
Concept Cluster No. 13
S. No. Concepts/Ideas Nature of Details
1. Ikzdk'k dk ijkorZu Descriptions,Definition,Categoration
2. Ikk'oZ ifjorZu Descriptions,
3. lery niZ.k ls izfrfcEc cuuk Description
4. vory niZ.k ls izfrfcEc cuuk Description
5. mÙky niZ.k ls izfrfcEc cuuk Description
Concept Cluster No. 14
S. No. Concepts/Ideas Nature of Details
1. e'khu Descriptions, Example
2. izFke izdkj dk mÙkksyd Descriptions, Example
3. f}rh; izdkj dk mÙkksyd Description, Example
4. rrh; izdkj dk mÙkksyd Description, Example

A Critical Appraisal of General Science Content of Class VII Textbooks
Indian Educational Review, Vol. 48, No.1, January 201150
FIGURE 1Interrelationship among concept cluster of
Class VII content of General Science

A Critical Appraisal of General Science Content of Class VII Textbooks
Indian Educational Review, Vol. 48, No.1, January 2011 51
APPENDIX-I
TEXTBOOK DETAILS
In the present study, content analysis of General Science textbook ofClass VII prescribed by Rajasthan Rajya Pathypustak Mandal, Jaipurwas made. Details of the above mentioned books are as follows:
fo"k; lwph
ikB~;iqLrd Ø- l- ikB i`"B la[;k 1- inkFkkZs dk la?kVu 1 2- jlk;u dh Hkk"kk 13 3- vEy] {kkjd ,ao yo.k 31 4- ok;q osQ vo;o 43 5- dksf'kdk lajpuk 56 6- lthokas esa Ård vax ,Oak ra=k 67 7- tSfod izfØ;k,¡& iks"k.k ,Oka 'olu 80 8- tSfod izfØ;k,¡&ifjlapj.k mRltZu ,Oka tuu 93 9- Lkaarqfyr Hkkstu 10310- fofHkUu izdkj osQ jksx 118
foKku d{kk 7 11- Å"ek 13012- Å"ek dk izHkko 14413- izdk'k dk ijkoZru 15514- èofu 17115- fLFkj fo|qr 18316- lkèkkj.k e'khusa 19617- iQly mRiknu ,oe~ i'kqikyu 21218- i;kZoj.k iznw"k.k 22419- izko`Qfrd lalkèku 23220- egku foKkuh pUæ'ks[kj osadVjeu 241
APPENDIX-II-AConcept in Class VII General Science Textbook and their description
S.No. Concepts Definitions Description Differentiation/Categorisation Process Relationship
1. inkFkZ √ Examples inkFkZ in terms of their state 'kq¼inkFkZ vkSj v'kq¼ inkFkZ Composition
'k q¼ inkFk Z in terms of their
Composition v'kq¼ inkFkZ in terms
of their Composition
2. rRo √ Examples rRo in terms of physical and
chemical Characteristic
3. feJ.k √ Examples Lkekax feJ.k vkSj vLkekax feJ.k :Constitution
4. ;kSfxd √ Examples, √Illustration
5. jklk;fud fØ;k √ Examples √ 6. izrhd √ Examples
7. v.kq lw=k √ Examples

A Critical Appraisal of General Science Content of Class VII Textbooks
Indian Educational Review, Vol. 48, No.1, January 201152
8. jklk;fud √ Examples √lehdj.k
9. mnklhuhdj.k √ Examples, √vfHkfØ;k Illustration
10. Yko.k √ Examples
11. ukbVªkstu √ Examples √;kSfxdhdj.k
12. dksf'kdk √ Structure,Function
13. lelw=kh √ √foHkktu
14. v/Zlw=kh √ √foHkktu
15. jkbckslksEl √ Structure,Function
16. xkYthdk; √ Structure,Function
17. fjfDrdak,¡ √ Structure,Function
18. ekbVªksdksfUMª;k √ Structure,Function
19. osaQæd √ Structure,
Function
20. lsaVªkslkse √ Structure,
Function
21. Ård √ Structure, tUrq Ård vk Sj iknd ÅrdFunction :Structure, tUrq Ård in terms
of their structure and
function, iknd Ård in termsof their structure Location
and function, tUrq foHkkT;ksrdÅrd vkSj LFkk;h Ård in termsof structure
22. 'olu √ Structure,
Function
23. vWkDlh'olu √
24. vukWDlh 'olu √ √
25. iks"k.k √ Examples, lthoksa esa iks"k.k ,oa ikni esa iks"k.k √Illustration
26. [kk| la'ys"k.k √ √
27. ifjlapj.k √ Structure,
Function √28. mRltZu √ Structure,
Function √29. tuu √ Structure, vySfxad tuu vkSj ySfxad tuu tarqvksa √
Function esa ySfxad tuu vkSj ikniksa esa ySfxad
tuu eknk tuu vkSj uj tuu

A Critical Appraisal of General Science Content of Class VII Textbooks
Indian Educational Review, Vol. 48, No.1, January 2011 53
30. Lkarqfyr Hkkstu √ Definition,
Example
31. jksx √ Definition,
Example
32. jksxk.kqq √
33. Å"ek √ Example
34. Rkki √ tc oLrq dks
Å"ek nsrs gSrks mldk rkic<+ tkrk gaSA
35. xyau √ Example,
Illustration √36. xyaukd √
37. DoFku √ Example, √Illustration
38. DoFkuakd √ √
39. m"eh; izlkj.k √ Bksl] æo v©j xSlh; m"eh; izlkj.k √
40. Lopkfyr √ Structure,
vfXu la;rd Function
41. Lopkfyr √ Structure,
fo|qr bL=kh Function
42. izdk'k ijkorZu √ fu;fer ijkorZu vkSj folfjr ijkorZu √
43. Ikk'oZ ifjorZu √
44. izfrfcEc √
45. èofu {kh.k ,oa izcy èofu ean √
,o rh{.k èofu46. èofu lapj.k √ Illustration √
47. izfrèofu √
48. izko`Qfrd √ Example euq"; dhvlaraqyu vfu;ksftr
vk£Fkd xfr&fofèk lsizko`Qfrdvlraq"V
49. i;kZoj.k iznw"k.k √ i;k Zoj.k i znw"k.k in terms ofcomponent of environment
50. izko`Qfrd √ Example,
lalk?ku Illustration
51. fLFkj fo|qr √ Example,
Illustration
52. fo|qr vkos'k √ Example, ?ku vkos'k vkSj ½.k vkos'kIllustration
53. fo|qr pkyd √

A Critical Appraisal of General Science Content of Class VII Textbooks
Indian Educational Review, Vol. 48, No.1, January 201154
54. fo|qr&jks/h √
55. e'khu √ Example, Lkk/kj.k e'khu vkSj tfVy e'khu √ Illustration
56. mÙkksyd √ izFke izdkj mÙkksyd f}rh; izdkj √mÙkksyd vkSj r`rh; izdkj mÙkksyd
57. tSfod fØ;k,¡ √ Example, √Illustration
APPENDIX-II-B
Other ideas in Class VII General Science textbook and their description
S.No. Ideas Descriptive Illustrative Explanatory
1. inkFkZ vR;Ur lw{e d.kksa ls feydj curs gSA √ 2. Å"ek ifjorZu ls inkFkZ dh voLFkk cny tkrh gSA √ 3. ok;q osQ vo;o
ok;q dk lfØ; Hkkx vkWDlhtu √ √ukbVªkstu ok;q dk lokZf?kd Hkkx √ √ok;q esa tyok"i vkSj dkcZu MkbvkWDlkbM ,oa /wy √osQ Bksl d.k fuf"Ø; xSlsa
4. tSfod fØ;kvksa osQ fy;s ÅtkZ t:jh √ √ 5. vax ,oa r=ak dk fuekZ.k √ 6. cnyrk i;kZoj.k √ 7. lalk/kuksa dk ßkal √ 8. fofHkUu izdkj osQ jksx ,oa mipkj √ √ 9. O;fDrxr ,oa lkeqnkf;d LokLF; √ √10. jksx dh igpku ,oa y{k.k √11. gekjk LokkLF; vkSj Hkkstu √12. egku foKkuh pUæ'ks[kj osadVjeu osQ thou dk o.kZu √13. O;fDrxr ,oa lkeqnkf;d LokLF; ,oa i;kZoj.k LoPNrk √
APPENDIX-III
Figure and diagram analysis of Class VII General Science textbookChapter Figure & Diagram Analysed No.
1. 1 fofHkUu oLrq,a √2 Å"ek ls inkFkZ dks fofHkUu voLFkkvksa esa ifjorZu √3 izÑfr esa fofHkUu rRoksa dh izfr'kr ek=kk √
2. 1 lksfM;e o Dyksfju ijek.kq dh lajpuk √2 ued cuus dh izfØ;k √
3. 1 vkWDlkbM cukus dh fof/ √ √ √
4. 1 ok;q dk izfr'kr la?kBu vk;ru osQ vuqlkj √ √
Figuresillustrating
way of settingup apparatus
for activity
Figures thatillustrate
only
FiguresRequiring
students toperform activity

A Critical Appraisal of General Science Content of Class VII Textbooks
Indian Educational Review, Vol. 48, No.1, January 2011 55
2 iz;ksx'kkyk eas vkWDlhtu cukuk √ √3 vkWDlhtu osQ mi;ksx
5- 1 tUrq dksf'kdk (lk/kj.k lw{en'khZ }kjk ns[kk x;k) √2 tUrq dksf'kdk (bysDVªku lw{en'khZ }kjk ns[kk x;k) √3 var% iznO;h tkfydk √4 ekbVªksdksfUMª;k √5 xkWYthdk; √6 osaQnzd √7 ikni dksf'kdk √8 fofHkUu vko`Qfr dh dksf'kdk,¡ √9 lelw=kh foHkktu √
10 v¼ZZlw=kh foHkktu √
6- 1 midyk Ård dksf'kdk,¡ √2 vfLFk ÅÙkd √3 :fèkj ÅÙkd √4 is'kh; ÅÙkd √5 raf=kdk dksf'kdk √6 rus dh vuqçLFk dkV √7 foHkkT;ksrd ÅÙkd √8 e`nqrd √9 LFkwydks.kksÙkd √
10 n`<+ksrd √11 nk: tk;ye ÅÙkd √12 iksFkokg ÅÙkd √13 vkek'k; esa mifLFkr ÅÙkd √14 ÅÙkd vax ra=k √
Figures & Diagrams from chapter No. 7 to chapter No. 17 of Class VII GeneralScience textbook were also analysed in the above manner.

Quest over Courses of Study: Deciding for Teacher Rating Scale
Indian Educational Review, Vol. 48, No.1, January 201156
Quest over Courses of Study: Deciding forTeacher Rating Scale
SUDESHNA LAHIRI*
Abstract
The focus is now shifting from improvement in the quantity of schoolsto improvement in the quality of teachers. Hence, reaffirming the roleand performance of facilitators become significant in the pursuit ofquality education. In this regard, policy makers and administratorshave suggested that student evaluation of teachers (SET) should beintegral part of the Teacher appraisal. Reviewing the recommenda-tions by different committees for improvement in educational systemin India, the question arises — whether questionnaires for rating teach-ers used to evaluate the teachers should be course specific? What isthe status of teachers when they are rated on a uniform questionnaireused in spite of having different streams? Thus, the present study isconducted with a framed objective — to find out the effect of course onstudent evaluation of teachers. A sample of 1711 higher secondaryschool students is made to rate 93 teachers. It is found that course hasan effect on student evaluation of teachers on more than one dimen-sion of “teacher effectiveness”.
Because, teacher plays a key role in carrying out the structuring ofthe society and nation, Education Commission (1966) has rightlysaid, “Of all different factors which influence the quality of educationand its contribution to national development, the quality, competenceand character of teachers are undoubtedly the most significant”. Thus,the importance of a teacher in the educational processes isunquestionable as he/she is architect and designer of all classroominteraction. Further, UNESCO (1972) has also reported that new rolesare expected from the teacher in Asian Schools. He has to become ademocratic leader, a friend and guide to his pupils and their parents
Research Notes
*Assistant Professor, Department of Education, University of Calcutta

Quest over Courses of Study: Deciding for Teacher Rating Scale
Indian Educational Review, Vol. 48, No.1, January 2011 57
in community. In view of the significance of the role in educationplayed by teachers, due to the rapid and drastic developments intechnology, economy, and politics, teachers would face morechallenges and uncertainties in performing a wider range of dutiesand taking up more responsibilities in 21st Century. The plea is thatlet the teachers accept responsibility and be accountable for theirpart in the declining standards of education and cooperate tocontribute positively in a constructive manner, as there has been aconsiderable increase in the amount of effort put into improving theteaching-learning process in schools in India and different parts ofthe world. To ensure quality education, policy makers haverecommended implementation of regular evaluation of teacherperformance and ensuring their accountability, with the introductionof pay scale revision. In 1971, S.R. Sen Committee whilerecommending the higher pay scales had added the need for code ofconducts (Professional ethics) to be made part of it. Recommendationfrom National Policy of Education (NPE) (1986) has suggested “AnnualPerformance Appraisal” for the teachers of colleges and Universitiesobserving a comprehensive open participatory database system ofteacher evaluation with the inputs from self, peers, heads ofinstitutions/departments, students and others. However, it has beenrealised that performance evaluation of teachers is an extremelydelicate and solemn task, which requires a high degree of uprightnessand integrity on the part of assessor. As in most academic institutions,the Principals/Heads always evaluate the teachers at the end of theacademic year when the confidential report is prepared. A major flawin the system is that the principal is so engaged in administrationthat he or she cannot devote time in monitoring, assessing and takingremedial measures for improving the quality of education beingimparted. Moreover, the permanent staff in the institution finds itoffensive that the all powerful Principal would intrude into theirclassroom without invitation. In this regard, policy makers andadministrators suggest that students would not be the silent partnersas students have front row seat to observe classroom processes andare the best judges of what they have learnt (Scriven, 1995). For thelast three decades, committees appointed, in India, to discuss effectivemeasures for the accountability of teachers recommend to implement‘Student Evaluation of Teachers’ to ensure quality teaching. TheRastogi Pay Committee (1997) instituted by the University GrantsCommission (UGC) has stressed that student appraisal of teachersshould be an integral part of the package of recommendation on payscale and service conditions. Mehrotra committee (1987) also agrees,

Quest over Courses of Study: Deciding for Teacher Rating Scale
Indian Educational Review, Vol. 48, No.1, January 201158
with NPE (1986), the need for compulsory annual submission of‘Performance Appraisal’ and students should evaluate theirperformance. The National Assessment and Accreditation Council(NAAC) of India, established by the University Grants Commission in1994 to initiate quality management procedure, has made theinstitution of higher education to introduce student evaluation ofteachers as one of the criteria for assessing teaching quality. Theguidelines given by NAAC for Internal Quality Assurance Cell (IQAC)consist of various questionnaires for collecting feedback from studentsin structured way. Similarly, Technical Education QualityImprovement Programme (TEQIP) of Government of India consequentto implementation of reforms derived from National Policy of Education(NPE-1986 as revised in 1992) by institutions. The reforms to becarried out, among others, may include establishing the practices ofstudent evaluation of teachers’ performance and teachingcounseling. The committees that also recommend student evaluationof teachers (SET) as an integral part of appraisal system areProfessor Amrik Singh Committee, Ashok Mitra Education commissionduring early 1990s and the current ‘Perspective Plan’ by HigherEducation Commission of West Bengal. In recent decision, theKendriya Vidyalaya Sangathan has decided to adopt a system ofevaluation of teachers by the students. According to the new rule(i.e., 81-E), children from class V to XII would be given printedassessment forms in the month of October and they would have toput tick mark against the appropriate grading. Tracing the origin ofthe concept, Student Evaluation of Teachers (SET), the process isfirst used in 1920’s in University of Washington for deciding tenurefor teachers, although it is started as a measure in US campuses foradministrative decisions since 1960’s. A recommendation for SETtops the list among the six suggestions for improvement of teachingmade by the Carnegie Commission (1972) for US campuses. The area,i.e., SET, has been the frequently visited by Educational Researchersin Euro-American academe since 1960; however, it is still unexploredin Indian scenario. Therefore, before making the process an integralpart of Teacher Appraisal System, a deep probe research should beconducted in Indian campus to constitute it’s layout. The first steptowards it is to develop the instrument, which could suitably matchthe objectives, purposes and needs of the system (i.e., SET).Development of the format of Teacher Rating Form is an essentialtask for quality assurance as quality is the most important agendain the eve of most awaited sixth pay commission because the appeal

Quest over Courses of Study: Deciding for Teacher Rating Scale
Indian Educational Review, Vol. 48, No.1, January 2011 59
is to make teaching job more attractive in terms of pay packages andservice conditions. Although, the process (SET) is struggling for itsexistence in Indian educational system, premier Institutions alongwith those managed by private bodies have enforced this system ofteacher appraisal without evolving scientifically developed ‘RatingForm’ for teachers. This, in return, leads to the pertinent question:whether uniform format should be used for evaluating the teachersfrom different courses of study? Because, policy makers have notmade any clarity in instruction for differential process\format forrating of teachers for different courses. Thus, the evaluation ofteachers is carried out in campuses blindly following the hypothesisthat there is no significant effect of courses on Student Evaluation ofTeachers. Review of related literature gives a sharp edge for testingthe hypothesis statistically. Because ‘SET’ has been frequently visitedarea for Euro-American researchers, the studies conducted suggestvaried results over the effect of course on student ratings. Exploringthe course variables, it is required/elective, day or evening, courselevel, academic major versus minor, prior subject interest are seenaffecting students’ ratings (Papalewis, 1990; Scherr & Scherr, 1990).Branes and Branes (1991) address in their study that althoughstudent evaluation data provide a reasonable basic for makingdecisions about instructors when generalisability across course andstudents. When the course is the object of measurement (OM), dataare less generalising. Conclude that this finding may be due to thetype of evaluation items used for academic discipline differences inthe type of courses selected for the study. Marsh (1982c) points thatweak tendency for higher ratings in humanities and lower ratings inscience but too fewer studies to be clear. Researchers also suggestthat humanities courses tend to be rated higher than those in scienceand engineering; upper level courses tend to be rated higher thanlower level courses (Feldman, 1983; Marsh & Dunkin, 1992). Becauseeach discipline may vary with respect to the type of teaching styleused (Hudak & Anderson, 1984), students with engineering majorsmay evaluate humanities, social sciences and natural scienceprofessors more negatively because they may be less accustomed totheir teaching styles or have less interest in those courses than otherstudents (Basow & Silberg, 1987). Study conducted by Basow andDistenfeld (1985) finds that student major also has an effect on theevaluations of professors. Engineering majors give the least positiveratings on each factor, perhaps because no engineering professorsare evaluated. Similarly, professors of humanities courses are always

Quest over Courses of Study: Deciding for Teacher Rating Scale
Indian Educational Review, Vol. 48, No.1, January 201160
rated more than professors of social science, natural science courses,and engineering, a common pattern (Adams, 1997; Cashin, 1988;Marsh & Dunkin, 1992; McKeachie, 1996). Again, Schenkler andMcKinnon (1994) suggest that course level appears to be a consistentvariable that displays the greatest effect on student evaluation withstudents in more advanced courses indicating greater satisfactionwith the instructor performance. Haskell (1997) points that requiredcourses hold less interest and receive lower evaluations than electivecourses. Ratings are generally higher for senior than for junior coursesand for optional than for required courses (Feldman, 1978; Marsh,1980, 1983; Murray et al., 1990). Cahn (1987) suggests that studentevaluation of teachers measure attitudes toward instructor’s course.Similarly, Evans (2004) finds that a link between a students’ leastpopular teacher and the student’s worst subject. Their favouriteteacher is also the teacher of their best subject. Researchers alsofind effect of course taught on student ratings in interaction withgender. When the interaction of student gender is considered, Lucek,Endres and Caplan (1993) in Mass Communication show that malestudents rate male instructors higher and that female students ratefemale instructors higher. Similarly, because female faculty are mostrepresent in the humanities, they are not viewed as verynontraditional by their students, although students may have same-gender preferences in terms of teaching styles when teacher genderis also considered. In social sciences, however, which are composedprimarily of business and economics and government and law-faculty,female professors are underrepresented and likely to be viewed asnon-traditional (Sidanius & Crane, 1989; Tieman & Rankin-Ullock,1985). Contradictory to the researches revealing the effect of course,Marsh and overall (1981) demonstrate that the instructor is theprimary determinant of student ratings rather than the course he orshe teaches. Gilmore et. al. (1978), applying generalisability theoryto student ratings, also find that the influence of the instructor whoteaches the course is much larger than that of course that is beingtaught. The conducted study suggests that ratings for a giveninstructor should be arranged across different courses to enhancegeneralisability. Reviewing the related literature, it has been observedthere is a scarcity of research in India on the area “Student Evaluationof Teachers”. The reported study on SET in Indian setup conductedby Balachandran (2000) in Madras University, finds that Economicsteachers have improved slightly more than English language teachersas a result of feedback by student evaluation. English being foreign

Quest over Courses of Study: Deciding for Teacher Rating Scale
Indian Educational Review, Vol. 48, No.1, January 2011 61
language, teachers may need more feedback of ‘student evaluation’sessions before improvements can result in English Languageteachers at par with teachers of other subjects. However, it does notstudy the effect of course/stream of studies on student evaluation ofteachers. The review of literature left the question unanswered thatwhether course specific questionnaires should be used to evaluatethe teachers. The present paper attempts to investigate the status ofteachers having different streams when students are ratings teacherson same format of Rating Scale.
OBJECTIVE
1. To find out the status of Higher Secondary School Teachers ofdifferent courses of study in relation to student evaluation ofteachers.
2. To find out the effect of courses of study on student evaluation ofteachers.
METHODOLOGY
Sample: From randomly selected 17 schools from urban area ofVaranasi (India), 1750 Higher Secondary level students are made torate 105 teachers. Because 39 rating forms are eliminated due toincomplete responses, final sample consists of 889 male and822 female students evaluating 57 male and 48 female teachers.Tool: A Teacher Rating Form (modified and adapted from Basow &Silberg, 1987) is used to measure student evaluation of teachers.The Rating Form is composed of 30 items responded over 5-pointLikert-scale ranging from Very Poor (1) to Excellent (5). The items areequally divided among six dimensions of teacher effectiveness:Scholarship, Organisation/Clarity, Teacher-Group Interaction,Teacher-Individual Student Interaction, Enthusiasm/Dynamism andPersonal Qualities. Internal reliability is established throughCronbach alpha, which is 0.7518.Procedure: All 17 schools are managed by private bodies and followCBSE syllabus. Each of the 105 teachers are having Post-graduatedegrees and teaching in Higher Secondary Classes. To investigatethe effect of course, students evaluate 41 teachers from Science,33 from Humanities and 31 from Commerce stream. Overall, eachteacher is rated by an average of 16.29 students. For analysing theeffect of courses, F-tests are computed among mean ratings of teachers

Quest over Courses of Study: Deciding for Teacher Rating Scale
Indian Educational Review, Vol. 48, No.1, January 201162
grouped according to streams (i.e., Science, Arts and Commerce).Post-hoc test is carried out to investigate the significance of differenceamong mean ratings of teachers using Student –Newman-Keuls test.
RESULT
Because the developmental problem of teacher evaluationprogrammes begins with the fundamental consideration: evaluationof what? If a student evaluation of teacher is the measure of “teachereffectiveness”, then it should provide the measures of separatedimensions. By using the responses of 1711 students, inter-correlation among the dimensions is calculated. Inter-correlatedmatrix is given in Table 1.
TABLE 1 Inter-correlation matrix among various dimensions
D1 D2 D3 D4 D5 D6
D1 1 0.879* 0.894* 0.758* 0.843* 0.688*
D2 1 0.904* 0.796* 0.845* 0.810*
D3 1 0.822* 0.837* 0.793*
D4 1 0.805* 0.731*
D5 1 0.741*
D6 1
*Significant at 0.01 level of confidence
D1 = ScholarshipD2 = Organisation/ClarityD3 = Teacher-Group InteractionD4 = Teacher-Individual student InteractionD5 = Enthusiasm/DynamismD6 = Personal Qualities
Correlation as given in Table 1 shows that six dimensions includedin test are highly interrelated. The inter-correlation among thedimensions is established to show that although they are separatedimensions but overlaps to capture a common abstract that is ‘teachereffectiveness’.
1. Status of Higher Secondary School Teachers of differentcourses of study in relation to student evaluation of teachers.
To find out the status of teachers of different courses of study whenstudents rating the teachers, mean, S.D. and S.E. are computed.

Quest over Courses of Study: Deciding for Teacher Rating Scale
Indian Educational Review, Vol. 48, No.1, January 2011 63
Table 2 shows descriptive statistics giving the status of the teachersacross six dimensions for each of three courses e.g., Science,Humanities and Commerce.
TABLE 2Status of Student Evaluation of Teachers on
Different Courses of Study.
VARIABLES MEAN S.D. S.E.
1. ScholarshipScience 15.9781 2.9017 0.4278Humanities 17.8267 2.5099 0.5477Commerce 17.9008 2.8409 0.5682
2. Organisation/ClarityScience 17.0188 3.2842 04842Humanities 17.8895 3.2196 0.7026Commerce 18.7590 2.9196 0.5839
3. Teacher-Group InteractionScience 15.1458 3.0799 0.4541Humanities 17.0990 2.8229 0.6160Commerce 17.32 3.1076 0.6215
4. Teacher-Individual Student InteractionScience 16.1276 3.3878 0.4995Humanities 16.5662 2.3157 0.5053Commerce 17.3546 2.8381 0.5676
5. Enthusiasm/DynamismScience 17.2672 3.4950 0.5153Humanities 17.7505 2.6567 0.5773Commerce 18.7752 3.1377 0.5313
6. Personal QualitiesScience 17.6030 2.9932 0.4462Humanities 17.8130 3.2430 0.7077Commerce 19.0456 2.5651 0.5130
Status of the teachers in relation to student evaluation of teacherscan be determined and compared on the basis of mean rating(Table 2) obtained. It can be concluded from Table 2 that teachersfrom Commerce stream have been rated highest across each ofsix dimensions, i.e., Scholarship, Organisation/Clarity, Teacher-Group Interaction, Teacher-Individual Student Interaction,Enthusiasm/Dynamism and Personal Qualities. Similarly, Teachersfrom Science stream have received lowest rating across everydimension on administered Rating Form. The table 2 furthersuggests that when compared for six dimensions within each coursesof study, Teachers from Commerce and Science stream are highlyrated in ‘Personal Qualities’ whereas teachers from Humanitiesscored high in ‘Organisation/Clarity’.

Quest over Courses of Study: Deciding for Teacher Rating Scale
Indian Educational Review, Vol. 48, No.1, January 201164
2. To find out the effect of courses of study on student evaluationof teachers.
To find out the effect of course, individual student ratings across thesix dimensions are subjected to F-tests are given in Table 3.
TABLE 3Effect of Courses of Study on Student Evaluation of Teachers
VARIABLES MEAN S.D S.E F SIG
1. ScholarshipScience 15.9781 2.9017 0.4278 5.23* 0.007Humanities 17.8267 2.5099 0.5477Commerce 17.9008 2.8409 0.5682
2. Organisation/ClarityScience 17.0188 3.2842 0.4842Humanities 17.8895 3.2196 0.7026 2.486 0.089Commerce 18.7590 2.9196 0.5839
3. Teacher-group InteractionScience 15.1458 3.0799 0.4541Humanities 17.0990 2.8229 0.6160 5.409* 0.006Commerce 17.32 3.1076 06215
4. Teacher-individualScience 16.1276 3.3875 0.4995Humanities 16.5662 2.3157 0.5053 1.328 0.270Commerce 17.3546 2.8381 0.5676
5. Enthusiasm/DynamismScience 17.2672 3.4950 0.5153Humanities 17.7505 2.6567 0.5773 1.910 0.154Commerce 18.7752 3.1377 0.5313
6. Personal QualitiesScience 17.6030 2.9932 04462Humanities 17.8130 3.2430 0.7077 2.013 0.140Commerce 19.0456 2.5651 0.5130
* Significant at 0.01 level.From Table 3, it can be concluded that there is a significant effect
of courses on student evaluation of teachers over dimensions, namely,Scholarship and Teacher-Group Interaction at 0.01 level ofconfidence. Comparing the means obtained for three courses ofstudies over six dimensions, it has been found that teachers fromscience stream received lowest mean ratings. Teachers fromCommerce stream received highest mean ratings among threecourses on each of the six dimensions of ‘teacher effectiveness’. Post-hoc tests have been carried out to find out the significant differencesamong mean ratings of teachers belonging to three courses, i.e.,science, arts and commerce, across six dimensions. Thus, data are

Quest over Courses of Study: Deciding for Teacher Rating Scale
Indian Educational Review, Vol. 48, No.1, January 2011 65
subjected to Student- Newman- Keuls tests to investigate the furthersignificant differences. Results are shown in Table 4.
TABLE 4Results of student-newman-keuls test for difference
in mean ratings in relation to course.Variables Subset for Alpha = 0.01
1. ScholarshipScience 15.9781 17.8267Humanities 17.9008Commerce
2. Organisation/ClarityScience 17.0188Humanities 17.8895Commerce 18.7590
3. Teacher-group InteractionScience 15.1458 17.0990Humanities 17.3200Commerce
4. Teacher-individual Student InteractionScience 16.1276Humanities 16.5662Commerce 17.3546
5. Enthusiasm/DynamismScience 17.2672Humanities 17.7505Commerce 18.7752
6. Personal QualitiesScience 17.6030Humanities 17.8193Commerce 19.0456
Results from Table 4 confirm that mean rating of teachers from sciencestream is significantly different from mean ratings of teachersbelonging to arts and commerce streams. For Organisation/clarity,Teacher-Individual Student Interaction, Enthusiasm/Dynamism andPersonal Qualities, there are no significant differences in the meanratings of the teachers belonging to Science, Arts and Commerce.
DISCUSSION
Gradually, a kind of critical but constructive observation by studentsis becoming the part of most teacher appraisal system in India. Beforemaking the process (i.e., SET) mandatory in every educationalinstitution, a pertinent question has to be addressed that whetherit is required to develop a uniform format for the teachers of allcourses available. It has been observed in many appraisal system,

Quest over Courses of Study: Deciding for Teacher Rating Scale
Indian Educational Review, Vol. 48, No.1, January 201166
it is not the students’ opinion that have necessarily been solicitedrather they are answering administrators’ questions without givingthe matter any thought when they are supposed to ‘evaluate’ teacher.Methodologically poor “evaluation” not only fail to measure professionalcompetency of the teachers, but also practically result in alienatingthe relationship between teacher and the administrators, hardlyleaving any scope for improvement of performance. Wherever anunscientifically developed Teacher Appraisal process is conducted,it gives hardly any scope for two-way dialogue and objective of givingopportunity to a teacher for self-improvement remains unfulfilled.Thus, the process has been imposed and fate of the teachers hasbeen decided without realising the consequences. However, aneffective administration one which gets results that does not criticiseteachers but assumes supportive roles to teachers. Because thereported study attempts to find out the status of the teachers whenthe same format for Rating Form is administered over the teachershaving different stream of studies, it has been found that studentsrate their teachers differentially with courses. Teachers belonging toScience stream are poorly rated than their counterparts. This amplyraises a quest whether teachers from science stream fail to showtheir “effectiveness” or it is the differential expectation related to thestream that pulls their ratings down. Thus, the objective 2 of thisstudy investigates upon the effect of courses on student evaluationof teachers (SET). The present study reveals that there is a significanteffect of course on student evaluation of teachers on more than onedimension of “teacher effectiveness”. When Post-hoc tests are applied,it has been found that mean ratings of Science teachers aresignificantly different from mean ratings of teachers from Commerceand Humanities for the dimensions: Scholarship and Teacher- GroupInteraction. The result is supported by previous researches whereMarsh (1981 b) argues that students’ ratings primarily reflect theeffectiveness of the instructors may be uniquely suited to teachingsome specific courses. Marsh (1994) assumes that every teachingmethod is effective for every course objective and suggests that thereis a single (correct) way to teach. Similarly, Instructional Developmentand Effective Assessment (IDEA) is based on the assumption, whichis supported by IDEA’s empirical data (Cashin & Perrin, 1978; Cashin& Sixbury, 1992; Hoyt & Cashin, 1977). The assumption is thatdifferent courses have different instructional objectives and therefore,various teaching methods will be differently related to achievementper cent or at least to student’s reports of progress — one different

Quest over Courses of Study: Deciding for Teacher Rating Scale
Indian Educational Review, Vol. 48, No.1, January 2011 67
course objectives. Researchers also suggest that the classroom alsoprovides the stage for interaction between students and teachers,its characteristics limits the choices of teaching strategies and modeof exchange between the two (Ting, 2000). Thus, student ratings maypartly reflect the class-specific experience. Because classcharacteristics vary from one course to another, sometimes the sameteacher may not get consistent ratings across different types ofcourses. Chang (2000) also finds that course difficulty is negativelycorrelated with all evaluation scores. Reviewing these studies andconsidering Indian socio-economic scenario, low ratings acquired byscience teachers in present study (Table 3) may be due to thedifferential expectations with the course. Students belonging toscience stream, face a threat of throat cut competitive examinationin India just after the completion of their Higher secondary school.This may result for a quench of knowledge, more often, up to thelevel where they can meet the requirement of competitiveexaminations. Thus, a teacher from science stream has to regularlyupdate its knowledge and should be equipped with skills andtechniques to disseminate the knowledge effectively. Moreover, mostof the study materials and content in science stream are availablein English. Thus, a dual competency is required for being well versedwith the language and conceptualising the course content, beforedisseminating the subject knowledge. The expectation is to haveknowledge of a broad range of content in sufficient depth to conveythe information in meaningful ways to the students. The low ratingsfor science teachers, especially for “Scholarship”, may also beaccounted by differences in method for teaching science. Similarly,science teaching may involve and require different method thanHumanities and Commerce. The question arises— how legitimate itis to put the teachers forcibly into same frame of questionnaire whenthe method of teaching is course specific? When review of literature(1984 to 1991) has been undertaken by Finely and Crawely (1993)to examine the instrument available for use of science educators,very few instrument are found to evaluate science educators. In India,the UGC involving representatives of All India Federation of Collegeand University Teacher’s Association has prepared two differentformats of performance appraisal, for assessing the teachers, one forthe teachers of Arts and Science colleges and other for teachers ofprofessional colleges. However, the committee does not suggest thespecificity of the format of the questionnaire used for collecting studentratings of teachers. Thus, it is in practice to administer same

Quest over Courses of Study: Deciding for Teacher Rating Scale
Indian Educational Review, Vol. 48, No.1, January 201168
questionnaire over the teachers belonging to different courseswhenever the process (i.e., SET) is employed. This makes the entireprocess of SET a convenient matter of picking and choosing whatserves to comply with the original hypothesis of the SET designer/administrator rather than engaging in an honest evaluation.This means the evaluation is like a shopping list of potentiallyconforming characteristics. For remedial measure, researchers revealabout the use of SET (Braskamp & Ory, 1994; Cashin, 1995): 1. Toincrease comparability across faculty and departments, evaluationsshould be administered with a standard set of institution-wideprocedures 2. Due to differences in student ratings by discipline,administrators comparing ratings for personal decisions or awardsacross such discipline should be very cautious.
In sum, student evaluation of teachers should be used to helpteachers for career development by securing feedback for reflectionand self-scrutiny. It should also serve as a touchstone to effectiveteachers. Therefore, course specific format should be designed toevaluate teachers. It is necessary to identify and select items relatedto the nature of the course. An effective Teacher Rating Form willenable teachers to know when he performs well and when he doesnot and how he needs to develop to become more valuable to him, theschool and the students. If a single format is used for all courses,rating obtained by teachers should only be compared within thestream to which they belong. Because teachers may feel inept andconfused when they receive lower ratings affected by the course ofstudies, they may be forced to keep changing their styles, ultimatelyloosing interest from their profession. Thus, it is important not onlyto develop performance appraisal system but also imbibe a positiveattitude towards it.
REFERENCES
ACHARYA, D. 2004. Chhatroder Reporte Uttor Bongo Biswavidyalaya kaaj GeloPaanch Shikhokher. Anandabazar Patrika. May 30, 2004.
ADAMS, JOHN V. 1997. Student Evaluations: The Ratings Game. Inquiry,Vol. 1, No. 2, 10-16.
BALACHANDRAN, E.S. 2000. Student Evaluation for Effective Teaching. RajammalPublications. Chennai, India.
BARNES, LAURA L.B., and BARNES, MICHAL. 1991. Effects of Academic Disciplineon Generalisability of Student Evaluations of Instruction. In: AnnualMeasurement in Education. Chicago, IL, April 4-6, 1991.

Quest over Courses of Study: Deciding for Teacher Rating Scale
Indian Educational Review, Vol. 48, No.1, January 2011 69
BASOW, S. A. 1995. Student evaluations of college professors: when gendermatters. Educational Psychology, 87, pp. 656-665.
BASOW, S.A. 1998. Student evaluations: the role of gender bias and teachingstyles. In L.H. COLLINS, J.C. CHRISLER, and K. QUINA(EDS.). Career Strategiesfor Women in Academe: Arming Athena (pp. 135-156). (Thousands Oaks.CA: Sage).
BASOW, S.A., and DISTENFELD, M.S. 1985. Teacher Expressiveness: moreimportant for males than females? Journal of Educational Psychology,77, pp. 45-52.
BASOW, S.A., and SILBERG, N.T. 1987. Student evaluations of college professors:are female and male professors rated differently? Educational Psychology,79, pp. 308-314.
BRASKAMP, L.A., and ORY, J.C. 1994. Assessing faculty work. Jossy- Bass.
Carnegie Commission on higher Education.1972. Reform on Campus:Changing Students’ Academic Programs. New York: McGraw-Hill.
CASHIN, W.E. 1988. Student Ratings of Teaching: A Summary of the Research.IDEA Paper No. 20. ERIC No: ED 302567.
CASHIN, W.E. 1995. Student ratings of teaching. The research revisited. Ideapaper No. 32. Center for faculty Evaluation and Development. KansasState University.
CHANG, TE-SHENG. 2000. What are teacher College students telling us aboutthem? Paper presented at the Annual Meeting of the American EducationalResearch Association. New Orleans, L.A., April 24 -28, 2000.
EVANS, D.R. 2004 Student Evaluations of Teachers. Journal of Nursing Studies.NCNJ, Vol.3, No.1, 91-99.
Express News Service. 1997. UGC Recommends: Massive Pay Hike. June13, Friday.
FELDMAN, K.A. 1978. Course characteristics and college students’ ratings oftheir teachers and courses: What we know and what we don’t. Researchin Higher Education, 9, 199-242.
FELDMAN, K.A. 1983. The seniority and instructional experience of collegeteachers as related to the evaluations they receive from students.Research in Higher Education, 10, 149- 172.
FINELY, SANDRA and CRAWLEY, FRANK E. 1993. Student Evaluation of TeacherPerformance: A Review of Literature and Instruments for ScienceEducators. Paper Presented at the Annual Meeting of the NationalAssociation for Research in Science Teaching. Atlanta, GA, April 1993.
GILMORE, G.M., KANE, M.T., and NACCARATO, R.W. 1978. The generalisability ofstudent ratings of instruction: Estimates of teacher and coursecomponents. Journal of Educational Measurement, 15, 1-13.

Quest over Courses of Study: Deciding for Teacher Rating Scale
Indian Educational Review, Vol. 48, No.1, January 201170
HASKELL, ROBERT. 1997. Academic Freedom, Promotion Reappointment, Tenureand the Administrative Use of Students Evaluation of Faculty: (Part II)Views from the Court. Education Policy Analysis Archives, Vol. 5, No. 17.
MARSH, H.W. 1980. The influence of student, course and instructorcharacteristics on evaluations of university teaching. AmericanEducational Research Journal. !7, 219- 237.
MARSH, H.W. 1983. Multidimensional ratings of teaching effectiveness bystudents from different academic settings and their relation to student/course/ instructor characteristics. Journal of Educational Psychology,74, 264- 279.
MARSH, H.W. 1994. Weighting for right criteria in the instructionaldevelopment and effectiveness assessment (IDEA) system: Global andspecific ratings of teaching effectiveness and their relation to courseobjectives. Journal of Educational Psychology, vol.86, No. 4, 631- 648.
MARSH, H.W., and DUNKIN, M.J. 1992. Students’ evaluations of universityteaching: A multidimensional perspective. In J. Smart (Ed.), HigherEducation: Handbook of Theory and Research. New York: Agathon.
MC KEACHIE, WILBERT J. 1997. Student Ratings: The Validity of Use. AmericanPsychologist, 52(11) 1217-1225.
MISHRA, R.C. 1999. Research on education in India. Prospects. Vol. XXIX,No. 3, 335-346.
MURRAY, HARRY and OTHERS 1990. Teacher Personality traits and StudentInstructional Ratings in Six Types of University Courses. Journal ofEducational Psychology, Vol. No. 2, 250-261.
PAPALEWIS, ROSEMARY. 1990. Interpretation of Student Data: ContextualVariables and Cultural Implications. Paper Presented at the NationalConference of Professor of Educational Administration, Los Angeles, CA.
SCHERR, FREDERICK and SCHERR, SUSAN. 1999. Bias in Student Evaluations ofTeacher Effectiveness. Journal of Education for Business, Vol. 65, No.8,356-358.
SCRIVEN, M. 1981. Summative teacher evaluation. In J. Millman (Ed.),Handbook of Teacher Evaluation (pp. 244-271). Beverly hills, CA: Sage.
SHYAMASUNDAR, M.S. and STELLA, ANTONY. 2002. Transforming the CampusExperience of Students. In: Seventh Quality in Higher EducationInternational Seminar, Transforming Quality, Melbourne,Australia .November 30-31, 2002.

The Effect of Excessive use of Internet upon Adolescents
Indian Educational Review, Vol. 48, No.1, January 2011 71
The Effect of Excessive Use ofInternet upon Adolescents
MRIDULA BHADAURIA*, RASHMI GORE**, DHEERAJ PANDEY***
Abstract
The present study was conducted to find out the effect of excessiveuse of internet upon adolescents, mental health. The major findingsof the study were : (i) Internet usage negatively affects the mentalhealth of adolescents. (ii) Internet usage affects more to the mentalhealth of rural adolescents than that of urban adolescent. (iii) Internetusage affects the mental health of adolescent boys and girls ofdifferent SES same way. (iv) Internet usage and area differences areinteracting significantly for the adolescents mental health and novariable are interacting significantly with one another for the mentalhealth of adolescents.
The 21st century is telemetric (Computers connected to networks). Itdenotes the emergence of new technologies of communication andmost significantly, the telemetric revaluation. Both globalisation andcommunication technologies have caused and resulted in the growthof each other and have influenced one another in complex andmultiple ways. People have become compulsive information consumer.Technology, particularly, internet is widely influenced all spheres ofhuman beings and specially the adolescent. No doubt, the technologyis revitalising antidote for stagnating education system. But, alsotrue that excess use of internet is creating problems regarding mentalhealth of people, especially of adolescents as they are widely usinginternet. Hyper use of internet produces impulsive-control disorders(ICD) with the development unlimited access to sex, gambling,shopping, stock trading etc. These all increase a subsequent rise in
* Reader, C.S.J.M. University, Kanpur** Lecturer, C.S.J.M. University, Kanpur***M.Phil, Student

The Effect of Excessive use of Internet upon Adolescents
Indian Educational Review, Vol. 48, No.1, January 201172
impulsive behaviour. Addictive behaviour are classified into fourcategories. Intermittent explosive disorder fails to receive aggressiveimpulses. Kleptomania, failure to resist urges to steal items.Pyromania and Pathological gambling fails to resist urges to set fire,and gambling. Trichotillomania fails to resist urges to pull ones hair.
Patients afflicted with these disorders engage in the behaviour toincrease arousal. When these behaviours occur frequently, theyinterfere with a person’s normal functioning or sometimes may distortpersonality.
Bonebrake, K. (2002) estimated that 85 million Americans are online and about 15 millions of those suffer from internet addiction;also identified specific risk factors such as loneliness, thrill seekingbehaviour and sexual compulsivity. Many research studies havesupported this view (Beaved, K.W. (2002), Meral Kelleci and S. Inal(2009), Hardie, E. & Tee, M.Y. (2007), Cooper, N.S. (2003). Some studiesrevealed that hyper use of internet contributes to increase job stressand strain. (Lakshminarayanan T.R. and Prabhakaran P. 1993).Information overload and multitasking both associated with ICT andmay create stress by work overload.
Excess use of internet may lead to increase levels of depressionand reduction in social support. The excess online interaction ofisolated adolescents sometimes encourages self–injurious behaviour.Hamburger, Y. & Ben Artizi, E. (2003) supported this view andidentified that time spent online was not associated with dispositionalor daily well being. As per intimacy theory the closeness of instantmessages communication partner was associated with daily socialanxiety. However results indicated that teenagers may be thepopulation most vulnerable to those negative effects. Sometimes theyare often quite knowledgeable about unwanted things like drugs andhave made access to information extremely simple (BBC New – Oct.28, 2009). Contrary to above studies S. Netherlands (2009) foundthat over-media use acted as protective factor for boys, who spentrelatively more time playing video games and watching movies. Hefound lowest level of anxiety in them. The opposite pattern emergedfor girls. Similarly surfing the net can slow dementia progression(caregmoor.news, Oct. 20, 2009). The Study of G. Small, supportedthe view and also indicated that people the little experience of web,performing the internet searches for even a short period of time canenhance brain function.

The Effect of Excessive use of Internet upon Adolescents
Indian Educational Review, Vol. 48, No.1, January 2011 73
Research Question
On the basis of above discussion the question arises as does excessiveinternet usage affects the mental health of adolescents? Whether iteffect positively or negatively? Is these any relationship betweenexcessive internet usage and rural/urban adolescent? Is there anyrelationship exists between excessive use of internet and boys andgirls of different socio-economic status? The present research isdesigned to answer the above questions.
Objective
The specific objective of the study is• To study the effect of excessive internet usage on mental health
of adolescents.
Hypotheses
In order to achieve the objectives the following null hypotheses wereformulated for presented study.
H01 • The scores of mental health of adolescent are not significantlydifferent on experimental group and control group regarding area,sex and SES.
H02 • Internet usage, area differences, sex and SES do not interact
significantly for the adolescents’ mental health in their two waysthree way and four way interaction.
Sample: In this study adolescents between age group of 17-18 yearswere selected from Class XI of senior secondary school of Banda city.
Sample Design
Experimental 5 5 5 5 5 5 5 5 5 5 5 5 60Group
Control 5 5 5 5 5 5 5 5 5 5 5 5 60Group
Total 10 10 10 10 10 10 10 10 10 10 10 10 120
Urban Rural
Hig
h (
SE
S)
Mid
dle
(S
ES
)
Low
(S
ES
)
Hig
h (
SE
S)
Mid
dle
(S
ES
)
Low
(S
ES
)
Hig
h (
SE
S)
Mid
dle
(S
ES
)
Low
(S
ES
)
Hig
h (
SE
S)
Mid
dle
(S
ES
)
Low
(S
ES
)
Dif
fere
nt
Str
ata
s
Boys Girls Boys Girls
Tota
l

The Effect of Excessive use of Internet upon Adolescents
Indian Educational Review, Vol. 48, No.1, January 201174
Tools: The following tools were used in this study –
� Mental Health Battery, constructed by Dr. Arun Kumar Singh andDr. Alpana Sen Gupta.
� Socio-Economic Status Scale (SESS) constructed by Dr. R.L.Bharadwaj.
Research Design – The Pre-test - Post-test equivalent groups designwas used as follows: -
R O1
O2
O1
O3 Pre-tests
R O3
C CO4
O2
O4 Post-tests
On the basis of the design an experiment was conducted to examinethe effect of excessive internet usage on mental health of adolescents.
Procedure
Phase I Administration of MHB & SESS upon the students ofClass XI of senior secondary schools of Banda city to selectthe students having normal mental health. SESS isadministered to categories the SES of the students.
Phase II On the basis of the scores of MHB and SESS 1200 studentswere selected. Out of 1200 students only 120 students wereselected randomly as sample.
Phase III Collection of their scores on MHB and allocation of120 students of normal mental health into experimentaland control group on the basis of area, sex and SES.
Phase IV The experimental group was given the facility to useinternet in the computer center continuously 04 hours upto 30 days regularly while no such facility was given tocontrol group.
Phase V After 30 days a post-test of MHB was administered to boththe groups, i.e., upon experimental group and control group.The differences of pre-test scores and post-test scores werefound as a gain scores.
Analysis and Interpretation of Data
The scores of adolescents’ mental health were divided into differentgroups in accordance to their internet usage, area, sex and socio-economic status.

The Effect of Excessive use of Internet upon Adolescents
Indian Educational Review, Vol. 48, No.1, January 2011 75
TA
BLE
–I
Sh
ow
ing t
he s
um
of
score
s, s
um
of
square
s an
d m
ean
of
score
s on
th
e v
ari
able
of
adole
scen
t’s
men
tal
healt
h f
all
ing i
ndif
fere
nt
stages
of
inte
rnet
use
s, a
rea,
sex a
nd s
ocio
-econ
om
ic s
tatu
s
Dif
fere
nt st
ages
of fa
ctor
B (A
rea
)
B1 (U
rba
n A
rea
)B
2 (
Ru
ral
Are
a )
Dif
fere
nt
Sta
ges
of
Fa
ctor
C (
Sex
)D
iffe
ren
t S
tages
of
Fa
ctor
C (
Sex
)
C1 (B
oys)
C2 (
Gir
ls)
C1 (B
oys)
C2 (
Gir
ls)
Dif
fere
nt
Sta
ges
of F
act
or D
D
iffe
ren
t S
tage
s of
Fa
ctor
D
Dif
fere
nt
Sta
ges
of F
act
or D
Dif
fere
nt
Sta
ges
of F
act
or D
(Soc
io-E
con
omic
Sta
tus)
(
Soc
io-E
con
omic
Sta
tus)
(S
ocio
-Eco
nom
ic S
tatu
s) (
Soc
io-E
con
omic
Sta
tus)
D1 H
igh
D2M
idd
leD
3 L
owD
1 H
igh D
2M
idd
le D
3 L
owD
1 H
igh
D2M
idd
leD
3 L
owD
1 H
igh
D2M
idd
leD
3 L
ow∑
(S
ES
)(S
ES
)(S
ES
)(S
ES
)
(SE
S)
(SE
S)
(SE
S)
(SE
S)
(SE
S)
(SE
S)
(SE
S)
(SE
S)
1
23
45
67
89
10
11
12
13
14
N=5
N=5
N=5
N=5
N=5
N=5
N=5
N=5
N=5
N=5
N=5
N=5
N=60
∑x=
–22
∑x=
–31
∑x=
–38
∑x=
–35
∑x=
–21
∑x=
–31
∑x=
–62
∑x=
–69
∑x=
–84
∑x=
–84
∑x=
–52
∑x=
–83
∑x=–5
78
∑x2
=234
∑x2
=261
∑x2
=412
∑x2
=351
∑x2
=99
∑x2
=297
∑x2
=900
∑x2
=1233
∑x2
=1678
∑x2
=804
∑x2
=680
∑x2
=1891
∑x2
=8840
M=4.4
M=6.2
M=7.6
M=.
7M
=4.2
M=6.2
M=12.4
M=13.8
M=16.8
M=.1
0M
=10.4
M=16.6
M=9.6
33
N=5
N=5
N=5
N=5
N=5
N=5
N=5
N=5
N=5
N=5
N=5
N=5
N=60
∑x=
9∑
x=1
∑x=
8∑
x=21
x=13
∑x=
8∑
x=2
∑x=
–5∑
x=–2
∑x=
10
∑x=
12
∑x=
8∑
x=+8
5
∑x2
=89
∑x2
=89
∑x2
=58
x2=297
∑x2
=97
∑x2
=34
∑x2
=44
∑x2
=41
∑x2
=220
∑x2
=76
∑x2
=104
∑x2
=152
∑x2
=1301
M=1.8
M=0.2
M=1.6
M=4.2
M=2.6
M=1.6
M=0.4
M=1.0
M=0.4
M=2
M=2.4
M=1.6
M=1.4
116
N=10
N=10
N=10
N=10
N=10
N=10
N=10
N=10
N=10
N=10
N=10
N=10
N=120
∑x=
–13
∑x=
–30
∑x=
–30
∑x=
–14
∑x=
–8∑
x=–2
3∑
x=–6
0∑
x=–7
4∑
x=–8
6∑
x=–4
0∑
x=–4
0∑
x=–7
5∑
x=–4
93
∑x2
=323
∑x2
=350
∑x2
=470
∑x2
=648
∑x2
=196
∑x2
=331
∑x2
=944
∑x2
=1274
∑x2
=1898
∑x2
=880
∑x2
=784
∑x2
=2043
∑x2
=10141
M=-1
.3M
=–3
.0M
=–3
.0M
=–1
.4M
=–0
.8M
=–2
.3M
=–6
.0M
=–7
.4M
=-8
.6M
=–4
.0M
=–4
.0M
=–7
.5
M=–4
.10833
Fa
ctor
s a
nd
its
Sta
ges
Different Stages offactor A (Internet uses)
A2 (ControlGroup)Group
A1
(ExperimentalGroup)

The Effect of Excessive use of Internet upon Adolescents
Indian Educational Review, Vol. 48, No.1, January 201176
Table I denotes that four way analysis of variance was applied to thescores of adolescents mental health at different stages of internetuses, Area, Sex, and Socio-economic status. The scores of adolescentsmental health were divided into different groups in accordance totheir internet uses, area, sex and socio-economic status. The resultsof the analysis are depicted in Table 2 given below.
TABLE 2
Summary table of four way analysis of variance on adolescent’smental health scores at different stages of internet usage,
area, sex and socio-economic status.
Source df SS MS F Level of Significance
Main effectFactor A 1 3363.08 3363.08 124.68 0.1Factor B 1 3363.08 3363.08 124.68 0.1Factor C 1 72.06 72.06 2.45 Non - SignificantFactor D 1 100.32 50.16 1.70 Non - SignificantTwo Way InteractionA B 1 291.39 291.39 9.92 0.1B C 1 11.41 11.41 0.39 Non - SignificantC D 2 23.46 11.73 0.40 Non - SignificantD A 2 54.94 27.47 0.93 Non - SignificantA C 1 5.21 5.21 0.18 Non - SignificantB D 2 18.81 9.41 0.32 Non - SignificantThree way InteractionA B C 1 1.91 1.91 0.06 Non - SignificantB C D 2 3.62 1.81 0.06 Non - SignificantA B C 2 6.02 3.01 0.10 Non - SignificantD A B 2 32.54 16.27 0.55 Non - SignificantFour way InteractionA B C D 2 25.71 12.86 0.44 Non - SignificantError 96 2820.7 29.38Total 19 7681.59
Table value of F-ratio is F. 05 = 3.94 and F. 01 = 6.90 for df (1,96)Table value of F-ratio is F.05 3.09, and F.01 4.82 for df = (2,96)
The summary table of four way analysis of variance on the scoresof adolescent’s mental health at different stages of internet uses,area, sex and socio- economic status shows that:
• The calculated value of F (1.96) = 124.68 (P <.01) for the maineffect of Factor A (Internet usage) exceeds the critical value(F.01 = 6.90), therefore F-ratio is significant at .01 level. Therefore

The Effect of Excessive use of Internet upon Adolescents
Indian Educational Review, Vol. 48, No.1, January 2011 77
null hypothesis is rejected and research hypothesis that the mentalhealth of adolescents of experimental group is significantly differentfrom that of control group is accepted at .01 level.
• The calculated value of F (1.96) = 18.73 (P < .01) for the maineffect of Factor B (Area), exceeds the critical value (P(.01) = 6.90)therefore F-ratio is significant at .01 level. Therefore nullhypothesis is rejected and research hypothesis that is the mentalhealth of adolescents of urban group is significantly different fromthat of rural group is accepted at .01 levels.
• The calculated value of F (1.96) 2.45 (P <.01) for the main effect ofFactor C (sex) very less than the critical value (F(.05) = 3.94)therefore F-ratio is non significant at both level. Therefore nullhypothesis ‘the mental health of adolescents of boys group is notsignificantly different from that of rural group’ is accepted andresearch hypothesis is rejected at both level
• The calculated value of F (2.96) = 1.70 (P <.01) for the maineffect of Factor D (Socio-economic status) is very less than thecritical value (F.
05 = 3.09), therefore F-ratio is non significant at
both level. The null hypothesis that ‘the mental of adolescentsis not significantly different in high, middle and low socio-economicstatus groups’ is accepted and research hypothesis is rejectedat both levels.
• The calculated value of F (1.96) = 9.92 (P <.01) for the interactioneffect of Factor A and Factor B is exceeds the critical value(F.
01 = 6.90), therefore F-ratio is significant at .01 level. So null
hypothesis is rejected and research hypothesis that ‘Is internetuses and area differences interact significantly for mental health ofadolescents’ is accepted.
• The calculated value of F (1.96) 0.39 (P <.01) for the interactioneffect of Factor B and Factor C is very less than the critical value(F.
05 = 3.94), therefore F-ratio is non significant at both level. That
is why null hypothesis ‘Area and sex differences are not interactingsignificantly for the mental health of adolescents’ is accepted andthe research hypothesis is rejected at both level.
• The calculated value of F (2.96) = 0.40 (P<.01) for the interactioneffect of Factor C and Factor D is very less than the critical value(F(.05) = 3.09) therefore F-ratio is non significant at both level.That is why, null hypothesis ‘Sex and SES differences are notinteracting significantly for the mental health of adolescents’ isaccepted and the research hypothesis is rejected at both level.

The Effect of Excessive use of Internet upon Adolescents
Indian Educational Review, Vol. 48, No.1, January 201178
• The calculated value of F (2.96) = 0-93 (P <.0l) for the interactioneffect of factor D and Factor A is very less than the critical value(F.
05= 3.09) therefore F-ratio is non significant at both level. That
is why, the null hypothesis ‘Is the differences of SES and internetusage are not interacting significantly for the mental health ofadolescents’ is accepted and research hypothesis is rejected atboth level.
• The calculated value of F (1.96) = 0.18 (P < 0.1) for the interactioneffect of Factor A and Faceted C is very less than the criticalvalue (F.0.5 = 3.94), therefore F-ratio is non-significant at bothlevel. That is why the null hypothesis ‘Internet usage and sexdifferences are not interacting significantly for the mental health ofadolescents’ is accepted and research hypothesis is rejected atboth level.
• The calculated value of F (2.96) = 0.32 (P <.01) for the interactioneffect of Factor B and Factor D is very less than the critical value(F.
05 = 3.09), therefore F-ratio is non significant at both level. That
is why, the null-hypothesis ‘Area and socioeconomic statusdifferences are not interacting significantly for the mental health ofadolescents’ is accepted and research hypothesis is rejected atboth level.
• The calculated value of F (1.96) = 0.06 (P <.01) for the interactioneffect of Factor A, Factor B and Factor C is very less than thecritical value (F.05 3.94), therefore F-ratio is non significant atboth level. That is why the null hypothesis ‘Internet usage, areaand sex differences are not interacting significantly for the mentalhealth of adolescents’ is accepted and research hypothesis isrejected at both level.
• The calculated value of F (2.96) 0.06 (P <.01) for the interactioneffect of Factor B, Factor C and Factor D is very less than thecritical value (F.05 = 3.09), therefore F-ratio is non significant atboth level. That is why the null hypothesis ‘Area, sex and socio-economic status differences are not interacting significantly for themental health of adolescents’ is accepted and research hypothesisis rejected at both level.
• The calculated value of F (2.96) = 0.10 9 P <.01) for the interactioneffect of Factor C, Factor D and Factor A is very less than thecritical value (F.05 = 3.09), therefore F-ratio is non significant atboth level. That is why the null hypothesis that ‘The differencesof sex, socio-economic status and internet usage are not interactingsignificantly for the mental health of adolescents’ is accepted andresearch hypothesis is rejected at both level.

The Effect of Excessive use of Internet upon Adolescents
Indian Educational Review, Vol. 48, No.1, January 2011 79
• The calculated value of F (2.96) = 0.55 (P <.01) for the interactioneffect of Factor D, Factor A, and Factor B is very less than thecritical value (F.05 = 3.09), therefore F-ratio is non significant atboth level. That is why, the null hypothesis ‘Socio-economic status,area, and sex differences are not interacting significantly for themental health of adolescents’ is accepted and research hypothesisis rejected at both level.
• The calculated value of F (2.96) = 0.44 (P <.01) for the interactioneffect of Factor A, Factor B, Factor C, and Factor D is very lessthan the critical value (F.05 = 3.09) Therefore, F-ratio is nonsignificant at both level. That is why the null hypothesis that‘The internet usage, area, sex and socio economic status differencesare not interacting significantly for the mental health of adolescents’is accepted and research hypothesis is rejected at both level.
Table 3 indicates that mean scores on adolescents mental health (a)in experimental group are less than that of control group which showsthat internet uses negatively affects the mental health of adolescents,(b) in rural area group are less than that of urban area group whichshows that internet uses more affected negatively to the rural areagroups than that of urban area groups (c) There is no significantdifference between the mean scores of boys group and girls groupwhich shows that the effect of internet uses or boys group in notsignificantly different from girls group and (d) the same case withhigh, middle and low socio-economic status groups.
FINDINGS
The findings of the present study are as follows:• Internet usage negatively affects the mental health of adolescents.
• Internet usage affects more to the mental health of ruraladolescents than that of urban adolescent.
• Internet usage affects the mental health of boys and girls in thesame way.
• Internet usage affects the mental health of the adolescents ofhigh middle and low SES in the same way.
• Internet usage and area differences are interacting significantlywith one another for the mental health of adolescents.
• It is found that area and sex differences are not interactingsignificantly with one another for the mental health of adolescents.

The Effect of Excessive use of Internet upon Adolescents
Indian Educational Review, Vol. 48, No.1, January 201180
TA
BLE
3
Mea
n v
alue
of ad
ole
scen
t’s
men
tal hea
lth s
core
s at
dif
fere
nt
stag
es o
fin
tern
et u
ses,
Are
a, S
ex a
nd S
oci
o-E
conom
ic S
tatu
s.
Dif
fere
nt st
ages
of fa
ctor
B (A
rea
)
B1 (U
rba
n A
rea
)B
2 (
Ru
ral
Are
a )
Dif
fere
nt
Sta
ges
of
Fa
ctor
C (
Sex
)D
iffe
ren
t S
tages
of
Fa
ctor
C (
Sex
)
C1 (B
oys)
C2 (
Gir
ls)
C1 (B
oys)
C2 (
Gir
ls)
Dif
fere
nt
Sta
ges
of F
act
or D
D
iffe
ren
t S
tage
s of
Fa
ctor
DD
iffe
ren
t S
tage
s of
Fa
ctor
D
Dif
fere
nt
Sta
ges
of F
act
or D
(Soc
io-E
con
omic
Sta
tus)
(S
ocio
-Eco
nom
ic S
tatu
s) (
Soc
io-E
con
omic
Sta
tus)
(S
ocio
-Eco
nom
ic S
tatu
s)
D
1 H
igh
D2M
idd
leD
3 L
owD
1 H
igh D
2M
idd
le D
3 L
owD
1 H
igh
D2M
idd
leD
3 L
owD
1 H
igh
D2M
idd
leD
3 L
ow
(S
ES
)(S
ES
)(S
ES
)(S
ES
)
(SE
S)
(SE
S)
(SE
S)
(SE
S)
(SE
S)
(SE
S)
(SE
S)
(SE
S)
1
23
45
67
89
10
11
12
13
– 4.4
–6.2
–7.6
–7.0
–4.2
-6.2
-12
.4-1
3.8
-16
.8-1
0.4
-10
.4-1
6.6
+1.8
+.0
2+1.6
+4.2
+2.6
+1.6
+0.4
–1.0
–0.4
+2.0
+2.4
0+
1.6
0
Fa
ctor
s a
nd
its
Sta
ges
Different Stages of
A2
(ControlGroup)
A1
(ExperimentalGroup)

The Effect of Excessive use of Internet upon Adolescents
Indian Educational Review, Vol. 48, No.1, January 2011 81
• It is found that sex and SES differences are not interactingsignificantly with one another for the mental health of adolescents.
• It is found that internet usage and SES differences are notinteracting significantly with one another for the mental healthof adolescents.
• It is found that internet usage and sex differences are notinteracting significantly with one another for the mental healthof adolescents.
• It is found that area and SES differences are not interactingsignificantly with one another for the mental health of adolescents.
• It is found that internet usage, area, and sex differences are notinteracting significantly with one anther for the mental health ofadolescents.
• It is found that area; sex and SES differences are no interactingsignificantly with one another for the mental health of adolescents.
• It is found that internet usage, sex, and SES differences are notinteracting significantly with one another for the mental healthof adolescents.
• It is found that SES, internet usage and area differences are notinteracting significantly with one another for the mental healthof adolescents.
• It is found that internet usage, area, sex and SES differences arenot interacting significantly with one another for the mental healthof adolescents.
DISCUSSION
Recent reports are indicating that 97 per cent urban youth are usinginternet out of them there is a large number of adolescents using itregularly.While circumstance are quite different for rural adolescents.Consequently internet usage affects too negatively to the mentalhealth of rural adolescents than that of urban adolescents.
Presently Internet use is emerging as one of the negative aspectamong youth too. Interactive communication application such as chatrooms, instant messaging, e-mail, and on-line games have been morecommonly associated with internet addiction among youth. Internetaddiction has a negative effect upon academics (a drop in grades),family relations (having to hide the excessive use of internet fromparents), physical health (sleep deprivation) and mental health

The Effect of Excessive use of Internet upon Adolescents
Indian Educational Review, Vol. 48, No.1, January 201182
(depression). These all creates poor concentration, poor memorymanagement, social impairment, impaired problem solving memory,disorganised behaviour, depressed mood, indifferent to others,shyness, lack of self confidence etc.
Often these negative symptoms steadily become more prominent.The same results were supported by Campbell, A.J. Cumming, C.R.and Hughes, I. (2006) as they found negative relationship betweenweb-surfing frequency and life satisfaction.
Adolescents with internet addiction were noticed with deficienciesin the ability to read, express and elicit desired emotions. The co-relation of emotional intelligence and internet addiction disorder wasespecially high for young adolescents.
Meral Kellei (2009) found that internet use in adolescent wasassociated with more severe psychiatric symptoms like schizophrenia.But on the contrary G.small (2009) found that among the older peoplewith little experience of the web performing the internet searches foreven a relatively short period of time can enhance brain function. Itseems that while moderate use of the internet can have positive effectsbut excessive usage of internet has negative effects upon mentalhealth of adolescent. Attention should be devoted to adolescents withinternet use for design of preventive strategies.
REFERENCES
ANDERSON, K. J. 1999. Internet Use Among College Studies: Should We beConcerned. Paper presented at the Annual Meeting of the AmericanPsychological Association, Boston.
BBC (British Broadcasting Corporation, October 28, 2009), at http://nesbbc.co.uk
BEARD, K.W. 2002. Internet Addiction: Current Status and Implications forEmployees. Journal of Employment and Counselling, 39 (2), 2-11.
BONEBRAKE, K. 2002. College Student Internet Use, Relationship Formation,and Personality Correlates, Cyber Psychology and Behaviour, 5, 55 1-557.
CARE G. MOOR. 2009. http://www.caregmoon.co.uk/direcltry/mental health.aspx.
COOPER, A., SCHERER, C.R., BOIES, and GORDON, B.L. 1999. Sexuality on theInternet: From Sexual Exploration to Pathological ExpressionProfessional Psychology: Research and Practice www.http:/ /www.apa.org/journalspro/ pro302154html.

The Effect of Excessive use of Internet upon Adolescents
Indian Educational Review, Vol. 48, No.1, January 2011 83
COOPER, N.S. 2003. The identification of Psychological and Social Correlatesof Internet Use in Children and Teenagers, Unpublished doctoral thesis,Alliant International University, California.
DREVER, J. 1964 A Dictionary of Psychology. London : Penguin Book.
ENGELBERG, E. and SJOBERG, L. 2004. Internet Use, Social Skills andAdjustment. Cyber Psychology and Behaviour, 7,41.
GROSS, E.F., JUVONEN, J. and GABLE, S.L. 2002. Internet Use and Well Being inAdolescents. The Society for Psychological Study of Social Issues, 58 (1),75-90.
HAMBURGER, Y, and BEN ARTIZI, E. 2003. Loneliness and Internet Use. Computersin Human Behaviour, 19, 71.
Hardie, E. and Tee, M.Y. 2007. Excessive Internet Use: the Role of Personality,Loneliness and Social Support Network Internet Addiction. AustralianJournal of Emerging Technologies and Society, 5 (1), 34-47.
KING, S.A. 1996. Is the Internet Addictive, or Are Addicts Using the Internet?.August, 18, 1999. www:http:www.concentric.net/~Astorm/ iad.html.
LAKSHMINARAYANAN, T. R. and PRABHAKARNA, P. 1993. Comparison of Mental HealthAmong the Different Age Groups of Industrial Employees. Journal ofPsychological Researches, 30 (3), 30-34.
MOODY, E.J. 2001. Internet Use and its Relationship to Loneliness. CyberPsychology and Behaviour, 4, 393-401.
MORAHAN MARTIN, J. and SCHUMACHER, P. 2003. Loneliness and Social Uses ofthe Internet. Computers in Human Behaviour, 19, 659-67 1.
MERAL KELLECI and S. INAL 2009. Phychitric symptoms in Adolescent withInternet Use : Comparison without Internet Use, Cyber Psychology andBehaviour, on line, November 3, 2009, 1089/cpb.
O-TOOLE, K. 2000. How Internet is Changing Daily Life. www. Stanford.edu/dept/news/pr/00/000216 internet. html.
ODELL, P.M., KORGEN, K.O., SCHUMACHER, P. 2000. Internet Use Among Femaleand Male College Students Cyber Psychology and Behaviour,3, 855-862.
OLDFIELD, and B. HOWITT, D. 2004. Loneliness, Social Support and InternetUse. Paper Presented at the Conference Internet Research 5.0: Ubiquity?,Sussex, U.K.

Resources in Primary Schools: A Challenge for India
Indian Educational Review, Vol. 48, No.1, January 201184
Resources in Primary Schools:A Challenge for India
V. K. JAIN AND MAMTA AGRAWAL*
Context
Education of children is the primary concern of all countries. In thelast two decades, there has been a movement called 'Education forAll' to provide access to all children to school. As a result theenrolment of primary schools which was 78 per cent in the year1990 increased to 86 per cent in the year 2004 around the world.India was no exception and about 123 million children were enrolledin primary classes according to the 7th All India School EducationSurvey (7th AISES), 2007, conducted by the National Council ofEducational Research and Training (NCERT), New Delhi. This hasbeen possible due to the governmental efforts to provide qualityeducation and in schooling facilities to all children in the age groupof 6–14 years.
In 1987, Government of India launched a scheme known as'Operation Blackboard' to provide certain minimum facilities inschools. These included (a) at least two teachers in all primaryschools; (b) essential teaching learning material in every school; and(c) at least a two roomed all weather building for each school(Department of Education, 2008). Another scheme, 'District PrimaryEducation Programme (DPEP)', was launched as a centrallysponsored scheme in 1994 in educationally backward districts of18 states of the country to provide access to all children to primaryeducation, to reduce dropout rates and to raise the averageachievement level (IGNOU, 2003).
Government of India launched another scheme Sarva ShikshaAbhiyan (SSA) in 2001-02 to attain universal elementary educationcovering the entire country in a mission mode with a focus on quality.
* Professors, Department of Educational Measurement and Evaluation, NationalCouncil of Educational Research and Training (NCERT), New Delhi, India

Resources in Primary Schools: A Challenge for India
Indian Educational Review, Vol. 48, No.1, January 2011 85
The Government of India took initiative to build schools in ruralhabitats as 70 per cent of Indian population lives in rural areas. Asa consequence, today 78 per cent of the rural population haveprimary schools within habitations (148 thousand habitations) and94 per cent of the rural population have primary schools within awalking distance of 1km (7th AISES). As a result of the governmentinitiatives, today 93 per cent of primary schools have a brick building,80 per cent schools have drinking water facility, 47 per cent haveurinals and 40 per cent have toilets (7th AISES).
It is evident that there is a phenomenal improvement in theaccess to primary education but there is need to ensure quality andequip the schools with adequate resources. A number of studieshave shown that achievement level of students is highly correlatedwith facilities available in schools. The study "Factors InfluencingEffectiveness of Secondary Schools of Delhi" found the physicalfacilities to be the most important factor for effectiveness of a schoolas availability of good facilities provides a conducive environmentfor learning. (Agrawal et. al, 2004). The baseline achievement surveyconducted on Class V students by the NCERT also indicated thatteaching aids, physical and ancillary facilities were positivelycorrelated with learning achievement (NCERT, 2006). In a studyconducted in Namibia, the condition of school building was found tohave a high correlation with school achievement. (Makuwa, D, 2005).Thus, physical facilities and other resources play an important rolein ensuring the quality of education. Equipping the primary schoolswith adequate facilities still remains a challenge for India.
The study, World Education Indicators-Survey of Primary Schools,conducted by UNESCO Institute of Statistics (UIS) in collaborationwith Organisation for Economic Cooperation and Development(OECD) in 11 different countries looked at how primary educationwas provided in different national settings. For this data was collectedon different variables from each participating country. For Indiaresources in schools is an important issue. Hence, this paper exploresthe availability of different resources and the condition for schoolbuildings in Indian Schools.
Questions to be explored in this paper
(a) How do Indian primary schools compared to schools in othercountries in terms of resource levels?
(b) Within India, how schools compare in resource levels by schoolslocation, school type (management) and states.

Resources in Primary Schools: A Challenge for India
Indian Educational Review, Vol. 48, No.1, January 201186
(i) Rural, Urban(ii) Public, Government aided, Independent private schools(iii) Assam, Rajasthan, MP and Tamil Nadu
Development of ToolsThe study of world education indicators required data on how schoolsfunction, how teacher teach, the learning conditions pupils andteachers face and the support available for change both from thesystem and from the communities they serve Accordingly, the OECDand UIS staff along with international experts developed threequestionnaires:
• School questionnaire to be filled up by the school heads• Teacher questionnaire to be filled up by Grade IV teachers
Questionnaire on the 'Opportunity to Learn' that Grade IV pupilshad to learn reading and mathematics.
It was through question numbers 18 and 20 of the SchoolQuestionnaire that information was collected on the availability ofshortage of different items related to school resources and conditionsof school buildings respectively.
SampleThe WEI-SPS study employed a stratified systematic sample design.India's sampling design followed a two stage procedure which firstinvolved the selection of districts in participating states followed bythe selection of schools from the list of eligible schools. The schoolswere selected with equal probability using a systematic samplingtechnique. In each selected school, all teachers teaching languageand/or mathematics to grade IV students were included in theteacher sample.
The sample for India in the WEI study covered only four states-Assam, M.P., Rajasthan and Tamil Nadu. These states representedthe Eastern, Central, North Western and Southern regions of thecountry. Altogether 1105 schools from 65 districts were covered inthe study. The following table shows the state-wise sample of districtsand schools.
TABLE 1
Sample of Districts and Schools in Four States of India
State Number of Districts Number of Schools
Assam 14 279Madhya Pradesh 20 279Rajasthan 16 275Tamil Nadu 15 272Total 65 1105

Resources in Primary Schools: A Challenge for India
Indian Educational Review, Vol. 48, No.1, January 2011 87
In each state, schools were sampled location wise i.e., rural andurban and also according to the type of schools i.e. government/publicschools, Government dependent private schools and independentprivate schools. The following two tables show the number andpercentage of pupils by school location and school type in each state.
TABLE 2
Percentage of Pupils by school location in four states of India Location
TotalRural Urban
AssamCount 3267336 233709 3501045
Percentage 93.3% 6.7% 100.0%
MPCount 6481780 2656178 9137958
Percentage 70.9% 29.1% 100.0%
RajasthanCount 6289977 1695191 7985168
Percentage 78.8% 21.2% 100.0%
Tamil NaduCount 3091296 3763504 6854800
Percentage 45.1% 54.9% 100.0%
TotalCount 19130389 8348582 27478971
Percentage 69.6% 30.4% 100.0%
TABLE 3Percentage of Pupils by school type in four states of India
Types of School
Govt. Dependent Independent TotalPublic School Private School Private School
Assam Count 2715006 675892 57620 3448518Percentage 78.7% 19.6% 1.7% 100.0%
MP Count 6496448 444329 2187576 9128353Percentage 71.2% 4.9% 24.0% 100.0%
Rajasthan Count 5415726 92411 2461321 7969458Percentage 68.0% 1.2% 30.9% 100.0%
Tamil Nadu Count 3346426 1848304 1617917 6812647Percentage 49.1% 27.1% 23.7% 100.0%
Total Count 17973606 3060936 6324434 27358976Percentage 65.7% 11.2% 23.1% 100.0%
The tables indicate that about 70 per cent pupils were in valleyschools and 30 per cent were in urban schools. Among these 68 percent studied in public schools, 11 per cent in govt. dependent privateschools and 23 per cent in independent private schools.
ResultsWhat was the condition of school buildingsIn the WEI study questions were asked from the school heads abouttheir perception of the condition of school buildings. This is an

Resources in Primary Schools: A Challenge for India
Indian Educational Review, Vol. 48, No.1, January 201188
important variable and correlates positively as shown by earlier statedstudies, with the school outcomes. The school heads classified theirschools as
1. School needs complete rebuilding
2. Some classrooms need major repairs
3. Most classrooms need minor repairs
4. School is in good condition
The first two categories were collapsed into one category (poorcondition) and the next two also in one category (good condition). Thefollowing figure shows the percentage of primary pupils in schools inthe states of India and in other countries by condition of schoolbuildings.
FIGURE 1
The Percentage of Primary Pupils in Schools in the States ofIndia and in other Countries by Condition of School Buildings
As can be seen from figure 1, in India more than 60 per cent ofpupils were in schools where the heads seemed to be satisfied thatcondition of their school buildings was good. About 40 per cent of thepupils were in schools whose condition was deemed as poor. Thiscompared closely with Malaysia and Argentina.

Resources in Primary Schools: A Challenge for India
Indian Educational Review, Vol. 48, No.1, January 2011 89
Among the states, it was seen that large number of pupils in thestate of Assam were in schools that needed major repairs or completerebuilding. As opposed to this about 78 per cent students in the stateof Tamil Nadu were in schools which were in good condition. Theschools in Tamil Nadu compare well with the schools in Chile,Argentina and Malaysia.
Availability of School Resources
In the school questionnaire, a list of 31 items representing differentresources was given and the school heads were asked if they hadeach one of them in their schools. The list contained such basic itemsas electricity, water, toilets to computers and internet.
Number of Resource Item: Four Indian States in theInternational Context
The following figure shows the distribution of pupils population bythe number of resource items.
FIGURE 2Distribution of Pupils Population by
the Number of Resource Items

Resources in Primary Schools: A Challenge for India
Indian Educational Review, Vol. 48, No.1, January 201190
About 50 per cent primary school pupils in India were in schoolswith 9 or less than 9 items, 25 per cent pupils had 6 less than 6items and 25 per cent were in schools with 13 or more than 13 items.In the international context, it can be seen that the Indian schoolswere most poorly resourced. The best situation was in Chile andMalaysia. A large variation was seen across the four states. Schoolsin Assam were relatively poorly resourced and the schools in TamilNadu were relatively better resourced, comparable to Philippines.
In Indian schools, some resource items were the basic items whichwere available to large percentage of primary pupils (above 60 percent pupils). These basic items as can be seen from the table 4 areblackboard, maps, drinking water, first aid kit, school library andsports field. In addition to these 6 items, some primary school childrenhave a facility of any one of the three or more resource items whichmay be separate toilets for boys and girls, electricity, staff room, sittingplaces and writing places.
The rest of the items are luxury for Indian schools. Electricitywas not available to 63 per cent primary pupils. In India, urbanschools have electricity connections, whereas in rural areas it is stilla distant dream.
Almost 60 per cent students neither have sufficient space forwriting nor sufficient places for sitting. Situation was particularlybad regarding safety equipment. Special rooms for teaching like audiovisual room and science laboratory, are rate in Indian primaryschools. Basic equipment like radio, tape recorder, T.V., overheadprojector, microscope etc., are also not available to most primaryschools and computers for students' use are very rare.
Resource Items by School Type
The percentage of pupils in schools possessing different resourceitems have been presented in Figure 3 for different types of schoolsi.e. public/government, Government dependent private andindependent private schools in different states of India.
Fifty per cent primary pupils in public schools in different stateswere in schools with 4 to 9 resource items, whereas 50 per centprimary pupils in independent private schools were in schools with9 items (Assam) to 23 items (Tamil Nadu). The state of Assam has themost poorly resourced schools. The reasons may be several. It hashilly terrain and rivers like Brahamputra which flood and createdevastation every year on a large scale.

Resources in Primary Schools: A Challenge for India
Indian Educational Review, Vol. 48, No.1, January 2011 91
FIGURE 3
Distribution of Primary Pupils forall Resource Items by School Type
Resource Items by School Location
For each state of India, the schools were compared by their location.The figure below shows the percentage of pupils possessing differentresources items in village schools and urban schools.
It could be seen that town schools were better equipped thanthe village schools in all the states of India. Schools in Assam wereagain found to be poorly resourced. Both village and town schools inTamil Nadu were better resouced than schools in any other state.
The study of resources in primary schools of India showedinteresting results. About 70 per cent primary pupils were in ruralschools. Only 65 per cent pupils were in public schools, 11 per centin Government dependent private schools and 23 per cent were inindependent private schools. More than 50 per cent students in

Resources in Primary Schools: A Challenge for India
Indian Educational Review, Vol. 48, No.1, January 201192
Assam were in schools with buildings in poor condition. More than50 per cent of pupils were in schools that did not have electricity,sufficient writing places and sufficient sitting places. More than 60per cent pupils did not have the facility of radio, telephone, T.V.,tape recorder, overhead projector etc. Computers are not availablein primary schools of India.
FIGURE 4
Distribution of Primary Pupils for allResource Items by School Location
Variation in Schools Resources in Indian States
To see whether there is variation in school resources among thefour Indian states and within the state at district level, analysisof variance was computed. The results are given in the followingtables.
TABLE 5
Analysis of Variance for Resources between States
Sources of Variation Sum of Squares df Mean Square F
Between Groups 187512686 3 62504228.7 2049618.2
Within Groups 837986091.5 27478966 30.4955467
Total 1025498778 27478969

Resources in Primary Schools: A Challenge for India
Indian Educational Review, Vol. 48, No.1, January 2011 93
FIGURE 5
Variation of Resources between StatesBetween states 18Within states 82
TABLE 6Analysis of Variance for Resources between Districts
Sum of Squares df Mean Square F Sig.
Assam Between Groups 6430762.58 13 494674.04 79123.67 0
Within Groups 21888122.5 3501030 6.2519094
Total 28318885.1 3501043
MP Between Groups 25462947.2 19 1340155.1 51467.01 0
Within Groups 237943792 9137938 26.039112
Total 263406739 9137957
Rajasthan Between Groups 28941224.7 15 1929415 79997.53 0
Withing Groups 192589350 7985152 24.118433
Total 221530575 7985167
Tamil Nadu Between Groups 70133144.3 14 5009510.3 134876.5 0
Within Groups 254596748 6854784 37.141469
Total 324729892 6854798
FIGURE 6
Variation of Resources between States

Resources in Primary Schools: A Challenge for India
Indian Educational Review, Vol. 48, No.1, January 201194
It can be seen from the table 5 that there is a variation in schoolresources from state to state. This may be explained by the fact thateducation in India is a state subject and each state makes its ownpolicy and allots funds for different levels of education.
The table 6 indicates that there is also variation between districtswithin each state. This is due to implementation of policies by districtlevel functionaries and the utilisation of funds by them.
School Resources and other Dimesions of School Education
Effective schooling not only depends on school resources but also onother factors too like emphasis on academic achievement, professionalsatisfaction of teachers, perceived teachers' status, staff's vision ofschool objectives, teachers' level of education and student motivation.When total school resources were correlated with these variables,the following results were seen.
TABLE 7
Correlation between Total Resources and SelectedVariables in India
Item Correlation SE
Emphasis on academic achievement 0.239 0.049Index of teacher complaints -0.202 0.039Professional satisfaction 0.300 0.042Perceived teacher status 0.138 0.039Per cent students repeating a grade -0.076 0.037Staff's vision of school objectives 0.247 0.036Teacher's level of education 0.171 0.038Perceived students motivation 0.205 0.041School engagement 0.173 0.048Student behaviour problems 0.206 0.070
The Table 7 indicates that total number of school resources arehighly correlated with different dimensions of education. It has beenobserved that higher the total resources, higher the emphasis onachievement, professional satisfaction of teachers, perceived teacherstatus, staff's vision of school objectives, teachers' level of education,perceived students' motivation. The schools which are betterresourced have lesser problems like repetition of grades by studentsand teachers' complaints of students behaviours. On the other sidepoorly equipped schools have low emphasis on achievement, poorstudents motivation, lesser satisfaction level of teachers and morecomplaints of behaviour problems.

Resources in Primary Schools: A Challenge for India
Indian Educational Review, Vol. 48, No.1, January 2011 95
Implications of the Study
The findings of the study have significant implications for improvingthe school resources in Indian primary school and can be used tosensitise policy makers and planners about importance of resourcesin the schools. Administrators and policy makers should try to planand provide better physical facilities and resource in primary schoolsof the country. A minimum level of a facilities should be provided toeach government and government aided school. There should include
• Complete classroom with usable black boards, chalks, single orduel desks and chairs/benches for students.
• electricity and water.
• sufficient number of clean toilets for students and staff.
• Computer facilities for students.
• Well equipped school libraries.
• Audio-visual room equipped with radio, take recorder, T.V.,overhead projector etc. If our schools are better resourced likethe schools in Malaysia, we can look forward to higher level oflearning outcomes.
Acknowledment: We gratefully acknowledge the help provided byDr. Yanhong Zhang of UIS in analysing the WEI data for India.
REFERENCES
AGRAWAL, M., JAIN, V. K. and CHANDRASEKHAR. 2004. Factors influencingEffectiveness of the Secondary Schools of Delhi, NCERT, New Delhi(Xeroxed)
Department of Education, Programmes. www.education.nic.in/ed 50 years/g/S/HS/OSHSO501.htm, 28.2.2000
District Primary Education Programme, India, IGNOU, 2003, New Delhi
MAKUWA, D. 2005. The SACMEQ II Project in Namibia: A study of theconditions of schooling and the quality of education, Ministry ofEducation, Namibia.
NCERT. 2006. Learning Achievement of Class V students, a Baseline study,NCERT. 2006. New Delhi
— Seventh All India School Education Survey, New Delhi
— A View Inside Primary Schools of India, World Education Indicators-Survey of Primary Schools, India Report. Xeroxed
World Education Indicators- Survey of Primary Schools UIS. 2008.

A Comparative Study of Pre-Service Teacher Education ...
Indian Educational Review, Vol. 48, No.1, January 201196
A Comparative Study of Pre-ServiceTeacher Education Programme atSecondary Stage in Bangladesh,India, Pakistan and Sri Lanka
S. K. YADAV*
Introduction
The comparative education is an analytical and synthetic approach.In the synthetic approach, it is seen to what extent the socialstructure, political philosophy and educational philosophy haveinfluenced the educational system of a country. In such study, thetotality of all situations and factors involved are kept in view. In otherwords, in comparative studies of education, now sociological basesare emphasised. Social process, social control, social organisationand social change of a country are carefully studied in comparativeeducation, because it is believed that its educational system cannotbe understood from teacher education point of view because it is asub-system of education.
The purpose of the study is to understand the problems related toteacher education in Bangladesh, India, Pakistan and Sri Lanka witha view to find out their solutions. In the process of understanding Pre-Service Training Education (PSTE) programme at the secondary stagein Bangladesh, India, Pakistan and Sri Lanka, the philosophicalbackground of the country concerned are studied because the educationsystem is always influenced by the philosophical points of view of thepeople. Another purpose of this study is to understand those causeswhich make the educational system of one place progressive and thatof another backward. In fact educational administration and control isstrictly according to prevailing rule in the country.
In India, secondary teachers are prepared through Pre-serviceTeacher Education Programmes (PSTE). One year Bachelor of Education
* Professor and Head, DTE & E, NCERT, New Delhi-16.

A Comparative Study of Pre-Service Teacher Education ...
Indian Educational Review, Vol. 48, No.1, January 2011 97
(B.Ed) programme is being run largely in more than ten thousandsteacher training institutions and universities in the country. Theseinstitutions are managed by Government and private bodies.
The standard of teacher education is regulated by NationalCouncil of Teacher Education (NCTE), New Delhi, a statutory body,passed by the Parliamentary Act in 1993. The main objective of theNCTE is to achieve planned and coordinated development of theteacher education system throughout the country, the regulationand proper maintenance of norms and standards in the teachereducation system and for matters connected therewith. InBangladesh, secondary teachers are also prepared through one yearB.Ed programme and are being run in more than 189 public andprivate teacher training institutions, colleges and universities. Thestandard is maintained by respective national universities. InPakistan, training of secondary school teachers is for one year B.Eddegree and is being run in 135 institutions and universities. TheNational Institute of Teacher Education maintains the norms andstandards of teacher education. In Sri Lanka, the pre-serviceeducation is provided by National Institute of Education, fourUniversity Departments, 17 Colleges of Education and four TeacherEducation Institutions. These institutions offer three-year pre-serviceteacher education programme leading to the National Diploma inTeaching. Out of three years, two are at the residential college andthe last year is in a school as an intern.
In all the four countries, secondary teachers are preparedthrough pre-service teacher education programme. But there arevariations in the teacher education programmes in terms of duration,curriculum weightage, curricular areas and its implementation atthe secondary stage in these four countries. Keeping these in view,this study was undertaken to study the system of teacher educationin all the above mentioned countries with following objectives.
Objective of the Study
The major objectives of the study are as follows:• To identify different issues of pre-service teacher education
programme at the secondary level in Bangladesh, India, Pakistanand Sri Lanka.
• To compare different components of pre-service teacher educationprogramme in Bangladesh, India, Pakistan and Sri Lanka.
• To derive implications for overall improvement of pre-serviceteacher education programme in India.

A Comparative Study of Pre-Service Teacher Education ...
Indian Educational Review, Vol. 48, No.1, January 201198
Design of the Study
The design of the study consisted of sampling procedure, tools usedfor data collection and techniques for analysis of the data.
Sampling
The sample of the study consisted of 24 Principals (6 males and16 females), 88 (46 males and 42 females) teacher educators and157 student-teachers (53 males and 104 females) from all the fourcountries.
Tools Used
The following three questionnaires were developed to seek theinformation about the various components of the B.Ed programmefrom Bangladesh, India, Pakistan and Sri Lanka.1. The first questionnaire related to Principals of the B.Ed
institutions seeks to ascertain perception of Principals aboutvarious aspects of B.Ed programme. It consists of 36 items relatedto general information of the institutions, faculty profile,admission procedure, curriculum development, curriculumtransaction and its evaluation.
2. The second questionnaire is meant to ascertain the perceptionsof teacher educators on the strengths and weaknesses of theB.Ed programme and its various components. It consists of32 items, related to structure, duration, components ofcurriculum, transaction of curriculum, course evaluation, teachereducator professional development, etc.
3. The third questionnaire is related to student teachers. Thisquestionnaire seeks to obtain the perception of student teachers/teacher trainees of pre-service teacher education programme(B.Ed) at the secondary stage. It consists of 30 items related tothe curriculum, methodology for curriculum transaction, use ofInformation and Communication Technology (ICT) and otherfacilities available in the institute, organisation of co-curricularactivities and evaluation system.All the three questionnaires were tried out and finalised on the
basis of experts opinions.
Data Collection
The data were collected by mailing all the three questionnaires tothe B.Ed institutions in Bangladesh, India, Pakistan and Sri Lanka.

A Comparative Study of Pre-Service Teacher Education ...
Indian Educational Review, Vol. 48, No.1, January 2011 99
The efforts were made to get the filled-in questionnaires from all thefour countries. However, less number of questionnaires were receivedand analysed from Bangladesh, Pakistan and Sri Lanka fromprincipals (7), teacher educators (9) and student teachers (19). Besidesthese, data from secondary sources were also used for completingthe study.
Analysis of Data
The data were scrutinised, classified, compiled and analysed. Thedescriptive analysis of data was carried out. The syllabus andcurriculum of the B.Ed programme from all the four countries wereanalysed to validate the information provided by the respondents.
Findings and Implications of the Study
The following findings and implications have been derived on thebasis of the perceptions of the principals, teacher educators andstudent teachers on different aspects of B.Ed institutions from India,Sri Lanka, Bangladesh and Pakistan. Major findings of the studyare as follows.
Duration
• The duration of the B.Ed programme was one year in India,Bangladesh and Pakistan. However, the duration of the B.Edprogramme in Sri Lanka was three years.
• Most of the teacher educators from India, Bangladesh andPakistan were not satisfied with the one year duration of the B.Edprogramme. The student teachers were found weak in contentknowledge in all the four countries in general and particularly inIndia.
Qualifications
• The Principals from all the countries were having Master's degreein Physical Sciences and Social Sciences along with Master'sdegree in Education. Some Principals were having doctoral degreein education in India.
• In India, Master's degree along with M.Ed was the minimumqualification of Lecturers, Readers and Professors of the B.Edinstitutions. In Pakistan, Master's degree along with B.Ed wasessential for all the posts. In Bangladesh and Sri Lanka, Master'sdegree was the minimum qualification required for all the posts.Five to ten years of experience was also required for the posts ofReaders, Professors and Principals in all the countries.

A Comparative Study of Pre-Service Teacher Education ...
Indian Educational Review, Vol. 48, No.1, January 2011100
Recruitment and Promotion
• In all the countries Lecturers, Readers, Professors and Principalsof B.Ed colleges were recruited through open selection byUniversities or Public Service Commission. The procedure forpromotion for the post of Reader and Professor was based onseniority in Sri Lanka, Bangladesh and Pakistan, where as inIndia, it is based both on open selection as well as under CareerAdvancement Scheme.
Admission
• Graduation degree was the minimum qualification for seekingadmission in the B.Ed programme, where as in Sri Lanka, it wasGCE (Advanced Level). But the teacher educators from Bangladeshand Pakistan expressed that the entry qualification need to bepost graduate. The admissions in the B.Ed programme were madeon the merit basis. The entrance test was also conducted in someuniversities in India and Bangladesh. But the teaching aptitudewas not considered as a criteria for admission in the entranceexamination. The weightage to co-curricular activities should begiven in admission to the B.Ed programme.
Management
• The B.Ed institutions were managed by the Government in allthe countries. However, some institutions were having privatemanagement in India and Bangladesh.
• The B.Ed programme was regulated by the National Council ofTeacher Education (NCTE) in India, National Institute ofEducation in Sri Lanka, National University in Bangladesh andUniversities in Pakistan. These regulatory bodies have beenentrusted the responsibility to maintain the norms and standardsof the B.Ed programme.
• In all the countries, most of the B.Ed institutions were co-educational and some of these were having residential facilities.
Curriculum Development
• In India, National Council of Teacher Education (NCTE),University Grant Commission (UGC) and National Council ofEducational Research and Training (NCERT) were responsiblefor preparing secondary teacher education. National Institute ofEducation, National University and University of Education wereresponsible for Sri Lanka, Bangladesh and Pakistan respectively.

A Comparative Study of Pre-Service Teacher Education ...
Indian Educational Review, Vol. 48, No.1, January 2011 101
• The B.Ed curriculum was revised during 1998, 2002, 2005 and2009 in India, Sri Lanka, Pakistan and Bangladesh respectively.In all the countries, no definite role was specified for theinvolvement of the faculty in formulation and revision of B.Edcurriculum and syllabus. However, some of the faculty memberswere involved in India and Sri Lanka.
• Subjects related to science, social science and languages aretaught by teacher educators in all the countries. During 2002-2009, B.Ed curriculum and syllabi of different subjects wererevised by all the countries on the basis of feedback collectedfrom student teachers, teacher educators and principals ofdifferent institutions.
• Work experience, physical education, art and craft, advancedresearch method and computer education were the additionalpapers of B.Ed programme.
• Art and craft and work experience were prescribed as non-scholastic areas in the B.Ed course. The teacher educators fromIndia and Sri Lanka suggested that co-curricular activities relatedto art and craft and work experience should be organised onregular basis and more weightage should be given to these areasin the B.Ed programme.
• Physical education helped in the development of the personalityof student teachers. However, the student teachers fromBangladesh revealed that physical education was suitable anduseful, but not much time was given for their involvement.
Theory Papers
• The compulsory theory papers prescribed in the B.Ed programmewere almost common in all the four countries. The papers namelyEducational Psychology, Sociology of Education, Guidance andCounseling, Educational Measurement and Evaluation, SchoolOrganisation, Computer Education and issues related tosecondary education were prescribed in the B.Ed programme. InPakistan, the paper on Islamiat and professional ethics were alsoprescribed in B.Ed course. The teaching subjects namely physicalsciences, life sciences, mathematics, English and social scienceswere prescribed by all the countries. Health and physicaleducation, yoga and value education, music, art and craft,computer education were prescribed as additional courses of B.Edprogramme in all the countries.

A Comparative Study of Pre-Service Teacher Education ...
Indian Educational Review, Vol. 48, No.1, January 2011102
• The teaching of different subjects in the B.Ed programme laidmore emphasis on the theory courses than practical work. Besidesthis, there is no link between the curriculum of the B.Ed courseand the school curriculum. Moreover, the curriculum is lengthyand content in many subjects are not required.
• There were many strengths of different subjects prescribed inthe B.Ed course. Teaching of philosophy and psychology are helpfulin the development of the personality of children. The workexperience develops aesthetic sense among the student teachers.The scientific attitude is developed by the teaching of physicalsciences and communication skills by teaching of languagesamong the student teachers.
Practical Work
• Computer application, psychological tests, art and craft, workexperience, practice teaching, research projects, assignments andsocial work were prescribed under practical work. In Bangladesh,only teaching practice was prescribed as practical activity.
• Work experience helped the student teachers to learn by doingdifferent activities. However, the student teachers fromBangladesh revealed that work experience was suitable anduseful, but much time was not given for their involvement andparticipation.
• It was found that the practical activities were very useful formaking an effective teacher. It developed confidence among them.The necessary knowledge and skills related to subject matter wereinculcated by these activities.
• The student teachers of India expressed that performing andvisual arts increased their confidence, brought hidden talentoutside and made them tension free. It also helped in developingtheir personalities. Performing and visual arts made teachinglearning interesting. The student teachers from Bangladesh andPakistan expressed that performing arts was not necessary.
Specific Curricular Inputs
• In India, specific curricular inputs like provision of scholarshipsand remedial teaching were provided for the disadvantagedstudents. In Bangladesh, Sri Lanka and Pakistan no specificcurricular inputs were provided for disadvantaged students.

A Comparative Study of Pre-Service Teacher Education ...
Indian Educational Review, Vol. 48, No.1, January 2011 103
Computer and ICT
• The computer labs were established in the institutions. Thecomputer literacy varied between 40 to 75 per cent in all the fourcountries.
• The computer facilities were utilised for the professionaldevelopment of teacher educators. Different types of relevantmaterials related to their own specialisation were downloadedfrom internet but this facility was availed by only 30 per centstudent teachers. However, the ICT facility was not usedfrequently during teaching learning process in all the fourcountries. ICT based classrooms were not available.
Practice Teaching
• In India, practice teaching was organised in all types of schoolsincluding government, private, aided and own demonstrationschools during first and second half of the year. In Bangladesh,the practice teaching was organised only in private schoolswhereas it was organised in own demonstration schools inPakistan.
• In India and Bangladesh, subjects like social sciences, physicalsciences, languages and mathematics were prescribed underteaching practice of the B.Ed programme.
• The student teachers expressed that two subjects wereundertaken for the practice teaching. In India, twenty-fourlessons from two subjects were delivered during forty-five daysby student teachers. While, forty-five lessons were deliveredduring ninety days in Bangladesh. In Pakistan, eleven lessonswere delivered during thirty days duration.
• The minimum duration of school experience programme was35-60 days in India, Sri Lanka and Bangladesh, whereasmaximum was 90 days in Pakistan. In Sri Lanka, minimum 5-6lessons were required to be delivered during practice teaching,whereas, maximum 90 lessons were required in Pakistan. In allthe four countries, student teachers were prepared for practiceteaching before sending them to actual classroom situation. Forpreparing student teachers, demonstration lessons by facultymembers or outside experts were arranged. Simulated andmicroteaching lessons were organised. About twenty schools wereselected by all the four countries for practice teaching. In SriLanka, about 2 – 3 lessons were observed by the supervisor,whereas maximum 60 lessons were observed in Bangladesh.

A Comparative Study of Pre-Service Teacher Education ...
Indian Educational Review, Vol. 48, No.1, January 2011104
• There were many weaknesses in the system of practice teaching.Teacher educators from India, Bangladesh and Pakistan revealedthat the duration of the practice teaching was less. It was notsupervised properly. The school authorities also did not cooperatefully in organising the teaching practices in their schools. It wasdifficult to observe the natural behaviours of student teachersduring this programme.
Co-curricular Activities
(i) The co-curricular activities like debate, study tour, social activities,drama, health awareness programme, excursion, science fair, etc.were organised as a part of the B.Ed programme. But in Pakistan,very limited activities like indoor games were organised. Theparticipation of the student teachers in co-curricular activitieswere lowest in Pakistan and highest in India.
Transactional Strategies
• Lecture method was frequently used by the teacher educators inall the four countries for curriculum transaction in the B.Edprogramme. Demonstration methods and group discussions wereheld on some occasions. Discovery and problem solving methodswere used rarely.
• ICT is not used for curriculum transaction. Power-pointpresentations were made on some occasions in India. It was notat all used in Bangladesh and Pakistan.
Professional Development
• There was no policy for the professional development of theteacher educators. They were only deputed in orientation andrefresher courses organised by national institutions like UGCand NCERT in adhoc manner.
• For the professional development of faculty members, nationalseminars, refresher courses, orientation programmes and otheracademic programmes on different themes were organised by allthe four countries. Lowest 15 faculty members from Pakistan andmaximum 100 teacher educators from Sri Lanka attended theprofessional development programmes during 2004-07. Theprogrammes were organised in the area of educational technology,research design, curriculum development, peace education,human rights, physical sciences, languages, womenempowerment and teacher education during 2004-07. Teacher

A Comparative Study of Pre-Service Teacher Education ...
Indian Educational Review, Vol. 48, No.1, January 2011 105
educators from Sri Lanka attended awareness course on teachereducation, whereas in Bangladesh, teacher educators attendedthe course on teaching quality improvement in secondaryeducation. The teacher educators from Pakistan attended therefresher courses on human rights education, curriculum reviewand revision and teaching of social studies for elementary B.Edprogramme. But, no such programme was attended outside thecountry during this time period.
• Teacher educators from India had expressed that they were themembers of professional organisations like AET, AIATE, AIERA,ATER, IAP, MAF and NATE. In Sri Lanka, teacher educators werethe members of SLTEU. In Banladesh, they were the membersof NAEM, where as in Pakistan, they were the members of PITEand AIOU.
• The teacher educators from India had published articles/ papersin the field of school and teacher education. The articles werecontributed in MERI Journal of Education, Indian Education,University News, Journal of Indian Education, Indian EducationalReview, Journal of All India Association for Educational Research,Journal of Education and Psychology, Nav Shiksha and Educationin Asia. In Sri Lanka, teacher educators had published articles oneducational awareness and role of education in womenempowerment in journal of Thinakaran. Teacher educators fromBangladesh published articles on Biological science teaching forthe B.Ed syllabus, Right person for the right job, curriculum in thejournals named-The Observer, The Star, and The Sangbad. No articlewas published by the faculty of Pakistan during 2004-07.
• Teacher educators from India had published books in the area ofeducational technology, computer education, teaching ofmathematics, child psychology and total quality management ineducation during 2004-07. The book on Islamic philosophy waspublished by the teacher educators of Sri Lanka. In Bangladeshand Pakistan, teacher educators had published books related toteaching subjects on Science, Psychology, English, Languagesand Social Science.
Research and Innovation
• Many research projects in the area of school and teachereducation were completed during 2004-07 in India and Pakistan.In India, innovations on practice teaching, educational technology,and instructional strategies were carried out, whereas innovations

A Comparative Study of Pre-Service Teacher Education ...
Indian Educational Review, Vol. 48, No.1, January 2011106
on ICT and staff development were undertaken by Pakistan. Noinnovations were reported by Sri Lanka and Bangladeshcountries.
Library
• The library facilities were available in the B.Ed institutions andthe professional librarians were working in these institutions inall the four countries. There was open access for books andjournals in India and Sri Lanka, but open access was not availablein Bangladesh and Pakistan. The libraries were kept open onholidays only in India.
• In all the four countries, it was found that books and journalsrelated to the B.Ed course were not available in adequatenumbers. Moreover, the libraries were having variety of booksrelated to different fields. The student teachers from all thecountries were satisfied with the library services and cooperationextended by the library staff. Seating arrangement in the librarywas not found proper and adequate in most of the libraries.
Physical facilities
Most of the physical facilities including Principal's room, Staff room,Classrooms, Student's common room, Office space, Laboratories, andToilets in the B.Ed institutions were available and adequate in India,Bangladesh and Pakistan. But the physical facilities like playground,computer room and gymnasium were not adequate.
Weaknesses and Suggestions
• Many weaknesses were reported in the B.Ed programme from allthe four countries. It was reported that more emphasis was givenon the teaching of theory courses. Infrastructure facilities were notadequate. Students were not attending the classes on regular basis.New and innovative methodologies were not used for transactingthe curriculum. The problems related to admission procedure, lackof faculty, library books, inter-college migration of students,curriculum and textbooks were also reported by the respondents.
• Many suggestions like use of ICT during teaching learningprocess, adequate infrastructural facilities, adequate libraryfacilities, appointment of qualified staff, well equipped sciencelaboratories, enhancement of duration of the B.Ed programmefrom one year to two years, more emphasis on practice teachingthan theory, availability of textual material and revision of the

A Comparative Study of Pre-Service Teacher Education ...
Indian Educational Review, Vol. 48, No.1, January 2011 107
B.Ed curriculum on regular interval of five years, were reportedby the principals, teacher educators and student teachers of B.Edinstitutions from all the countries for improvement of this course.
• Teacher educators from Bangladesh mentioned that PSTE shouldbe made compulsory.
• The student teachers from Bangladesh expressed that moreassignments should be given on the basis of the theory papers.Guidance and counseling paper was suggested to be included inthe theory paper of the B.Ed course of Pakistan.
Examination and Evaluation System
• Both annual and semester system for examination were followedin India and Sri Lanka. Whereas, only annual system was followedin India and Bangladesh and semester system in Pakistan werefollowed. Marking system was prevalent for theory and practiceteaching and grading system followed for practical workexamination in all the four countries.
• The performance of the student teachers in theory courses wasevaluated by conducting external and internal examination.Written tests, viva-voce and assignments were largely used astools for examination. Practice teaching was evaluated byobserving and supervising the delivery of the lesson plans in realclassrooms. The evaluation of the practical activities was basedon construction of psychological tests, assignments and projects.
• There were many weaknesses in the current evaluation system.Outdated and traditonal techniques were used for the evaluationof performance of student teachers. These tools and techniqueswere largely related to cognitive aspect of the personality. Teachereducators suggested that methods of evaluation should be revised.Continuous and comprehensive evaluation should be introducedfor evaluating the performance of the student teachers and gradingsystem should be introduced in place of marking system.
Implications
The following implications for action have been drawn on the basis ofthe findings mentioned above.
1. The Principals, Teacher educators and Student teachers fromIndia, Bangladesh and Pakistan stated that one year duration ofthe B.Ed programme is very less and it should be increased fromone year to two years, so that the necessary knowledge and skills

A Comparative Study of Pre-Service Teacher Education ...
Indian Educational Review, Vol. 48, No.1, January 2011108
can be inculcated among the student teachers during thisprogramme. Besides this, integrated programme of longer durationlike in Sri Lanka should also be introduced in India for preparingbetter teachers.
2. There should be entrance examination for admission in the B.Edprogramme and it should be based on aptitude of the students.Written tests, group discussions and interviews should be thepart of admission procedure.
3. Physical facilities including principals' room, staff room, commonroom, computer room, office space, laboratories and toilets shouldbe provided adequately, so that the quality of teaching can beenhanced.
4. The library services should be provided in all the B.Ed institutions,with latest books and journals in adequate number. Well qualifiedlibrarian should be employed. Adequate space for library andreading room should be provided in the institutions. The computerand internet facility should also be available in the library. Thelibrary should have networking with other libraries.
5. Well qualified faculty members including principals, teachereducators and technical staff should be appointed according tosanctioned strength prescribed for the institution. In the sameway, administrative staff should also be appointed. Promotionalpolicies should be followed on regular basis.
6. The schools and the teacher education institutions are workingin isolation. Even, there is no relationship between the PSTEcurriculum and the school curriculum. Both the curriculumshould have close linkages and coordinations. The frequency forrevising PSTE curriculum should be at least five years.
7. During the B.Ed programme, more emphasis was laid on theorypart than the practical aspects. All the theory papers prescribedin the B.Ed programme should give space to the practical workincluding assignments and projects.
8. The duration of the school experience was not found adequate inthe B.Ed programme. Ninety days duration were allocated for thisprogramme only in Pakistan. The other countries should alsoallocate at least ninety days duration of the school experienceprogramme. Student teachers should be prepared well beforesending them to actual school situations. Simulation andmicroteaching lessons should be organised. All the lessons shouldbe supervised and monitered, either by the faculty of the

A Comparative Study of Pre-Service Teacher Education ...
Indian Educational Review, Vol. 48, No.1, January 2011 109
institution or by the school teachers, where the school experienceprogramme is undergoing.
9. Lecture method was used frequently for transacting thecurriculum of the B.Ed programme in all the four countries.Besides this, project method, problem solving method, quiz,discovery method and case studies should be used in transactingthe curriculum of the B.Ed programme. ICT should be integratedduring teaching learning process.
10. The activities related to work experience, projects andassignments were undertaken as a part of B.Ed programme.These activities were not undertaken seriously. More activitieslike debates, social activities, drama, health awarenessprogrammes and science fairs should be organised in more seriousand systematic manner, so that student teachers can gain moreexposure and experience during this programme.
11. The performances of student teachers in the B.Ed programmewere evaluated through annual and semester systems ofexamination. It is suggested that comprehensive and continuousevaluation should be introduced for evaluating the performanceof student teachers. Equal weightage should be given to schoolbased experience and practical work. Grading system should beintroduced in place of marking system.
12. There was no regular policy for the professional development offaculty of the B.Ed programme. Only some faculty members aredeputed to the seminars and conferences in adhoc manner. Onlyvery few are contributing articles/papers in the journals. Thereshould be a regular policy for the professional development of thefaculty members for their growth and development.
REFERENCES
ALI, M. A. 1998. Supervision for Teacher Development: A Proposal forPakistan, International Institute for Educational Planning, UNESCO,Paris.
FAROOQ, R. A. 1990. A Survey Study on the Problems and Prospects of TeacherEducation in Pakistan, Ministry of Education, Islamabad.
HERATH, NIHAL. 1998. Primary Teacher Education Programmes: The Presentand the Future, Primary Education Reforms in Sri Lanka.
NCERT. 2006. National Focus Group on Teacher Education in CurriculumRenewal (Position Paper), NCERT, New Delhi.

A Comparative Study of Pre-Service Teacher Education ...
Indian Educational Review, Vol. 48, No.1, January 2011110
NCTE. 2009. National Curriculum Framework for Teacher Education, NCTE,New Delhi.
REDDI, USHA. V and MISHRA SANJAY. 2005. Educational Media in Sri Lanka,Educational Media in Asia, Commonwealth of Learning, Vancouver.
REPORT. 1996. Courses for Bachelor of Education, University of Karachi,Karachi.
REPORT. 1997. Teacher Education in Bangladesh for the Effective use of NewInformation Media in Schools, UNESCO-APED Associated Center,Hiroshima University, Japan.
REPORT. 2000. Curriculum and Syllabus for Secondary School CertificateExamination, National Curriculum and Textbook Board Dhaka,Bangladesh.
REPORT. 2000. Professional Development Programme for Senior TeacherEducators of Sri Lanka, NCERT, New Delhi.
REPORT. 2002. Pak Millennium Conference, Higher Education in Pakistan:Chalanges for Reforms, Massachusetts Institute of Technology andBoston University, Boston, USA.
REPORT. 2003. Bachelor of Education- A Guideline for Teaching Practice,National University, Gazipur, Bangladesh.
REPORT. 2007. Bachelor of Education-Curriculum, National University,Gazipur, Bangladesh.
REPORT. 2008. Status of Education in Asia-Pacific Region, InternationalReading Association, UNESCO, Bangkok.
YADAV, S. K. 2003. Research Perspective in Teacher Education, UniversityNews, 41, 22. June, 2-8, 2003. New Delhi.
YADAV, S. K and SUMBUL REHAN . 2006. Teacher Education in India: Issues andConcerns, University News, 44, 38, (September, 18-24, 2006), New Delhi.
YADAV, S. K. 2007. Professional Teachers in Higher Education, UniversityNews, 45, 09. February 26-March 4, 2007. New Delhi.
YADAV, S. K. 2010. Innovations in Teacher Education, University News,Vol. 48, No. 40. October 4-10, 2010.

Less Familiar Pathways in Constructivism
Indian Educational Review, Vol. 48, No.1, January 2011 111
* Regional Institute of Education (RIE), Bhubaneswar–751 022
Less Familiar Pathways in Constructivism
B. K. PARIDA* J. K. MOHAPATRA* AND M. MAHAPATRA*
ABSTRACT
Beginning as an art movement in Russia in the early parts of thetwentieth century, constructivism has encompassed many domainsof knowledge. Accordingly, many varieties of constructivism haveappeared in the literature, so much so that some authors have gone onto dub constructivism a ‘veritable jungle’. The five major varieties suchas philosophical constructivism, sociological constructivism, Piagetianconstructivism, radical constructivism, and social constructivism arelike well travelled highways, widely talked about and discussed inliterature. In the present paper we make an effort to bring into focussome of the less discussed varieties of constructivism. Though they arelike less travelled streets compared to their major counterparts, theylead to new destinations, and explore new dimensions of knowledgeacquisition and cognition.
Introduction
In the current scenario constructivism offers a more realisticapproach to the process of knowledge acquisition than behaviourism.However, unlike behaviourism, constructivism appears in a largevariety of forms (good et. al. 1993; Phillips 1995; Geelan 1997; Jha2009), some more prominent than the others, Ernest (1995) goes onto say that there are as many varieties of constructivism as thereare researchers. Riegler (2003) finds constructivism a ‘veritablejungle’. Some of the different varieties of constructivism are elaboratelydiscussed in the literature whereas others are less pronounced. Thelatter varieties far outnumber the former in terms of perspective andfield of application. Here we shall focus on these ‘minor’ varieties ofconstructivism and their significance. If we consider the major

Less Familiar Pathways in Constructivism
Indian Educational Review, Vol. 48, No.1, January 2011112
varieties of constructivism as well travelled highways, the minorvarieties may appear like less familiar streets. However, the latterlead to new destinations with distinctive ambience.
To appreciate these less discussed forms of constructivism a briefaccount of the historical development of constructivism and its majorvarieties is in order.
Constructivism: A Historical Perspective
The term ‘constructivism’ appears to be Russian in origin(konstruktivizm). According to The Oxford Dictionary of Difficult Words(2002, p. 95): “Constructivism is a style or movement in art in whichassorted mechanical objects are combined into abstract mobilestructural forms. The movement originated in Russia in the 1920sand has influenced many aspects of modern architecture and design”.The New Encyclopaedia Britannica (1985) elaborates: “Constructivism,Russian artistic and architectural movement that was first influencedby Cubism and Futurism and is generally considered to have beeninitiated in 1913 with the “painting reliefs” – abstract geometricconstructions – of Vladimir Tatlin. Antoine Pevsner and Naum Gabojoined Tatlin and his followers in Moscow, and upon publication oftheir jointly written Realist Manifesto in 1920 – they became thespokesmen of the movement. It is from the meanifest that the nameConstructivism was derived: one of the directives was “to construct”art. Because of their admiration for machines and technology,functionalism, and modern industrial materials such as plastic, steel,and glass, they were also called artist-engineers.”
Thus the term ‘constructivism’ seems to have originated in thefield of art and architecture. But it has exerted a lot of influence inmany fields of knowledge and learning. However, the basic connotationof the term across the fields remains– “to construct”.
Historically, the tenets of constructivism, as used in the field ofknowledge, are said to have emerged as early as the sixteenthcentury in the writings of Giambattista Vico or Giovanni BattistaVigo (1668-1744), an Italian philosopher. Her proposition of 1710,verum esse ipsum factum ("true itself is fact" or "the true itself ismade") is taken as an early instance of constructivism epistemology.The proposition states that truth is verified through creation orinvention and not through observation as taught by Descartes. Itis also translated as: "The human mind can know only what thehuman mind has made" (von Glasersfeld 1995, p. 21). vonGlasersfeld (2000) also quotes Giambattsta Vico thus: “God knows

Less Familiar Pathways in Constructivism
Indian Educational Review, Vol. 48, No.1, January 2011 113
the world, because He created it, human beings can know only whatthey themselves have made”, and then adds: “The treatise formwhich this statement is taken, is the first constructivist manifesto.”According to Noddings (1990) constructivism also emerged from theworks of Ulric Neisser (act psychology), and Noam Chomsky (innatelinguistic structures of mind).
Major Pathways in Constructivism
The major traditions have been identified in constructivism. Theseare (i) philosophical constructivism, (ii) sociological constructivism,and (iii) educational constructivism.
Philosophical constructivism probably originated in the ancientGreek philosophy with Socrates’ (469-399 BC) ‘dialogue’ in whichhe asked directed questions leading his pupils to realise forthemselves the weakness in their thinking. More recent origins ofconstructivism may be seen in George Berkeley's (1685-1753)philosophy of science, the philosophy of lmmanuel Kant (1724-1804),Thomas Kuhn's (1922-1996) Structure of Scientific Revolutions (1962),and Richard Rorty's (1931-2007) Philosophy and the Mirror of Nature(1979). The philosophical view of constructivism revolves around theconcept of materialism vs. idealism and the debate concerningwhether the world is knowable or unknowable (Afanasyev 1980).According to philosophical view of constructivism our beliefs andperceptions of the world are actively constructed (not discovered) byus on the basis of our experiences and active processes of developingknowledge rather than through a passive reception of sense data.This basic principal of philosophical constructivism in fact governsall other kinds of constructivism.
Experts in the history of science, philosophy of science, sociology,anthropology and computer science often indulge in the debateconcerning the role of social factors in scientific advancement relativeto retaional, empirical and other scientific factors. This has led tothe notion of sociological constructivism. According to sociologicalconstructivism the progress of science and technology, and thegeneration of the public body of knowledge are due to changing socialconditions and interests. It argues that all knowledge is constructedand interpreted socially in the frame of science and technologystudies. Though the physical world is not socially constructed, ourknowledge of the physical world is socially constructed in the sensethat interpretation of the sensations coming through our senseorgans is socially negotiated, constructed and accepted by people

Less Familiar Pathways in Constructivism
Indian Educational Review, Vol. 48, No.1, January 2011114
interacting with each other. The changes in theories and philosophicalcommitments of science are not directly linked to the explanatorypower of cognitive content and rational reasoning. The sociologiststreat the individual mind as a ‘black box’ whose inputs are sociologicalconcerns and outputs are in the form of statements of belief whichmay be true or false. Three varieties of sociological constructivismhave resulted from different schools of thought (Boudourides 1998):strong form, mild form, and actor-network theory (ANT).
Educational constructivism is concerned with knowledgeconstruction in teaching-learning situations including classrooms.It is also known as psychological constructivism (Phillips 1995) andhas two categories: (a) personal constructivism, and (b) socialconstructivism, depending upon whether an individual or a group isinvolved in the process of construction. Personal constructivism inturn is supposed to have two version: (i) Piagetian constructivism orcognitive constructivism due to Piaget and (ii) radical constructivismdue to von Glasersfeld. Social constructivism is ascribed to Vygotsky.
Piagetian constructivism, ascribed to Jean Piaget (1896-1980),simply means that knowledge is not passively passed on by theteacher to the learner, but is actively constructed by the learner. Inthis connection Piaget (1970, pp. 57-58) says, "What remains isconstruction as such, and one sees no ground why it should beunreasonable to think it is ultimate nature of reality to be in continualconstruction instead of consisting of an accumulation of readymadestructures". Piaget's stages of cognitive development supportconstructivism.
Ernst von Glasersfeld proposed radical constructivism both asa theory of knowledge and as a guide for science and mathematicseducation (von Glasersfeld 1984, 1987, 1993, 1995). In radicalconstructivism the traditional philosophical view of realismaccording to which knowledge has to be a representation of theobjective world that is independent of human experience isabandoned. The stand taken by the radical constructivists is thatknowledge is something which is personally constructed by anindividual in an active way, as she tries to comprehend and organiseher experiential world. Knowledge construction is an evolving andself-regulatory process, and it is impossible to know the extent towhich knowledge reflects an ontological reality. The term 'ontology'refers to 'the science that deals with the principles of pure being'or 'that part of metaphysics which deals with the nature and essenceof things', von Glasersfeld justifies the name radical constructivism

Less Familiar Pathways in Constructivism
Indian Educational Review, Vol. 48, No.1, January 2011 115
in the following lines: "Radical constructivism, thus, is radicalbecause it breaks with convention and develops a theory ofknowledge in which knowledge does not reflect an 'objective'ontological reality, but exclusively an ordering and organisation ofa world constituted by our experience. The radical constructivist hasrelinquished 'metaphysical realism' once and for all." (vonGlasersfeld 1987, p. 199)
Lev Vygotsky (1896-1934), a leading Russian developmentalpsychologist, is the propounder of social constructivism. In it he bringsto focus the role of the society in the process of knowledge acquisitionby a learner. According to him collaboration is the key in knowledgeconstruction. Vygtosky introduced the notion of the ‘Zone of ProximalDevelopment’ (ZPD) (Vygotsky 1978) which is defined as theintellectual potential a child acquires when assisted by aknowledgeable adult or a more advanced peer. ZPD is to bedistinguished from the actual domain of development of the childand can be a true measure of the child's achievement. Interactivecommunication needs to involve guided interaction that should enablethe child to reflect critically on their conceptions and go for necessarychanges. Social constructivism views individual knowledge and socialknowledge to be one and the same. It suggests that construction ofknowledge is facilitated by the vast cultural repertoire of artefacts,ideas, assumptions, concepts and practices which an individualinherits or born into. Thus, learning is a form of culturalapprenticeship.
Less Familiar Types of Constructivism
While the above five categories namely philosophical constructivism,sociological constructivism, Piagetian constructivism, radicalconstructivism, and social constructivism are considered the majortypes of constructivism, with their numerous followers, there are manyother types of constructivism mentioned in the literature though to alesser extent. Each of them has its own significance and utility,gleaned from the literature. The list, however, may not be exhaustive,(i) Communal constructivism, (ii) Computational constructivism,(iii) Constructionism, (iv) Contextual constructivism, (v) Criticalconstructivism, (vi) Cultural constructivism, (vii) Cyberneticconstructivism, (viii) Dialectical constructivism, (ix) Didacticconstructivism, (x) Empirical constructivism, (xi) Human constructivism,(xii) Information-processing constructivism, (xiii) Mathematicalconstructivism, (xiv) Methodological constructivism (xv) Moderateconstructivism, (xvi) Physical constructivism (xvii) Pragmatic social

Less Familiar Pathways in Constructivism
Indian Educational Review, Vol. 48, No.1, January 2011116
constructivism (xviii) Psychiatric/Therapeutic constructivism,(xix) Rational constructivism, (xx) Realist constructivism,(xxi) Sociocultural constructivism, (xxii) Socio-historical constructivism,(xxiii) Sociotransformative constructivism, (xxiv) Trivial constructivism,(xxv) Weak constructivism.
A perusal of literature suggests that some of the above forms ofconstructivism are not readily accessible. In view of this we now brieflyintroduce 19 of the above list of 25 forms of constructivism.
Communal Constructivism
B. Holmes et. al. introduced the term communal constructivism in 2001in view of the increasing influence of Information and CommunicationTechnology (ICT) and networked learning on knowledge constructionand sharing. In this model, apart from developing their own knowledgebase, students and teachers involved may be thought of as membersof a kind of community who help one another in generation andsharing of knowledge making use of ICT. Communal constructivismthus suggests a way of converting the principles of socialconstructivism into practice in teaching-learning situations. In thewords of Holmes et. al. (2001), "What we argue for is a communalconstructivism where students and teachers are not simply engagedin developing their own information but actively involved in creatingknowledge that will benefit other students. In this model studentswill not simply pass through a course like water through a sieve butinstead leave their own imprint in the development of the course,their school or university, and ideally the discipline."
Computational Constructivism
Computational constructivism is based on neural basis of cognitivedevelopment. Its proponents are Quartz, and Sejnowski (1997) andWestermann (2000).
Constructionism
As a variant of constructivism, constructionism (Papert 1991, 1993)emphasises that in order to learn about abstract concepts it isnecessary for a learner to create and experiment with 'artifacts'.A link between this view and that of the original Russian connotationof constructivism may be seen. Today constructionism may befacilitated by computers. Thus, besides being an active constructorof knowledge, a learner needs to go for particular constructions ofthe subject that are external and shared, thereby bringingunderstanding and experience together.

Less Familiar Pathways in Constructivism
Indian Educational Review, Vol. 48, No.1, January 2011 117
Contextual Constructivism
An individual constructs her knowledge upon a foundation or in acontext. Contextual constructivism recognises the significance ofcontext in learning. Contextual constructivism is aboutunderstanding the fundamental, culturally based beliefs that bothstudents and teachers bring to the classroom, and how these beliefsare supported by culture. According to Cobern (1993) contextualconstructivism is nothing but the impact of culture on the teachingand learning of science. In contextual constructivism the student,the content, and the context are intimately connected. The studentbuilds an understanding of content in context and the contextmediates student understanding of content. Context shapes studentlearning and is in turn shaped by both content and the student.
Critical Constructivism
The roots of critical constructivism are said to lie in a series of articleswhich appeared in the journal Critical Inquiry (1991). It argue thatbesides 'truth' and 'reality', other research tools like 'evidence','document', 'experience', 'fact', 'proof', etc. are also important in asocial and ideological construction, and these are also subject tocriticism. It applies to many disciplines including natural sciencesuch as physics and biology, statistics, history, law, etc. Accordingto Kincheloe (1993): "Critical constructivism concerns the attempt tomove beyond the formal style of thinking which emerges fromempiricism and rationalism, a form of cognition that solves problemsframed by the dominant paradigm, the conventional way of seeing."
Watts and Jofili (1998) raise an interesting debate on'constructivist teaching' claiming that the term is an oxymoron as itcombines two contradictory actions: 'construction' and 'instruction'(teaching). They argue that "...constructivist teaching itself shouldbe superseded in favour of 'critical constructivism', and approachwhich undertakes a broader critique of the relationships betweenteacher and taught, between learner and subject matter, and betweenschooling and society." According to them, "To be criticalconstructivists, teeachers must possess critical awareness: anunderstanding of themselves, their perspectives, their approachesto the construction of knowledge, and ways in which their ownconsciousness has been shaped by society (and schools)." Theyfurther observe that "Inside a critical constructivist classroom,learners reflect on the lives they lead, ask questions to discovermeanings and values. Their learning experiences now include a self-

Less Familiar Pathways in Constructivism
Indian Educational Review, Vol. 48, No.1, January 2011118
reflective dimension around themes from daily life. .....This aims topush them into becoming active participants in shaping the economic,social and cultural environment in which they live. These learnersalso become actively and critically involved in controlling their ownlearning, and teachers need to work towards the 'liberation' oflearners, instead of their 'domestication'." They produce empiricalevidence of teachers moving from constructivism towards criticalconstructivism in classroom transactions through in-serviceprofessional development course and action research.
In short, under critical constructivism the learner is expected toquestion the answers, the evidences, and the so called facts.
Cultural Constructivism
According to cultural constructivism, knowldege and reality, asperceived by a community of people, are dependent upon its culture,which may also dictate the methodology and approach. To give anexample, for scientific studies, Western cultures use objects whereasNative American culture uses events. Superstitions and blind beliefsare also peculiar to cultures. Under cultural constructivism knowledgeconstruction is perceived as a process of enculturation. Culturalconstructivism appears to be a subset of the broader socialconstructivism.
Cybernetic Constructivism
Cybernetics is the study of self-organising systems. Cyberneticconstructivism owes its origin to cybernetic developments in biology,neurophysiology, and cognition, in particular, cybernetics of self-organisation or second order– mode 2 - cybernetics (von Foerster1984). It is based on the concept of autopoiesis (self-formation)originally developed to study cell biology. Autopoietic systems are self-contained and self-referential units. Besides biology the concept hasbeen applied to physical, cognitive and psychic systems (Mingers1995) and social, communication, and legal systems (Luhmann 1989,1990, 1995). Cybernetic constructivism supports the basic notion ofphilosophical constructivism as a self-referential process ofmaintaining identity. Autopoiesis is said to manifest its constructivistcharacter at the level of 'closure' of the nervous system in the sensethat action and cognition depend on each other and not on anyoutside system. Von Foerster has argued that this happens whenhuman brain interprets signals received from different sensoryorgans. Thus living beings are autopoietic systems. Accordingly,

Less Familiar Pathways in Constructivism
Indian Educational Review, Vol. 48, No.1, January 2011 119
Maturana and Varela (1980) have claimed that cognitive apparatusis an organisationally closed system. Riegler (2003) terms thisbiological constructivism. In this connection von Glasersfeld claimsthat "contemporary neurophysiological models may be compatiblewith a constructivist theory of knowing but can in no way be integratedwith the notion of transduction of 'information' from the environmentthat any realist epistemology demands" (von Glasersfeld 1989).
Dialectical Constructivism
Dialectical constructivism is concerned with the interaction betweena learner and her environment. It recognises that traditional viewsof cognition are not sufficient and both psychological and sociologicalfactors are important for learning. The blending of psychology andsociology helps one to understand how individuals orient and learnfrom their surrounding and, further, how these interactive influencesshape their mental processes. Dialectical constructivism is also calledblended constructivism as it brings out the importance of the blendingof psychology and sociology in the context of learning. It is linked tothe joint efforts of psychologists and sociologists to understandlearning from the perspective of 'contextualism' (Brunning,Schraw,and Ronning 1999).
Didactic Constructivism
Didactic constructivism is linked to the problem of operationalisingradical constructivism in teaching (Brink 1991). Here the term'didactic' has the connotation 'to realise'. The verb 'to realise' in turnhas two components: 'to construct', and 'to confront'. In this processthe learner constructs a conceptual representation and thenconfronts it with the ideas of the others. It enables one to discovermistakes which could not be perceived earlier. Similarity betweenthis and the Socrates' 'dialogue' discussed earlier in the context ofphilosophical constructivism may be seen.
Human Constructivism
Human constructivism (Sharma 2006), due to J. D. Novak (Novak 1993),basically proposes that the process of meaningful learning, asunderstood through assimilation theory, is fundamental to both thepsychological process of cognitive development of individuals and theepistemological process of new knowledge construction. It avers thatlearning and research are nothing but meaning making mechanisms.A researcher as well as a new learner constructs meaning out of a

Less Familiar Pathways in Constructivism
Indian Educational Review, Vol. 48, No.1, January 2011120
new experience by connecting it to their existing knowledge framework.This means that a scientist and a learner use the same cognitiveprocesses in the construction of new knowledge. The consequentconceptual change may occur in small incremental steps resultingin a 'weak' from of knowledge reconstruction or in a rapid and abruptmanner resulting in a 'strong form of knowledge reconstruction. Thisis valid for both a scientist and a learner. According to humanconstructivism, knowledge is an idiosyncratic, dynamic constructionof human beings and in identical situations two human beings mayconstruct two different meanings. This brings out the 'human' aspectof a scientist's work, which is often ignored in teaching-learningsituations.
Information-Processing Constructivism
According to information-processing constructivism (Melnerney andMelnerney 2002) ability of an individual in information processing iscrucial in the process of learning. It suggests that a learner has anindependent capacity to self-actualise, i.e. the learner can activelyorganise his/her own learning experiences with clear ideas of meansand ends.
Mathematical Constructivism
Mathematical constructivism (Riegler 2003) is a reaction to Platonismin mathematics. Its proponents, such as I.E.J. Brouwer, ArendHeyting, and Jean Paul van Bendegem claim that mathematicalobjects exist only if they can be constructed by a method. For thisreason they oppose, for example, the notion of infinity.
Physical Constructivism
There exists a 'physical' approach to cognition (Riegler 2003). Theproponent and physicist O. Diettrich (2001) argues that the perceivedpatterns and regularities are just invariants of inborn cognitive(sensory) operators. Different sets of cognitive operators generatedifferent cognitive phenotypes. Laws of nature are, therefore, humanspecific. According to the physicist G. Grossing (2001) the perceivednon-classical structure of space and time in relativistic class arehuman-specific artefacts based on neurophysiological processes.
Pragmatic Constructivism
According to Rieber (1993), pragmatists are those teachers andresearchers who have developed a braod and general constructivist

Less Familiar Pathways in Constructivism
Indian Educational Review, Vol. 48, No.1, January 2011 121
perspective through their disposition, reading and professionaldevelopment programmes, but have a narrower view of the same inclassrooms.
Psychiatric/Therapeutic Constructivism
This constructivism is used as a family therapy to solve interpersonalproblems (Watziawiek et al 1974). It aims at disrupting the pattern ofsymptomatic interpretation of a habitual situation by 'reframing' thesituation. The procedure is to "place a conceptual and/or emotionalsetting or viewpoint in another frame which fits the 'facts' of the sameconcrete situation equally well or even better and thereby change itsentire meaning". This way the patients are enabled to find alternativeconstructions of their world-view.
Socio-Historical Constructivism
This form of constructivism basically suggests that humans are socialbeings, situated within the culture and history of a society, whichshape their thinking process.
Sociotransformative Constructivism
The sociotransformative constructivism (Rodriguez 1998) originatedto help teachers in making their science and mathematics classesmore gender-inclusive, socially relevant, and student-centred. Itattempts to unite social constructivism as a theory of learning andmulticulturalism as a theory of social justice.
Trivial Constructivism
This advocates the thesis that all knowledge is human construction(von Glasersfeld, 1993). It, however, has 'discovery of ontology' as itspurpose (Osborne, 1996). It also means that the worldviews, whichare differently constructed, gradually converge towards a knowledgesystem that represents the world objectively.
Weak Constructivism
Paul Ernest (1995) describes weak constructivism as one in whichindividuals construct their own knowledge (a local notion), whileaccepting the existence of objective knowledge (a global notion).
In Table 1 we give a summary of the main tenets of the differentforms of constructivism discussed above. The table enables us torecognise the distinctions between them at a glance.

Less Familiar Pathways in Constructivism
Indian Educational Review, Vol. 48, No.1, January 2011122
TABLE 1
Form of Main tenetsconstructivism
Communal Students and teachers as a community; Members help oneconstructivism another in knowledge acquisition; Each member creates
knowledge for other; Use of ICT and networked learningComputational Cognitive development of learner; Neural dimensionconstructivism of cognitionConstructionism Knowledge construction facilitated by construction of and
experimentation with artifactsContexual Significance of context in learning; Impact of cultureconstructivism on learningCritical Construction has a critical dimension; Construction hasconstructivism a self reflective dimensionCultural Knowledge and reality depend upon culture; Knowledgeconstructivism construction is a process of enculturationCybernetic Concept of autopoiesis; Cognitive apparatus is anconstructivism organisationally closed systemDialectical Interaction between learner and environment; Blending ofconstructivism psychological and sociological factors for learning; ContextualismDidactic Operationalising radical constructivism in teaching;constructivism Construction and confrontation; Discovering mistakesHuman Knowledge as idiosyncratic and dynamic human construction;constructivism Learning and research use similar meaning making mechanisms;
Weak and strong forms of knowledge reconstructionInformation- Information-processing; Self-actualisationprocessingconstructivismMathematical Mathematical objects exist if they can beconstructivism constructed by a methodPhysical Inborn cognitive operators; Cognitive phenotypes;constructivism Neurophysiological processesPragmatic Broad constructivist perspective gained through reading,constructivism disposition and professional development but narrower view of
constructivism in classroomsPsychiatric/ Solving interpersonal problems; Reframing a habitual situation;Therapeutic Alternative worldviewsconstructivismSocio-historical Humans as social beings situated within culture and history;constructivism Thinking process shaped by culture and historySociotransfor- Uniting social constructivism as a theory of learning andmative Const. multiculturalism as a theory of social justiceTrivial Knowledge is human construction; Discovery of ontologyconstructivismWeak Own knowledge as local notion; Objective knowledge asconstructivism global notion

Less Familiar Pathways in Constructivism
Indian Educational Review, Vol. 48, No.1, January 2011 123
Conclusion
Recognising the fact that the five major varieties of constructivismnamely philosophical constructivism, sociological constructivism,Piagetian constructivism, radical constructivism, and socialconstructivism (which belong to the three major constructivisttraditions) are generally widely discussed and disseminated in theliterature, in this paper we have tried to highlight some of the lessprominent varieties of constructivism whose significance can bejudged on their merit. It must be pointed out that these varieties arenot less important; rather they attempt bring to the fore subtle butsignificant issues in constructivism. They are only limited in theirdomains of operation. They appear to be less global and more local intheir scope. Some of them may be directly traced to the major varietieswhereas some others appear to have an independent stance. Theyappear less widely in the literature. This is one reason why we havegiven here a brief account of only 19 of the list of 25 less known formsof constructivism cited above. However, it may not be far from truth ifwe conclude that these minor varieties constitute some 'finestructures' of the major varieties of constructivism. In view of theirindividual significance it may be important to bring the implicationsof these less known varieties of constructivism into teaching–learningsituations.
REFERENCES
AFANASYEV, V. G. 1980. Marxist Philosophy. Progress Publishers. Moscow.
BRINK, J. VAN DEN. 1991. Didactic constructivism. In E. von Glasersfeld (Ed.),Radical Constructivism in Mathematics Education. Kluwer Dordrecht.pp. 195-227.
BRUNNING, R. H., SCHRAW, G. J., and R. R. RONNING 1999. Cognitive Psychologyand Instruction. Upper Saddle River, N. J: Merrill. pp. 218.
BOUDOURIDES, M. A. 1998. Constructivism and education: a shopper's guide.Paper contributed to the International Conference on the Teaching ofMathematics, Samos, Greece, (July 3-6, 1998). http://www.duth.gr/mboudour/
COBERN, W. 1993. Contextual constructivism: the impact of culture onlearning and teaching of science. In K. Tobin (ed.), The practice ofConstructivism in Science Education, Lawrence-Erlbaum, Hillsdale, N.J.pp. 51-69.

Less Familiar Pathways in Constructivism
Indian Educational Review, Vol. 48, No.1, January 2011124
DIETTRICH, O. 2001. A Physical Approach to the Construction of Cognitionand to Cognitive Evolution. Foundation of Science. Vol. 6 No. 4.pp. 273-341.
ERNEST, P. 1995. The one and the Many. In L. Steffe and J. Gale (Eds.).Constructivism in Education (pp. 459-486). New Jersey: Lawrence ErlbaumAssociates, Inc.
GARRISON, J. W. 1998. Toward a Pragmatic Social Constructivism.In M. Larochelle, N. Bednarz and J. Garrision (eds.), Constructivismand Education. Cambridge University Press. pp. 43-60.
GEELAN, D. R. 1997. Epistemological Anarchy and the Many Forms ofConstructivism, Science and Education. Vol. 6 No. 1-2. pp. 15-28.
GOOD, R., WANDERSEE, J., and ST. JULIEN, J. 1993. Cautionary Notes on theAppeal of the New "Ism" (Constructivism) in Science Education.In K. Tobin (Ed.), Constructivism in Science and Mathematics Education.AAAS, Washington DC. pp. 71-90.
GROSSING, G. 2001. Comparing the Long-Term Evolution of "CognitiveInvariances" in Physics with a Dynamics in States of Consciousness.Foundation of Science. Vol. 6 No. 4. pp. 255-272.
HOLMES, B., TANGNEY, B., FITZ GIBBON, A., SAVAGE, T., and MEEHAN, S. 2001.Communal constructivism: Students constructing learning for as well aswith others. Proceedings of SITE 2001, Florida.
JHA, A. K. 2009, Constructivist Epistemology and Pedagogy, New Delhi: AtlanticPublishers (P) Ltd.
KINCHELOE, J. L. 1993. Towards a Critical Politics of Teacher Thinking. Mappingthe Postmodern, London: Bergin and Garvey.
LUHMANN, N. 1989. Ecological Communication. Cambridge, UK: Polity Press.
LUHMANN, N. 1990. Essays in Self-Reference. New York: columbia UniversityPress.
LUHMANN, N. 1995. Social Systems. Stanford: Stanford University Press.
MATURANA, H. and VARLEA, F. 1980. Autopoiesis and Cognition: The Realisation ofthe Living, Boston Studies in the Philosophy of Sciences. Vol. 42. Boston,Dordrecht: D. Reidel.
MCINERNEY and MCINERNEY 2002. Educational Psychology, Pearson CustomPublishing, Australia.
MINGERS, J. 1995. Self-Producing Systems: Implications and Applications ofAutopoiesis. New York: Plenum.
NODDINGS, N. 1990. Constructivism in mathematics education. In R. Davis,C. Maiier, and N. Noddings (Eds.), Constructivist views on the teachingand learning of mathematics, pp. 7-18. Reston, Va: National Council ofTeachers of Mathematics.

Less Familiar Pathways in Constructivism
Indian Educational Review, Vol. 48, No.1, January 2011 125
NOVAK, J. D. 1993. Human constructivism: A unification of psychological andepistemological phenomena in meaning making. International Journal ofConstructivist Psychology, Vol. 6, issue 2, pp. 167-193.
OSBORNE, J. E. 1996. Beyond constructivism. Science Education. Vol. 80.pp. 53-82.
PAPERT, S. A. 1991.Situating Constructionism. In. I. Harel and S. Papert(Eds.), Constructionism. pp. 1-12. Norwood. N J: Ablex.
PAPERT, S. 1993. The Children's Machine: Rethinking School in the Age of theComputer, New York: Basic Books.
PIAGET, J. 1970. Logic and Psychology (translation, W. Mays). N Y: Basic Books.
QUARTZ, S and SEJNOWSKI, T. J. 1997. The neural basis of cognitive development:A constructivist manifesto. Behavioural and Brain Sciences. Vol. 20,No. 4, pp. 537-596.
RIEBER, L. P. 1993. A pragmatic view of instructional technology. In K. Tobin(Ed.), The Practice of Constructivism in Science Education. Hove: LawrenceErlbaum.
RIEGLER, A. 2003. The Key to Radical Constructivism, http://www.univie.ac.at/constructivism/key.html
RODRIGUEZ, A. J. 1998. Strategies for counter resistance: Towardsociotransformative constructivism and learning to teach science fordiversity and for understanding. Journal of Research in Science Teaching.Vol. 36, No. 6, pp. 589-622.
Sharma, S. 2006, Constructivism. In S. Sharma. Constructivist Approachesto Teaching and Learning: Handbook for Teachers of Secondary Stage,pp. 4-5. New Delhi: NCERT.
THE NEW ENCYCLOPAEDIA BRITANNICA. 1985. Micropaedia. Vol. 3. pp. 576.
THE OXFORD DICTIONARY OF DIFFICULT WORDS. 2002. de. Archie Hobson. OxfordUniversity Press. pp. 95.
VON FOERSTER, H. 1984. Observing Systems Salinas: Intersystems Publications.
VON GLASERSFEED, E. 1984. An introduction to radical constructivism.In P. Watzlawick, The Invented Reality, pp. 17-40. New York: W. W. Nortonand Company.
VON GLASERSFELD, E. 1987. Construction of Knowledge. IntersystemsPublications, Salinas CA.
VON GLASERSFELD, E. 1989. Cognition, Construction of Knowledge andTeaching. Synthese. Vol. 80. No. 1. pp. 121-140.
VON GLASERSFELD, E. 1993. Questions and answers about radicalconstructivism. In K. Tobin (Ed.), The Practice of Constructivism in ScienceEducation. pp. 23-38. Washington, DC: AAAS Press.

Less Familiar Pathways in Constructivism
Indian Educational Review, Vol. 48, No.1, January 2011126
VON GLASERSFELD, E. 1995. A Way of Knowing and Learning. The Falmer Press.London.
VON GLASERSFELD, E. 2000. Radical Constructivism and Teaching.http://srri.nsm.umass.edu/vonGlasersfeld/onlinePapers/html/geneva/
VYGOTSKY, L. 1978. Mind in Society. Ed. M. Cole et. al. Cambridge. MA: HarvardUniversity Press.
WATTS, M. and JOFILI, Z. 1998. Towards critical constructivist teaching.International Journal of Science Education. Vol. 20. No. 2. pp. 173-185.
Watzlawick, P., Weakland, J., and Fisch, R. 1974. Change: Principle of ProblemFormation and Problem Resolution. New York: W. W. Norton.
WERTSCH, J. V. 1979. From social interaction to higher psychologicalprocesses. Human Development. Vol. 22. pp. 1-22.
WESTERMANN, G. 2000. Constructivist Neural Network Models of CognitiveDevelopment. Ph. D. thesis at the University of Edinburgh.

Socio-Psychological Factors Influencing the Choice of Teaching ...
Indian Educational Review, Vol. 48, No.1, January 2011 127
* Associate Professor, Department of Foundations of Education, NUEPA, New Delhi
Socio-Psychological FactorsInfluencing the Choice of Teaching
as a Career: A Study of Post GraduateStudents in Delhi
VINEETA SIROHI*
ABSTRACTThis study responds to the current challenge of inadequate supply ofteachers in Indian higher education. The present study is an attemptto ascertain the choice of post graduate students for teaching andexplore the factors influencing the choice of teaching as a career inhigher education. A survey was carried out on a sample of 303 postgraduate final year students selected through a multistage stratifiedsampling technique. Results revealed that approximately one-third ofthe students were inclined towards teaching profession. A significantdifference was found between academic stream and inclinationtowards teaching. Further, significant differences were also foundacross professions in terms of job preference, economic benefit, freedomof work and job security. While, career choice of teaching was foundto be influenced by various socio-psychological factors, no evidencewas adduced to support gender influence. The findings have implicationsfor policy makers and educationists for attracting and retaining talentin teaching profession.
Key words: Socio-psychological factors, career choice, teachingprofession, higher education, academic stream
Introduction
In confronting the many challenges that the future holds in store,humankind sees in education an indispensable asset in its attemptto attain the ideals of peace, freedom and social justice. The tirelessquest for knowledge in all fields of thought and human endeavour

Socio-Psychological Factors Influencing the Choice of Teaching ...
Indian Educational Review, Vol. 48, No.1, January 2011128
is quite evident in the Indian Education system. In the quest fordevelopment, higher education assumes great importance, for itprovides the cutting edge and there is no doubt that higher educationhas a significant contribution to economic development, socialprogress and transformation of the Indian economy into aknowledge economy. The massive expansion of higher education to1500 universities nationwide to increase the gross enrolment ratioof at least 15 per cent by 2015 as envisaged by National KnowledgeCommission (2006) makes qualified and competent teacher aprerequisite for its efficacious expansion and calls for a seriousattention. The new dimension of education, which makes it anintegral part of the national development, cast great responsibilityon the teacher. At the core of the learning enterprise, a teacher ifenabled and empowered, would lead and shape the reinvention ofthe organisation into a genuine learning organisation. Therefore,there must be a conscious effort to attract and retain talentedteachers by providing attractive salaries along with incentivesand rewards for performance. This is also essential as talentedstudents have far more lucrative choices in other professions in Indiaand abroad.
The social and economic aspirations of the general populationcontinue to grow apace with the fast changing scenario. Though thesalaries undoubtedly are an element of the profession’sattractiveness, non-pecuniary conditions and rewards are crucial,too. These include both realisation of personal potentials and theservices rendered to the society at large. Likewise, the process ofcareer choice is the result of interaction among various forces. InIndia, career choice is influenced by various social and psychologicalfactors comprising of influence of significant others, prestige, gender,socioeconomic status, and educational background.
Perusal of the extant literature revealed the influence of variousfactors on career choice. Arulmani, Van and Eastan (2003) indicatedthat career belief and socio-economic status influence the careerdecision of high school students in India. Another study by See (2004)pointed out that those with less educated parents are more likely tochoose teaching as a career. In another study, Chan, Chan andSang (2002) found significant relationships between students’interest in teaching and demographic characteristics. Recently,Kumar and Sharma (2008) indicated nominal pay packages as oneof the important reasons behind the shortage of faculty inuniversities. The determinants have been explored repeatedly with
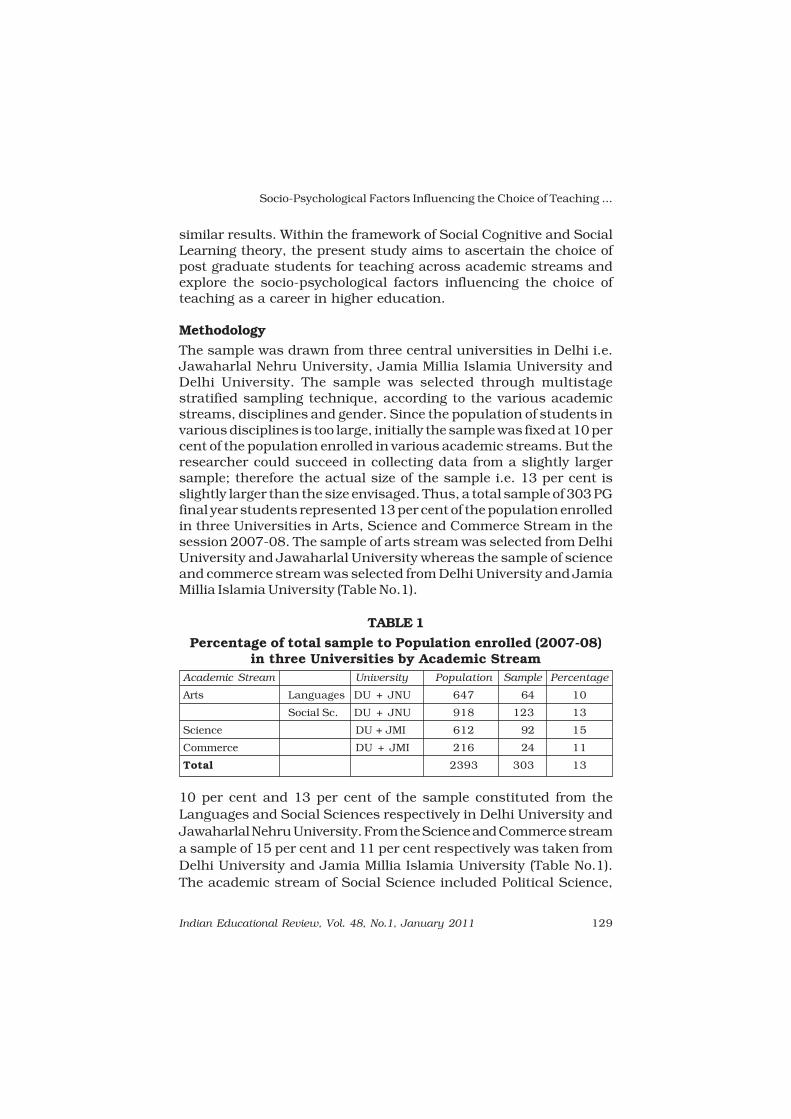
Socio-Psychological Factors Influencing the Choice of Teaching ...
Indian Educational Review, Vol. 48, No.1, January 2011 129
similar results. Within the framework of Social Cognitive and SocialLearning theory, the present study aims to ascertain the choice ofpost graduate students for teaching across academic streams andexplore the socio-psychological factors influencing the choice ofteaching as a career in higher education.
Methodology
The sample was drawn from three central universities in Delhi i.e.Jawaharlal Nehru University, Jamia Millia Islamia University andDelhi University. The sample was selected through multistagestratified sampling technique, according to the various academicstreams, disciplines and gender. Since the population of students invarious disciplines is too large, initially the sample was fixed at 10 percent of the population enrolled in various academic streams. But theresearcher could succeed in collecting data from a slightly largersample; therefore the actual size of the sample i.e. 13 per cent isslightly larger than the size envisaged. Thus, a total sample of 303 PGfinal year students represented 13 per cent of the population enrolledin three Universities in Arts, Science and Commerce Stream in thesession 2007-08. The sample of arts stream was selected from DelhiUniversity and Jawaharlal University whereas the sample of scienceand commerce stream was selected from Delhi University and JamiaMillia Islamia University (Table No.1).
TABLE 1
Percentage of total sample to Population enrolled (2007-08)in three Universities by Academic Stream
Academic Stream University Population Sample Percentage
Arts Languages DU + JNU 647 64 10
Social Sc. DU + JNU 918 123 13
Science DU + JMI 612 92 15
Commerce DU + JMI 216 24 11
Total 2393 303 13
10 per cent and 13 per cent of the sample constituted from theLanguages and Social Sciences respectively in Delhi University andJawaharlal Nehru University. From the Science and Commerce streama sample of 15 per cent and 11 per cent respectively was taken fromDelhi University and Jamia Millia Islamia University (Table No.1).The academic stream of Social Science included Political Science,

Socio-Psychological Factors Influencing the Choice of Teaching ...
Indian Educational Review, Vol. 48, No.1, January 2011130
History, Sociology, Geography, Economics and Psychology, underlanguages-English, Hindi and Sanskrit were covered and Physics,Chemistry, Biology and Mathematics constituted the Science stream.
TABLE 2
Showing no. of respondents by gender and academic stream
Gender Academic Stream
Arts Science Commerce Total
Language S. Sc.
Male 37 67 43 14 161
Female 27 56 49 10 142
Total 64 123 92 24 303
With regards to gender, a total of 161 (53%) males and 142 (47%)females constituted the total sample of 303 students (Table No.2). Aself-developed questionnaire comprising 57 questions wasadministered to identify the important factors influencing the decisionto choose the teaching profession and perceptions about teaching asa career in relation to other careers. The questionnaire comprised ofboth closed and open ended questions covering eight broad areasrelating to teaching profession- personal information, socio-economicstatus, job preference, status of teaching profession, fosteringdynamism in the profession, attracting and retaining talent, qualitiesessential for good teachers and factors viewed necessary to improvethe status of teachers. The data were analysed quantitatively bycomputing percentage and employing chi square tests and othersalient trends were highlighted through qualitative analysis.
Results
The analysis of the data revealed that out of a total sample of303 students only 31 per cent were inclined towards teaching,representing 30 per cent males and 32 per cent females. A Chi Squaretest revealed no significant difference between gender and inclinationtowards teaching. Further, an analysis of data across academicstreams, indicate that a larger number of students from the ArtsStream were inclined towards teaching (37%) followed by the studentsfrom the Science stream (23%) and Commerce stream (17%). Chisquare tests showed a significant difference between academicstreams and inclination towards teaching at .05 level (Table No.3)

Socio-Psychological Factors Influencing the Choice of Teaching ...
Indian Educational Review, Vol. 48, No.1, January 2011 131
TABLE 3
χχχχχ2 Value for inclination towards teachingacross gender and academic stream
Variables Inclined Not Inclined Total χ2
Male 48 (29.81) 113(70.18) 161 (53%)
Gender Female 46 (32.39) 96 (67.60) 142 (47%) 0.23
Total 94 (31.02) 209 (68.97) 303 (100)
Arts 69 (36.89) 118 (63.10) 187 (61.71)
Academic StreamScience 21 (22.82) 71 (77.17) 92(30.36)
Commerce 4 (16.66) 20 (83.33) 24 (7.92)8.16*
Total 94 (31.02) 209 (68.97) 3 0 3 (100)
*p < 0.05, **p < 0.01
Job Preference, in terms of order of priority on a list of ten professionsreveal that Civil Services was the most popular career across variousacademic streams and Teaching occupied the second position.A Chi Square test showed a significant difference at 0.01 level forjob preference among the professions (Table No.4).
TABLE 4
χχχχχ2 Value across professions in terms of job preference,economics benefits, freedom of work and job security
Variables Professions χ2
Civil Teaching Management Self OthersServices Employment
Job 127 94 5 55 55 167.25**Preference (41.91) (31.02) (7.26) (1.65) (18.15)Economic 128 9 69 20 77 151.68**Benefits (42.24) (2.97) (22.72) (6.60) (25.41)Freedom 77 84 7 104 31 106.39**of Work (25.41) (27.72) (2.31) (34.32) (10.23)Job 142 91 11 12 47 207.19**Security (46.86) (30.03) (3.63) (3.96) (15.51)
*p < 0.05, **p < 0.01
Further relative ranking of various professions in terms of economicbenefits, placed teaching much lower compared to other professions,as hardly 3 per cent of students rate it at first rank, whereas CivilServices occupied the first place as rated by 42 per cent ofrespondents. With regards to freedom of work, Self Employment wasoccupied the top position as rated at first rank by 34 per centrespondents, whereas the position of teaching is enhanced (second

Socio-Psychological Factors Influencing the Choice of Teaching ...
Indian Educational Review, Vol. 48, No.1, January 2011132
position) in comparison to Civil Services which was placed at thirdposition. With regards to job security, teaching again lagged behindCivil Services and was placed at the second position. Further, ChiSquare test indicated a significant difference across professions interms of first ratings for job preference, economic benefits, freedomof work and job security at .01 level (Table No.4).
The Socio-economic status of respondents was examined on thebasis of the levels of income and educational background of theparents. The major proportion of the students inclined towardsteaching fell in the category of low level of income (63%), while incontrast few students came from high-income parents. Further,Educational background of the parents of those inclined towardsteaching seems to be low, as only 22 per cent of their parents haveacquired the qualification of post graduation. Self efficacy also seemsto be a pertinent factor in the choice of teaching as a career whichis evident from the responses of almost half of the students who areinclined towards teaching seems to have strong beliefs about theirability to teach well. Since career choice is a very crucial turn orthreshold in the life of an individual, the significant others in one’slife, like parents, friends and relatives, play a significant role ininfluencing the decisions of one’s career. With respect to influence ofsignificant others on career choice of students, a large segment i.e.60 per cent of the students indicate that they made the decisionabout their career independently, whereas 34 per cent of the studentsstate that their decision is based on a joint consensus with theirparents, whereas influence of parents accounted to only 11 per cent.On the other hand, influence of relatives and friends seems to benegligible i.e. only 3 per cent and 6 per cent respectively (Fig.1).
FIGURE 1
Preference based on influence of significant others

Socio-Psychological Factors Influencing the Choice of Teaching ...
Indian Educational Review, Vol. 48, No.1, January 2011 133
Prestige factor is also considered important in Indian society whilechoosing a career. About 73 per cent of the students affirm thatteaching profession receive adequate respect and recognition in societytoday. However, a five point rating scale, indicate an average ratingand none rated it very low. A little less than one fourth placed it at ahigh echelon. Hence, it may be inferred that status of teaching isnot perceived as low since it is rated at that level by a negligiblenumber of students, whereas in contrast 18 per cent rate it veryhigh. On inquiring about why teaching is not chosen as a career?Almost 75 per cent of those not inclined towards teaching stated lowsalary as the main reason for not choosing teaching as their career.The qualitative information may be gathered from Table No.5.
TABLE 5
Excerpts from narratives of students from academicstreams on the theme “Why did you not choose
Teaching as your Career?”
• Low salary is the main reason of not choosing Teaching.
• It is a low paid job.
• It is because, teaching is something like repeating the samesyllabus again and again, there is nothing new to learn. It isnot practical enough.
• In teaching, we do not get lucrative salaries, which could beavailable in other professions. Moreover, in teaching profession,I can never get opportunity to spend holidays abroad.
• Because of low salary.
• There are many factors which stop me to choose teaching as acareer such as work load, low status in society, low recognition,seems static, negative perception from society, less respect bystudents etc.
• It is the last option for me, since salary package is not goodenough.
The salient trends that emerged from the narratives in Table No. 5are that besides low salary, the availability of other options offeringlucrative salaries was also important reason for not choosing teachingas a career. Other deterring factors were work load, low status insociety, low recognition, static profession, negative perception fromsociety, less respect by students and the monotonous and mechanicalnature of the job. Almost half of the students are of the opinion that

Socio-Psychological Factors Influencing the Choice of Teaching ...
Indian Educational Review, Vol. 48, No.1, January 2011134
one of the most imperative factors accountable for deterioration ofstatus of teaching is ‘Salary and Service conditions’.
Discussion
A range of forces work together to facilitate or thwart career choice.It is against the backdrop of this tightly interwoven fabric of varioussocio-psychological factors that career choices seem to be expressedin the Indian context.
Positive and negative values could be attributed to career withinthe social-cognitive environment, created by prevailing ideologies andexperiences of the community. Further, prestige and respectabilityare factors which have marked influence on career choice. It hasbeen reported in the literature that beliefs about the prestige attributesof a career significantly influence career choice behaviour (Akhilesh,1991; Desai & Whiteside, 2000), which has been confirmed by thepresent study. It seems that careers which are accorded lower prestigeare also accorded lower dignity. Hence, in order to win the respect oftheir parents and peer, students may choose to enter a particularoccupation, not because they would enjoy the work, but because theywant to be deemed worthy of respect by virtue of their futureoccupational membership (Arulmani, 2005). The findings of thepresent study seem to align with prestige perceptions.
An interesting finding is related to the socio-economic backgroundof the students, as the results confirm a trend that has been revealedby past research, which suggests that those opting for teaching tendto come from a low socioeconomic background. The present studyreplicated the findings of Arulmani, Van and Eastan (2003) whichhighlighted the influence of career belief and socio-economic statuson the career decision. The beliefs held by young people fromeconomically and socially disadvantaged backgrounds seem topredispose them to lower levels of occupational aspirations ascompared to their more privileged counterparts. Further, our findingsare also consistent with the findings of See (2004) which indicatethat those with less educated parents are more likely to chooseteaching as a career.
The findings of the present study pertaining to gender disparitywith respect to inclination towards teaching appears to be in conflictwith the findings of Singh, (2006) indicating that higher proportionof women students preferred academic career as compared to menstudents, as well as Chan et. al. (2002) who found significant

Socio-Psychological Factors Influencing the Choice of Teaching ...
Indian Educational Review, Vol. 48, No.1, January 2011 135
difference between students gender and interest in teaching. Thisdiscrepancy may be explained in the past by the notion that teachingis, by tradition, a feminine profession and over the years the mindsetsof people have gone through a sea change, in response to evolvingsocial ideologies.
The Indian child rearing practices family structure, hierarchicalsocial organisation and value systems promote social support andinterdependence. But, with the advent of industrialisation andurbanisation there has been an enormous change from the past, inthe values, child rearing practices, family structure etc. which isevident from findings of the present and past research. Findings ofArulmani (1995), indicate that 46 per cent career choices were basedon parental influence as against 12 per cent influence indicated inour study. And individual’s decision making with the help of parentalinputs had occurred amongst 24 per cent of the individuals, whereasit is about 33 per cent in our study. There is striking divergence inrespect of independent decision making, which is fifteen times morenow, than what it was in 1995. So, we may infer that in a time gap ofabout thirteen years, young persons have become more independentin taking career decisions and the spectrum of a combined decisionof parents and children has increased. This seems to illustrate ablending of the influence of significant others with the young person’semerging individuality.
As reported by Bereiter and Freedman, (1962) that ability is themajor determinant of occupation choice is confirmed by our studyindicating beliefs of high self efficacy having more probability ofinclination towards teaching. The study concurs with the findingsof Chan, et. al. (2002) with respect to relative ranking of teaching toother professions occupying one of the first three positions amongtop three careers, most wanted by students and a significantdifference between academic streams and interest in teaching. In asimilar study, students’ decision to teach or not was found to berelated to their subject of study at the university. Social sciencesstudents were two and a half times more likely than those doingscience and maths to choose teaching as a career (See, 2004).
Deterioration of status in teaching profession has been indicatedin the present study which is also acknowledged by a recentgovernment report indicating a perceptible decline in the popularityand status of the teaching profession (GOI 2006). It also indicatesthat salary, service conditions and allowances are responsible forthe decline of teachers’ status similar to our study.

Socio-Psychological Factors Influencing the Choice of Teaching ...
Indian Educational Review, Vol. 48, No.1, January 2011136
Conclusion
Compared to other industries, teaching does not offer lucrative careerin terms of monetary benefits, as a result only few talented peopleget attracted towards teaching. Further, there is a general feelingamong members of the society that a teacher is not receiving duerecognition. The very fact that, compared to many other professions,teaching is not getting equivalent material benefits is an index ofcomparative neglect of the teacher. There is a need to identify thefactors these students believe are the most important and thendemonstrate that teaching meets these factors. This sets the stageto focus on recruitment and induction process, assessment oftraining needs and supportive working conditions to substantiallyenhance the status of the teaching profession. The task of the policyformulators in any country will be ensuring that the country risesto this challenge to compete in the global knowledge economy.
In this present study, an attempt is made to provide an insightinto the perceptions of post graduate students of central universitiesregarding teaching as a career choice in higher education, to assistpolicy makers and planners in making informed decisions regardingimprovement in the status of teaching profession. Thus, cleardirections emerge from this research that policy makers must addresseffective ways to provide an attractive salary package and lift thestatus of teaching profession at par with other professions, in orderto attract talented persons to this profession. It is found that broaderprofessional concerns about pay, prestige and career opportunitiescontinue to figure into individual teachers’ choices. Therefore,policymakers must take seriously the long-range challenges ofincreasing teachers’ salary and developing differentiated careers thatreward expertise and encourage advancement. Without somechanges, talented students and committed teachers will continue toturn away from teaching. Academics must receive sufficientremuneration according to the global standards. In many, perhapsmost, countries salary levels have not kept up with inflation and theacademic profession has lost ground to other professional occupations.Today, prospective teachers have access to occupations offering highpay and status; comfortable and well-equipped work setting;continuous training; and opportunities for rapid career advancement.Thus there is no guarantee that they will choose teaching over otheroptions. Nor do they necessarily expect to teach for the long term;serial careers are the norm, and short-term employment is common.

Socio-Psychological Factors Influencing the Choice of Teaching ...
Indian Educational Review, Vol. 48, No.1, January 2011 137
Therefore, the challenge of recruiting teachers to meet the shortageis unprecedented, in both nature and scope.
In the current scenario of globalised world Teaching professionneeds a revamping of the policies of personnel management in termsof recruitment, salary and service conditions, promotional avenues,grades and cumulative economic benefits in the career span andperformance appraisal.
REFERENCES
AKHILESH, K. B. 1991. Vocational choice patterns of urban adolescents: Acase study. The Indian Journal of Social Work, Vol. 52(2), 265-275.
ARULMANI, G. 1995. Stressors associated with career related decisions in India.Biennial conference of the Indian Association for Child and AdolescentMental Health, Hyderabad: Indian Association for Child and AdolescentMental Health.
ARULMANI,G., VAN LAAR,D., and EASTON,S.2003.The influence of career beliefsand socio-economic status on the career decision-making of high schoolstudents in India. International Journal for Educational and VocationalGuidance, 3,193-204.
ARULMANI, G., and ARULMANI, S. 2005. Career Counselling A Handbook. TataMcGraw-Hill Publishing Company Limited, New Delhi.
BEREITER, C., and FREEDMAN, M. B. 1962. Fields of Study and the People inthem. The American College, New York.
CHAN, L.K., CHAN, W.K. and SANG, S.K. 2002. Teaching as a Career in HongKong: Understanding Secondary Seven students’ Perceptions. The HongKong Institute of Education, Survey Study.
DESAI, G., and WHITESIDE, T. 2000. Vocational higher secondary educationgraduates in the state of Gujarat. Journal of Vocational Education andTraining, Vol. 52(1), 49-61.
GOI 2006. Towards Faster and More Inclusive Growth: An Approach to theEleventh Five Year Plan, Planning Commission.
GOI 2006. Report to the Nation. National Knowledge Commission.
KUMAR, T. R., and SHARMA, V. 2008. Pay Structure in Higher Education: SomeIssues. Economic and Political Weekly,19-22.
SEE, B.H. 2004. Determinants of Teaching as a Career in the U.K. Evaluationand Research in Education, Vol.18 (4), 213-225.
SINGH, N.S. 2006.Higher Education and Career-Choices of the UndergraduatesStudents. University News, Vol.44 (19), 16-20.

Effect of Self Regulatory Strategies onEnhancing Teaching Competence among
B.Ed Students
Project InvestigatorBEGUM, A. J. (2009)
Objectives: (i) To identify the important components and principlesof Self Regulation (SR). (ii) To identify the important Self RegulatoryStrategies (SRS) which can enhance the teaching competencies (TC).(iii) To identify the specific teaching competencies which are veryessential for successful effective teaching. (iv) To find out therelationship between SRS and specific teaching competencies. (v) Toevolve a model to enhance to the TC of B.Ed trainees. (vi) To assessthe level of SR and application SRS of B.Ed teacher trainees. (vii) Toimplement the model evolve in order to enhance the TC of B.Ed teachertrainees through the application of SRS. (viii) To assess theapplication of SRS among the B.Ed teacher trainees after intervention.(ix) To assess TC after intervention. (x) To find out the relationshipbetween application of SRS and TC. (xi) To identify the specific SRS,which enhance specific TC.
Methodology: A sample of 40 teacher trainees of eight subjects(English, Tamil, Science, Biological science, History, Economics,Mathematics and Commerce) from KEVI college of teacher education,Salem Tamil Nadu were selected under quota sampling method(Kothatri, 2005). The independent variables, selected for the presentstudy were teachers' age, gender, education qualification, majorsubject, years of teaching experience, type of school and locality ofschool while dependent variable was teaching competence of teachertrainees.Tools used: A Questionnaire and Attitude Scale for B.Ed teachertrainees and Teaching Competency Assessing Tool developed andstandardised by the investigator. Tools used in the study hadcontent validity.
ERIC Projects Completed

Indian Educational Review, Vol. 48, No.1, January 2011 139
ERIC Projects
Findings: (i) The B.Ed teacher trainees improved in all the dimensionsnamely planning, monitoring and evaluation of self regulatorystrategies in the post assessment then the pre assessment. (ii) Theteaching competency of the teacher trainees improved significantlyin post assessment of teaching competency than the Pre assessment.All the components of teaching competency shown significantimprovement. (iii) Teacher trainees of Physical Science subject scoredhighest in the evaluation aspect of self regulation. Teacher traineesof History subject scored highest in the monitoring aspect of selfregulation. Teacher trainees of Mathematics subject scored highestin the planning aspect of self regulation. (iv) Teacher trainees of Tamilsubject scored highest in the four dimensions of teaching competency,such as mobilisations of resources, planning curriculum, developingleardership quality and motivating pupils. (v) Teacher trainees ofEnglish subject significantly improved in the four dimensions ofteaching competence such as motivating colleagues, evaluation andremedial skills and planning curriculum. (vi) Teacher trainees ofMathematics subject has shown considerable improvement in fourdimensions of teaching competence such as mobilisation of resources,planning curriculum, identification of pupils' talents and needs andclassroom management. (vii) Teacher trainees of Physical Sciencesubject have improved in the four dimensions of teaching competencesuch as mobilisation of resources, planning curriculum, motivatingpupil and initialisation of curriculum. (viii) Teacher trainees ofBiological Science subject have significantly improved in the fourdimensions of teaching competence such as developing leadershipquality, planning curriculum, motivating colleagues and initialisationcurriculum. (ix) Teacher trainees of History subject has shownconsiderable improvement in the three dimensions of teachingcompetence such as identification of pupils' talents, classroommanagement and motivating pupils. (x) Teacher trainees of Commercesubject has shown considerable enhancement in the threedimensions of teaching competence such as developing leadershipquality, motivating colleagues and interschool relations. (xi) Teachertrainees of Economics subject have shown considerable enhancementin the three dimensions of teaching competence such as, mobilisationof resources, identification of pupils' talents and evaluation andremedial skills. (xii) In the overall performance of teacher trainees ofMathematics subject has shown highest performance in the teachingcompetence from all the other teacher trainees of different subjectsand age groups.

Indian Educational Review, Vol. 48, No.1, January 2011140
ERIC Projects
Availability and Use of ICT in Schools inDelhi
Project Investigators
SIDDIQUE, M. A. AND ABRAHAM, J. (2010)
Objectives: (i) To study the availability of hardware and softwarefacility in schools in Delhi. (ii) To study the extent of use of technologiesin different type of schools as evident from competencies in students.(iii) To study the impact of ICT on students. (iv) To study the extent oftraining in computers received by the teachers of Delhi.
Methodology: The study was conducted on a sample of 309 schools-157 Government, 52 Government aided, 93 Public, 5 KVS and 2 Zamiaschools. The sample were selected by using random sampling methodtaking 822 primary school students, 970 students of class VII/VIIIand 196 teachers of above five different types of schools. Tools usedin the study were: (a) Questionnaire for Heads of the schools(b) Questionnaire for the class IV/V students, (c) Questionnaire forclass VII/VIII students, and (d) Questionnaire for teachers. Data wereinterpreted by using statistical techniques like; Mean, StandardDeviation, percentage, etc. The reliability of the studetns'competencies tests were established through test-retest method.
Findings: (i) 94 per cent of the total schools in Delhi had computers,whereas 100 per cent of KVS and Zamia schools had computers,97 per cent of Public schools and 87 per cent of Government aidedschools had computers. (ii) There was computer lab in 84 per cent ofthe total schools, 79.62 per cent Government schools, 80.77 per centGovt. aided schools, 93.55 per cent Private schools, 80 per cent KVSand 100 per cent Zamia schools. (iii) Scanner was present in 29 percent of the schools. (iv) The availability of laptop in percentage wasnil in Government schools, 5.77 per cent in Govt. aided schools, 19.35per cent in Private schools and 20 per cent in KVS. (v) The availabilityof data lodger was poor as in only 1.94 per cent of total schools studied13 per cent of total schools had an LCD projector. (vi) The availabilityof internet facility in the schools were excellent as 74.52 per cent ofGovernment schools, 75 per cent of Government aided, 63 per cent ofPublic, 80 per cent of KVS and 100 per cent of Zamia schools had

Indian Educational Review, Vol. 48, No.1, January 2011 141
ERIC Projects
internet facility. (vi) Internet, LAN A and Interactive white board werethe technologies that the teacher equipped to handle classes of the21st century providing learning environments which could make thelearner construct knowledge and be active learners rather thanpassive listeners in the class. (vii) Findings suggested that the schoolswere ready to take up e-learning environments as 71.5 per cent ofthe schools studied had internet connection. (vii) Availability ofsoftware was 20.38 per cent of govt. schools, 3.08 per cent ofGovernment aided schools, 23.66 per cent private schools, 60 percent KVS, 0 per cent zamia schools and 22.33 per cent of total schoolshad publishing software, 3.18 per cent of govt. schools, 7.69 per centof govt. aided schools, 21.51 per cent private schools, 20 per centKVS, per cent 0 Zamia schools and 9.71 per cent of total schools hadsoftware for web design. (viii) General knowledge CDs were availableonly in 1.91 per cent govt., 9.62 per cent govt. aided, 44 per cent KVSand per cent0 Zamia and 60 per cent of the total schools. (viii) Onlinelibrary facility was available in 1.91 per cent govt. school, 7.69 percent govt. aided schools, 9.68 per cent private schools, 20 per centKVS and 0 per cent Zamia schools and 5.5 per cent total schoolscovered in this study. (ix) Only 12 per cent of total schools covered inthis study used computers for examination purpose. (x) 81 per centof the schools covered under this study had computer as a teachingsubject. (xi) The effect on ICT on students made a difference in dropoutrate in the schools. 7.5 per cent decreased in dropout rate in theschools under ICT compared with schools without ICT (5.7%).(xii) The enrolment of students in schools with ICT facility increasedat 13.97 per cent when compared with 11.93 per cent in Non-ICTschools. (xiii) ICT has helped in improving the results of the studentsin the terminal examination. (xiv) The effect of ICT on the studentswas found in the field of achievement, time spent on study and interestshown in the classrooms, (xv) The study found that 35.25 per cent ofthe total teachers had no training in computer, while only 32 percent teachers had received departmental training in computereducation. (xvi) Teachers without training computers were willing toundergo training and use computers in classroom teaching. Thestudy has cited 121 references in the end.

For further enquiries, please visit www.ncert.nic.in or contact the BusinessManagers at the addresses of the regional centres given on the copyright page.

For further enquiries, please visit www.ncert.nic.in or contact the BusinessManagers at the addresses of the regional centres given on the copyright page.

Form IV (See Rule 8)INDIAN EDUCATIONAL REVIEW
1. Place of Publication National Council of EducationalResearch and Training (NCERT)
2. Periodicity of Publication Half-yearly
3. Printer’s Name Chander Mohan(Whether citizen of India?) Yes(If foreigner, state the Not applicablecountry of origin)Address Proprietor: Gita Offset Printers
C-90, Okhla Industrial AreaPhase II, New Delhi 110 020
4. Publisher’s Name Neerja Shukla(Whether citizen of India?) Yes(If foreigner, state the Not applicablecountry of origin)Address Head, Publication Department
NCERT, Sri Aurobindo MargNew Delhi 110 016
5. Editor’s Name Poonam Agrawal(Whether citizen of India?) Yes(If foreigner, state the Not applicablecountry of origin)Address Academic Editor (IER), DERPP
NCERT, New Delhi 110 016
6. Names and addresses of the National Council of Educationalindividuals who own the Research and Training, New Delhinewspaper and partner or (An autonomous body of theshareholders holding more than Government of India in the Ministry ofone per cent of the total capital Human Resource Development)
I, Neerja Shukla, hereby declare that the particulars given above aretrue to the best of my knowledge and belief.
Publisher