Embed Size (px)
Citation preview
Duty Cycling Influences Current Generation in Multi-AnodeEnvironmental Microbial Fuel CellsEmily J. Gardel,† Mark E. Nielsen,‡ Phillip T. Grisdela, Jr.,§ and Peter R. Girguis*,‡
†School of Engineering and Applied Sciences, Harvard University, 29 Oxford Street Cambridge, Massachusetts 02138, United States‡Department of Organismic and Evolutionary Biology, Harvard University, 16 Divinity Avenue, Cambridge, Massachusetts 02138,United States§Department of Biology, Dartmouth College, 78 College Street, Hanover, New Hampshire 03755, United States
*S Supporting Information
ABSTRACT: Improving microbial fuel cell (MFC) perform-ance continues to be the subject of research, yet the role ofoperating conditions, specifically duty cycling, on MFCperformance has been modestly addressed. We present aseries of studies in which we use a 15-anode environmentalMFC to explore how duty cycling (variations in the time ananode is connected) influences cumulative charge, current, andmicrobial composition. The data reveal particular switchingintervals that result in the greatest time-normalized current.When disconnection times are sufficiently short, there is a striking decrease in current due to an increase in the overall electrodereaction resistance. This was observed over a number of whole cell potentials. Based on these results, we posit that replenishmentof depleted electron donors within the biofilm and surrounding diffusion layer is necessary for maximum charge transfer, and thatproton flux may be not limiting in the highly buffered aqueous phases that are common among environmental MFCs.Surprisingly, microbial diversity analyses found no discernible difference in gross community composition among duty cyclingtreatments, suggesting that duty cycling itself has little or no effect. Such duty cycling experiments are valuable in determiningwhich factors govern performance of bioelectrochemical systems and might also be used to optimize field-deployed systems.
■ INTRODUCTIONMicrobial fuel cells (MFCs) harness the catabolic activity ofmicroorganisms to convert chemical energy into electricalenergy.1,2 Electroactive microorganisms facilitate the exchangeof electrons to and from solid-phase electron acceptors ordonors through diverse physiological mechanisms that we willbroadly refer to as extracellular electron transfer (EET).2−9
MFCs operated in nature, or in comparable, industrialconditions such as sewage treatment plants, are referred toherein as environmental microbial fuel cells (eMFCs), andtypically host a diversity of microbes on the anode that may bedirectly or indirectly involved in EET.2,10,11
MFCs have been the subject of much research in the pastdecade,12−14 largely driven by the possibility to producesubstantial amounts of carbon-neutral energy from organicmatter, including wastewater, as well as the promise ofcatalyzing the efficiency of industrial processes that rely onmicrobial catabolism.15−19 There have been a number ofsuitable implementations of eMFCs for small-scale powergeneration, such as unattended power supplies for distributedsensors,20,21 though power from eMFCs is often below theamount required for most conventional external devices. Forexample, numerous eMFC studies report power densitiesranging from 20 to 1500 mW·m−2 normalized to anodearea,22−27 with systems using defined media producing morepower in general.10 Moreover, additional losses are often
incurred when scaling up MFCs, which result from design andtechnological constraints.28−30 To increase the efficacy ofMFCs, in particular eMFCs, in power production, recentstudies have endeavored to increase power through the use ofparticular microbial phylotypes,31−34 varying electron do-nors,35−37 electrode materials,38,39 the addition of electro-chemically active compounds6,8,40,41 to facilitate electrontransfer between the microbes and the electrode, andoptimizing system function and architecture, through variousbuffers27,42 and use of selective membranes.43
Whereas the influence of design factors on MFC perform-ance has been extensively studied, the extent to which dutycycling affects MFC performance has been of interest onlyrecently and is further addressed in this study. Recent dutycycling experiments performed by connecting and disconnect-ing to an external resistor in an MFC concluded that shortercycles lead to optimal power production.44 Previously, acapacitor has been used in the external circuit to accumulatecharge and release bursts of current discharged either throughan external resistor45 or channeled back to the anode as in amicrobial electrolysis cell.46 In these studies, the circuit design
Received: December 22, 2011Revised: April 11, 2012Accepted: April 12, 2012Published: April 12, 2012
Article
pubs.acs.org/est
© 2012 American Chemical Society 5222 dx.doi.org/10.1021/es204622m | Environ. Sci. Technol. 2012, 46, 5222−5229
resulted in a variable anode potential that can influencemicrobial colonization and activity and, potentially, powerproduction.47,48
Fundamental to all MFCs are the limitations imposed by thediffusion of substrates and products into and out of microbialcells and, in some cases, into and out of the microbial biofilm.Recent laboratory studies using pure or defined cultures revealthat substrate diffusion in the biofilm49 and proton diffusionaway from the anode42 limit current generation. These studieshighlight important factors that influence the electrode reactionkinetics associated with MFC performance: donor-substrateavailability and utilization, electron transfer to the anode, andproton diffusion away from the anode.It is equally important to consider how these and other
factor(s) might govern power production in eMFCs. Forexample, the extent to which the surrounding geochemicalenvironment or microbial community composition influencesbulk transport, alleviates diffusion limitation, and, ultimately,affects power production is unknown. To this end, weconducted a series of experiments in which we operated amultiple anode eMFC (specifically a chambered MFC placedatop marine sediments) to interrogate how three key factorssubstrate and endproduct diffusion into and out of the biofilm,microbial community composition, and geochemical condi-tionsinfluence power production. Through cycling continuitybetween anode and cathode at varying frequencies, geochemicalanalyses, and molecular microbial phylogenetic analyses, wecharacterized the relationship between current production andcycling frequency, seawater geochemical composition and pH,biofilm thickness, and microbial community composition. Weheld the potential constant with a programmable load duringthese experiments to eliminate variable potential as aconfounding factor. These data suggest that replenishment ofdepleted chemical species within the biofilm and surroundingdiffusion layer is likely what governs maximum charge transferin these eMFCs. It is also worth noting that duty cycling had nodiscernible effect on microbial community composition,suggesting that gross community composition is unaltered byduty cycling in these experiments. In brief, these datacollectively underscore the importance of considering a varietyof operational, geochemical, and microbial factors whencharacterizing or optimizing MFC performance.
■ EXPERIMENTAL METHODSSystem Design and Operation. We built a multianode
chambered benthic MFC (Figure S1) in an aquarium (40 cmdeep × 60 cm long × 30 cm high) filled with saltmarshsediment recovered from Winthrop Harbor, MA to a height ofapproximately 24 cm. The remainder of the tank was filled withnatural aerated seawater. The multianode MFC consisted of 15graphite anodes, housed in sets of three, in five independentsemi-enclosed acrylic chambers. Anodes were fabricated fromcylindrical graphite rods (1.25 cm diameter × 1.25 cm high).Each chamber was 7 cm in diameter and 15 cm high, and werepushed approximately 10 cm into the sediment. The top ofeach chamber was fitted with a gastight septum to enable fluidsampling. All the anodes were connected to a programmablerelay board (model 34903A; Agilent Inc.) that enabled theindependent connection of each anode to a custom-builtprogrammable load (North-West Metasystems, Inc.).26 Thecircuit effectively adjusts the external resistance to maintain auser-defined whole-cell potential (in our case 0.5 V), so long asactual whole-cell potential is not below the user-defined set
point. To eliminate variations in cathode performance, a single1-m long graphite brush was used as the cathode for allexperiments. The cathode was placed in the overlying, air-sparged seawater (S = 30 ppt, T = 10 °C) overlying thesediment in the aquarium. Our measurements of constantcathode potential during all duty-cycling treatments indicatethat our system was not cathode-limiting. An Ag/AgClelectrode (MI-402; Microelectrodes, Inc.) was used as areference electrode in the overlying water. Electrode potentialsand current were measured using a digital multimeter (34970A;Agilent Inc.) with 6 1/2 digits of resolution, 0.004% directcurrent (DC) voltage, and isolated from the earth-referencedcircuitry and computer interface. A 20-channel multiplexer and2 current channels module (34901A; Agilent Inc.) with a 60channel·s−1 scan speed and 120 channel·s−1 open/close speedwas used to input electrode potential and current formeasurement.The multimeter and relay bank were controlled through a
custom-designed LabVIEW interface with the capability toexecute a number of different experiments: (1) cycling amongall 15 anodes with a set switching interval (1.5 s dataacquisition), (2) cycling a single anode through variable ONand OFF times (600 ms data acquisition), and (3) maintenanceof the anodes at a constant state (i.e., always ON or alwaysOFF). Cycling among all 15 anodes sequentially allowedcurrent to be drawn from one anode at a time, and singleexperiments were conducted at different anode switchingintervals (3 s, 7.5 s, 15 s, 30 s, 60 s). The “ON” time was theswitching interval, i, and the “OFF” time was the total amountof time it took to cycle back to the same anode, (n − 1) × i forthe general case of n anodes and 14 × i for our case of 15anodes. Later, a single electrode was used for select duty cyclingexperiments (where each condition was performed once),wherein each set of cycling conditions was followed by a periodat open circuit until anode potential was within 1.5% of theoriginal open circuit value (to remove any experimentalcarryover effects). Using a single anode in this manner enabledthe ON and OFF times to be investigated independently tomeasure total cumulative current passed by the anode.Selection of the cycling conditions, the ON and OFF times,between consecutive experiments was varied to reduce any biasin the system. In these experiments, the total sum of ON timeswas normalized to one hour in order to compare how the OFFtime interval influenced total cumulative charge. Maintainingconstant continuity with a steady whole cell potential was usedto study pH changes within the pore water inside the core tube.
pH Measurements. pH was monitored inside one chamberfor nine consecutive days, during which the three electrodes inthe chamber were kept in the ON state. Fluid samples (2 mL)were collected from within the chamber through the septa inthe lid at regular intervals, decanted into a 2-mL centrifuge tubeimmersed in a 10 °C cold bath, and measured with a needle pHelectrode (MI-407; Microelectrodes, Inc.) with an Ag/AgClelectrode (MI-402; Microelectrodes, Inc.) as reference using apH meter (AR20 Accumet; Fisher Scientific). All pH samplesand measurements were conducted in duplicate.
Dissolved Sulfide Measurements. Anode chamber fluidwas collected through the septa, and dissolved sulfide wasmeasured with a spectrophotometer sulfide kit scaled down tohandle sample volumes of 1 mL (LaMotte, Inc.). Absorbancewas measured with spectrophotometer (DU-650; Beckman-Coulter) and was compared to a standard curve of knownconcentration sodium sulfide samples prepared anaerobically.
Environmental Science & Technology Article
dx.doi.org/10.1021/es204622m | Environ. Sci. Technol. 2012, 46, 5222−52295223
Both chamber fluid and a 10x dilution with Milli-Q water weremeasured for an accurate reading on the standardization curve.Assessing Changes in Anode Biofilm Diversity Across
Treatments.Microbial diversity was assessed by examining thecommunity diversity of the electrogenic biofilm growing onfour representative anodes maintained at four different dutycycles: (a) always ON, (b) 1.8 s ON and 0.6 s OFF, (c) 1.8 sON and 41.4 s OFF, and (d) always OFF. After operating atthese conditions for four months, electrodes were removedfrom the system and scraped with a sterile razor blade. Shavingswere scraped into sterile cryovials. In addition, sedimentsunderlying the electrodes were sampled using syringes with thetips removed, and biofilm from inside each chamber weresampled using sterile wipes (Kimberley Clark, Inc.). All sampleswere flash frozen in liquid nitrogen and then kept at −80 °Cuntil further processing.DNA was extracted using a PowerSoil DNA Isolation Kit
(Mo-Bio, Inc.) following the manufacturer’s protocol, with anadditional cell lysis protocol consisting of heating to 85 °C andbead beating (FastPrep-24, MP Bio, Inc.) for 60 s at 6.5 m/safter the initial extraction. DNA extractions were quantifiedusing a fluorometric assay (Qubit; Invitrogen, Inc.), and rangedfrom 25 to 300 ng of DNA·cm−2 of electrode, with the anode inthe always OFF state having the least concentration.16S rRNA genes were amplified by PCR with 28F (5′-
GAGTTTGATYMTGGCTC) and 519R (5 ′-GTAT-TACCGCGGCTGGCTG) primers as previously described,50
and amplicons were sequenced via 454 Titanium pyrosequenc-ing.51 Sequence sff files were analyzed with Qiime version1.3.0,52 OTUs were picked with the optimal flag passed inUCLUST with a 0.97 similarity threshold and a representativeset was selected based on the most abundant sequence andaligned with PyNAST using the UCLUST pairwise alignmentmethod with a 0.75 minimum percent sequence identity toclosest BLAST hit to include sequence in alignment.ChimeraSlayer was used to identify chimeric sequences beforethe OTUs were assigned taxonomy with the RDP database at aminimum confidence level of 80%.Sequence sff files are available through the National Center
for Biotechnology Information Sequence Read Archive (NCBISRA) database under submission identification SRA049469.Scanning Electron Microscopy (SEM) Sample Prep-
aration and Imaging. Anode subsamples for SEM imagingwere collected at the same time as those for DNA extraction. Asection of the anode was removed using a sterile cutter andimmediately placed in 2 mL of sterile 5% glutaraldehyde inphosphate buffered saline (PBS), in a sterile 2-mL centrifugetube and held at 4 °C for 24 h. The samples were subject toethanol dehydration by placing the sample in 10%, 25%, 50%,75%, and 100% ethanol (200 proof) PBS solutions for 5 mineach. The 100% ethanol solution was changed three times andthe sample was left in ethanol for critical point drying(Autosamdri 815 A; Tousimis, Inc.) with a 15-min purgetime. The samples were adhered to SEM posts with carbon tapeand coated with platinum/palladium (208HR Sputter Coater)at 40 mA current for 100 s and then imaged with a SEM at 10kV (JEOL, Inc.).Confocal Microscopy Sample Preparation, Imaging,
and Analysis. Anode sections were sampled as above, andplaced into a sterile 4% paraformaldehyde in PBS solution in a2-mL centrifuge tube and refrigerated at 4 °C for 12 h. Sampleswere placed in 100% PBS and kept at 4 °C. Prior to imaging,each sample was placed with sterile tweezers in 500 μL of PBS
and 0.15 μL of SYBR Green I (Invitrogen), wrapped in foil, andkept at room temperature for at least 15 min. Samples werethen placed in a PBS-filled glass-bottom dish (MatTek Corp.),with the side to be imaged against the coverslip, and imagedwith a Zeiss 700 inverted confocal microscope using the 488-nm laser and Zeiss filter set 38. For calculating biofilm thicknessmeasurements, confocal stacks were imaged at 20×, 40×, and63× magnifications with typical z distances between each slicebeing 1.7, 0.4, and 0.3 μm, respectively. Different magnifica-tions were used to reduce any bias due to slice thicknesses. Intotal, eight confocal stacks were acquired for always ON, shortOFF, and long OFF samples. Due to the inherentheterogeneity of both the graphite surface and the biofilmthickness, each image was analyzed with an ImageJ programthat subdivided each stack into a 10 × 10 grid and calculatedthe local biofilm thickness based on signal intensity for each subregion. The average biofilm thickness is from the values for subregions among all images for a given sample.
■ RESULTS AND DISCUSSIONDefining Mass Transfer Limitation in MFCs. In a MFC,
the magnitude of the steady-state current is usually limited byone reaction, typically called the rate-determining step. Themore facile reactions are held back from their maximum ratesby the slowness with which the rate-determining step disposesof their products or creates their reactants. The electronexchange reaction at the electrodes can be represented by aresistance term (R) composed of a series of resistances: masstransfer between the bulk solution and near the electrodesurface, chemical reactions that occur within this region close tothe electrode, and surface reactions including adsorption, ordesorption, and electron transfer at the electrode (eq 1). A fastreaction step is characterized by a small resistance, while a slowstep is represented by a high resistance.
= + + +‐ ‐R R R R Rmass tansfer chemicalreactions
surfacereactions
electron transfer
(1)
Generally, eMFC systems that are operated continuouslybecome mass-transfer limited. Previous studies have shown thatthe power density of an eMFC is increased 4-fold by mixing thefluids in the anode chamber.22 Similarly, the mass-transferresistance can be reduced by disconnecting the anode to enablesubstrate depletion to dissipate through diffusion. Cycling aseries of anodes then is expected to lower the overall electrodereaction resistance and increase the current produced, whencompared to a single anode under constant load.
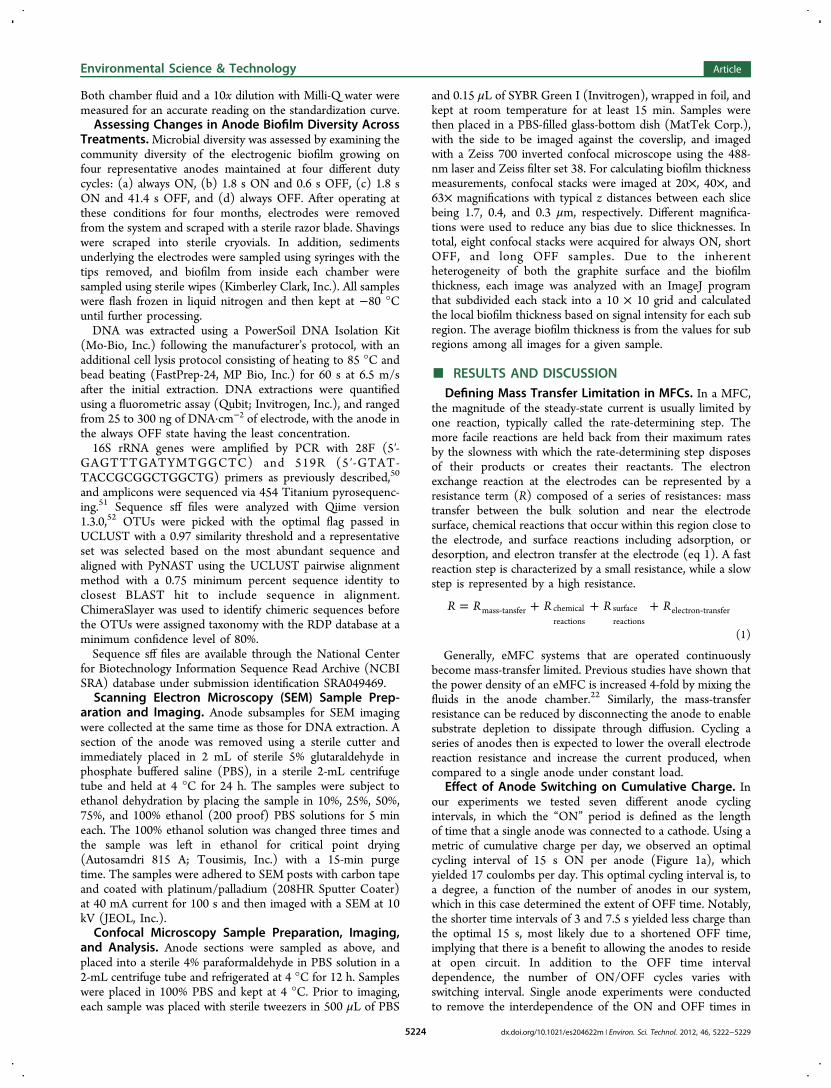
Effect of Anode Switching on Cumulative Charge. Inour experiments we tested seven different anode cyclingintervals, in which the “ON” period is defined as the lengthof time that a single anode was connected to a cathode. Using ametric of cumulative charge per day, we observed an optimalcycling interval of 15 s ON per anode (Figure 1a), whichyielded 17 coulombs per day. This optimal cycling interval is, toa degree, a function of the number of anodes in our system,which in this case determined the extent of OFF time. Notably,the shorter time intervals of 3 and 7.5 s yielded less charge thanthe optimal 15 s, most likely due to a shortened OFF time,implying that there is a benefit to allowing the anodes to resideat open circuit. In addition to the OFF time intervaldependence, the number of ON/OFF cycles varies withswitching interval. Single anode experiments were conductedto remove the interdependence of the ON and OFF times in
Environmental Science & Technology Article
dx.doi.org/10.1021/es204622m | Environ. Sci. Technol. 2012, 46, 5222−52295224
the 15 anode experiments. With a single anode, differentcombinations of ON and OFF times were selected and dutycycling continued until the total amount of ON time equaled 1h. These single-anode experiments demonstrate that selectratios of ON/OFF times yielded greater total chargenormalized to 1 h of total ON time (Figure 2).
Examining the current profile of an ON/OFF cycle in asingle-anode experiment (Figure S2) demonstrates how ashorter switching interval leads to more cumulated charge dueto less time spent in the current profile’s plateau, where currentis modest. All current profiles (both single and multianodeexperiments) exhibited ∼t1/2 decay rate that is typical when avoltage step is applied to an electrode.53 This most likely resultsfrom the expanding diffusion layer, ∂O(t), surrounding theelectrode where the oxidizing species are depleted. Thethickness of the diffusion layer depends on the time after thevoltage step (t) and the diffusion coefficient of the oxidizingspecies (DO), grows with ∼t1/2 (eq 2) and reaches a maximumwhen the concentration gradient through the diffusion layerreaches a steady-state.53
∂ =t D t( ) 2O O (2)
The time shortly after connection when the diffusion layer isthin, produces maximal current because the electrode issurrounded by a high concentration of electron donors, bethey reduced chemical species that are abiotically oxidized bythe anode or microbial cells replete with charge from theirmetabolic substrates.26,49
These experiments demonstrate the value of allowing thesystem to spend time in open circuit if maximal current is a keycharacteristic being optimized. At switching intervals shorterthan 15 s, the multianode experiments yielded less charge,decreasing the overall benefit of a shorter ON time. Indeed,previous experiments using pure cultures of S. oneidensis MR-154 and Geobacter sulferreducens55 observe similar currentprofiles (a transient peak with ∼t1/2 decay) following circuitconnection with peaks that increase in magnitude with longertime spent in open circuit. The authors attribute the increasedcurrent to the biofilm’s ability to store charge that accumulatedduring the disconnection time. The transient current peaksobserved in our experiments are consistent with the dischargingof charge stored in the biofilm, but our data do not provide theresolution needed to definitively attribute our results to thisphenomenon.
Recovery of Anode Potential during Cycling. Tofurther elucidate the effect of the OFF time to the overallsystem performance, we examined the anode potential profilesof the different switching intervals in the 15 anode experiments,and observed that anode potential prior to the next ON timewhich we refer to as recovered potentialis closer to theoriginal open circuit potential at longer time intervals (Figure1b). During these experiments, 15 s is the shortest switchinginterval where the anode potential nearly fully recovers to opencircuit potential, suggesting that for any given system a specificcombination of ON time and OFF time maximizes anodepotential recovery while increasing total cumulative charge. Weparameterized this anode recovery by calculating the anoderecovery percentage, which is defined as the ratio of thedifference between the anode recovered potential, VR, (FigureS2a) and the anode closed circuit potential, VON, and thedifference between original open circuit potential, VOCP, andanode closed circuit potential, VON (eq 3).
=| − |
| − |×
V VV V
AR% 100R ON
OCP ON (3)
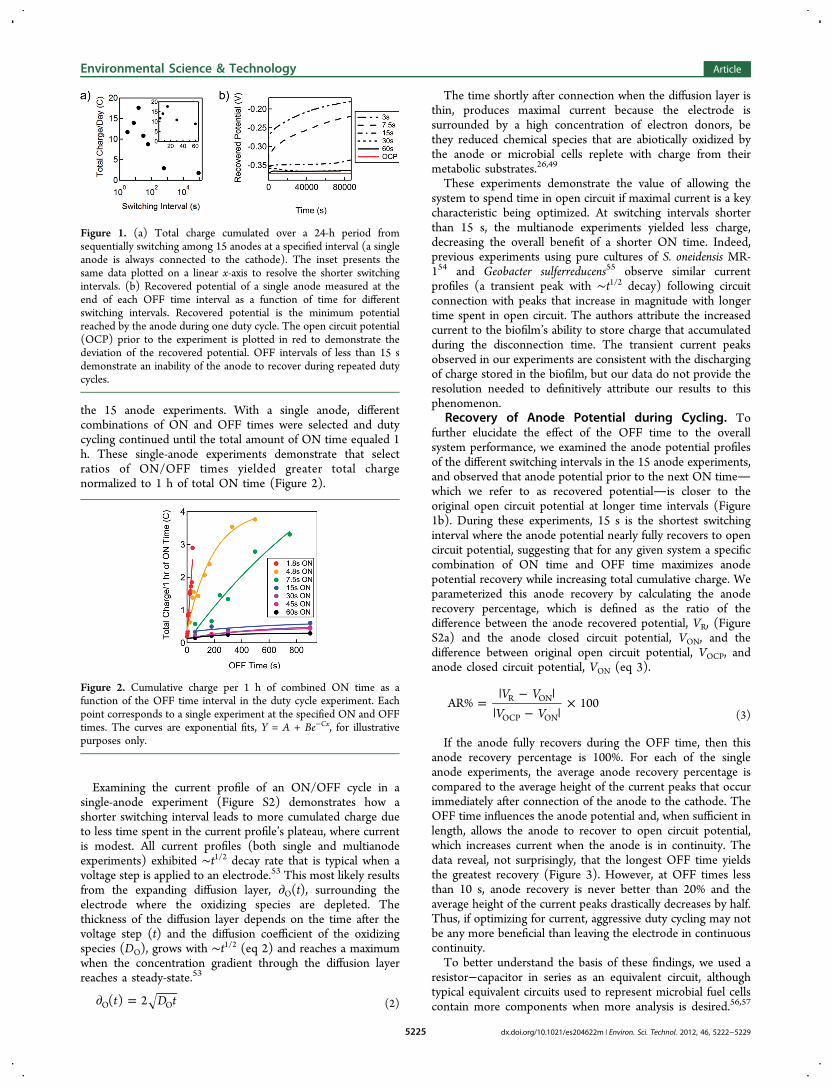
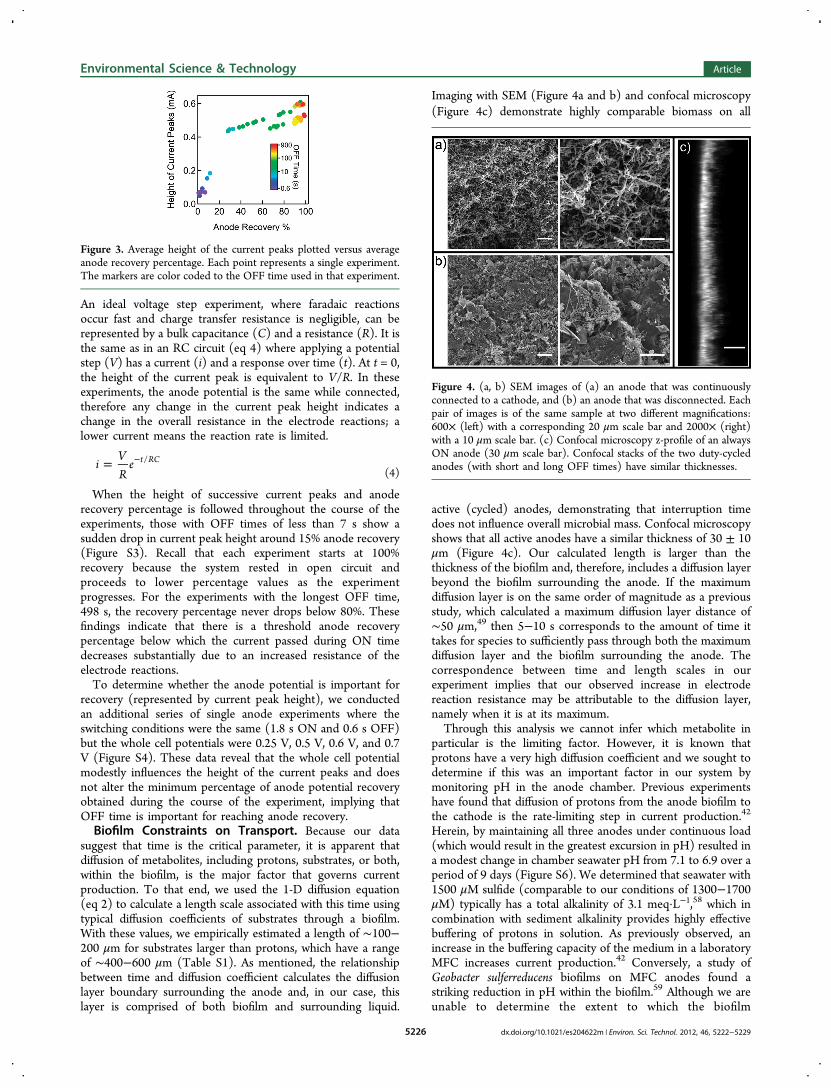
If the anode fully recovers during the OFF time, then thisanode recovery percentage is 100%. For each of the singleanode experiments, the average anode recovery percentage iscompared to the average height of the current peaks that occurimmediately after connection of the anode to the cathode. TheOFF time influences the anode potential and, when sufficient inlength, allows the anode to recover to open circuit potential,which increases current when the anode is in continuity. Thedata reveal, not surprisingly, that the longest OFF time yieldsthe greatest recovery (Figure 3). However, at OFF times lessthan 10 s, anode recovery is never better than 20% and theaverage height of the current peaks drastically decreases by half.Thus, if optimizing for current, aggressive duty cycling may notbe any more beneficial than leaving the electrode in continuouscontinuity.To better understand the basis of these findings, we used a
resistor−capacitor in series as an equivalent circuit, althoughtypical equivalent circuits used to represent microbial fuel cellscontain more components when more analysis is desired.56,57
Figure 1. (a) Total charge cumulated over a 24-h period fromsequentially switching among 15 anodes at a specified interval (a singleanode is always connected to the cathode). The inset presents thesame data plotted on a linear x-axis to resolve the shorter switchingintervals. (b) Recovered potential of a single anode measured at theend of each OFF time interval as a function of time for differentswitching intervals. Recovered potential is the minimum potentialreached by the anode during one duty cycle. The open circuit potential(OCP) prior to the experiment is plotted in red to demonstrate thedeviation of the recovered potential. OFF intervals of less than 15 sdemonstrate an inability of the anode to recover during repeated dutycycles.
Figure 2. Cumulative charge per 1 h of combined ON time as afunction of the OFF time interval in the duty cycle experiment. Eachpoint corresponds to a single experiment at the specified ON and OFFtimes. The curves are exponential fits, Y = A + Be−Cx, for illustrativepurposes only.
Environmental Science & Technology Article
dx.doi.org/10.1021/es204622m | Environ. Sci. Technol. 2012, 46, 5222−52295225
An ideal voltage step experiment, where faradaic reactionsoccur fast and charge transfer resistance is negligible, can berepresented by a bulk capacitance (C) and a resistance (R). It isthe same as in an RC circuit (eq 4) where applying a potentialstep (V) has a current (i) and a response over time (t). At t = 0,the height of the current peak is equivalent to V/R. In theseexperiments, the anode potential is the same while connected,therefore any change in the current peak height indicates achange in the overall resistance in the electrode reactions; alower current means the reaction rate is limited.
= −iVR
e t RC/(4)
When the height of successive current peaks and anoderecovery percentage is followed throughout the course of theexperiments, those with OFF times of less than 7 s show asudden drop in current peak height around 15% anode recovery(Figure S3). Recall that each experiment starts at 100%recovery because the system rested in open circuit andproceeds to lower percentage values as the experimentprogresses. For the experiments with the longest OFF time,498 s, the recovery percentage never drops below 80%. Thesefindings indicate that there is a threshold anode recoverypercentage below which the current passed during ON timedecreases substantially due to an increased resistance of theelectrode reactions.To determine whether the anode potential is important for
recovery (represented by current peak height), we conductedan additional series of single anode experiments where theswitching conditions were the same (1.8 s ON and 0.6 s OFF)but the whole cell potentials were 0.25 V, 0.5 V, 0.6 V, and 0.7V (Figure S4). These data reveal that the whole cell potentialmodestly influences the height of the current peaks and doesnot alter the minimum percentage of anode potential recoveryobtained during the course of the experiment, implying thatOFF time is important for reaching anode recovery.Biofilm Constraints on Transport. Because our data
suggest that time is the critical parameter, it is apparent thatdiffusion of metabolites, including protons, substrates, or both,within the biofilm, is the major factor that governs currentproduction. To that end, we used the 1-D diffusion equation(eq 2) to calculate a length scale associated with this time usingtypical diffusion coefficients of substrates through a biofilm.With these values, we empirically estimated a length of ∼100−200 μm for substrates larger than protons, which have a rangeof ∼400−600 μm (Table S1). As mentioned, the relationshipbetween time and diffusion coefficient calculates the diffusionlayer boundary surrounding the anode and, in our case, thislayer is comprised of both biofilm and surrounding liquid.
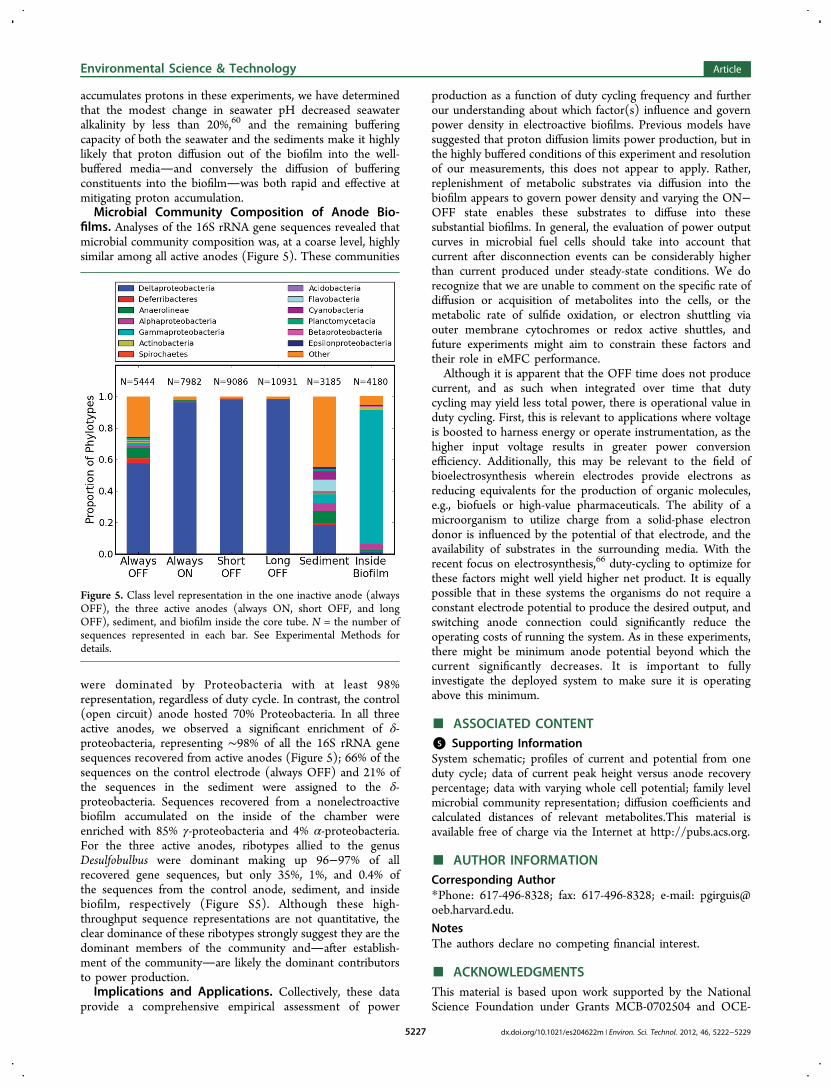
Imaging with SEM (Figure 4a and b) and confocal microscopy(Figure 4c) demonstrate highly comparable biomass on all
active (cycled) anodes, demonstrating that interruption timedoes not influence overall microbial mass. Confocal microscopyshows that all active anodes have a similar thickness of 30 ± 10μm (Figure 4c). Our calculated length is larger than thethickness of the biofilm and, therefore, includes a diffusion layerbeyond the biofilm surrounding the anode. If the maximumdiffusion layer is on the same order of magnitude as a previousstudy, which calculated a maximum diffusion layer distance of∼50 μm,49 then 5−10 s corresponds to the amount of time ittakes for species to sufficiently pass through both the maximumdiffusion layer and the biofilm surrounding the anode. Thecorrespondence between time and length scales in ourexperiment implies that our observed increase in electrodereaction resistance may be attributable to the diffusion layer,namely when it is at its maximum.Through this analysis we cannot infer which metabolite in
particular is the limiting factor. However, it is known thatprotons have a very high diffusion coefficient and we sought todetermine if this was an important factor in our system bymonitoring pH in the anode chamber. Previous experimentshave found that diffusion of protons from the anode biofilm tothe cathode is the rate-limiting step in current production.42
Herein, by maintaining all three anodes under continuous load(which would result in the greatest excursion in pH) resulted ina modest change in chamber seawater pH from 7.1 to 6.9 over aperiod of 9 days (Figure S6). We determined that seawater with1500 μM sulfide (comparable to our conditions of 1300−1700μM) typically has a total alkalinity of 3.1 meq·L−1,58 which incombination with sediment alkalinity provides highly effectivebuffering of protons in solution. As previously observed, anincrease in the buffering capacity of the medium in a laboratoryMFC increases current production.42 Conversely, a study ofGeobacter sulferreducens biofilms on MFC anodes found astriking reduction in pH within the biofilm.59 Although we areunable to determine the extent to which the biofilm
Figure 3. Average height of the current peaks plotted versus averageanode recovery percentage. Each point represents a single experiment.The markers are color coded to the OFF time used in that experiment.
Figure 4. (a, b) SEM images of (a) an anode that was continuouslyconnected to a cathode, and (b) an anode that was disconnected. Eachpair of images is of the same sample at two different magnifications:600× (left) with a corresponding 20 μm scale bar and 2000× (right)with a 10 μm scale bar. (c) Confocal microscopy z-profile of an alwaysON anode (30 μm scale bar). Confocal stacks of the two duty-cycledanodes (with short and long OFF times) have similar thicknesses.
Environmental Science & Technology Article
dx.doi.org/10.1021/es204622m | Environ. Sci. Technol. 2012, 46, 5222−52295226
accumulates protons in these experiments, we have determinedthat the modest change in seawater pH decreased seawateralkalinity by less than 20%,60 and the remaining bufferingcapacity of both the seawater and the sediments make it highlylikely that proton diffusion out of the biofilm into the well-buffered mediaand conversely the diffusion of bufferingconstituents into the biofilmwas both rapid and effective atmitigating proton accumulation.Microbial Community Composition of Anode Bio-
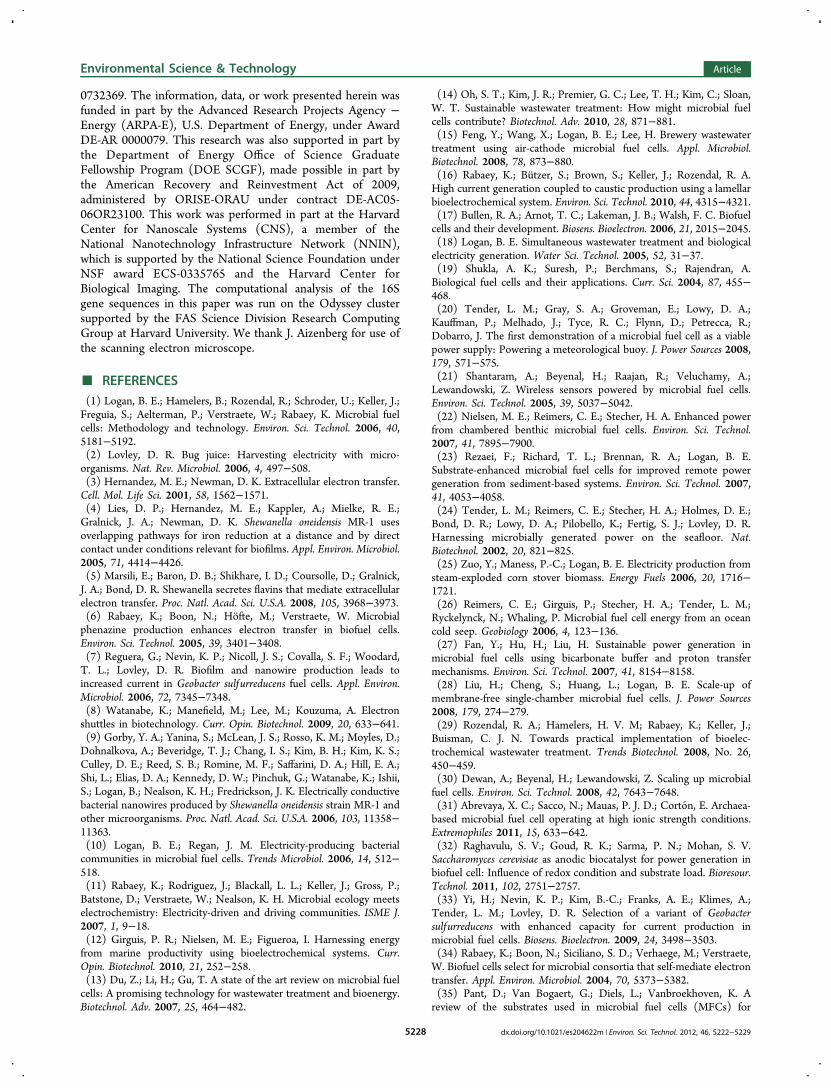
films. Analyses of the 16S rRNA gene sequences revealed thatmicrobial community composition was, at a coarse level, highlysimilar among all active anodes (Figure 5). These communities
were dominated by Proteobacteria with at least 98%representation, regardless of duty cycle. In contrast, the control(open circuit) anode hosted 70% Proteobacteria. In all threeactive anodes, we observed a significant enrichment of δ-proteobacteria, representing ∼98% of all the 16S rRNA genesequences recovered from active anodes (Figure 5); 66% of thesequences on the control electrode (always OFF) and 21% ofthe sequences in the sediment were assigned to the δ-proteobacteria. Sequences recovered from a nonelectroactivebiofilm accumulated on the inside of the chamber wereenriched with 85% γ-proteobacteria and 4% α-proteobacteria.For the three active anodes, ribotypes allied to the genusDesulfobulbus were dominant making up 96−97% of allrecovered gene sequences, but only 35%, 1%, and 0.4% ofthe sequences from the control anode, sediment, and insidebiofilm, respectively (Figure S5). Although these high-throughput sequence representations are not quantitative, theclear dominance of these ribotypes strongly suggest they are thedominant members of the community andafter establish-ment of the communityare likely the dominant contributorsto power production.Implications and Applications. Collectively, these data
provide a comprehensive empirical assessment of power
production as a function of duty cycling frequency and furtherour understanding about which factor(s) influence and governpower density in electroactive biofilms. Previous models havesuggested that proton diffusion limits power production, but inthe highly buffered conditions of this experiment and resolutionof our measurements, this does not appear to apply. Rather,replenishment of metabolic substrates via diffusion into thebiofilm appears to govern power density and varying the ON−OFF state enables these substrates to diffuse into thesesubstantial biofilms. In general, the evaluation of power outputcurves in microbial fuel cells should take into account thatcurrent after disconnection events can be considerably higherthan current produced under steady-state conditions. We dorecognize that we are unable to comment on the specific rate ofdiffusion or acquisition of metabolites into the cells, or themetabolic rate of sulfide oxidation, or electron shuttling viaouter membrane cytochromes or redox active shuttles, andfuture experiments might aim to constrain these factors andtheir role in eMFC performance.Although it is apparent that the OFF time does not produce
current, and as such when integrated over time that dutycycling may yield less total power, there is operational value induty cycling. First, this is relevant to applications where voltageis boosted to harness energy or operate instrumentation, as thehigher input voltage results in greater power conversionefficiency. Additionally, this may be relevant to the field ofbioelectrosynthesis wherein electrodes provide electrons asreducing equivalents for the production of organic molecules,e.g., biofuels or high-value pharmaceuticals. The ability of amicroorganism to utilize charge from a solid-phase electrondonor is influenced by the potential of that electrode, and theavailability of substrates in the surrounding media. With therecent focus on electrosynthesis,66 duty-cycling to optimize forthese factors might well yield higher net product. It is equallypossible that in these systems the organisms do not require aconstant electrode potential to produce the desired output, andswitching anode connection could significantly reduce theoperating costs of running the system. As in these experiments,there might be minimum anode potential beyond which thecurrent significantly decreases. It is important to fullyinvestigate the deployed system to make sure it is operatingabove this minimum.
■ ASSOCIATED CONTENT*S Supporting InformationSystem schematic; profiles of current and potential from oneduty cycle; data of current peak height versus anode recoverypercentage; data with varying whole cell potential; family levelmicrobial community representation; diffusion coefficients andcalculated distances of relevant metabolites.This material isavailable free of charge via the Internet at http://pubs.acs.org.
■ AUTHOR INFORMATIONCorresponding Author*Phone: 617-496-8328; fax: 617-496-8328; e-mail: [email protected].
NotesThe authors declare no competing financial interest.
■ ACKNOWLEDGMENTSThis material is based upon work supported by the NationalScience Foundation under Grants MCB-0702504 and OCE-
Figure 5. Class level representation in the one inactive anode (alwaysOFF), the three active anodes (always ON, short OFF, and longOFF), sediment, and biofilm inside the core tube. N = the number ofsequences represented in each bar. See Experimental Methods fordetails.
Environmental Science & Technology Article
dx.doi.org/10.1021/es204622m | Environ. Sci. Technol. 2012, 46, 5222−52295227
0732369. The information, data, or work presented herein wasfunded in part by the Advanced Research Projects Agency −Energy (ARPA-E), U.S. Department of Energy, under AwardDE-AR 0000079. This research was also supported in part bythe Department of Energy Office of Science GraduateFellowship Program (DOE SCGF), made possible in part bythe American Recovery and Reinvestment Act of 2009,administered by ORISE-ORAU under contract DE-AC05-06OR23100. This work was performed in part at the HarvardCenter for Nanoscale Systems (CNS), a member of theNational Nanotechnology Infrastructure Network (NNIN),which is supported by the National Science Foundation underNSF award ECS-0335765 and the Harvard Center forBiological Imaging. The computational analysis of the 16Sgene sequences in this paper was run on the Odyssey clustersupported by the FAS Science Division Research ComputingGroup at Harvard University. We thank J. Aizenberg for use ofthe scanning electron microscope.
■ REFERENCES(1) Logan, B. E.; Hamelers, B.; Rozendal, R.; Schroder, U.; Keller, J.;Freguia, S.; Aelterman, P.; Verstraete, W.; Rabaey, K. Microbial fuelcells: Methodology and technology. Environ. Sci. Technol. 2006, 40,5181−5192.(2) Lovley, D. R. Bug juice: Harvesting electricity with micro-organisms. Nat. Rev. Microbiol. 2006, 4, 497−508.(3) Hernandez, M. E.; Newman, D. K. Extracellular electron transfer.Cell. Mol. Life Sci. 2001, 58, 1562−1571.(4) Lies, D. P.; Hernandez, M. E.; Kappler, A.; Mielke, R. E.;Gralnick, J. A.; Newman, D. K. Shewanella oneidensis MR-1 usesoverlapping pathways for iron reduction at a distance and by directcontact under conditions relevant for biofilms. Appl. Environ. Microbiol.2005, 71, 4414−4426.(5) Marsili, E.; Baron, D. B.; Shikhare, I. D.; Coursolle, D.; Gralnick,J. A.; Bond, D. R. Shewanella secretes flavins that mediate extracellularelectron transfer. Proc. Natl. Acad. Sci. U.S.A. 2008, 105, 3968−3973.(6) Rabaey, K.; Boon, N.; Hofte, M.; Verstraete, W. Microbialphenazine production enhances electron transfer in biofuel cells.Environ. Sci. Technol. 2005, 39, 3401−3408.(7) Reguera, G.; Nevin, K. P.; Nicoll, J. S.; Covalla, S. F.; Woodard,T. L.; Lovley, D. R. Biofilm and nanowire production leads toincreased current in Geobacter sulfurreducens fuel cells. Appl. Environ.Microbiol. 2006, 72, 7345−7348.(8) Watanabe, K.; Manefield, M.; Lee, M.; Kouzuma, A. Electronshuttles in biotechnology. Curr. Opin. Biotechnol. 2009, 20, 633−641.(9) Gorby, Y. A.; Yanina, S.; McLean, J. S.; Rosso, K. M.; Moyles, D.;Dohnalkova, A.; Beveridge, T. J.; Chang, I. S.; Kim, B. H.; Kim, K. S.;Culley, D. E.; Reed, S. B.; Romine, M. F.; Saffarini, D. A.; Hill, E. A.;Shi, L.; Elias, D. A.; Kennedy, D. W.; Pinchuk, G.; Watanabe, K.; Ishii,S.; Logan, B.; Nealson, K. H.; Fredrickson, J. K. Electrically conductivebacterial nanowires produced by Shewanella oneidensis strain MR-1 andother microorganisms. Proc. Natl. Acad. Sci. U.S.A. 2006, 103, 11358−11363.(10) Logan, B. E.; Regan, J. M. Electricity-producing bacterialcommunities in microbial fuel cells. Trends Microbiol. 2006, 14, 512−518.(11) Rabaey, K.; Rodriguez, J.; Blackall, L. L.; Keller, J.; Gross, P.;Batstone, D.; Verstraete, W.; Nealson, K. H. Microbial ecology meetselectrochemistry: Electricity-driven and driving communities. ISME J.2007, 1, 9−18.(12) Girguis, P. R.; Nielsen, M. E.; Figueroa, I. Harnessing energyfrom marine productivity using bioelectrochemical systems. Curr.Opin. Biotechnol. 2010, 21, 252−258.(13) Du, Z.; Li, H.; Gu, T. A state of the art review on microbial fuelcells: A promising technology for wastewater treatment and bioenergy.Biotechnol. Adv. 2007, 25, 464−482.
(14) Oh, S. T.; Kim, J. R.; Premier, G. C.; Lee, T. H.; Kim, C.; Sloan,W. T. Sustainable wastewater treatment: How might microbial fuelcells contribute? Biotechnol. Adv. 2010, 28, 871−881.(15) Feng, Y.; Wang, X.; Logan, B. E.; Lee, H. Brewery wastewatertreatment using air-cathode microbial fuel cells. Appl. Microbiol.Biotechnol. 2008, 78, 873−880.(16) Rabaey, K.; Butzer, S.; Brown, S.; Keller, J.; Rozendal, R. A.High current generation coupled to caustic production using a lamellarbioelectrochemical system. Environ. Sci. Technol. 2010, 44, 4315−4321.(17) Bullen, R. A.; Arnot, T. C.; Lakeman, J. B.; Walsh, F. C. Biofuelcells and their development. Biosens. Bioelectron. 2006, 21, 2015−2045.(18) Logan, B. E. Simultaneous wastewater treatment and biologicalelectricity generation. Water Sci. Technol. 2005, 52, 31−37.(19) Shukla, A. K.; Suresh, P.; Berchmans, S.; Rajendran, A.Biological fuel cells and their applications. Curr. Sci. 2004, 87, 455−468.(20) Tender, L. M.; Gray, S. A.; Groveman, E.; Lowy, D. A.;Kauffman, P.; Melhado, J.; Tyce, R. C.; Flynn, D.; Petrecca, R.;Dobarro, J. The first demonstration of a microbial fuel cell as a viablepower supply: Powering a meteorological buoy. J. Power Sources 2008,179, 571−575.(21) Shantaram, A.; Beyenal, H.; Raajan, R.; Veluchamy, A.;Lewandowski, Z. Wireless sensors powered by microbial fuel cells.Environ. Sci. Technol. 2005, 39, 5037−5042.(22) Nielsen, M. E.; Reimers, C. E.; Stecher, H. A. Enhanced powerfrom chambered benthic microbial fuel cells. Environ. Sci. Technol.2007, 41, 7895−7900.(23) Rezaei, F.; Richard, T. L.; Brennan, R. A.; Logan, B. E.Substrate-enhanced microbial fuel cells for improved remote powergeneration from sediment-based systems. Environ. Sci. Technol. 2007,41, 4053−4058.(24) Tender, L. M.; Reimers, C. E.; Stecher, H. A.; Holmes, D. E.;Bond, D. R.; Lowy, D. A.; Pilobello, K.; Fertig, S. J.; Lovley, D. R.Harnessing microbially generated power on the seafloor. Nat.Biotechnol. 2002, 20, 821−825.(25) Zuo, Y.; Maness, P.-C.; Logan, B. E. Electricity production fromsteam-exploded corn stover biomass. Energy Fuels 2006, 20, 1716−1721.(26) Reimers, C. E.; Girguis, P.; Stecher, H. A.; Tender, L. M.;Ryckelynck, N.; Whaling, P. Microbial fuel cell energy from an oceancold seep. Geobiology 2006, 4, 123−136.(27) Fan, Y.; Hu, H.; Liu, H. Sustainable power generation inmicrobial fuel cells using bicarbonate buffer and proton transfermechanisms. Environ. Sci. Technol. 2007, 41, 8154−8158.(28) Liu, H.; Cheng, S.; Huang, L.; Logan, B. E. Scale-up ofmembrane-free single-chamber microbial fuel cells. J. Power Sources2008, 179, 274−279.(29) Rozendal, R. A.; Hamelers, H. V. M; Rabaey, K.; Keller, J.;Buisman, C. J. N. Towards practical implementation of bioelec-trochemical wastewater treatment. Trends Biotechnol. 2008, No. 26,450−459.(30) Dewan, A.; Beyenal, H.; Lewandowski, Z. Scaling up microbialfuel cells. Environ. Sci. Technol. 2008, 42, 7643−7648.(31) Abrevaya, X. C.; Sacco, N.; Mauas, P. J. D.; Corton, E. Archaea-based microbial fuel cell operating at high ionic strength conditions.Extremophiles 2011, 15, 633−642.(32) Raghavulu, S. V.; Goud, R. K.; Sarma, P. N.; Mohan, S. V.Saccharomyces cerevisiae as anodic biocatalyst for power generation inbiofuel cell: Influence of redox condition and substrate load. Bioresour.Technol. 2011, 102, 2751−2757.(33) Yi, H.; Nevin, K. P.; Kim, B.-C.; Franks, A. E.; Klimes, A.;Tender, L. M.; Lovley, D. R. Selection of a variant of Geobactersulfurreducens with enhanced capacity for current production inmicrobial fuel cells. Biosens. Bioelectron. 2009, 24, 3498−3503.(34) Rabaey, K.; Boon, N.; Siciliano, S. D.; Verhaege, M.; Verstraete,W. Biofuel cells select for microbial consortia that self-mediate electrontransfer. Appl. Environ. Microbiol. 2004, 70, 5373−5382.(35) Pant, D.; Van Bogaert, G.; Diels, L.; Vanbroekhoven, K. Areview of the substrates used in microbial fuel cells (MFCs) for
Environmental Science & Technology Article
dx.doi.org/10.1021/es204622m | Environ. Sci. Technol. 2012, 46, 5222−52295228
sustainable energy production. Bioresour. Technol. 2010, 101, 1533−1543.(36) Nielsen, M. E.; Wu, D. M.; Girguis, P. R.; Reimers, C. E.Influence of substrate on electron transfer mechanisms in chamberedbenthic microbial fuel cells. Environ. Sci. Technol. 2009, 43, 8671−8677.(37) Catal, T.; Li, K.; Bermek, H.; Liu, H. Electricity production fromtwelve monosaccharides using microbial fuel cells. J. Power Sources2008, 175, 196−200.(38) Scott, K.; Cotlarciuc, I.; Hall, D.; Lakeman, J. B.; Browning, D.Power from marine sediment fuel cells: The influence of anodematerial. J. Appl. Electrochem. 2008, 38, 1313−1319.(39) Lowy, D. A.; Tender, L. M.; Zeikus, J. G.; Park, D. H.; Lovley,D. R. Harvesting energy from the marine sediment-water interface. II.Kinetic activity of anode materials. Biosens. Bioelectron. 2006, 21,2058−2063.(40) Liu, R.-H.; Sheng, G.-P.; Sun, M.; Zang, G.-L.; Li, W.-W.; Tong,Z.-H.; Dong, F.; Lam, M. H.-W.; Yu, H.-Q.; Hon-Wah Lam, M.Enhanced reductive degradation of methyl orange in a microbial fuelcell through cathode modification with redox mediators. Appl.Microbiol. Biotechnol. 2011, 89, 201−208.(41) Milliken, C. E.; May, H. D. Sustained generation of electricity bythe spore-forming, Gram-positive, Desulf itobacterium hafniense strainDCB2. Appl. Microbiol. Biotechnol. 2007, 73, 1180−1189.(42) Torres, C. I.; Marcus, A. K.; Rittmann, B. E.; Legacy, N. Z.Proton transport inside the biofilm limits electrical current generationby anode-respiring bacteria. Biotechnol. Bioeng. 2008, 100, 872−881.(43) Rozendal, R. A.; Hamelers, H. V. M; Molenkamp, R. J.;Buisman, C. J. N. Performance of single chamber biocatalyzedelectrolysis with different types of ion exchange membranes.Water Res.2007, 41, 1984−1994.(44) Grondin, F.; Perrier, M.; Tartakovsky, B. Microbial fuel celloperation with intermittent connection of the electrical load. J. PowerSources 2012, 208, 18−23.(45) Dewan, A.; Beyenal, H.; Lewandowski, Z. Intermittent energyharvesting improves the performance of microbial fuel cells. Environ.Sci. Technol. 2009, 43, 4600−4605.(46) Liang, P.; Wu, W.; Wei, J.; Yuan, L.; Xia, X.; Huang, X. Alternatecharging and discharging of capacitor to enhance the electronproduction of bioelectrochemical systems. Environ. Sci. Technol.2011, 45, 6647−6653.(47) White, H. K.; Reimers, C. E.; Cordes, E. E.; Dilly, G. F.; Girguis,P. R. Quantitative population dynamics of microbial communities inplankton-fed microbial fuel cells. ISME J. 2009, 3, 635−646.(48) Torres, C. I.; Krajmalnik-Brown, R.; Parameswaran, P.; Marcus,A. K.; Wanger, G.; Gorby, Y. A.; Rittmann, B. E. Selecting anode-respiring bacteria based on anode potential: Phylogenetic, electro-chemical, and microscopic characterization. Environ. Sci. Technol. 2009,43, 9519−9524.(49) Lee, H.-S.; Torres, C. I.; Rittmann, B. E. Effects of substratediffusion and anode potential on kinetic parameters for anode-respiring bacteria. Environ. Sci. Technol. 2009, 43, 7571−7577.(50) Nielsen, M. E.; Reimers, C. E.; White, H. K.; Sharma, S.;Girguis, P. R. Sustainable energy from deep ocean cold seeps. EnergyEnviron. Sci. 2008, 1, 584−593.(51) Margulies, M.; Egholm, M.; Altman, W. E.; Attiya, S.; Bader, J.S.; Bemben, L. A.; Berka, J.; Braverman, M. S.; Chen, Y.-J.; Chen, Z.;Dewell, S. B.; Du, L.; Fierro, J. M.; Gomes, X. V.; Godwin, B. C.; He,W.; Helgesen, S.; Ho, C. H.; Irzyk, G. P.; Jando, S. C.; Alenquer, M. L.I.; Jarvie, T. P.; Jirage, K. B.; Kim, J.-B.; Knight, J. R.; Lanza, J. R.;Leamon, J. H.; Lefkowitz, S. M.; Lei, M.; Li, J.; Lohman, K. L.; Lu, H.;Makhijani, V. B.; McDade, K. E.; McKenna, M. P.; Myers, E. W.;Nickerson, E.; Nobile, J. R.; Plant, R.; Puc, B. P.; Ronan, M. T.; Roth,G. T.; Sarkis, G. J.; Simons, J. F.; Simpson, J. W.; Srinivasan, M.;Tartaro, K. R.; Tomasz, A.; Vogt, K. A.; Volkmer, G. A.; Wang, S. H.;Wang, Y.; Weiner, M. P.; Yu, P.; Begley, R. F.; Rothberg, J. M.Genome sequencing in microfabricated high-density picolitre reactors.Nature 2005, 437, 376−380.
(52) Caporaso, J. G.; Kuczynski, J.; Stombaugh, J.; Bittinger, K.;Bushman, F. D.; Costello, E. K.; Fierer, N.; Pena, A. G.; Goodrich, J.K.; Gordon, J. I.; Huttley, G. A.; Kelley, S. T.; Knights, D.; Koenig, J.E.; Ley, R. E.; Lozupone, C. A.; Mcdonald, D.; Muegge, B. D.; Pirrung,M.; Reeder, J.; Sevinsky, J. R.; Turnbaugh, P. J.; Walters, W. A.;Widmann, J.; Yatsunenko, T.; Zaneveld, J.; Knight, R. QIIME allowsanalysis of high-throughput community sequencing data intensitynormalization improves color calling in SOLiD sequencing. Nat.Methods 2010, 7, 335−336.(53) Bard, A. J.; Faulkner, L. R. Electrochemical Methods:Fundamentals and Applications, 2nd ed.; John Wiley & Sons, Inc.:New York, 2000; p 35.(54) Uría, N.; Berbel, X. M.; Sanchez, O.; Munoz, F. X.; Mas, J.Transient storage of electrical charge in biofilms of Shewanellaoneidensis MR-1 growing in a microbial fuel cell. Environ. Sci. Technol.2011, 45, 10250−10256.(55) Schrott, G. D.; Bonanni, P. S.; Robuschi, L.; Esteve-Nunez;Abraham Busalmen, J. P. Electrochemical insight into the mechanismof electron transport in biofilms of Geobacter sulfurreducens. Electro-chim. Acta 2011, 56, 10791−10795.(56) He, Z.; Wagner, N.; Minteer, S. D.; Angenent, L. T. An upflowmicrobial fuel cell with an interior cathode: Assessment of the internalresistance by impedance spectroscopy. Environ. Sci. Technol. 2006, 40,5212−5217.(57) Ramasamy, R. P.; Ren, Z.; Mench, M. M.; Regan, J. M. Impactof initial biofilm growth on the anode impedance of microbial fuelcells. Biotechnol. Bioeng. 2008, 101, 101−108.(58) Millero, F. J.; Lee, K.; Roche, M. Distribution of alkalinity in thesurface waters of the major oceans. Mar. Chem. 1998, 60, 111−130.(59) Franks, A. E.; Nevin, K. P.; Jia, H.; Izallalen, M.; Woodard, T. L.;Lovley, D. R. Novel strategy for three-dimensional real-time imaging ofmicrobial fuel cell communities: Monitoring the inhibitory effects ofproton accumulation within the anode biofilm. Energy Environ. Sci.2009, 2, 113−119.(60) Millero, F. J. Thermodynamics of the carbon dioxide system inthe oceans. Science 1995, 59, 661−677.(61) Lovley, D. R.; Roden, E. E.; Phillips, E. J. Enzymatic iron anduranium reduction by sulfate-reducing bacteria. Mar. Geol. 1993, 113,41−53.(62) Holmes, D. E.; Bond, D. R.; Lovley, D. R. Electron transfer byDesulfobulbus propionicus to Fe(III) and graphite electrodes. Appl.Environ. Microbiol. 2004, 70, 1234−1237.(63) Lovley, D. R.; Phillips, E. J. Novel processes for anaerobic sulfateproduction from elemental sulfur by sulfate-reducing bacteria. Appl.Environ. Microbiol. 1994, 60, 2394−2399.(64) Holmes, D. E.; Bond, D. R.; O’Neil, R. A.; Reimers, C. E.;Tender, L. R.; Lovley, D. R. Microbial communities associated withelectrodes harvesting electricity from a variety of aquatic sediments.Microb. Ecol. 2004, 48, 178−190.(65) Finster, K.; Liesack, W.; Thamdrup, B. Elemental sulfur andthiosulfate disproportionation by Desulfocapsa sulfoexigens sp. nov., anew anaerobic bacterium isolated from marine surface sediment. Appl.Environ. Microbiol. 1998, 64, 119−125.(66) Rabaey, K.; Rozendal, R. A. Microbial electrosynthesis Revisiting the electrical route for microbial production. Nat. Rev.Microbiol. 2010, 8, 706−716.
Environmental Science & Technology Article
dx.doi.org/10.1021/es204622m | Environ. Sci. Technol. 2012, 46, 5222−52295229