Embed Size (px)
Citation preview
DUST DISPERSION MODELLING FOR PILBARA IRON DAMPIER
PORT EXPANSION TO 145 MTPA (PHASE B) – DEVELOPMENT OF DUST EMISSIONS ESTIMATES
Prepared for
Sinclair Knight Merz
by
Environmental Alliances Pty Ltd
May 2007
Disclaimer and Limitation
Environmental Alliances Pty Ltd (EAPL) will act in all professional matters as a faithful adviser to the Client and exercise all reasonable skill and care in the provision of its professional services.
This report has been prepared on behalf of and for the exclusive use of the Client, and is subject to and issued in accordance with the agreement between the Client and EAPL. EAPL accepts no liability or responsibility whatsoever for it in respect of any use of or reliance upon this report by any third party.
This report is based on the scope of services defined by the Client, budgetary and time constraints requested by the Client, the information supplied by the Client (and its agents), and methods consistent with the preceding.
EAPL has not attempted to verify the accuracy or completeness of the information supplied.
Copying of this report or parts of this report is not permitted without the authorisation of the Client or EAPL.
Client: Sinclair Knight Merz
Job No: J5104 Version Prepared by Reviewed by Submitted to Client Status Copies Date
Preliminary Draft Report 4 DP - *.doc 14/4/2006 Draft Report 5b DP - *.doc 11/9/2006 Draft Report 6a DP - *.pdf 7/11/2006 Draft Report 6b DP - *.doc 28/11/2006 Draft Report 7a DP - *.doc 11/5/2007 Final Report 7b DP - *.doc, *.pdf 17/5/2007
Environmental Alliances Pty Ltd Tel: (08) 9343 0554 Fax: (08) 9343 0079
ABN: 75 103 600 620

Page i
App B1 EmissionsEstimateRptV7b.doc Environmental Alliances Pty Ltd
TABLE OF CONTENTS
1. INTRODUCTION 1
2. NATURE OF DAMPIER PORT IRON ORE OPERATIONS 1
3. OPERATIONAL SOURCES OF DUST 2
4. HISTORY OF DUST EMISSIONS ESTIMATES 3
5. DUST EMISSIONS FROM VEHICLES 6
5.1 EMISSION RATE PER VEHICLE 6
5.2 ESTIMATING VEHICLE KILOMETRES TRAVELLED 7
5.3 ACTIVITY DATA 8
5.4 VEHICLE EMISSION RATES 8
5.5 INCREASED ROAD SEALING AT EII 9
6. DUST EMISSIONS FROM BULKING 11
6.1 EMISSION ESTIMATION EQUATIONS 11
6.2 ACTIVITY FACTORS FOR 95 MTPA 12
6.3 ACTIVITY FACTORS FOR 145 MTPA 12 6.3.1 EII 12 6.3.2 PP 13
7. DUST EMISSIONS FROM ACTIVITY SOURCES 15
7.1 DUST EMISSION EQUATIONS 16 7.1.1 Sources other than conveyors 16 7.1.2 Conveyors 17 7.1.3 Car Dumpers 20
7.2 OPERATING FREQUENCIES 20
8. DUST EMISSIONS FROM OPEN SOURCES 23
9. ADJUSTMENT FOR ORE DUSTINESS 25
10. EFFECT ON AVERAGE DUSTINESS FROM CHANGE IN ORE COMPOSITION FOR 145 MTPA 29
Page ii
App B1 EmissionsEstimateRptV7b.doc Environmental Alliances Pty Ltd
11. ADJUSTMENTS TO EMISSIONS ESTIMATES FOR KARRATHA WIND SPEED AND RAINFALL 32
11.1 WIND SPEED ADJUSTMENT FOR DPS 32
11.2 RAINFALL 32
12. CHANGES TO DUST SOURCES FOR 145 MTPA 32
12.1 ADDITIONAL DUST CONTROLS 32
12.2 QUANTIFIED CHANGES IN EMISSION RATES 32
13. REFERENCES 40
14. GLOSSARY 42
LIST OF TABLES
1. Dust emissions dependencies for various source types 2 2. Summary of key dust sources and fundamental mechanisms affecting dust emissions 4 3. Summary of results of vehicle survey on 5E causeway 7 4. Hourly vehicle counts on 5E causeway 8 5. Estimated PM10 emission rates from vehicles for existing operations 9 6. Estimated vehicle activity in operation areas 10 7. Estimated dust reduction benefit for road sealing and dust retardant at EII 10 8. Bulking activity factors 12 9. Bulk stockpiles and ore movement assumptions 13 10. Bulking constants for all stockpiles 14 11. Haul truck and equipment assumptions 14 12. Empirically derived parameters for wind generated dust from “activity” sources 17 13. Dust emission benefit of 1800 mm conveyors compared to 1500 mm conveyors 19 14. Changes in total ore handling capacity of PI Dampier Ports 21 15. Use of operational parameters to estimate equipment emissions 22 16. Unit area empirically derived parameters for wind generated dust lift-off 24 17. Areas of open sources 25 18. Ore throughputs and DEMS for Dampier Port 2005 (95 Mtpa) 29 19. Ore throughputs and DEMS for Dampier Port at 145 Mtpa 30 20. Ore moisture assumptions for 145 Mtpa 31
Page iii
App B1 EmissionsEstimateRptV7b.doc Environmental Alliances Pty Ltd
21. Changes to PI sources and emissions resulting from proposed expansion to 145 Mtpa 34 22. Summary of conveyor monitoring results 53 23. Summary of changes to emissions functions from on-site monitoring 55 24. Results from all known PI rotating drum dustiness tests 59 25. Parameters for moisture/dustiness relationships for 95 Mtpa and 145 Mtpa ores and products 60 26. Revised emission rates 62
LIST OF FIGURES
1. Outline of steps for estimating vehicle dust emissions 6 2. PP bulking simulation over January for 145 Mtpa 15 3. Outline of activity sources dust emissions estimation steps 16 4. Percent of time each day EII shiploader running for 2005 20 5. Outline of steps for estimating dust emissions from open sources 23 6. Wind generated PM10 emissions 25 7. Relative dustiness potential of Dampier Ports ores for 95 Mtpa 26 8. Relative dustiness potential of Dampier Ports ores for 145 Mtpa 27 9. Dustiness adjustment factors 27 10. Annual average TSP emission rates for PI sources at 95 Mtpa and 145 Mtpa 39 11. 1/4-5E transfer point during downwind dust sampling 47 12. Downwind cross-sectional profile of dust plume from 1/4-5E transfer point 47 13. Downwind cross-sectional profile of dust plume from PP stacker 48 14. PP reclaimer during downwind dust sampling at 11:34 49 15. PP reclaimer during downwind dust sampling at 11:52 49 16. Downwind cross-sectional profile of dust plume from PP reclaimer 50 17. Photos of reclaimers at EII 50 18. PP Screenhouse SH1P 51 19. PM10 cross-wind profile downwind of SH1P 51 20. PM10 cross-wind profile downwind of Eastern Bulk Stockpile outloading 52 21. Profile of PM10 adjacent to conveyor 53 22. Rotating drum arrangement 56 23. Example of moisture/dustiness relationships from rotating drum tests 57 24. Comparison between EA (2006) and SKM (2007) emissions functions for PP
Reclaimers 64
Page iv
App B1 EmissionsEstimateRptV7b.doc Environmental Alliances Pty Ltd
25. Comparison between EA (2005) and SKM (2007) emissions functions for PP Stackers 65
LIST OF APPENDICES
1. Results of source monitoring program 7-10/12/2005 2. Effect of Ore moisture on dust emissions 3. Revisions to emissions estimates since draft report version 6b 4. Comparison between EA (2006) and SKM (2007) emissions functions for PP
Reclaimers 5. Comparison between EA (2005) and SKM (2007) emissions functions for PP
Stackers
Page 1
App B1 EmissionsEstimateRptV7b.doc Environmental Alliances Pty Ltd
1. INTRODUCTION
This report contains details on the methods used to estimate dust emissions used to predict dust impacts for Pilbara Iron’s proposed increase in throughput to 145Mt/a at its Dampier Port operations.
Other reports which contain relevant information to this proposal are:
Report title Author Purpose
Environmental Protection Statement SKM Describes the proposal in a form suitable for public comments and review by the EPA
Dust Dispersion Modelling for Pilbara Iron Dampier Port Expansion to 145 Mtpa (Phase B)
Environmental Alliances
Overview report describing the changes in dust impacts predicted to occur following the Port expansion to 145 Mtpa
THIS REPORT
Dust Dispersion Modelling for Pilbara Iron Dampier Port Expansion to 145 Mtpa (Phase B) – Development of Dust Emissions Estimates
Environmental Alliances
Provides details of the development of dust emissions estimates for the Pilbara Iron operational sources at Dampier
Dust Dispersion Modelling for Pilbara Iron Dampier Port Expansion to 145 Mtpa (Phase B) – Dispersion Model Set-Up and Performance
Environmental Alliances
Provides details of the set-up of the CALMET (meteorological pre-processor) and CALPUFF dispersion models used for the dust dispersion modelling
2. NATURE OF DAMPIER PORT IRON ORE OPERATIONS
Crushed and screened iron ore from the mine sites is railed to the Dampier Port.
Each of the two shiploading terminals (located at Parker Point and East Intercourse Island) has facilities for train unloading, ore-product blending, bulking, screening and shiploading.
On arriving at the two terminals, ore is dumped from the trains at rotary car dumpers, weighed and then conveyed to the live stockpile areas. At East Intercourse Island, the 5E conveyor transports the ore 2.7 km, which includes a causeway.
Parker Point has 24 blending live stockpiles while East Intercourse Island has 14 live stockpiles. The ore is stored in these stockpiles until it is shipped.
Both operations also have areas set aside for the storage of bulk stockpiles. The bulking activity involves using loaders and haul trucks to remove ore from a live stockpile and dump it into a bulking stockpile. Some time later, the ore from the bulk stockpile is loaded into ore trucks and transported to a dump hopper which conveys the ore back into a live stockpile. Bulking is undertaken to help manage product demand requirements.
When ready for shipping, automatic reclaimers reclaim the ore from the stockpiles, which is then transported to the ship via a series of conveyors.
Page 2
App B1 EmissionsEstimateRptV7b.doc Environmental Alliances Pty Ltd
Lump ore is re-screened immediately prior to shipping. Undersize from this re-screening process is returned to the fines stockpiles.
The ore is loaded into ships at wharves at Parker Point and East Intercourse Island through shiploaders.
3. OPERATIONAL SOURCES OF DUST
The mechanisms underlying the generation of airborne dust from iron ore handling operations are very complex. While some aspects of dust emissions are obvious – for example, equipment such as stackers and reclaimers will only generate emissions while they are actually operating, other aspects such as the relationship between ore mineralogy and dustiness are poorly understood.
Dust emissions from operational sources may depend on:
• the frequency at which a dust-generating activity takes place (eg. vehicles travelling on roads, shiploading etc) – there is no dust emission when the activity is not being undertaken;
• prevailing meteorological conditions, in particular, the frequency at which the wind speed exceeds a defined limit for dust lift-off from an unconfined source (eg. stockpiles, unpaved roads etc);
• ore particle size distribution; and
• ore moisture content.
The resulting dust emission rate may be either:
• fairly constant, where dust is made airborne by the nature of the activity (eg. vehicle generated dust); or
• highly variable, dependent on the wind speed (eg. stockpiles, unpaved roads etc).
Dust sources can be broadly categorised as:
• Activity-dependent, where equipment needs to be operating in order to cause a dust emission;
• Wind-dependent, where the source is exposed to dust lift-off from frictional wind forces; and
• Vehicles, where dust results from wheels and the movement of the vehicle.
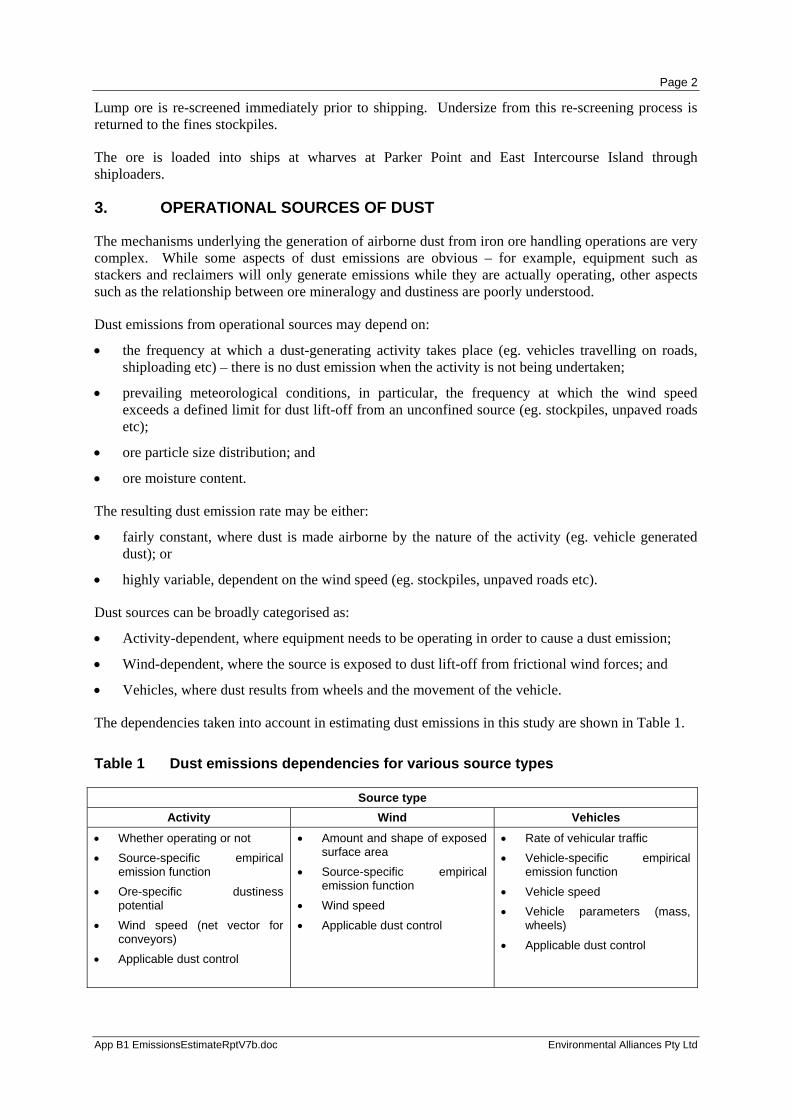
The dependencies taken into account in estimating dust emissions in this study are shown in Table 1.
Table 1 Dust emissions dependencies for various source types
Source type Activity Wind Vehicles
• Whether operating or not • Source-specific empirical
emission function • Ore-specific dustiness
potential • Wind speed (net vector for
conveyors) • Applicable dust control
• Amount and shape of exposed surface area
• Source-specific empirical emission function
• Wind speed
• Applicable dust control
• Rate of vehicular traffic • Vehicle-specific empirical
emission function
• Vehicle speed • Vehicle parameters (mass,
wheels)
• Applicable dust control
Page 3
App B1 EmissionsEstimateRptV7b.doc Environmental Alliances Pty Ltd
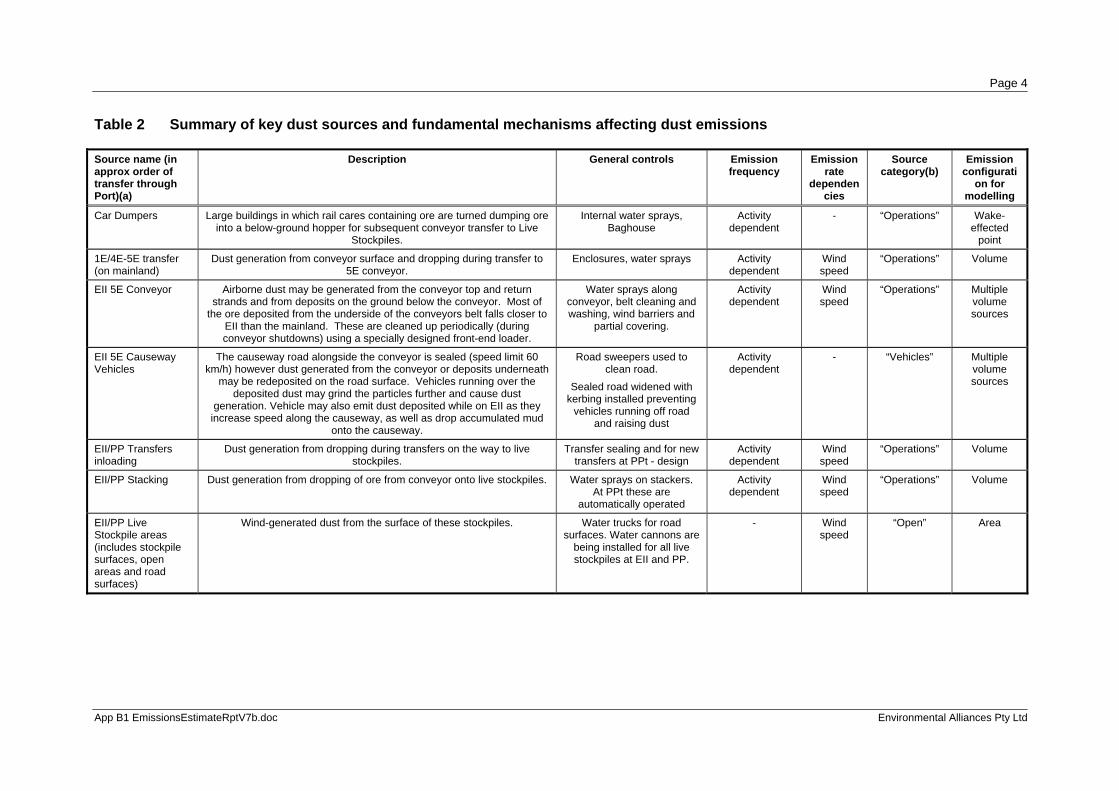
A summary of the specific Dampier Port dust sources and their categorisation for the purpose of describing emission rates later in this document is shown in Table 2. A more detailed description of dust emissions controls as at 95 Mtpa and proposed for 145 Mtpa is given later in Table 21.
4. HISTORY OF DUST EMISSIONS ESTIMATES
The source emissions functions and supporting data used for modelling in this study have been developed and updated over time based as follows.
Used for modelling expansion to 95 Mtpa
• Results from several weeks of on-site measurements during 1997 and 1998 described in SKM (1998) (note that wind dependent functions based on BoM Karratha wind speeds therefore DPS wind speeds multiplied by 1.3 times for consistency with derivation of functions);
• Revisions described in Environmental Alliances (EA) (2003);
Used for modelling expansion to 120 Mtpa
• Revisions from the results from a further field sampling program in May 2004 pursuant to the Ministerial Conditions of approval for the expansion to 95 Mtpa (EA 2004).
• Revisions to the 5E conveyor and road emissions following a sampling program in December 2004 (EA 2005). It is understood that newly installed top belt water sprays were operating during this monitoring, however an improved belt cleaning system (both installed as part of the 95 Mtpa upgrade) was not operating. The emissions rate subsequently determined may therefore be an over-estimate once the belt cleaner is fully operational.
• The period modelled was updated from 17/12/2001 to 16/12/2002 to 1/6/2003 to 31/5/2004. This introduced the following variations-
• Emissions from sources based on wind generated dust functions will vary due to differences in wind speeds over the periods – the emissions are very sensitive to the highest wind speeds over a period. Consequently, a rainfall function was incorporated to set all source emissions to zero when the 24-hour average rainfall exceeded 0.25 mm for modelling of the 1/6/2003 to 31/5/2004 period. This is based on the NPI emission estimation equation for open area wind erosion (NPI 2001).
• The emissions from bulking are dependent on the extent and time of bulking operations – these vary from year-to-year. Bulking data for the modelling period was used as the basis for this study.
• More detailed activity related data for vehicles in operational areas, and PP car dumpers, screenhouses, and ship loaders specific to the period modelled in this case, were used.
• For sources for which there were no previous emissions estimates, NPI or AP42 emissions estimates were used.
Page 4
App B1 EmissionsEstimateRptV7b.doc Environmental Alliances Pty Ltd
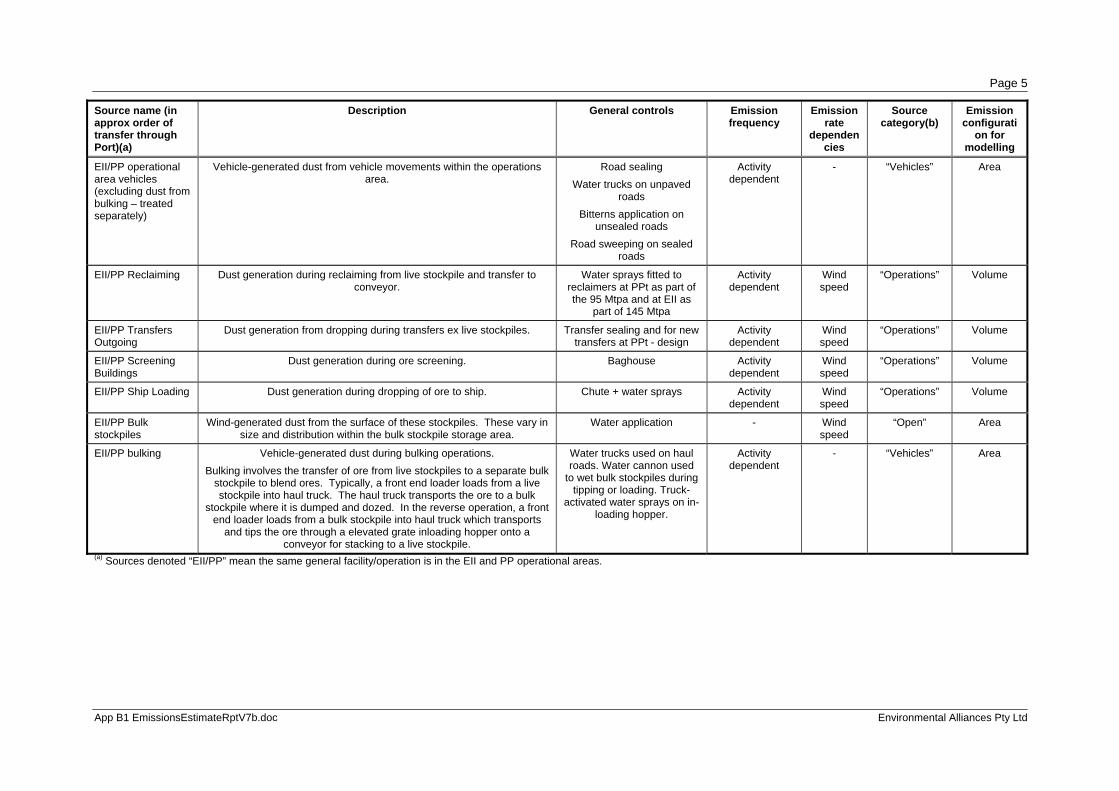
Table 2 Summary of key dust sources and fundamental mechanisms affecting dust emissions
Source name (in approx order of transfer through Port)(a)
Description General controls Emission frequency
Emission rate
dependencies
Source category(b)
Emission configurati
on for modelling
Car Dumpers Large buildings in which rail cares containing ore are turned dumping ore into a below-ground hopper for subsequent conveyor transfer to Live
Stockpiles.
Internal water sprays, Baghouse
Activity dependent
- “Operations” Wake-effected
point
1E/4E-5E transfer (on mainland)
Dust generation from conveyor surface and dropping during transfer to 5E conveyor.
Enclosures, water sprays Activity dependent
Wind speed
“Operations” Volume
EII 5E Conveyor Airborne dust may be generated from the conveyor top and return strands and from deposits on the ground below the conveyor. Most of
the ore deposited from the underside of the conveyors belt falls closer to EII than the mainland. These are cleaned up periodically (during conveyor shutdowns) using a specially designed front-end loader.
Water sprays along conveyor, belt cleaning and washing, wind barriers and
partial covering.
Activity dependent
Wind speed
“Operations” Multiple volume sources
EII 5E Causeway Vehicles
The causeway road alongside the conveyor is sealed (speed limit 60 km/h) however dust generated from the conveyor or deposits underneath
may be redeposited on the road surface. Vehicles running over the deposited dust may grind the particles further and cause dust
generation. Vehicle may also emit dust deposited while on EII as they increase speed along the causeway, as well as drop accumulated mud
onto the causeway.
Road sweepers used to clean road.
Sealed road widened with kerbing installed preventing
vehicles running off road and raising dust
Activity dependent
- “Vehicles” Multiple volume sources
EII/PP Transfers inloading
Dust generation from dropping during transfers on the way to live stockpiles.
Transfer sealing and for new transfers at PPt - design
Activity dependent
Wind speed
“Operations” Volume
EII/PP Stacking Dust generation from dropping of ore from conveyor onto live stockpiles. Water sprays on stackers. At PPt these are
automatically operated
Activity dependent
Wind speed
“Operations” Volume
EII/PP Live Stockpile areas (includes stockpile surfaces, open areas and road surfaces)
Wind-generated dust from the surface of these stockpiles. Water trucks for road surfaces. Water cannons are
being installed for all live stockpiles at EII and PP.
- Wind speed
“Open” Area
Page 5
App B1 EmissionsEstimateRptV7b.doc Environmental Alliances Pty Ltd
Source name (in approx order of transfer through Port)(a)
Description General controls Emission frequency
Emission rate
dependencies
Source category(b)
Emission configurati
on for modelling
EII/PP operational area vehicles (excluding dust from bulking – treated separately)
Vehicle-generated dust from vehicle movements within the operations area.
Road sealing Water trucks on unpaved
roads Bitterns application on
unsealed roads Road sweeping on sealed
roads
Activity dependent
- “Vehicles” Area
EII/PP Reclaiming Dust generation during reclaiming from live stockpile and transfer to conveyor.
Water sprays fitted to reclaimers at PPt as part of the 95 Mtpa and at EII as
part of 145 Mtpa
Activity dependent
Wind speed
“Operations” Volume
EII/PP Transfers Outgoing
Dust generation from dropping during transfers ex live stockpiles. Transfer sealing and for new transfers at PPt - design
Activity dependent
Wind speed
“Operations” Volume
EII/PP Screening Buildings
Dust generation during ore screening. Baghouse Activity dependent
Wind speed
“Operations” Volume
EII/PP Ship Loading Dust generation during dropping of ore to ship. Chute + water sprays Activity dependent
Wind speed
“Operations” Volume
EII/PP Bulk stockpiles
Wind-generated dust from the surface of these stockpiles. These vary in size and distribution within the bulk stockpile storage area.
Water application - Wind speed
“Open” Area
EII/PP bulking Vehicle-generated dust during bulking operations. Bulking involves the transfer of ore from live stockpiles to a separate bulk
stockpile to blend ores. Typically, a front end loader loads from a live stockpile into haul truck. The haul truck transports the ore to a bulk
stockpile where it is dumped and dozed. In the reverse operation, a front end loader loads from a bulk stockpile into haul truck which transports
and tips the ore through a elevated grate inloading hopper onto a conveyor for stacking to a live stockpile.
Water trucks used on haul roads. Water cannon used
to wet bulk stockpiles during tipping or loading. Truck-
activated water sprays on in-loading hopper.
Activity dependent
- “Vehicles” Area
(a) Sources denoted “EII/PP” mean the same general facility/operation is in the EII and PP operational areas.
Page 6
App B1 EmissionsEstimateRptV7b.doc Environmental Alliances Pty Ltd
Used for modelling expansion to 145 Mtpa
• The emissions estimation approach used for modelling dust for the 2005 year and for the proposed increase in throughput to 145 Mtpa incorporated revised functions for estimating emissions from some sources based on
a field sampling program in December 2005 by Environmental Alliances in response to Ministerial Conditions attached to the approval for the 120 Mtpa upgrade; and
field sampling programs over 2006 by SKM pursuant to Condition:M7-3 of Ministerial Statement 734 (see Appendix 3).
The following Sections describe the methods used to estimate dust emissions from the Dampier Port operations for 2005 – at a nominal Port throughput of 95 Mtpa, and for an increased throughput to 145 Mtpa.
5. DUST EMISSIONS FROM VEHICLES
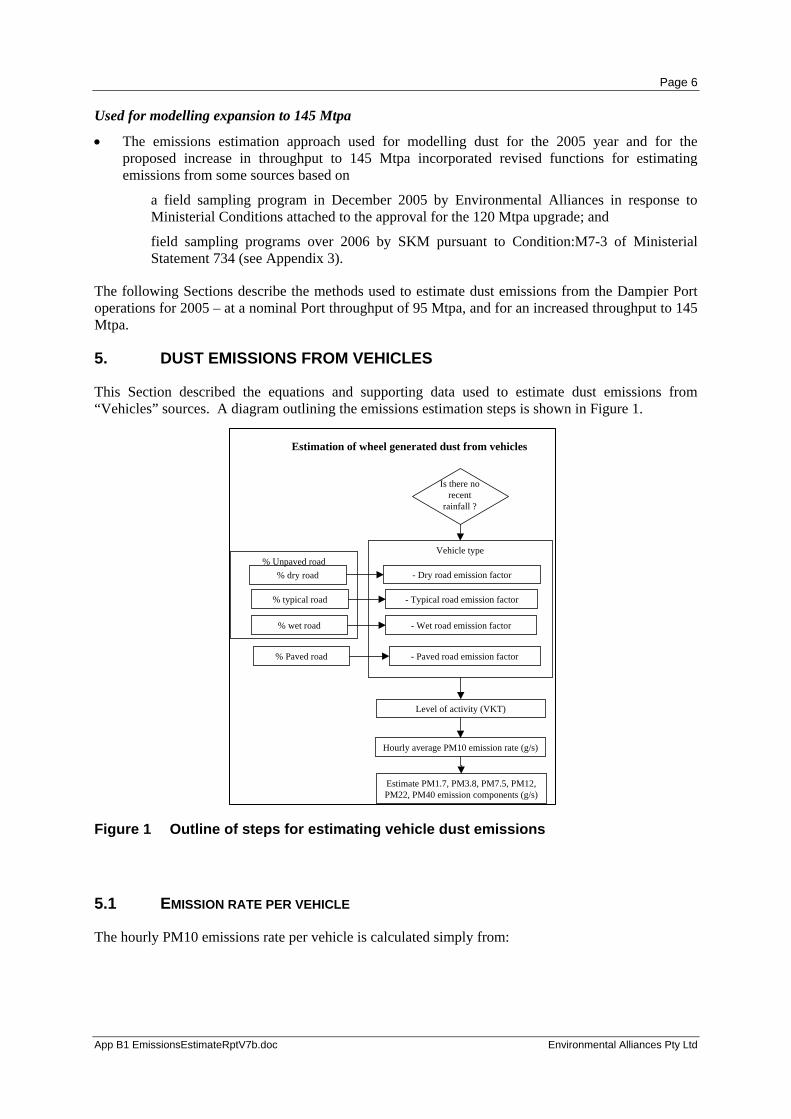
This Section described the equations and supporting data used to estimate dust emissions from “Vehicles” sources. A diagram outlining the emissions estimation steps is shown in Figure 1.
Figure 1 Outline of steps for estimating vehicle dust emissions
5.1 EMISSION RATE PER VEHICLE
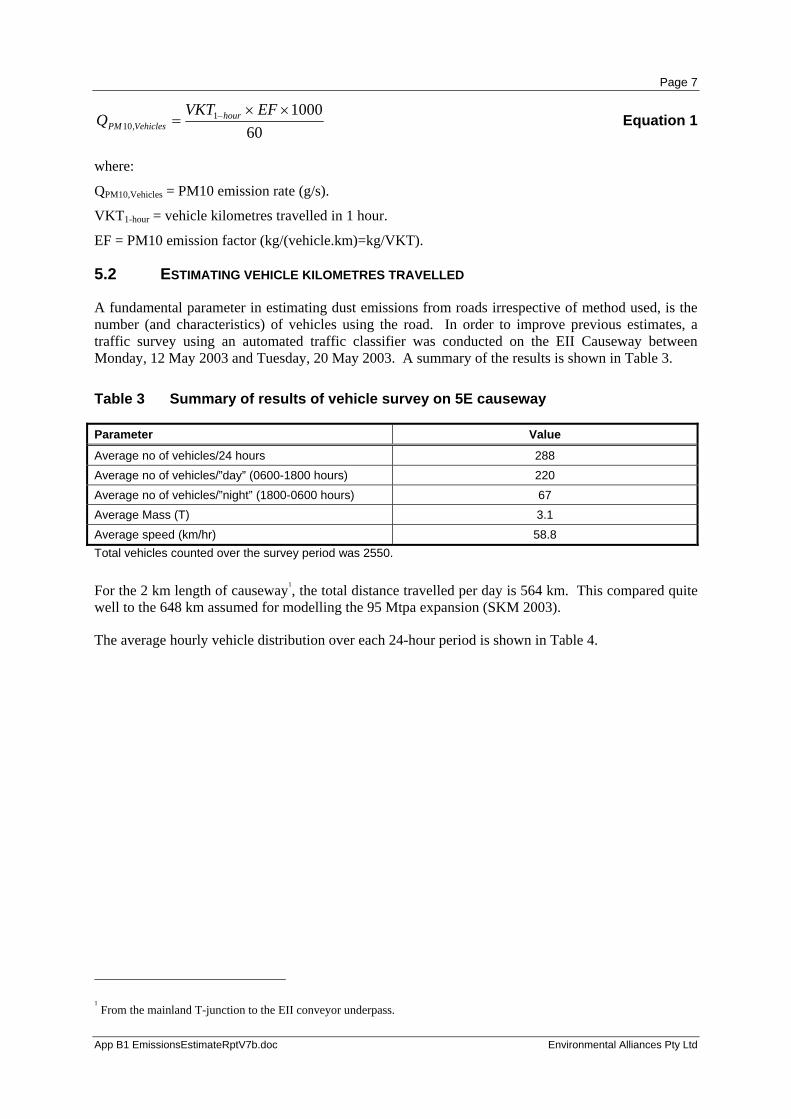
The hourly PM10 emissions rate per vehicle is calculated simply from:
Estimation of wheel generated dust from vehicles
Vehicle type
Estimate PM1.7, PM3.8, PM7.5, PM12,PM22, PM40 emission components (g/s)
Hourly average PM10 emission rate (g/s)
% wet road
Level of activity (VKT)
% dry road
% typical road
- Dry road emission factor
- Typical road emission factor
- Wet road emission factor
- Paved road emission factor
% Unpaved road
% Paved road
Is there norecent
rainfall ?
Page 7
App B1 EmissionsEstimateRptV7b.doc Environmental Alliances Pty Ltd
6010001
,10××
= − EFVKTQ hour
VehiclesPM Equation 1
where:
QPM10,Vehicles = PM10 emission rate (g/s).
VKT1-hour = vehicle kilometres travelled in 1 hour.
EF = PM10 emission factor (kg/(vehicle.km)=kg/VKT).
5.2 ESTIMATING VEHICLE KILOMETRES TRAVELLED
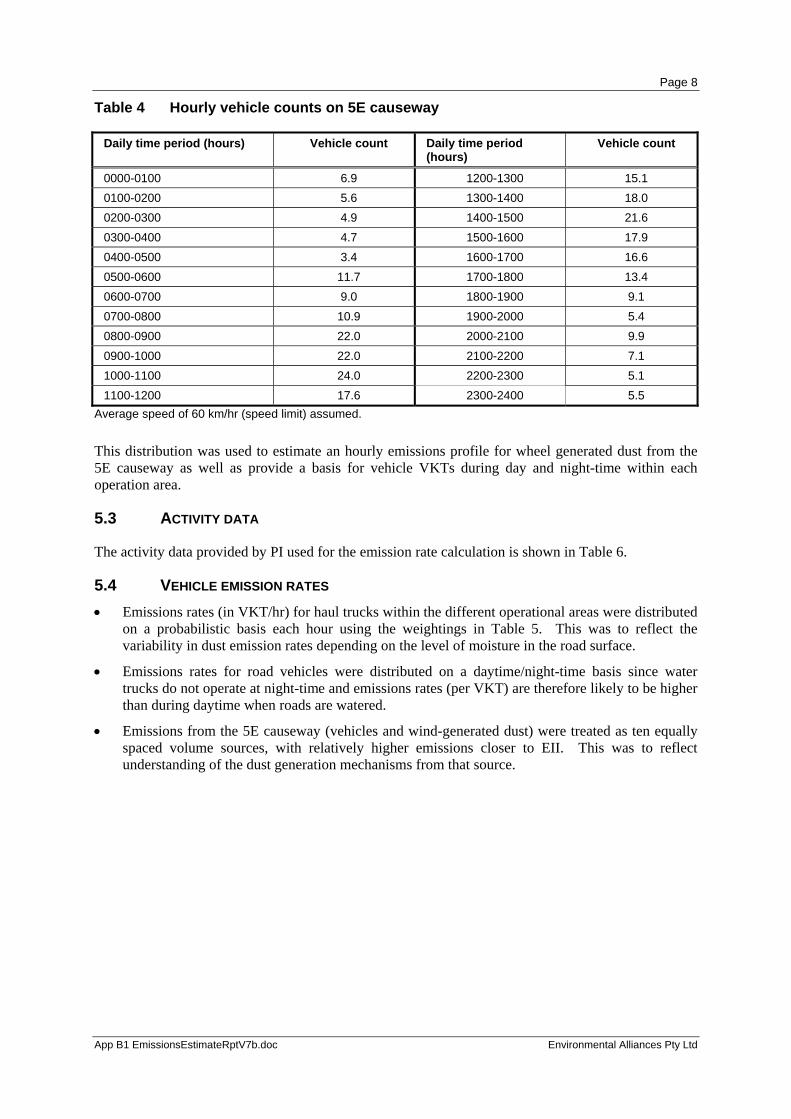
A fundamental parameter in estimating dust emissions from roads irrespective of method used, is the number (and characteristics) of vehicles using the road. In order to improve previous estimates, a traffic survey using an automated traffic classifier was conducted on the EII Causeway between Monday, 12 May 2003 and Tuesday, 20 May 2003. A summary of the results is shown in Table 3.
Table 3 Summary of results of vehicle survey on 5E causeway
Parameter Value
Average no of vehicles/24 hours 288 Average no of vehicles/”day” (0600-1800 hours) 220 Average no of vehicles/”night” (1800-0600 hours) 67 Average Mass (T) 3.1 Average speed (km/hr) 58.8 Total vehicles counted over the survey period was 2550.
For the 2 km length of causeway1, the total distance travelled per day is 564 km. This compared quite well to the 648 km assumed for modelling the 95 Mtpa expansion (SKM 2003).
The average hourly vehicle distribution over each 24-hour period is shown in Table 4.
1 From the mainland T-junction to the EII conveyor underpass.
Page 8
App B1 EmissionsEstimateRptV7b.doc Environmental Alliances Pty Ltd
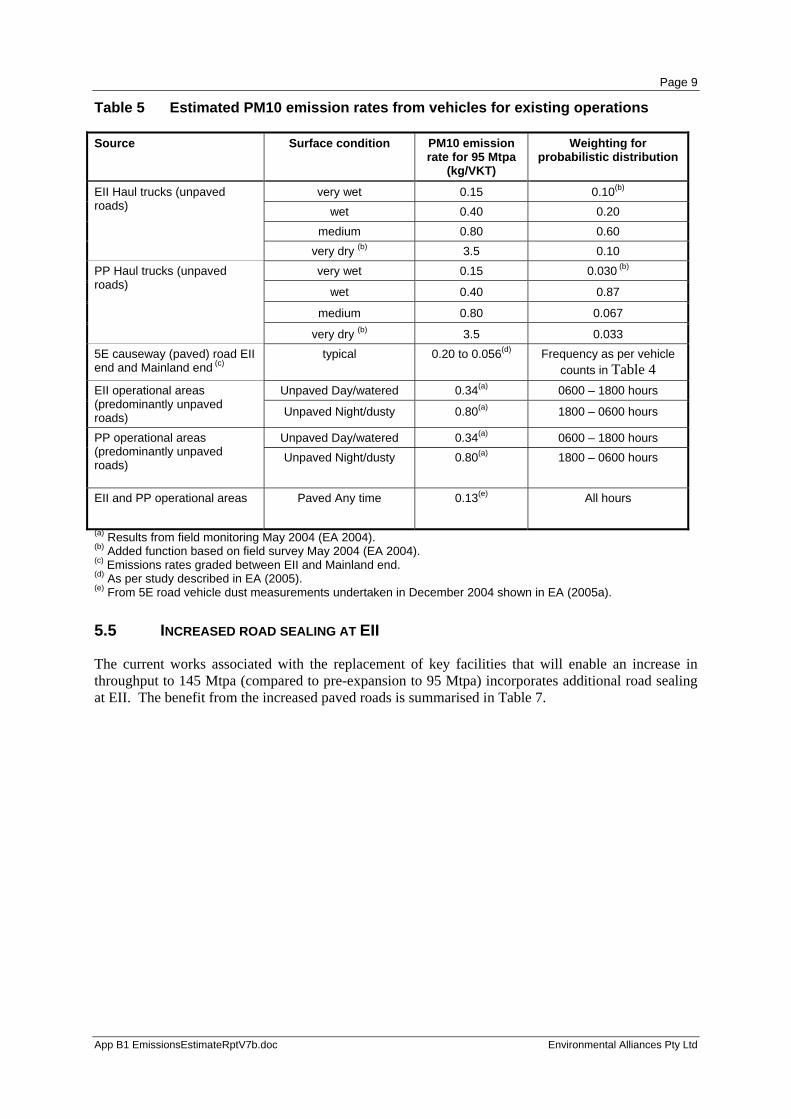
Table 4 Hourly vehicle counts on 5E causeway
Daily time period (hours) Vehicle count Daily time period (hours)
Vehicle count
0000-0100 6.9 1200-1300 15.1 0100-0200 5.6 1300-1400 18.0 0200-0300 4.9 1400-1500 21.6 0300-0400 4.7 1500-1600 17.9 0400-0500 3.4 1600-1700 16.6 0500-0600 11.7 1700-1800 13.4 0600-0700 9.0 1800-1900 9.1 0700-0800 10.9 1900-2000 5.4 0800-0900 22.0 2000-2100 9.9 0900-1000 22.0 2100-2200 7.1 1000-1100 24.0 2200-2300 5.1 1100-1200 17.6 2300-2400 5.5
Average speed of 60 km/hr (speed limit) assumed.
This distribution was used to estimate an hourly emissions profile for wheel generated dust from the 5E causeway as well as provide a basis for vehicle VKTs during day and night-time within each operation area.
5.3 ACTIVITY DATA
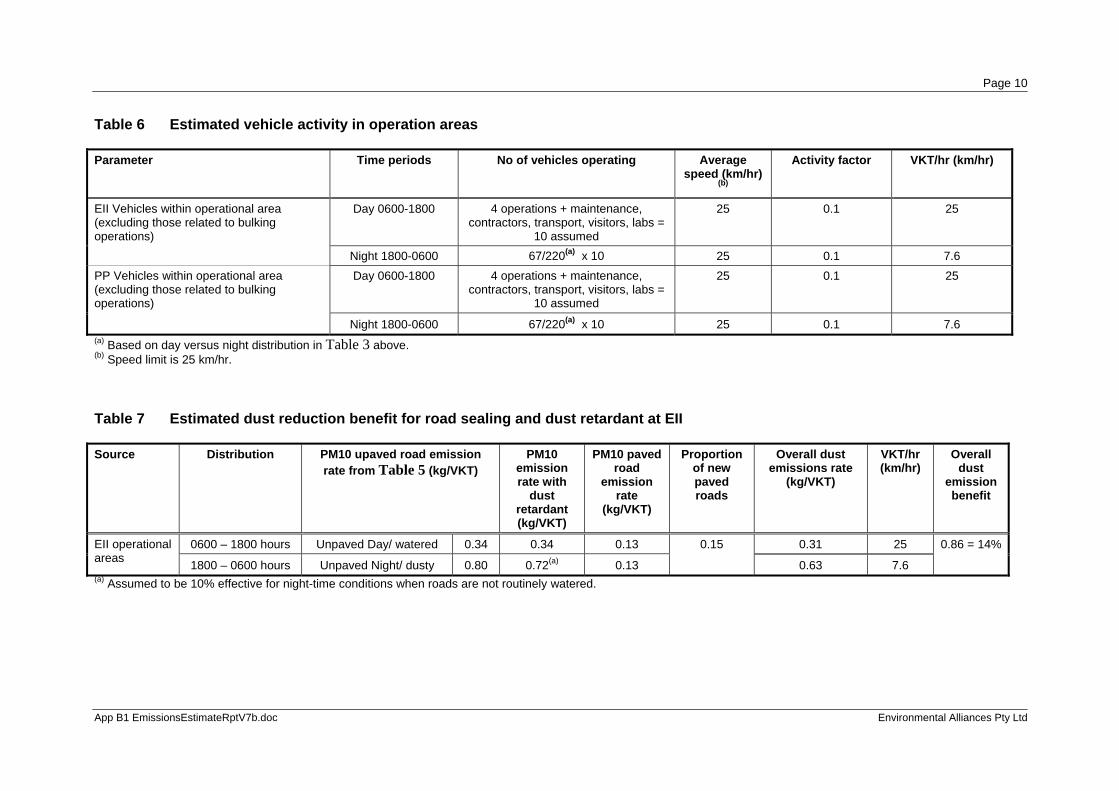
The activity data provided by PI used for the emission rate calculation is shown in Table 6.
5.4 VEHICLE EMISSION RATES • Emissions rates (in VKT/hr) for haul trucks within the different operational areas were distributed
on a probabilistic basis each hour using the weightings in Table 5. This was to reflect the variability in dust emission rates depending on the level of moisture in the road surface.
• Emissions rates for road vehicles were distributed on a daytime/night-time basis since water trucks do not operate at night-time and emissions rates (per VKT) are therefore likely to be higher than during daytime when roads are watered.
• Emissions from the 5E causeway (vehicles and wind-generated dust) were treated as ten equally spaced volume sources, with relatively higher emissions closer to EII. This was to reflect understanding of the dust generation mechanisms from that source.
Page 9
App B1 EmissionsEstimateRptV7b.doc Environmental Alliances Pty Ltd
Table 5 Estimated PM10 emission rates from vehicles for existing operations
Source Surface condition PM10 emission rate for 95 Mtpa
(kg/VKT)
Weighting for probabilistic distribution
very wet 0.15 0.10(b) wet 0.40 0.20
medium 0.80 0.60
EII Haul trucks (unpaved roads)
very dry (b) 3.5 0.10 very wet 0.15 0.030 (b)
wet 0.40 0.87
medium 0.80 0.067
PP Haul trucks (unpaved roads)
very dry (b) 3.5 0.033 5E causeway (paved) road EII end and Mainland end (c)
typical 0.20 to 0.056(d) Frequency as per vehicle counts in Table 4
Unpaved Day/watered 0.34(a) 0600 – 1800 hours EII operational areas (predominantly unpaved roads) Unpaved Night/dusty 0.80(a) 1800 – 0600 hours
Unpaved Day/watered 0.34(a) 0600 – 1800 hours PP operational areas (predominantly unpaved roads) Unpaved Night/dusty 0.80(a) 1800 – 0600 hours
EII and PP operational areas Paved Any time 0.13(e) All hours
(a) Results from field monitoring May 2004 (EA 2004). (b) Added function based on field survey May 2004 (EA 2004). (c) Emissions rates graded between EII and Mainland end. (d) As per study described in EA (2005). (e) From 5E road vehicle dust measurements undertaken in December 2004 shown in EA (2005a).
5.5 INCREASED ROAD SEALING AT EII
The current works associated with the replacement of key facilities that will enable an increase in throughput to 145 Mtpa (compared to pre-expansion to 95 Mtpa) incorporates additional road sealing at EII. The benefit from the increased paved roads is summarised in Table 7.
Page 10
App B1 EmissionsEstimateRptV7b.doc Environmental Alliances Pty Ltd
Table 6 Estimated vehicle activity in operation areas
Parameter Time periods No of vehicles operating Average speed (km/hr)
(b)
Activity factor VKT/hr (km/hr)
Day 0600-1800 4 operations + maintenance, contractors, transport, visitors, labs =
10 assumed
25 0.1 25 EII Vehicles within operational area (excluding those related to bulking operations)
Night 1800-0600 67/220(a) x 10 25 0.1 7.6 Day 0600-1800 4 operations + maintenance,
contractors, transport, visitors, labs = 10 assumed
25 0.1 25 PP Vehicles within operational area (excluding those related to bulking operations)
Night 1800-0600 67/220(a) x 10 25 0.1 7.6 (a) Based on day versus night distribution in Table 3 above. (b) Speed limit is 25 km/hr.
Table 7 Estimated dust reduction benefit for road sealing and dust retardant at EII
Source Distribution PM10 upaved road emission rate from Table 5 (kg/VKT)
PM10 emission rate with
dust retardant (kg/VKT)
PM10 paved road
emission rate
(kg/VKT)
Proportion of new paved roads
Overall dust emissions rate
(kg/VKT)
VKT/hr (km/hr)
Overall dust
emission benefit
0600 – 1800 hours Unpaved Day/ watered 0.34 0.34 0.13 0.31 25 EII operational areas 1800 – 0600 hours Unpaved Night/ dusty 0.80 0.72(a) 0.13
0.15
0.63 7.6
0.86 = 14%
(a) Assumed to be 10% effective for night-time conditions when roads are not routinely watered.
Page 11
App B1 EmissionsEstimateRptV7b.doc Environmental Alliances Pty Ltd
6. DUST EMISSIONS FROM BULKING
Bulking also involves front-end loader and dozer usage, dumping into haul trucks and the haul trucks dumping their load.
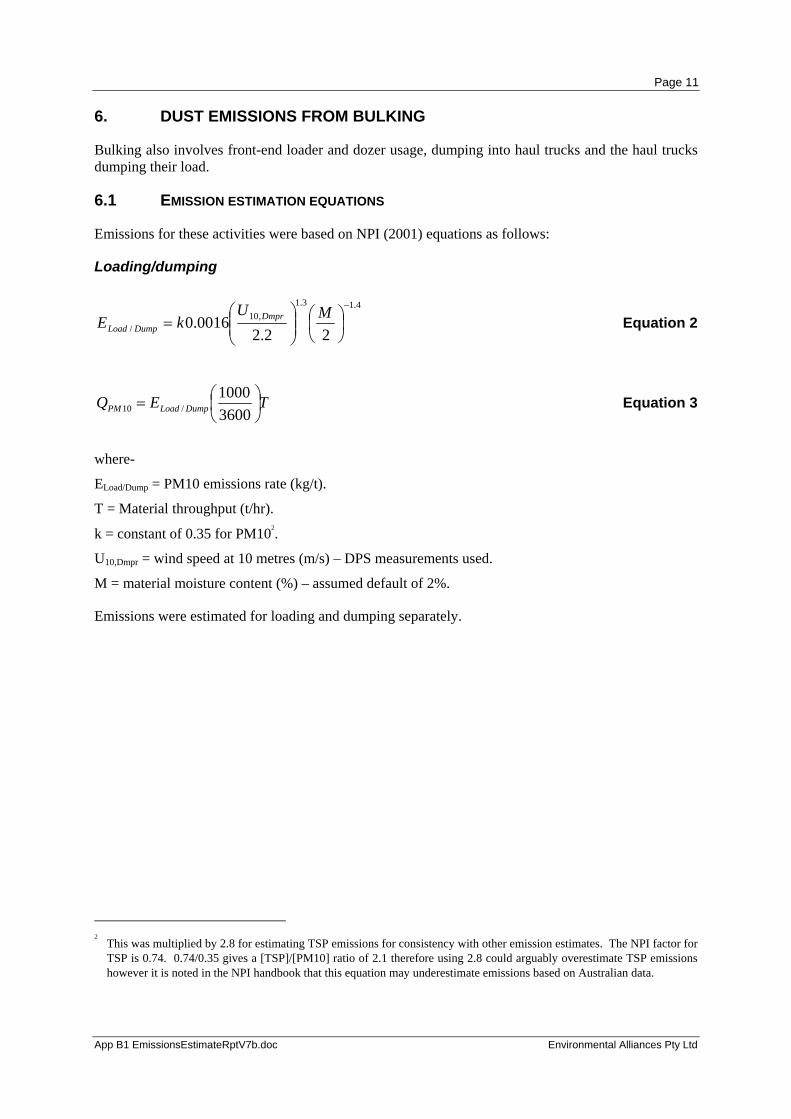
6.1 EMISSION ESTIMATION EQUATIONS
Emissions for these activities were based on NPI (2001) equations as follows:
Loading/dumping
4.13.1,10
/ 22.20016.0
−
⎟⎠⎞
⎜⎝⎛
⎟⎟⎠
⎞⎜⎜⎝
⎛=
MUkE Dmpr
DumpLoad Equation 2
TEQ DumpLoadPM ⎟⎠⎞
⎜⎝⎛=
36001000
/10 Equation 3
where-
ELoad/Dump = PM10 emissions rate (kg/t).
T = Material throughput (t/hr).
k = constant of 0.35 for PM102.
U10,Dmpr = wind speed at 10 metres (m/s) – DPS measurements used.
M = material moisture content (%) – assumed default of 2%.
Emissions were estimated for loading and dumping separately.
2 This was multiplied by 2.8 for estimating TSP emissions for consistency with other emission estimates. The NPI factor for
TSP is 0.74. 0.74/0.35 gives a [TSP]/[PM10] ratio of 2.1 therefore using 2.8 could arguably overestimate TSP emissions however it is noted in the NPI handbook that this equation may underestimate emissions based on Australian data.
Page 12
App B1 EmissionsEstimateRptV7b.doc Environmental Alliances Pty Ltd
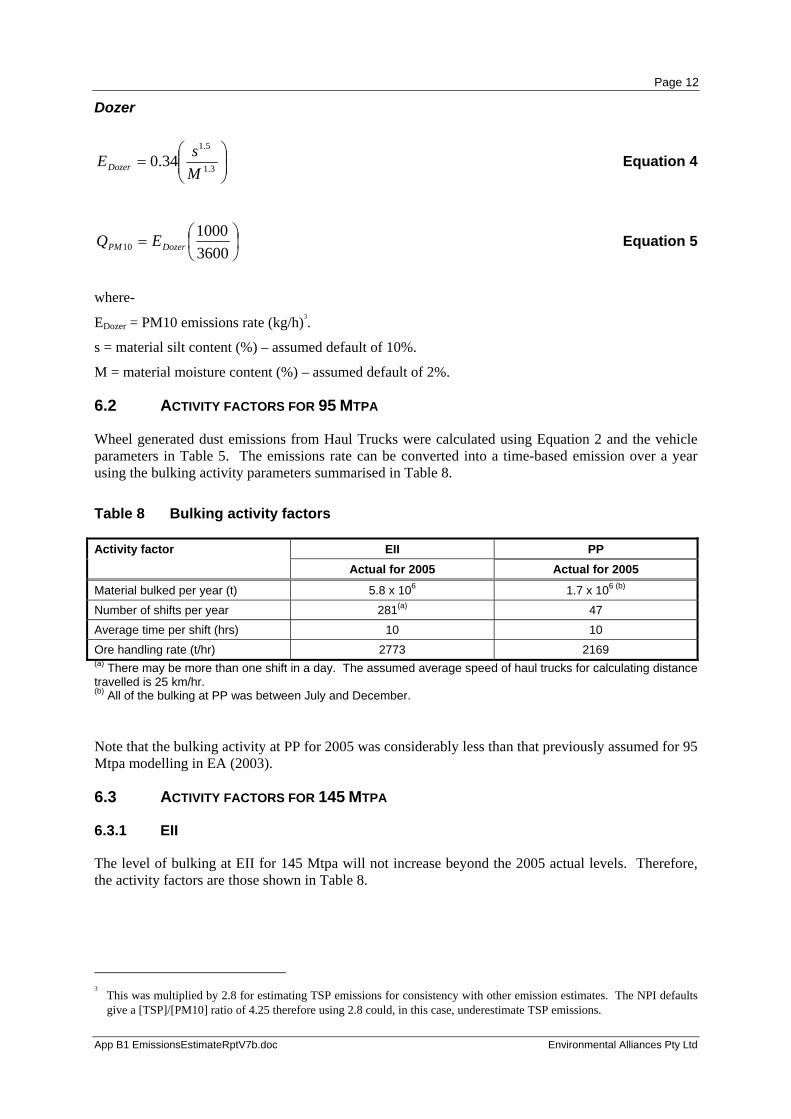
Dozer
⎟⎟⎠
⎞⎜⎜⎝
⎛= 3.1
5.1
34.0MsEDozer Equation 4
⎟⎠⎞
⎜⎝⎛=
36001000
10 DozerPM EQ Equation 5
where-
EDozer = PM10 emissions rate (kg/h)3.
s = material silt content (%) – assumed default of 10%.
M = material moisture content (%) – assumed default of 2%.
6.2 ACTIVITY FACTORS FOR 95 MTPA
Wheel generated dust emissions from Haul Trucks were calculated using Equation 2 and the vehicle parameters in Table 5. The emissions rate can be converted into a time-based emission over a year using the bulking activity parameters summarised in Table 8.
Table 8 Bulking activity factors
EII PP Activity factor Actual for 2005 Actual for 2005
Material bulked per year (t) 5.8 x 10⁶ 1.7 x 10⁶ (b) Number of shifts per year 281(a) 47 Average time per shift (hrs) 10 10 Ore handling rate (t/hr) 2773 2169 (a) There may be more than one shift in a day. The assumed average speed of haul trucks for calculating distance travelled is 25 km/hr. (b) All of the bulking at PP was between July and December.
Note that the bulking activity at PP for 2005 was considerably less than that previously assumed for 95 Mtpa modelling in EA (2003).
6.3 ACTIVITY FACTORS FOR 145 MTPA
6.3.1 EII
The level of bulking at EII for 145 Mtpa will not increase beyond the 2005 actual levels. Therefore, the activity factors are those shown in Table 8.
3 This was multiplied by 2.8 for estimating TSP emissions for consistency with other emission estimates. The NPI defaults
give a [TSP]/[PM10] ratio of 4.25 therefore using 2.8 could, in this case, underestimate TSP emissions.
Page 13
App B1 EmissionsEstimateRptV7b.doc Environmental Alliances Pty Ltd
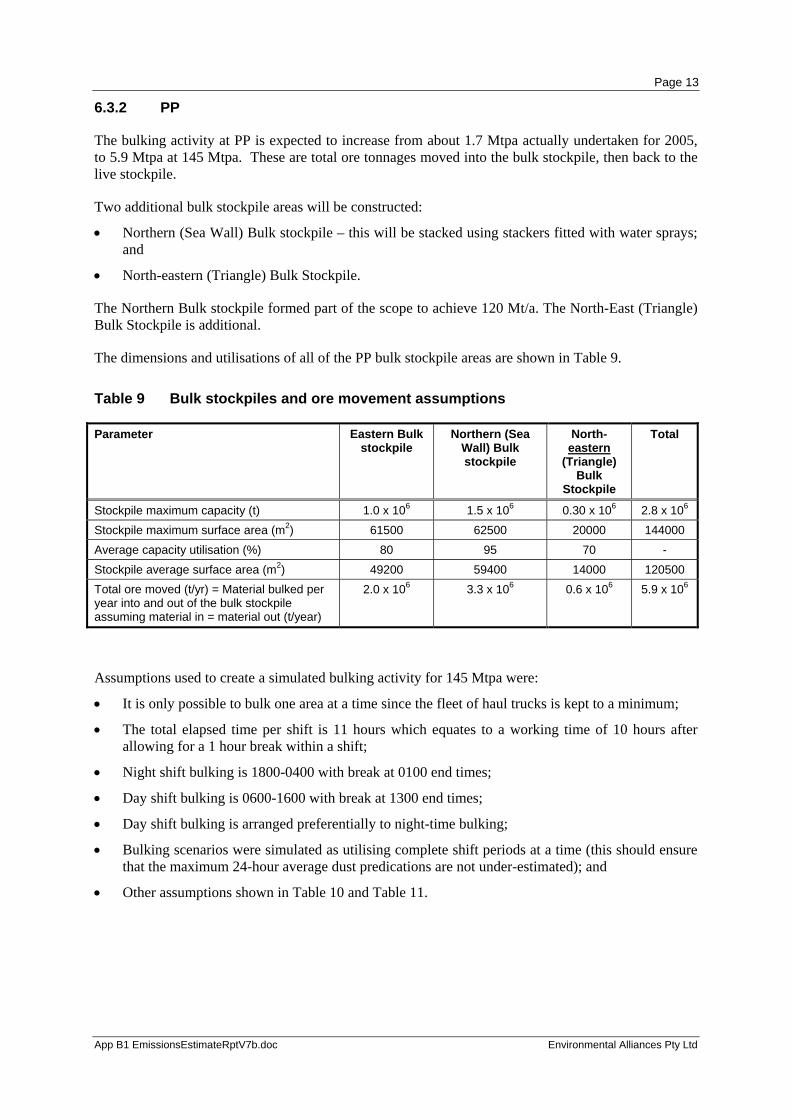
6.3.2 PP
The bulking activity at PP is expected to increase from about 1.7 Mtpa actually undertaken for 2005, to 5.9 Mtpa at 145 Mtpa. These are total ore tonnages moved into the bulk stockpile, then back to the live stockpile.
Two additional bulk stockpile areas will be constructed:
• Northern (Sea Wall) Bulk stockpile – this will be stacked using stackers fitted with water sprays; and
• North-eastern (Triangle) Bulk Stockpile.
The Northern Bulk stockpile formed part of the scope to achieve 120 Mt/a. The North-East (Triangle) Bulk Stockpile is additional.
The dimensions and utilisations of all of the PP bulk stockpile areas are shown in Table 9.
Table 9 Bulk stockpiles and ore movement assumptions
Parameter Eastern Bulk stockpile
Northern (Sea Wall) Bulk stockpile
North-eastern
(Triangle) Bulk
Stockpile
Total
Stockpile maximum capacity (t) 1.0 x 10⁶ 1.5 x 10⁶ 0.30 x 10⁶ 2.8 x 10⁶ Stockpile maximum surface area (m2) 61500 62500 20000 144000 Average capacity utilisation (%) 80 95 70 - Stockpile average surface area (m2) 49200 59400 14000 120500 Total ore moved (t/yr) = Material bulked per year into and out of the bulk stockpile assuming material in = material out (t/year)
2.0 x 10⁶ 3.3 x 10⁶ 0.6 x 10⁶ 5.9 x 10⁶
Assumptions used to create a simulated bulking activity for 145 Mtpa were:
• It is only possible to bulk one area at a time since the fleet of haul trucks is kept to a minimum;
• The total elapsed time per shift is 11 hours which equates to a working time of 10 hours after allowing for a 1 hour break within a shift;
• Night shift bulking is 1800-0400 with break at 0100 end times;
• Day shift bulking is 0600-1600 with break at 1300 end times;
• Day shift bulking is arranged preferentially to night-time bulking;
• Bulking scenarios were simulated as utilising complete shift periods at a time (this should ensure that the maximum 24-hour average dust predications are not under-estimated); and
• Other assumptions shown in Table 10 and Table 11.
Page 14
App B1 EmissionsEstimateRptV7b.doc Environmental Alliances Pty Ltd
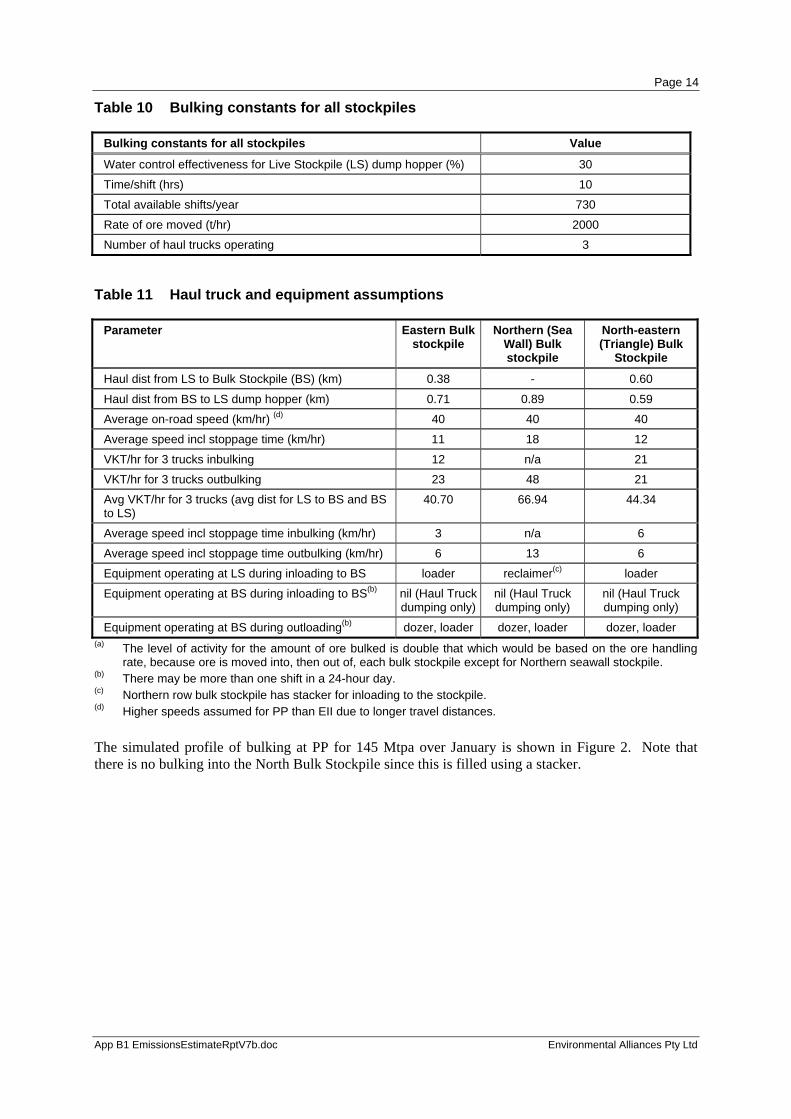
Table 10 Bulking constants for all stockpiles
Bulking constants for all stockpiles Value
Water control effectiveness for Live Stockpile (LS) dump hopper (%) 30
Time/shift (hrs) 10
Total available shifts/year 730
Rate of ore moved (t/hr) 2000
Number of haul trucks operating 3
Table 11 Haul truck and equipment assumptions
Parameter Eastern Bulk stockpile
Northern (Sea Wall) Bulk stockpile
North-eastern (Triangle) Bulk
Stockpile
Haul dist from LS to Bulk Stockpile (BS) (km) 0.38 - 0.60
Haul dist from BS to LS dump hopper (km) 0.71 0.89 0.59
Average on-road speed (km/hr) (d) 40 40 40
Average speed incl stoppage time (km/hr) 11 18 12
VKT/hr for 3 trucks inbulking 12 n/a 21
VKT/hr for 3 trucks outbulking 23 48 21
Avg VKT/hr for 3 trucks (avg dist for LS to BS and BS to LS)
40.70 66.94 44.34
Average speed incl stoppage time inbulking (km/hr) 3 n/a 6
Average speed incl stoppage time outbulking (km/hr) 6 13 6
Equipment operating at LS during inloading to BS loader reclaimer(c) loader
Equipment operating at BS during inloading to BS(b) nil (Haul Truck dumping only)
nil (Haul Truck dumping only)
nil (Haul Truck dumping only)
Equipment operating at BS during outloading(b) dozer, loader dozer, loader dozer, loader (a) The level of activity for the amount of ore bulked is double that which would be based on the ore handling
rate, because ore is moved into, then out of, each bulk stockpile except for Northern seawall stockpile. (b) There may be more than one shift in a 24-hour day. (c) Northern row bulk stockpile has stacker for inloading to the stockpile. (d) Higher speeds assumed for PP than EII due to longer travel distances.
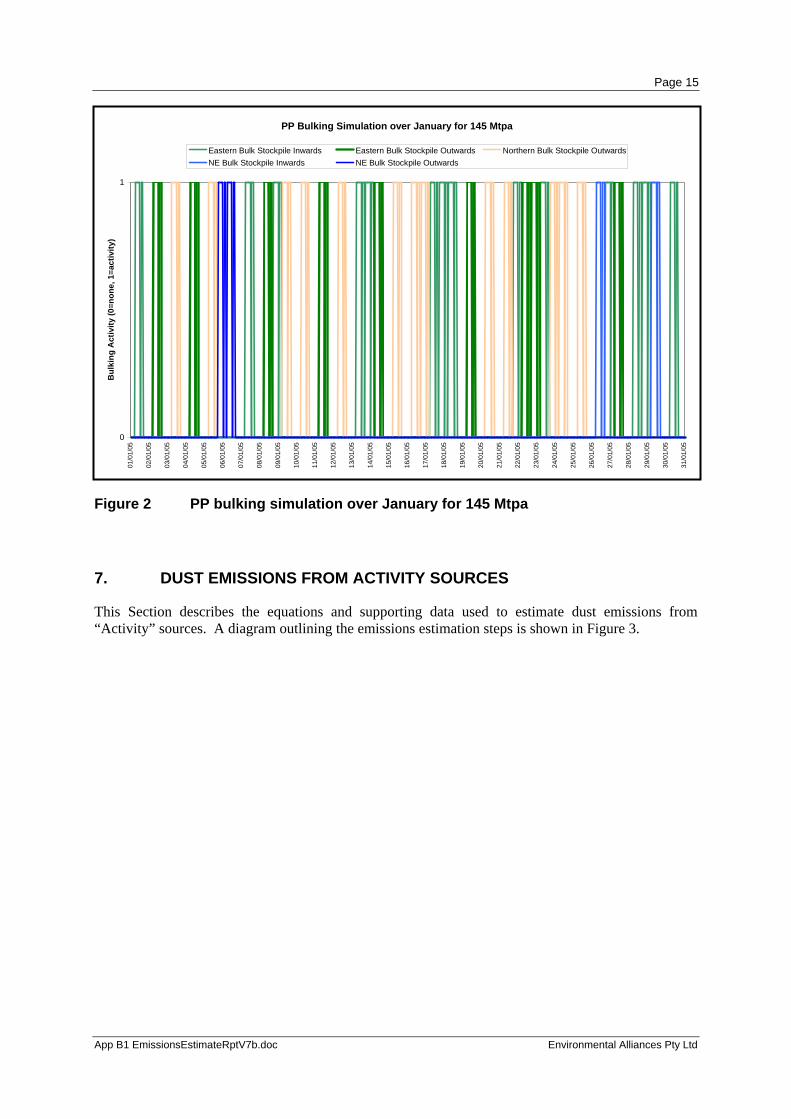
The simulated profile of bulking at PP for 145 Mtpa over January is shown in Figure 2. Note that there is no bulking into the North Bulk Stockpile since this is filled using a stacker.
Page 15
App B1 EmissionsEstimateRptV7b.doc Environmental Alliances Pty Ltd
Figure 2 PP bulking simulation over January for 145 Mtpa
7. DUST EMISSIONS FROM ACTIVITY SOURCES
This Section describes the equations and supporting data used to estimate dust emissions from “Activity” sources. A diagram outlining the emissions estimation steps is shown in Figure 3.
PP Bulking Simulation over January for 145 Mtpa
0
1
01/0
1/05
02/0
1/05
03/0
1/05
04/0
1/05
05/0
1/05
06/0
1/05
07/0
1/05
08/0
1/05
09/0
1/05
10/0
1/05
11/0
1/05
12/0
1/05
13/0
1/05
14/0
1/05
15/0
1/05
16/0
1/05
17/0
1/05
18/0
1/05
19/0
1/05
20/0
1/05
21/0
1/05
22/0
1/05
23/0
1/05
24/0
1/05
25/0
1/05
26/0
1/05
27/0
1/05
28/0
1/05
29/0
1/05
30/0
1/05
31/0
1/05
Bul
king
Act
ivity
(0=n
one,
1=a
ctiv
ity)
Eastern Bulk Stockpile Inwards Eastern Bulk Stockpile Outwards Northern Bulk Stockpile OutwardsNE Bulk Stockpile Inwards NE Bulk Stockpile Outwards

Page 16
App B1 EmissionsEstimateRptV7b.doc Environmental Alliances Pty Ltd
Figure 3 Outline of activity sources dust emissions estimation steps
7.1 DUST EMISSION EQUATIONS
7.1.1 Sources other than conveyors
The initial emissions estimate, as PM10, based on the wind speed is given by:
Estimation of 1-Hourly Activity Source Dust Emissions for Dampier 2005
Wind speed
Operating data
PM1.7, PM3.8, PM7.5, PM12, PM22, PM40 emission
components (g/s)
Hourly average PM10 emission rate (g/s)
Empirical PM10 emissions function for source
“Activity” Source (eg stacker, reclaimer etc)
Is source operating ?
Is there no recent
rainfall ?
Apply dust control factor as applicable
Zero dust emissions
NO
YES
NO
YES
Ore/Product type
Ore dustiness factorOre/Product
moisture

Page 17
App B1 EmissionsEstimateRptV7b.doc Environmental Alliances Pty Ltd
psPM UKQ KA10,10 = Equation 6
where-
Ks = Source-specific empirical constant (g/m).
U10,KA = Wind speed measured at 10 m at Karratha Airport (m/s).
p = Source-specific empirical exponent.
The values of Ks and p along with the assumed emissions frequency based on activity times are shown in Table 12.
Table 12 Empirically derived parameters for wind generated dust from “activity” sources
Source name Unit ID Ks (g/m) p Modifier
1-4E/5E Transfer 1-4E/5E 0.25 0.5 - EII Reclaiming(b) Various 0.18 1.4 + 1.0 g/s EII Screening Building SH1E 1.22 0.5 - EII Ship Loading SL1E 0.19 1.4 - EII Stacking(b) Various 0.080 1.4 Or 0.1 g/s for U10,KA < 2 m/s EII Transfers inloading(b) Various 0.060 1.4 Or 0.1 g/s for U10,KA < 2 m/s EII Transfers outgoing Various 0.095 1.4 - PP Screening Building 1 SH1P 2.4 0.5 - PP Screening Building 2 SH3P 1.22 0.5 - PP Ship Loader 1 SL1P 0.19 1.4 - PP Ship Loader 2 SL2P 0.19 1.4 - PP Stacking(c) Various 0.21 1.4 Or 0.1 g/s for U10,KA < 2 m/s PP Transfers inloading Various 0.14 1.4 - PP Reclaiming(a) Various 0.29 1.4 Or 0.1 g/s for U10,KA < 2 m/s PP Transfers outgoing(b) Various 0.045 1.4 Or 0.1 g/s for U10,KA < 2 m/s (a) Note that this is averaged from EA and SKM (2007) monitoring – see Appendix 4. (b) Emission function from SKM (2007). (c) Note that this is averaged from EA and SKM (2007) monitoring – see Appendix 5.
7.1.2 Conveyors
5E Conveyor top strand
Wind generated PM10 from the 5E conveyor top strand was estimated using the results from additional monitoring in 2004 (EA 2005):
QPM10 = 0.00084Uf3(1-(5.42/Uf
2)) Equation 7
Where-
Uf = the “forcing” wind speed – ie. net wind speed between the actual wind speed at conveyor height and the belt speed (m/s) (ie also taking into account the wind direction and orientation of the conveyor).
Page 18
App B1 EmissionsEstimateRptV7b.doc Environmental Alliances Pty Ltd
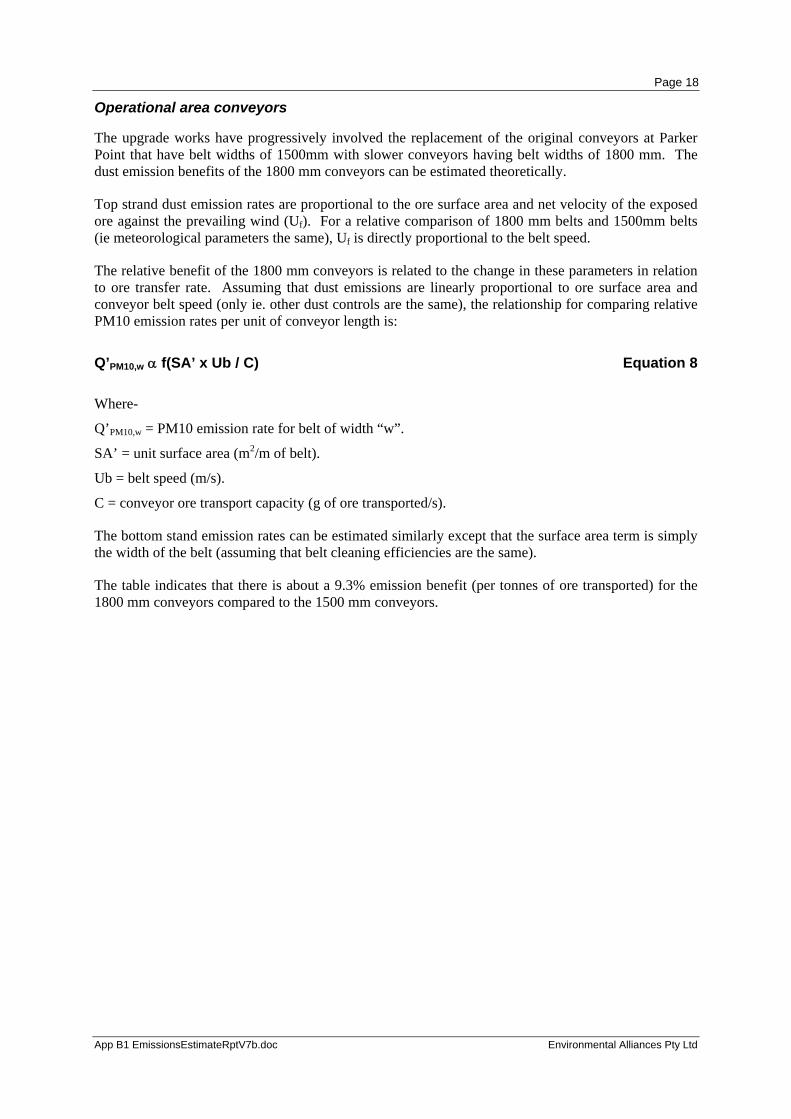
Operational area conveyors
The upgrade works have progressively involved the replacement of the original conveyors at Parker Point that have belt widths of 1500mm with slower conveyors having belt widths of 1800 mm. The dust emission benefits of the 1800 mm conveyors can be estimated theoretically.
Top strand dust emission rates are proportional to the ore surface area and net velocity of the exposed ore against the prevailing wind (Uf). For a relative comparison of 1800 mm belts and 1500mm belts (ie meteorological parameters the same), Uf is directly proportional to the belt speed.
The relative benefit of the 1800 mm conveyors is related to the change in these parameters in relation to ore transfer rate. Assuming that dust emissions are linearly proportional to ore surface area and conveyor belt speed (only ie. other dust controls are the same), the relationship for comparing relative PM10 emission rates per unit of conveyor length is:
Q’PM10,w α f(SA’ x Ub / C) Equation 8
Where-
Q’PM10,w = PM10 emission rate for belt of width “w”.
SA’ = unit surface area (m2/m of belt).
Ub = belt speed (m/s).
C = conveyor ore transport capacity (g of ore transported/s).
The bottom stand emission rates can be estimated similarly except that the surface area term is simply the width of the belt (assuming that belt cleaning efficiencies are the same).
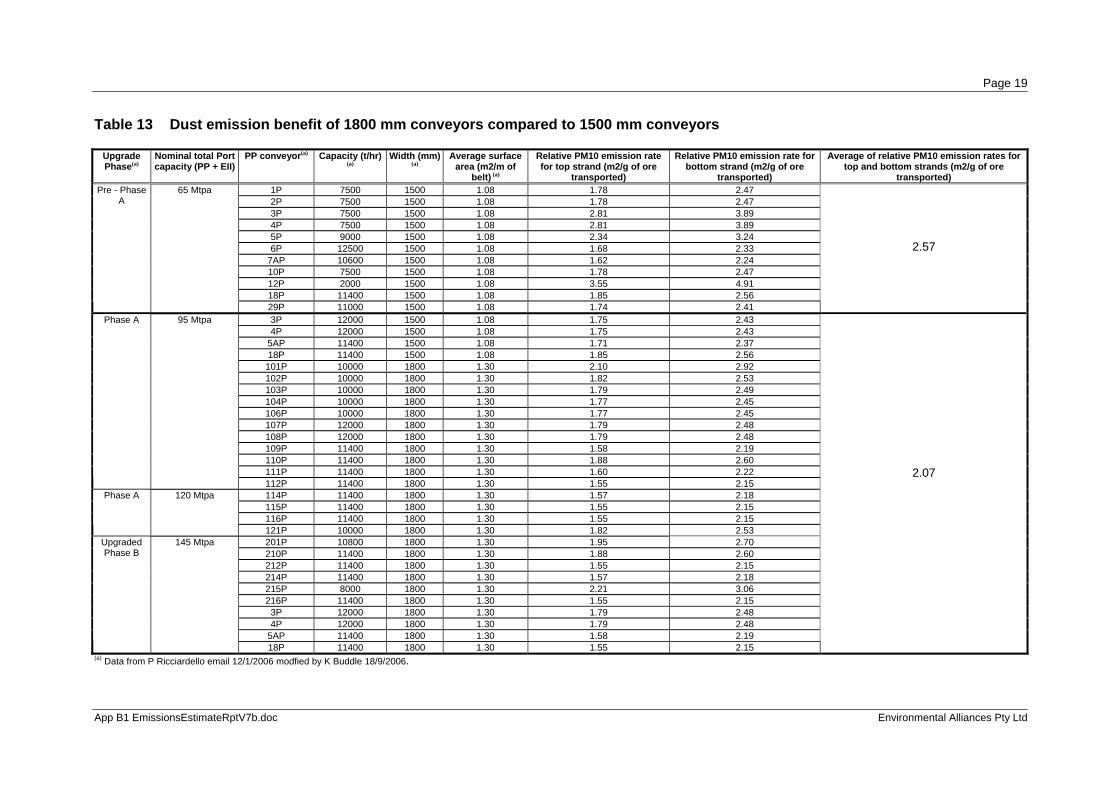
The table indicates that there is about a 9.3% emission benefit (per tonnes of ore transported) for the 1800 mm conveyors compared to the 1500 mm conveyors.
Page 19
App B1 EmissionsEstimateRptV7b.doc Environmental Alliances Pty Ltd
Table 13 Dust emission benefit of 1800 mm conveyors compared to 1500 mm conveyors
Upgrade Phase(a)
Nominal total Port capacity (PP + EII)
PP conveyor(a) Capacity (t/hr)
(a) Width (mm)
(a) Average surface
area (m2/m of belt) (a)
Relative PM10 emission rate for top strand (m2/g of ore
transported)
Relative PM10 emission rate for bottom strand (m2/g of ore
transported)
Average of relative PM10 emission rates for top and bottom strands (m2/g of ore
transported) 1P 7500 1500 1.08 1.78 2.47 2P 7500 1500 1.08 1.78 2.47 3P 7500 1500 1.08 2.81 3.89 4P 7500 1500 1.08 2.81 3.89 5P 9000 1500 1.08 2.34 3.24 6P 12500 1500 1.08 1.68 2.33
7AP 10600 1500 1.08 1.62 2.24 10P 7500 1500 1.08 1.78 2.47 12P 2000 1500 1.08 3.55 4.91 18P 11400 1500 1.08 1.85 2.56
Pre - Phase A
65 Mtpa
29P 11000 1500 1.08 1.74 2.41
2.57
3P 12000 1500 1.08 1.75 2.43 4P 12000 1500 1.08 1.75 2.43
5AP 11400 1500 1.08 1.71 2.37 18P 11400 1500 1.08 1.85 2.56 101P 10000 1800 1.30 2.10 2.92 102P 10000 1800 1.30 1.82 2.53 103P 10000 1800 1.30 1.79 2.49 104P 10000 1800 1.30 1.77 2.45 106P 10000 1800 1.30 1.77 2.45 107P 12000 1800 1.30 1.79 2.48 108P 12000 1800 1.30 1.79 2.48 109P 11400 1800 1.30 1.58 2.19 110P 11400 1800 1.30 1.88 2.60 111P 11400 1800 1.30 1.60 2.22
Phase A 95 Mtpa
112P 11400 1800 1.30 1.55 2.15 114P 11400 1800 1.30 1.57 2.18 115P 11400 1800 1.30 1.55 2.15 116P 11400 1800 1.30 1.55 2.15
Phase A 120 Mtpa
121P 10000 1800 1.30 1.82 2.53 201P 10800 1800 1.30 1.95 2.70 210P 11400 1800 1.30 1.88 2.60 212P 11400 1800 1.30 1.55 2.15 214P 11400 1800 1.30 1.57 2.18 215P 8000 1800 1.30 2.21 3.06 216P 11400 1800 1.30 1.55 2.15 3P 12000 1800 1.30 1.79 2.48 4P 12000 1800 1.30 1.79 2.48
5AP 11400 1800 1.30 1.58 2.19
Upgraded Phase B
145 Mtpa
18P 11400 1800 1.30 1.55 2.15
2.07
(a) Data from P Ricciardello email 12/1/2006 modfied by K Buddle 18/9/2006.

Page 20
App B1 EmissionsEstimateRptV7b.doc Environmental Alliances Pty Ltd
7.1.3 Car Dumpers Car dumper emissions estimates assumed a fixed emission of 0.35 g/s (when operating) based on a dust emissions concentration of 5 mg/m3 when the dumper was operating. Measured emissions concentrations from car dumper 3 were 0.59 mg/m3, <DL, 0.37 mg/m3 (SKM 2006) hence 5 mg/m3 is an upper estimate (Ref: SKM, 2006, “Design Transmittal no DPU-DT-09420”, 13/2/2006).
7.2 OPERATING FREQUENCIES
The emissions estimation approach incorporated the times of the actual activity of each stage of the ore handling operation (eg car dumping, stacking, reclaiming etc).
The operating frequencies for 2005 – nominally 95 Mtpa, were determined from the Port Process Analysis (PPA) data base. An example of the daily operating times over 2005 for the EII ship loader is shown in Figure 4. It is interesting that all of the ore handling equipment is subject to periodic stoppages throughout each day.
Figure 4 Percent of time each day EII shiploader running for 2005
Percent of time each day SL1E running for 2005
0
10
20
30
40
50
60
70
80
90
100
1/01
/05
15/0
1/05
29/0
1/05
12/0
2/05
26/0
2/05
12/0
3/05
26/0
3/05
9/04
/05
23/0
4/05
7/05
/05
21/0
5/05
4/06
/05
18/0
6/05
2/07
/05
16/0
7/05
30/0
7/05
13/0
8/05
27/0
8/05
10/0
9/05
24/0
9/05
8/10
/05
22/1
0/05
5/11
/05
19/1
1/05
3/12
/05
17/1
2/05
31/1
2/05
Perc
ent o
f tim
e (%
)
Page 21
App B1 EmissionsEstimateRptV7b.doc Environmental Alliances Pty Ltd
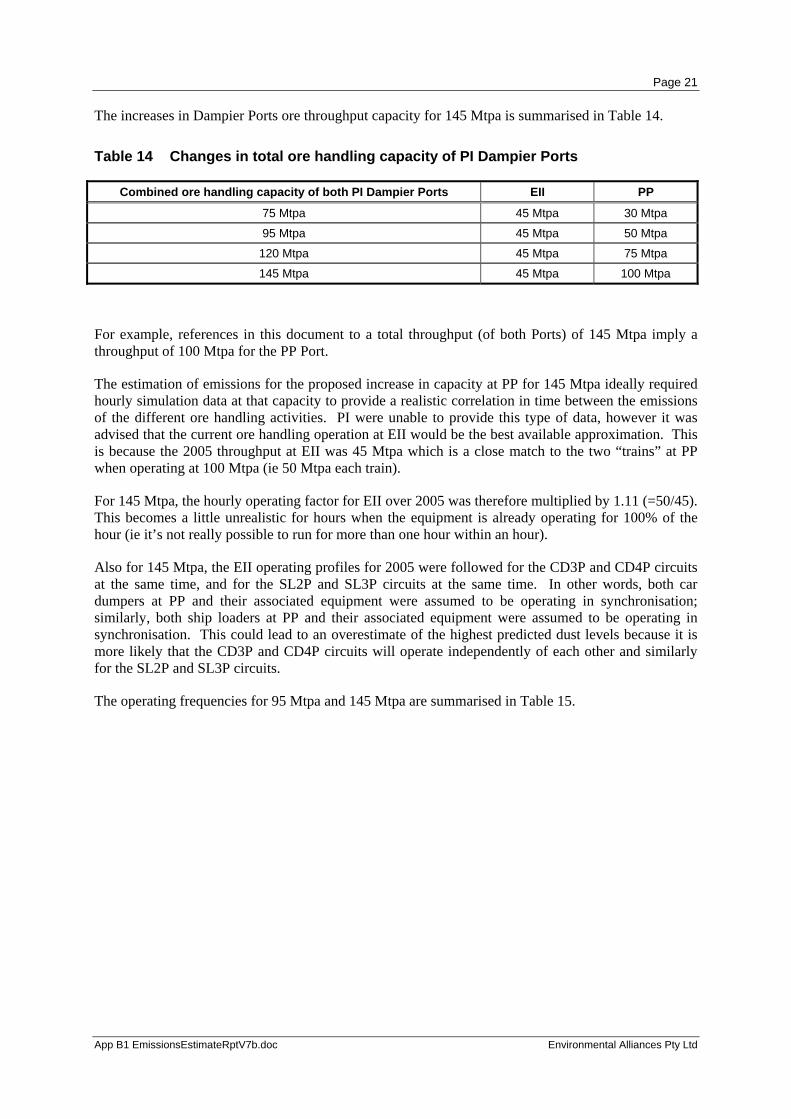
The increases in Dampier Ports ore throughput capacity for 145 Mtpa is summarised in Table 14.
Table 14 Changes in total ore handling capacity of PI Dampier Ports
Combined ore handling capacity of both PI Dampier Ports EII PP
75 Mtpa 45 Mtpa 30 Mtpa
95 Mtpa 45 Mtpa 50 Mtpa
120 Mtpa 45 Mtpa 75 Mtpa
145 Mtpa 45 Mtpa 100 Mtpa
For example, references in this document to a total throughput (of both Ports) of 145 Mtpa imply a throughput of 100 Mtpa for the PP Port.
The estimation of emissions for the proposed increase in capacity at PP for 145 Mtpa ideally required hourly simulation data at that capacity to provide a realistic correlation in time between the emissions of the different ore handling activities. PI were unable to provide this type of data, however it was advised that the current ore handling operation at EII would be the best available approximation. This is because the 2005 throughput at EII was 45 Mtpa which is a close match to the two “trains” at PP when operating at 100 Mtpa (ie 50 Mtpa each train).
For 145 Mtpa, the hourly operating factor for EII over 2005 was therefore multiplied by 1.11 (=50/45). This becomes a little unrealistic for hours when the equipment is already operating for 100% of the hour (ie it’s not really possible to run for more than one hour within an hour).
Also for 145 Mtpa, the EII operating profiles for 2005 were followed for the CD3P and CD4P circuits at the same time, and for the SL2P and SL3P circuits at the same time. In other words, both car dumpers at PP and their associated equipment were assumed to be operating in synchronisation; similarly, both ship loaders at PP and their associated equipment were assumed to be operating in synchronisation. This could lead to an overestimate of the highest predicted dust levels because it is more likely that the CD3P and CD4P circuits will operate independently of each other and similarly for the SL2P and SL3P circuits.
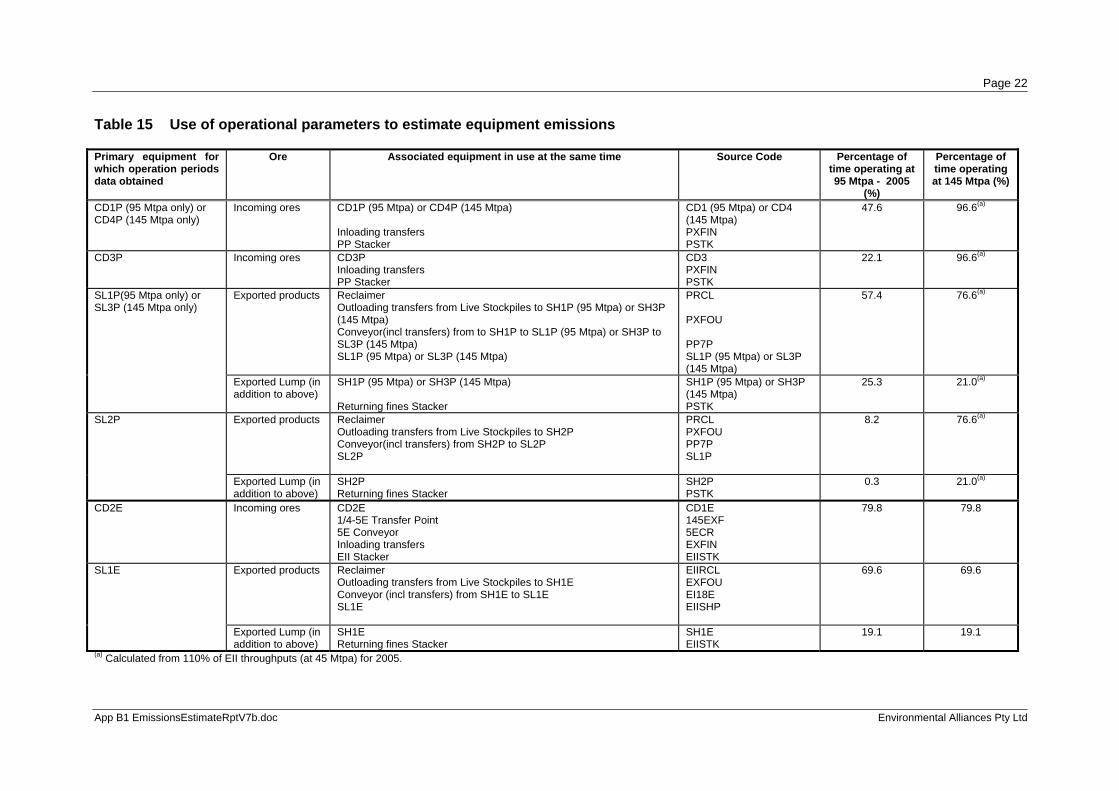
The operating frequencies for 95 Mtpa and 145 Mtpa are summarised in Table 15.
Page 22
App B1 EmissionsEstimateRptV7b.doc Environmental Alliances Pty Ltd
Table 15 Use of operational parameters to estimate equipment emissions
Primary equipment for which operation periods data obtained
Ore Associated equipment in use at the same time Source Code Percentage of time operating at 95 Mtpa - 2005
(%)
Percentage of time operating at 145 Mtpa (%)
CD1P (95 Mtpa only) or CD4P (145 Mtpa only)
Incoming ores CD1P (95 Mtpa) or CD4P (145 Mtpa) Inloading transfers PP Stacker
CD1 (95 Mtpa) or CD4 (145 Mtpa) PXFIN PSTK
47.6 96.6(a)
CD3P Incoming ores CD3P Inloading transfers PP Stacker
CD3 PXFIN PSTK
22.1 96.6(a)
Exported products Reclaimer Outloading transfers from Live Stockpiles to SH1P (95 Mtpa) or SH3P (145 Mtpa) Conveyor(incl transfers) from to SH1P to SL1P (95 Mtpa) or SH3P to SL3P (145 Mtpa) SL1P (95 Mtpa) or SL3P (145 Mtpa)
PRCL PXFOU PP7P SL1P (95 Mtpa) or SL3P (145 Mtpa)
57.4 76.6(a) SL1P(95 Mtpa only) or SL3P (145 Mtpa only)
Exported Lump (in addition to above)
SH1P (95 Mtpa) or SH3P (145 Mtpa) Returning fines Stacker
SH1P (95 Mtpa) or SH3P (145 Mtpa) PSTK
25.3 21.0(a)
Exported products Reclaimer Outloading transfers from Live Stockpiles to SH2P Conveyor(incl transfers) from SH2P to SL2P SL2P
PRCL PXFOU PP7P SL1P
8.2 76.6(a) SL2P
Exported Lump (in addition to above)
SH2P Returning fines Stacker
SH2P PSTK
0.3 21.0(a)
CD2E Incoming ores CD2E 1/4-5E Transfer Point 5E Conveyor Inloading transfers EII Stacker
CD1E 145EXF 5ECR EXFIN EIISTK
79.8 79.8
Exported products Reclaimer Outloading transfers from Live Stockpiles to SH1E Conveyor (incl transfers) from SH1E to SL1E SL1E
EIIRCL EXFOU EI18E EIISHP
69.6 69.6 SL1E
Exported Lump (in addition to above)
SH1E Returning fines Stacker
SH1E EIISTK
19.1 19.1
(a) Calculated from 110% of EII throughputs (at 45 Mtpa) for 2005.
Page 23
App B1 EmissionsEstimateRptV7b.doc Environmental Alliances Pty Ltd
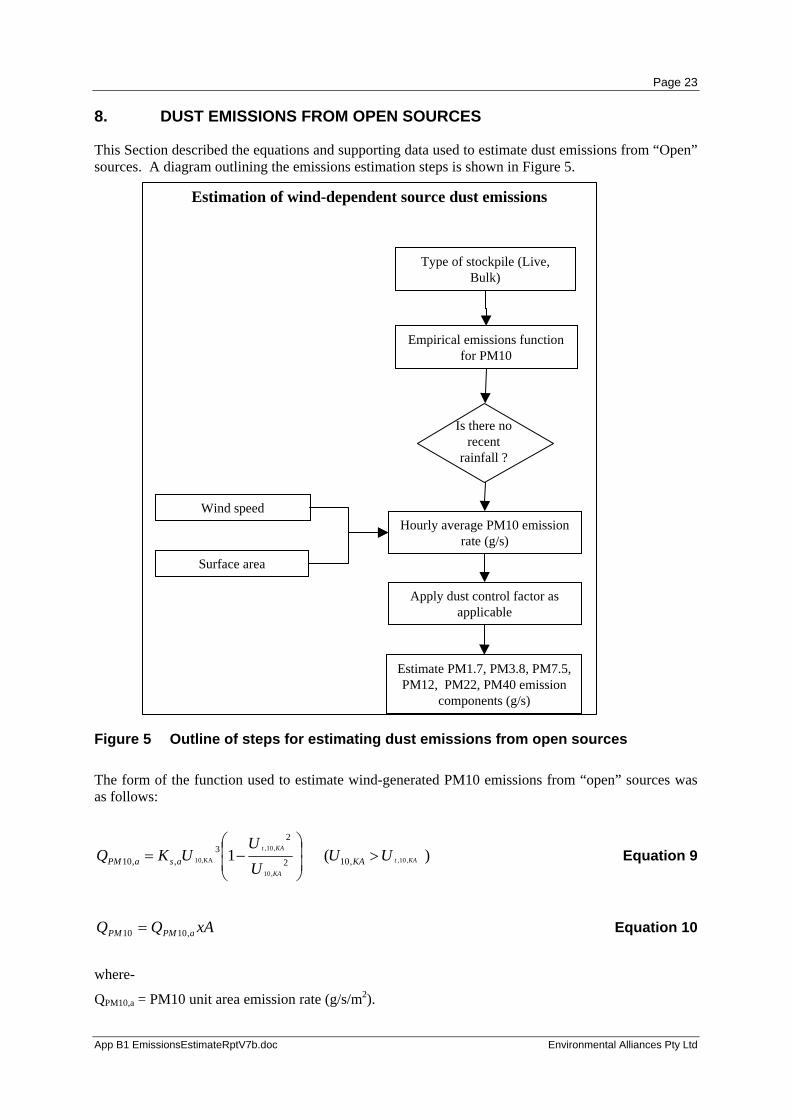
8. DUST EMISSIONS FROM OPEN SOURCES
This Section described the equations and supporting data used to estimate dust emissions from “Open” sources. A diagram outlining the emissions estimation steps is shown in Figure 5.
Figure 5 Outline of steps for estimating dust emissions from open sources
The form of the function used to estimate wind-generated PM10 emissions from “open” sources was as follows:
)( 1 ,10,
,10
,10,
KA10, ,102
23
,,10 KAt
KA
KAt UUUU
UKQ KAasaPM >⎟⎟⎠
⎞⎜⎜⎝
⎛−= Equation 9
xAQQ aPMPM ,1010 = Equation 10
where-
QPM10,a = PM10 unit area emission rate (g/s/m2).
Estimation of wind-dependent source dust emissions
Type of stockpile (Live,Bulk)
Surface area
Wind speed
Estimate PM1.7, PM3.8, PM7.5,PM12, PM22, PM40 emission
components (g/s)
Hourly average PM10 emissionrate (g/s)
Empirical emissions functionfor PM10
Is there norecent
rainfall ?
Apply dust control factor asapplicable

Page 24
App B1 EmissionsEstimateRptV7b.doc Environmental Alliances Pty Ltd
Ks,a = Site specific empirical constant (g.s2/m5).
U10,KA = Wind speed measured at 10 m at Karratha Airport (m/s).
Ut,10,KA = Wind speed threshold for lift off of the material expressed in terms of wind speed measured at 10 m (m/s).
A = Source surface area (m2).
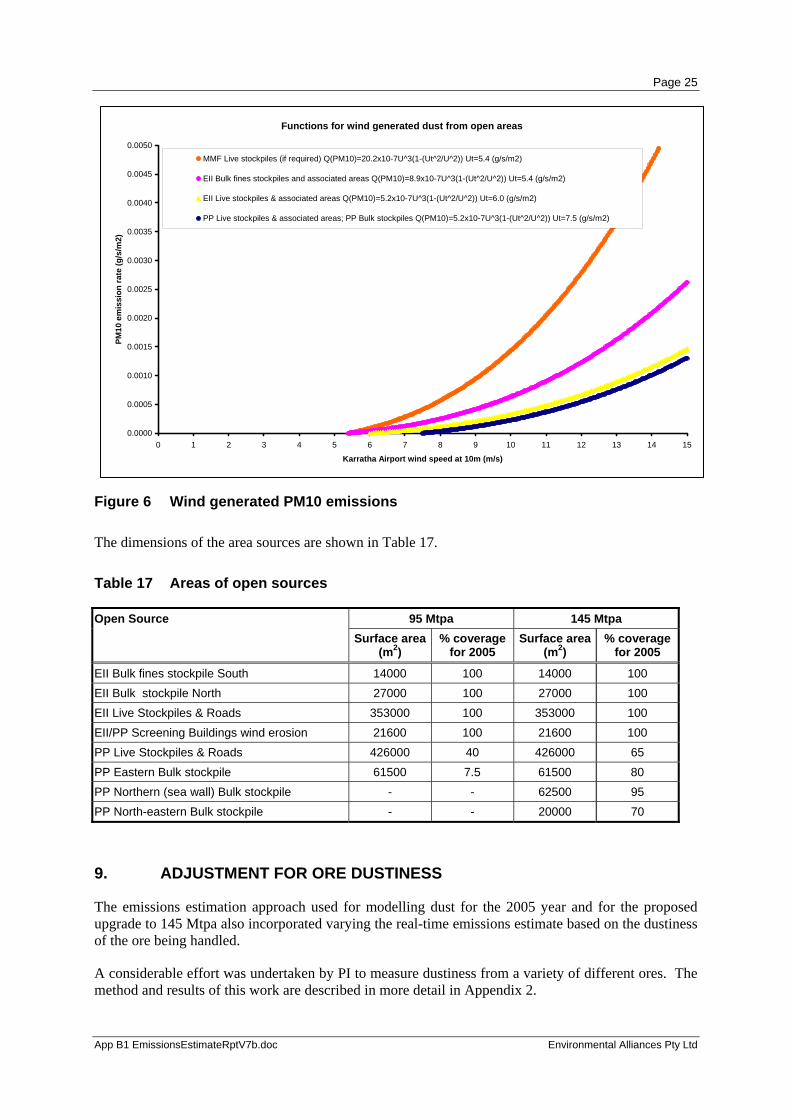
The values of Ks,a and Ut,10,KA for the major wind-dependent dust sources are shown in Table 16. The application of the wind-generated function using these constants is illustrated in Figure 6.
Table 16 Unit area empirically derived parameters for wind generated dust lift-off
Open Source Ks,a (g.s2/m5) Ut,10,KA (m/s)
EII Live Stockpiles & Roads 5.2 x 10⁻⁷ 6.0(c) PP Live Stockpiles & Roads 5.2 x 10⁻⁷ 7.5 PP Bulk stockpiles 5.2 x 10⁻⁷ 7.5 EII Bulk fines stockpile South and EII bulk stockpile North 8.9 x 10⁻⁷ 5.4 EII/PP Screening Buildings wind erosion 9.7 x 10⁻⁷ 5.4 EII conveyor from Screening Building to shiploader jetty (18E)(b)
9.7 x 10⁻⁷ 5.4
PP conveyor from SH1P to SL jetty (7P) (b) 9.7 x 10⁻⁷ 5.4 PP MMF Live Stockpiles (if required)(a) 20.2 x 10⁻⁷ 5.4 (a) Based on wind tunnel testing of dustiness assuming no water cannon dust suppression (SKM 2003 pers com). (b) Source added following field sampling May 2004 (EA 2004). (c) Emission function from SKM (2007).
Page 25
App B1 EmissionsEstimateRptV7b.doc Environmental Alliances Pty Ltd
Figure 6 Wind generated PM10 emissions
The dimensions of the area sources are shown in Table 17.
Table 17 Areas of open sources
95 Mtpa 145 Mtpa Open Source Surface area
(m2) % coverage
for 2005 Surface area
(m2) % coverage
for 2005
EII Bulk fines stockpile South 14000 100 14000 100 EII Bulk stockpile North 27000 100 27000 100 EII Live Stockpiles & Roads 353000 100 353000 100 EII/PP Screening Buildings wind erosion 21600 100 21600 100 PP Live Stockpiles & Roads 426000 40 426000 65 PP Eastern Bulk stockpile 61500 7.5 61500 80 PP Northern (sea wall) Bulk stockpile - - 62500 95 PP North-eastern Bulk stockpile - - 20000 70
9. ADJUSTMENT FOR ORE DUSTINESS
The emissions estimation approach used for modelling dust for the 2005 year and for the proposed upgrade to 145 Mtpa also incorporated varying the real-time emissions estimate based on the dustiness of the ore being handled.
A considerable effort was undertaken by PI to measure dustiness from a variety of different ores. The method and results of this work are described in more detail in Appendix 2.
Functions for wind generated dust from open areas
0.0000
0.0005
0.0010
0.0015
0.0020
0.0025
0.0030
0.0035
0.0040
0.0045
0.0050
0 1 2 3 4 5 6 7 8 9 10 11 12 13 14 15
Karratha Airport wind speed at 10m (m/s)
PM10
em
issi
on ra
te (g
/s/m
2)
MMF Live stockpiles (if required) Q(PM10)=20.2x10⁻⁷U^3(1-(Ut^2/U^2)) Ut=5.4 (g/s/m2)
EII Bulk fines stockpiles and associated areas Q(PM10)=8.9x10⁻⁷U^3(1-(Ut^2/U^2)) Ut=5.4 (g/s/m2)
EII Live stockpiles & associated areas Q(PM10)=5.2x10⁻⁷U^3(1-(Ut^2/U^2)) Ut=6.0 (g/s/m2)
PP Live stockpiles & associated areas; PP Bulk stockpiles Q(PM10)=5.2x10⁻⁷U^3(1-(Ut^2/U^2)) Ut=7.5 (g/s/m2)
Page 26
App B1 EmissionsEstimateRptV7b.doc Environmental Alliances Pty Ltd
In theory, the relative in-field dustiness from different ores can be estimated from the dustiness/moisture relationship from dustiness testing and the actual ore moisture content. There are historical ore moisture measurements from ex the minesites and pre-shiploading. These data were reviewed but were not considered adequately representative of the ores as they are being handled through the Port. For example, the pre-shiploader moisture measurements at Parker Point are made immediately downstream of a manually operated water spray. The purpose of the measurement is to determine moisture levels of ore on the ship for commercial reasons.
Also, in-field moisture levels of the exposed ore vary considerably through the various stages from dumping, conveying to stockpiles, storage, reclaiming/conveying from the stockpiles (with screening as required) prior to shiploading. Moisture is added at various stages for dust control purposes, and lost through evaporation. A proper simulation of ore moisture changes during this cycle is complex. While important for accurate dust emissions modelling particularly for short timescales, this task is beyond the scope of what can be achieved at present.
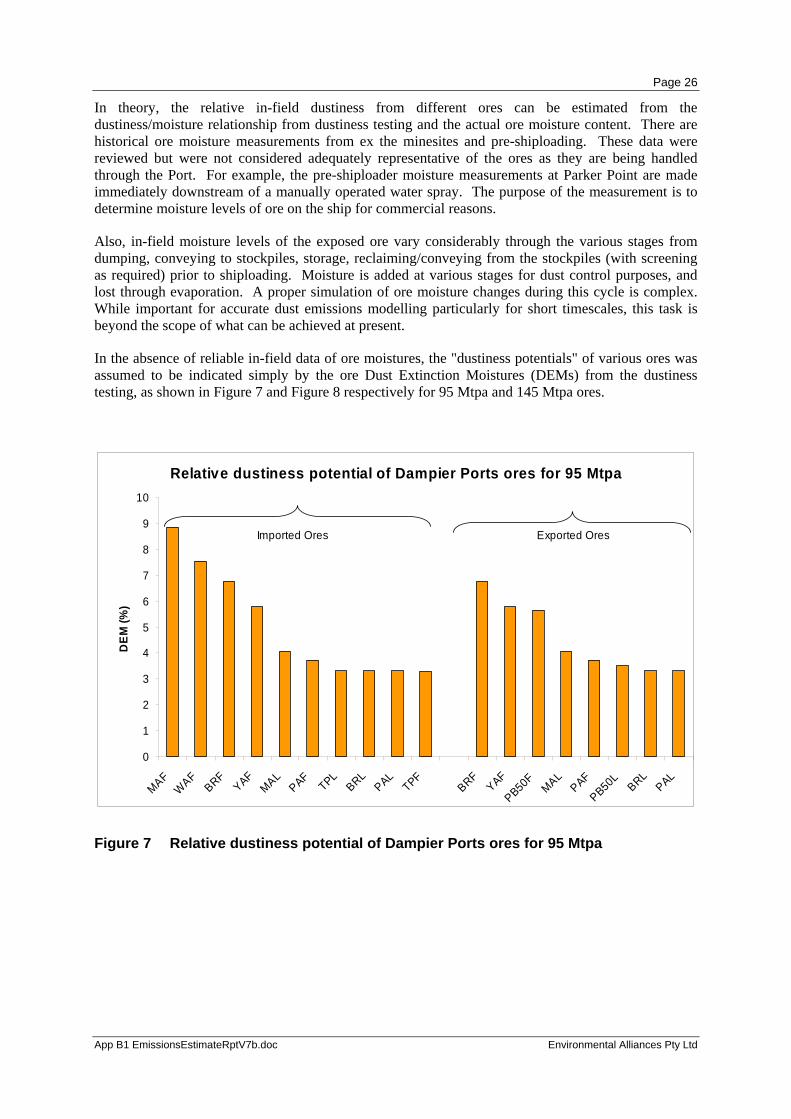
In the absence of reliable in-field data of ore moistures, the "dustiness potentials" of various ores was assumed to be indicated simply by the ore Dust Extinction Moistures (DEMs) from the dustiness testing, as shown in Figure 7 and Figure 8 respectively for 95 Mtpa and 145 Mtpa ores.
Relative dustiness potential of Dampier Ports ores for 95 Mtpa
0
1
2
3
4
5
6
7
8
9
10
MAFWAF
BRFYAF
MALPAF
TPLBRL
PALTPF
BRFYAF
PB50FMAL
PAF
PB50LBRL
PAL
DEM
(%)
Exported OresImported Ores
Figure 7 Relative dustiness potential of Dampier Ports ores for 95 Mtpa
Page 27
App B1 EmissionsEstimateRptV7b.doc Environmental Alliances Pty Ltd
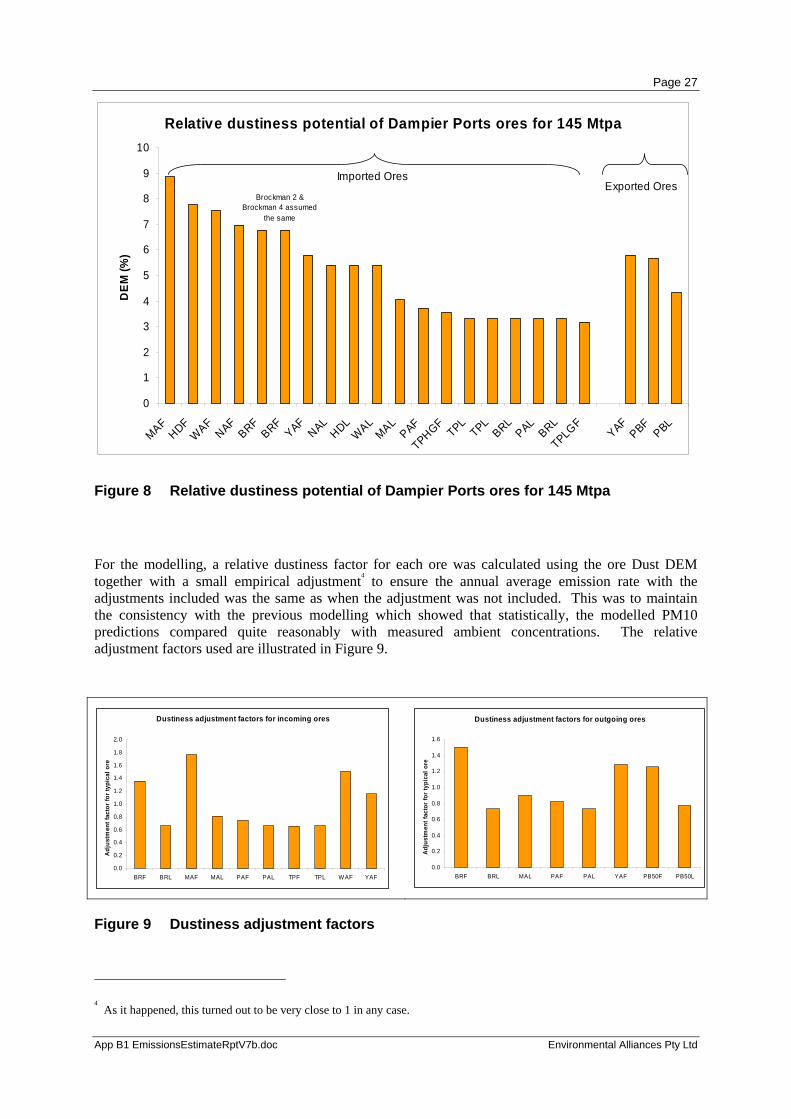
Relative dustiness potential of Dampier Ports ores for 145 Mtpa
0
1
2
3
4
5
6
7
8
9
10
MAFHDF
WAFNAF
BRFBRF
YAFNAL
HDLWAL
MALPAF
TPHGFTPL
TPLBRL
PALBRL
TPLGFYAF
PBFPBL
DE
M (%
)
Brockman 2 & Brockman 4 assumed
the same
Imported OresExported Ores
Figure 8 Relative dustiness potential of Dampier Ports ores for 145 Mtpa
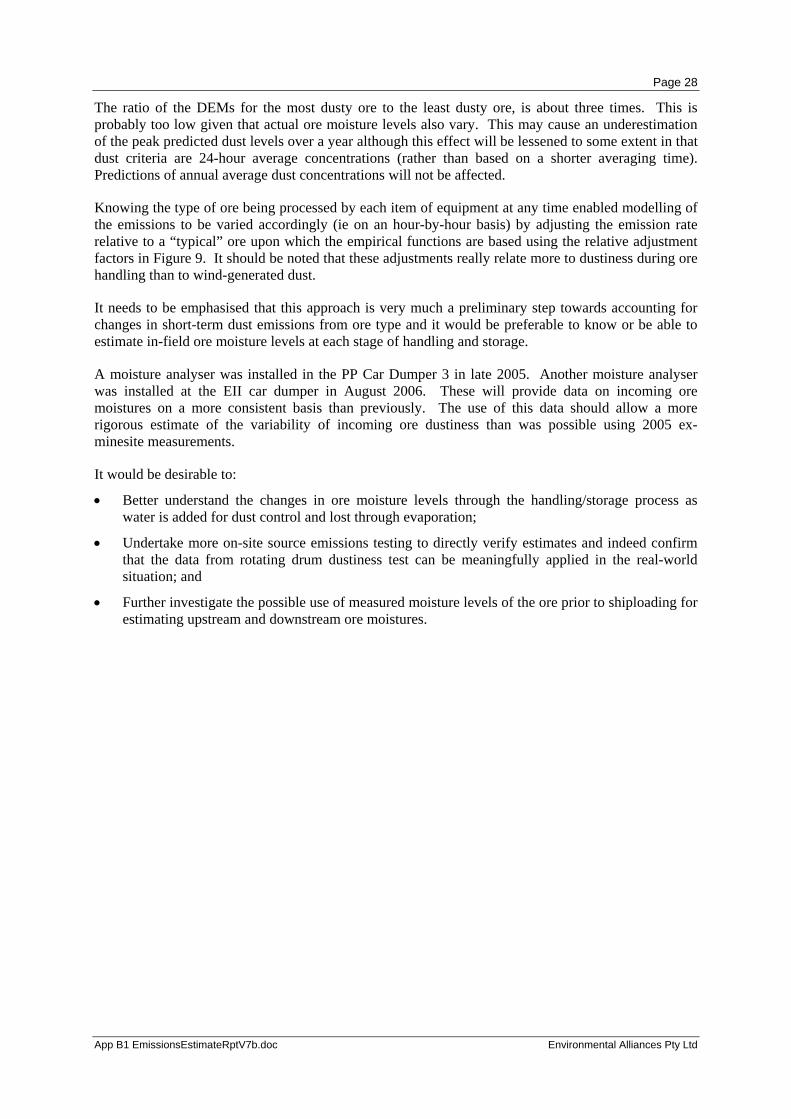
For the modelling, a relative dustiness factor for each ore was calculated using the ore Dust DEM together with a small empirical adjustment4 to ensure the annual average emission rate with the adjustments included was the same as when the adjustment was not included. This was to maintain the consistency with the previous modelling which showed that statistically, the modelled PM10 predictions compared quite reasonably with measured ambient concentrations. The relative adjustment factors used are illustrated in Figure 9.
Dustiness adjustment factors for incoming ores
0.0
0.2
0.4
0.6
0.8
1.0
1.2
1.4
1.6
1.8
2.0
BRF BRL MAF MAL PAF PAL TPF TPL WAF YAF
Adj
ustm
ent f
acto
r for
typi
cal o
re
Dustiness adjustment factors for outgoing ores
0.0
0.2
0.4
0.6
0.8
1.0
1.2
1.4
1.6
BRF BRL MAL PAF PAL YAF PB50F PB50L
Adj
ustm
ent f
acto
r fo
r ty
pica
l ore
Figure 9 Dustiness adjustment factors
4 As it happened, this turned out to be very close to 1 in any case.
Page 28
App B1 EmissionsEstimateRptV7b.doc Environmental Alliances Pty Ltd
The ratio of the DEMs for the most dusty ore to the least dusty ore, is about three times. This is probably too low given that actual ore moisture levels also vary. This may cause an underestimation of the peak predicted dust levels over a year although this effect will be lessened to some extent in that dust criteria are 24-hour average concentrations (rather than based on a shorter averaging time). Predictions of annual average dust concentrations will not be affected.
Knowing the type of ore being processed by each item of equipment at any time enabled modelling of the emissions to be varied accordingly (ie on an hour-by-hour basis) by adjusting the emission rate relative to a “typical” ore upon which the empirical functions are based using the relative adjustment factors in Figure 9. It should be noted that these adjustments really relate more to dustiness during ore handling than to wind-generated dust.
It needs to be emphasised that this approach is very much a preliminary step towards accounting for changes in short-term dust emissions from ore type and it would be preferable to know or be able to estimate in-field ore moisture levels at each stage of handling and storage.
A moisture analyser was installed in the PP Car Dumper 3 in late 2005. Another moisture analyser was installed at the EII car dumper in August 2006. These will provide data on incoming ore moistures on a more consistent basis than previously. The use of this data should allow a more rigorous estimate of the variability of incoming ore dustiness than was possible using 2005 ex-minesite measurements.
It would be desirable to:
• Better understand the changes in ore moisture levels through the handling/storage process as water is added for dust control and lost through evaporation;
• Undertake more on-site source emissions testing to directly verify estimates and indeed confirm that the data from rotating drum dustiness test can be meaningfully applied in the real-world situation; and
• Further investigate the possible use of measured moisture levels of the ore prior to shiploading for estimating upstream and downstream ore moistures.

Page 29
App B1 EmissionsEstimateRptV7b.doc Environmental Alliances Pty Ltd
10. EFFECT ON AVERAGE DUSTINESS FROM CHANGE IN ORE COMPOSITION FOR 145 MTPA
There will be changes to the incoming ore composition when operating at 145 Mtpa since the market specifications will be changing and additional minesites will be contributing to the Port throughputs.
Since the dust emissions functions were determined empirically from a different ore composition, an assessment was undertaken on the potential effect on dustiness from the new composition.
The actual time-varying profiles for incoming and exported ores at 145 Mtpa are not known. Therefore, the dustiness potential of ores at 145 Mtpa throughput compared to 95 Mtpa were estimated using the weighted dustiness’s of all ores for 95 Mtpa and 145 Mtpa (Table 18 and Table 19 respectively).
Table 18 Ore throughputs and DEMS for Dampier Port 2005 (95 Mtpa)
Ore type Ore Abbrev % throughpu
t for Dampier
ports 2005
DEM (%)
Weighted DEM for
throughput (%)
Weighted Avg DEM (%)
Incoming ores Tom Price Lump TPL 11 3.3 0.4 Brockman Lump BRL 5 3.3 0.2
Brockman ores (mostly hematite)
Paraburdoo Lump PAL 12 3.3 0.4 Marra Mamba ores (mostly goethite)
Marandoo Lump MAL 8 4.1 0.3
Tom Price Fines TPF 9 3.3 0.3 Brockman Fines BRF 11 6.8 0.7
Brockman ores (mostly hematite)
Paraburdoo Fines PAF 12 3.7 0.4 Marandoo Fines MAF 9 8.9 0.8 Marra Mamba ores
(mostly goethite) West Angelas Fines WAF 0 7.5 0.0 Channel Iron Deposit ores (pisolites)
Yandi Fines YAF 23 5.8 1.3
4.9
Exported products Brockman Lump BRL 1 3.3 0.0 Brockman ores (mostly
hematite) Paraburdoo Lump PAL 20 3.3 0.7 Marra Mamba ores (mostly goethite)
Marandoo Lump MAL 0 4.1 0.0
Hematites and goethites Pilbara Blend 50 Lump
PB50L 14 3.5 0.5
Brockman Fines BRF 1 6.8 0.0 Brockman ores (mostly hematite) Paraburdoo Fines PAF 21 3.7 0.8 Hematites and goethites Pilbara Blend 50
Fines PB50F 18 5.7 1.0
Channel Iron Deposit ores (pisolites)
Yandi Fines YAF 25 5.8 1.4
4.5
Page 30
App B1 EmissionsEstimateRptV7b.doc Environmental Alliances Pty Ltd
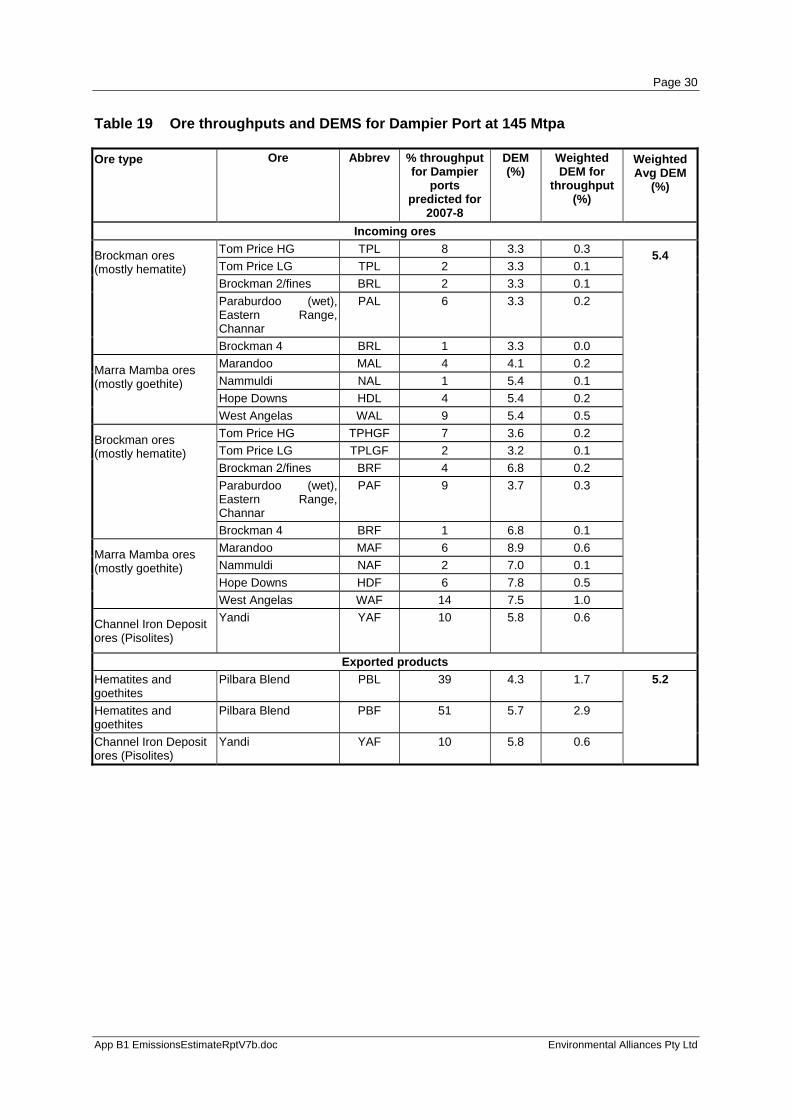
Table 19 Ore throughputs and DEMS for Dampier Port at 145 Mtpa
Ore type Ore Abbrev % throughput for Dampier
ports predicted for
2007-8
DEM (%)
Weighted DEM for
throughput (%)
Weighted Avg DEM
(%)
Incoming ores Tom Price HG TPL 8 3.3 0.3 Tom Price LG TPL 2 3.3 0.1 Brockman 2/fines BRL 2 3.3 0.1 Paraburdoo (wet), Eastern Range, Channar
PAL 6 3.3 0.2
Brockman ores (mostly hematite)
Brockman 4 BRL 1 3.3 0.0 Marandoo MAL 4 4.1 0.2 Nammuldi NAL 1 5.4 0.1 Hope Downs HDL 4 5.4 0.2
Marra Mamba ores (mostly goethite)
West Angelas WAL 9 5.4 0.5 Tom Price HG TPHGF 7 3.6 0.2 Tom Price LG TPLGF 2 3.2 0.1 Brockman 2/fines BRF 4 6.8 0.2 Paraburdoo (wet), Eastern Range, Channar
PAF 9 3.7 0.3
Brockman ores (mostly hematite)
Brockman 4 BRF 1 6.8 0.1 Marandoo MAF 6 8.9 0.6 Nammuldi NAF 2 7.0 0.1 Hope Downs HDF 6 7.8 0.5
Marra Mamba ores (mostly goethite)
West Angelas WAF 14 7.5 1.0
Channel Iron Deposit ores (Pisolites)
Yandi YAF 10 5.8 0.6
5.4
Exported products Hematites and goethites
Pilbara Blend PBL 39 4.3 1.7
Hematites and goethites
Pilbara Blend PBF 51 5.7 2.9
Channel Iron Deposit ores (Pisolites)
Yandi YAF 10 5.8 0.6
5.2
Page 31
App B1 EmissionsEstimateRptV7b.doc Environmental Alliances Pty Ltd
The weighted average dustiness potential of ores at 95 Mtpa is about 4.7% (average of 4.9% and 4.5%). The weighted average dustiness potential of ores at 145 Mtpa is about 5.3% (average of 5.4% and 5.2%).
This implies that on a per tonne basis, ore handling will be on average, about 13% more dusty for 145 Mtpa than 95 Mtpa.
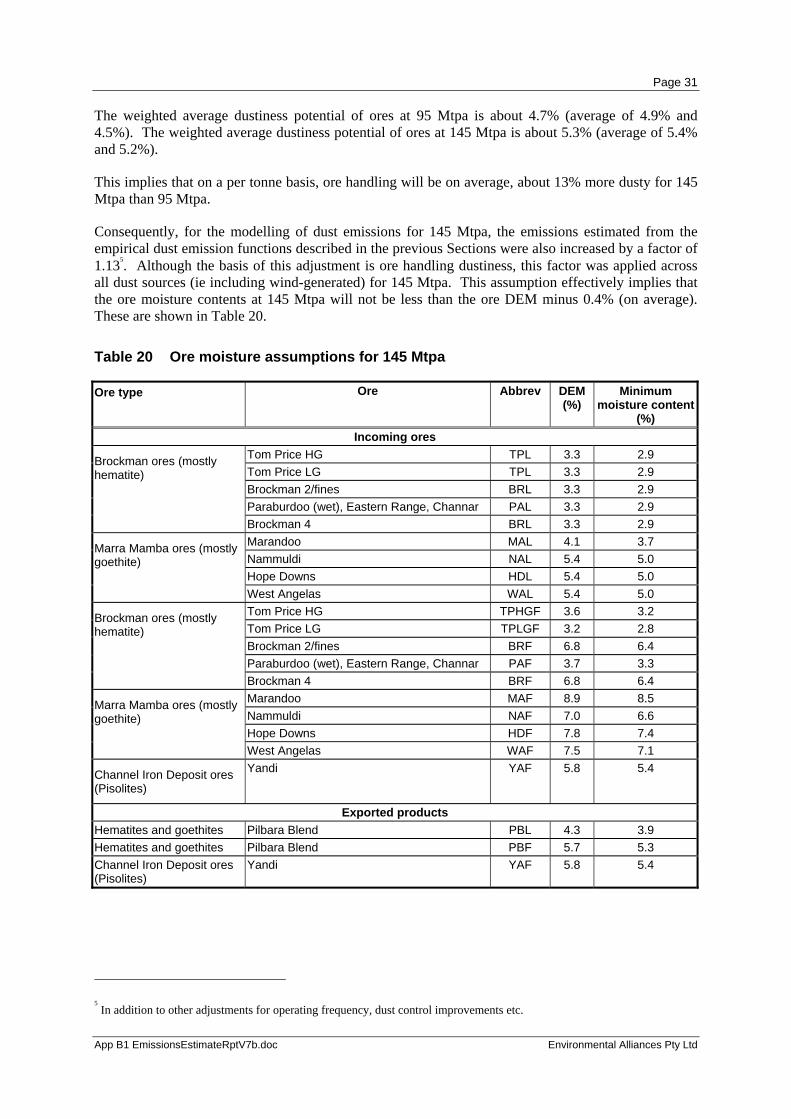
Consequently, for the modelling of dust emissions for 145 Mtpa, the emissions estimated from the empirical dust emission functions described in the previous Sections were also increased by a factor of 1.135. Although the basis of this adjustment is ore handling dustiness, this factor was applied across all dust sources (ie including wind-generated) for 145 Mtpa. This assumption effectively implies that the ore moisture contents at 145 Mtpa will not be less than the ore DEM minus 0.4% (on average). These are shown in Table 20.
Table 20 Ore moisture assumptions for 145 Mtpa
Ore type Ore Abbrev DEM (%)
Minimum moisture content
(%) Incoming ores
Tom Price HG TPL 3.3 2.9 Tom Price LG TPL 3.3 2.9 Brockman 2/fines BRL 3.3 2.9 Paraburdoo (wet), Eastern Range, Channar PAL 3.3 2.9
Brockman ores (mostly hematite)
Brockman 4 BRL 3.3 2.9 Marandoo MAL 4.1 3.7 Nammuldi NAL 5.4 5.0 Hope Downs HDL 5.4 5.0
Marra Mamba ores (mostly goethite)
West Angelas WAL 5.4 5.0 Tom Price HG TPHGF 3.6 3.2 Tom Price LG TPLGF 3.2 2.8 Brockman 2/fines BRF 6.8 6.4 Paraburdoo (wet), Eastern Range, Channar PAF 3.7 3.3
Brockman ores (mostly hematite)
Brockman 4 BRF 6.8 6.4 Marandoo MAF 8.9 8.5 Nammuldi NAF 7.0 6.6 Hope Downs HDF 7.8 7.4
Marra Mamba ores (mostly goethite)
West Angelas WAF 7.5 7.1
Channel Iron Deposit ores (Pisolites)
Yandi YAF 5.8 5.4
Exported products Hematites and goethites Pilbara Blend PBL 4.3 3.9 Hematites and goethites Pilbara Blend PBF 5.7 5.3 Channel Iron Deposit ores (Pisolites)
Yandi YAF 5.8 5.4
5 In addition to other adjustments for operating frequency, dust control improvements etc.
Page 32
App B1 EmissionsEstimateRptV7b.doc Environmental Alliances Pty Ltd
11. ADJUSTMENTS TO EMISSIONS ESTIMATES FOR KARRATHA WIND SPEED AND RAINFALL
11.1 WIND SPEED ADJUSTMENT FOR DPS
The SKM (1998) wind-generated dust emissions functions were based on winds measured at the Karratha airport. For the purpose of estimating emissions from operations and open sources using these functions, the DPS wind speed was increased by 1.3, as in the previous assessment for 95 Mtpa (SKM 2003). This is the average ratio of wind speeds greater than 5 m/s at the Karratha Airport to those measured at the DPS site.
11.2 RAINFALL The hourly emissions were adjusted for rainfall by setting them to zero if the 1-hour rainfall exceeded 0.1 mm based on a rolling 24-hour average. This effectively allowed for a delayed onset of dusty conditions after heavy rainfall. This is more realistic than the US EPA (2003 Ch 13.12.2) approach for unpaved roads of setting a day’s emissions to zero based on daily rainfall exceeding 0.254 mm. A lower value of 0.1 mm was, however, used to indicate the return of dust emissions after rainfall since sources such as roads and some stockpiles may have their surfaces disturbed.
12. CHANGES TO DUST SOURCES FOR 145 MTPA
12.1 ADDITIONAL DUST CONTROLS
The key additional dust controls for which an estimated dust control improvement has been incorporated into the modelling are:
Source Dust Control
• 5E conveyor and causeway
The conveyor will be covered (the previously installed water sprays will be retained). The causeway will be kerbed and the sealed section widened. A new, larger road sweeper will be purchased.
• EII Live Stockpiles Installation of 140 water cannons in stockyard at EII with associated pump stations to maintain delivery and water pressure. Also, chemical dust suppressant dosing is being added to stackers at EII to coat stockpile crests.
• EII roads Sealing of additional roads at EII (eg eastern and western sides of EII causeway, and 5E/6E area) and between six live stockpiles.
• Water cannons at PP Installation of 221 water cannons in live stockpile area at PP with associated pump stations to maintain delivery and water pressure.
Other additional dust controls which have not been incorporated into the modelling are:
• Chemical dosing capability is being added to standpipes at EII and PP for water truck application on roads (via spray bars) and stockpiles (via water truck mounted cannon); and
• Road sealing at PP.
12.2 QUANTIFIED CHANGES IN EMISSION RATES
It needs to be acknowledged that quantifying the dust control benefit of the improvements is a difficult task. For this study, the control factors provided in NPI (2001) have been used as the primary basis of these estimates. In some cases, estimates of control benefits are from test-work. Ultimately, the
Page 33
App B1 EmissionsEstimateRptV7b.doc Environmental Alliances Pty Ltd
estimation of the emissions reduction benefits from the dust control improvements has been made by PI.
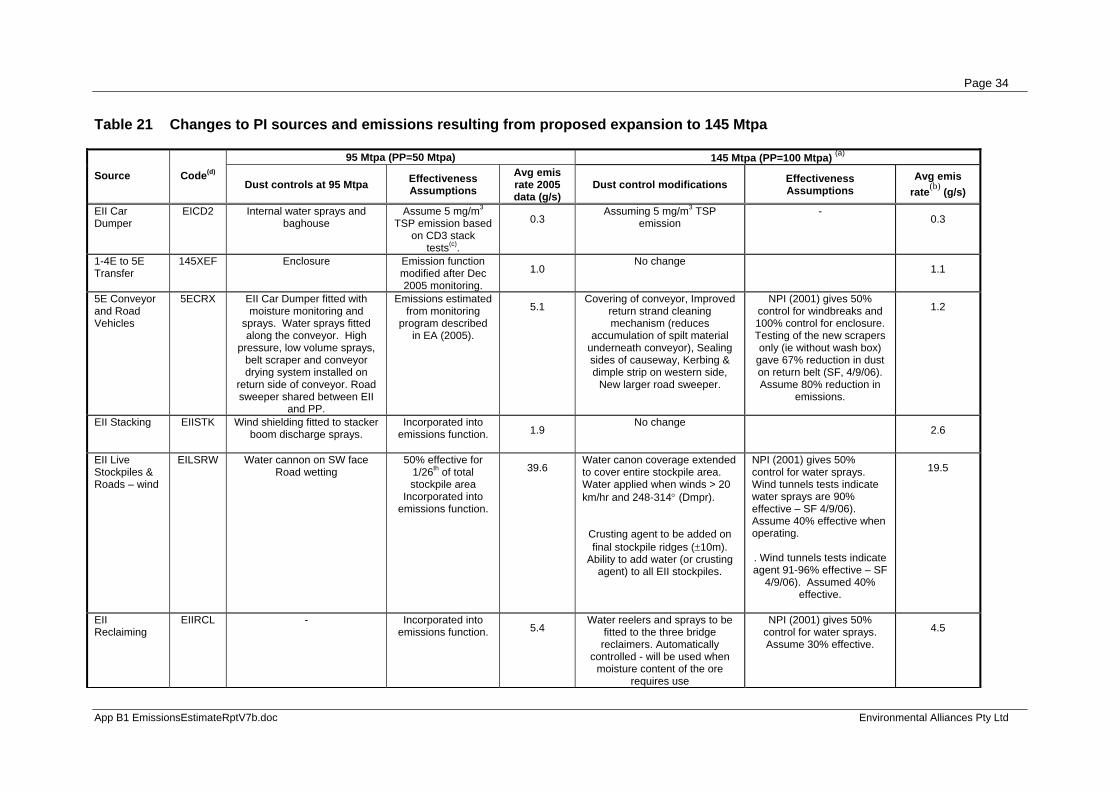
A summary of the estimated dust emissions for each source at 95 Mtpa and 145 Mtpa throughput, together with the additional controls and effectiveness assumptions is shown in Table 21 and Figure 10. From Table 21, the average TSP emissions rate for the proposal is estimated to increase from 160 g/s (actual for 2005) to 196 g/s.
The major changes are for 145 Mtpa compared to 95 Mtpa are:
• The 145 Mtpa emissions estimates for all sources include an additional 13% for increased dust potential from the changes to incoming ores and operating frequencies for a 145 Mtpa throughput rate;
• Dust from the 5E conveyor and road is reduced from 5.1 g/s to 1.2 g/s due to the construction of a cover;
• Wind generated dust from the EII Live stockpiles is reduced from 39.6 g/s to 19.5 g/s due to the installation of water canons;
• The actual PP throughput for 2005 was 37 Mtpa. For an increased throughput at PP to 100 Mtpa, the emissions from each PP activity sources will increase by an additional 100/37 = 2.7 times;
• The PP eastern bulk stockpile coverage for 2005 was only 7.5% (4,600 m2). The total surface area of the PP bulk stockpiles at 145 Mtpa is 120,500 m2, which is a considerable increase.
• The wind generated dust from the bulk stockpiles at PP increases by about 8.0 g/s due to the increase in the number of bulk stockpiles. Note that this increase is exaggerated by the very small bulk stockpile inventory actually held for 2005;
• Dust emissions from the PP bulking operations increases by about 11 g/s due to a three and one-half times increase in activity levels of bulking activity proposed for 145 Mtpa compared to the actual level of bulking for 2005; and
• The increase in dust emissions from the “activity” sources at PP are approximately a pro rata increase in emissions for the amount of ore handled.
Page 34
App B1 EmissionsEstimateRptV7b.doc Environmental Alliances Pty Ltd
Table 21 Changes to PI sources and emissions resulting from proposed expansion to 145 Mtpa
95 Mtpa (PP=50 Mtpa) 145 Mtpa (PP=100 Mtpa) (a) Source Code(d)
Dust controls at 95 Mtpa Effectiveness Assumptions
Avg emis rate 2005 data (g/s)
Dust control modifications Effectiveness Assumptions
Avg emis rate(b) (g/s)
EII Car Dumper
EICD2 Internal water sprays and baghouse
Assume 5 mg/m3 TSP emission based
on CD3 stack tests(c).
0.3 Assuming 5 mg/m3 TSP
emission -
0.3
1-4E to 5E Transfer
145XEF Enclosure Emission function modified after Dec 2005 monitoring.
1.0 No change
1.1
5E Conveyor and Road Vehicles
5ECRX EII Car Dumper fitted with moisture monitoring and
sprays. Water sprays fitted along the conveyor. High
pressure, low volume sprays, belt scraper and conveyor drying system installed on
return side of conveyor. Road sweeper shared between EII
and PP.
Emissions estimated from monitoring
program described in EA (2005).
5.1 Covering of conveyor, Improved
return strand cleaning mechanism (reduces
accumulation of spilt material underneath conveyor), Sealing sides of causeway, Kerbing & dimple strip on western side,
New larger road sweeper.
NPI (2001) gives 50% control for windbreaks and 100% control for enclosure. Testing of the new scrapers only (ie without wash box)
gave 67% reduction in dust on return belt (SF, 4/9/06). Assume 80% reduction in
emissions.
1.2
EII Stacking EIISTK Wind shielding fitted to stacker boom discharge sprays.
Incorporated into emissions function. 1.9
No change 2.6
EII Live Stockpiles & Roads – wind
EILSRW Water cannon on SW face Road wetting
50% effective for 1/26th of total stockpile area
Incorporated into emissions function.
39.6 Water canon coverage extended to cover entire stockpile area. Water applied when winds > 20 km/hr and 248-314° (Dmpr).
Crusting agent to be added on final stockpile ridges (±10m).
Ability to add water (or crusting agent) to all EII stockpiles.
NPI (2001) gives 50% control for water sprays. Wind tunnels tests indicate water sprays are 90% effective – SF 4/9/06). Assume 40% effective when operating.
. Wind tunnels tests indicate agent 91-96% effective – SF
4/9/06). Assumed 40% effective.
19.5
EII Reclaiming
EIIRCL - Incorporated into emissions function. 5.4
Water reelers and sprays to be fitted to the three bridge
reclaimers. Automatically controlled - will be used when
moisture content of the ore requires use
NPI (2001) gives 50% control for water sprays. Assume 30% effective.
4.5

Page 35
App B1 EmissionsEstimateRptV7b.doc Environmental Alliances Pty Ltd
95 Mtpa (PP=50 Mtpa) 145 Mtpa (PP=100 Mtpa) (a) Source Code(d)
Dust controls at 95 Mtpa Effectiveness Assumptions
Avg emis rate 2005 data (g/s)
Dust control modifications Effectiveness Assumptions
Avg emis rate(b) (g/s)
EII bulking operations
EIHB95 Water sprays fitted to dump hopper.
Water sprays from water truck
used on bulking areas
NPI (2001) gives 50% control for water sprays
Assumed 30% effective.
13.6 No change -
15.3
EII Bulk Stockpiles – wind
EIIBW - Incorporated into emissions function. 9.7
No change - 11.0
EII Screening Building
EIISB - Incorporated into emissions function. 10.0
No change - 11.4
EII Screening Building – wind
EIISBW - Incorporated into emissions function. 5.6
Improved sealing between vibration feeder and belt and
around screens to reduce spillage.
Not quantified. 6.3
EII operational areas Vehicles
EIIV Road wetting. As per Table 6 5.5
Road sealing of 15% of EII roads. New, larger road
sweeper. Use of dust retardant on unpaved roads,
Overall dust control benefit = 14% 5.5
EII Transfers Outgoing + Ingoing
EXF Enclosures. Incorporated into emissions function. 3.5
No change - 4.0
EII Conveyors from Screenhouse 1 to SL1E (incl 20E/21E)
EI18E Wetted at Screen House Based on monitoring of PP7P x 3. 4.0
Improved belt cleaner (5E design) and dust de-ionising scrubber (removed fine dust from top of belt after transfer
point).
Tests indicate belt cleaner removes 67% of dust from
return strand. Assume 67% effective.
1.5
EII Ship Loading
EIISHP Boom control. Incorporated into emissions function. 3.6
Fitted with boom sprays (separate project but similar
timing). Also improved transfer belt design to reduce spillage.
Assumed 30% effective. 2.4
PP Car Dumper 1
CD1P Internal water sprays. 50 mg/m3 TSP emission(c). 0.2
- Decommissioned -
PP Car Dumper 3
CD3P Internal water sprays, Baghouse.
Emission rate revised based on 5
mg/m3 TSP emission after stack
testing 2006.
0.1 No change -
0.3
PP Car Dumper 4
CD4P As for CD3P. As for CD3P. -
No change - 0.3

Page 36
App B1 EmissionsEstimateRptV7b.doc Environmental Alliances Pty Ltd
95 Mtpa (PP=50 Mtpa) 145 Mtpa (PP=100 Mtpa) (a) Source Code(d)
Dust controls at 95 Mtpa Effectiveness Assumptions
Avg emis rate 2005 data (g/s)
Dust control modifications Effectiveness Assumptions
Avg emis rate(b) (g/s)
PP Live Stockpiles & Roads
PPLS95 For existing product range, 21 stockpiles are non MMF
Stockpile sprays on north side of 3P/5P and eastern end –
covers total of 9 of these stockpiles.
3 stockpiles are MM with water cannon.
Use of water sprays not yet
implemented. No special MMF
stockpiles. 40% capacity for 2005.
10.8 Total stockpiles=24. Only one lump (PBL) two fines (PBF &
YF) products produced. Water canon coverage extended to cover entire stockpile area.
Water applied when winds > 20 km/hr and 0 – 72° (Dmpr) and
winds > 11 m/s 180 – 360° (King Bay). Average stockpile area
utilisation is 65%.
NPI (2001) gives 50% control for water sprays.
Assume 40% effective when operating.
19.2
PP Stacking PPSTK Manually operated water sprays on stackers.
Incorporated into emissions function. 5.8
No change - 15.0
PP Reclaiming
PRCL(e) - Incorporated into original function 7.5
No change - 19.0
PP Screen House
SH1P - Emission function modified after Dec 2005 monitoring.
4.6 - Decommissioned
-
PP Screen House wind dust
SH1PW - Incorporated into original function 4.9
- Decommissioned -
PP Screen House 2
SH2P Improved efficiency of materials transfers within
structure reduces localised dust deposition.
Assumed to be 0.5 of SH1P emission rate (after SH1P
doubled after Dec 2005 monitoring)
0.0 No change -
2.5
PP Screen House 2 wind dust
SH2PW - Same wind dust function as PPSBW -
Improved efficiency of materials transfers within structure reduces localised dust
deposition. New, larger road sweeper.
50% reduction 2.8
PP Screen House 3
SH3P New for 145 Mtpa - -
As for SH2P.
As for SH2P. 2.5
PP Screen House 3 wind dust
SH3PW New for 145 Mtpa Same wind dust function as PPSBW -
As for SH2PW 50% reduction 2.8
PP operational areas Vehicles
PPV Road wetting As per Table 6 5.5
Minor (est 10% increase in traffic). Extra road sealing. New, larger road sweeper.
No change 6.2
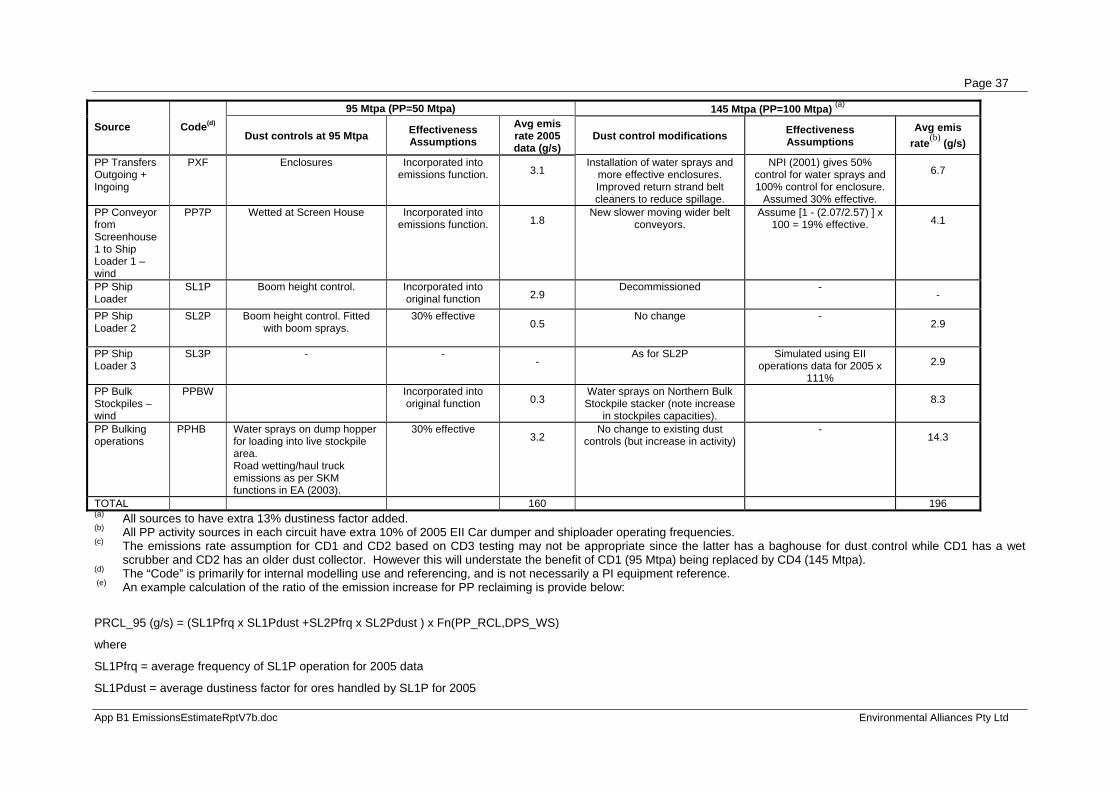
Page 37
App B1 EmissionsEstimateRptV7b.doc Environmental Alliances Pty Ltd
95 Mtpa (PP=50 Mtpa) 145 Mtpa (PP=100 Mtpa) (a) Source Code(d)
Dust controls at 95 Mtpa Effectiveness Assumptions
Avg emis rate 2005 data (g/s)
Dust control modifications Effectiveness Assumptions
Avg emis rate(b) (g/s)
PP Transfers Outgoing + Ingoing
PXF Enclosures Incorporated into emissions function. 3.1
Installation of water sprays and more effective enclosures. Improved return strand belt cleaners to reduce spillage.
NPI (2001) gives 50% control for water sprays and 100% control for enclosure.
Assumed 30% effective.
6.7
PP Conveyor from Screenhouse 1 to Ship Loader 1 – wind
PP7P Wetted at Screen House Incorporated into emissions function. 1.8
New slower moving wider belt conveyors.
Assume [1 - (2.07/2.57) ] x 100 = 19% effective. 4.1
PP Ship Loader
SL1P Boom height control. Incorporated into original function 2.9
Decommissioned - -
PP Ship Loader 2
SL2P Boom height control. Fitted with boom sprays.
30% effective 0.5
No change - 2.9
PP Ship Loader 3
SL3P - - -
As for SL2P Simulated using EII operations data for 2005 x
111% 2.9
PP Bulk Stockpiles – wind
PPBW Incorporated into original function 0.3
Water sprays on Northern Bulk Stockpile stacker (note increase
in stockpiles capacities).
8.3
PP Bulking operations
PPHB Water sprays on dump hopper for loading into live stockpile area. Road wetting/haul truck emissions as per SKM functions in EA (2003).
30% effective
3.2 No change to existing dust
controls (but increase in activity) -
14.3
TOTAL 160 196 (a) All sources to have extra 13% dustiness factor added. (b) All PP activity sources in each circuit have extra 10% of 2005 EII Car dumper and shiploader operating frequencies. (c) The emissions rate assumption for CD1 and CD2 based on CD3 testing may not be appropriate since the latter has a baghouse for dust control while CD1 has a wet
scrubber and CD2 has an older dust collector. However this will understate the benefit of CD1 (95 Mtpa) being replaced by CD4 (145 Mtpa). (d) The “Code” is primarily for internal modelling use and referencing, and is not necessarily a PI equipment reference. (e) An example calculation of the ratio of the emission increase for PP reclaiming is provide below:
PRCL_95 (g/s) = (SL1Pfrq x SL1Pdust +SL2Pfrq x SL2Pdust ) x Fn(PP_RCL,DPS_WS)
where
SL1Pfrq = average frequency of SL1P operation for 2005 data
SL1Pdust = average dustiness factor for ores handled by SL1P for 2005
Page 38
App B1 EmissionsEstimateRptV7b.doc Environmental Alliances Pty Ltd
SL2Pfrq = average frequency of SL2P operation for 2005 data
SL2Pdust = average dustiness factor for ores handled by SL2P for 2005
Fn(PP_RCLDPS_WS) = wind speed dependent emission function for PP reclaimers (this is different than for EII reclaimers)
= (0.574 x 0.986 ) + (0.082 x 1.16) x Fn(DPS_WS)
= 0.661
PRCL_145 (g/s) =1.13 x (2 x SL1Efrq + SL1Edust x 1.11) x Fn(PP_RCL,DPS_WS)
where
1.13 = ore dustiness increase factor for 145 Mtpa ore mix compared to 95 Mtpa ore mix
SL1Efrq = average frequency of SL1E operation for 2005 data
SL1Edust = average dustiness factor for ores handled by SL1E for 2005
1.11 = ratio of 50 Mtpa/45 Mtpa (50 Mtpa is throughput for each PP circuit for 145 Mtpa capacity; 45 Mtpa is actual ore tonnage from EII for 2005)
= 1.13 x (2 x 0.695 x 1.04 x 1.11) x Fn(PP_RCL,DPS_WS)
= 1.81
PRCL_145 / PRCL_95 from above = 1.81/0.661 = 2.7
Ratio of actual emissions = 19.4/7.58 = 2.6
Note that a small difference is possible from different wind speeds occurring at different emission periods.
(Calculation based on data as at 28/11/2006)
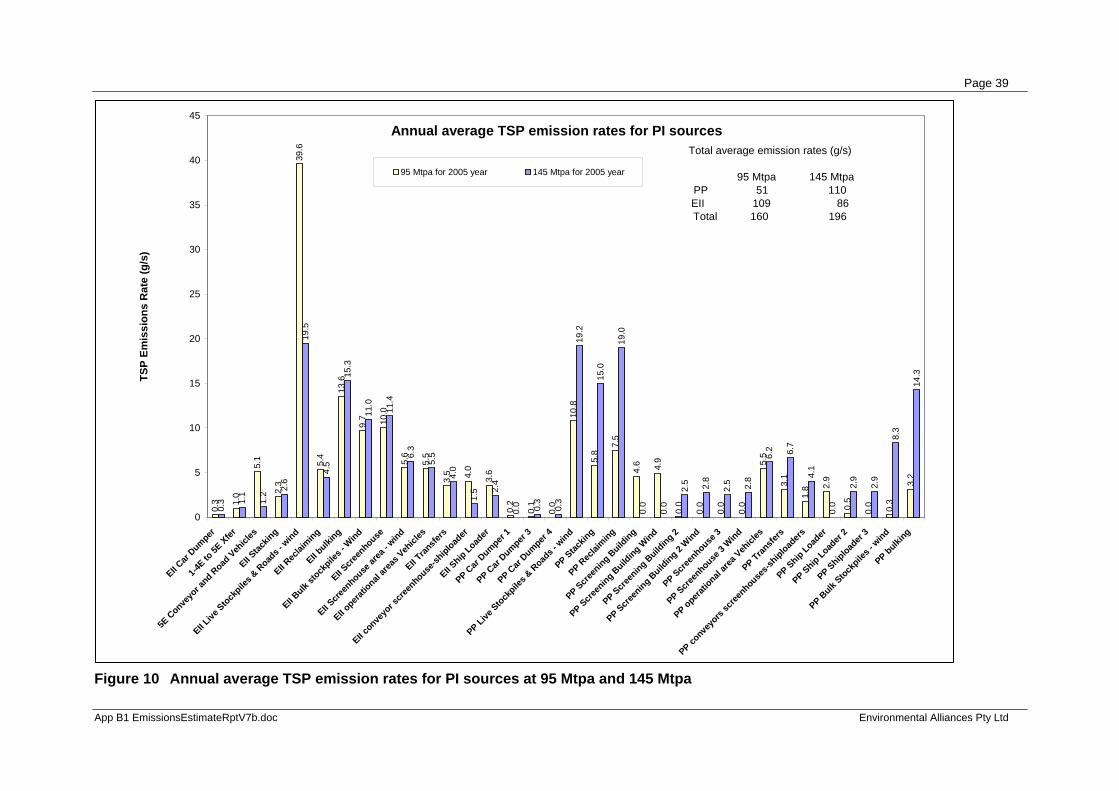
Page 39
App B1 EmissionsEstimateRptV7b.doc Environmental Alliances Pty Ltd
Figure 10 Annual average TSP emission rates for PI sources at 95 Mtpa and 145 Mtpa
Annual average TSP emission rates for PI sources
0.3 1.
0
5.1
2.3
39.6
5.4
13.6
9.7 10
.0
5.6
5.5
3.5 4.0
3.6
0.2
0.1
0.0
10.8
5.8
7.5
4.6 4.9
0.0
0.0
0.0
0.0
5.5
3.1
1.8 2.
9
0.5
0.0 0.3
3.2
0.3 1.
1
1.2 2.
6
19.5
4.5
15.3
11.0
11.4
6.3
5.5
4.0
1.5 2.
4
0.0 0.3
0.3
19.2
15.0
19.0
0.0
0.0
2.5 2.8
2.5 2.8
6.2 6.7
4.1
0.0
2.9
2.9
8.3
14.3
0
5
10
15
20
25
30
35
40
45
EII Car
Dumper
1-4E to
5E Xfer
5E C
onveyo
r and R
oad Veh
icles
EII Stac
king
EII Live
Stockpile
s & R
oads -
wind
EII Rec
laiming
EII bulki
ng
EII Bulk
stock
piles -
Wind
EII Scre
enhouse
EII Scre
enhouse
area
- wind
EII opera
tional
areas
Vehicl
esEII T
ransfe
rs
EII conve
yor s
creen
house-sh
iploader
EII Ship Load
er
PP Car
Dumper 1
PP Car
Dumper 3
PP Car
Dumper 4
PP Live Stock
piles &
Road
s - w
indPP Stac
king
PP Rec
laiming
PP Screen
ing Build
ing
PP Screen
ing Build
ing Wind
PP Screen
ing Build
ing 2
PP Screen
ing Build
ing 2 Wind
PP Screen
house 3
PP Screen
house 3
Wind
PP operatio
nal are
a Veh
icles
PP Transfe
rs
PP conve
yors
scree
nhouses-s
hiploaders
PP Ship Loader
PP Ship Loader
2
PP Shiploader
3
PP Bulk
Stockpile
s - w
indPP bulki
ng
TSP
Emis
sion
s R
ate
(g/s
)
95 Mtpa for 2005 year 145 Mtpa for 2005 year
Total average emission rates (g/s)
95 Mtpa 145 MtpaPP 51 110EII 109 86Total 160 196
Page 40
App B1 EmissionsEstimateRptV7b.doc Environmental Alliances Pty Ltd
13. REFERENCES
Air Assessments, 2005, “Cape Lambert - 2005 Dust Monitoring Review - Prepared for Pilbara Iron Company By Air Assessments”, Draft, June 2005.
BHB Billiton Iron Ore, 2002, “Dust Management Program”, April 2002.
Blockley, A., 2003, pers com, Ausplume meteorological file for Dampier 1999.
Department of Environment (DoE), 2004, “Pilbara Air Quality Summary Report”, Technical Series Report 120, August 2004.
Department of Environment (DoE), 2005, “Western Australia Air Monitoring Report - Written to comply with the National Environment Protection Measure (Ambient Air Quality)”, Technical Series 122, April 2005.
Department of Environment and Conservation NSW (DEC NSW), 2005, “Approved Methods for the Modelling and Assessment of Air Pollutants in New South Wales”, 26 August 2005.
Environ, 2004, “Port Hedland Dust Modelling Assessment for Fortescue Metals Group Limited”, 16 August 2004.
Environment Protection Authority of Victoria (EPAV), “Ausplume Gaussian Plume Dispersion Model - Technical User Manual”, November 2000.
Environmental Alliances, 2004, “Hamersley Iron – Dampier Port Operations – Compliance with Dust Management Conditions in Ministerial Statement of Approval for 95 Mtpa Expansion”, August 2004.
Environmental Alliances, 2005a, “Hamersley Iron – Dampier Port Operations – Monitoring Dust Emissions from the 5E Conveyor and Road”, Prepared for Kellogg Brown & Root Pty Ltd, February 2005.
Environmental Alliances, 2005b, “Dust Dispersion Modelling for Hamersley Iron Dampier Port Expansion to 120 Mtpa”, Version l, Prepared for Sinclair Knight Merz, April 2005.
Environmental Alliances, 2006a, “Dust Dispersion Modelling for Pilbara Iron Dampier Port Expansion to 145 Mtpa (Phase B) – Development of Dust Emissions Estimates”, Prepared for Sinclair Knight Merz, November 2006.
Environmental Alliances, 2006b, “Dust Impact Assessment for Proposed Pilbara Iron Dampier Port Expansion to 145 Mtpa (Phase B) - Dispersion Model Set-Up and Assessment of Performance”, Prepared for Sinclair Knight Merz, November 2006.
National Pollutant Inventory (NPI), 2001, “Emission Estimation Technique Manual for Mining Version 2.3”, December 2001.
National Environment Protection Council (NEPC), 1997, “Draft National Environment Protection Measure and Impact Statement for Ambient Air Quality”, 21 November 1997.
NEPC, 2002, “National Environment Protection (Ambient Air Quality) Measure Impact Statement for PM2.5 Variation Setting a PM2.5 Standard in Australia”, October 2002.
Pacific Air & Environment, 2005, “Assessment of Dust Emissions from the Bauxite Residue Disposal Areas at Worsley Alumina Pty Ltd”, 18 October 2005.

Page 41
App B1 EmissionsEstimateRptV7b.doc Environmental Alliances Pty Ltd
Sinclair Knight Merz (SKM), 1998, “Hamersley Iron Pty Limited – Dust Assessment – Dampier Operations”.
Sinclair Knight Merz (SKM), 2003, “Hamersley Iron – Dampier Port Upgrade to 95 Mtpa Capacity Environmental Protection Statement”, August 2003.
Sinclair Knight Merz (SKM), 2005, “Improvement of NPI Fugitive Particulate Matter Emission Estimation Techniques”, May 2005.
Sinclair Knight Merz (SKM), 2007, “Dust Emissions Inventory - Hamersley Iron Dampier Operations - Ministerial Statement 702, Condition 7-3”, March 2007.
U.S. Environmental Protection Agency, 1998, “Quality Assurance Handbook for Air Pollution Measurement Systems Vol II: Part 1 Ambient Air Quality Monitoring Program Quality System Development”, Research Triangle Park, North Carolina, August 1998.
U.S. Federal Register, 2001, “Part II Environmental Protection Agency 40 CFR Ch. I (7–1–01 Edition) Part 51, Appendix W —Guideline On Air Quality Models”.
United States Environmental Protection Agency (USEPA), 1999, Compilation of Air Pollutant Emissions Factors (AP-42), U.S. Environmental Protection Agency, Research Triangle Park, North Carolina.
US EPA, 1999 ,Guideline on Air Quality Models, US EPA, 40 CFR Ch I (7-1-99 Edition).
Page 42
App B1 EmissionsEstimateRptV7b.doc Environmental Alliances Pty Ltd
14. GLOSSARY
General terms [PM10], [TSP] abbreviations for PM10 concentration and TSP concentration μg/m3 micrograms per cubic metre of air.
μm microns or micrometers. AB PI Parker Point Administration Building – dust monitoring site. BJ Dampier Boat Jetty – dust monitoring site. DoE Department of Environment – formerly Department of Environmental
Protection DMP PI’s Dust Management Plan for its Dampier operations. DPS Dampier Primary School - dust and meteorological monitoring site. E-BAM Model of Beta Attenuation Monitor– instrument used for the continuous
measurement of airborne particles. EII East Intercourse Island (operations). equivalent aerodynamic diameter
the diameter of a particle which exhibits the same aerodynamic behaviour as a spherical particle with a density of 1000 kilograms per cubic metre.
g/cm3 grams per cubic centimetre. PI Pilbara Iron Pty Limited. HVAS High volume air sampler KEPP Kwinana Environmental Protection Policy taken to jointly comprise the
Environmental Protection (Kwinana) (Atmospheric Waste) Policy 1992 and Environmental Protection (Kwinana) (Atmospheric Waste) Regulations 1992.
km kilometres. kt kilotonnes m metres. MMF Marra Mamba Fines ore m/s metres per second. Mtpa Million tonnes per annum. NEPM National Environment Protection Measure for Ambient Air Quality
dated 26 June 1998.
percentile the division of a distribution into 100 groups having equal frequencies (calculated using MS Excel®)
PM10 Airborne particles with an equivalent aerodynamic diameter of less than 10 μm.
PM2.5 Airborne particles with an equivalent aerodynamic diameter of less than 2.5 μm.
PM50 Airborne particles with an equivalent aerodynamic diameter of less than 50 μm.
PP Parker Point (operations).
TEOM Tapered Element Oscillating MicroBalance – instrument used for the continuous measurement of airborne particles.
TSP Total Suspended Particulates, for the purposes of this document,
Page 43
App B1 EmissionsEstimateRptV7b.doc Environmental Alliances Pty Ltd
considered to be equivalent to PM50. Wind direction references NNE north-north-east NE north-east ENE east-north-east ESE east-south-east SE south-east SSE south-south-east SSW south-south-west SW south-west WSW west-south-west WNW west-north-west NW north-west NNW north-north-west PI sources at PP at 95 Mtpa or 145 Mtpa
CD1P Car Dumper 1 – located at Parker Point (to be decommissioned and replaced by CD4P)
CD2E Car Dumper 2 – located at East Intercourse Island CD3P Car Dumper 3 – located at Parker Point (part of 95 Mtpa expansion) CD4P Car Dumper 4 – located at Parker Point (part of 145 Mtpa expansion) SH1E Screenhouse 1 – located at EII
SH1P Screenhouse 1 – located at Parker Point (to be decommissioned and replaced by SH3P)
SH2P Screenhouse 2 – located at Parker Point (part of 95 Mtpa expansion) SH3P Screenhouse 3 – located at Parker Point (part of 145 Mtpa expansion) SL1E Ship Loader 1 – located at EII
SL1P Ship Loader 1 – located at Parker Point (to be decommissioned and replaced by SL3P)
SL2P Ship Loader 2 - located at Parker Point (part of 95 Mtpa expansion) SL3P Ship Loader 3 - located at Parker Point (part of 145 Mtpa expansion) PPLS PP Live Stockpiles & Roads – Wind-generated dust PSTK PP Stacking PRCL PP Reclaiming SH1PW PP Screening Building Wind generated dust from immediate surrounds SH2PW PP Screening Building 2 Wind generated dust from immediate surrounds SH3PW PP Screenhouse 3 Wind generated dust PPV PP operational area Vehicles PXF PP Transfers PP7P PP conveyors screenhouses-shiploaders PPBW PP Bulk Stockpiles - wind PPHB PP bulking (loading/unloading, haul trucks, dozing) PI sources at EII at 95 Mtpa or 145 Mtpa
Page 44
App B1 EmissionsEstimateRptV7b.doc Environmental Alliances Pty Ltd
EICD2 EII Car Dumper 145EXF 1-4E to 5E Tansfer on mainland 5ECRX 5E Conveyor, Road and Vehicles EIISTK EII Stacking EILSR EII Live Stockpiles & Roads - Wind generated dust EIIRCL EII Reclaiming EIHB EII bulking (loading/unloading, haul trucks, dozing) EIIBW EII Bulk stockpiles - Wind EIISB EII Screenhouse EIISBW EII Screenhouse area - Wind generated dust from immediate surrounds EIIV EII operational areas Vehicles EXF EII Transfers EI18E EII conveyor screenhouse-shiploader EIISHP EII Ship Loader
Page 45
App B1 EmissionsEstimateRptV7b.doc Environmental Alliances Pty Ltd
Appendix 1 Results of source monitoring program 7-10/12/2005
Methodology
On-site dust monitoring to improve the emissions estimates from specific sources was undertaken over 7-10/12/2005.
Two types of techniques were used:
Profiling
Profiling involves taking continuous dust measurements while moving laterally through the plume. Ideally, locations for the start and end of each profile are where dust is at background levels so that the resultant profile resembles a gaussian shaped curve where the peak is the plume centre-line concentration and the outer extents either side of the “plume” curve are background concentrations. An average profile for up to one hour is obtained by averaging the dust measurements at each location from repeated profiles. This can also be used to refine the modelled source dimensions and initial plume dispersion spread parameters. For back-calculating the source emission rate, a number of discrete receptors are defined along the profile and the model’s predictions at each receptor compared to the concentration at that location indicated by the measured profile curve.
When comparing the predicted profile to the measured profile, it is not particularly important that the profiles are a little horizontally off-set. This can result from a small misrepresentation of the actual wind direction has minimal effect on the expected correspondence of the profiles in other aspects.
The profiling method provides data which can be depicted in pictorial form which facilitates a review of the “reasonableness” of the data and that the measurements corrected targeted the required source. Profiling does however, require considerable work.
Stationary sampling
This involves simply monitoring downwind of the source for a period of time to determine the average concentrations at that location. The model’s predicted concentrations at that location are simply compared to the measurements, and the source emission rate can be scaled accordingly. The problem with using a single measurement location to back-calculate a source emission is that it is difficult to know for sure the whereabouts of the sampling location along the cross-wind axis of the plume due to the uncertainty of the representivity of the wind direction. This can lead to very significant errors in the back-calculated source emission rate – particularly for narrow plumes, and is not a recommended approach.
Background concentration estimates
The background concentrations from profiling were estimated from the concentrations at the outer extent of the profile. Background concentrations from stationary monitoring were estimated from the 5th percentile of the sampled concentrations.
Meteorological data
The meteorological data set used for modelling was that developed using Calmet for annual modelling of the 2005 year. In this way, the adjustments to meteorological data itself, source configurations, local influences on dispersion etc are matched to the source configuration used to predict dust impacts over the course of the full year.
Page 46
App B1 EmissionsEstimateRptV7b.doc Environmental Alliances Pty Ltd
Form of exponent in wind-dependent source emission rate
For determining the emission rates of sources that do not have emissions functions from historical monitoring, sources that have emissions open to the exposed air (stackers, reclaimer etc) are assumed to have their emissions related to wind speed through a power law with an exponent of 1.4. For sources that more enclosed (eg transfer points, screening building etc), the exponent assumed is 0.5 (ie wind speed is likely to have a relatively lesser influence on the emission rate).
Results
The results for individual sources follow.
In the above and following profile Figures, the black line shows the measured PM10 concentration profile. The blue line shows the modelled profile based on previously assumed emissions function for the prevailing wind conditions, corrected for ore-specific dustiness. The green line shows the predicted concentrations using the revised emission function which adjusts the predicted concentrations half-way towards the measured concentrations.
The revised K factors for wind speeds referenced to the DPS site are shown in Table 23 at the end of this Section.
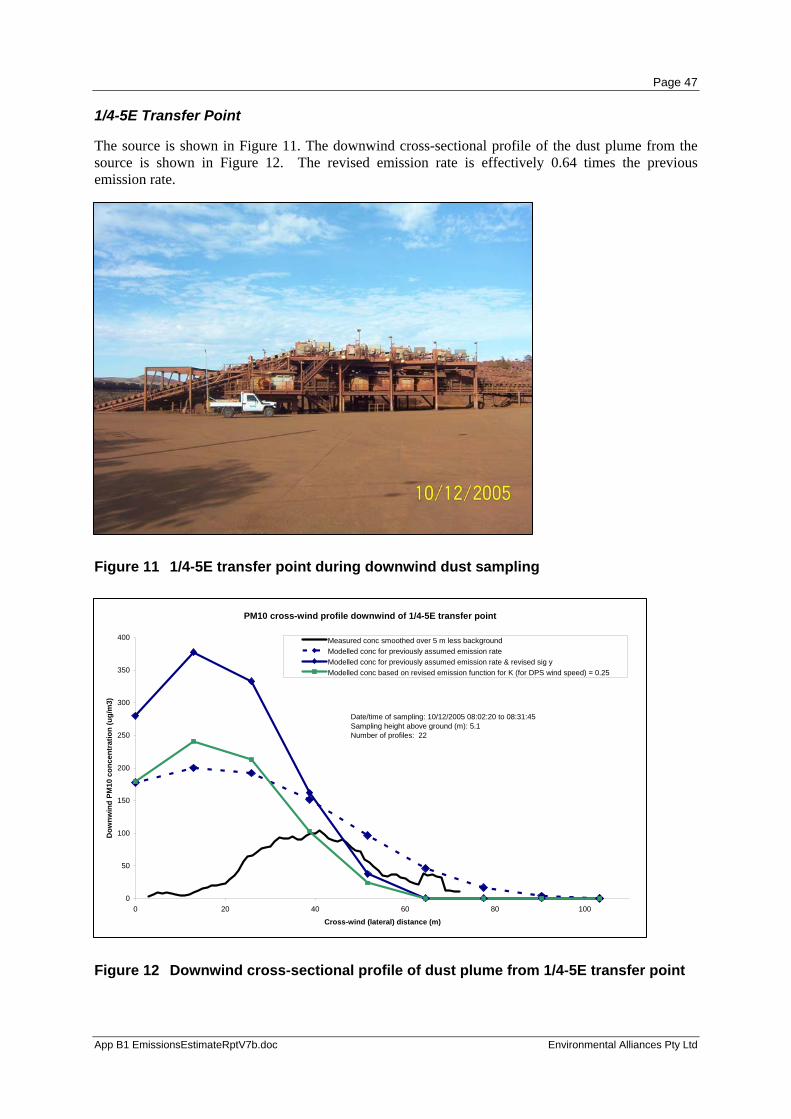
Page 47
App B1 EmissionsEstimateRptV7b.doc Environmental Alliances Pty Ltd
1/4-5E Transfer Point
The source is shown in Figure 11. The downwind cross-sectional profile of the dust plume from the source is shown in Figure 12. The revised emission rate is effectively 0.64 times the previous emission rate.
Figure 11 1/4-5E transfer point during downwind dust sampling
PM10 cross-wind profile downwind of 1/4-5E transfer point
0
50
100
150
200
250
300
350
400
0 20 40 60 80 100
Cross-wind (lateral) distance (m)
Dow
nwin
d PM
10 c
once
ntra
tion
(ug/
m3)
Measured conc smoothed over 5 m less backgroundModelled conc for previously assumed emission rateModelled conc for previously assumed emission rate & revised sig yModelled conc based on revised emission function for K (for DPS wind speed) = 0.25
Date/time of sampling: 10/12/2005 08:02:20 to 08:31:45Sampling height above ground (m): 5.1Number of profiles: 22
Figure 12 Downwind cross-sectional profile of dust plume from 1/4-5E transfer point
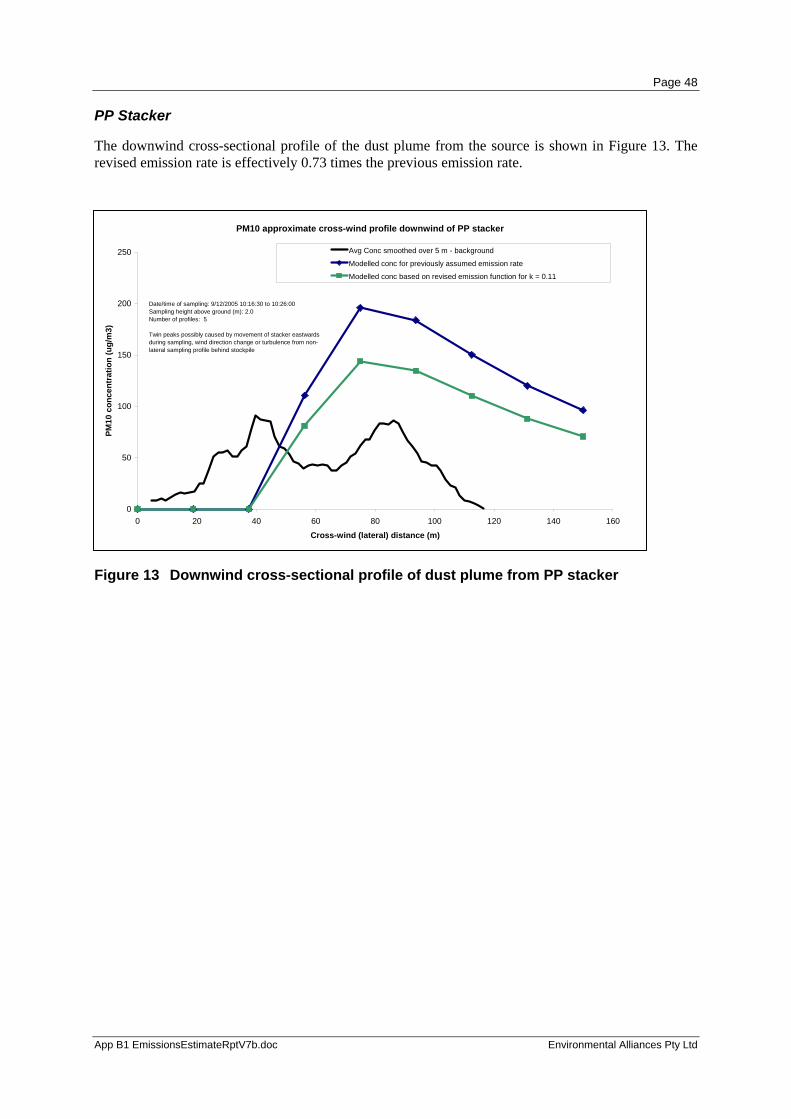
Page 48
App B1 EmissionsEstimateRptV7b.doc Environmental Alliances Pty Ltd
PP Stacker
The downwind cross-sectional profile of the dust plume from the source is shown in Figure 13. The revised emission rate is effectively 0.73 times the previous emission rate.
Figure 13 Downwind cross-sectional profile of dust plume from PP stacker
PM10 approximate cross-wind profile downwind of PP stacker
0
50
100
150
200
250
0 20 40 60 80 100 120 140 160
Cross-wind (lateral) distance (m)
PM10
con
cent
ratio
n (u
g/m
3)
Avg Conc smoothed over 5 m - background
Modelled conc for previously assumed emission rate
Modelled conc based on revised emission function for k = 0.11
Date/time of sampling: 9/12/2005 10:16:30 to 10:26:00Sampling height above ground (m): 2.0Number of profiles: 5
Twin peaks possibly caused by movement of stacker eastwards during sampling, wind direction change or turbulence from non-lateral sampling profile behind stockpile
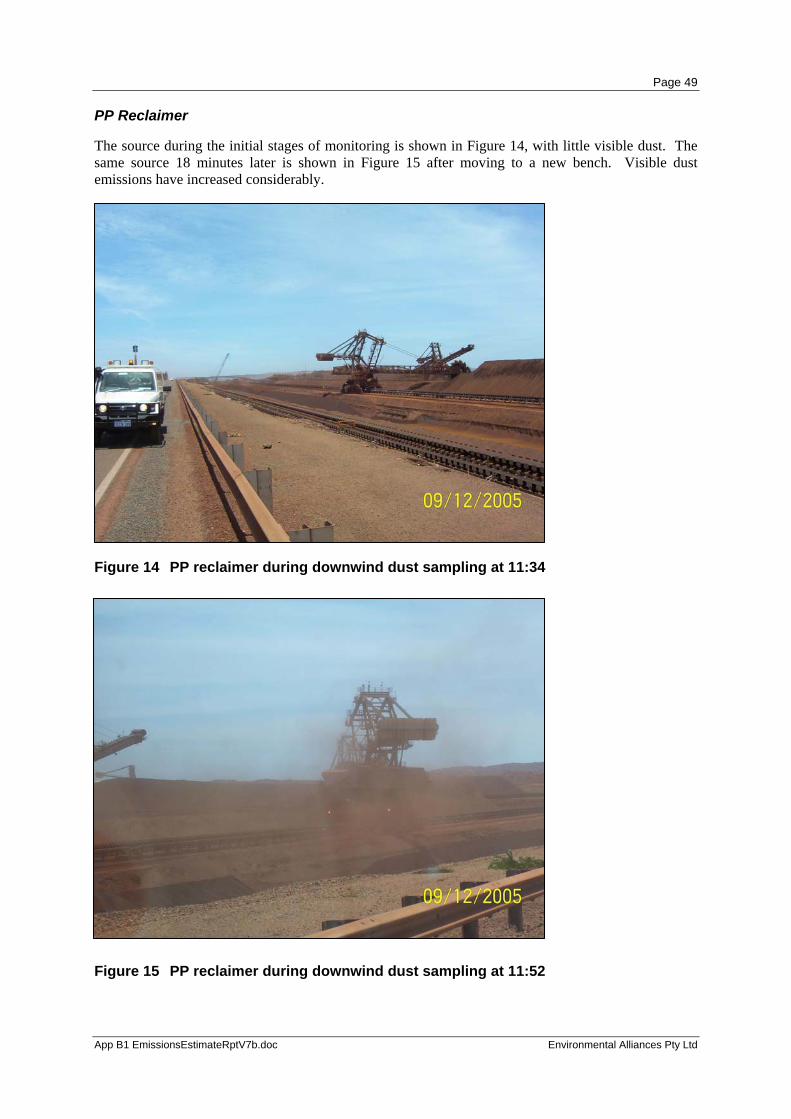
Page 49
App B1 EmissionsEstimateRptV7b.doc Environmental Alliances Pty Ltd
PP Reclaimer
The source during the initial stages of monitoring is shown in Figure 14, with little visible dust. The same source 18 minutes later is shown in Figure 15 after moving to a new bench. Visible dust emissions have increased considerably.
Figure 14 PP reclaimer during downwind dust sampling at 11:34
Figure 15 PP reclaimer during downwind dust sampling at 11:52
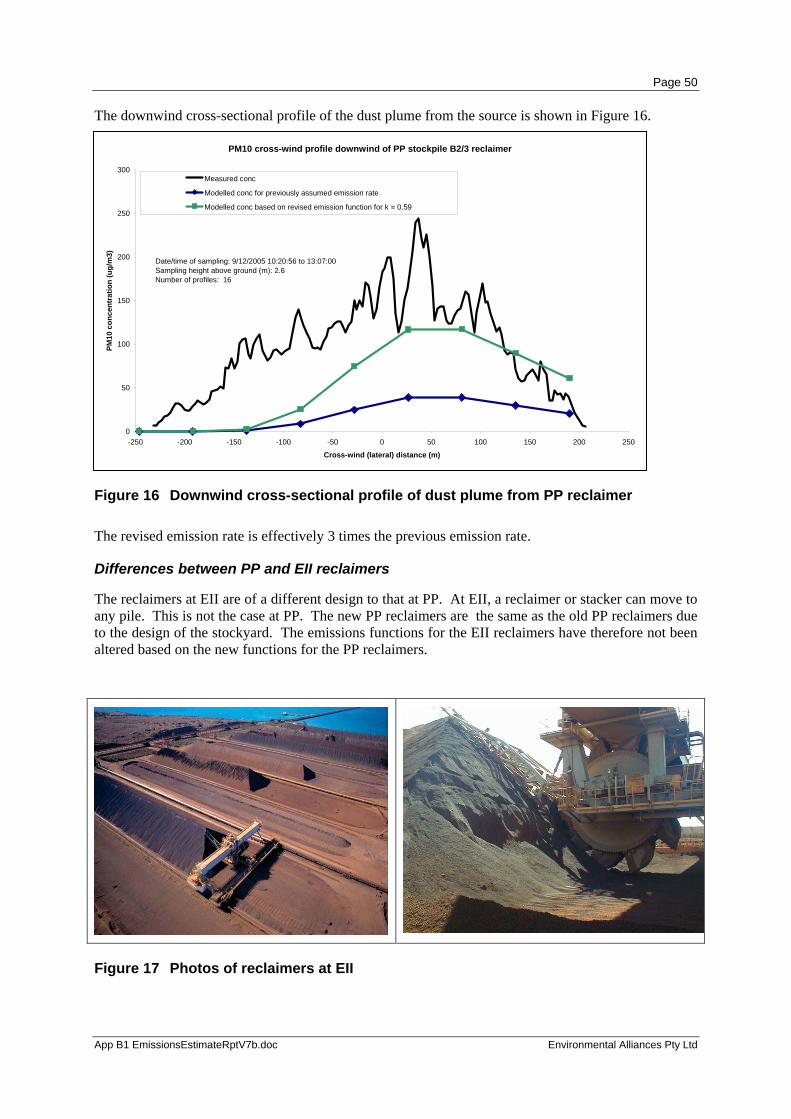
Page 50
App B1 EmissionsEstimateRptV7b.doc Environmental Alliances Pty Ltd
The downwind cross-sectional profile of the dust plume from the source is shown in Figure 16.
Figure 16 Downwind cross-sectional profile of dust plume from PP reclaimer
The revised emission rate is effectively 3 times the previous emission rate.
Differences between PP and EII reclaimers
The reclaimers at EII are of a different design to that at PP. At EII, a reclaimer or stacker can move to any pile. This is not the case at PP. The new PP reclaimers are the same as the old PP reclaimers due to the design of the stockyard. The emissions functions for the EII reclaimers have therefore not been altered based on the new functions for the PP reclaimers.
Figure 17 Photos of reclaimers at EII
PM10 cross-wind profile downwind of PP stockpile B2/3 reclaimer
0
50
100
150
200
250
300
-250 -200 -150 -100 -50 0 50 100 150 200 250
Cross-wind (lateral) distance (m)
PM10
con
cent
ratio
n (u
g/m
3)
Measured conc
Modelled conc for previously assumed emission rate
Modelled conc based on revised emission function for k = 0.59
Date/time of sampling: 9/12/2005 10:20:56 to 13:07:00Sampling height above ground (m): 2.6Number of profiles: 16

Page 51
App B1 EmissionsEstimateRptV7b.doc Environmental Alliances Pty Ltd
PP Screenhouse SH1P
The source is shown in Figure 18. The downwind cross-sectional profile of the dust plume from the source is shown in Figure 19. Firstly, the predicted profile (dark blue dotted line) was far too broad compared to the measured profile. The initial sigma-y was changed from 80m to 20m. This resulted in a much better shaped profile (dark blue solid line). The revised emission rate is effectively 1.7 times the previous emission rate.
Figure 18 PP Screenhouse SH1P
Figure 19 PM10 cross-wind profile downwind of SH1P
PM10 cross-wind profile downwind of SH1P
0
100
200
300
400
500
600
700
800
900
-40 -20 0 20 40 60 80 100Cross-wind (lateral) distance (m)
PM10
con
cent
ratio
n (u
g/m
3)
Avg Conc smoothed over 5 m(ug/m3)
Modelled conc for previouslyassumed emission rate
Modelled conc for previouslyassumed emission rate &revised sig yModelled conc based onrevised emission function for k= 2.4
Date/time of sampling: 8/12/2005 16:18:55 to 16:59:45Sampling height above ground (m): 5.1Number of profiles: 6
East end of SH1P building (Limit of access for profiling)
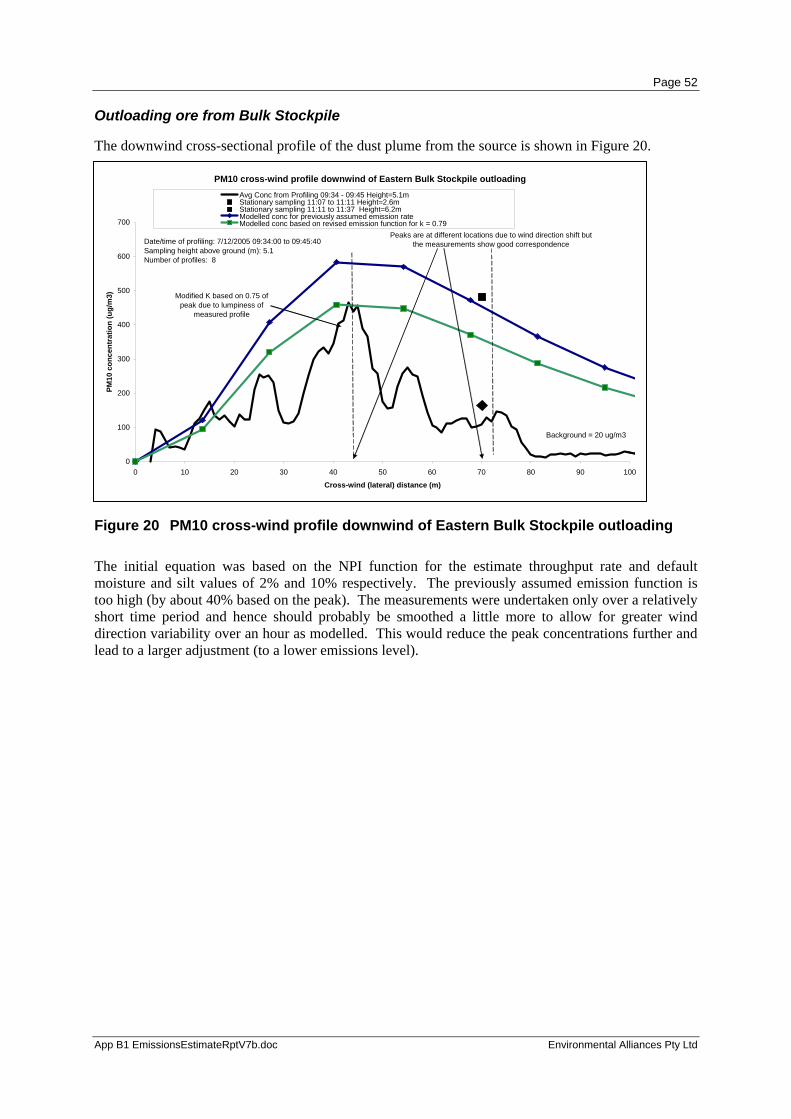
Page 52
App B1 EmissionsEstimateRptV7b.doc Environmental Alliances Pty Ltd
Outloading ore from Bulk Stockpile
The downwind cross-sectional profile of the dust plume from the source is shown in Figure 20.
Figure 20 PM10 cross-wind profile downwind of Eastern Bulk Stockpile outloading
The initial equation was based on the NPI function for the estimate throughput rate and default moisture and silt values of 2% and 10% respectively. The previously assumed emission function is too high (by about 40% based on the peak). The measurements were undertaken only over a relatively short time period and hence should probably be smoothed a little more to allow for greater wind direction variability over an hour as modelled. This would reduce the peak concentrations further and lead to a larger adjustment (to a lower emissions level).
PM10 cross-wind profile downwind of Eastern Bulk Stockpile outloading
0
100
200
300
400
500
600
700
0 10 20 30 40 50 60 70 80 90 100
Cross-wind (lateral) distance (m)
PM10
con
cent
ratio
n (u
g/m
3)
Avg Conc from Profiling 09:34 - 09:45 Height=5.1mStationary sampling 11:07 to 11:11 Height=2.6mStationary sampling 11:11 to 11:37 Height=6.2mModelled conc for previously assumed emission rateModelled conc based on revised emission function for k = 0.79
Date/time of profiling: 7/12/2005 09:34:00 to 09:45:40Sampling height above ground (m): 5.1Number of profiles: 8
Peaks are at different locations due to wind direction shift but the measurements show good correspondence
Background = 20 ug/m3
Modified K based on 0.75 of peak due to lumpiness of
measured profile
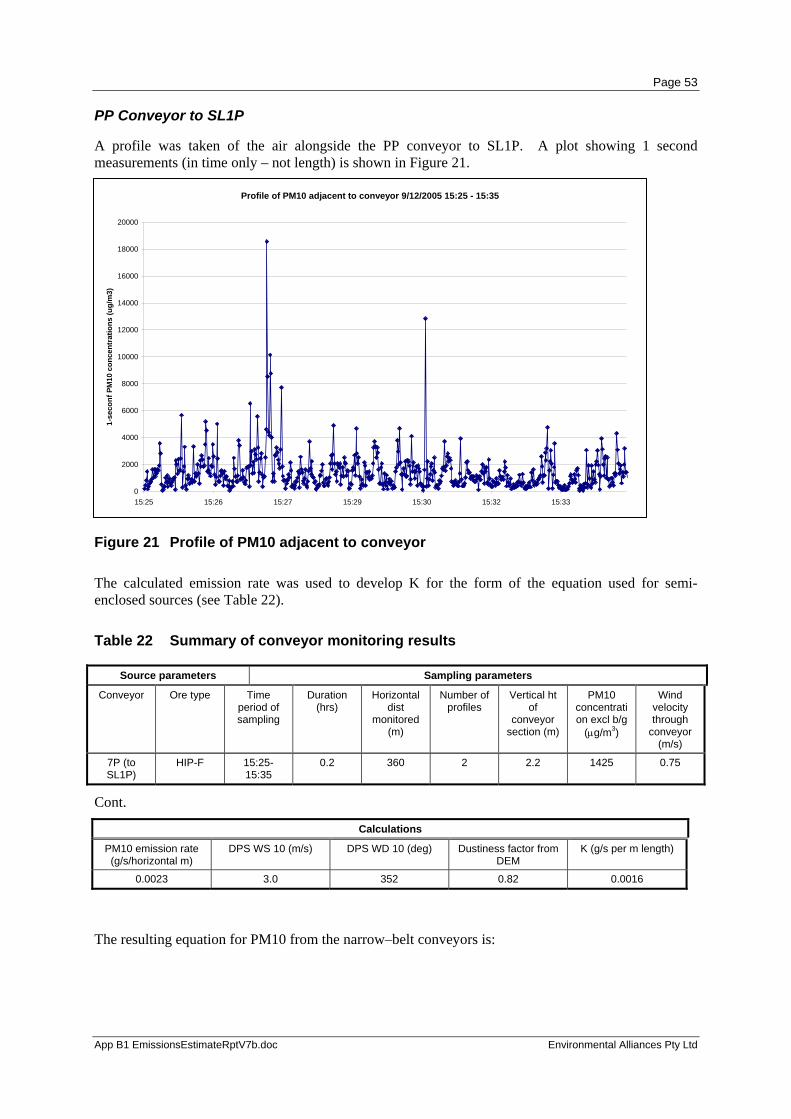
Page 53
App B1 EmissionsEstimateRptV7b.doc Environmental Alliances Pty Ltd
PP Conveyor to SL1P
A profile was taken of the air alongside the PP conveyor to SL1P. A plot showing 1 second measurements (in time only – not length) is shown in Figure 21.
Figure 21 Profile of PM10 adjacent to conveyor
The calculated emission rate was used to develop K for the form of the equation used for semi-enclosed sources (see Table 22).
Table 22 Summary of conveyor monitoring results
Source parameters Sampling parameters
Conveyor Ore type Time period of sampling
Duration (hrs)
Horizontal dist
monitored (m)
Number of profiles
Vertical ht of
conveyor section (m)
PM10 concentration excl b/g
(μg/m3)
Wind velocity through
conveyor (m/s)
7P (to SL1P)
HIP-F 15:25-15:35
0.2 360 2 2.2 1425 0.75
Cont.
Calculations
PM10 emission rate (g/s/horizontal m)
DPS WS 10 (m/s) DPS WD 10 (deg) Dustiness factor from DEM
K (g/s per m length)
0.0023 3.0 352 0.82 0.0016
The resulting equation for PM10 from the narrow–belt conveyors is:
Profile of PM10 adjacent to conveyor 9/12/2005 15:25 - 15:35
0
2000
4000
6000
8000
10000
12000
14000
16000
18000
20000
15:25 15:26 15:27 15:29 15:30 15:32 15:33
1-se
conf
PM
10 c
once
ntra
tions
(ug/
m3)
Page 54
App B1 EmissionsEstimateRptV7b.doc Environmental Alliances Pty Ltd
psPM xLxUKQ Dmpr10,10 = Equation 11
Where-
QPM10 = PM10 emission rate (g/s).
Ks = 0.0016 (g/s per m length).
U10,Dmpr = DPS wind speed at 10 metres (m/s).
L = length of conveyor (m).
p = 0.5.
As described previously, emissions from conveyors are also dependent on wind direction. This function was derived for winds at right angles to the conveyor and hence would cause emissions to be over-estimated for other wind orientations due to a reduced area of exposure. The emissions factor has therefore been reduced by 0.71 for annual modelling purposes.
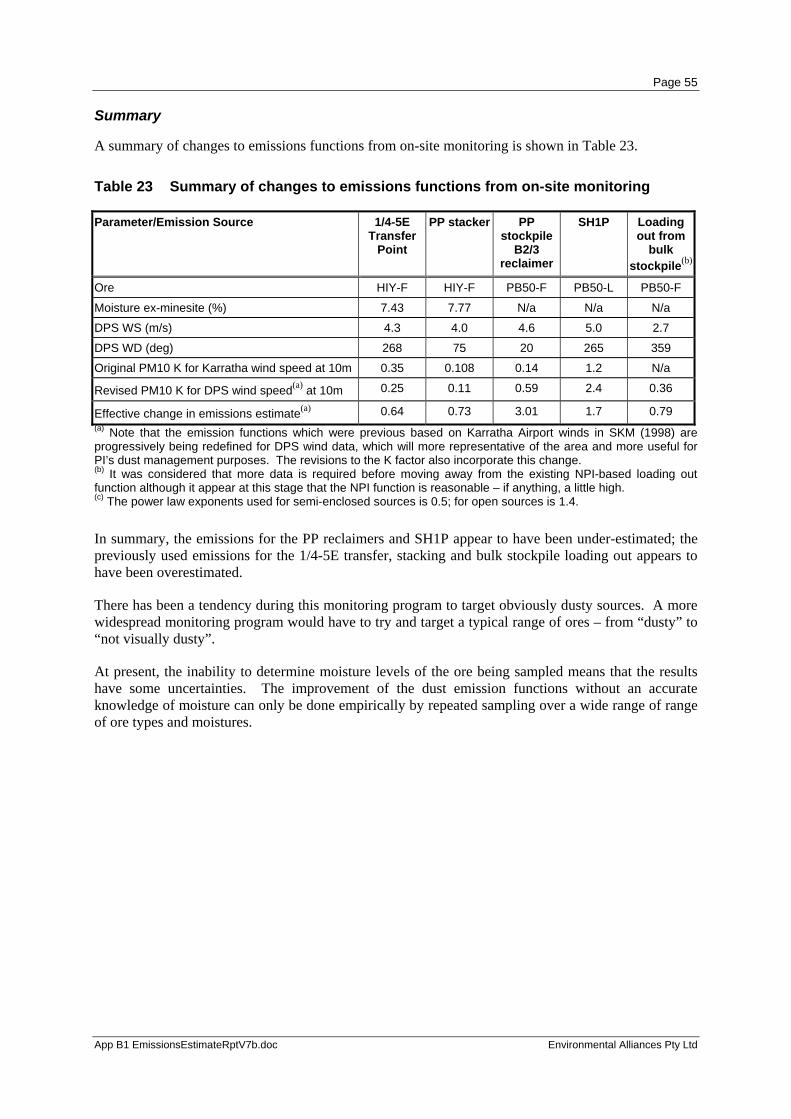
Page 55
App B1 EmissionsEstimateRptV7b.doc Environmental Alliances Pty Ltd
Summary
A summary of changes to emissions functions from on-site monitoring is shown in Table 23.
Table 23 Summary of changes to emissions functions from on-site monitoring
Parameter/Emission Source 1/4-5E Transfer
Point
PP stacker PP stockpile
B2/3 reclaimer
SH1P Loading out from
bulk stockpile(b)
Ore HIY-F HIY-F PB50-F PB50-L PB50-F
Moisture ex-minesite (%) 7.43 7.77 N/a N/a N/a
DPS WS (m/s) 4.3 4.0 4.6 5.0 2.7
DPS WD (deg) 268 75 20 265 359
Original PM10 K for Karratha wind speed at 10m 0.35 0.108 0.14 1.2 N/a
Revised PM10 K for DPS wind speed(a) at 10m 0.25 0.11 0.59 2.4 0.36
Effective change in emissions estimate(a) 0.64 0.73 3.01 1.7 0.79 (a) Note that the emission functions which were previous based on Karratha Airport winds in SKM (1998) are progressively being redefined for DPS wind data, which will more representative of the area and more useful for PI’s dust management purposes. The revisions to the K factor also incorporate this change. (b) It was considered that more data is required before moving away from the existing NPI-based loading out function although it appear at this stage that the NPI function is reasonable – if anything, a little high. (c) The power law exponents used for semi-enclosed sources is 0.5; for open sources is 1.4.
In summary, the emissions for the PP reclaimers and SH1P appear to have been under-estimated; the previously used emissions for the 1/4-5E transfer, stacking and bulk stockpile loading out appears to have been overestimated.
There has been a tendency during this monitoring program to target obviously dusty sources. A more widespread monitoring program would have to try and target a typical range of ores – from “dusty” to “not visually dusty”.
At present, the inability to determine moisture levels of the ore being sampled means that the results have some uncertainties. The improvement of the dust emission functions without an accurate knowledge of moisture can only be done empirically by repeated sampling over a wide range of range of ore types and moistures.

Page 56
App B1 EmissionsEstimateRptV7b.doc Environmental Alliances Pty Ltd
Appendix 2 Effect of Ore moisture on dust emissions
The dust emitted from a given ore during a handling operation is considered to be primarily dependent on the actual moisture content and “inherent dustiness”.
The inherent dustiness arises from a number of inter-related factors such as the particle size distribution, density (specific gravity) and shape of the particles, mineralogy of the ore and hygroscopicity.
Ore dustiness has historically been characterised using a rotation drum test designed to measure coal dustiness as defined by Australian Standard AS4156.6-2000.
The rotating drum test consists of a horizontally mounted drum. A moisture-conditioned 1 litre sample is placed inside the drum and the drum rotated for a fixed time. A constant stream of air is drawn through the drum and the generated dust (-150 micron) collected in a vacuum filter bag (see Figure 22). The weight of the filter bag is measured before and after the test to determine the quantity of dust collected.
Figure 22 Rotating drum arrangement
A dust number, indicating relative dustiness, is obtained from:
Dust Number = (Mb – Ma) / Ms x 100,000 Equation 12
Where:
Mb = Mass of filter bag and dust (grams)
Ma = Mass of filter bag (grams)
Ms = Mass of sample in drum (grams)
By repeating the test for different moisture levels in the same ore, a series of moisture and dust number paired data are obtained. These are plotted on a log linear graph (see Figure 23) where the line of best fit intersecting a dust number of 10 is deemed to be the “Dust Extinction Moisture”
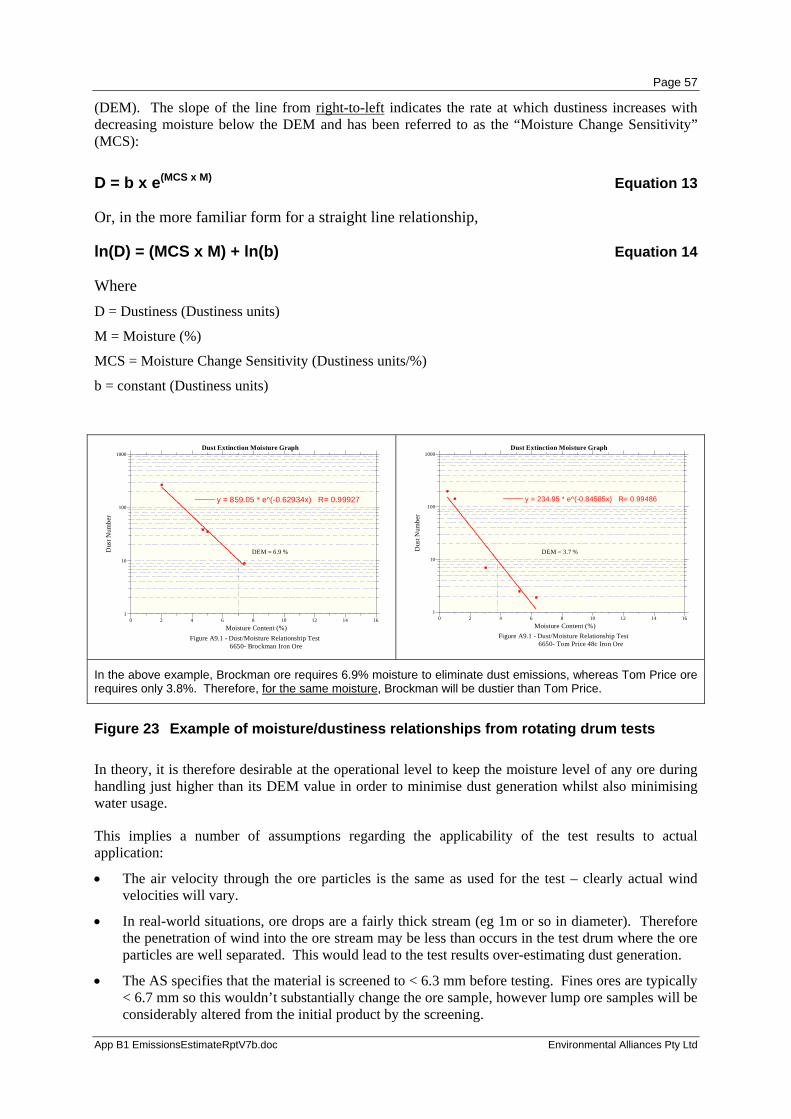
Page 57
App B1 EmissionsEstimateRptV7b.doc Environmental Alliances Pty Ltd
(DEM). The slope of the line from right-to-left indicates the rate at which dustiness increases with decreasing moisture below the DEM and has been referred to as the “Moisture Change Sensitivity” (MCS):
D = b x e(MCS x M) Equation 13
Or, in the more familiar form for a straight line relationship,
ln(D) = (MCS x M) + ln(b) Equation 14
Where D = Dustiness (Dustiness units)
M = Moisture (%)
MCS = Moisture Change Sensitivity (Dustiness units/%)
b = constant (Dustiness units)
1
10
100
1000
0 2 4 6 8 10 12 14 16
y = 859.05 * e^(-0.62934x) R= 0.99927
Moisture Content (%)Figure A9.1 - Dust/Moisture Relationship Test 6650- Brockman Iron Ore
Dus
t Num
ber
Dust Extinction Moisture Graph
DEM = 6.9 %
1
10
100
1000
0 2 4 6 8 10 12 14 16
y = 234.95 * e^(-0.84585x) R= 0.99486
Moisture Content (%)Figure A9.1 - Dust/Moisture Relationship Test 6650- Tom Price 48c Iron Ore
Dus
t Num
ber
Dust Extinction Moisture Graph
DEM = 3.7 %
In the above example, Brockman ore requires 6.9% moisture to eliminate dust emissions, whereas Tom Price ore requires only 3.8%. Therefore, for the same moisture, Brockman will be dustier than Tom Price.
Figure 23 Example of moisture/dustiness relationships from rotating drum tests
In theory, it is therefore desirable at the operational level to keep the moisture level of any ore during handling just higher than its DEM value in order to minimise dust generation whilst also minimising water usage.
This implies a number of assumptions regarding the applicability of the test results to actual application:
• The air velocity through the ore particles is the same as used for the test – clearly actual wind velocities will vary.
• In real-world situations, ore drops are a fairly thick stream (eg 1m or so in diameter). Therefore the penetration of wind into the ore stream may be less than occurs in the test drum where the ore particles are well separated. This would lead to the test results over-estimating dust generation.
• The AS specifies that the material is screened to < 6.3 mm before testing. Fines ores are typically < 6.7 mm so this wouldn’t substantially change the ore sample, however lump ore samples will be considerably altered from the initial product by the screening.
Page 58
App B1 EmissionsEstimateRptV7b.doc Environmental Alliances Pty Ltd
Following a review of dustiness test reports provided by PI, it also became apparent that there are a number of variations that may be applied by different laboratories:
• Where the moisture of the ore sample needs to be lowered, either oven drying or air drying may be used.
• Where the moisture of the ore sample needs to be raised above the level as provided, the moisture tends to adhere to the fine fraction only and not be evenly distributed throughout. It was advised that a spray bottle is used and the ore gently agitated in a bag, however the skill of the analyst would appear to be important in obtaining an even distribution of moisture. It is preferable to get ores to be tested in a wet condition from the minesite.
• PI follow the ISO 3087:1998 Standard for the analysis of moisture in ore, however it is not clear what procedure is used by laboratories when undertaking dustiness tests.
• The AS specified that the moisture is measured prior to the test. The Standard optionally specifies a moisture measurement after the test as well, but does not specify it be used in determination of the actual test moisture. If there is some drying out of the sample during the test, the associated moisture will be over-estimated.
• Some laboratories may run the test for a period of 5 minutes with an air flow rate of 350 L/m as opposed to the Standard’s specification of 10 minutes with an air flow rate of 170 L/m. This may be at the request of the client on the basis that the shorter duration and higher air flow rate is more representative of real-world situations.
Unfortunately, dustiness test results were not always accompanied by reports describing the details of the method used.
It is not known whether the issues described above are important in terms of affecting the usefulness of the results or not.
• In order to obtain more up-to-date and consistent data, PI arranged for further dustiness testing of existing fines ores and most of those proposed at the 145 Mtpa throughput level - strictly following AS 4156.6-2000 (noting the various vagaries in this Standard).
• For the ores not tested in the 2006 program, previous test data was used to estimate the parameters for the dust equations (see Table 24).
• The parameters for the moisture/dustiness relationships for 95 Mtpa and 145 Mtpa ores and products are shown in Table 25.

Page 59
App B1 EmissionsEstimateRptV7b.doc Environmental Alliances Pty Ltd
Table 24 Results from all known PI rotating drum dustiness tests
Ore Classification/Product
b (Dustiness units)
MCS (Dustiness units/%) DEM (%) Ref
Hematites FinesHIB Fines 6.6 -1.1 3.8 Dust Tests Data Base.xlsHIB Fines 7.0 -0.9 5.0 Dust Tests Data Base.xlsHIB Fines 4.9 -0.6 4.3 Dust Tests Data Base.xlsHIB Fines 8.3 -1.7 3.4 Dust Tests Data Base.xlsHIB Fines 10.3 -1.7 4.8 Dust Tests Data Base.xlsHIB Fines 9.5 -1.7 4.3 Dust Tests Data Base.xlsHIB Fines 3.8 -0.3 4.9 Dust Tests Data Base.xlsHIB Fines 2.8 -0.2 2.9 Dust Tests Data Base.xlsHIB Fines 5.2 -0.4 6.7 Dust Tests Data Base.xlsBrockman Fines 6.0 -0.6 6.3 Bkm Fines Production 23_09_03.doc
Brockman Fines 7.0 -0.7 6.8
TEST PROGRAM TO DETERMINE THE RELATIONSHIP BETWEEN DUSTINESS AND MOISTURE CONTENT FOR SELECTED TYPES OF IRON ORE CONDUCTED AT TUNRA BULK OLIDS HANDLING RESEARCH ASSOCIATES, UNIVERSITY OF NEWCASTLE Date: 30 August 2006 Introspec Consulting
HIP Fines 5.5 -0.5 6.1 Dust Tests Data Base.xlsHIP Fines 7.9 -1.3 4.2 Dust Tests Data Base.xls
Paraburdoo Fines 6.3 -1.1 3.7
TEST PROGRAM TO DETERMINE THE RELATIONSHIP BETWEEN DUSTINESS AND MOISTURE CONTENT FOR SELECTED TYPES OF IRON ORE CONDUCTED AT TUNRA BULK OLIDS HANDLING RESEARCH ASSOCIATES, UNIVERSITY OF NEWCASTLE Date: 30 August 2006 Introspec Consulting
Tom Price Fines 48c 5.5 -0.8 3.7
TEST PROGRAM TO DETERMINE THE RELATIONSHIP BETWEEN DUSTINESS AND MOISTURE CONTENT FOR SELECTED TYPES OF IRON ORE CONDUCTED AT TUNRA BULK OLIDS HANDLING RESEARCH ASSOCIATES, UNIVERSITY OF NEWCASTLE Date: 30 August 2006 Introspec Consulting
Tom Price 10 Fines 22.3 -5.6 3.6
TEST PROGRAM TO DETERMINE THE RELATIONSHIP BETWEEN DUSTINESS AND MOISTURE CONTENT FOR SELECTED TYPES OF IRON ORE CONDUCTED AT TUNRA BULK OLIDS HANDLING RESEARCH ASSOCIATES, UNIVERSITY OF NEWCASTLE Date: 30 August 2006 Introspec Consulting
Tom Price 44 Fines 9.9 -2.9 2.6
TEST PROGRAM TO DETERMINE THE RELATIONSHIP BETWEEN DUSTINESS AND MOISTURE CONTENT FOR SELECTED TYPES OF IRON ORE CONDUCTED AT TUNRA BULK OLIDS HANDLING RESEARCH ASSOCIATES, UNIVERSITY OF NEWCASTLE Date: 30 August 2006 Introspec Consulting
Average 6.5 -0.9 4.9Goethites FinesHIM Fines 6.5 -0.8 5.2 Dust Tests Data Base.xlsHIM Fines 7.3 -0.8 6.5 Dust Tests Data Base.xlsHIM Fines 6.6 -0.5 8.7 Dust Tests Data Base.xlsHIM Fines 7.2 -0.7 7.3 Dust Tests Data Base.xlsHIM Fines 7.2 -0.7 7.4 Dust Tests Data Base.xlsHIM Fines 13.3 -2.4 4.7 Dust Tests Data Base.xlsHIM Fines 6.5 -0.9 4.8 Dust Tests Data Base.xlsHIM Fines 7.3 -0.9 5.5 Dust Tests Data Base.xlsHIM Fines 7.5 -0.9 5.7 Dust Tests Data Base.xlsHIM Fines 7.5 -0.9 5.6 Dust Tests Data Base.xls
Marandoo Fines 9.6 -0.9 8.1
MARANDOO STOCKPILE TREATMENT ANALYSIS Email: [email protected] Our Ref.: 6564 From: Tobias Krull Your Ref.: DB3878 Subject: Stockpile Treatment Analysis (Wind Tunnel & DEM)
Marandoo Fines 17.0 -1.7 8.9
TEST PROGRAM TO DETERMINE THE RELATIONSHIP BETWEEN DUSTINESS AND MOISTURE CONTENT FOR SELECTED TYPES OF IRON ORE CONDUCTED AT TUNRA BULK OLIDS HANDLING RESEARCH ASSOCIATES, UNIVERSITY OF NEWCASTLE Date: 30 August 2006 Introspec Consulting
West Angelas fines 4.6 -0.3 6.8Flow Properties of West Angelas Ores Report No 5613 June 1997 Client:Robe River Iron Associates
WA Zone D Fines 10.0 -1.1 6.9 SKM Cape LambertWA Fines 9.5 -0.8 9.6 SKM Cape LambertWA Fines 11.0 -1.1 8.1 SKM Cape Lambert
West Angelas Fines 12.3 -1.3 7.5
TEST PROGRAM TO DETERMINE THE RELATIONSHIP BETWEEN DUSTINESS AND MOISTURE CONTENT FOR SELECTED TYPES OF IRON ORE CONDUCTED AT TUNRA BULK OLIDS HANDLING RESEARCH ASSOCIATES, UNIVERSITY OF NEWCASTLE Date: 30 August 2006 Introspec Consulting
Hope Downs Fines 10.2 -1.1 7.5Dustiness Testing of Hope Downs Iron Ores Report No 6086 Nov 2001 Client: Hope Downs Management Services
Hope Downs Fines 9.9 -0.9 8.0Dustiness Testing of Hope Downs Iron Ores Report No 6086 Nov 2001 Client: Hope Downs Management Services
Nammuldi Fines 6.7 -0.6 7.0
TEST PROGRAM TO DETERMINE THE RELATIONSHIP BETWEEN DUSTINESS AND MOISTURE CONTENT FOR SELECTED TYPES OF IRON ORE CONDUCTED AT TUNRA BULK OLIDS HANDLING RESEARCH ASSOCIATES, UNIVERSITY OF NEWCASTLE Date: 30 August 2006 Introspec Consulting
Average 9.0 -1.0 7.0Pisolitic FinesMesa J Fines 8.5 -0.6 10.0 SKM Cape LambertMesa J Fines 11.3 -1.2 7.5 SKM Cape Lambert
Page 60
App B1 EmissionsEstimateRptV7b.doc Environmental Alliances Pty Ltd
Table 25 Parameters for moisture/dustiness relationships for 95 Mtpa and 145 Mtpa ores and products
Ore Classification/Product Port throughput Abrev
b (Dustiness units)
MCS (Dustiness
units/%) DEM (%) Ref
Brockman Fines 95 Mtpa & 145 Mtpa BRF 7.0 -0.7 6.8Introspec Consulting
30 August 2006
Paraburdoo Fines 95 Mtpa & 145 Mtpa PAF 6.3 -1.1 3.7Introspec Consulting
30 August 2006
Tom Price Fines 48c 95 Mtpa & 145 Mtpa 5.5 -0.8 3.7Introspec Consulting
30 August 2006
Tom Price 44 Fines 95 Mtpa & 145 Mtpa 9.9 -2.9 2.6Introspec Consulting
30 August 2006Tom Price LG Fines 145 Mtpa TPLGF 7.7 -1.9 3.2 Average of TP LGs
Tom Price 10 Fines 145 Mtpa TPHGF 22.3 -5.6 3.6Introspec Consulting
30 August 2006Avg Tom Price Fines 95 Mtpa TPF 12.6 -3.1 3.3 Average of all TP fines
Marandoo Fines 95 Mtpa & 145 Mtpa MAF 17.0 -1.7 8.9Introspec Consulting
30 August 2006
West Angelas Fines 95 Mtpa & 145 Mtpa WAF 12.3 -1.3 7.5Introspec Consulting
30 August 2006
Yandicoogina Fines 95 Mtpa & 145 Mtpa YAF 8.6 -1.1 5.8Introspec Consulting
30 August 2006
Nammuldi Fines 145 Mtpa NAF 6.7 -0.6 7.0Introspec Consulting
30 August 2006
Hope Downs Fines 145 Mtpa HDF 10.1 -1.0 7.8
Dustiness Testing of Hope Downs Iron Ores Report No 6086 Nov 2001 Client: Hope
Downs Management Services
Pilbara Blend Fines 145 Mtpa PBF 7.9 -1.0 5.7Introspec Consulting
30 August 2006Brockman Lump 95 Mtpa & 145 Mtpa BRL 10.3 -2.4 3.3 Average of BLs
Marandoo Lump 95 Mtpa & 145 Mtpa MAL 8.3 -1.5 4.1Dust Tests Data
Base.xlsParaburdoo Lump 95 Mtpa & 145 Mtpa PAL 10.3 -2.4 3.3Tom Price Lump 95 Mtpa & 145 Mtpa TPL 10.3 -2.4 3.3Nammuldi Lump 145 Mtpa NAL 10.1 -1.5 5.4Hope Downs Lump 145 Mtpa HDL 10.1 -1.5 5.4West Angelas Lump 145 Mtpa WAL 10.1 -1.5 5.4Pilbara Blend Lump - Avg Hematite/Geothite lumps 145 Mtpa PBL 9.9 -1.9 4.3 Average of compositesPilbara Blend 50 fines - Avg Hematite/Geothite fines 95 Mtpa PB50F 10.7 -1.6 5.7 AveragePilbara Blend 50 lump - Avg Hematite/Geothite lumps 95 Mtpa PB50L 9.8 -2.2 3.5 Average
Average of hematites lumps
Average of goethite lumps
Page 61
App B1 EmissionsEstimateRptV7b.doc Environmental Alliances Pty Ltd
Appendix 3 Revisions to emissions estimates since draft report version 6b
A number of changes to the emissions estimates for the 145 Mtpa proposal have been made since the draft report version 6b (dated 28/11/2006) was provided to the EPA. The basis of the changes were:
• Revisions to dust emissions inventory
Pursuant to Condition:M7-3 of Ministerial Statement 734, SKM undertook an intensive on-site emission monitoring programme at Hamersley Iron’s Dampier Operations in June and October 2006 to determine emission rates under various operational and meteorological conditions. Details of SKM’s findings are provided in SKM (2007) which was submitted to the DEC on 29 March 2007. The changes to the emission function for the sources covered by the SKM program have since been included in this proposal.
• Changes to level of proposed bulking at PP
Pilbara Iron have revised downwards the level of bulking activity from 9 Mtpa in draft report version 6b to 5.5 Mtpa in 2008 and 5.9 Mtpa from 2009. The 5.9 Mtpa level has been assumed for modelling of the 145 Mtpa proposal.
• Use of water canon on PP Live Stockpiles for winds towards King Bay
Pilbara Iron now propose to apply water canons for winds in the direction of King Bay in excess of 11 m/s. During 2005, this occurred for 10 hours of the year.
The changes to the TSP emission rates from those reported in the draft report version 6b are summarised in Table 26 below.
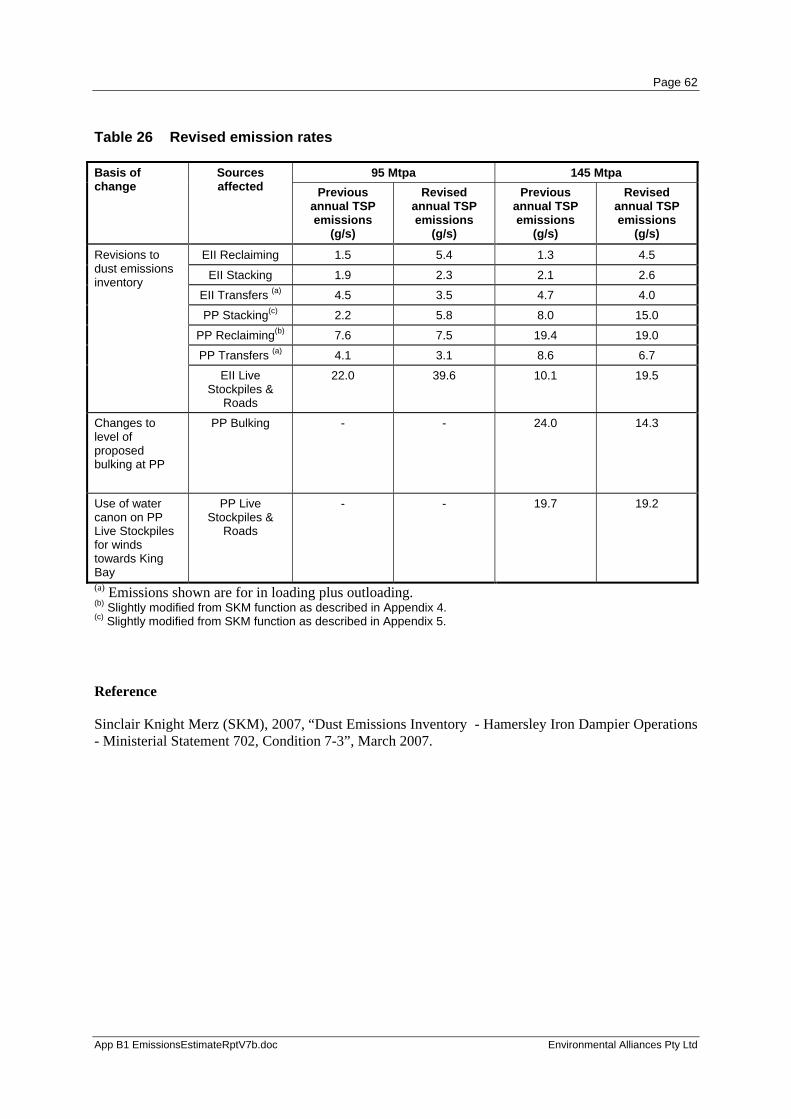
Page 62
App B1 EmissionsEstimateRptV7b.doc Environmental Alliances Pty Ltd
Table 26 Revised emission rates
95 Mtpa 145 Mtpa Basis of change
Sources affected Previous
annual TSP emissions
(g/s)
Revised annual TSP emissions
(g/s)
Previous annual TSP emissions
(g/s)
Revised annual TSP emissions
(g/s)
EII Reclaiming 1.5 5.4 1.3 4.5
EII Stacking 1.9 2.3 2.1 2.6
EII Transfers (a) 4.5 3.5 4.7 4.0
PP Stacking(c) 2.2 5.8 8.0 15.0
PP Reclaiming(b) 7.6 7.5 19.4 19.0
PP Transfers (a) 4.1 3.1 8.6 6.7
Revisions to dust emissions inventory
EII Live Stockpiles &
Roads
22.0 39.6 10.1 19.5
Changes to level of proposed bulking at PP
PP Bulking - - 24.0 14.3
Use of water canon on PP Live Stockpiles for winds towards King Bay
PP Live Stockpiles &
Roads
- - 19.7 19.2
(a) Emissions shown are for in loading plus outloading. (b) Slightly modified from SKM function as described in Appendix 4. (c) Slightly modified from SKM function as described in Appendix 5.
Reference
Sinclair Knight Merz (SKM), 2007, “Dust Emissions Inventory - Hamersley Iron Dampier Operations - Ministerial Statement 702, Condition 7-3”, March 2007.

Page 63
App B1 EmissionsEstimateRptV7b.doc Environmental Alliances Pty Ltd
Appendix 4 Comparison between EA (2006) and SKM (2007) emissions functions for PP Reclaimers
The emissions function determined for PP reclaimers from EA monitoring in 2005 was:
4.110 KA10,)59.069.0( UKxQ sPM = Equation 15
Where 0.69 = (1/1.3)1.4 which adjusts the K constant from DPS winds to Karratha Airport winds.
The emissions function determined for PP reclaimers from SKM monitoring in 2007 was:
6.110 KA10,10.0 UQ sPM = Equation 16
These are plotted in Figure 24 below.
This shows that the emissions from the EA function are about three times higher than from the SKM function.
The SKM function was determined excluding a high outlier data point (see SKM 2007 page 32 Figure 4-13). Had this point been included in determined the emission function, it would have more resembled the EA function. This approach differs slightly from EA’s sampling where “outlying” data are not excluded.
The EA emissions function was therefore essentially retained for modelling in this assessment except for a slight modification whereby the SKM approach of setting of a lower emission limit to avoid an unrealistic zero emission when the wind speed equals zero, was retained (ie. PM10 emission rate set to 0.1 m/s for wind speed < 2 m/s).
Actual emissions may be highly variable depending on the frequency of reclaiming the type of dusty ores that were measured in the SKM outlier.
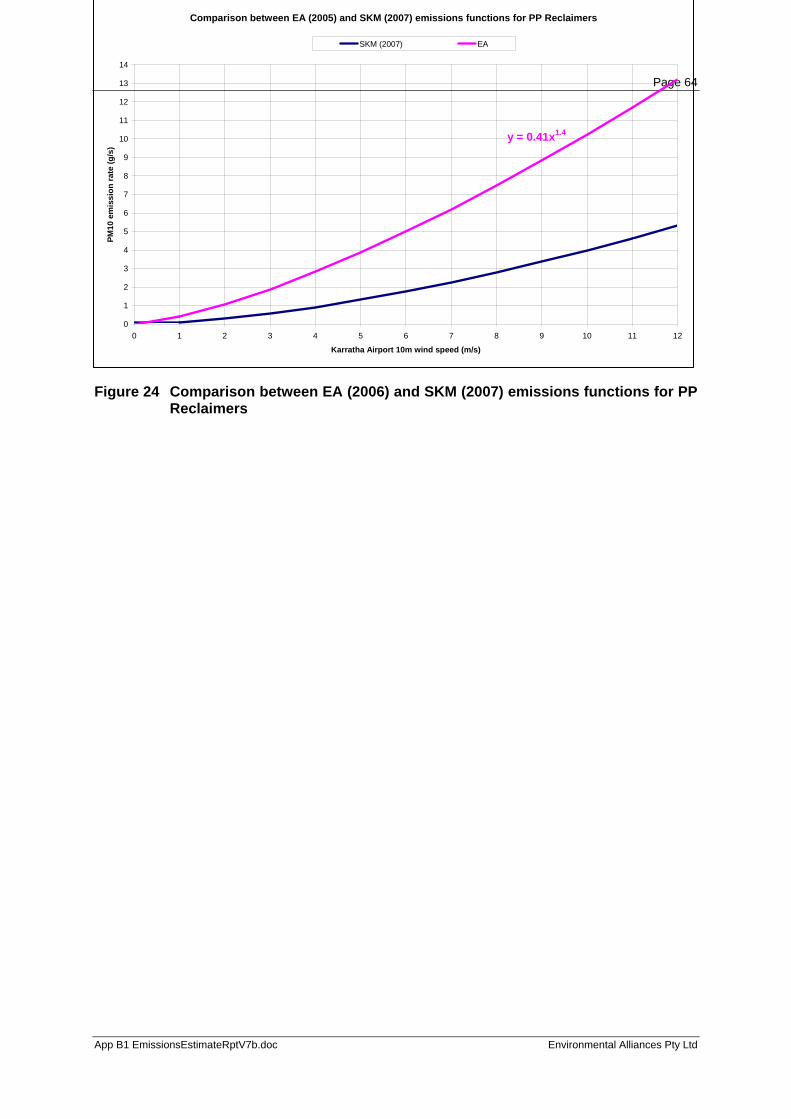
Page 64
App B1 EmissionsEstimateRptV7b.doc Environmental Alliances Pty Ltd
Figure 24 Comparison between EA (2006) and SKM (2007) emissions functions for PP Reclaimers
Comparison between EA (2005) and SKM (2007) emissions functions for PP Reclaimers
0
1
2
3
4
5
6
7
8
9
10
11
12
13
14
0 1 2 3 4 5 6 7 8 9 10 11 12
Karratha Airport 10m wind speed (m/s)
PM10
em
issi
on ra
te (g
/s)
SKM (2007) EA
y = 0.41x1.4
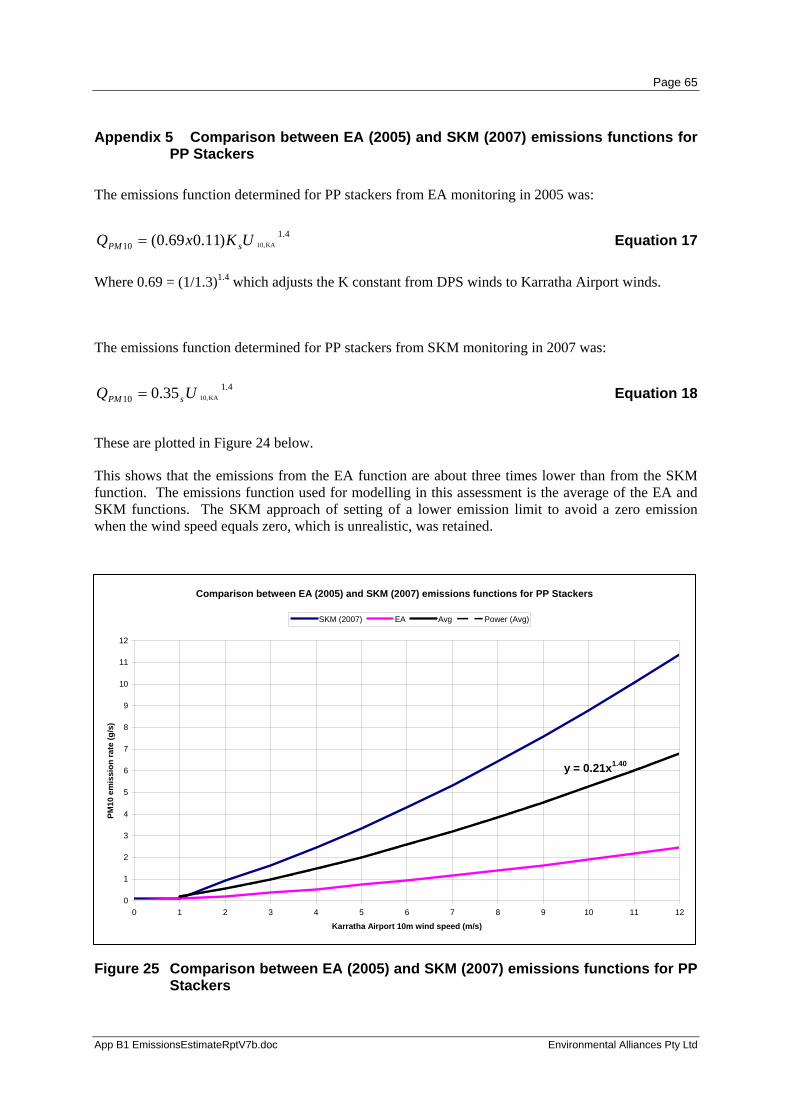
Page 65
App B1 EmissionsEstimateRptV7b.doc Environmental Alliances Pty Ltd
Appendix 5 Comparison between EA (2005) and SKM (2007) emissions functions for PP Stackers
The emissions function determined for PP stackers from EA monitoring in 2005 was:
4.110 KA10,)11.069.0( UKxQ sPM = Equation 17
Where 0.69 = (1/1.3)1.4 which adjusts the K constant from DPS winds to Karratha Airport winds.
The emissions function determined for PP stackers from SKM monitoring in 2007 was:
4.110 KA10,35.0 UQ sPM = Equation 18
These are plotted in Figure 24 below.
This shows that the emissions from the EA function are about three times lower than from the SKM function. The emissions function used for modelling in this assessment is the average of the EA and SKM functions. The SKM approach of setting of a lower emission limit to avoid a zero emission when the wind speed equals zero, which is unrealistic, was retained.
Figure 25 Comparison between EA (2005) and SKM (2007) emissions functions for PP Stackers
Comparison between EA (2005) and SKM (2007) emissions functions for PP Stackers
y = 0.21x1.40
0
1
2
3
4
5
6
7
8
9
10
11
12
0 1 2 3 4 5 6 7 8 9 10 11 12
Karratha Airport 10m wind speed (m/s)
PM10
em
issi
on ra
te (g
/s)
SKM (2007) EA Avg Power (Avg)