Embed Size (px)
Citation preview
Durham Research Online
Deposited in DRO:
22 May 2012
Version of attached file:
Accepted Version
Peer-review status of attached file:
Peer-reviewed
Citation for published item:
Cimatti, A. and Robberto, M. and Baugh, C. and Beckwith, S. V. W. and Content, R. and Daddi, E. and DeLucia, G. and Garilli, B. and Guzzo, L. and Kauffmann, G. and Lehnert, M. and Maccagni, D. andMartnez-Sansigre, A. and Pasian, F. and Reid, I. N. and Rosati, P. and Salvaterra, R. and Stiavelli, M. andWang, Y. and Zapatero Osorio, M. and Balcells, M. and Bersanelli, M. and Bertoldi, F. and Blaizot, J. andBottini, D. and Bower, R. and Bulgarelli, A. and Burgasser, A. and Burigana, C. and Butler, R. C. andCasertano, S. and Ciardi, B. and Cirasuolo, M. and Clampin, M. and Cole, S. and Comastri, A. and Cristiani,S. and Cuby, J. G. and Cuttaia, F. and de Rosa, A. and Sanchez, A. D. and di Capua, M. and Dunlop, J. andFan, X. and Ferrara, A. and Finelli, F. and Franceschini, A. and Franx, M. and Franzetti, P. and Frenk, C.and Gardner, J. P. and Gianotti, F. and Grange, R. and Gruppioni, C. and Gruppuso, A. and Hammer, F.and Hillenbrand, L. and Jacobsen, A. and Jarvis, M. and Kennicutt, R. and Kimble, R. and Kriek, M. andKurk, J. and Kneib, J. P. and Le Fevre, O. and Macchetto, D. and MacKenty, J. and Madau, P. andMagliocchetti, M. and Maino, D. and Mandolesi, N. and Masetti, N. and McLure, R. and Mennella, A. andMeyer, M. and Mignoli, M. and Mobasher, B. and Molinari, E. and Morgante, G. and Morris, S. and Nicastro,L. and Oliva, E. and Padovani, P. and Palazzi, E. and Paresce, F. and Perez Garrido, A. and Pian, E. andPopa, L. and Postman, M. and Pozzetti, L. and Rayner, J. and Rebolo, R. and Renzini, A. and Rttgering, H.and Schinnerer, E. and Scodeggio, M. and Saisse, M. and Shanks, T. and Shapley, A. and Sharples, R. andShea, H. and Silk, J. and Smail, I. and Span, P. and Steinacker, J. and Stringhetti, L. and Szalay, A. andTresse, L. and Trifoglio, M. and Urry, M. and Valenziano, L. and Villa, F. and Villo Perez, I. and Walter, F.and Ward, M. and White, R. and White, S. and Wright, E. and Wyse, R. and Zamorani, G. and Zacchei, A.and Zeilinger, W. W. and Zerbi, F. (2009) ’SPACE : the spectroscopic all-sky cosmic explorer.’, Experimentalastronomy., 23 (1). pp. 39-66.
Further information on publisher’s website:
http://dx.doi.org/10.1007/s10686-008-9096-7
Publisher’s copyright statement:
The original publication is available at www.springerlink.com

Use policy
The full-text may be used and/or reproduced, and given to third parties in any format or medium, without prior permission or charge, forpersonal research or study, educational, or not-for-profit purposes provided that:
• a full bibliographic reference is made to the original source
• a link is made to the metadata record in DRO
• the full-text is not changed in any way
The full-text must not be sold in any format or medium without the formal permission of the copyright holders.
Please consult the full DRO policy for further details.
Durham University Library, Stockton Road, Durham DH1 3LY, United KingdomTel : +44 (0)191 334 3042 — Fax : +44 (0)191 334 2971
http://dro.dur.ac.uk
2
arX
iv:0
804.
4433
v1 [
astr
o-ph
] 2
8 A
pr 2
008
Noname manuscript No.(will be inserted by the editor)
SPACE: the SPectroscopic All-sky Cosmic Explorer
A. Cimatti1 · M. Robberto2· C.
Baugh3· S. V. W. Beckwith2
·
R. Content4· E. Daddi5 · G. De
Lucia6· B. Garilli7 · L. Guzzo8
·
G. Kauffmann6· M. Lehnert9
· D.
Maccagni7 · A. Martınez-Sansigre10· F.
Pasian11· I. N. Reid2
· P. Rosati12 ·
R. Salvaterra13· M. Stiavelli2 · Y.
Wang14· M. Zapatero Osorio15
· M. Balcells15· M.
Bersanelli13 · F. Bertoldi16 · J.
Blaizot6· D. Bottini7 · R. Bower3
·
A. Bulgarelli17 · A. Burgasser18·
C. Burigana17· R. C. Butler17
·
S. Casertano2· B. Ciardi6 · M.
Cirasuolo19· M. Clampin20
· S. Cole3·
A. Comastri21 · S. Cristiani11 · J.-G.
Cuby22· F. Cuttaia17
· A. De Rosa17·
A. Diaz Sanchez23· M. Di Capua24
· J.
Dunlop19,25· X. Fan26
· A. Ferrara27·
F. Finelli17 · A. Franceschini28 · M.
Franx29· P. Franzetti7 · C. Frenk3
·
Jonathan P. Gardner20· F. Gianotti17 ·
R. Grange22· C. Gruppioni21 · A.
Gruppuso17· F. Hammer9
· L.
Hillenbrand30· A. Jacobsen31
· M.
Jarvis32· R. Kennicutt33
· R. Kimble20·
M. Kriek29· J. Kurk10
· J.-P. Kneib22·
O. Le Fevre22· D. Macchetto34
·
J. MacKenty2· P. Madau35
· M.
Magliocchetti11 · D. Maino13· N.
Mandolesi17 · N. Masetti17 · R.
McLure19· A. Mennella13
· M. Meyer36·
M. Mignoli21 · B. Mobasher37·
E. Molinari8 · G. Morgante17· S.
Morris3· L. Nicastro17
· E. Oliva38,39·
P. Padovani12 · E. Palazzi17 · F.
Paresce17· A. Perez Garrido23
· E.
Pian11· L. Popa40
· M. Postman2· L.
2
Pozzetti21 · J. Rayner41· R. Rebolo15
·
A. Renzini42 · H. Rottgering29· E.
Schinnerer10· M. Scodeggio7
· M.
Saisse22· T. Shanks3
· A. Shapley43·
R. Sharples4· H. Shea44
· J. Silk45· I.
Smail3 · P. Spano8· J. Steinacker10
·
L. Stringhetti17 · A. Szalay46· L.
Tresse22· M. Trifoglio17
· M. Urry47·
L. Valenziano17· F. Villa17
· I. Villo
Perez23· F. Walter10
· M. Ward3· R.
White2· S. White6
· E. Wright48· R.
Wyse46· G. Zamorani21 · A. Zacchei11 ·
W.W. Zeilinger49· F. Zerbi8
Received: November 21, 2007 / Accepted: 10 Apr, 2008
Abstract We describe the scientific motivations, the mission concept and theinstrumentation of SPACE, a class-M mission proposed for concept study atthe first call of the ESA Cosmic-Vision 2015-2025 planning cycle. SPACE aimsto produce the largest three-dimensional evolutionary map of the Universe overthe past 10 billion years by taking near-IR spectra and measuring redshiftsfor more than half a billion galaxies at 0 < z < 2 down to AB ∼ 23 over3π sr of the sky. In addition, SPACE will also target a smaller sky field, per-forming a deep spectroscopic survey of millions of galaxies to AB ∼ 26 and at2 < z < 10+. These goals are unreachable with ground-based observations dueto the ≈500 times higher sky background (see e.g. [2]). To achieve the mainscience objectives, SPACE will use a 1.5m diameter Ritchey-Chretien tele-scope equipped with a set of arrays of Digital Micro-mirror Devices (DMDs)covering a total field of view of 0.4 deg2, and will perform large-multiplexing
1Universita di Bologna, Dipartimento di Astronomia, Italy ·2Space Telescope Science In-
stitute, Baltimore, USA ·3University of Durham, Institute of Computational Cosmology,
UK ·4University of Durham, Centre for Advanced Instrumentation, UK ·
5CEA Saclay,France ·
6MPA Garching, Germany ·7INAF - IASFMI, Italy ·
8INAF - Brera, Italy ·
9Observatoire de Paris - Meudon, France ·10Max-Planck-Institut fur Astronomie Heidel-
berg, Germany ·11INAF - Osservatorio Astronomico di Trieste, Italy ·
12ESO Garching,Germany ·
13University of Milano, Italy ·14University of Oklahoma, USA 15
· IAC, Spain ·
16University of Bonn, Germany ·17INAF - IASFBO, Italy ·
18MIT, USA ·19ROE, UK ·
20NASA/GSFC, USA ·21INAF - Osservatorio Astronomico di Bologna, Italy ·
22LAM,France ·
23UPCT, U. Politecnica de Cartagena, Spain ·24UMD, USA ·
25CRC, Canada ·
26University of Arizona, USA ·27SISSA, Italy ·
28University of Padova, Italy ·29University
of Leiden, The Netherlands ·30Caltech, USA ·
31OpSys Project Consulting, Germany ·
32University of Hertfordshire, UK ·33IoA, Cambridge, UK ·
34ESA ·35UCSC, USA ·
36Steward Observatory, USA ·37UC Riverside, USA ·
38INAF Osservatorio Astrofisico diArcetri, Italy ·
39TNG, Italy ·40University of Bucharest, Romania ·
41Institute for Astron-omy, Hawaii, USA ·
42INAF - Osservatorio Astronomico di Padova, Italy ·43Princeton ·
44Ecole Polytechnique Federale de Lausanne, Switzerland ·45University of Oxford, UK ·
46Johns Hopkins University, USA ·47Yale, USA ·
48UCLA, USA ·49University of Vienna,
Austria
3
multi-object spectroscopy (e.g. ≈6000 targets per pointing) at a spectral reso-lution of R∼400 as well as diffraction-limited imaging with continuous coveragefrom 0.8µm to 1.8µm. Owing to the depth, redshift range, volume coverage andquality of its spectra, SPACE will reveal with unique sensitivity most of thefundamental cosmological signatures, including the power spectrum of densityfluctuations and its turnover. SPACE will also place high accuracy constraintson the dark energy equation of state parameter and its evolution by measur-ing the baryonic acoustic oscillations imprinted when matter and radiationdecoupled, the distance-luminosity relation of cosmological supernovae, theevolution of the cosmic expansion rate, the growth rate of cosmic large-scalestructure, and high-z galaxy clusters. The datasets from the SPACE mis-sion will represent a long lasting legacy for the whole astronomical communitywhose data will be mined for many years to come.
PACS 98.80.Es Observational cosmology · 95.36.+x Dark Energy · 95.55.-nAstronomical and space-research instrumentation
1 Introduction and Scientific Background
Our view of the Universe has changed dramatically over the past two decadesthrough measurements of the cosmic microwave background (CMB), the large-scale structure of the local Universe (z < 0.3) and the brightness of distantsupernovae. Fully 96% of the constituents consist of non-luminous and uniden-tified dark energy (73%) and dark matter (23%) that govern the expansion his-tory and evolution of cosmic structure and leave their imprints on the structureand distribution of visible galaxies. These dark components are unexplainedin standard physical theory, but are, nevertheless, considered a natural featureof standard cosmology because they can explain a wide range of observationsassuming only that dark energy produces a pressure countering gravity anddark matter behaves like ordinary matter in its effect on space-time.
The acceleration of the expansion of the Universe is considered one of themost important discoveries of cosmology ([41], [39]) . Both of the extant ex-planations for accelerating space-time require new physics: a negative pressurecomponent dubbed dark energy, or a modification of the law of gravity and,therefore, the standard framework underpinning cosmology. The first possibil-ity, dark energy, is currently favoured but, nevertheless, provides little helpbecause we have no plausible candidates from elementary particle theories([36]). The simplest case is represented by the so called cosmological constant,Λ. Unfortunately, there is no theoretical justification for the size of the cosmo-logical constant as inferred from the rate of universal acceleration. Argumentsbased on the standard model of particle physics yield values between 1050
and 10123 times larger than the observed value. The cosmological constantis only one of several candidates to explain the acceleration of the universe.Most possibilities can be parameterized by their equation of state, the ratioof the pressure exerted by the dark energy to the energy density of the field:
4
w = P/ρc2. A cosmological constant necessarily implies w = −1. The sim-plest alternative quantum-field explanations allow w to differ from −1 andto vary with time. Translating from linear time to observable redshift, z, wecan parameterize w(z) = w0 + wa(1 − a), a = 1/(1 + z). The magnitude ofw determines the rate of acceleration (through the associated pressure), so itcan be characterized by measuring the rate of acceleration as a function oftime for the history of the Universe, or equivalently, the Hubble parameter asa function of redshift, H(z). Alternatively, the acceleration could be the resultof a modified form of gravity, such as gravity that is a function of scale (e.g.[12]), or a modification of the standard model through string or brane theories(e.g. [37]). Distinguishing between dark energy, modified gravity and differentvariants necessarily requires high-precision measurements of the cosmic ex-pansion rate history H(z), but the remaining differences among theories meanthat even a very accurate H(z) is inadequate to uniquely isolate one theory(e.g. [55]; [58]; [27]). The degeneracy occurs because a dark energy model and amodified gravity theory can give identical cosmic expansion histories H(z), butwould give very different growth histories of cosmic large scale structure ([29]).However, the predicted growth rate of large-scale structures varies among the-ories, and a measurement of structure evolution can isolate the correct one.The best current constraints on w from observations of distant supernovae areconsistent with a cosmological constant: −1 < w < −0.85 with 10% − 20%uncertainties assuming a flat Universe ([68]; [42]; [45]).
The cosmological models make testable predictions about how the darkcomponents affect a wide range of observable features that can be discrimi-nated with high precision only using newly developed technology on spacecraft.In this framework, we designed a new space mission aimed at addressing thekey questions of modern cosmology. This study led to a proposal that wassubmitted to ESA in response to the first call Cosmic Vision 2015-2025: theSPectroscopic All-sky Cosmic Explorer (SPACE 1). To solve the mystery ofdark energy, SPACE will determine H(z) and constrain w0 and wa by combin-ing the observations of the Baryonic Acoustic Oscillations (BAO), the growthrate of structures, distant Type Ia Supernovae and high redshift galaxy clus-ters. But SPACE will also address several other key questions of moderncosmology besides dark energy. The main scientific objectives of SPACE arepresented in the next sections.
2 SPACE and the Power Spectrum of Density Fluctuations
Thanks to the enormous volume sampled and the availability of spectroscopicredshifts, SPACE will be able to place constraints at an unprecedented levelon the power spectrum of matter fluctuations, P (k), which is a key input totheoretical models of structure formation. The spectrum of CMB temperaturefluctuations, Cl, and the matter P (k) are subject to different parameter de-generacies. While CMB spectra depend on the combination Ωmh2, the matter
1 http://urania.bo.astro.it/cimatti/space
5
P (k) is sensitive to Ωmh. Thus, combining these two datasets help to breakdegeneracies and adds tremendous scope to tighten the limits on parameterswhich result from the use of just one dataset in isolation. The Cl spectrumexpected from the Planck 2 satellite will probe to smaller angular scales thanWMAP3, significantly increasing the overlap with the scales probed by theSPACE measurment of P (k). The massive volume covered by SPACE meansthat we will be able to make the first compelling measurement of the turnoverin the matter P (k). This feature is a prediction of the standard paradigm ofstructure formation, imprinted when matter first started to dictate the expan-sion of the Universe around 27,000 years after the Big Bang. This measurementof the large scale power will be the first direct probe of primordial fluctuations,which have only been measured to date through ripples in the CMB. The po-sition and shape of the turnover in P (k) depends upon the matter density ofthe universe, and how much of this mass is in the form of baryons and mas-sive neutrinos. By measuring the slope of the power spectrum on scales largerthan the turnover we will be able to distinguish between different models ofinflation, extending the grasp of SPACE on the history of the universe rightback to within a tiny fraction second after the Big Bang.
3 SPACE and Baryonic Acoustic Oscillations
Baryonic acoustic oscillations (BAO) are small amplitude (5-10%) modulationsin the distribution of matter imprinted at the epoch when matter and radiationdecoupled (z ∼ 1000). These ripples correspond to sound waves in the primor-dial photon-baryon fluid. The length scale of the oscillations is closely relatedto the sound horizon at decoupling, a scale (∼ 150 Mpc) which is accuratelyknown from measurements of CMB temperature fluctuations ([53]). Acousticpatterns imprinted on the cosmic microwave background have provided themost precise measurements of cosmological parameters by WMAP and formthe basis for the even more precise measurements anticipated for the Planck .The physical scale of these oscillations will have different apparent sizes on thesky at different redshifts and in different cosmologies. Assuming that the dis-tribution of galaxies reflects the distribution of all matter, this physical scaleis measured from the spatial correlation (i.e. the power spectrum) of galaxies.The acoustic oscillation physical scale length is effectively a standard rulerwhose apparent size can be measured in the transverse and the radial direc-tions (3D) from the distribution of galaxies. Combining the apparent size withthe known physical size gives the distance at the redshift of observation andmakes it possible to determine the expansion rate as a function of redshift,H(z) ([8]; [20]; [49]; [63]). This technique is considered a very promising newmethod proposed to measure the evolution of the expansion rate and there-fore the relative effects of dark energy and dark matter. The application ofBAOs to extant galaxy surveys (in combination with other datasets or with
2 http://www.rssd.esa.int/Planck3 http://map.gsfc.nasa.gov/
6
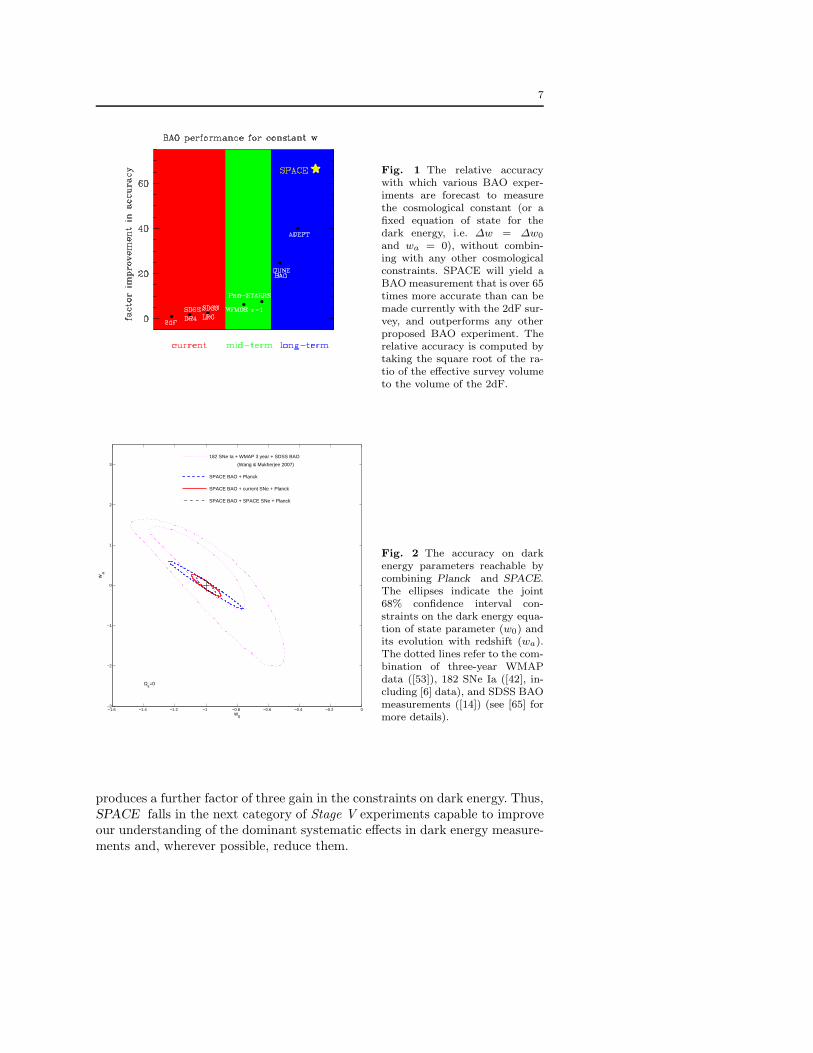
restrictive assumptions like a flat Universe) has already yielded constraints onw with uncertainties of only 10% (e.g. [14]; [22], [23]; [56]; [38]) even thoughthis technique is only a few years old. The astrophysical effects which maycause deviations of the ideal BAO signature, for example nonlinear evolutionof the density field, dynamical redshift-space distortions, galaxy biasing arenow well understood from numerical calculations ([49], [50]; [4], [5]; [15]; [21]).Angulo and collaborators ([5]) demonstrated that the primary limitation onthe accuracy of the BAO method is sample variance. Thus, to minimize theuncertainty in w, the observations need simply to maximize the survey vol-ume. To maximize the sample volume, SPACE will perform a spectroscopicAll-Sky Survey to measure galaxies over 3/4 of the entire sky and over theredshift interval 0 < z < 2, centered on the redshift z ∼ 1 at which the darkenergy first starts to dominate the expansion of the Universe. The sensitivityrequirement is SNR ∼ 3 per resolution element at HAB ∼ 23. Taking spectraat near infrared wavelengths ensures that SPACE covers the entire redshiftrange efficiently. The use of a space-based multi-object spectrometer makesit possible to get accurate redshifts of millions of galaxies over the whole skyin a short time. Fig. 1-2 show the power of the SPACE BAO approach andthe expected accuracy. It is clear that SPACE will dramatically improve ourknowledge of w0 and wa. Recent works emphasized the need to trace the evo-lution of dark energy, w(z), with high accuracy in order to derive the moststringent constraints on the dark energy (see [27]).
Thanks to the huge volume and wide redshift range covered, SPACE willachieve 0.5% accuracy in the BAO scale measurement redshift slices with∆z ∼ 0.5. Even more accurate constraints on dark energy will result froma combination of independent and complementary datasets (e.g. see [59]). Buteven in the case of Planck + SPACE only (see Fig. 2), the constraints onw will be ≈5 (SPACE BAOs), ≈10 (SPACE BAOs + current SNe Ia), and≥20 (SPACE BAOs + SPACE SNe) times more accurate than the currentaccuracy. This also highlights the ”self–sufficiency” of SPACE.
In 2006, NASA established the Dark Energy Task Force (DETF4 withthe purpose of studying and defining the accuracies reachable with futureexperiments dedicated to dark energy.
None of the currently planned ground-based BAO experiments can competewith the accuracy on w reachable with a SPACE-like survey. For instance, theSDSS-III BOSS (Baryon Oscillation Spectroscopic Survey) experiment basedon measuring BAOs from Luminous Red Galaxies at z < 0.7 over a 10,000 deg2
sky area (see http://www.sdss3.org/cosmology.php) would achieve a DETFFigure of Merit (FoM) about an order of magnitude less than a SPACE-likesurvey to HAB=23 over 20,000 deg2 and SPACE fully meets the requirementsof the DETF which recommended that the goal for new survey designs shouldbe that their Figure of Merit improves by a factor of three between differentStages of dark energy missions ([1]). Combining the SPACE BAO measure-ment with a long-term Stage IV experiments, such as LSST, JDEM and SKA,
4 http ://home.fnal.gov/∼rocky/DETF/
7
Fig. 1 The relative accuracywith which various BAO exper-iments are forecast to measurethe cosmological constant (or afixed equation of state for thedark energy, i.e. ∆w = ∆w0
and wa = 0), without combin-ing with any other cosmologicalconstraints. SPACE will yield aBAO measurement that is over 65times more accurate than can bemade currently with the 2dF sur-vey, and outperforms any otherproposed BAO experiment. Therelative accuracy is computed bytaking the square root of the ra-tio of the effective survey volumeto the volume of the 2dF.
w0
wa
182 SNe Ia + WMAP 3 year + SDSS BAO
(Wang & Mukherjee 2007)
SPACE BAO + Planck
SPACE BAO + current SNe + Planck
SPACE BAO + SPACE SNe + Planck
Ωk=0
−1.6 −1.4 −1.2 −1 −0.8 −0.6 −0.4 −0.2 0−3
−2
−1
0
1
2
3
Fig. 2 The accuracy on darkenergy parameters reachable bycombining Planck and SPACE.The ellipses indicate the joint68% confidence interval con-straints on the dark energy equa-tion of state parameter (w0) andits evolution with redshift (wa).The dotted lines refer to the com-bination of three-year WMAPdata ([53]), 182 SNe Ia ([42], in-cluding [6] data), and SDSS BAOmeasurements ([14]) (see [65] formore details).
produces a further factor of three gain in the constraints on dark energy. Thus,SPACE falls in the next category of Stage V experiments capable to improveour understanding of the dominant systematic effects in dark energy measure-ments and, wherever possible, reduce them.
8
4 SPACE and the Growth Rate of Cosmic Structures
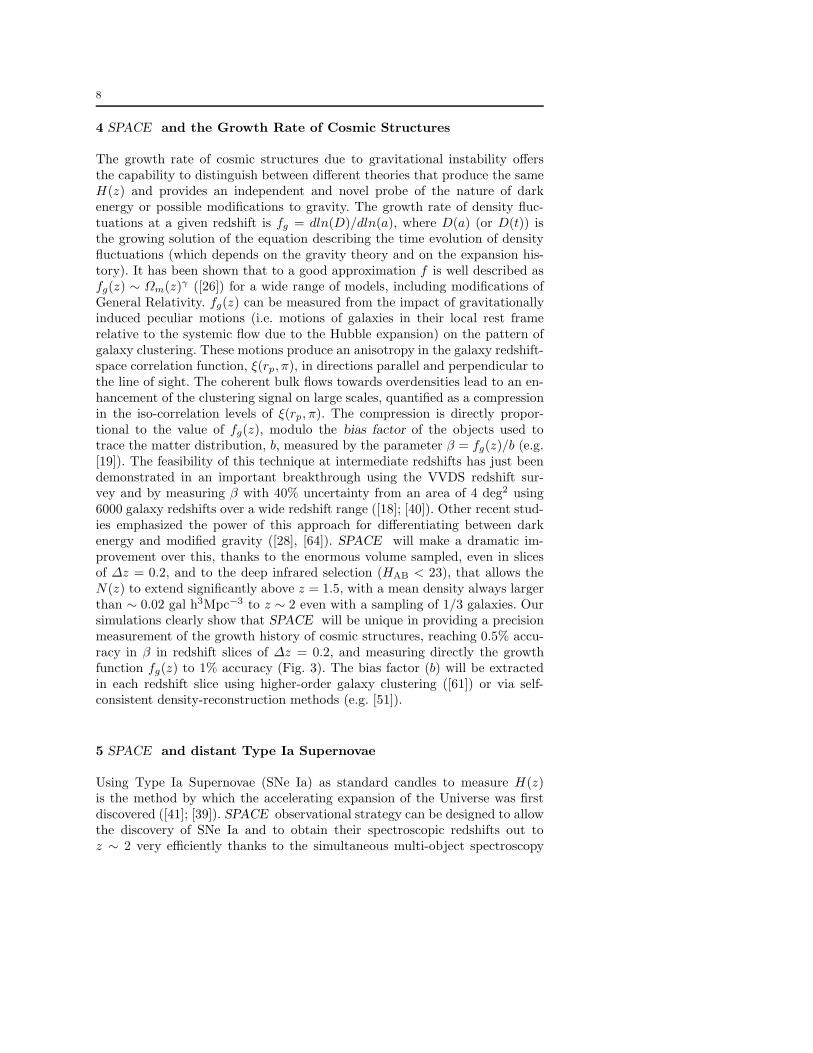
The growth rate of cosmic structures due to gravitational instability offersthe capability to distinguish between different theories that produce the sameH(z) and provides an independent and novel probe of the nature of darkenergy or possible modifications to gravity. The growth rate of density fluc-tuations at a given redshift is fg = dln(D)/dln(a), where D(a) (or D(t)) isthe growing solution of the equation describing the time evolution of densityfluctuations (which depends on the gravity theory and on the expansion his-tory). It has been shown that to a good approximation f is well described asfg(z) ∼ Ωm(z)γ ([26]) for a wide range of models, including modifications ofGeneral Relativity. fg(z) can be measured from the impact of gravitationallyinduced peculiar motions (i.e. motions of galaxies in their local rest framerelative to the systemic flow due to the Hubble expansion) on the pattern ofgalaxy clustering. These motions produce an anisotropy in the galaxy redshift-space correlation function, ξ(rp, π), in directions parallel and perpendicular tothe line of sight. The coherent bulk flows towards overdensities lead to an en-hancement of the clustering signal on large scales, quantified as a compressionin the iso-correlation levels of ξ(rp, π). The compression is directly propor-tional to the value of fg(z), modulo the bias factor of the objects used totrace the matter distribution, b, measured by the parameter β = fg(z)/b (e.g.[19]). The feasibility of this technique at intermediate redshifts has just beendemonstrated in an important breakthrough using the VVDS redshift sur-vey and by measuring β with 40% uncertainty from an area of 4 deg2 using6000 galaxy redshifts over a wide redshift range ([18]; [40]). Other recent stud-ies emphasized the power of this approach for differentiating between darkenergy and modified gravity ([28], [64]). SPACE will make a dramatic im-provement over this, thanks to the enormous volume sampled, even in slicesof ∆z = 0.2, and to the deep infrared selection (HAB < 23), that allows theN(z) to extend significantly above z = 1.5, with a mean density always largerthan ∼ 0.02 gal h3Mpc−3 to z ∼ 2 even with a sampling of 1/3 galaxies. Oursimulations clearly show that SPACE will be unique in providing a precisionmeasurement of the growth history of cosmic structures, reaching 0.5% accu-racy in β in redshift slices of ∆z = 0.2, and measuring directly the growthfunction fg(z) to 1% accuracy (Fig. 3). The bias factor (b) will be extractedin each redshift slice using higher-order galaxy clustering ([61]) or via self-consistent density-reconstruction methods (e.g. [51]).
5 SPACE and distant Type Ia Supernovae
Using Type Ia Supernovae (SNe Ia) as standard candles to measure H(z)is the method by which the accelerating expansion of the Universe was firstdiscovered ([41]; [39]). SPACE observational strategy can be designed to allowthe discovery of SNe Ia and to obtain their spectroscopic redshifts out toz ∼ 2 very efficiently thanks to the simultaneous multi-object spectroscopy
9
Fig. 3 The predicted perfor-mance of SPACE in measuringthe growth rate of density fluc-tuations as a function of red-shift, fg(z) using the anisotropyof galaxy correlations, assuming aΛCDM fiducial model (see [18]).SPACE will disentangle to highaccuracy the cosmological con-stant theory from variants of darkenergy (here two possible casesare shown - [3]). The combinationof the fully independent mea-surements of H(z) from BAOsand fg(z) from redshift distor-tions will provide a direct testof whether cosmic accelerationis due to a modification of Ein-stein theory of gravitation or tonew physics beyond the standardmodel.
over a wide field. For instance, the repeated observation of a 4 deg2 DeepField (HAB < 26) would allow the identification of ∼ 2300 SNe to z ∼ 2 inabout 5–7 months spread over 1 year, where 1 visit would take 4 days to cover4 deg2 to HAB ∼ 26, and each visit would be repeated every 7–10 days. We alsonote that near-IR spectroscopy is advantageous because less affected by dustextinction, and hence very useful for high-z SNe. The details of the SPACE -SNe program will depend on the developments of other future projects in spaceand on the ground (e.g. SNAP, Pan-STARRS, LSST, ...). One could imaginea scenario where SNAP and SPACE will be operational in the same timeframe in order to provide the strong synergy with SNAP discovering the SNethrough imaging and SPACE obtaining their spectra and redshifts.
6 SPACE and high-redshift galaxy clusters
Galaxy clusters are the end products of the hierarchical build-up of small sys-tems into increasingly larger structures up to 1015 M⊙. Since clusters arisefrom rare high peaks of primordial density perturbations, their number densi-ties and mass distribution, i.e. their mass function n(M, z), is highly sensitiveto the matter density parameter Ωm, and dark energy parameters (Λ, w) whichcontrol the rate at which structure grows, as well as to the normalization ofthe matter power spectrum, σ8. At z > 1, the existing surveys do not yetplace strong constraints on dark energy due to the small volumes probed andbecause only a handful of systems have been identified to date (e.g. [43], [35],[54]). SPACE, with its unmatched spectroscopic speed in near-IR, will providespectroscopic confirmation of all the thousands of clusters at z > 1 detected inthe next generation near-IR, Sunyaev-Zeldovich (SZ) and X-ray large area sur-veys (e.g. SPT in 2007+, Planck in 2008+, eROSITA in 2012+). SPACE will
10
identify bona-fide virialized structures, the ones to be compared to the the-oretical cluster mass function, and it will resolve the cases of contaminationfrom point-like radio sources and AGN that are expected to plague future SZand X-ray searches for distant clusters. Thus, SPACE will unleash the fullpotential of the next generation cluster surveys by allowing the best possi-ble knowledge of systematic errors, with small statistical uncertainties limitedonly by the volume of the observable Universe. We recall that constraints fromcluster surveys generally exhibit parameter degeneracies different from thoseof other techniques, such as CMB, Type-Ia SNe and BAO described above.The pursuit of these complementary means, based on different physical prop-erties of the Universe, is the most powerful way to unveil the nature of thedark energy and dark matter. In addition, SPACE itself, thanks to the un-biased near-infrared selection and the spectroscopic survey will locate for thefirst time several tens of thousands of clusters directly in three dimensions outto z ∼ 2.5 and over a large mass range.
7 From Dark Matter to Baryons: galaxy formation and evolution
In the standard model of galaxy formation, galaxies coalesce from gas thatcools inside dark matter halos ([66,7]). Determining the physical processesthat regulate the growth of galaxies and their link with massive black holes isone of the outstanding problems of modern astrophysics. By observing galaxiesdown to faint magnitudes and sampling randomly one of every three of thesefaint galaxies, SPACE will measure the characteristics of more than half abillion galaxies as a function of their environment at sensitivities impossible toobtain from ground-based telescopes. We take this opportunity to underlinewhy SPACE must observe in the near-infrared. The strong optical-ultravioletspectral features of galaxies well below L∗ that are primary redshift and diag-nostic tracers fall, in the redshift range z ∼ 0.5 − 3, in the near-IR. Their listincludes: Balmer and D4000 continuum breaks, strong H Balmer lines, CaIIH&K lines, as well as the well-studied diagnostic emission lines such as [OII]λ3727, Balmer lines, [O III]λλ4959,5007, and several high ionization linesuseful for identifying the presence of an active galactic nucleus. At higherredshifts, SPACE will obtain redshifts and diagnostics of the young stel-lar populations and the interstellar medium using rest-frame ultraviolet lines.SPACE ’s combination of wavelength coverage, resolution and sensitivity willremove the degeneracy limiting the photometric SED fitting (reddening vs. redstars). Examples of what SPACE will be able to accomplish include: (1) theevolution of the distribution functions with the highest accuracy possible andlimited only by cosmic variance (e.g. luminosity, stellar mass) significantlybelow the characteristic mass, M∗, (2) the cosmic evolution of red/passivegalaxies at 0 < z < 2 and up to their formation epoch, (3) to investigatehow the properties of galaxies depend on the density of their surroundings,(4) to determine the merger rate as a function of redshift, (5) to determineblack hole masses from line widths and compare them to the stellar content,
11
mass, and age of the host galaxy, to directly probe feedback processes in thelargest ever high-z sample of AGN, (6) to determine the causes of downsiz-ing, whereby star-formation histories correlate with stellar mass, and the activesites of star-formation move to increasingly higher mass galaxies with redshift,(7) to provide a unique resource for measuring all aspects of the spatial dis-tribution of galaxies and clusters on smaller scales, including the higher ordercorrelation functions (i.e. the amplitudes of the N-point correlation functions)which are sensitive to the growth of structure through gravitational instabilityand offer a direct route to measuring galaxy bias (see section 2.2). Moreover,SPACE will enable new facilities such as LOFAR, eROSITA, WISE, SKA toreach their full capability by removing the significant bottleneck in obtainingthe redshifts for the large survey samples.
8 Galaxies and QSOs in the early Universe
In the area of galaxy and AGN co-evolution, SPACE will provide a uniquecontribution through a spectroscopic Deep Survey, by targeting galaxies atredshifts as high as 10, when the Universe was a few hundred million yearsold. The SPACE Deep Survey will be designed to study large samples at highredshifts following a strategy of this type: (1) Z-, J- and H-band imaging of a10 deg2 area to H = 26, J ∼ 28, Z ∼ 28, (2) narrow-band imaging of the samearea, (3) spectroscopy to H = 25 over the same area and with a sampling rateof 90% (mostly at 2 < z < 7), (4) the candidates at z > 7 will be pre-selectedfrom broad-band colors ([11], [10]) using the SPACE imaging data themselvesand will be repeatedly observed for secure spectroscopic identification. Basedon the observed galaxy luminosity function at z = 6 ([10]), extrapolated athigher redshift under the assumption of simple luminosity evolution, in anarea of 10 deg2, there will be ∼ 800 galaxies at z > 7 with H < 26m, ∼ 500 at7 < z < 8, ∼ 200 at 8 < z < 9, and a few tens above z = 9. As the most massiveobjects at these redshifts are extremely rare, the large FOV of SPACE com-pared to JWST gives it an enormous advantage: only ∼ 0.3 massive galaxiesshould be present in the JWST field of view of ∼ 10 arcmin2. SPACE is thenatural complement to JWST for the study of high redshift galaxies. Withnarrow-band filters, it will be possible to search for Ly-α emitters too faint tobe detected in the broad-band SPACE images by selecting objects showingan excess of flux in narrow-band filters with respect to the broad-band one.For instance, filters centered at ∼ 1.03 and ∼ 1.34 µm, allowing an extensiveLy-α emitter search at z ∼ 7.7 and z ∼ 10. At AB = 26, SPACE shouldfind ∼ 1200 (∼ 30) emitters at z ∼ 7.7 (z ∼ 10) objects with Ly-α fluxesas low as ∼ 4 × 10⁻¹⁸ erg s−1cm−2 with S/N ∼ 10. A fraction (up to 10%)of these sources is expected to be powered by very massive, metal-free stars,the so called Population III stars ([46]). These objects can be selected fromSPACE data owing to their very large Ly-α equivalent width and He II λ1640emission ([47]). Finally, SPACE will also obtain the definitive measurementand spectrum of the so far elusive cosmic Near Infrared Background (NIRB)
12
(e.g. [24] and [57] and references therein). Sources at z > 5 contributing to thereionization of the Universe are expected to produce a strong feature in theNIRB, with a well defined maximum at ∼ 1µm with νIν ∼ 1 nW m2sr−1 anda strong break below 1 µm due to the strong absorption by the intergalacticmedium (IGM) below rest-frame 912 A([44]; [13]).
The enormous sky coverage of the SPACE all-sky survey will also revealseveral hundred QSOs at z > 6 (including a few tens of objects at z > 9)and shed light on the evolution of supermassive black holes. To estimate thedetected number of high-redshift QSOs, a z = 6 luminosity function was con-structed using current observational constraints ([16], [67]), assuming 2/3 ofthe sky is covered, and 1/3 sampling rate within this sky coverage. Three sce-narios were considered, in order to model the evolution of the z ≥ 6 QSOLF: no evolution from the z = 6 LF, linear evolution, and Eddington (expo-nentially decaying) evolution with an e-folding time of τ = 45 Myr. Theseassumptions yield a detection rate of approximately 200, 150 and ≤ 1 (70, 30,< 1) QSOs at z = 7 (z > 9). The SPACE spectral resolution is good enoughto study the absorption of photons from Lyα and Lyβ transitions through theIGM as a function of redshift. The masses of QSOs can be measured from theSPACE spectra using the C IV λ1549 A line ([62]). Currently, it takes about8 hours with a 8m telescope to obtain a suitable near-infrared spectrum of aQSO at z ∼ 6 (e.g. [52]), whereas in 15 minutes SPACE would go 3 mag-nitudes fainter. Before 2017, programs on ground-based telescopes will searchfor high-redshift QSOs by imaging in several optical and near-infrared bands,and using drop-out techniques. However, such techniques are limited by (a)the near-infrared imaging depth achievable from the ground for a large skyarea, (b) the limited redshift ranges available to the drop-out technique, (c)the large fraction (> 95%) of drop out candidates that are cool stars, and (d)the OH sky lines covering > 40% of the near-infrared spectrum. Ground-basedsurveys are expected to find only a relatively small number of high-redshiftQSOs (for a recent example of the process, see [60]). For a significant increasein the number of objects, and to really open up the unexplored redshift range(z > 7), we need to search for high-redshift QSOs over the entire available allsky with spectra that cover a large wavelength range free from by atmosphericemission lines.
9 The Near-Infrared view of our Milky Way Galaxy
At low galactic latitudes source crowding represents a problem for multi-slitspectroscopic surveys. However, the extreme versatility of the instrument wehave envisioned allows us to perform integral field spectroscopy using codedmasks (Hadamard transforms). A SPACE Galactic-plane survey will be fea-sible with a relatively modest investment of time by covering in integral fieldmode the strip within ±0.5 centered on the Galactic Equator between ±60 ofgalactic longitude to magnitude AB ∼ 20. Other examples of key contributionsof SPACE in Galactic studies include the census of ultracool dwarfs in the
13
vicinity of the Sun and the estimate of the lower mass function in star-formingregions.
10 SPACE vs ground-based observations
All the scientific goals described above need the coverage of the largest possiblevolume of the Universe, and are reachable within reasonable timescales only ifthe observations are done from space and in the near-IR by taking advantageof the sky background lower by a factor of ≈500 than from the ground, andthe lack of OH emission lines and telluric absorptions. From the ground, 30%of the wavelength range between 1 and 2 µm is invisible, and for the remainingfraction the bright and variable night sky lines dominate (at the ∼ 95% level!) the background. At low spectral resolution (R ∼ 500), their filling factor isvirtually 100%. Even at R ∼ 2000, less than half the near-IR spectral rangeis free from night sky line emission ([33]). These emission lines, variable inintensity on time scales of minutes, add background noise, subtraction residu-als and scattering that make spectral line and redshift determination of faintsources from the ground nearly impossible, no matter how long one integrates.The SPACE uninterrupted spectral coverage of ∼0.8–1.8µm coupled with thenear-IR selection of the all-sky survey sample (HAB < 23) ensures a surveyspeed, a redshift coverage of 0 < z < 2 and a spectroscopic redshift mea-surement success rate that would be impossible to obtain from the ground.This huge advantage opens also the possibility to perform a SPACE deepand wide-field (≈10 deg2) spectroscopy survey down to limiting magnitudes(HAB < 25 − 26) (see Section 4) that would be completely unreachable withground-based observations even in the era of extremely large telescopes (>10mdiameter).
11 Simulations
In order to assess the mission feasibility and efficiency, and to define the mostsuitable characteristics of the instrumentation, the performances of SPACE wereextensively simulated both for imaging and spectroscopy.
11.1 Spectroscopy
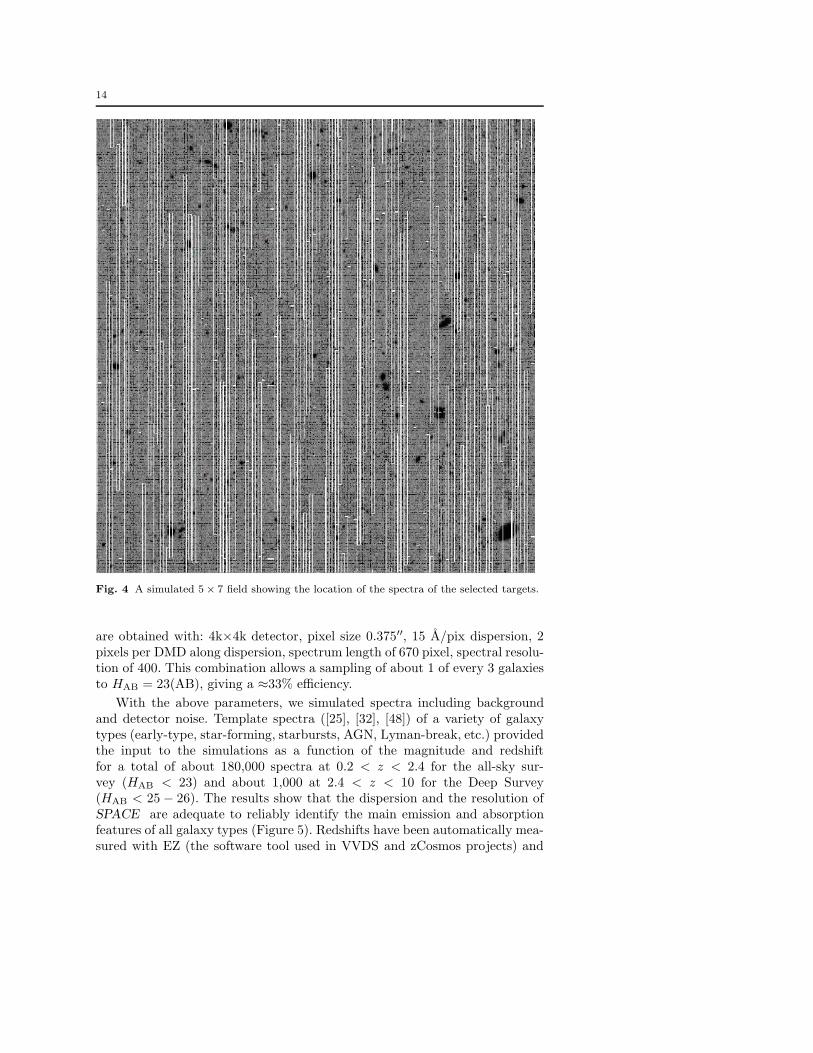
In the case of spectroscopy, we explored different instrument configurations us-ing the VVDS slit positioning software ([9]) and using both real and artificial(from the Millennium Simulations) galaxy catalogs with magnitudes matchedto the sensitivity limits of the All-Sky and Deep Survey. The software doesnot allow the overlap of spectra both in the spatial and in the wavelengthdirections (Fig. 4). The mission efficiency was evaluated as a function of in-strumental parameters and galaxy properties, conservatively allowing 2 emptypixels between spectra to accommodate spectral distortions. The best results
14
Fig. 4 A simulated 5 × 7 field showing the location of the spectra of the selected targets.
are obtained with: 4k×4k detector, pixel size 0.375′′, 15 A/pix dispersion, 2pixels per DMD along dispersion, spectrum length of 670 pixel, spectral resolu-tion of 400. This combination allows a sampling of about 1 of every 3 galaxiesto HAB = 23(AB), giving a ≈33% efficiency.
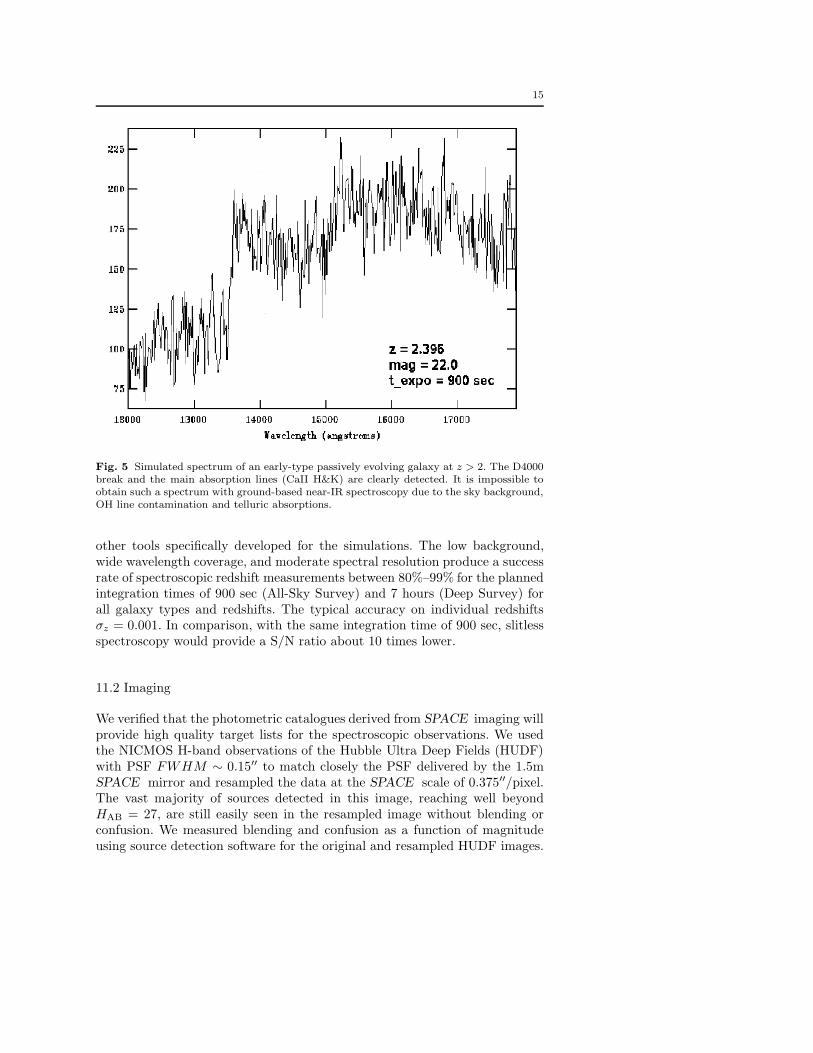
With the above parameters, we simulated spectra including backgroundand detector noise. Template spectra ([25], [32], [48]) of a variety of galaxytypes (early-type, star-forming, starbursts, AGN, Lyman-break, etc.) providedthe input to the simulations as a function of the magnitude and redshiftfor a total of about 180,000 spectra at 0.2 < z < 2.4 for the all-sky sur-vey (HAB < 23) and about 1,000 at 2.4 < z < 10 for the Deep Survey(HAB < 25 − 26). The results show that the dispersion and the resolution ofSPACE are adequate to reliably identify the main emission and absorptionfeatures of all galaxy types (Figure 5). Redshifts have been automatically mea-sured with EZ (the software tool used in VVDS and zCosmos projects) and
15
Fig. 5 Simulated spectrum of an early-type passively evolving galaxy at z > 2. The D4000break and the main absorption lines (CaII H&K) are clearly detected. It is impossible toobtain such a spectrum with ground-based near-IR spectroscopy due to the sky background,OH line contamination and telluric absorptions.
other tools specifically developed for the simulations. The low background,wide wavelength coverage, and moderate spectral resolution produce a successrate of spectroscopic redshift measurements between 80%–99% for the plannedintegration times of 900 sec (All-Sky Survey) and 7 hours (Deep Survey) forall galaxy types and redshifts. The typical accuracy on individual redshiftsσz = 0.001. In comparison, with the same integration time of 900 sec, slitlessspectroscopy would provide a S/N ratio about 10 times lower.
11.2 Imaging
We verified that the photometric catalogues derived from SPACE imaging willprovide high quality target lists for the spectroscopic observations. We usedthe NICMOS H-band observations of the Hubble Ultra Deep Fields (HUDF)with PSF FWHM ∼ 0.15′′ to match closely the PSF delivered by the 1.5mSPACE mirror and resampled the data at the SPACE scale of 0.375′′/pixel.The vast majority of sources detected in this image, reaching well beyondHAB = 27, are still easily seen in the resampled image without blending orconfusion. We measured blending and confusion as a function of magnitudeusing source detection software for the original and resampled HUDF images.
16
The results are: (1) at the HAB < 23 (all sky survey), 97% of the sources arestill individually detected in the resampled image, (2) at HAB = 26, only ∼15% of the sources appear blended with neighbouring sources, (3) source countsfrom the original and resampled image are consistent well beyond HAB = 26.
12 The SPACE survey programmes
The main objective of SPACE will be to execute a Core Science Program inabout 3.5 years. However, given the power and flexibility of SPACE in manyfields of astrophysics, it will allow also for Guest Observer Science Programs.The Core Program will be composed of:
– The SPACE all-sky survey will observe the entire sky at galactic latitudes> ±18 (∼ 70% of the total). This corresponds approximately to 28,500square degrees and 71,000 satellite pointing (1 pointing = 0.4 deg2). As-suming 20 minutes per pointing and an observing efficiency of 75%, thiswill require 2.7 years. The expected number of galaxy spectra with a 1/3target random sampling is (50,000/3)×71, 000× 0.4 ∼ 0.5 × 10⁹. The se-lection of the spectroscopic targets will be done taking an acquisition im-age in the H-band at AB ∼ 23.5 immediately before the spectroscopicobservation. Targets will be selected using on-board software applied tothe images taken with SPACE itself , following the approach currentlyadopted in ground-based spectroscopic surveys (e.g. VVDS, zCOSMOS).As a byproduct, the acquisition images will produce the deepest all-skyimaging survey at |b| > ±18.
– The SPACE Deep Survey will target a 10 deg2 field (25 SPACE pointings)down to HAB = 25, with a target sampling rate of 90%, and without anycolor pre-selection. About 200,000 objects (stars+galaxies) are expected in1 deg2 at HAB < 25. With a multiplex of ∼ 6000 objects and an integrationtime of about 7 hours per observation to reach a sufficient S/N, we need ∼[(200, 000×0.4×0.90)/6000]×25 pointings ×7h ≈ 5 months. We recall thatthe z > 7 galaxy candidates will be pre-selected using the SPACE imagingin z,J,H bands and will be compulsory targets repeated in each of the12 spectroscopic observations done for each of the 25 pointings so thatthey will accumulate a total integration time of (7 h×12) = 84 hours (perpointing) needed to reach a sufficient S/N for J, H = 26 (AB). The timeneeded for the broad-band z-, J- , H-band and narrow-band imaging willbe negligible with respect to the time dedicated to spectroscopy. With anappropriate strategy of repeated visits, the Deep Survey could be used alsofor detecting high-z SNe (see Section 2.3)
– The SPACE Galactic-plane survey will cover in Integral field mode thestrip within ±0.5 centered on the Galactic Equator between ±60 of galac-tic longitude. We will allocate 4 hr per pointing, i.e. 10 hours per squaredegree and 50 days total for the entire survey.
Allocating a fraction of the time to a Guest Observer Program will addvalue to the mission. We will split the Core Science program in a four phases
17
lasting approximately 9 months each, allowing the GO observing time to beramped up over time in a manner similar to the phasing in past missions suchas ISO and Spitzer. This will allow the core science program to be completedin a timely manner while providing the community with early instrument per-formance information and science results to use in the planning of observationsfor other studies.
13 SPACE Mission concept
13.1 Driving requirements
The science requirements identified in the previous sections place firm con-straints on mission concept and the design of instrument.
The first need is to access the whole celestial sphere for about 3 years. Thecore observing program requires 0.1′′ pointing stability for at least 20 min oftypical integration time, high temperature stability and good access to theground station for data downlink and telemetry. All these requirements areideally met by a large-amplitude halo orbit around the second Earth-sun La-grange point (L2). A halo orbit at L2 maximizes the availability of the skyfor observation with respect to the visual and thermal disturbance from theSun, Earth and Moon. The thermal environment is very stable and, with theexception of solar storms, the radiation environment is relatively low. On ahalo orbit of sufficient amplitude eclipses can be avoided altogether, while theconstant satellite-sun-Earth geometry eases the thermal control and the com-munications. L2 is considered the ideal vantage point for an IR observatoryand, following WMAP, several mission (e.g. Herschel, Planck, GAIA, JWST)will be operated at L2.
In order to measure a large number of sources, one needs multi-object spec-troscopic capability over an area of the order of 1 square degree. In order toobserve faint sources, one needs to operate in slit mode, exploiting the celestialbackground from space ∼ 500 times lower than from the ground. The sensi-tivity requirement also drives the telescope diameter, whereas the large fieldof view drive the effective focal length of the optical system. The broad wave-length range and resolution of the spectrograph drives the choice of materials(mirrors vs. lenses), the detector technology, the instrument temperature, andultimately the multiplexing capability of the instrument. In particular, theneed for extensive multi-object capability suggests considering Micro-Electro-Mechanical-Systems (MEMS), following the approach pioneered for NIRSPECon JWST ([34], [30]).
Having set through performance simulations the basic requirements on theinstrument parameters (see Sect. 11), we have evaluated several possible solu-tions and converged finally on an elegant design that satisfies all requirements.To keep complexity and cost to a minimum we aimed for a single-mode instru-ment rather an all-purpose machine with a variety of arms and configurations.Nevertheless, we came out with a solution which inherently provides an ex-
18
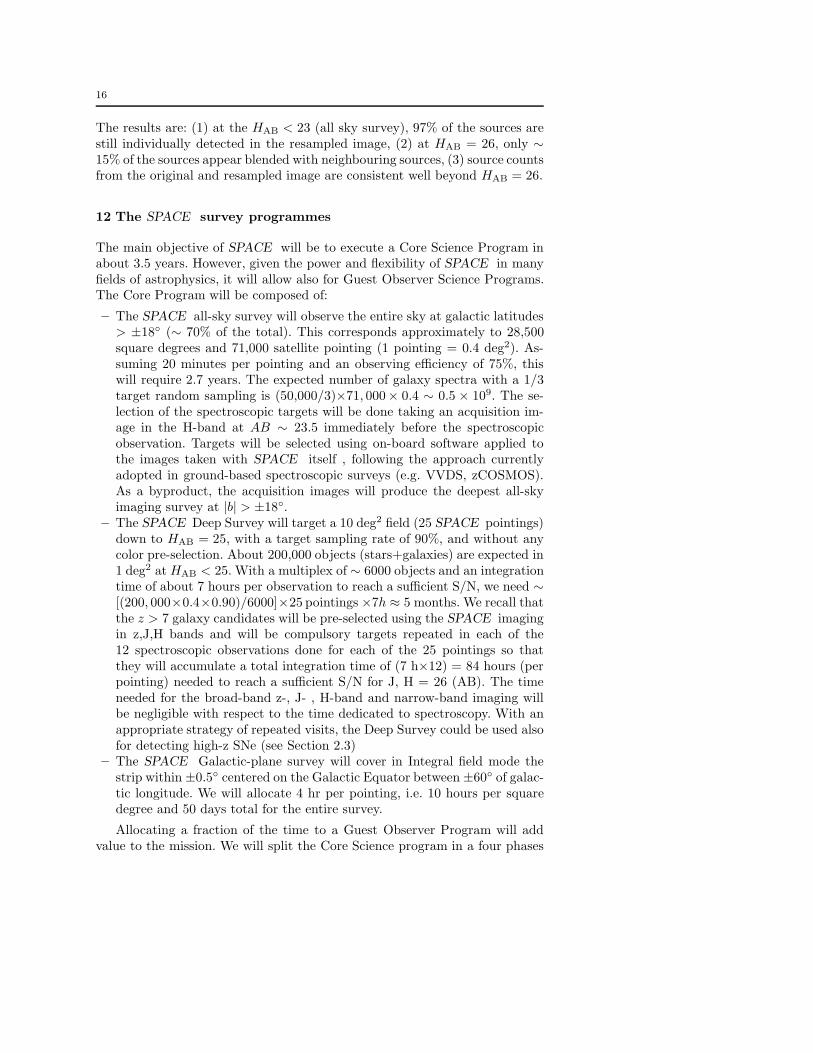
Fig. 6 Optical Telescope Assembly and fore-optics system (four channels).
traordinary degree of versatility without adding complexity, weight or cost tothe basic hardware needed for our main survey program. Using MEMS for tar-get selection we have several millions of randomly addressable optical switches.Depending on the MEMS configuration, and on the selection of a filter or aprism in a filter wheel (we may have a single filter wheel, which would thenrepresent the only moving part on SPACE) SPACE can perform imaging,slitless and slit spectroscopy (our main observing mode), and even wide-fieldintegral field spectroscopy using Hadamard transforms.
13.2 Payload description
The SPACE payload is a compact and modular instrument, fitting below theprimary mirror structure within a cylindrical envelope of 1.5 m diameter (thesize of the primary) by 60 cm height. To accommodate for our large field ofview, the beam is split into 4 identical channels, each one taking a 90 sectorof the cylinder. Each channel is a relatively conventional spectrograph with aMEMS device located at the intermediate focal plane. For the MEMS device wehave opted for a Texas Instrument DMD of 2048×1080 micro-mirrors, whereasfor the detector we use a 4k×4k infrared Focal Plan Assembly similar to theone developed for JWST. Each micro-mirror images a square 0.75′′ × 0.75′′
field onto 2× 2 detector pixels. Hereafter we will examine the baseline opticaldesign and the main component of a spectrograph more in detail.
19
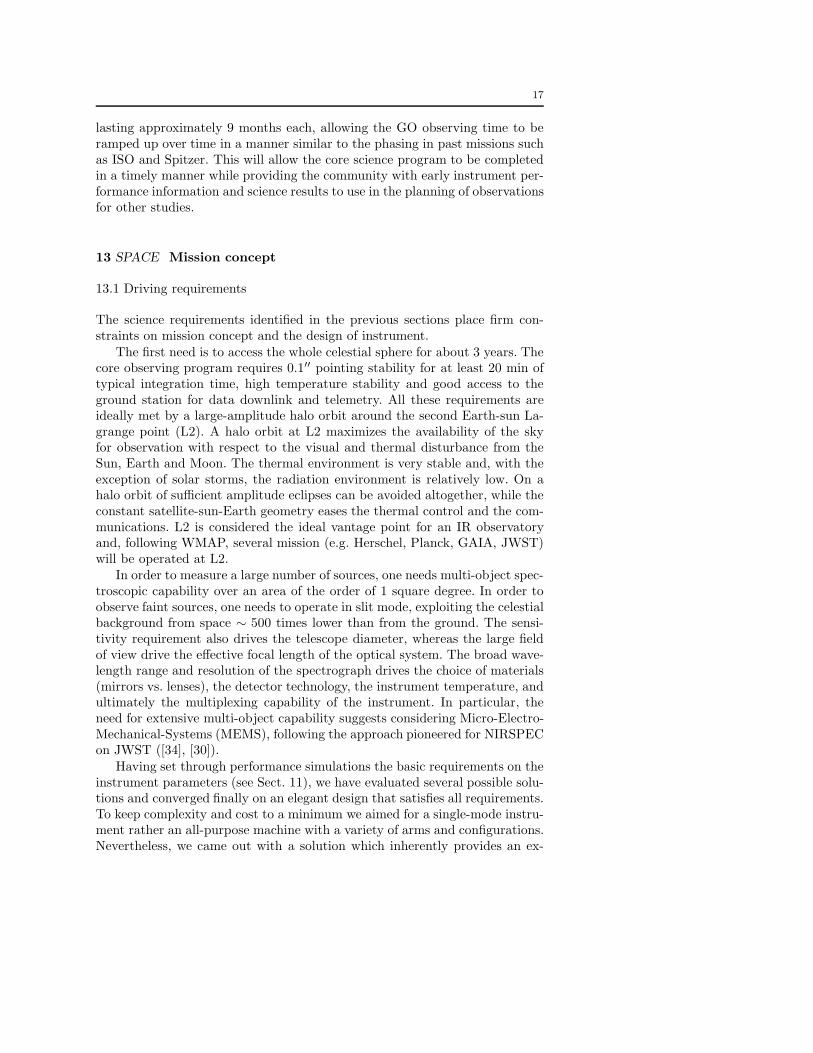
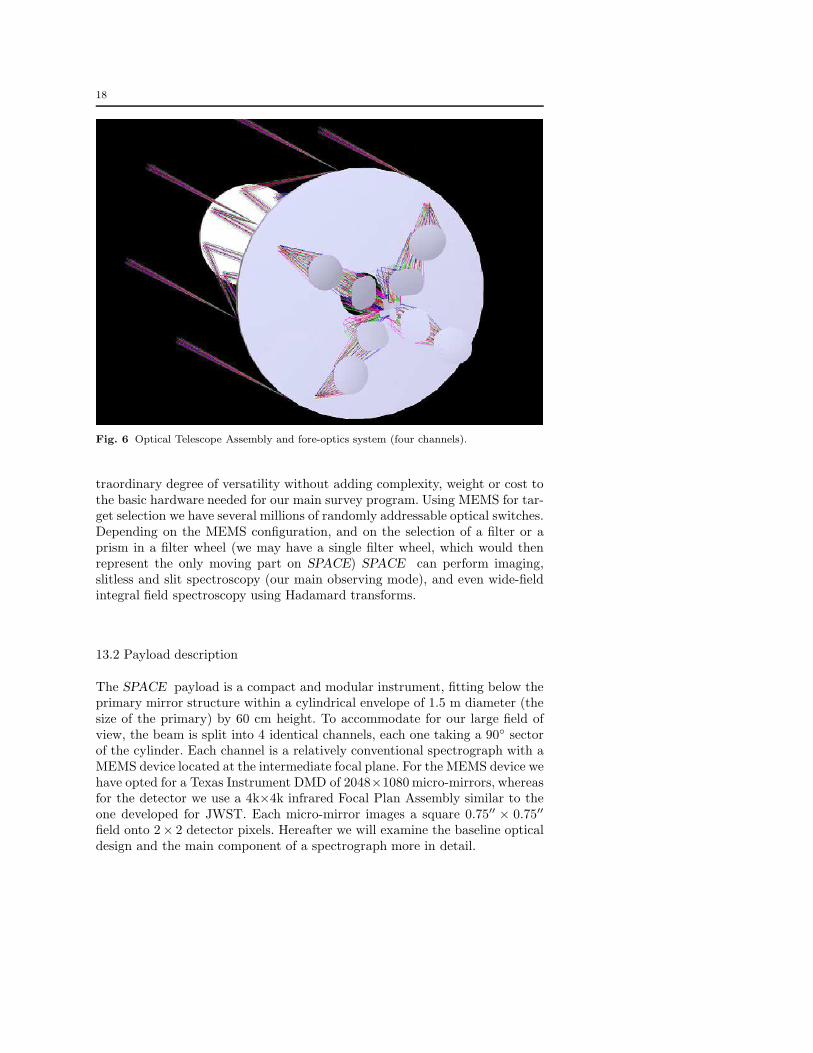
Fig. 7 Four-fold symmetric cross for theSPACE pyramid mirror allowing for 4 identi-cal optical channels.
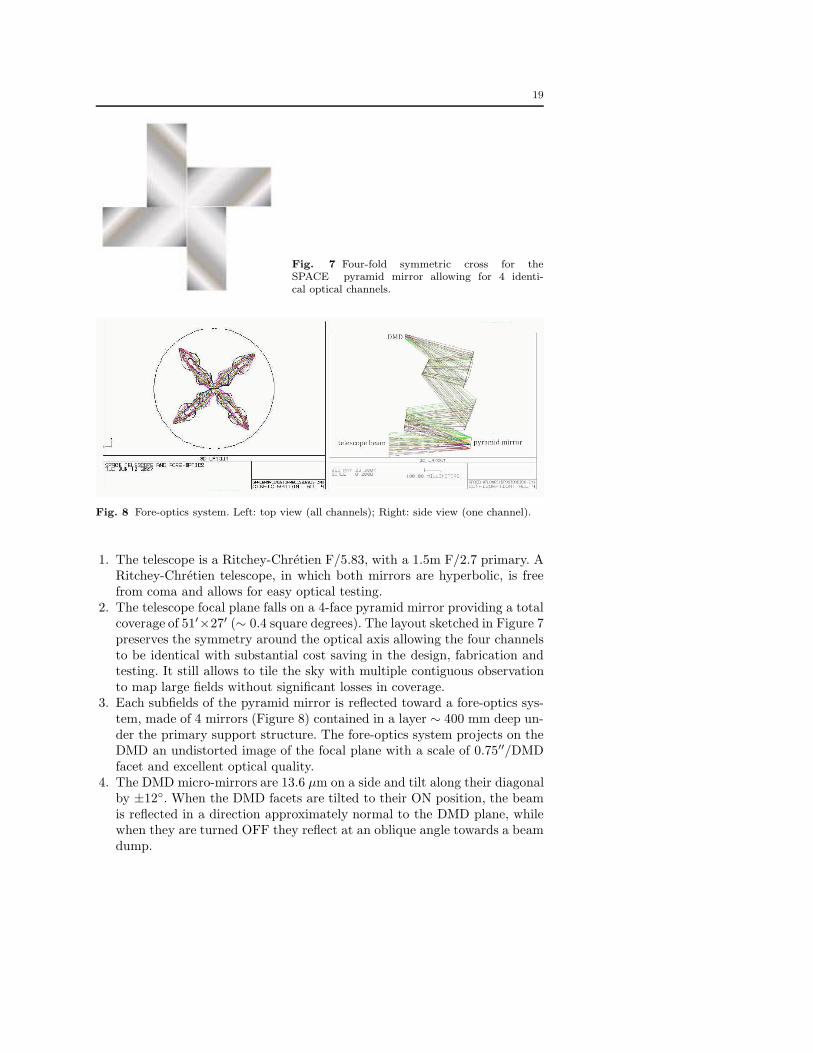
Fig. 8 Fore-optics system. Left: top view (all channels); Right: side view (one channel).
1. The telescope is a Ritchey-Chretien F/5.83, with a 1.5m F/2.7 primary. ARitchey-Chretien telescope, in which both mirrors are hyperbolic, is freefrom coma and allows for easy optical testing.
2. The telescope focal plane falls on a 4-face pyramid mirror providing a totalcoverage of 51′×27′ (∼ 0.4 square degrees). The layout sketched in Figure 7preserves the symmetry around the optical axis allowing the four channelsto be identical with substantial cost saving in the design, fabrication andtesting. It still allows to tile the sky with multiple contiguous observationto map large fields without significant losses in coverage.
3. Each subfields of the pyramid mirror is reflected toward a fore-optics sys-tem, made of 4 mirrors (Figure 8) contained in a layer ∼ 400 mm deep un-der the primary support structure. The fore-optics system projects on theDMD an undistorted image of the focal plane with a scale of 0.75′′/DMDfacet and excellent optical quality.
4. The DMD micro-mirrors are 13.6 µm on a side and tilt along their diagonalby ±12. When the DMD facets are tilted to their ON position, the beamis reflected in a direction approximately normal to the DMD plane, whilewhen they are turned OFF they reflect at an oblique angle towards a beamdump.
20
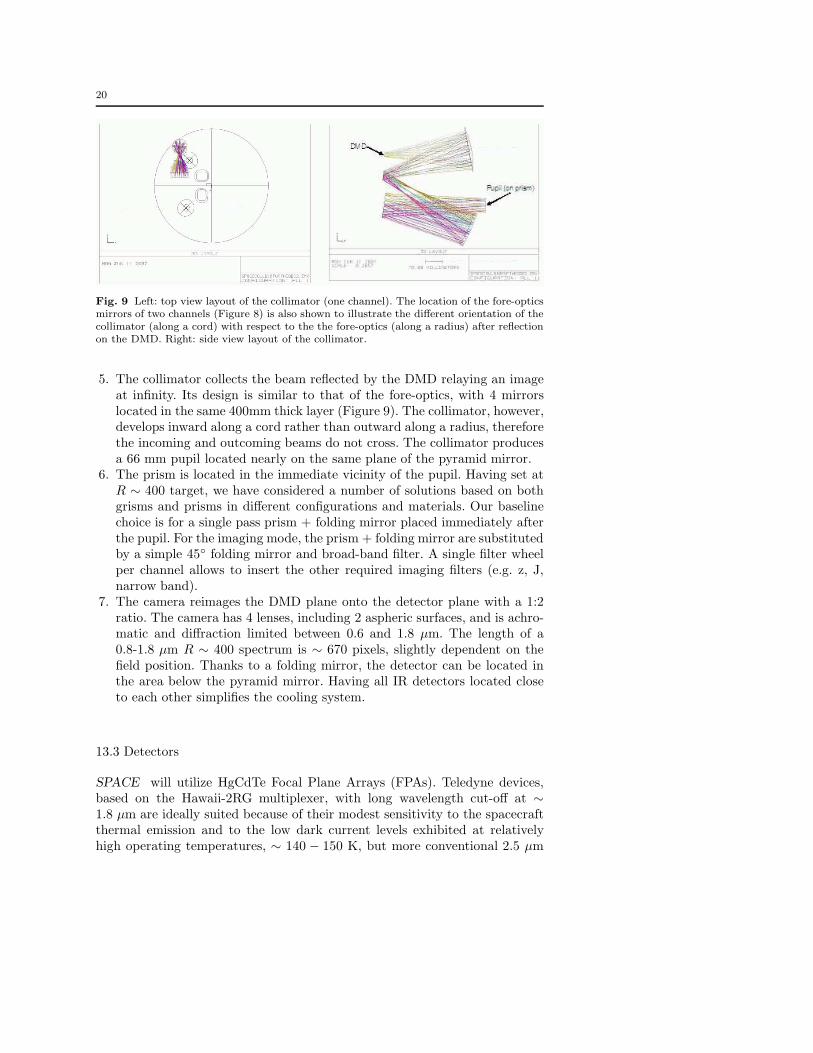
Fig. 9 Left: top view layout of the collimator (one channel). The location of the fore-opticsmirrors of two channels (Figure 8) is also shown to illustrate the different orientation of thecollimator (along a cord) with respect to the the fore-optics (along a radius) after reflectionon the DMD. Right: side view layout of the collimator.
5. The collimator collects the beam reflected by the DMD relaying an imageat infinity. Its design is similar to that of the fore-optics, with 4 mirrorslocated in the same 400mm thick layer (Figure 9). The collimator, however,develops inward along a cord rather than outward along a radius, thereforethe incoming and outcoming beams do not cross. The collimator producesa 66 mm pupil located nearly on the same plane of the pyramid mirror.
6. The prism is located in the immediate vicinity of the pupil. Having set atR ∼ 400 target, we have considered a number of solutions based on bothgrisms and prisms in different configurations and materials. Our baselinechoice is for a single pass prism + folding mirror placed immediately afterthe pupil. For the imaging mode, the prism + folding mirror are substitutedby a simple 45 folding mirror and broad-band filter. A single filter wheelper channel allows to insert the other required imaging filters (e.g. z, J,narrow band).
7. The camera reimages the DMD plane onto the detector plane with a 1:2ratio. The camera has 4 lenses, including 2 aspheric surfaces, and is achro-matic and diffraction limited between 0.6 and 1.8 µm. The length of a0.8-1.8 µm R ∼ 400 spectrum is ∼ 670 pixels, slightly dependent on thefield position. Thanks to a folding mirror, the detector can be located inthe area below the pyramid mirror. Having all IR detectors located closeto each other simplifies the cooling system.
13.3 Detectors
SPACE will utilize HgCdTe Focal Plane Arrays (FPAs). Teledyne devices,based on the Hawaii-2RG multiplexer, with long wavelength cut-off at ∼1.8 µm are ideally suited because of their modest sensitivity to the spacecraftthermal emission and to the low dark current levels exhibited at relativelyhigh operating temperatures, ∼ 140 − 150 K, but more conventional 2.5 µm
21
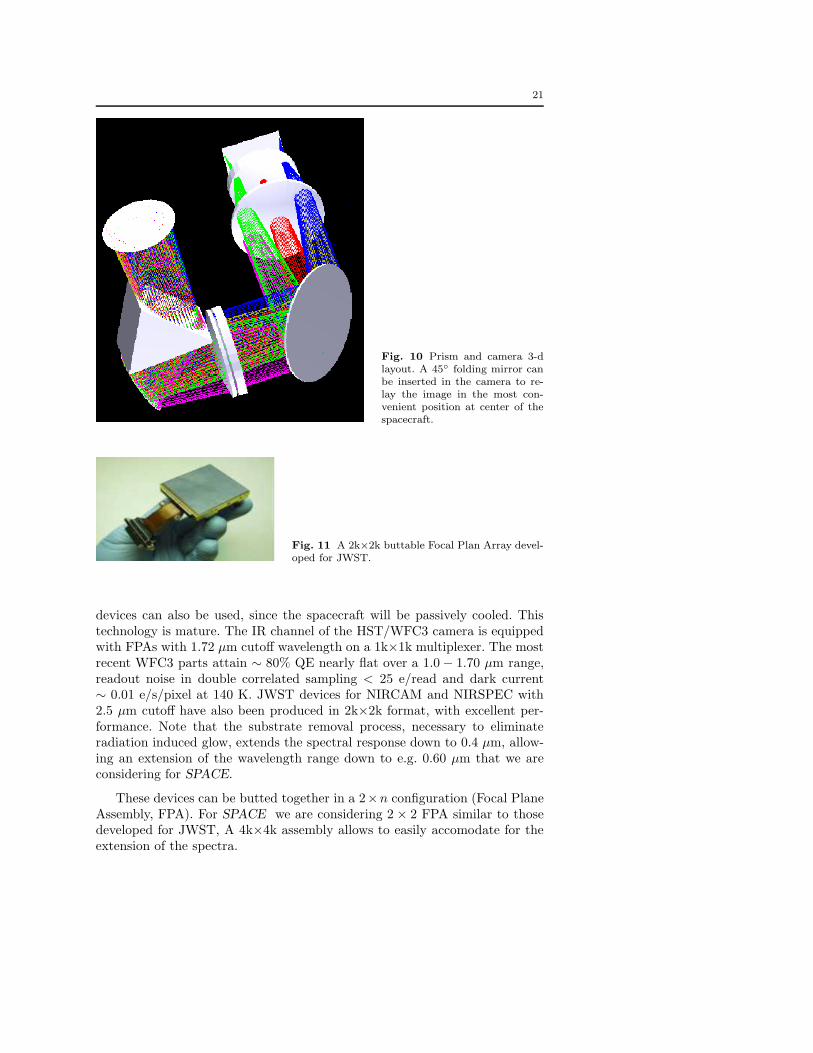
Fig. 10 Prism and camera 3-dlayout. A 45 folding mirror canbe inserted in the camera to re-lay the image in the most con-venient position at center of thespacecraft.
Fig. 11 A 2k×2k buttable Focal Plan Array devel-oped for JWST.
devices can also be used, since the spacecraft will be passively cooled. Thistechnology is mature. The IR channel of the HST/WFC3 camera is equippedwith FPAs with 1.72 µm cutoff wavelength on a 1k×1k multiplexer. The mostrecent WFC3 parts attain ∼ 80% QE nearly flat over a 1.0 − 1.70 µm range,readout noise in double correlated sampling < 25 e/read and dark current∼ 0.01 e/s/pixel at 140 K. JWST devices for NIRCAM and NIRSPEC with2.5 µm cutoff have also been produced in 2k×2k format, with excellent per-formance. Note that the substrate removal process, necessary to eliminateradiation induced glow, extends the spectral response down to 0.4 µm, allow-ing an extension of the wavelength range down to e.g. 0.60 µm that we areconsidering for SPACE.
These devices can be butted together in a 2×n configuration (Focal PlaneAssembly, FPA). For SPACE we are considering 2 × 2 FPA similar to thosedeveloped for JWST, A 4k×4k assembly allows to easily accomodate for theextension of the spectra.
22
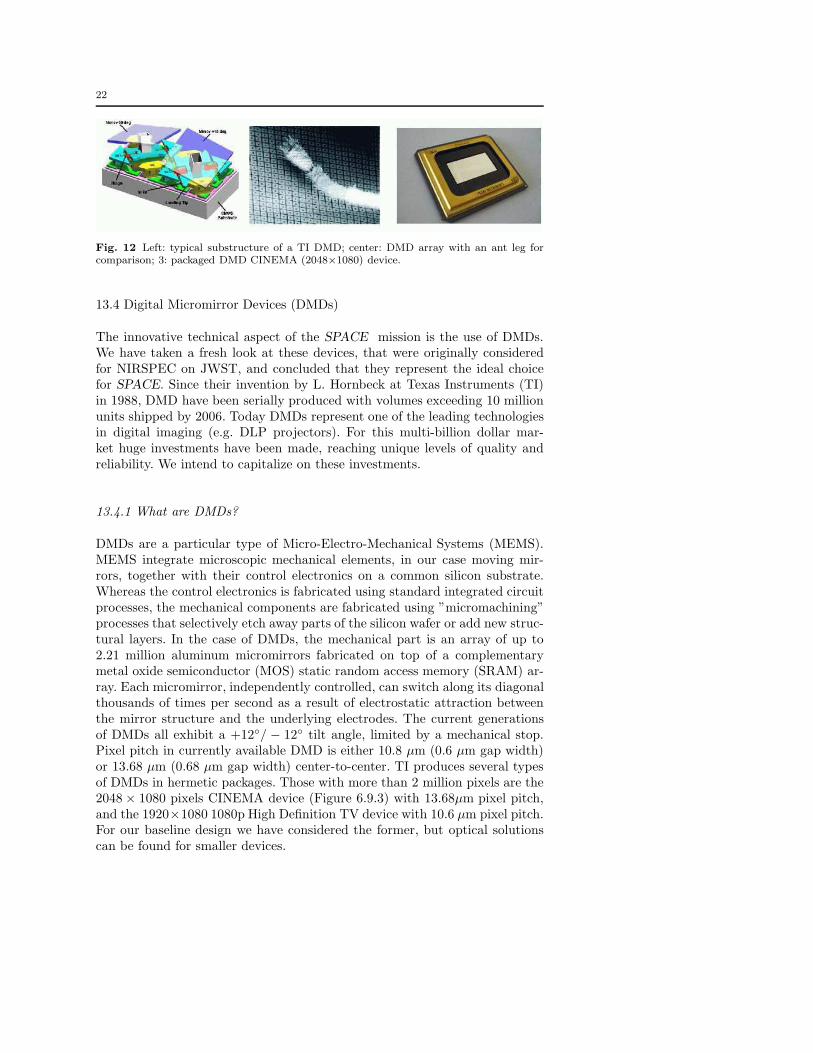
Fig. 12 Left: typical substructure of a TI DMD; center: DMD array with an ant leg forcomparison; 3: packaged DMD CINEMA (2048×1080) device.
13.4 Digital Micromirror Devices (DMDs)
The innovative technical aspect of the SPACE mission is the use of DMDs.We have taken a fresh look at these devices, that were originally consideredfor NIRSPEC on JWST, and concluded that they represent the ideal choicefor SPACE. Since their invention by L. Hornbeck at Texas Instruments (TI)in 1988, DMD have been serially produced with volumes exceeding 10 millionunits shipped by 2006. Today DMDs represent one of the leading technologiesin digital imaging (e.g. DLP projectors). For this multi-billion dollar mar-ket huge investments have been made, reaching unique levels of quality andreliability. We intend to capitalize on these investments.
13.4.1 What are DMDs?
DMDs are a particular type of Micro-Electro-Mechanical Systems (MEMS).MEMS integrate microscopic mechanical elements, in our case moving mir-rors, together with their control electronics on a common silicon substrate.Whereas the control electronics is fabricated using standard integrated circuitprocesses, the mechanical components are fabricated using ”micromachining”processes that selectively etch away parts of the silicon wafer or add new struc-tural layers. In the case of DMDs, the mechanical part is an array of up to2.21 million aluminum micromirrors fabricated on top of a complementarymetal oxide semiconductor (MOS) static random access memory (SRAM) ar-ray. Each micromirror, independently controlled, can switch along its diagonalthousands of times per second as a result of electrostatic attraction betweenthe mirror structure and the underlying electrodes. The current generationsof DMDs all exhibit a +12/ − 12 tilt angle, limited by a mechanical stop.Pixel pitch in currently available DMD is either 10.8 µm (0.6 µm gap width)or 13.68 µm (0.68 µm gap width) center-to-center. TI produces several typesof DMDs in hermetic packages. Those with more than 2 million pixels are the2048 × 1080 pixels CINEMA device (Figure 6.9.3) with 13.68µm pixel pitch,and the 1920×1080 1080p High Definition TV device with 10.6 µm pixel pitch.For our baseline design we have considered the former, but optical solutionscan be found for smaller devices.
23
13.4.2 Why DMDs? (instead of micro-shutter arrays)
The main alternative to DMD is the Micro-shutter array (MSA), which hasbeen developed and optimally matched to the IRMOS/JWST. MSAs representan outstanding technological achievement and are especially unique in their ca-pability of operating at low temperatures. However, they come in much smallersize (at the moment 171 × 365 pixels) and are still prone to cosmetic defects.Other figures of merit (e.g. filling factor, contrast, reliability) do not appear tobe superior to those achieved by the current generation of commercial DMDs.DMDs are technologically mature, already in use in Astronomy ([31]) and meetall the optical and technical needs of the SPACE mission. The issues (opticalquality, constrast, reliability, radiation environment, ....) related to the use ofDMD in our mission are discussed in detail in the SPACE proposal.
14 Performance assessment with respect to science objectives
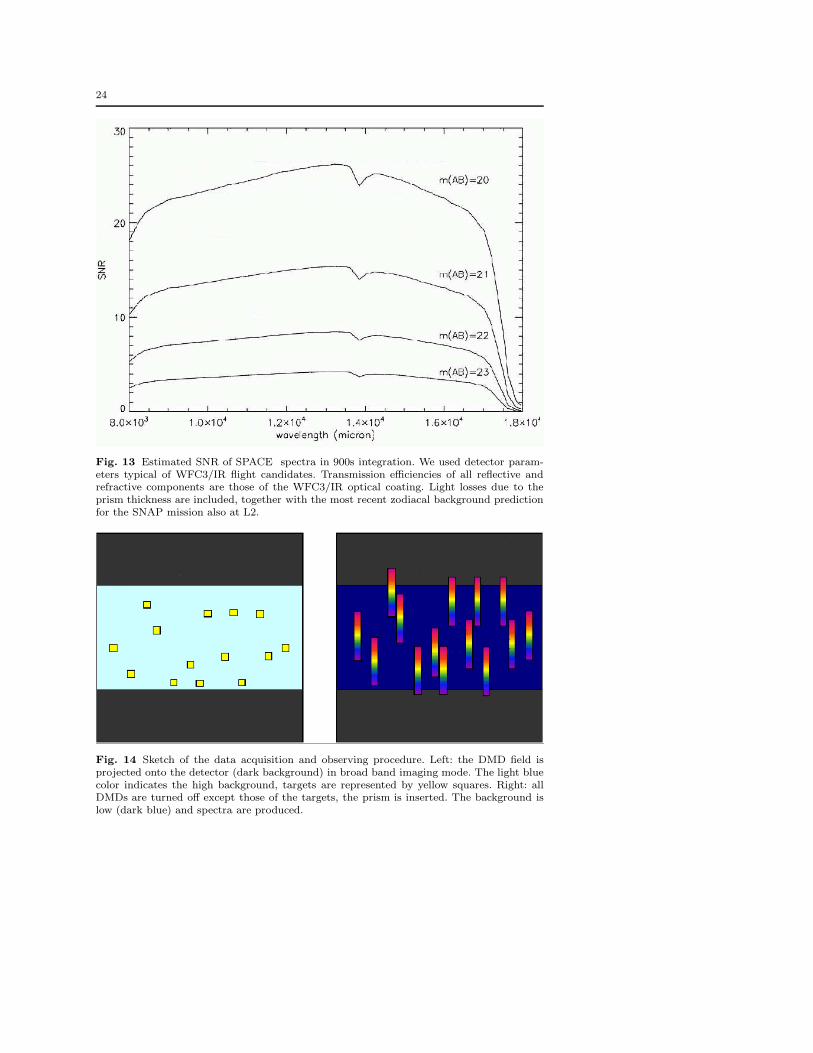
We have verified that with our proposed design SPACE reaches the sensi-tivity goals stated in the Sect. 11 and 12. Using the baseline optical designdescribed in the previous section we have estimated the signal to noise ra-tio per resolution element in 900 s of integration (Fig. 13). A SNR ∼ 3 atAB=23 is the sensitivity requirement derived in Section 3 for the All-sky sur-vey. The sensitivity estimates for the Deep Survey are also compatible withthe requirements.
15 Operating modes
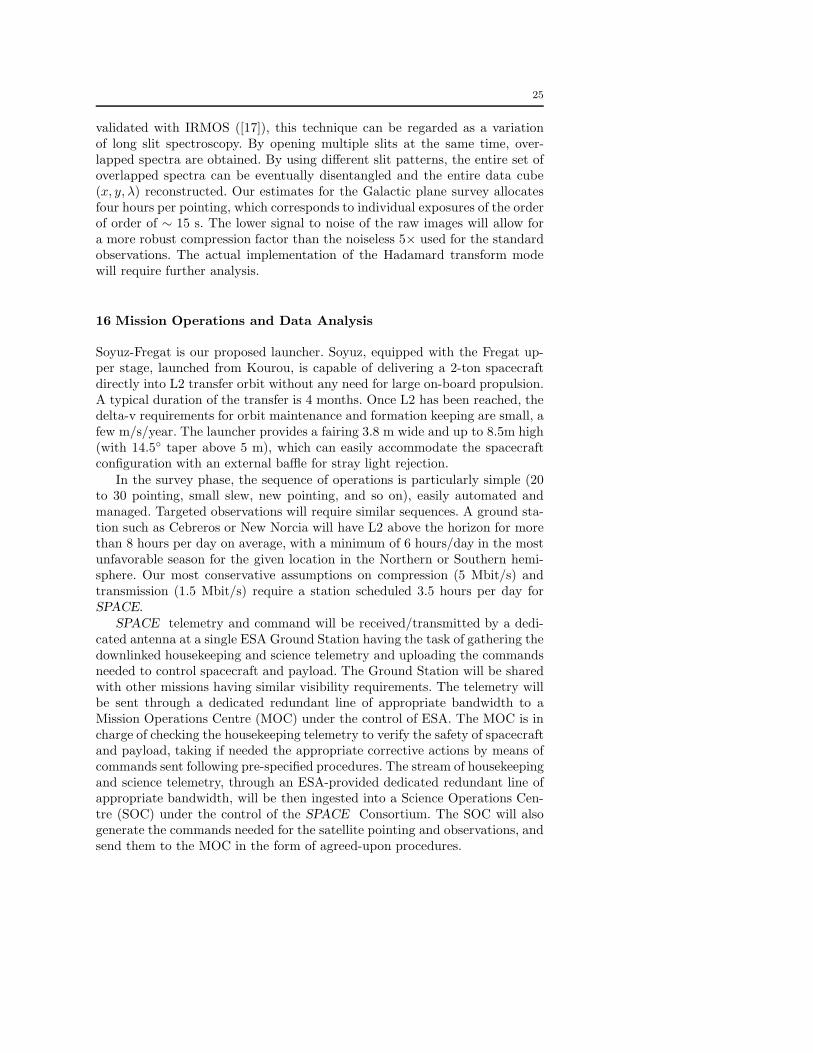
The all-sky survey will be performed repeating the same basic observing mode,sketched in Figure 14. After locking the guider, a ∼ 30 s broad-band imagewill be taken and corrected for dark, bad pixels and flat field using calibrationframes stored on-board. A software routine (similar to the one we used inSect. 11.1) will then automatically select the targets, generate and upload theoptimal DMD configuration. In the mean time, the prism will be inserted atthe place of the broad-band filter. We allocate 5 minutes for these operations,which will proceed in parallel on the four channels.
As mentioned in Sect. 11, refinements are possible, e.g. splitting the acqui-sition of spectra in multiple exposures to eliminate cosmic rays or to optimizethe extraction of the bright sources. The HAWAII 2RG detectors allow to ad-dress and read individual pixels while the others integrate (guide mode). Thiscapability may also be exploited to synchronize the readout of certain areaswith the opening of the corresponding slits.
The long exposures performed for the Deep Survey will be more efficient,avoiding the frequent broad-band acquisition. We plan to add telescope dither-ing to recover spatial resolution and dead pixels. For the integral field spec-troscopic survey of the Galactic plane, we will use Hadamard transform spec-troscopy. Proposed by J. Mather for NIRSPEC on JWST and successfully
24
Fig. 13 Estimated SNR of SPACE spectra in 900s integration. We used detector param-eters typical of WFC3/IR flight candidates. Transmission efficiencies of all reflective andrefractive components are those of the WFC3/IR optical coating. Light losses due to theprism thickness are included, together with the most recent zodiacal background predictionfor the SNAP mission also at L2.
Fig. 14 Sketch of the data acquisition and observing procedure. Left: the DMD field isprojected onto the detector (dark background) in broad band imaging mode. The light bluecolor indicates the high background, targets are represented by yellow squares. Right: allDMDs are turned off except those of the targets, the prism is inserted. The background islow (dark blue) and spectra are produced.
25
validated with IRMOS ([17]), this technique can be regarded as a variationof long slit spectroscopy. By opening multiple slits at the same time, over-lapped spectra are obtained. By using different slit patterns, the entire set ofoverlapped spectra can be eventually disentangled and the entire data cube(x, y, λ) reconstructed. Our estimates for the Galactic plane survey allocatesfour hours per pointing, which corresponds to individual exposures of the orderof order of ∼ 15 s. The lower signal to noise of the raw images will allow fora more robust compression factor than the noiseless 5× used for the standardobservations. The actual implementation of the Hadamard transform modewill require further analysis.
16 Mission Operations and Data Analysis
Soyuz-Fregat is our proposed launcher. Soyuz, equipped with the Fregat up-per stage, launched from Kourou, is capable of delivering a 2-ton spacecraftdirectly into L2 transfer orbit without any need for large on-board propulsion.A typical duration of the transfer is 4 months. Once L2 has been reached, thedelta-v requirements for orbit maintenance and formation keeping are small, afew m/s/year. The launcher provides a fairing 3.8 m wide and up to 8.5m high(with 14.5 taper above 5 m), which can easily accommodate the spacecraftconfiguration with an external baffle for stray light rejection.
In the survey phase, the sequence of operations is particularly simple (20to 30 pointing, small slew, new pointing, and so on), easily automated andmanaged. Targeted observations will require similar sequences. A ground sta-tion such as Cebreros or New Norcia will have L2 above the horizon for morethan 8 hours per day on average, with a minimum of 6 hours/day in the mostunfavorable season for the given location in the Northern or Southern hemi-sphere. Our most conservative assumptions on compression (5 Mbit/s) andtransmission (1.5 Mbit/s) require a station scheduled 3.5 hours per day forSPACE.
SPACE telemetry and command will be received/transmitted by a dedi-cated antenna at a single ESA Ground Station having the task of gathering thedownlinked housekeeping and science telemetry and uploading the commandsneeded to control spacecraft and payload. The Ground Station will be sharedwith other missions having similar visibility requirements. The telemetry willbe sent through a dedicated redundant line of appropriate bandwidth to aMission Operations Centre (MOC) under the control of ESA. The MOC is incharge of checking the housekeeping telemetry to verify the safety of spacecraftand payload, taking if needed the appropriate corrective actions by means ofcommands sent following pre-specified procedures. The stream of housekeepingand science telemetry, through an ESA-provided dedicated redundant line ofappropriate bandwidth, will be then ingested into a Science Operations Cen-tre (SOC) under the control of the SPACE Consortium. The SOC will alsogenerate the commands needed for the satellite pointing and observations, andsend them to the MOC in the form of agreed-upon procedures.
26
The SOC will distribute the data to a Science Data Centre (SDC), whichwill focus on the spectra contained in the images, their extraction, analysis,distribution, archiving and generation of scientific results. The SDC will repre-sent the interfaces between the project and the scientific community. The SDCwill receives both the raw data and pre-reduced data from the SOC, addingall services needed to efficiently exploit their science content.
Acknowledgments The authors aknowledge the support from the Universityof Bologna and the Space Telescope Science Institute. Thales Alenia - Milano(Italy) is warmly acknowledged for its contributions and support.
References
1. Albrecht A., et al. 2006, DETF report, http://home.fnal.gov/∼rocky/DETF/;2. Aldering, G. 2001, LBNL report number LBNL-51157.3. Amendola, L., 2000, Phys.Rev. D, 62, 3511 ;4. Angulo R., et al. 2005, MNRAS, 362, L25 ;5. Angulo R., et al. 2007, astro-ph/0702543;6. Astier P. et al. 2006, A&A, 447, 317. Baugh C.M. 2006, Reports on Progress in Physics, 69, 31018. Blake & Glazebrook K. 2003, ApJ, 594, 665;9. Bottini D. Et al. 2005, PASP, 117, 996;10. Bouwens R.J., Illingworth G.D., Blakeslee J.P. Franx M., 2006, ApJ, 653, 53;11. Bouwens R. et al. 2004, ApJ, 616, L79; Bouwens R. et al. 2004, ApJ, 624, L5;12. Capozziello et al. 2007, arXiv0706.1146;13. Choudhury T.R. & Ferrara A., 2006, MNRAS, 371 L55;14. Eisenstein D. et al. 2005, ApJ, 633, 560;15. Eisenstein D. et al. 2006, astro.ph.4362E;16. Fan, X., et al., 2004, AJ, 128, 515;17. Fixsen & MacKenty 2007, in prep.;18. Guzzo L. et al. 2008, Nature, in press19. Hamilton A.J.S. 2001, Technical Report, NASA GSFC;20. Hu & Haiman 2003, PhRvD, 68, 6;21. Huff E. et al. 2007, APh, 26, 351 ;22. Hutsi G. 2005, A&A, 449, 891;23. Hutsi G. 2006, A&A, 459, 375;24. Kashlinsky A., 2005, PhR, 409, 361;25. Kinney, A., Calzetti D., Bohlin R.C. et al. 1996, ApJ, 467, 3826. Linder E. 2005, Physical Review D, vol. 72, Issue 4, id. 04352927. Linder E., arXiv:0708.002428. Linder E., arXiv:0709.111329. Lue A., Scoccimarro R., Starkman G.D. 2004, Phys.Rev. D, 69, 124015;30. MacKenty & Stiavelli 2000, ASP Conf. 195, 443;31. MacKenty et al. 2006, SPIE 6269, 37M;32. Mannucci, F., Basile F., Poggianti B. 2001, MNRAS, 326, 74533. Martini P. & DePoy D.L., 2000, Proc. SPIE, Vol. 4008, p. 695;34. Moseley et al. 2000, ASP Conf. 207, 262;35. Mullis C. et al. 2005, ApJ, 623, L85;36. Padmanabhan, T. 2007, arXiv0705.2533;37. Peacock, J.A., et al 2006, ESA-ESO Working Group Report on Fundamental Cosmology,
astro-ph/0610906;38. Percival et al. 2007, arXiv0705.3323;39. Perlmutter, S., et al. 1999, ApJ, 517, 565;40. Pierleoni M. et al. 2007, submitted ;
27
41. Riess, A.G., et al. 1998, AJ, 116, 1009;42. Riess, A.G., et al. 2007, ApJ, 659, 98;43. Rosati P. et al. 2004, AJ, 127, 230;44. Salvaterra R., Magliocchetti M., Ferrara A., Schneider R., 2006, MNRAS, 368, L6;45. Sanchez, A.G., et al. 2006, MNRAS, 366, 189 ;46. Scannapieco E., Schneider R., Ferrara A., 2003, ApJ, 589, 35;47. Schaerer D., 2003, A&A, 397, 527;48. Shapley, A., Steidel C.C., Pettini M. et al. 2003, ApJ, 588, 6549. Seo H.-J. & D. Eisenstein 2003, ApJ, 598, 720;50. Seo H.-J. & D. Eisenstein 2005, ApJ, 633, 575;51. Sigad Y. et al. 2000, ApJ, 540, 62;52. Simcoe, R.A., 2006, AJ, 653, 977;53. Spergel et al. 2007, ApJS, 170, 377;54. Stanford S.A. et al. 2006, ApJ, 646, L13;55. Tegmark, M. 2003, Science, 296, 1427;56. Tegmark et al 2006, PhRvD, 74, 12;57. Thompson R. et al 2007, ApJ, 657, 66958. Trotta R., 2006, arXiv:astro-ph/060749659. Ketchum, W., and Wang, Y. 2007, submitted to ApJ (2007);60. Venemans, B., et al., 2007, MNRAS, 376L, 7661. Verde L. et al. 2001, MNRAS, 325, 412;62. Vestergaard, M. 2002 ApJ, 571, 733-75263. Wang Y. 2006, ApJ, 647, 1;64. Wang Y. 2007, arXiv:0710.388565. Wang Y., Mukherjee P. 2007, PRD, in press (arXiv:astro-ph/070378066. White S.D.M., Rees M. 1978, MNRAS, 183, 341;67. Willott, et al., 2005, ApJ, 633, 630;68. Wood-Vasey, W.M., et al. 2007, astro-ph/0701041;