Embed Size (px)
Citation preview

Durham E-Theses
Use of endogenous plant defensive proteins to confer
resistance to aphids in crop plants
Down, Rachel Elizabeth
How to cite:
Down, Rachel Elizabeth (1998) Use of endogenous plant defensive proteins to confer resistance to aphids in
crop plants, Durham theses, Durham University. Available at Durham E-Theses Online:http://etheses.dur.ac.uk/4786/
Use policy
The full-text may be used and/or reproduced, and given to third parties in any format or medium, without prior permission orcharge, for personal research or study, educational, or not-for-pro�t purposes provided that:
• a full bibliographic reference is made to the original source
• a link is made to the metadata record in Durham E-Theses
• the full-text is not changed in any way
The full-text must not be sold in any format or medium without the formal permission of the copyright holders.
Please consult the full Durham E-Theses policy for further details.

Academic Support O�ce, Durham University, University O�ce, Old Elvet, Durham DH1 3HPe-mail: [email protected] Tel: +44 0191 334 6107
http://etheses.dur.ac.uk
2

USE OF ENDOGENOUS PLANT DEFENSIVE PROTEINS TO CONFER
RESISTANCE TO APfflDS IN CROP PLANTS
A thesis submitted by Rachel Elizabeth Down, B. Sc. (Dunelm) in accordance with
the requirements of the University of Durham for the degree of Doctor of
Philosophy.
The copyright of this thesis rests with the author. No quotation from it should be published without the written consent of the author and information derived from it should be acknowledged.
Department of Biological Sciences
April 1998
1 2 HAY m§

DECLARATION
I declare that no part of this work has been submitted by me for any degree in this or any other university. All of the work presented was conducted by me, except where otherwise stated in the text.
Rachel E. Down
The copyright of this thesis rests with the author. No quotation from it should be published without his prior written consent and information derived from it should be acknowledged.

ABSTRACT
A liquid artificial diet system, which was suitable for bioassay of added compounds, was developed for the glasshouse potato aphid, Aulacorthum solani. The diet supported normal growth and reproduction of this insect. Once established, the artificial diet bioassay system was used to test potential insecticidal activities of a variety of proteins found naturally occurring in plants. Effects on survival, development and fecundity were measured.
The lectin found in snowdrop, Galanthus nivalis agglutinin (GNA) was found to significantly reduce the fecundity of A. solani, in terms of parthenogenetic nymph production, when administered in artificial diets at the 0.1% w/v level. No significant reductions in survival were found, although GNA administered in vitro did appear to slow the development of A. solani. Transgenic potato plants expressing GNA were used in a growth room trial to show that the reduction in fecundity with the in vitro trials could be reproduced in planta. Aphids feeding on the GNA-expressing potatoes had a significantly lower cumulative nymph production than those feeding on non-transformed plants. The transgenic plants had no effect on the survival of A. solani. The GNA-expressing plants were tested in a larger scale glasshouse trial and resulted in a significantly slower buildup of aphids when compared to control potatoes, thus confirming the results of the artificial diet bioassays and in planta growth room trials. Immunohistochemical studies were performed to detect the presence of GNA in the gut lumen of A. solani fed on artificial diet containing 0.1% w/v GNA; the lectin was observed to be selectively concentrated in the region of the epithelial membrane in the stomach, suggesting that binding to surface carbohydrates or glycoproteins was taking place. Binding to the gut surface has been suggested to mediate lectin toxicity in higher animals, and other insects.
A synergistic effect was observed with transgenic potatoes expressing a double construct encoding GNA and bean chitinase (BCH); A. solani cumulative nymph production on these plants was significantly reduced compared to aphids feeding on control and GNA-only expressing plants. However, interestingly, BCH-only expressing plants did not significantly affect the fecundity of A. solani, although a slight reduction in nymph production was observed.
On the basis of reports in the literature that suggested that chitin-binding lectins were toxic to insects, an attempt to isolate the gene encoding the chitin-binding stinging nettle lectin was made. RNA was extracted from nettle rhizomes and used to prepare a cDNA library. Successful library construction was verified. PCR methods and a primary screen of the library were used in an attempt to locate the gene.
I

CONTENTS
Page
Abstract I Contents I I -VI Figures List VII-IX Tables List X Plates List X I - X I I Memorandum X I I I Abbreviations XIV-XV Acknowledgements X V I
Chapter 1. Introduction 1
1.1 Setting the scene 1
1.2 Microbial biological control agents 2
1.3 Breeding resistant crop plants 3 1.4 The potential of plant-derived genes in the genetic manipulation of 4
crops for insect resistance 1.4.1 The use of protease inhibitors 4 1.4.2 The use of cx-amylase inhibitors 5 1.4.3 The use of lectins 5 1.4.4 The use of ribosome inactivating proteins 6
1.4.5 The use of chitinases 6
1.5 Methods of plant transformation 7
1.6 Lectins 8 1.6.1 Terminology 8 1.6.2 The role of plant lectins 9 1.6.3 Snowdrop lectin 15 1.6.4 Nettle lectin 16
1.7 Chitinases 18 1.7.1 General introduction on chitinases 18 1.7.2 Bean chitinase 20
1.8Aphids 21 1.8.1 The aphid alimentary tract and feeding 21 1.8.2 Life cycles and parthenogenetic reproduction 25
1.9 Natural plant defence against aphid attack 26
1.10 The glasshouse potato aphid 27 1.10.1 Biology 27 1.10.2 An example of plant defence systems against A. solani 30
1.11 Aims of research 31
Chapter 2. Materials and methods 32 2.1 Chemical and biological materials 32
2.1.1 Chemical reagents and equipment 32 2.1.2 Commonly used solutions and buffers 33 2.1.3 Maintenance of insect stock culture 36 2.1.4 Production of transgenic potato plants 37
I I

2.1.5 Maintenance of plant stocks 37
2.2 Artificial diet bioassays 38 2.2.1 Artificial diet preparation 38 2.2.2 Artificial diet feeding chambers 38 2.2.3 In vitro protein feeding trials 41 2.2.4 Proteins tested against A. solani in artificial diet bioassays 41
2.3 Controlled-environment transgenic plant trials against A. solani 42 2.3.1 Using whole plants 42 2.3.2 Clip cage method 43 2.3.3 Detached leaf bioassays 44
2.4 Aphid growth measurements 45
2.5 Glasshouse trials of A. solani using GNA-expressing potato plants 45
2.6 Calculating the expression levels of the inserted genes in transgenic plants 46 2.6.1 Bradford protein assay 46 2.6.2 Immunodot blot assay 46 2.6.3 Protein detection using radiolabeled secondary antibodies 47 2.6.4 ECL detection 47 2.6.5 Tissue blots 47
2.7 Histology 48 2.7.1 Preparation of specimens 48
2.7.1.1 Adults fed on artificial diet 48 2.7.1.2 Aphids fed on transgenic potato plants 48
2.7.2 Fixation of specimens 48 2.7.3 Dehydration and embedding of specimens 49 2.7.4 Sectioning of specimens 49 2.7.5 Immunohistochemical staining to detect the presence of
GNA/bean chitinase 49
2.8 SDS-Polyacrylamide gel electrophoresis 50 2.8.1 Preparation of SDS-PAGE minigels 50 2.8.2 Silver staining 51 2.8.3 Western blotting 51
2.9 Analysis of aphid honeydew 52 2.9.1 Honeydew collection 52 2.9.2 Analysis of honeydew 52
2.10 Gel electrophoresis of DNA 52
2.11 Formaldehyde gel electrophoresis of RNA 53
2.12 Investigating the variability of the stock A. solani 53 2.12.1 Variability in performance of A. solani on control artificial
diet 53 2.12.2 Genomic DNA extraction from individual aphids 54 2.12.3 RAPD-PCR 54
2.13 Isolation of the gene encoding a lectin expressed in the rhizomes of Urtica dioica (stinging nettle) 55
2.13.1 Genomic DNA extraction from Urtica dioica leaves 55 2.13.2 PCR using genomic DNA from Urtica dioica, to amplify
I I I

the gene encoding nettle lectin 56 2.13.3 Extraction of RNA from Urtica dioica rhizomes 56 2.13.4 Extraction of mRNA from total RNA of Urtica dioica
rhizomes 58 2.13.5 cDNA library synthesis from Urtica dioica rhizomes 58 2.13.6 Amplifying the gene encoding nettle lectin, using PCR,
from the cDNA library of Urtica dioica rhizomes 58 2.13.7 Electroelution of PCR products from agarose gel 59 2.13.8 Purification of PCR products for sequencing 59 2.13.9 Sequencing of PCR products 60 2.13.10 Excision and sequencing of random clones from the
Urtica dioica cDNA library 60 2.13.11 Plating out and screening of Urtica dioica cDNA library 60
2.14 Statistical analyses 61
Chapter 3. GNA bioassays: results and discussion 62 3.1 Artificial diet bioassays 62
3.1.1 First instar nymphs reared on diet incorporating 0.1 % GNA 62 3.1.2 First instar nymphs reared on control diet and transferred to
diet incorporating 0.1 % GNA upon maturity 62 3.1.3 The effect of 0.1% GNA on the growth and development
of A. solani 64 3.1.4 First instar nymphs reared on diet incorporating 0.05% GNA 67 3.1.5 Dose response bioassay of A. solani against GNA 69 3.1.6 Honeydew analysis of A. solani feeding on 0.1 % GNA 71
3.2 Controlled-temperature plant bioassays using transgenic potatoes expressing GNA 71
3.2.1 Aphids contained in clip cages on transgenic potatoes expressing GNA (bioassay number 1) 71
3.2.2 Aphids contained in clip cages on transgenic potatoes expressing GNA (bioassay number 2) 73
3.2.3 Whole-plant bioassay using transgenic potato plants expressing GNA 77
3.2.4 Growth measurements of aphids feeding on GNA-expressing potato 77
3.3 Glasshouse trials 79
3.3.1 Glasshouse trial using GNA-expressing potato plants 79
3.4 Discussion of results 82
Chapter 4. Bean chitinase bioassays: results and discussion 89 4.1 Artificial diet bioassay testing 0.1% w/v bean chitinase 89 4.2 Detached leaf bioassay using three different lines of bean chitinase-
expressing potato plants 89
4.3 Discussion of results 93
Chapter 5. GNA and bean chitinase combined: results and discussion 97 5.1 Controlled-environment plant bioassays 97
5.1.1 Clip cage bioassay using potato plants expressing GNA and bean chitinase 97
5.1.2 Whole plant bioassay using potato plants expressing GNA and bean chitinase 99
5.1.3 Detached leaf bioassay using transgenic potatoes expressing
I V

GNA and bean chitinase 102
5.2 Discussion of results 104
Chapter 6. Histology: results and discussion 108 6.1 Adults fed on artificial diet with or without 0.1% w/v GNA
incorporated 108
6.2 Aphids fed on transgenic potato plants expressing bean chitinaseand bean chitinase + GNA combined 113
6.3 Discussion of results 119
Chapter 7. Other protein bioassays: results and discussion 122 7.1 Results 122
7.1.1 Pea lectin 122 7.1.2 Nettle lectin 124 7.1.3 Concanavalin A 124 7.1.4 Canavalia brasiliensis lectin 127 7.1.5 Cratylia floribunda lectin 131 7.1.6 Ovalbumin 131 7.1.7 Soybean Bowman-Birk Inhibitor 134 7.1.8 5-Hydroxytryptamine 136 7.1.9 Lipoxygenase 138 7.1.10 Scoparone and scopoletin 140 7.1.11 Thaumatin 141
7.2 Discussions 141 7.2.1 Pea lectin 141 7.2.2 nettle lectin 142 7.2.3 Concanavalin A 143 7.2.4 Canavalia brasiliensis lectin 144 7.2.5 Cratylia floribunda lectin 146 7.2.6 Ovalbumin 146 7.2.7 Soybean Bowman-Birk Inhibitor 147 7.2.8 5-Hydroxytryptamine 148 7.2.9 Lipoxygenase 149 7.2.10 Scoparone and scopoletin 150 7.2.11 Thaumatin 150
Chapter 8. Aphid culture variability: results and discussion 152 8.1 Performance of aphids on control diet 152
8.2 Investigating differences within the genome of aphids from the stock
culture 152
8.3 Discussion 154
Chapter 9. Isolation of the gene encoding a lectin expressed in the rhizomes of stinging nettle (Urtica dioica) 159
9.1 Genomic DNA extraction from U. dioica leaves 159 9.2 Polymerase chain reaction using genomic DNA extracted from
U. dioica leaves 159
9.3 RNA extraction from U. dioica rhizomes 161
9.4 Extraction of mRNA from total RNA of U. dioica rhizomes 161
V

9.5 cDNA library synthesis using mRNA from U. dioica rhizomes 162
9.6 Polymerase chain reactions using the U. dioica rhizome cDNA library 163
9.7 Excision and sequencing of random clones of the U. dioica rhizome
cDNA library 166
9.8 Primary screening of the U. dioica rhizome cDNA library 166
9.9 Discussion 168
Chapter 10. Concluding discussion 169
Chapter 11. Bibliography 177
Appendix
V I
FIGURES
Page
Fig. 1. Structure of a chimaeric gene construct used in tobacco transformation.
Fig. 2. Map showing the distribution of the glasshouse potato aphid, Aulacorthum solani. 28
Fig. 3. Diagram of a blackman box of the type used in detached leaf bioassays and also for rearing the stock cultures. 45
Fig. 4. Graph showing the survival and cumulative nymph production per replicate of Aulacorthum solani against time, when fed on control diet with or without the addition of 0.1 % w/v GNA. 63
Fig. 5. Graph showing the survival and cumulative nymph production per replicate of Aulacorthum solani against time. Al l aphids were fed on control diet until day 10, when they were transferred to diet with or without the addition of 0.1 % w/v GNA. 65
Fig. 6. Graphs showing a) the mean length and width of the surviving aphids and b) the number of survivors of Aulacorthum solani, against time, when fed control diet with or without the addition of 0.1% w/v GNA. 66
Fig. 7. Graph showing the survival and cumulative nymph production per replicate of Aulacorthum solani against time, when fed on control diet with or without the addition of 0.05% w/v GNA. 68
Fig. 8. Graph showing the percentage survival of second generation Aulacorthum solani against time when fed on diet with or without the incorporation of 0.05% w/v GNA. 70
Fig. 9. Graph showing the percentage survival and fecundity per adult of Aulacorthum solani on control and GNA-expressing potato plants. 72
Fig. 10. Graphs showing a) the percentage survival and b) the fecundity per adult of Aulacorthum solani on control, GNA-expressing (GNA2-23, GNA2-28, GNA2-30 and PWG85) and wheat oc-amylase (WAI9-12) expressing potato plants. 74
Fig. 11. Plots showing a) the percentage survival of the initial aphids, b) the average number of nymphs found per plant, c) the average weight of the surviving adults, d) the average length and width of the survivng adults and e) total nymph biomass per plant of Aulacorthum solani on control and GNA-expressing plants. 78
Fig. 12. Graphs showing the estimated number of aphids/ cm 2 in a) the top leaf layer, b) the middle leaf layer and c) the lower leaf layer. This trial performed in the glasshouse, had mixed plant plots containing control and GNA-expressing potatoes. 80
V I I

Fig. 13. Graph showing the survival and cumulative nymph production per replicate of Aulacorthum solani against time, when fed on control diet with or without the addition of 0.1% w/v bean chitinase. 90
Fig. 14. Graphs showing a) the percentage survival, b)cumulative nymph production per surviving adult, c) the average length and d) the average width of the survivors on day 6 of Aulacorthum solani feeding on different transgenic lines of potato expressing bean chitinase (BCH1-7, BCH1-21 and BCH1-35). 92
Fig. 15. Graph showing the percentage survival and cumulative nymph production per adult of Aulacorthum solani feeding on control and transgenic (containing a double construct for GNA and bean chitinase) potato plants. 98
Fig. 16. Plots showing a) the percentage survival of the initial nymphs, b) the average number of nymhs found per plant, c) the average weight of the surviving adults, d) the average length and width of the surviving adults and e) total nymph biomass per plant of Aulacorthum solani on control potato and potato expressing GNA and bean chitinase. 101
Fig. 17. Graphs showing a) the survival and cumulative number of nymphs produced per replicate and b) the mean length and width of the survivors on day 5 for Aulacorthum solani feeding on control and transgenic (expressing GNA and bean chitinase) potato plants. 103
Fig. 18. Graph showing the survival and cumulative nymph production per replicate of Aulacorthum solani when fed artificial diet with or without the incorporation of 0.1 % w/v pea lectin. 123
Fig. 19. Graph showing the survival and cumulative nymph production per replicate of Aulacorthum solani when fed artificial diet with or without the addition of 0.1 % w/v nettle lectin. 125
Fig. 20. Graphs showing a) the survival per replicate and b) the mean length and width of the survivors on day 6 of Aulacorthum solani fed on artificial diet with or without the addition of Concanavalin A (at 0.1%, 0.05%, 0.02% and 0.01% w/v concentrations). 126
Fig. 21. Graph showing the survival and cumulative nymph production per replicate of Aulacorthum solani when fed artificial diet with or without the incorporation of 0.1% w/v Canavalia brasiliensis lectin. 128
Fig. 22. Graph showing a) survival and b) the cumulative nymph production per replicate of Aulacorthum solani when fed artificial diet with or without the addition of Canavalia brasiliensis lectin (at 0.2%, 0.1 %, 0.05% and 0.025% w/v concentrations). 130
Fig. 23. Graph showing the survival per replicate of Aulacorthum solani when fed artificial diet with or without the addition of 0.1% w/v Cratylia floribunda lectin. 132
Fig. 24. Graphs showing the survival and cumulative nymph production per replicate of Aulacorthum solani when fed artificial diet with or without the addition of 0.1% w/v ovalbumin on two separate occasions. 133
V I I I

Fig. 25. Graph showing the survival and cumulative nymph production per replicate of Aulacorthum solani when fed artificial diet with or without the addition of 0.1 % w/v soybean Bowman-Birk inhibitor. 135
Fig. 26. Graphs showing a) the survival and b) the cumulative nymph production per replicate of Aulacorthum solani when fed on 5-hydroxytryptamine (at concentrations of ImM, O.lmM, O.OlmM and O.OOlmM). 137
Fig. 27. Graphs showing the survival and cumulative nymph production per replicate of Aulacorthum solani when fed artificial diet with or without the addition of a) 0.1% and b) 0.2% w/v lipoxygenase. 139
Fig. 28. Graph showing the survival per replicate of Aulacorthum solani, against time, when feeding on artificial diet in a series of three bioassays. 153
Fig. 29. Diagram showing the published sequence of the gene encoding the lectin found in stinging nettle rhizomes (Lerner & Raikhel, 1992). 160
Fig. 30. Spectrophotometric profile showing the absorbance against wavelength (from 220-300nm) of an aliquot from one total RNA sample after the RNA extraction procedure had been completed. 161
Fig. 31. Spectrophotometric profile showing the absorbance against wavelength (from 220-300nm) of an aliquot of mRNA after following the mRNA isolation procedure. 162
Fig. 32. The nucleic acid profile and sequence for the random clone 13 when sequenced on an ABI automated sequencer in one direction using the SK primer. 167
I X

T A B L E S
Page
Table 1. Artificial diet recipe for rearing aphids, proposed by Dadd et al. (1966). 39
Table 2. Artificial diet recipe, for rearing Acyrothosiphon pisum proosed by Febvay a/. (1988). 40
X

PLATES
Page Plate 1. Photograph of an adult glasshouse potato aphid, Aulacorthum solani. 29
Plate 2. Photograph showing a clip cage in place over a potato plant leaf. 43
Plate 3. An example of an immunodot blot used to detect the expression level of GNA within transgenic plants. 76
Plate 4. Tissue blots of leaves from control and transgenic potato plants from one of the plots used in the glasshouse trial. 81
Plate 5. An example of an immunodot blot used to detect the expression level of bean chitinase within transgenic plants. 100
Plate 6. l|xm thick sections of an adult A. solani aphid, fixed, embedded and stained with toluidine blue solution to aid identification of internal structures. 109
Plate 7. l|j,m sections of an A. solani aphid fed on control artificial diet, fixed, embedded and stained with toluidine blue to show strctures of the alimentary canal. 110
Plate 8. l(xm sections of an A. solani aphid fed on control artificial diet, fixed and embedded. The Vectastain ABC kit was used to show the absence of GNA. 111
Plate 9. l^tm sections of an A. solani aphid fed on control artificial diet, fixed and embedded. Sections were incubated with pre-immune serum instead of primary antibody and the Vectastain ABC kit used for detection. 112
Plate 10. l | i m sections of an A. solani aphid fed on artificial diet with 0.1% GNA added, fixed and embedded. Pre-immune serum was used instead of primary antibody and detection carried out using the Vectastain ABC kit. 114
Plate 11. Low power photographs of l f im sections of an A. solani aphid fed on artificial diet with 0.1% GNA added, fixed and embedded. The Vectastain ABC kit was used to detect the presence of GNA. 115
Plate 12. High power photographs of l|Lim sections of an A. solani aphid fed on artificial diet with 0.1% GNA added, fixed and embedded. The Vectastain ABC kit was used to detect the presence of GNA within the sections. 116
Plate 13. High power photographs of l^im sections of an A. solani aphid fed on artificial diet with 0.1% GNA added, fixed and embedded. The Vectastain ABC kit was used to detect the presence of GNA within the sections. 117
X I

Plate 14. l(xm midgut sections of an A. solani aphid fed on artificial diet with 0.1% GNA added, fixed and embedded. The vectastain ABC kit was used to detect the presence of GNA within the sections. 118
Plate 15. Photograph showing samples of genomic DNA, electrophoresed on a 0.7% agarose gel, from the leaves of stinging nettle (Urtica dioica). 159
Plate 16. Photograph showing an ethidium bromide plate with a sample of the nettle rhizome cDNA library before ligation into the Uni-ZAP XR vector arms and amplification of the Uni-ZAP XR library. 163
Plate 17. Photograph showing PCR analysis using cDNA library of U. dioica rhizomes as the template and primer pair 2. The PCR products were separated on a 0.7% agarose gel containing ethidium bromide. 164
Plate 18. Photograph showing PCR analysis using cDNA library of U. dioica rhizomes as the template and primer pair 3. The PCR products were separated on a 0.7% agarose gel containing ethidium bromide. 165
Plate 19. Photographs of DNA profiles of the random clones excised from the cDNA library when plated out and miniprepped to purify before sequencing. Samples were electrophoresed on a 0.7% agarose gel. 166
X I I
MEMORANDUM
Parts of this work have been included in the following publication (see appendix):
Down, R.E., Gatehouse, A.M.R., Hamilton, W.D.O. and Gatehouse, J.A. (1996) Snowdrop lectin inhibits development and decreases fecundity of the glasshouse potato aphid (Aulacorthum solani) when administered in vitro and via transgenic plants both in laboratory and glasshouse trials. Journal of Insect Physiology 42 (11-12), 1035-1045.
xiin

ABBREVIATIONS
APS - ammonium persulphate
BCH - Bean chitinase
BSA - Bovine Serum Albumin
BT -Bacillus thuringiensis toxin
CaMV 35S - Cauliflower mosaic virus 35S constitutive promoter
CBL - Canavalia brasiliensis lectin
Con A - Concanavalin A (lectin from jackbean)
CpTI - Cowpea Trypsin inhibitor
(k)Da - (kilo) Dalton
DMSO - dimethyl sulphoxide
(c)DNA - (complementary) deoxyribonucleic acid
DTT - dithio threitol
ECL - Enhanced Chemiluminescent
EDTA - ethylenediaminatetra-acetic acid
GlcNAc - N-acetylglucosamine
GNA - Galanthus nivalis agglutinin (snowdrop lectin)
HIV - human immunodeficiency virus
5-HT - 5-hydroxytryptamine
L - litre
PAGE - polyacrylamide gel electrophoresis
PBS - phosphate-buffered saline
PCR - Polymerase Chain Reaction
PHA - phytohemagglutinin
PM - peritrophic membrane
PMSF - phenylmethylsulphonyl fluoride
RIP - ribosome inactivating protein
(m)RNA - (messenger) ribonucleic acid
XIV

Rnase - ribonuclease
RSsl - Rice sucrose synthase promoter
SBBI - soybean Bowman-Birk inhibitor
SDS - sodium dodecyl sulphate
sp. - species
TEMED - NNN'N'tetramethylethylenediamine
Tris - Tris(hydroxymethyl)aminomethane
Tween-20 - Polyoxyethylenesorbitan monolaurate
UDA - Urtica dioica agglutinin (stinging nettle lectin)
WGA - wheatgerm agglutinin
X V

ACKNOWLEDGEMENTS
I would like to acknowledge the financial support provided by BBSRC and the Department of Biological Sciences, Durham University for the use of their facilities.
I would like to thank the following for the provision of materials: AXIS Genetics Ltd for the transgenic plants; L.N. Gatehouse and R.D.D. Croy for the primary antibodies; Y. Rahbe' for the supply of aphids; L.N. Gatehouse for the bean chitinase; T. Grangiero for the Canavalia brasiliensis and Cratylia floribunda lectins; K. Horsham for the Urtica dioica lectin and A.Q. Panhwar for the pea lectin.
I gratefully acknowledge J. Bartley for DNA sequencing; Jackie Spence for advice with the microscopy; G.M. Davison and A.M.R. Gatehouse for their help with the glasshouse trial and N. Sauvion who collaborated with the initial transgenic plant trials.
I would also like to thank my supervisors, J.A. Gatehouse and A.M.R. Gatehouse for their support throughout the project; K.S. Powell for useful discussions regarding homopteran bioassay systems and D.P. Bown for help and advice with the molecular biology.
Finally, thank you to my parents and friends for support during the project.
X V I
1. INTRODUCTION
1.1 Setting the scene
Rising demands on crop yields coupled with a projected short-fall in crop production have resulted in intense farming methods which in turn have increased the potential for insect damage (Gatehouse et al., 1993). At present an estimated ISIS0/© of crop loss is directly attributed to insect pests, despite the use of chemical insecticides (Boulter, 1989; Gatehouse et al., 1993). Several disadvantages, both economical and ecological, are associated with reliance on chemical pesticides. Industrial chemicals are costly to develop and apply (which usually has to be done more than once), they are inefficient in that a large proportion applied fails to reach the target insect and, they are environmentally unfriendly since they can leach into water sources, degrade the environment and work their way up food chains (Gatehouse et al., 1992). The exclusive use of pesticides can cause a rapid build-up of resistance amongst insect populations (Metcalf, 1986), reducing the effective lifespan of a chemical. An estimated 450 arthropod species are resistant to insecticides. Three possible mechanisms of insecticide resistance exist: physical resistance involving processes such as a slower or reduced intake of insecticide, due to modifications of the exoskeleton, or increased excretion rates; metabolic resistance where enzymatic metabolism is modified to increase detoxification or stop activation of the insecticide and; altered target site mechanisms where sensitivity to the insecticide is decreased due to an alteration in the target site (Callaghan, 1991). Insecticide-resistant aphid populations have arisen as a direct result of intensive and widespread use of chemicals (Devonshire, 1989). Resistance to organophosphates in the peach-potato aphid, Myzus persicae, is a result of increased esterase activity, which hydrolyses and sequesters organophosphates (Devonshire, 1989). There are seven degrees of resistance in M. persicae populations, each one having a two-fold increase in esterase, suggesting that this is a result of gene amplification (Devonshire, 1991). The non-selectivity of insecticides can affect the relationships between pests and natural predators, often in favour of the pest species (Gatehouse et al., 1993). Some aphicide residues have been shown to be toxic to beneficial invertebrates; in particular, dimethoate doses at the current recommended field application rate are particularly harmful to two beneficial coleopterans found in cereal crops (Unal & Jepson, 1991). The public are becoming increasingly more concerned over the use of chemical pesticides, demanding a reduction in usage as awareness of alternative methods of pest management is raised.
1

1.2 Microbial biological control agents
An alternative approach to the problem of pest control is the use of biological control agents, either in their natural form or modified to enhance their effect; organisms which act as naturally occurring insect pathogens can be manipulated to increase their effectiveness. For example, crystals produced during sporulation by the bacterium Bacillus thuringiensis have been shown to have insecticidal activity (Hannay, 1953; Hannay & Fitz-James, 1955; Schnepf & Whiteley, 1981). The spores of certain B. thuringiensis strains have now been in limited use against certain insect species for 25 years (Hilder et al., 1992), the first commercially available strain being known as "Thuricide" (Peferoen, 1992). This was later replaced by a more potent strain known as HD-1 isolated by Dulmage (1970) and applied against many lepidopteran pests. Other strains have since been identified to act against coleoptera, diptera, hymenoptera and more recently against homopterans, particularly aphids (as reported by Walters & English, 1995).
However, resistance to some commercially available strains of B. thuringiensis (BT) spore-crystal protein complexes has occurred. The lepidopteran pest of stored grain, Plodia interpunctella, can develop resistance to a commercial formulation within a few generations and this has been detected in bins of BT-treated grain (McGaughey, 1985). This resistance to a particular BT strain was demonstrated to be due to a 50-fold reduction in membrane receptor affinity although susceptibility to a different strain then increased (Van Rie et al., 1990). McGaughey (1985) suggested that stored grain was an ideal environment for the development of resistance because it remains undisturbed for a long time allowing insects to breed for several generations in contact with the BT. Resistance in a crop field is likely to take longer due to the instability of foliarly applied BT and transitory plant-pest interactions.
Naturally occurring insect pathogenic baculoviruses, which have a limited host range but work relatively slowly, can also be manipulated to enhance their effectiveness as control agents. For example recombinant baculoviruses have been produced, expressing a toxin present in mite (Pyemotes tritici) venom (Tomalski & Miller, 1991) and an insect-specific neurotoxin from the venom of the North African scorpion, Androtonus austral is (Stewart et al., 1991). Both of these paralysed and reduced survival time of Trichoplusia ni larvae. The modified baculoviruses retained the ability to produce polyhedra and replicate so that virus-injected larvae died of a typical viral infection i f paralysis did not occur.
2

1.3 Breeding resistant crop plants
Breeding crop plants for insect resistance has several advantages over the reliance of chemical insecticides. These include:
- season long protection,
- insects are treated at the most sensitive stage, - protection is independent of the weather, - no application costs are involved, - protection of tissues which are difficult to reach with chemicals, - only the crop-eating insects are exposed, - the material is confined to the expressing plant tissue, - no leaching into the environment occurs, - the active factor is biodegradeable, - the choice of suitable genes and gene products ensure that it is not toxic to
man or mammals, - consumer acceptability, well defined and characterised gene products are
used instead of unspecified pesticide residues, - financial savings (Gatehouse et al., 1992).
An alternative strategy in pest control is the use of genetic engineering to make crop plants resistant to their target pest species. This method has the same advantages as mentioned above but also has three further plus-points over conventional plant breeding methods. Firstly, incompatibility barriers can be crossed, both inter- and intraspecifically. Secondly the desired genes can be transferred without the co-transfer of undesirable characteristics and thirdly, the technology is theoretically less time consuming than conventional plant breeding methods (Gatehouse et al., 1992). However there are also limitations to this technology; namely the inability to transform and regenerate some crop plants (mainly the monocotyledons), although these problems are being addressed and overcome, the identification and production of useful non-toxic (to man and mammals) genes and lastly, the regulatory barriers and lack of information provided to the public concerning the use of transgenic crops (Gatehouse et al., 1992).
Transgenic plants expressing modified B. thuringiensis toxin genes have been shown to have insecticidal activities (Barton et al., 1987; Fischhoff et al., 1987; Vaeck et al., 1987). Plants expressing these genes have since appeared in the field but protection is only given against a limited number of species (mainly
3
lepidopterans). Of particular interest, transgenic potato plants expressing a B. thuringiensis tenebrionis 5-endotoxin gene have been demonstrated to have no effect on the feeding behaviour of the peach-potato aphid, Myzus persicae (Shieh et al., 1994).
1.4 The potential of plant-derived genes in the genetic manipulation of crops for insect resistance
A further strategy for producing crop plants resistant to insect attack is to transfer genes of plant origin, using genetic manipulation. There are several groups of plant proteins whose genes are potential candidates for the genetic manipulation of crop plants.
1.4.1 The use of protease inhibitors
The function of protease inhibitor proteins in many plant species is unknown, although evidence suggests that they are involved in plant defence against insect attack (Ryan, 1973). These proteins are usually found in high concentrations in tissues most vulnerable to insect attack, such as the seeds or tubers (Ryan, 1973; Richardson, 1977). They can be induced in aerial parts of the plant by mechanical wounding or attack from herbivorous insects (Green & Ryan, 1972). These proteins are able to inhibit some insect proteases but are only rarely able to inhibit the proteases within plants (Kirsi & Micola, 1971), thus it seems likely that they are involved in defence against invading micro-organisms and insects.
There are several examples of protease inhibitors showing activity against insect gut proteases (Birk et al., 1963; Applebaum et al., 1964; Wolfson & Murdock, 1987; Christeller & Shaw, 1989) and against insects in artificial diet bioassays (Lipke et al., 1954; Gatehouse et al., 1979; Gatehouse & Boulter, 1983; Broadway & Duffey, 1986; Hines etal, 1990; Johnston et al., 1993; Burgess et al., 1991 and 1994). The gene encoding the trypsin inhibitor, CpTI, from Cowpea (Vigna unguiculata) was the first plant-derived gene to be successfully engineered into another plant conveying enhanced insect resistance (Hilder et al., 1987). The gene, engineered into tobacco under the control of the CaMV 35S promoter was expressed in transformants up to approximately 1 % of total soluble protein. The transgenic plants were tested against the lepidopteran pest, Heliothis virescens and showed enhanced resistance to insect attack in terms of number of survivors, insect biomass and leaf area eaten. Similar results were obtained with other lepidoptera, including H. zea, Spodoptera littoralis and Manduca sexta (Gatehouse et al., 1992). Other protease
4

inhibitors have now been used in genetic engineering. Johnson et al. (1989) engineered the tomato protease inhibitor I I gene into tobacco, resulting in resistance against M. sexta and potato proteinase inhibitor I I expressed in transgenic tobacco has been shown to have an adverse effect upon Chrysodeixis eriosoma (McManus et al., 1994).
1.4.2 The use of a-amylase inhibitors
a-amylase inhibitors have been purified from many plants, being especially abundant in cereal grains (Garcia-Olmedo et al., 1987). They can inhibit both mammalian and insect gut a-amylases or be insect specific (Deponte et al., 1976). An a-amylase inhibitor isolated from Phaseolus vulgaris seeds was shown to be active against an enzyme extract from a major storage pest, Zabrotes subfasciatus (Gatehouse et al., 1987) and had detrimental effects against other bruchids when fed in artificial diet (Ishimoto & Kitamura, 1989; Huesing et al., 1991a). Other a-amylase inhibitors, such as those from wheat have adverse effects against enzymes of Tribolium confusum and Callosobruchus maculatus, although in feeding trials toxicity was only demonstrated against C. maculatus (Gatehouse et al., 1986a). Pueyo et al. (1995) assayed bean and wheat a-amylase inhibitors in vitro and in vivo against stored product insect pests and found that the effects varied from non-toxic to toxic, depending on the particular insect species. An a-amylase inhibitor isolated from sorghum {Sorghum bicolor) was found to inhibit insect a-amylases from the locust and cockroach (Bloch & Richardson, 1991).
The gene encoding the a-amylase inhibitor from P. vulgaris has been engineered into tobacco (Altabella & Chrispeels, 1990) and the gene encoding wheat a-amylase inhibitor has been used to transform potato although reports of insect trials using these plants are limited. However, Ishimoto et al. (1996) demonstrated that transgenic azuki bean (Vigna angularis) expressing the seed a-amylase inhibitor of P. vulgaris could effectively stop the development of three Callosobruchus bruchid species although a fourth, Z. subfasciatus, could develop normally.
1.4.3 The use of lectins
Lectins are carbohydrate-binding proteins, found in many plant species and are particularly abundant in seeds and storage tissues (Peumans & Van Damme, 1995). Section 1.6 gives a more indepth discussion of lectins.
5

There are several examples of transgenic plants engineered with genes encoding lectins. For example, the gene encoding the lectin from pea (Pisum sativum) has been successfully transformed into tobacco; when tested against H. virescens, larval biomass and leaf damage were reduced (Boulter et al., 1990). The genes encoding the lectin from snowdrop have also been successfully introduced into both tobacco (Shi et al., 1994, Hilder et al., 1995) and potato (Gatehouse et al., 1996). Trials with two different aphid species (Hilder et al., 1995; Gatehouse et al., 1996 and Down et al., 1996) and lepidopteran species (Gatehouse et al., 1997; Fitches et al., 1997 in press) have been successful in reducing insect numbers and affording a degree of protection to the plants.
1.4.4 The use of ribosome inactivating proteins
It is thought that another class of plant proteins, the ribosome inactivating proteins (RIPs) or cytotoxins may be involved in plant protection. There are two types of RJPs, known as type 1 and type 2 (Stirpe & Barbieri, 1986). Type 2 RIPs are extremely potent cytotoxins causing irreversible inactivation of eukaryotic cytosolic ribosomes. Type 1 RIPs are generally not as toxic in vivo although they can be potent inactivators in vitro (Stirpe & Barbieri, 1986). Gatehouse et al. (1990) showed that both type 1 and type 2 RIPs were toxic to two Coleopteran species but not towards the Lepidopteran species tested. Hence some RIPs (notably the type 1 RIPs) may have a future in genetic engineering of crop plants to confer insect resistance.
1.4.5 The use of chitinases
Chitinases catalyse the hydrolysis of chitin, a polymer with p-1,4 linkages between N-acetylglucosamine (GlcNAc) residues (Collinge etal, 1993). Section 1.7 contains a further, more indepth discussion of chitinases.
To date there are only a few examples of transgenic plants engineered with a foreign plant chitinase gene. Rustica (unpublished data) have engineered the gene encoding a tomato chitinase into oilseed rape with the potential to confer insect resistance, although no reports of any insect trials using these plants are available. The gene encoding a bean chitinase has been successfully expressed in potato, alongside a gene encoding GNA; these plants have shown a degree of resistance against the peach-potato aphid, Myzus persicae (Gatehouse et al., 1996). However, potato plants expressing bean chitinase provide only very limited protection against the lepidopteran species, Lacanobia oleracea (Gatehouse et al., 1997).
6

1.5 Methods of plant transformation
The most useful method of gene transfer is the Ti-plasmid system of Agrobacterium tumefaciens (Boulter, 1989). A. tumefaciens is a Gram-negative bacterium which causes crowngall in plants; it is a natural gene vector. During infection a small section of DNA, known as the T-DNA (present on the bacterial plasmid), is inserted into the genome of a cell of the host plant. These inserted genes can then be expressed by the infected cells. This process can be manipulated to transfer specific genes to host plants (Webb & Morris, 1992). Removal of the oncogenes present in the T-DNA section enables A. tumefaciens to be used as a vector for transformation. Foreign genes can be inserted within the T-DNA of the original (but disarmed) Ti plasmid (cis) or on an additional, non-virulent plasmid (trans) (Webb & Morris, 1992).
A reporter gene, inserted alongside the transgene, is necessary to study gene expression in the transgenic plants. The reporter genes used often encode bacterial enzymes which do not usually occur in plants and which can easily be assayed for their presence. P-glucuronidase (gus), nopaline synthase (nos) and chloramphenicol acetyltransferase (cat) are examples of reporter genes; of these gus is the most commonly used since it is the easiest to detect and the assay method is extremely sensitive (Webb & Morris, 1992). A selectable marker gene, inserted with the gene of interest and reporter gene enables successful transformants to be selected. The selection agents most commonly used are antibiotics, such as kanamycin and hygromycin. Neomycin phosphotransferase I I , encoded by the nptll gene is able to detoxify kanamycin, allowing successful transformants to grow on kanamycin-containing medium and has been successfully used in tobacco, potato and tomato transformation (An et al., 1986). Prokaryotic regulators do not generally work in eukaryotic systems, except for promoters of the nos gene and promoters from plant viruses which are dependent on plant transcription and translation. Therefore a suitable promoter must be inserted to enable expression of the foreign genes. The most common promoter used is that of the 35S RNA gene from the cauliflower mosaic virus (CaMV 35S), which enables constitutive expression of the foreign genes throughout the tissues of the host plant. An example of a gene construct is that used by Shi et al. (1994) to engineer the gene encoding GNA into tobacco (see Fig. 1).
7

pBRSSLT
3089bp L.474bp J
RB LB SaJl Bam bal
KanR RSsl GNA NOS
7 ATG AT
GCT GCC AAG CTA GAG GAT CCT CTA GAG TCC GGT TCC
Fig. 1. Structure of a chimaeric gene construct used in tobacco tranformation. pBRSSLT is the vector used. RB, T-DNA right border; LB, T-DNA left border; KanR, kanomycin resistance cassette consisting of the neomycin phosphotransferase I I gene fused to the nopaline synthase promoter and terminator; RSsl, rice sucrose synthase-1 promoter including 5' flanking region, transcription start site, the first intron and translation start codon; GNA, snowdrop lectin coding sequence; NOS, nopaline synthase terminator. The sequence shown is the fusing region between the RSsl promoter and GNA. The restriction sites relevant for cloning are included. Taken from Shi etal. (1994).
Other methods of gene transfer include direct gene transfer to protoplasts either by chemical treatments (Krens et al., 1982), DNA delivery via liposomes (Matthews & Cress, 1981), electroporation (Fromm et al., 1986); direct gene transfer to cells and tissues by microprojectile bombardment (Klein et al., 1989), macroinjection into plants (De la Pena et al., 1987), DNA uptake into imbibing zygotic embryos (Topfer et al., 1989), microinjection into cells, DNA transfer via the growing pollen tube and fibre-mediated delivery to plant cells (as discussed by Webb & Morris, 1992).
1.6 Lectins
1.6.1 Terminology
The first lectin was discovered by Stillmark in 1888 from extracts of castor bean; since then several hundred have been identified and characterised (Peumans & Van Damme, 1995). The term lectin originally referred to any carbohydrate-binding protein that could agglutinate erythrocytes of a particular human blood group (Peumans & Van Damme, 1995), but since then proteins showing a less specific
8

agglutination behaviour, agglutinating erythrocytes and other cells, have been named as lectins (Peumans & Van Damme, 1995). Goldstein & Hayes (1978) described lectins as "carbohydrate-binding proteins that bind glycans of glycoproteins, glycolipids, or polysaccharides with high affinity". Peumans & Van Damme (1995) have suggested that any protein with at least one noncatalytic domain that is able to reversibly bind to a specific carbohydrate could be termed a lectin. This means they do not have to be able to precipitate glycoconjugates or agglutinate cells. Consequently, a number of carbohydrate-binding proteins which only possess one binding site can be referred to as lectins (Peumans & Van Damme, 1995). Lectins are thought to have evolved through gene duplication and divergence (Chrispeels & Raikhel, 1991). Some plant proteins with a noncatalytic carbohydrate-binding domain also possess a catalytic region. These include the type 2 RIPs (e.g. ricin and abrin) which consist of a toxic A chain and a carbohydrate-binding B chain (Barbieri et al., 1993) and class I chitinases, such as UDA (Urtica dioica agglutinin), composed of a chitin-binding hevein-like domain and a catalytic chitinase domain (Collinge et al., 1993).
Lectins can be classified into three groups: merolectins, hololectins and chimerolectins (Peumans & Van Damme, 1995). Merolectins, such as hevein (Van Parijs et al., 1991) and proteins from orchids (Van Damme et al., 1994), are small, single polypeptide proteins with only one carbohydrate-binding site, incapable of precipitating glycoconjugates and agglutinating cells. Hololectins have two or more carbohydrate-binding domains with identical or similar amino acid sequences; they do not possess any other domains (Peumans & Van Damme, 1995). Most known lectins are hololectins, including the lectin found in Snowdrop bulbs (Galanthus nivalis agglutinin, GNA) (Van Damme et al., 1987), and pea lectins (Trowbridge, 1974; Higgins et al., 1983). Chimerolectins possess a carbohydrate-binding domain and an unrelated domain with catalytic activity, such as UDA from stinging nettle rhizomes (Peumans et al., 1984; Lerner & Raikhel, 1992).
1.6.2 The role of plant lectins
Several possible roles for plant lectins have been suggested including a defensive role against attack by pathogens, insects and mammalian herbivores (Chrispeels & Raikhel, 1991; Peumans & Van Damme, 1995). Most plant lectins are secretory proteins and eventually accumulate in vacuoles, cell walls and intercellular spaces (Chrispeels & Raikhel, 1991). Legume seed lectins such as concanavalin A and pea lectin act as storage proteins. They can make up to 10% of the total soluble protein of the seeds and are stored in the vacuoles of the cotyledon cells, with lower levels
9

in the embryonic axes. These lectins are broken down to provide amino acids during germination and development (Chrispeels & Raikhel, 1991; Etzler, 1985). Lectins can also be found in cereal seeds, such as wheat (Raikhel et al., 1984), but are present in much lower amounts (ljug/dry grain) and only in specific layers such as the surface layers of the coleorhiza and embryo rootcap (Mishkind et al., 1982; Etzler, 1985, Chrispeels & Raikhel, 1991). Lectins can also occur in other plant parts, such as roots, rhizomes, leaves and stems, although not usually in as high a concentration as found in seeds (Etzler, 1985). Lectins present at low concentrations may be involved in recognition processes where use of their carbohydrate-binding properties will be made (Peumans & Van Damme, 1995). Lectin receptors are glycoconjugates with a carbohydrate configuration complementary to that of the lectin binding site; so far none have been found in plants (Peumans & Van Damme, 1995). Despite this however, there is evidence to suggest they might function in cell recognition, such as incompatibility systems (Knox et al., 1976) and morphogenesis (Howard et al., 1972). Legume root lectins are thought to be involved in the recognition and binding of Rhizobium and Bradyrhizobium spp. in nodule symbiotic relationships (Diaz et al., 1986 & 1989; Bohlool & Schmidt, 1974).
Constitutive lectins can be found in the sieve tubes of many species (Gietl et al., 1979; Sabnis & Hart, 1978; Read & Northcote, 1983). The presence of lectins in phloem tissue does not necessarily mean that they will be present in the sap. The protein may not be transported to the sap, may be unstable or could be bound structurally to the sieve tubes (Shi et al., 1994). However, lectins have been found in phloem exudates from genera of the Cucurbitaceae family (Sabnis & Hart, 1978; Read & Northcote, 1983). Read & Northcote (1983) found two phloem proteins in each exudate. The larger one, PP1, was demonstrated to be responsible for the gellation of the exudate when the petioles were cut, by forming filaments on oxidation (Kleinig et al., 1975); this did not require the presence of the lectin (Read & Northcote, 1983). PP2, the lectin, is a dimeric protein which is incorporated into the filaments in vivo using disulphide bridges (Sabnis & Hart, 1978). Both proteins are thought to have an anti-invasive action, with the filaments cross-linking to form a gel, sealing wounded sieve-tubes, and the lectin by binding microorganisms to maintain sterility (Gietl et al., 1979). The basic phloem proteins will also bind to acidic cell walls (Read & Northcote, 1983). Evert et al. (1973) also hypothesised that phloem proteins might be involved in maintaining an even flow of sap; the lectin could bind to glycolipids and glycoproteins at the edges of the sieve tube elements, thus ensuring that the filaments were kept at the sides of the tubes.
10

Lectins have similarities with other plant defence proteins, being unusually stable in unfavourable conditions, including heat, a wide pH range and animal and insect proteases, although some plant predators are able to digest lectins with their gut proteases (Peumans & Van Damme, 1995). They are often abundant in parts of the plant, such as storage organs and seeds, which are more likely to be attacked due to their attractiveness and lack of an active defence system. Hence it could be argued that they are acting as a passive defence system as well as a nitrogen reserve (Peumans & Van Damme, 1995; Chrispeels & Raikhel, 1991). Although only small amounts of lectins are found in Gramineae seeds, their local concentration in specific layers (notably the ones that come into contact with the soil) is high, also suggesting a role in defence against pathogens (Mishkind et al., 1982; Raikhel et al., 1984). Lectins are one of the few groups of plant proteins able to recognise and bind glycoconjugates on the surface of microorganisms and within insect and mammalian alimentary canals. As their name suggests, chitin-binding lectins are capable of binding chitin which is a common component of fungal cell walls and insect exoskeletons (including the lining of the gut) (Peumans & Van Damme, 1995). Plant lectins have a much higher binding affinity towards oligosaccharides, rather than simple sugars; this adds further support to a defence role since oligosaccharides are not common in plants (Peumans & Van Damme, 1995).
Type 2 RIPs are the only plant lectins capable of binding to plant viruses, which do not possess glycans (Peumans & Van Damme, 1995). However animal and human viruses do possess glycoproteins and many plant lectins have been shown to have inhibitory effects against these in vitro (Balzarini et al., 1992). Lectins are unable to permeate bacterial cell walls so do not have access to the membranes and intracellular structures of bacteria. However they can interact with extracellular glycans or cell wall carbohydrates. For example, some legume seed lectins bind to muramic acid, N-acetylmuramic acid and muramyl dipeptides present in bacterial cell walls and evidence suggests that the lectin from thorn apple (Datura stramonium) seeds blocks mobility of bacteria at the air/water interface, preventing potentially harmful bacteria from invading seedling roots (see review by Peumans & Van Damme, 1995).
Some plant lectins, particularly the chitin-binding lectins possess antifungal activity. Again, the cell walls prevent lectins from interacting with glycoconjugates on fungal membranes and entering the cell cytoplasm. Wheat germ agglutinin was found to bind to hyphal tips and septa of Trichoderma viride (Mirelman et al., 1975) and other fungal species (Barkai-Golan et al., 1978; Brambl & Gade, 1985). The inhibition of spore germination was due to the lectin binding to the chitin of the
11

emerging hyphal tip. Inhibition is thought to be due to the cross-linking of chitin, caused by lectin binding, thus preventing selective lysis of pre-existing chitin, required for the deposition of newly synthesised chitin. When this process is disturbed, chitin synthesis is thought to stop (Mirelman et al., 1975). Brambl & Gade (1985) also observed adventitious branching of spore germ tubes and a sensitivity to osmotic lysis in several fungal species in the presence of lectins. A chitinase-free preparation of UDA inhibits the growth of several chitin-containing fungi, again probably by interferring with cell wall synthesis (Broekaert et al., 1989). Hevein, from rubber tree latex (Van Parijs et al., 1991) and Amaranthus caudatus lectin have also been shown to have antifungal properties (Broekaert et al., 1992).
Glycoproteins are major constituents of the luminal membranes of gut epithelial cells in insects and are in direct contact with ingested food, thus there are many potential binding sites for plant lectins within the insect gut. When a lectin binds to a receptor it could cause a local or systemic deleterious response which may result in an antifeedant effect, growth retardation, or death (Peumans & Van Damme, 1995). The first demonstration of a lectin with anti-insect properties was in 1976 by Janzen et al. when the lectin from P. vulgaris (PHA) killed larvae of the cowpea weevil, C. maculatus. However the toxic effect, also demonstrated by Gatehouse et al. (1984), was claimed to be due to a contaminating a-amylase inhibitor (Huesing et al., 1991a) while Murdock et al. (1990) argued that rigorously purified PHA was not toxic to the cowpea weevil. Many different plant lectins have since been shown to be toxic against many different insect orders including Coleoptera (Czapla & Lang, 1990; Huesing et al., 1991b & 1991c; Murdock et al., 1990), Lepidoptera (Shukle & Murdock, 1983; Czapla & Lang, 1990; Boulter et al., 1990; Gatehouse et al., 1992), Diptera (Eisemann et al., 1994) and Homoptera (Powell et al., 1993; Habibi et al., 1993; Rahbe etai, 1995; Cole, 1994a).
At present it is uncertain how lectins interact with receptors in the insect gut, although there are three possible mechanisms: a binding of lectins to the glycoconjugates exposed on epithelial cells; a binding of lectins to glycosylated digestive enzymes, or in the case of the chitin-binding lectins, binding to the chitin in the peritrophic membrane and cuticle surrounding most of the regions of the insect gut (Peumans & Van Damme, 1995).
An immunofluorescence study on the binding of P. vulgaris lectin in C. maculatus showed that the lectin bound to the luminal membrane of midgut epithelial cells and was occasionally also seen binding to the distal cell membrane, suggesting that the
12
lectin is able to cross the luminal membrane (Gatehouse et al., 1984). No evidence was seen of lectin binding to the peritrophic membrane but it was not known whether this was because the lectin was able to cross the membrane or whether it was disrupted. In mature larvae some lectin binding was observed on the surfaces of fat cells at the outer edge of the gut epithelium. The authors suggested that this was due to a re-organisation of the gut epithelium which occurs prior to pupation, allowing the lectin to diffuse into the adipose tissue. However, the revelations of Huesing et al. (1991a) and Murdock et al. (1990) that vigorously purified PHA was not toxic to C. maculatus, raises questions about the meaning of these observations; it would appear that although PHA is binding to the midgut epithelium, it does not disrupt normal cell and gut function.
Lectin-binding to fat-body cells has also been observed in Drosophila larvae (Rizki & Rizki, 1983). In this case the cell membranes appeared to be polarised, with a much higher concentration of WGA lectin-binding sites on the cell surfaces in contact with the basal membrane and facing the haemocoel, with fewer sites on parts of the cell membrane in contact with other cells. It was also observed that during pupation the distribution of binding sites was altered so that they were spread more evenly over the entire cell surface.
Eisemann et al. (1994) demonstrated three mechanisms of lectin toxicity against blowfly, Lucilia cuprina, larvae. The first was a reduction in the amount of diet ingested by the larvae, either due to a gustatory effect or possibly because of a loss of larval activity due to lectin toxicity. A possible gustatory effect could be due to lectin binding to glycoproteins on chemoreceptors leading to a feeding inhibition. Lectin was also shown bound to the peritrophic membrane (PM) of the larvae. Lectins with N-acetylglucosamine specificities could bind directly to the chitin present in the PM whereas those with other sugar specificities must have bound to glycoproteins present in this membrane. Lectin was also observed bound to the apical membranes of the midgut epithelial cells, although no disruption of these cells was seen. Thus it was concluded that lectins must be able to pass through the PM after ingestion. A layer of precipitous substances was seen along the gut lumen side of the peritrophic membrane. It was hypothesised that the binding of lectin to the PM resulted in an aggregation of precipitated lectin and other proteins which could restrict the bi-directional movement of nutrients and digestive enzymes across the membrane (Eisemann et al., 1994).
Immunohistochemical studies on the rice brown planthopper, Nilaparvata lugens, have shown GNA binding to midgut epithelial cell luminal membranes and possibly
13

an increase in the number of gut bacteria present (Powell, 1993). Sauvion (1995) has also reported Con A (a D-mannose/ D-glucose specific lectin) binding to epithelial cells of another homopteran, the pea aphid {Acyrthosxphon pisum). More recently studies using Lacanobia oleracea larvae (Lepidoptera) have isolated a membrane-bound receptor for GNA; this is the first such receptor for lectin binding found in insects (Fitches et al., pers. comm.).
However, a definite role for lectins in plant-homopteran interactions has not yet been proved (Rahbe et al., 1995). The concentrations of lectin in artificial diets required to show an insecticidal effect against aphids is generally higher than the concentration of protein detected in phloem sap, estimated as <100|ag/ml by Cole (1994a). Some lectins such as concanavalin A could possibly afford some protection against aphid feeding i f it could be expressed in phloem sap at 50-100ng/ml (Rahbe & Febvay, 1993). However, some lectins have been shown to be present in the intercellular spaces (Chrispeels & Raikhel, 1991) so aphids should come into contact with these on their way to the phloem tissue. Intracellular penetration by aphid stylets is also thought to be quite common (Cole et al., 1993; Klingauf, 1987; Srivastava, 1987) and since some lectins are stored in cell vacuoles (Chrispeels & Raikhel, 1991), aphids may well have contact with lectins in this way as well.
As with insects, the gut epithelial cells of mammals and birds possess countless glycoconjugates, providing possible receptors for plant lectins. Some plant lectins are higly toxic to mammals. For instance PHA is resistant to gut proteases and binds to brush border cells in the intestine where it is endocytosed. Enhanced metabolic activity follows, resulting in hyperplasia and hypertrophy of the small intestine and an acceleration of epithelial turnover. This results in an increased proportion of immature cells, allowing opportunistic E. coli to bind, resulting in the overgrowth of this bacterium. When PHA binds to the intestinal mucosa of rats, lesions appear and disruptions and abnormal development of the microvilli occur (Pusztai et al., 1993b). Other lectins have been shown to bind to the gut epithelium of rats, leading to hyperplastic and hypertrophic growth of the small bowel. This causes reduced digestibility and utilisation of dietary proteins leading to reduced growth (Pusztai et al., 1990 & 1993a). Some lectins are endocytosed by the epithelial cells, transported into the systemic circulation where they are found deposited in the walls of blood and lymphatic vessels. They can also result in hypertrophic growth of the pancreas and thymus atrophy (Pusztai et al., 1993b). Some lectins, such as PHA, have also been shown to be toxic to birds (Jayne-Williams & Burgess, 1974). On the otherhand, some lectins, such as that from pea are not toxic to pigs and are broken down in the gut (Begbie & King, 1985).
14
1.6.3 Snowdrop lectin
The first lectin to be found in the Amaryllidaceae family was by Van Damme et al. (1987) who isolated a lectin from snowdrop {Galanthus nivalis) bulbs, using affinity chromatography on immobilised mannose. The overall yield of lectin (GNA) was 2.5mg/g of bulb tissue (fresh weight). GNA migrated as a single polypeptide band with a molecular weight of 13,000 during gel electrophoresis, indicating that the lectin contained a single polypeptide. Further biochemical analyses revealed that GNA exists as a tetrameric protein containing four identical sub-units of Mr = 13,000 which are not held together by disulphide bridges. The protein contains high amounts of asparagine, aspartic acid, glycine, serine and leucine but no methionine (Van Damme et al., 1987) or cysteine (Kaku & Goldstein, 1989) could be detected. No amino sugar was found and the protein was unglycosylated. GNA withstood a pH range of 3-12 and heating at 70°C for 10 minutes, thus it is a very stable protein (Van Damme et al., 1987).
GNA readily agglutinated rabbit erythrocytes and even after heating at 70°C for 10 minutes, 20% of this activity was retained. Only D-mannose was inhibitory but glucose polymers, such as amylose, glycogen and dextran did have some inhibitory effect (Van Damme et al., 1987). Oligosaccharides containing an a-D-mannopyranosyl unit at the non-reducing terminus or the disaccharide man(al-3)man and this disaccharide itself were found to inhibit the GNA-mannan precipitation (Shibuya et al., 1988). The glycoprotein, thyroglobulin was slightly inhibitory at a high concentration (Van Damme et al., 1987).
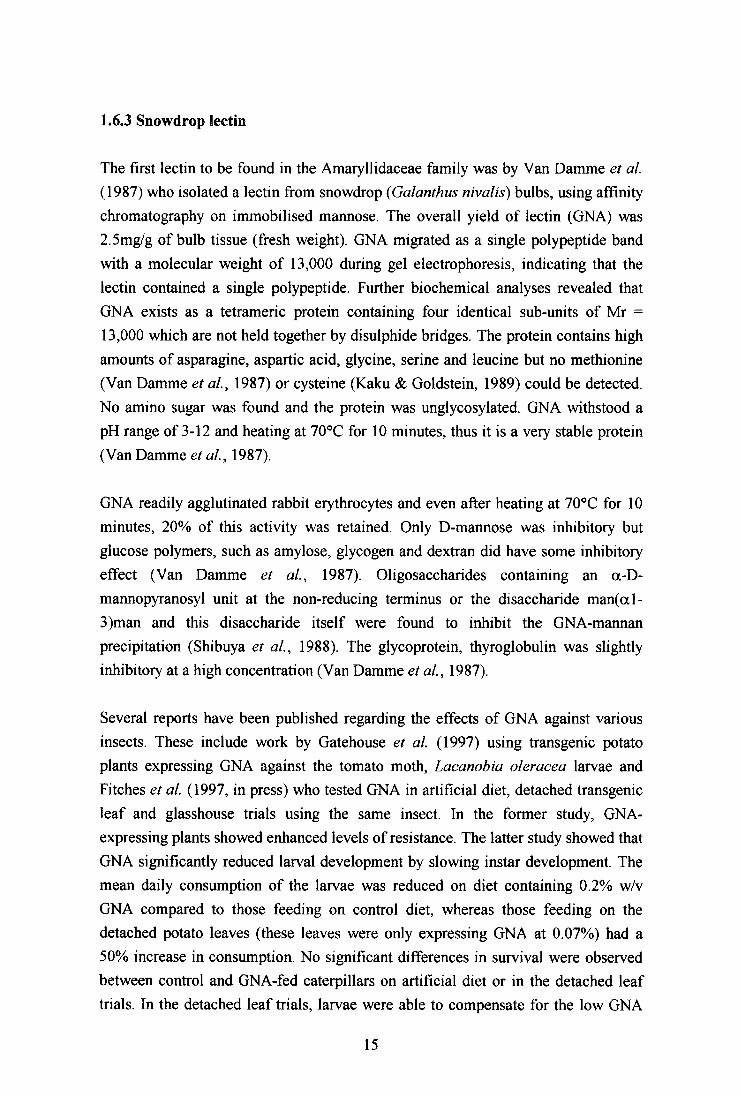
Several reports have been published regarding the effects of GNA against various insects. These include work by Gatehouse et al. (1997) using transgenic potato plants expressing GNA against the tomato moth, Lacanobia oleracea larvae and Fitches et al. (1997, in press) who tested GNA in artificial diet, detached transgenic leaf and glasshouse trials using the same insect. In the former study, GNA-expressing plants showed enhanced levels of resistance. The latter study showed that GNA significantly reduced larval development by slowing instar development. The mean daily consumption of the larvae was reduced on diet containing 0.2% w/v GNA compared to those feeding on control diet, whereas those feeding on the detached potato leaves (these leaves were only expressing GNA at 0.07%) had a 50% increase in consumption. No significant differences in survival were observed between control and GNA-fed caterpillars on artificial diet or in the detached leaf trials. In the detached leaf trials, larvae were able to compensate for the low GNA
15

levels in one generation. Plants used in the glasshouse trial, with 0.5% expression levels for GNA showed a reduction in leaf damage, the larvae feeding on them showed a reduction in biomass and a 40% reduction in survival. GNA has also proved to have adverse effects against several homopteran species including the rice brown planthopper, N. lugens (Powell et al., 1993, 1995a) and the rice green leafhopper, Nephotettix ciniciteps (Powell et al., 1993). Further artificial diet bioassays have shown that GNA is toxic towards the pea aphid, Acyrthosiphon pisum (Rahbe et al., 1995) and the peach-potato aphid, Myzuspersicae (Sauvion et al., 1996). In both these cases an inhibitory effect on growth was also seen and in the case of M. persicae, the fecundity of the aphid was also reduced (Sauvion et al., 1996). Transgenic tobacco plants expressing GNA are reported to successfully reduce the rate of population growth of M. persicae (Hilder et al., 1995) and work by Gatehouse et al. (1996) demonstrated a reduced fertility of M. persicae feeding on transgenic potato plants expressing GNA. Thus GNA is already proving to be a strong potential candidate for use in crop protection against insect attack, especially since it appears to be non-toxic to mammals, possibly even having a beneficial effect (Pusztai et al., 1993a).
1.6.4 Nettle Lectin
Peumans et al. (1984) isolated and purified considerable amounts (approximately lg per kg of rhizomes) of a lectin (LTDA) from stinging nettle (Urtica dioica) rhizomes using affinity chromatography on chitin. A low agglutination activity was demonstrated, which was not blood group specific and only inhibited by N -acetylglucosamine (GlcNAc) and its oligomers ie. UDA binding is exclusive to GlcNAc and GlcNAc-oligomers. SDS polyacrylamide gel analysis showed that native UDA exists as a monomer with an Mr of 8.5kDa. The biochemical characteristics of UDA include a high glycine and cysteine content (18.2% and 15.6% respectively), an unusually high tryptophan content (9.1%) but it is lacking in proline, phenylalanine and methionine. No covalently bound carbohydrate was detected (Peumans et al., 1984). UDA possesses two 43-amino acid domains, known as hevein domains because of the high amino acid sequence homology to hevein, the rubber lectin (Beintema & Peumans, 1992). Hence there are two carbohydrate-binding sites per molecule (Broekaert et al., 1989; Shibuya et al., 1986). Since the initial purification and characterisation of UDA, Van Damme et al (1988) have demonstrated that UDA actually consists of six different isolectins. Investigations into their individual properties demonstrated that all six isoforms migrated on SDS polyacrylamide gel to give a single band at 8.5kDA, suggesting that all six are monomeric. The isolectins have almost identical amino acid sequences, differing by
16
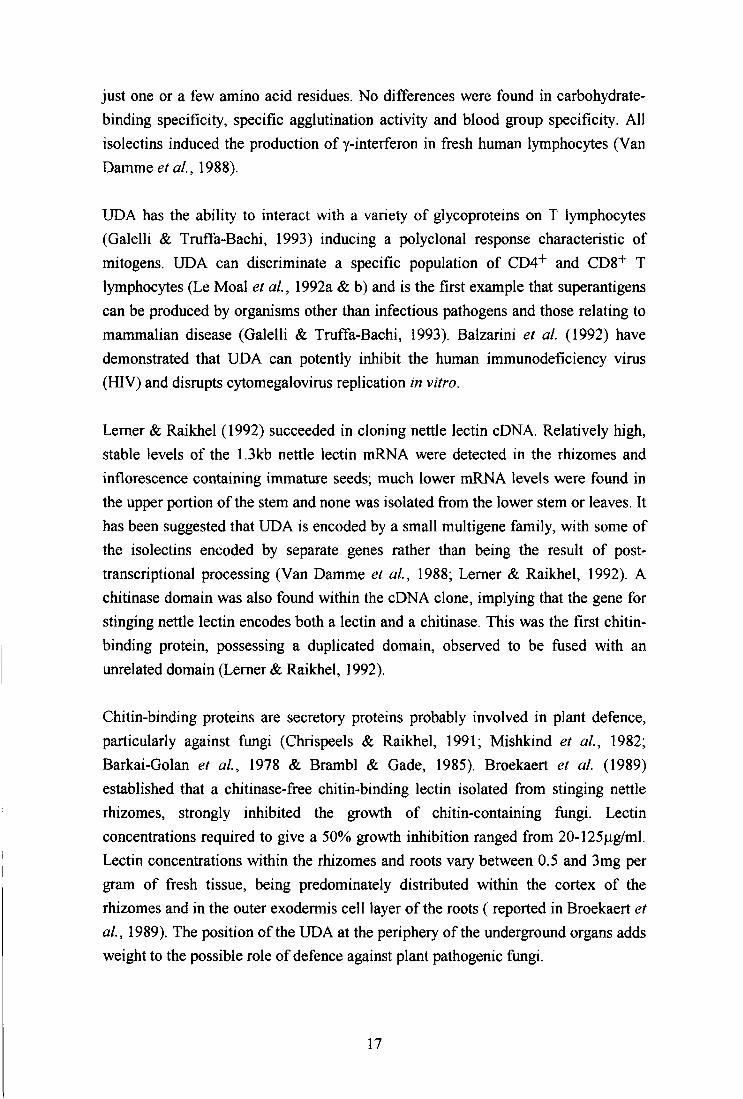
just one or a few amino acid residues. No differences were found in carbohydrate-binding specificity, specific agglutination activity and blood group specificity. Al l isolectins induced the production of y-interferon in fresh human lymphocytes (Van Damme etai, 1988).
UDA has the ability to interact with a variety of glycoproteins on T lymphocytes (Galelli & Truffa-Bachi, 1993) inducing a polyclonal response characteristic of mitogens. UDA can discriminate a specific population of CD4 + and CD8 + T lymphocytes (Le Moal et al., 1992a & b) and is the first example that superantigens can be produced by organisms other than infectious pathogens and those relating to mammalian disease (Galelli & Truffa-Bachi, 1993). Balzarini et al. (1992) have demonstrated that UDA can potently inhibit the human immunodeficiency virus (HIV) and disrupts cytomegalovirus replication in vitro.
Lerner & Raikhel (1992) succeeded in cloning nettle lectin cDNA. Relatively high, stable levels of the 1.3kb nettle lectin mRNA were detected in the rhizomes and inflorescence containing immature seeds; much lower mRNA levels were found in the upper portion of the stem and none was isolated from the lower stem or leaves. It has been suggested that UDA is encoded by a small multigene family, with some of the isolectins encoded by separate genes rather than being the result of post-transcriptional processing (Van Damme et al., 1988; Lerner & Raikhel, 1992). A chitinase domain was also found within the cDNA clone, implying that the gene for stinging nettle lectin encodes both a lectin and a chitinase. This was the first chitin-binding protein, possessing a duplicated domain, observed to be fused with an unrelated domain (Lerner & Raikhel, 1992).
Chitin-binding proteins are secretory proteins probably involved in plant defence, particularly against fungi (Chrispeels & Raikhel, 1991; Mishkind et al., 1982; Barkai-Golan et al., 1978 & Brambl & Gade, 1985). Broekaert et al. (1989) established that a chitinase-free chitin-binding lectin isolated from stinging nettle rhizomes, strongly inhibited the growth of chitin-containing fungi. Lectin concentrations required to give a 50% growth inhibition ranged from 20-125fxg/ml. Lectin concentrations within the rhizomes and roots vary between 0.5 and 3mg per gram of fresh tissue, being predominately distributed within the cortex of the rhizomes and in the outer exodermis cell layer of the roots ( reported in Broekaert et al., 1989). The position of the UDA at the periphery of the underground organs adds weight to the possible role of defence against plant pathogenic fungi.
17

Not only does UDA have a defensive role against fungi, it can also protect against insect attack. Huesing et al. (1991c) fed artificial cowpea seeds, containing 0.05-2.0% w/w UDA to the cowpea weevil, C. maculatus. A 1% UDA concentration resulted in a 65% mortality (compared to an 8% mortality of weevils fed on control seeds). Evidence is also available to support a possible protection against attack from sap-sucking insects. Although UDA had no adverse effect on rice brown planthopper when administered in artificial diet (Powell et al., 1995b), it was moderately active against the pea aphid, A. pisum (Rahbe et al., 1995) and the cabbage aphid, Brevicoryne brassicae (Cole, 1994a). Against A. pisum, the LC50 value (concentration causing 50% mortality) was estimated as being greater than 500ng/ml but a 25% growth inhibition, compared to the control aphids, was seen at a concentration of 250|xg/ml (Rahbe et al., 1995). Against B. brassicae, a 2.5mg/ml UDA concentration resulted in 40% mortality and a reduced amount of honeydew, suggesting that UDA was acting as an antifeedant (Cole, 1994a). An antifeedant effect at concentrations < 250ug/ml has been suggested, when a rapid mortality of 50% occurs due to starvation, however at a higher concentration of 2.5mg/ml it is suggested that mortality is due to the toxicty of the lectin (Cole, 1994a). The mode of action of chitin-binding lectins is unknown but they could bind to the peritrophic membrane lining insect midguts (Chrispeels & Raikhel, 1991). However, sap-sucking insects do not possess a peritrophic membrane, instead the microvilli are surrounded by an outer lipoprotein membrane known as the perimicrovillar membrane (Terra, 1996). UDA could however bind to the stylets, salivary canals (Cole, 1994a) and linings of the fore- and hindgut which contain chitin (Ponsen, 1987).
UDA could prove to have a valuable potential in genetic engineering of plants for insect resistance. Its effectiveness against phloem feeding pests could be due to its small size, enabling it to be more easily translocated through the phloem (Cole, 1994a).
1.7 Chitinases
1.7.1 General introduction on chitinases
Chitinases have been purified from a number of fungi and plants and are responsible for the hydrolysis of chitin, a polymer of N-acetylglucosamine (GlcNAc) residues with p-1,4 linkages (Collinge et al., 1993; Sahai & Manocha, 1993). There are two types of chitinases: endochitinases cleave randomly at internal points while exochitinases catalyse a stepwise release of acetylchitobiose. The main product of
18

endochitinases is the dimer di-acetylchitobiose, although other low molecular mass, soluble multimers of GlcNAc are formed (Sahai & Manocha, 1993).
There are three classes of plant chitinases. Class I chitinases, such as those from bean (Broglie et al., 1986) and potato (Gaynor, 1988), are basic and contain two structural domains. One domain is highly conserved, cysteine and glycine-rich, with chitin-binding properties and the other is a highly conserved chitinolytic catalytic domain. Both domains are interspersed with hyper-variable hinge regions. These regions are rich in glycine and proline residues and are 8-11 amino acids in length (Sahai & Manocha, 1993). The chitin-binding domain remains intact with the catalytic domain during processing of these chitinases (Lerner & Raikhel, 1992). Class I chitinases are induced by ethylene and accumulate in the cell vacuoles (Sahai & Manocha, 1993). Class I I chitinases, such as the acidic forms of tobacco (Payne et al., 1990), do not possess a chitin-binding domain but have a high sequence homology with the catalytic domain and hinge region of class I chitinases (Sahai & Manocha, 1993). Class I I chitinases are acidic and found in the intercellular spaces between plant cells (Sahai & Manocha, 1993). Both class I and class I I chitinases are expressed dependent on age and in specific organs in uninfected plants (Sahai & Manocha, 1993). Class I I I chitinases, such as those from Arabidopsis (Samac et al., 1990) and cucumber (Metraux et al., 1989), do not share any sequence homologies with the class I and I I chitinases and do not possess a chitin-binding domain. They may be basic or acidic (Sahai & Manocha, 1993). Class I I and class I I I chitinases are regulated by salicylic acid (Ward et al., 1991). Collinge et al. (1993) propose a fourth class to contain those with a cysteine-rich domain similar to class I chitinases but are smaller due to four deletions.
Chitin does not occur in plant cells and so far no endogenous plant substrates have been found for purified plant chitinases (Sahai & Manocha, 1993), suggesting their function might be a role in defence against fungi (Boiler et al., 1983; Sahai & Manocha, 1993) and possibly insects, both of which contain chitinous exoskeletons. Plant chitinases are usually endochitinases and have a molecular weight of around 30kDa. They can be acidic or basic in nature. The acidic forms are usually secreted extracellularly and into the apoplast whereas the basic forms accumulate intracellularly, within the vacuole (Sahai & Manocha, 1993). Acidic chitinases appear to be synthesised locally in response to treatments such as salicylic acid and solutions of necrotising salts but the basic chitinases are induced systemically by ethylene (Sahai & Manocha, 1993). Chitinases can be induced by viral attack (Pan et al., 1992; Metraux & Boiler, 1986; Margis-Pinheiro et al., 1993), attack from bacteria (Metraux & Boiler, 1986; Broekaert & Peumans, 1988), fungal attack
19

(Metraux & Boiler, 1986; Anuratha et al., 1996) and in response to environmental stress (Boiler et al., 1983; Mauch et al., 1984 & 1988; Grosset et al., 1990).
Some of the possible functions of chitinases may include a role in development. This is supported by the findings of De Jong et al. (1992) that a chitinase was able to overcome a block in embryogenesis in a mutant carrot cell line. Other work has shown that chitinases are able to regulate Nod-factor activity, thereby determining the specificity of Rhizobium-plant interactions (Staehelin et al., 1994). Some chitinases have been demonstrated to inhibit in vitro fungal growth, especially in conjuction with P-1,3 glucanases (Schlumbaum et al., 1986). Evidence suggests that chitinases are induced in plants during fungal attack (Anuratha et al., 1996) and in vitro studies demonstrate that chitinases inhibit the growth of several fungi (Schlumbaum et al., 1986; Mauch et al., 1988). Also work by Broglie et al. (1991) with transgenic tobacco expressing bean chitinase demonstrated that these plants had a greater ability to survive in the presence of a fungal pathogen and disease symptoms were delayed. Chitinases are thought to protect plants in two ways: their action against fungal cell walls releases signal molecules (elicitors) which activate a variety of defences within the plant (Ryan, 1988) and they cause lysis of the hyphal tips (Benhamu et al., 1993).
There has only been very limited research into the role of chitinases in protection against insect attack. A chitinase purified from the fungus, Streptomyces griseus, incorporated into artificial diet resulted in reduced survival and growth inhibition of the pea aphid, A. pisum (Rahbe & Febvay, 1993) but had no effect against rice brown planthoppers, N. lugens (Powell et al., 1993). Bean chitinase-expressing potato plants have been used in insect trials against lepidopteran and homopteran pests and are discussed further in section 1.7.2. The gene for tomato chitinase has been transformed into oilseed rape with a view to conferring insect resistance, although no data is available of any insect trials carried out (Rustica, unpublished data).
1.7.2 Bean chitinase
Bean chitinase is an endochitinase, induced (its activity increasing 30 fold) in Phaseolus vulgaris L. leaves by ethylene (Boiler et al., 1983). The enzyme, present as approximately 1% of total leaf protein, catalyses the breakdown of chitin to chitobiose and other oligosaccharides. It was found to be active against fungal cell walls and had a lysozyme activity against bacterial walls (Boiler et al., 1983). Further work by Boiler et al. (1983) estimated a molecular weight of between
20

22,000-30,000. The chitinase was found to have a broad pH optimum around 6.5, and was heat stable up to 40°C. The activity was reduced to approximately 50% by the presence of lOOmM GlcNAc and histamine. The chitinase is encoded by a multigene family of approximately four members (Broglie et al., 1986). The amino acid sequence deduced by Broglie et al. (1986, 1989) encoded a protein with a molecular weight of 35,400 suggesting that the chitinase is initially synthesised, possibly by membrane-bound ribosomes, as a larger precursor including a signal sequence, thought to determine vacuolar localisation.
At least two acidic chitinases are also present in Phaseolus vulgaris leaves, which can be induced by biotic (such as infection with alfalfa mosaic virus) and abiotic stresses (eg. mercuric chloride treatment and UV irradiation) (Margis-Pinheiro et al., 1993). The P3-chitinase appears to be more readily induced by the virus whereas the P4-chitinase mRNA levels are higher with mercuric chloride treatment.
Transgenic tobacco plants expressing the bean endochitinase under the CaMV 35S promoter have already been produced (Broglie et al., 1991). Although not tested for the possibility of providing resistance against insect attack, they have proved to delay the development of disease symptoms and increase survival against attack by the Rhizoctonia solani fungus. The expression of bean chitinase along with another protein (GNA) in transgenic potato plants was demonstrated to have insecticidal activity against the aphid, Myzus persicae (Gatehouse et al., 1996). Trials using lepidopteran species on transgenic potato expressing bean chitinase have also been performed but proved to show no protection against larvae of the tomato moth, Lacanobia oleracea (Gatehouse et al., 1997). These are the first examples of transgenic plants expressing a foreign chitinase with the intention of providing protection against insects. Thus chitinases could have a future in providing a degree of resistance against insect attack, especially in conjunction with other engineered foreign proteins.
1.8 Aphids
1.8.1 The aphid alimentary tract and feeding
The feeding site on the plant depends on several factors including the aphid species, age of the plant or leaves, position of the leaves and humidity (Klingauf, 1987), although many prefer the underside of young or senescing leaves (Kennedy et al., 1950; Wearing, 1972; Gibson, 1972). The anterior part of the aphid alimentary tract consists of two sets of chitinous stylets, the outer mandibular stylets and the inner
21
maxillary stylets. The maxillary stylets are divided into an anterior food canal (diameter l-2um) and a posterior salivary canal (diameter 0.2-0.4u,m) (Klingauf, 1987). Before stylet penetration, saliva is secreted onto the plant surface, dissolving the cuticle and, chemoreceptors present on the labium detect the suitability of the substrate (Srivastava, 1987). Protractor and retractor muscles, possibly in conjunction with a clamping action of the labium enable stylet penetration (Srivastava, 1987). Penetration is usually intercellular, although larger aphids may penetrate intracellularly (reported in Srivastava, 1987) and some go through the stomata (Auclair, 1963; Parry, 1971). Once the stylet is inserted, the pathway to the phloem is predominantly intercellular, although intracellular routes are probably more common than first thought (Klingauf, 1987). Saliva, secreted during this process, contains enzymes such as cellulases and pectin polygalacturonase to digest the middle lamellae between the plant cells (McAllan & Adams, 1961). A salivary sheath (Saxena & Chada, 1971) made of gelling material which quickly sets, is secreted along the pathway (Auclair, 1963). Polyphenoloxidases present within the saliva are thought to be involved in the formation of the salivary sheath (Miles, 1965). Most aphid species feed on the phloem sap translocated through the sieve tubes, although some feed in the parenchyma cells (Srivastava, 1987). Aphid saliva may also contain a 1,3-glucosidase capable of breaking down callose, which forms upon wounding of phloem sieve elements to block up the pores; this would lead to an enlargement of the pores and an increased flow of sap (Dreyer & Campbell, 1987). It is estimated that aphids can penetrate the epidermis in approximately one minute and that the phloem can be reached after 5 minutes although generally speaking this takes up to several hours longer (Klingauf, 1987).
The suggested mechanisms of feeding include capillarity, a decrease in the sap surface tension, the pressure of the sap and an active sucking performed by the pharyngeal pump (Klingauf, 1987). Food passes through the stylets and pharynx into the foregut which is lined with a chitinous intima, secreted by a single layer of squamous epithelium (Ponsen, 1987). The intima is moulted at each instar and passes back into the stomach where it remains for the rest of the aphid's life (Moericke & Mittler, 1966). Following on from the foregut is the midgut, consisting of a tubular or dilated stomach and intestine (Ponsen, 1987). In Myzus persicae there are three regions to the stomach; the first, identified by its cuboidal cell lining, the middle region lined with finger-like columnar cells and the posterior region also lined with cuboidal cells. Midgut cells have a striated border consisting of microlabyrinths and microvilli and a multi-folded basal membrane (Ponsen, 1987). The midgut, which is the largest part of the alimentary tract leads into the hindgut. This section can be lined with a layer of squamous, cuboidal or triangular cells
22
depending on the aphid species, and is coated by a delicate intima (Ponsen, 1987). The two regions of the rectum are both lined with intimas, the intima of the anterior portion resembling that of the midgut and the intima of the posterior part more closely related to that of the foregut (Ponsen, 1987).
It is thought that aphids are able to control their feeding rate which is affected by nutritional quality, age and size of the aphid, abiotic factors and ant attendance (Klingauf, 1987). Regurgitation can occur during feeding when particles accumulate around the sheath (Ponsen, 1987) and may also play a role in nonpersistent virus transmission (Harris & Bath, 1973). Excretion of honeydew usually shows a diurnal rhythm, varying between 2-25 droplets in 12 hours and is dependent on the state of the host plant, stage of the aphid's life, humidity, temperature, time of day and ant attendance. Honeydew excretion is interrupted by moulting and changing feeding sites (Klingauf, 1987). The honeydew droplet can be expelled from the body in one of three ways: the droplet can be sprayed off the anus, or it can be flung off by either hindleg, or by forming a droplet at the anus coated by wax filaments (Klingauf, 1987). Honeydew consists of a variety of sugars such as glucose, fructose, sucrose, melezitose, trehalose and some other oligosaccharides. Approximately a third of the ingested nitrogenous compounds are excreted in the honeydew. Other compounds are also found in the honeydew, including plant growth hormones, carboxylic acids, ammonia and anions such as phosphate, sulphur and chloride.
Aphids get all their essential nutrients from either the phloem sap of their host plants or the symbionts present within their body. Stylet sap analyses have shown that not surprisingly, different plant species contain varying amounts of nitrogenous compounds in the phloem sap. These seem to vary from the results obtained by Mittler (1958) to those found by Barlow & Randolph (1978). Mittler (1958) found 12 amino acids (0.03-0.2% w/v depending on season and developmental stage) although no appreciable amounts of proteins, peptides, ammonia or uric acid were found in the stylet sap of Tuberolachnus salignus feeding on Salix acutifolia. Barlow & Randolph (1978) showed the presence of 18 free amino acids, nine of these were also incorporated into protein, giving a total amino acid content of 4.51%, in the stylet sap of Acyrthosiphon pisum feeding on Pisum sativum. Special nitrogenous substances such as canavanine, allantoin and citrulline are present in the phloem sap of some plant species. Proteases and peptidases are found in gut extracts of some aphid species. Protease activity (due to cathepsin and trypsin) was found in the salivary gland and stomach and peptidase activity was found in the stomach of Myzus persicae (Srivastava, 1987). Other aphid species did not appear to possess protease activity in their guts but are able to hydrolyse peptides; these include A.
23
pisum (Srivastava & Auclair, 1963; Rahbe et al., 1995), Aphis acanthi and Megoura viciae (Srivastava, 1987).
Sucrose is the main carbohydrate present in the phloem sap of plants, the concentration varying from 5-30% w/v (Srivastava, 1987). Some other sugars such as myoinositol, raffinose and stachyose (0.5-2%) may also be present. Sugar alcohols such as D-mannitol, sorbitol and dulcitol can also be present in the phloem sap of some plant species. The presence of polysaccharidases within aphid guts also appear to be limited. Amylase is present in many aphids, being secreted in the saliva and present in the gut as in M. persicae and Rhopalosiphum padi (Srivastava, 1987). Those that don't secrete amylase, such as A. pisum, may possess microorganisms within their gut which are capable of hydrolysing starch (Srivastava & Auclair, 1962). Polysaccharidases such as pectinase and cellulase are present in the saliva of a number of aphids (Adams & McAllan, 1958; Adams & Drew, 1965). Several aphids including Aphis fabae and Macrosiphum rosae possess an a-glucosidase to hydrolyse sucrose, trehalose and maltose. A. fabae and Hyperomyzus lactucae possess an oc-galactosidase to hydrolyse raffinose and melibiose and A. pisum gut homogenates contain an invertase to hydrolyse sucrose, trehalose, maltose, melezitose and turnarose (Srivastava, 1987).
Lipids such as cholesterol and phytosterols are present in the phloem sap of many plants and are taken up by feeding aphids (Forrest & Knights, 1972; Srivastava, 1987). The water soluble vitamins such as niacin, thiamine, pantothenic acid, pyridoxine, ascorbic acid and myoinositol are present and translocated in phloem tubes and are therefore available to feeding aphids, along with many other organic components such as organic acids (malic, oxalic, citric, succinic etc. acids), nucleic acids, ATP, organic phosphate compounds (eg. glucose-6-phosphate, fructoses-phosphate and phosphoglycerate), plant growth substances (such as auxins, cytokinins and gibberellins) and phenolic compounds (Srivastava, 1987). Many inorganic minerals are translocated within the phloem sieve tubes and are available to feeding aphids; these include cations ( K + , Na + , C a 2 + and M g 2 + ) , anions (phosphate, sulphate, chloride and bicarbonate) and heavy metals (Zn, Fe, Mn, Cu and Mo) (Srivastava, 1987). Hence the phloem sap is a rich food source providing for normal growth and reproduction.
Al l aphids have an obligatory, symbiotic relationship with prokaryotes, usually Eubacteriales (Houk & Griffiths, 1980). Most live intracellularly, within the vacuoles of specialised cells known as mycetocytes; these cells are usually clumped together to form a mycetome (Houk, 1987). These are often located in the adult
24

around the posterior portion of the foregut and in the abdomen and are circumintestinal in the developing embryos (McLean & Houk, 1973). Some secondarily acquired yeasts are free-living within the haemolymph (Houk, 1987). There is some debate as to the functions of symbionts. It is known that in some cases they synthesise tryptophan (Houk & Griffiths, 1980). It has been suggested that they may synthesise methionine and/or cysteine, and work by Ehrhardt went some way to demonstrate that this was a possibility in some cases (Houk, 1987). A further hypothesis is that they are involved in sterol biosynthesis and various studies have indicated that this may be possible (Griffiths & Beck, 1977; Houk et al., 1976). Akey & Beck, (1972) demonstrated A pisum could survive normally on a sterol free diet for 28 generations, although performance was better in its presence. However more recent studies have put a doubt on this function (Campbell & Nes, 1983). The possibility of symbionts being involved in B-complex vitamin biosynthesis has also been raised (Houk & Griffiths, 1980). Also Campbell & Dreyer (1985) suggested symbionts may play a role in the synthesis of enzymes such as pectinases, cellulase and hemicellulase, used to digest the middle lamellae between plant cells during stylet penetration.
1.8.2 Life cycles and parthenogenetic reproduction
The life cycle of aphids in temperate regions consists of sexual morphs as well as parthenogenetic virginoparae. Sexual morphs are produced in the autumn and mate; the oviparous females then lay overwintering eggs. The following year the eggs hatch, the nymphs develop into winged female adults known as fundatrices which are parthenogenetic and a series of parthenogenetic generations ensues (Dixon, 1973).
Parthenogenetic reproduction allows for the production of offspring without having to find a mate, enabling clonal polymorphism and development of embryos within the embryos of a parthenogenetically reproducing aphid (the so called telescoping of generations). During the early stages of embryo development, nutrition is derived via a trophic cord attached to nurse cells. Older embryos obtain their nutrients from the mother's haemolymph across the ovariole sheath (Dixon, 1987). Embryos are kept separated from one another allowing aphids to control embryo development individually. Once born, an aphid will pass through 3-5 instars before developing into an adult; the time taken is dependent on the aphid species, food quality, temperature, birth weight and morph (apterous or alate) (Dixon, 1987). On reaching adulthood there is usually a delay, known as the pre-reproductive delay, between the moult to adulthood and the first nymph produced. The length of the delay is
25

dependent on size of the individual and temperature (Dixon, 1987). The highest reproductive rate is in early adult life, with the earliest offspring having the greatest effect on population growth. Again, the reproductive rate is variable according to food quality and temperature but also on adult size and the birth weight of that particular individual (Dixon, 1987).
1.9 Natural plant defence against aphid attack
Aphids are a major pest of crop plants; many crops suffer to some degree from aphid infestations. Damage can be due to a depletion in the crop plant resources, tissue damage, transmission of viruses (an estimated 60% of plant viruses are thought to be spread by aphids) (Dreyer & Campbell, 1987) and reduced marketability of ornamental crops (Devonshire, 1989). Even i f a plant is only partially resistant to aphid attack, reproductive and developmental rates could be slowed (Dreyer & Campbell, 1987) to enable natural predators and parasites to control aphid populations more effectively (Starks et al., 1972).
A number of secondary plant metabolites have been implicated in defence against aphids, however few cases exist where this is due to a direct toxicity. The majority of secondary metabolic compounds exert a feeding deterrent. Glucosinolates are thought to provide some wild Brassica species with resistance to the cabbage aphid, Brevicoryne brassicae. They appear to reduce significantly passive phloem uptake, with aphids spending more time in non-probing, stylet pathway and sieve element salivation behaviour and, increasing the number of probes and cell punctures (Cole, 1994b). However, when the glucosinolates were tested in artificial diets, no reductions in aphid survival were observed indicating they do not exert a toxic effect (Cole, 1994b). The hydroxamic acid, DIMBOA is thought to protect wheat against Schizaphis graminum (Argandona et al., 1981) and other cereals against Metopolophium dirhodum (Argandona et al., 1980). When applied to artificial diets DIMBOA reduces the survival of M. dirhodum (Argandona et al., 1980) and acts as a feeding deterrent, increasing the mortality of S. graminum (Argandona et al., 1983).
The wild tomato, Lycopersicon pennellii, is resistant to potato aphid, Macrosiphum euphorbiae, attack. This is due to epidermal characteristics (Gentile & Stoner, 1968) such as the type IV trichomes present on the leaf surface which exude a sticky substance containing 2,3,4-triacylglucoses (Goffreda et al., 1989). However, aphid mortality was not due just to entrapment in the sticky exudate because few late
26

instar aphids were observed to be trapped. It was suggested that mortality was also due to starvation resulting from disturbed settling (Goffreda et al., 1988). A greater proportion of aphids did not probe, took longer to probe and made fewer probes of shorter duration on L. pennellii compared to on L. esculentum (a susceptible tomato species) (Goffreda et al., 1988, 1990). Aphid fecundity was also reduced on L. pennellii (Goffreda et al., 1990).
Aphids feeding on resistant plant varieties spend at least twice as long reaching the phloem, make a greater number of shorter probes, have more difficulty locating the phloem and spend less time ingesting from the phloem compared to aphids feeding on susceptible varieties (Dreyer & Campbell, 1987). It has been suggested that the rate of pectin depolymerisation during probing plays a part in resistance; susceptible lines show much faster rates of depolymerisation (Dreyer & Campbell, 1983). A number of pectin features including high methoxy pectin content, high numbers of branch chains, high acetyl content and the presence of pectinase inhibitors can slow down depolymerisation (Campbell & Dreyer, 1985).
Kaloshian et al. (1995) observed that tomato lines that carried a nematode-resistance gene, known as Mi, also displayed resistance to aphids, particularly the potato aphid, M. euphorbiae. These authors established a tight linkage between the Mi gene and the gene for aphid resistance, Meu 1, which is thought to be a dominant trait. No differences in trichome numbers between resistant and susceptible plants were observed, implying that a similar resistance mechanism to that of L. pennellii (Goffreda et al., 1988 & 1989) is not being seen; the resistance is simply inherited (Kaloshian et al., 1995).
1.10 The glasshouse potato aphid
1.10.1 Biology
The glasshouse potato aphid (Aulacorthum solani (Kalt.)), also known as the foxglove aphid or Macrosiphum solani (Kalt.) is a member of the Aphididae family. The aphid, considered to be a native of Europe, is found distributed in Europe, the USA and Canada, Japan, New Zealand, Kenya and Peru (Hill, 1987) (see Fig. 2).
27
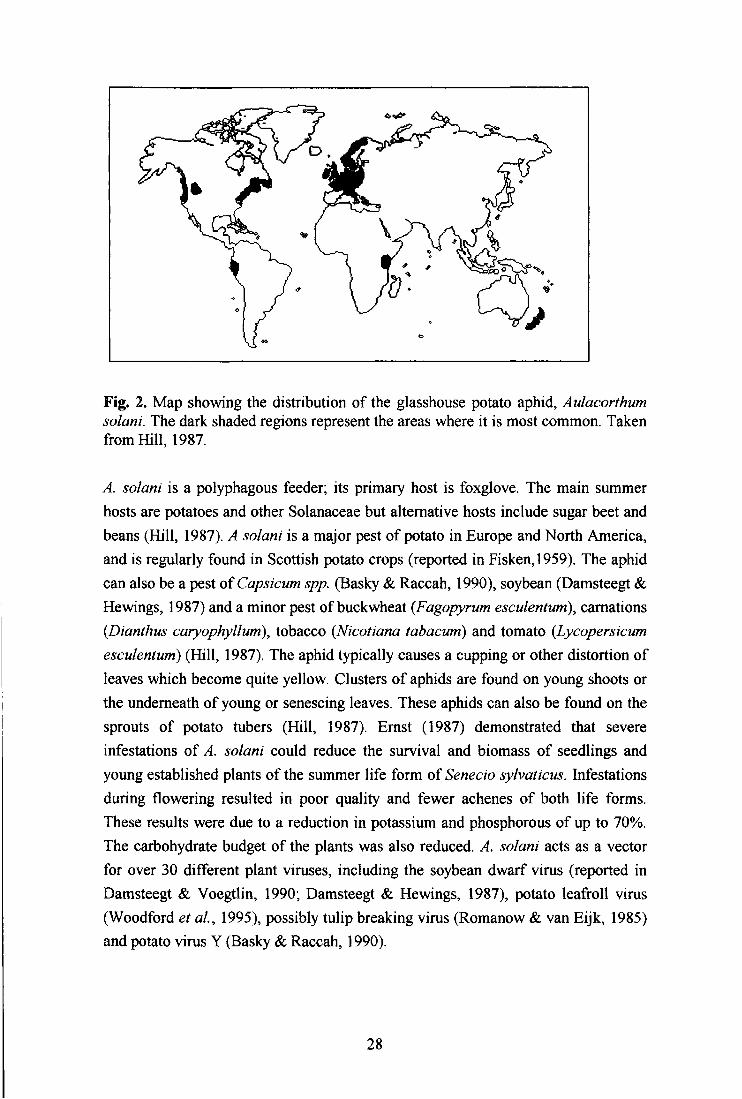
Fig. 2. Map showing the distribution of the glasshouse potato aphid, Aulacorthum solani. The dark shaded regions represent the areas where it is most common. Taken from Hil l , 1987.
A. solani is a polyphagous feeder; its primary host is foxglove. The main summer hosts are potatoes and other Solanaceae but alternative hosts include sugar beet and beans (Hill, 1987). A solani is a major pest of potato in Europe and North America, and is regularly found in Scottish potato crops (reported in Fisken,1959). The aphid can also be a pest of Capsicum spp. (Basky & Raccah, 1990), soybean (Damsteegt & Hewings, 1987) and a minor pest of buckwheat (Fagopyrum esculentum), carnations (Dianthus caryophyllum), tobacco (Nicotiana tabacum) and tomato (Lycopersicum esculentum) (Hill, 1987). The aphid typically causes a cupping or other distortion of leaves which become quite yellow. Clusters of aphids are found on young shoots or the underneath of young or senescing leaves. These aphids can also be found on the sprouts of potato tubers (Hill, 1987). Ernst (1987) demonstrated that severe infestations of A. solani could reduce the survival and biomass of seedlings and young established plants of the summer life form of Senecio sylvaticus. Infestations during flowering resulted in poor quality and fewer achenes of both life forms. These results were due to a reduction in potassium and phosphorous of up to 70%. The carbohydrate budget of the plants was also reduced. A. solani acts as a vector for over 30 different plant viruses, including the soybean dwarf virus (reported in Damsteegt & Voegtlin, 1990; Damsteegt & Hewings, 1987), potato leafroll virus (Woodford et al., 1995), possibly tulip breaking virus (Romanow & van Eijk, 1985) and potato virus Y (Basky & Raccah, 1990).
28
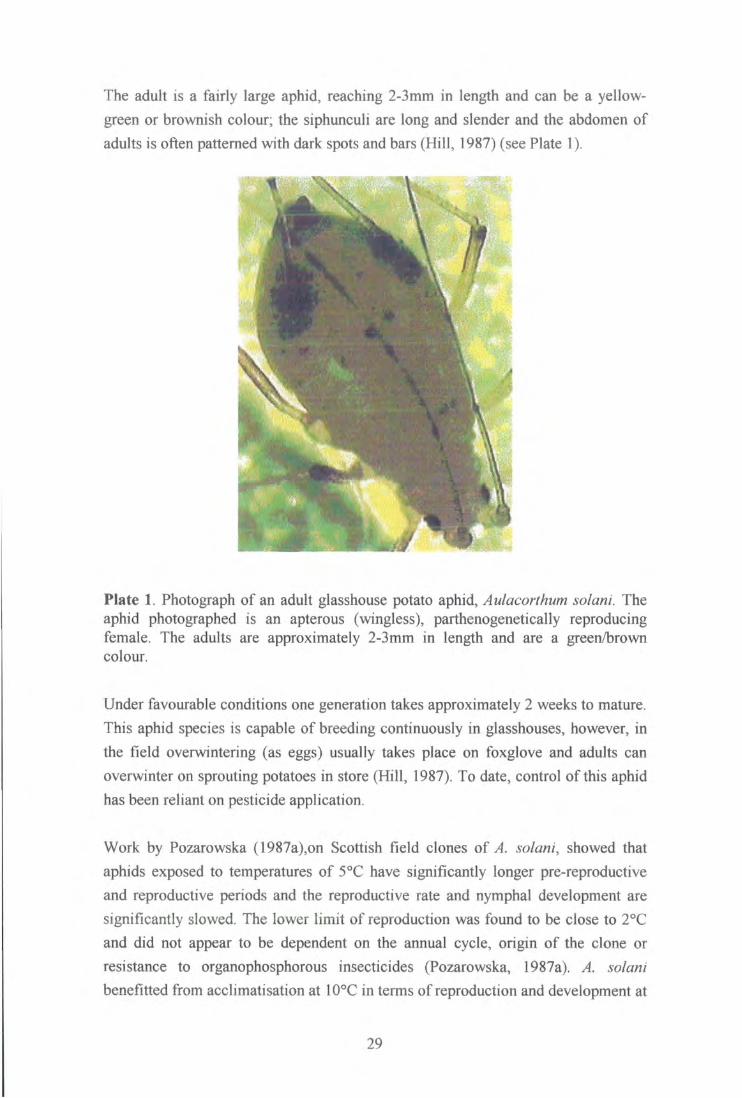
The adult is a fairly large aphid, reaching 2-3mm in length and can be a yellow-green or brownish colour; the siphunculi are long and slender and the abdomen of adults is often patterned with dark spots and bars (Hill, 1987) (see Plate 1).
:
Plate 1. Photograph of an adult glasshouse potato aphid, Aulacorthum solani. The aphid photographed is an apterous (wingless), parthenogenetically reproducing female. The adults are approximately 2-3mm in length and are a green/brown colour.
Under favourable conditions one generation takes approximately 2 weeks to mature. This aphid species is capable of breeding continuously in glasshouses, however, in the field overwintering (as eggs) usually takes place on foxglove and adults can overwinter on sprouting potatoes in store (Hill, 1987). To date, control of this aphid has been reliant on pesticide application.
Work by Pozarowska (1987a),on Scottish field clones of A. solani, showed that aphids exposed to temperatures of 5°C have significantly longer pre-reproductive and reproductive periods and the reproductive rate and nymphal development are significantly slowed. The lower limit of reproduction was found to be close to 2°C and did not appear to be dependent on the annual cycle, origin of the clone or resistance to organophosphorous insecticides (Pozarowska, 1987a). A. solani benefitted from acclimatisation at 10°C in terms of reproduction and development at
29

5°C (Pozarowska 1987b). Although results were variable between clones, when reared at this temperature for a second generation, nymphal development was slower but they had a high capacity for recovery. When compared with M. persicae, A. solani showed a higher ability to survive, reproduce and develop when temperatures declined gradually and in their recovery from low temperatures; this is the exact opposite from the observations with these two species at sudden temperature drops (Pozarowska, 1987a). However, A. solani was found to be less efficient at overwintering when compared to M. persicae, due to the lower survival and slower reproduction and development at low temperatures.
1.10.2 An example of a plant defence system against A. solani
Some geranium {Pelargonium x hortorum Bailey) lines are resistant to the foxglove aphid (Acyrthosiphon solani Kaltenbach), otherwise known as the glasshouse potato aphid. The lines resistant to aphids also appear to be resistant to the two-spotted spider mite {Tetranychus urticae Koch). Adult survival and nymph production was significantly reduced on the resistant lines (Walters et al., 1989a, 1990). Nymphs spent less time (44%) feeding and probing on the resistant lines (compared to 83% on susceptible lines), instead 16% of their time was spent struggling and 22% of the time they were immobilised (Walters et al., 1990). Resistant lines that had their leaves washed in buffer allowed aphids to behave as i f they were on susceptible plants. From this it was concluded that the trichome exudate (which was washed away by the buffer solution) was essential for resistance (Walters et ah, 1989a, 1990). It was suggested that the trichome exudate acted as a physical entrapment rather than being toxic; adult aphids showed a lesser degree of entrapment, their longer legs enabling them to step over the trichomes without being caught up in sticky exudate (Walters et ah, 1990). Tall glandular trichome densities on the leaf surface are closely correlated with resistance; resistant lines possess 3-4 times more of these trichomes than susceptible lines (Walters et al., 1989b). Although mites and aphids have difficulty in walking over another trichome type, the tall spiny trichomes, the densities of these do not correlate with resistance, suggesting that these alone are unable to provide resistance.
Work by Walters et al. (1989b) demonstrated that extracts from individual trichomes of the resistant line had over 50 times the amount of anacardic acids, compared to those of the susceptible variety. Exudate collected from the exterior of trichomes from a resistant variety contained ten times more anacardic acids. However resistant lines only had double the amount of anacardic acids when comparing whole-leaf extracts. From this Walters et al. (1989b) suggested that
30

susceptible plants lack the ability to translocate the anacardic acids to the tip of the trichome from the site of synthesis, resulting in a build-up at the site of synthesis which in turn leads to a feedback inhibition. A further geranium line (18-6) exhibited aphid resistance at lower temperatures but became susceptible at 25.5°C. This was shown to be because the 18-6 line had a higher proportion of the shorter chain anacardic acid, compared to the permanently resistant line, resulting in a less viscous and more fluid exudate. At higher temperatures it was suggested that the exudate becomes even more fluid and the droplets cease to stay at the trichome tips, instead flowing onto the leaf surface and diminishing its efficiency as a sticky trap. This conclusion further supported the idea that the exudate incurrs a physical trap rather than acting as a toxin (Walters et ah, 1991).
1.11 Aims of research
The main aims of this research are outlined as follows:
1. To develop an artificial diet and bioassay system capable of sustaining normal growth and reproduction of the glasshouse potato aphid, Aulacorthum solani.
2. To screen a range of purified endogenous plant proteins in an artificial diet bioassay system, in an attempt to find a protein that is toxic to A. solani or capable of reducing the fecundity of this aphid.
3. To screen available transgenic plants expressing foreign plant proteins for toxicity or resistance to A. solani in an effort to reproduce in v/Yro-data in planta and, to follow this through to a larger scale, semi-controlled glasshouse trial.
4. To establish a mechanism of action for the toxic effects observed.
5. To isolate the gene encoding a plant protein with potential for conferring aphid resistance, for use in plant transformations.
6. To discuss the results obtained, with a view to the potential of plant derived proteins in conferring aphid resistance to crop plants and use in integrated pest management schemes.
31

2. M A T E R I A L S AND METHODS
2.1 Chemical and biological materials
2.1.1 Chemical reagents and equipment
Unless otherwise stated, chemicals were of analytical grade and supplied by BDH-Merck Ltd, Lutterworth, Leics. or Sigma Chemical Co. Ltd, Poole, Dorset.
Artificial diet reagents Bean chitinase was purified by L. N. Gatehouse (University of Durham). Canavalia brasiliensis and Cratylia floribunda lectins were donated by T. Grangiero (visiting student, University of Durham).
Galanthus nivalis agglutinin (GNA) was supplied either by Vector Laboratories, Peterborough or by Dr. W. Peumans (Catholic University of Leuven, Belgium). Pea lectin was purified by A. Q. Panhwar (University of Durham). Scoparone and scopoletin were supplied by Dr. R. Edwards (University of Durham). Urtica dioica lectin was purified by K. Horsham (Honours project student, University of Durham).
Lipoxygenase, ovalbumin, soybean Bowman-Birk inhibitor, 5-hydroxytryptamine, thaumatin and Parafilm M were supplied by Sigma Chemical Co. Ltd, Poole, Dorset.
3MM paper was supplied by Whatman Labsales Ltd, Maidstone, Kent.
Immunoblot assays
Acrylamides and SDS7 protein marker were obtained from Sigma Chemical Co. Ltd, Poole, Dorset. BIO-RAD Bradford protein assay concentrated dye, dot-blot apparatus and ECL HRP-conjugated secondary antibodies were supplied by BIO-RAD Laboratories Ltd, Hemel Hempstead, Herts. Nitrocellulose, Schleicher & Schuell, grade BA-85 was supplied by Andermann & Co. Ltd, Kingston-upon-Thames, Surrey. Low fat milk powder was obtained from "Boots" Chemist stores. Anti-GNA and anti-BCH antibodies were supplied by L. N. Gatehouse and Dr. R. D. D. Croy (University of Durham). ECL detection reagents were supplied by Amersham, Life Science, Little Chalfont, Bucks. Radiochemicals were supplied by Amersham International pic, Aylesbury, Bucks. X-ray film, Fuji-RX was supplied by Fuji Photo Film (UK) Ltd.
32

X-ray cassettes, ATTO protein gel apparatus and semi-dry blotting apparatus were obtained from Genetic Research Instrumentation Ltd, Dunmow, Essex. Developer - Ilford phenisol was supplied by Ilford Ltd, Mobberly, Ches. Fixer -Kodak unifix was supplied by Phase Separations Ltd, Deeside, Clwyd.
Histology Vectastain ABC (IgG rabbit and IgG mouse) kits were obtained from Vector Laboratories, Peterborough.
LR white resin was obtained from London Resin Company Ltd, Reading, Berkshire.
Molecular biology reagents
Agarose minigel apparatus and LKB-Gene ATAQ controller PCR block were supplied by Pharmacia biosystems Ltd, Milton Keynes. Agarose was obtained from Gibco BRL, Life Technologies Ltd, Paisley, Scotland. Restricted Lambda digest and Klenow enzyme were supplied by nbl Gene Sciences, Cramlington, Northumberland. Total pea RNA was supplied by O. P. Dhankher (University of Durham). Oligonucleotides were supplied by J. S. Gilroy (University of Durham) or Perkin-Elmer Ltd, Warrington. dNTP's, lOx PCR reaction buffer were supplied by MBI Fermentas, Immunogen International Ltd, Sunderland, Tyne & Wear. Taq polymerase was obtained from Promega Ltd, Southampton. Enhanced perfect match and the cDNA synthesis kit were supplied by Stratagene, Cambridge Science Park, Cambridge. Yeast extract was supplied by Unipath Ltd, Basingstoke, Hampshire. Bacto-peptone and bacto-agar were supplied by Difco laboratories, Detroit, Michigan, U.S.A.
Miscellaneous Murashige & Skoog medium was supplied by ICN Biomedicals Ltd, Thame, Oxfordshire.
2.1.2 Commonly used solutions and buffers
Immunoblot assays Extraction buffer: 50mM Tris/HCl pH 9.5
TN buffer: 20mM Tris/HCl pH 7.2, 0.9% NaCl
33

ECL detection block ( I / 1 )
ECL antisera buffer (L ' 1 ) :
lOxPBS (L" 1 ):
SDS PAGE solutions
Acrylamides:
Resolving buffer:
Stacking buffer:
2x SDS sample buffer:
lOx reservoir buffer:
stain:
destain:
Protein size markers: (SDS7: Sigma)
50g low fat milk powder 100ml lOxPBS 10ml Tween 20
50g low fat milk powder 100ml 1 Ox PBS lml Tween 20
2 g K H 2 P 0 4
11.5gNa 2HP0 4
2gKCl 80gNaCl
30g acrylamide, 0.8g bisacrylamide /100ml
3.0M TrisHCIpH8.8
0.5MTrisHClpH6.8
0.2M TrispH6.8 20% glycerol 2% SDS 0.002% Bromophenol blue
0.25M Tris pH 8.3 1.92M glycine 1% SDS
40% methanol 7% glacial acetic acid 0.05% Kenacid Blue R
40% methanol 7% glacial acetic acid
66k bovine albumin 45k egg albumin 36k glyceraldehyde-3-phosphate
dehydrogenase 29k bovine erythrocyte carbonic acid 24k PMSF-treated trypsinogen 20k soybean trypsin inhibitor 14k alpha-lactalbumin
34

RNA extraction Denaturing solution: 37.88g guanidine thiocyanate
50ml CSB buffer
CSB buffer:
cDNA library screening lOx column buffer:
42mM sodium citrate 0.83% N-lauroyl sarcosine 0.1M p-mercaptoethanol
1.5MNaCl 0.1MEDTA 1% SDS 0.5M Tris HClpH7.5
20x SSC buffer (L" 1): 175.3gNaCl 88.2g sodium citrate 800ml distilled H 2 0 adjust pH to 7.0 with NaOH add distilled water to 1L
50x Denhardt's reagent (per 500ml): 5g Ficoll 5g polyvinylpyrrolidine
Pre-hybridisation solution (50ml):
Hybridisation solution:
5gBSA
5x SSC 5x Denhardts solution 100ug/ml denatured and fragmented Herring sperm DNA (boil for 5 minutes)
5x SSC 2x Denhardt's reagent 100ng/ml Herring sperm DNA (denatured)
Others TE buffer:
TEN-SDS:
lOOmM Tris lOmM EDTA pH 8.0
lOOmMTris lOmM EDTA pH 8.0 250mMNaCl 2% SDS
Genomic DNA extraction buffer: 200mM Tris/HClpH7.5 250mMNaCl 25mM EDTA 0.5% SDS
35

TAE buffer: 40mM Tris-acetate pH 7.7 lOmMEDTA
5x formaldehyde gel-running buffer: 0.1MMOPS pH 7.0 40mM sodium acetate-3-hydrate 5mM EDTA pH 8.0
2x PCR reaction buffer: 200^1 lOx Taq reaction buffer 4nl of dGTP, dCTP, dATP, dTTP (lOOmM) 120^125mMMgCl 2
10nl 20mg/ml BSA 650ul sterile distilled H 2 0
lOgNaCl lOg tryptone 5g yeast extract distilled water
NZY agar (L ' 1 ) : 5gNaCl 2g MgS0 4 .7H 2 0 5g yeast extract lOgNZ amine 15gagar distilled water
NZY Top agar (L"l): 1L NZY broth 0.7% (w/v) agarose
NZY broth (L- 1 ) : 5gNaCl 2gMgS0 4 .7H 2 0 5g yeast extract lOg NZ amine distilled water
Al l media must be autoclaved before use.
2.1.3 Maintenance of insect stock culture
A culture of Aulacorthum solani was donated by Y. Rahbe from a laboratory clone kept at INRA, Lyon, France. The culture was reared on potato {Solanum tuberosum) cv. Desiree, grown from tubers, in blackman boxes using a similar technique to that described by Blackman (1971). The mature aphids were kept at a density of 15 aphids per box. Adults and nymphs were transferred to fresh leaves at approximately 4-day intervals. Any winged (alate) individuals were discarded. The culture was
Media LB broth (L- 1 ) :
36

maintained in a Gallenkamp cooled incubator at a temperature of 21°C±2°C under a 16 hour light: 8 hour dark lighting regime.
2.1.4 Production of transgenic potato plants
The GNA-expressing potato plants were produced as described in Down et al. (1996); potatoes expressing the double construct encoding GNA and bean chitinase were produced as described in Gatehouse et al. (1996). Both these and potato plants expressing bean chitinase only, were produced and supplied by AXIS Genetics Ltd, Babraham, Cambridge. Al l transgenes were under the control of the CaMV 35S constitutive promoter.
2.1.5 Maintenance of plant stocks
A continuous supply of control potato (S. tuberosum) cv. Desiree, and the transgenic potato lines were propagated and maintained in tissue culture. The following medium was used:
1 litre distilled water 20g sucrose 4.7g Murashige and Skoog (MS) medium 3.5gphytagel The pH should be 6.5 before autoclaving for 20 minutes at 15psi, along with Beatson jars to pour the media into after cooling.
Propagation (repeated at approximately three weekly intervals) was performed by cutting off the apical and/or axillary buds of plantlets already in culture and setting into fresh jars of media. A sterile petri dish base was used as a lid and sealed with parafilm punctured with two small holes. Cultures were maintained in controlled conditions (20°C±2° C, 16 hours light: 8 hours dark).
Once a good root system had developed, plantlets were potted out in John Innes no. 3 compost and a polythene bag placed over each pot. On reaching a height of 10cm, the top of the bag was opened to enable ventilation; after a week the bag was removed. Plants were grown at a temperature of 20°C±2°C under a L16:D8 lighting regime.
37

2.2 Artificial diet bioassavs
2.2.1 Artificial diet preparation
Two artificial diet formulations were tested. Initially one described by Dadd & Mittler (1966) was prepared according to the recipe in Table 1. The ingredients (with the exception of tyrosine and riboflavin) were weighed out and dissolved in approximately 70ml distilled water. Tyrosine was dissolved in a few drops of 1M HC1 and riboflavin was dissolved in a few drops of distilled water heated to 30-50°C before adding to the diet. The pH was adjusted to 7.0 with K2HPO4 and the volume
made up to 100ml before filter sterilising through 0.2|am millipore filters and stored in 5ml aliquots at -20°C.
The second artificial diet recipe was obtained from Febvay et al. (1988) and was prepared using the recipe in Table 2. One adjustment was made to the original recipe: phenylalanine was substituted for p-alanyltyrosine on a mole for mole basis due to difficulties in obtaining this component. The vitamin solution was first prepared by dissolving the vitamins (quantities for 1 litre of diet) in 150ml distilled water. The volume was adjusted to 200ml before storing at -20°C in 20ml aliquots. The diet was prepared by dissolving the remaining ingredients (except the KH2PO4)
(quantities for 100ml of diet) in 40ml distilled water plus 20ml of vitamin solution. The pH was adjusted to 7.0 with 1M KOH before adding the KH2PO4. The volume
was made up to 100ml with distilled water and the pH adjusted to 7.5 with 1M KOH. The diet was filter sterilised through 0.2um millipore filters and stored in 5ml aliquots at -20°C.
Initially pilot chambers (see section 2.2.2) were set up containing either mature aphids or 1 st instar nymphs to establish which of the two diets most suited A. solani. Performance was measured in terms of the number of survivors on each diet and the number of nymphs produced.
2.2.2 Artificial diet feeding chambers
Feeding chambers described by Powell et al. (1993) were prepared as follows. The base of a 35mm plastic petri dish was lined with moistened (using sterile distilled water) Whatman No. 1 filter paper, to maintain humidity. Five aphids were placed inside before stretching Parafilm membrane over the dish. 200u,l of diet was placed
38

on the membrane and a second layer of Parafilm stretched on top to provide a sealed diet sachet. Chambers were prepared in a Laminar Flowhood using sterile techniques to minimise bacterial and fungal contamination.
Diet sachets were replaced on alternate days using fresh diet to prevent deterioration of the diet and contamination. Feeding chambers were kept in a Gallenkamp cooled incubator at 21°C±2°C and a 16 hour light: 8 hour dark lighting regime.
Ingredients me/100ml Vitamins mg/lOOml
L°amino acids ascorbic acid 100 biotin 0.1
alanine 100 calcium 5.0 pantothenate
arginine 270 choline chloride 50 asparagine 550 folic acid 0.5 aspartic acid 140 i-inositol 50 cysteine 40 nicotinic acid 10 hydrochloride glutamic acid 140 pyridoxine 2.5
hydrochloride glutamine 150 riboflavin 0.5 glycine 80 thiamine 2.5 histidine 80 isoleucine 80 Salts leucine 80 lysine 120 K H 2 P 0 4
500 monohydrochloride methionine 40 MgCl2.6H 20 200 phenylalanine 40 sequestrenes*:Cu, 0.4, 1.5, 0.8
Fe, Mn, Zn respectively proline 80 serine 80 Other ingredients threonine 140 tryptophan 80 sucrose 15g tyrosine 40 valine 80
* chloride salts used
Table 1. Artificial diet recipe for rearing aphids, proposed by Dadd & Mittler (1966).
39

Ingredients quantity mg/lilre quantity mg/100ml concentration (mM)
L-amino acids
alanine 1787.06 178.71 20.06 P-alanine 62.17 6.22 0.70 arginine 2449.04 244.90 14.06 asparagine (H20) 2985 48 298.55 19.88 aspartic acid 882.52 88.25 6.63 cysteine 295.87 29.59 2.44 glutamic acid 1493.61 149.36 10.15 gluatamine 4456.07 445.61 30.49 glycine 1665.58 166.56 22.19 histidine (HCl, H20) 1360.22 136.02 6.49 isoleucine (allofree) 4647.45 164.75 12.56 leucine 2315.58 231.56 17.65 lysine (HCl) 3510.86 351.09 19.22 methionine 723.53 72.35 4.85 ornithine (HCl) 94.12 9.41 0.56 phenylalanine 2319.27 231.93 14.04 proline 1293.26 129.33 11.23 serine 1242.81 124.28 11.83 threonine (allofree) 1271.59 127.16 10.67 tryptophan 427.48 42.75 2.09 tyrosine 386.30 38.63 2.13 valine 1908.54 190.85 16.29 B-alanyltyrosine* 1091.52 109.15 3.79 * 61. lmg phenylalanine/lOOml diet, substituted in place of P-alanyltyrosine
saccharose 200g 40g 584.28
Vitamins
amino benzoic acid 100.00 _
ascorbic acid 1000.00 - -biotin 1.00 - -calcium pantothenate (D- 50.00 - -form) choline chloride 500.00 - -folic acid 10.00 -i-inositol (anhydrous) 420.00 - -nicotinic acid 100.00 - -pyridoxine (HO) 25.00 - -riboflavin 5.00 -thiamin (HCl) 25.00 - -
Trace metals
CuS0 4.5H 20 4.70 0.47 FeCl3.6H20 44.50 4.45 MnCl 2 .4H 20 6.50 0.65 NaCl 25.40 2.54 ZnCl 2 8.30 0.83
Other ingredients
calcium citrate 100.00 10.00 cholesterol benzoate 25.00 2.50 MgS04.7H20 2420.00 242.00 KH2PO4 2500.00 250.00
Table 2. Artificial diet recipe for rearing Acyrthosiphon pisum proposed by Febvay etal. (1988).
40
2.2.3 In vitro protein feeding trials
It was ascertained that A. solani preferred the diet of Febvay et al. (1988) (see section 2.2.1) so in all future artificial diet bioassays this diet was used as the control diet. A number of different proteins were incorporated in the diet and tested in artificial diet bioassays against A. solani. Al l bioassays were set up in the following way unless described otherwise.
Newly mature, apterous, parthenogenetic aphids from the stock culture were placed in feeding chambers (5 insects per chamber) with control diet sachets, overnight. The number of adults used was based on the assumption that each individual would produce two nymphs overnight. Chambers were kept at 21°C±2°C for up to 24 hours. The resulting nymphs were used to set up the bioassay. Again, feeding chambers were set up according to section 2.2.2 with five 1st instar nymphs in each dish. The diet sachets contained either control diet or diet incorporating the protein to be tested, at the desired concentration. In some instances a no diet control was set up where the feeding sachets were empty. Either five or ten replicates were set up for each bioassay. The chambers were kept in a Gallenkamp cooled incubator at 21°C±2°C with 16hours light: 8 hours dark. In all instances the number of survivors per replicate and, on maturity, the number of nymphs produced per replicate were recorded on a daily basis. Feeding sachets were replaced on alternate days to avoid deterioration of diet and contamination. Bioassays were usually terminated after 20 days. In the case of the artificial diet bioassay where first instar nymphs were fed on control diet until maturity and then transferred to 0.1% w/v GNA (see section 3.1.2), the diet sachets were changed on every third day and the Parafilm M was sterilised by placing on a transilluminator for 5 minutes beforehand.
2.2.4 Proteins tested against A. solani in artificial diet bioassays
The following proteins were incorporated into control diet at the stated concentration and artificial diet bioassays set up as described in section 2.2.3:
• 0.1% w/v Galanthus nivalis agglutinin (GNA) (Vector Laboratories, Peterborough, U.K),
© 0.05% w/v GNA (Dr. W. Peumans, Catholic University of Leuven, Belgium),
° 0.1,0.05,0.02 and 0.01% w/v GNA, ® 0.1% w/v Bean chitinase, * 0.1% w/v Pea lectin,
41

• 0.1% w/v Urtica dioica lectin, • 0.1, 0.05,0.02 and 0.01% w/v Concanavalin A, • 0.1% w/v Canavalia brasiliensis lectin, • 0.2, 0.1, 0.05 and 0.025% w/v Canavalia brasiliensis lectin, • 0.1% w/v Cratylia floribunda lectin, «> 0.1% w/v Ovalbumin, • 0.1% w/v Soybean Bowman-Birk inhibitor, • 5-hydroxytryptamine at ImM, 0.ImM, O.OlmM & O.OOlmM concentrations, • 0.1% and 0.2% w/v Lipoxygenase, • Scoparone at 10" 4M and 10"5M, • Scopoletinat 10" 4M and 10" 5M, • 0.1% thaumatin.
2.3 Controlled-environment transgenic plant trials against A solani
2.3.1 Using whole plants
A perspex cylinder was placed around eight plants of each type (control, GNA expressing (PWG85) and GNA + bean chitinase expressing (PBG47) potato). Plants were inoculated with fifteen first instar (24 hour old) nymphs produced by a synchronised population of apterous, parthenogenetic A. solani adults. Fine nylon mesh was then taped down over the top of the cylinders to prevent the aphids from escaping. The trial was performed in a controlled-environment cabinet set at 24°C±2°C, relative humidity 50% and a L16:D8 light regime. After 12 days the trial was terminated and the following observations were made:
• number of adults found per plant, • number of nymphs found per plant, • weight of each surviving adult, • body length and width of each surviving adult*, • total weight of nymphs found on each plant.
• Length was measured from the tip of the head to the tip of the cauda; width was measured across the metathorax, using a video monitor linked to a Microscale Image Analysis package.
42

2.3.2 Clip cage method
Following the method of Birch & Wratten (1984), three clip cages per plant (see Plate 2) and eight plants of each type (control, GNA expressing (PWG85) and GNA + bean chitinase (PBG47) expressing potato) were set up using a synchronised population of mature, apterous, parthenogenetic A. solani aphids, giving a total of 24 cages (8 replicates) for each plant line. The aphids were caged on the abaxial leaf surfaces and cages were placed throughout the leaf canopy. After 24 hours, all adults and all but two of the resulting nymphs were removed from the cages. These were left undisturbed until maturity when one of the aphids was removed, leaving one adult per clip cage. The daily reproduction and mortality of each individual was recorded, counts being made within the same two hour period and all nymphs were removed. The trial was performed in a controlled-environment growth room set at 25°C±2°C, 70% relative humidity and a L16:D8 lighting regime, over a 30 day period.
Plate 2. Photograph showing a clip cage in place over a potato plant leaf. Sponge rings on the parts in contact with the leaf help to prevent bruising to the leaf surface. Fine nylon mesh on the upper and lower surfaces of the cage allow the aphids to breathe. Aphids are contained in the lower part of the cage so that they have access to the abaxial leaf surface.
A second clip cage trial was performed using a slightly different design of clip cage, enclosing the whole leaf so that aphids had access to the upper and lower leaf surfaces.
43

The following types of plants were used: • control potato, • GNA expressing potato (PWG85 line), • GNA expressing potato (line GNA2-23), o GNA expressing potato (line GNA2-28),
• GNA expressing potato (line GNA2-30), • wheat a-amylase inhibitor expressing potato (line WAI9-12).
Clip cages were again distributed throughout the leaf canopy so that for each plant type there were 30 cages. The bioassay was set up as detailed above and performed in a controlled-environment growth room at 21°C±2°C, and a light regime of L16:D8. The mortality and number of nymphs produced by each individual adult was recorded on a daily basis over 30 days.
2.3.3 Detached leaf bioassays
Terminal leaves of the compound leaflets of potato plants to be tested were removed using a razor blade and inserted into blackman boxes and stood in a tray of tap water (see Fig. 3). Each of these was then inoculated with 10 first instar A. solani nymphs (produced over 24 hours from a synchronised population of apterous, parthenogenetic adults on control potato). The number of survivors and nymph production was monitored on a daily basis, nymphs being removed after each count. Leaves were changed every 2-3 days. Trials were performed in a Gallenkamp cooled incubator set at 21°C±2°C with a L16:D8 light regime.
The following types of potato plants were assayed in this way:
• control, • bean chitinase expressing potato (lines BCH 1-7, BCH1-21, and BCH1-35), • GNA + bean chitinase expressing (line PBG47), • GNA expressing potato (line GNA2-28).
44

Perspex component box with: - sliding front wall for access - nylon mesh covered circular hole
in rear wall to allow leaf and aphids to breathe
- horizontal plastic divider with small hole through which leaf stalk is inserted
- lower section of box filled with sponge enabling leaf stalk to uptake water.
Tray with shallow layer of water.
Fig. 3. Diagram of a blackman box of the type used in detached leaf bioassays and also for rearing of the stock cultures. Several blackman boxes can be kept in the same tray of water. Design taken from Blackman, 1971.
2.4 Aphid growth measurements
Aphid artificial diet bioassays were set up as described in section 2.2.3, except that a plastic ring (diameter 4cm) was used for the feeding chamber instead of a petri dish, enabling the aphids to be handled by a paintbrush every day without removing the diet sachet. Detached leaf bioassays were set up as in section 2.3.3. Length (from the tip of the head to the tip of the cauda) and width (across the metathorax) measurements were taken for each individual aphid on a daily basis by using a video monitor linked to a Microscale Image Analysis package.
Sometimes "one o f f measurements were taken during bioassays (usually on day 6 to coincide with a diet or leaf change) i f size differences between the control and experimental aphids were observed. These measurements were taken using the same technique as described in the paragraph above.
2.5 Glasshouse trials of A. solani using GNA-expressing potato plants
A large scale glasshouse trial was performed using mature transgenic potato plants (PWG85) expressing GNA. Prior to the trial, environmental variability within the glasshouse was examined by arranging 40 plots in grid fashion, each planted with 12 radish seeds (var. French Breakfast). Percent germination, plant height and weight and root length was recorded. Based on the results of this investigation, the trial was set up with four beds each 3m x 0.76m, and subdivided into 0.76m x 0.76m beds,
45

giving a total of 16 plots; these were separated by fine mesh attached to a frame. The beds contained a 5cm gravel base over which approximately 22cm of loam-based compost was laid. Three control and three transgenic plants were planted in each plot, alternating in a lattice grid. Before commencing the trial, tissue blots (see section 2.6.3) were taken from all plants to check that the transgenic plants were expressing GNA. Plots were randomly infested by A. solani, and routine observations made. For screening, each plant was divided into 3 parts, top, middle and bottom leaves. Infestation levels were base on a scoring system of none, light (1 aphid cm - 2 ) , medium (1-5 aphids cm - 2 ) , heavy (5-25 aphids cm"2) and very heavy (> 25 aphids cm"2).
2.6 Calculating the expression levels of the inserted genes in transgenic plants
2.6.1 Bradford protein assay
The protein assay used to calculate total soluble protein in leaf extracts is based on the method of Bradford (1976). BIO-RAD Bradford protein assay concentrated dye (diluted 1 in 5 with water) was used as the reagent; 200ul was used per well of a flat bottomed microtitre plate. 5ul of crude leaf extract was added to each well. Plates were incubated at room temperature for 2 minutes, with shaking before being read at 595nm on a plate reader (Dynatech MR5000). BSA was used as the standard protein for calibration; a range of 0-8|xg/ial BSA were prepared in extraction buffer (50mM Tris/HCl pH 9.5).
2.6.2 Immunodot blot assay
The expression of GNA and bean chitinase in transgenic plants was determined using an immunodot-blot assay detection system. Leaf samples (usually the end leaf from the third compound leaflet) were taken from each plant before the start of a trial, frozen in liquid nitrogen and then freeze dried. The samples were manually ground and proteins extracted in 50mM Tris/HCl buffer pH 9.5 (containing 1% fresh 36mg/ml PMSF in ethanol), using lOmg dried leaf/ml buffer. Extraction was carried out overnight at 4°C with shaking. Then samples were centrifuged for 10 minutes at 12,000g, 4°C and the supernatants transferred to clean tubes. Total protein concentration was quantified as described in section 2.6.1.
For the dot-blot assay 5\±g total protein/well was loaded on to nitrocellulose in a Bio-Rad dot-blot apparatus. Standards were prepared by adding purified GNA or Bean chitinase to 5u.g total protein from an untransformed control potato, at levels
46

ranging from 0-2.0% of total soluble protein. Filters were processed in one of two ways: either by using 1 2 5 I to detect primary antibody or by using the ECL method. Following detection, protein expression levels were calculated by scanning the films into Molecular Analyst computer software. The calibration data were plotted and the protein levels within the samples read off from the graphs.
2.6.3 Protein detection using radiolabeled secondary antibodies
After loading the samples, filters were blocked overnight at 4°C in TN buffer (20mM Tris/HCl pH7.2, 0.9% NaCl) containing 5% low fat milk powder (Blotto), before incubating with GNA or BCH antibody (1 in 5000 dilution in TN buffer) for 2 hours at 37°C. After washing the filters in Blotto, they were incubated with 5u.Ci of secondary antibody ( 1 2 5I-donkey anti-rabbit IgG for GNA detection, 1 2 5I-donkey anti-mouse IgG for BCH detection) in 25ml TN buffer, for 2 hours at 37°C. Then blots were washed in Blotto, rinsed in TN buffer, blotted dry and exposed to film for 24 hours.
2.6.4 E C L detection
After loading the samples, blots were rinsed in distilled water before and after soaking in 2% periodic acid for 10 minutes. Filters were blocked for 1 hour at room temperature or overnight at 4°C in blocking solution (see section 2.1.2). Then the filters were rinsed in antisera buffer (see section 2.1.2) and incubated with primary antibody (1 in 10,000 dilution in antisera buffer), for 3 hours at room temperature or overnight at 4°C. Filters were rinsed in antisera buffer before incubating with secondary HRP-conjugated antibody (HRP-anti rabbit for GNA and HRP-anti mouse for BCH) at a 1 in 5000 dilution in antisera buffer for 2 hours at room temperature. Filters were washed three times in antisera buffer and then in PBS/0.1% Tween 20, rinsed in water, with one change, for approximately 5 minutes. The following procedure was performed in a darkroom. Equal volumes of Amersham ECL detection reagents 1 and 2 were mixed, such that the total volume was equivalent to 0.125ml/cm2 of membrane. The filter was drained and detection reagent poured over the upper surface, left for one minute, then drained, placed between acetate sheets and exposed to film.
2.6.5 Tissue blots
On some occasions tissue blots, modified from Pereira et al. (1992) were used as a non-quantitative means of establishing whether transgenic potato plants were
47

expressing the transgene. The leaves were cut transversely and the cut side pressed against nitrocellulose (previously soaked in distilled water and blotted dry). Once this was completed, filters were processed as described in section 2.6.4.
2.7 Histology
2.7.1 Preparation of specimens
2.7.1.1 Adults fed on artificial diet
Newly mature, apterous, parthenogenetic A. solani were fed control diet or diet incorporating 0.1% w/v GNA for 5 days. Feeding chambers, four replicates for each diet type, containing 5 aphids, were set up and maintained as described in section 2.2.2.
2.7.1.2 Aphids fed on transgenic potato plants
One potato plant for each of two BCH-expressing lines, BCH1-21, BCH1-35 and one PBG47 plant (with the double construct encoding GNA and bean chitinase) were used to feed aphids. The plants were approximately 3 months old. Perspex cylinders were placed around each plant before inoculating with 15 first instar nymphs, produced overnight from apterous, parthenogenetic adults on control potato. After inoculation metal lids (perforated, but with fine nylon mesh over the holes) were placed over the cylinders to contain the aphids. The plants were left undisturbed (except for watering) in a Gallenkamp cooled incubator at 21°C±2°C, L16:D8 lighting regime for 11 days before removing and fixing the adults.
2.7.2 Fixation of specimens
Once the aphids had been fed on diet or transgenic plants for the allotted number of days they were fixed in a modified version of Karnovsky's fixative (Karnovsky, 1965), consisting of the following two solutions:
Solution A 2g paraformaldehyde 40ml distilled water 2-6 drops l M N a O H
* The paraformaldehyde and distilled water were warmed with continuous stirring. The 1M NaOH was added dropwise until the white precipitate dissolved.
48
Solution B 10ml 25% gluteraldehyde 50ml lOx PBS pH 7.3
The two solutions were kept separate at 4°C and mixed in equal volumes just prior to use. The aphids were transferred to Macartney bottles containing fixative and stored (for at least one week) at 4°C.
2.7.3 Dehydration and embedding of specimens
The fixed aphids were taken through a series of increasing ethanol concentrations as follows:
10% ethanol in distilled water, overnight at room temperature, 20% ethanol in distilled water, overnight at room temperature, 30%, 40%, 50%, 60%, 75%, 95% and 100% ethanol in distilled water for 30 minutes each at room temperature.
Then the aphids were transferred to 50% LR white resin/50% absolute ethanol, overnight at room temperature, followed by 4 hours in 100% LR white resin. The aphids were embedded individually in gelatin capsules containing LR white resin. The capsules were kept at 50-60°C for 3 days to allow the resin to polymerise and harden.
2.7.4 Sectioning of specimens
Specimens were sectioned to a lum thickness using a Reichert NK ultratome (Model OM 3) using glass knives cut on an LKB 7800 knifemaker. Sections were expanded using chloroform vapour before floating (in distilled water) on to polysine coated microscope slides (BDH) and adhered using heat as suggested by BDH. Some of the sections were stained with toluidine blue to ease identification of the internal structures, the remainder were used for immunohistochemical staining to detect the presence of GNA or bean chitinase.
2.7.5 Immunohistochemical staining to detect the presence of GNA/bean chitinase
The Vectastain ABC kit (rabbit IgG for GNA detection, mouse IgG for BCH detection) (Vector Laboratories, Peterborough, U.K.), utilising the avidin/biotin
49

detection method, was used to detect the presence of GNA/BCH in cut sections. Endogenous peroxidase activity was blocked by incubating the sections with 0.3% H2O2 in absolute methanol for 30 minutes. Sections were washed for 2x 5 minutes
in distilled water before incubating with 0.5mg/ml sodium borohydride in PBS for 3x 5 minutes, to block free reactive aldehyde groups. Sections were rinsed in PBS for 4x 5 minutes before incubating for 20 minutes in diluted normal serum from the Vectastain ABC kit. Excess serum was blotted from the sections before incubating for 30 minutes with primary antibody diluted 1 :1000 in PBS buffer. Sections were washed for l x 10 minutes and lx 5 minutes in PBS before incubating for 30 minutes with diluted biotinylated antibody from the kit. Then slides were washed as detailed above, before incubating for 60 minutes with Vectastain reagent. Sections were washed again, before incubating in peroxidase substrate solution for 7 minutes. The peroxidase substrate solution was prepared by mixing equal volumes of 0.02% H2O2
and 0.1% diaminobenzidine tetrahydrochloride in 0.1M Tris buffer pH 7.2. Sections were washed for 5 minutes in tap water, dried thoroughly and mounted under a coverslip in DPX mountant before viewing and photographing.
Some of the sections were incubated with pre-immune serum (rabbit for GNA/ mouse for BCH) instead of primary antibody to act as a further control.
2.8 SDS-Polyacrylamide gel electrophoresis
2.8.1 Preparation of SDS-PAGE minigels
Unless otherwise stated 15% acrylamide gels were prepared according to the basic recipe suggested by Hames (1981):
Resolving gel Stacking gel 7.5ml 1.25ml Acrylamides
Tris/HCL pH 8.8 Tris/HCl pH 6.8 distilled water De-gas for 5 minutes 10% SDS 2% APS TEMED
1.875ml
4.915ml
0.15ml 0.56ml 7.5(̂ 1
2.50ml 5.65ml
0.10ml 0.50ml 7.5jnl
An equal volume of 2x SDS sample buffer (see section 2.1.2) was added to all samples along with 2ju.l of p-mercaptoethanol, before boiling for 5 minutes and chilling on ice. SDS7 protein marker (Sigma) was run on all gels. Gels were loaded
50

and electrophoresis carried out in an ATTO electrophoresis tank at 70V past the
stacking gel and 110V to the bottom of the gel. After electrophoresis, gels were
stained with a solution of 0.05% Kenacid Blue R in 40% methanol, 7% acetic acid
and de-stained in the same solution minus the dye.
2.8.2 Silver staining
Minigels were prepared as described in section 2.8.1 and then silver stained using a
protocol obtained from Dr. H.S. Edmonds (University of Durham). The gel was
incubated, with shaking in the following solutions:
50% methanol, 5 % acetic acid for 15 minutes
7% methanol, 5% acetic acid for 15 minutes
10% glutaraldehyde for 15 minutes
deionised water (either for 6x 10 minutes or overnight)
5ng/ml DTT in water for 10 minutes 0.1% AgNC>3 in water for 15 minutes
2 quick washes with deionised water
developer (3.26% Na2C03 anhydrous + 100u,l formaldehyde)*
'stop' solution (50% methanol, 10% acetic acid)
* gel covered with a few mis of developer, shaken by hand until solution starts to
cloud, poured off and rest of the developer added. Left shaking until bands appear
then discarded and 'stop' solution quickly added.
2.8.3 Western blotting
The semi-dry blotting technique of Kyshe-Anderson (1984) was employed to
transfer protein from minigels to nitrocellulose filters. The blotting apparatus was
stacked in the following order.
Anode plate
2 sheets of 3 M M paper soaked in anode buffer 1
1 sheet of 3MM paper soaked in anode buffer 2
1 sheet of nitrocellulose soaked in distilled water
1 acrylamide gel to be blotted
1 sheet of 3MM paper soaked in cathode buffer
1 sheet of cellophane soaked in distilled water
2 sheets of 3MM paper soaked in cathode buffer
Cathode plate
51

Electrotransfer was performed at 2.5mAcm"2 for 1 hour. Proteins were detected using the ECL detection system as described in section 2.6.4.
2.9 Analysis of aphid honevdew
2.9.1 Honeydew collection
Artificial diet feeding chambers were prepared in the usual way (see section 2.2.2), except that the moist filter paper was not included in the petri dish base. Artificial diet with and without 0.1% GNA w/v (supplied by Peumans, Catholic University of Leuven, Belgium) was incorporated into the diet sachets. Five replicate feeding chambers of contol and treatment were set up, each one containing 5 first instar nymphs. Chambers were kept in a Gallenkamp cooled incubator at 21°C±2°C, L16:D8 lighting regime.
After 10 days the aphids and all the shed exoskeletons were removed from the chambers and 100u,l distilled water + I O O J L I I of 2 X SDS sample buffer were added to all chambers, which were then covered with parafilm and left shaking overnight at 4°C to collect the honeydew.
2.9.2 Analysis of honeydew
Once the honeydew had been collected a series of 15% SDS-PAGE minigels were prepared (see section 2.8.1) for silver staining and Western blotting (as described in sections 2.8.2 and 2.8.3 respectively).
When running the samples on minigels, 18|ul of each sample was taken, 2|nl of (3-mercaptoethanol added and then boiled for 5 minutes and cooled on ice. 7^1 of SDS7 marker + 2ul of P-mercaptoethanol was run as a size marker. Pure GNA was also loaded onto the gels as a standard: 9^1 of a lmg/ml solution + 9jnl of 2x SDS sample buffer + 2|al of P-mercaptoethanol was boiled for 5 minutes and chilled on ice before loading.
2.10 Gel electrophoresis of DNA
DNA electrophoresis was performed in a Pharmacia GNA-100 mini gel apparatus, according to Sambrook et al. (1989). 0.7% or 1.5% agarose gels were used with TAE buffer unless otherwise stated. Gels and running buffer contained lfo.g4il
sis a
52

ethidium bromide. 0.2-0.3 volumes of dye-loading buffer (lOmM Tris/HCl, lOmM EDTA pH 8.0, lmg/ml fast orange G, 30% glycerol) was added to samples prior to loading. Electrophoresis was carried out at 70V (unless otherwise stated) for approximately 2 hours. A commercial restriction of Xpst DNA was used as a size marker. Gels were viewed under UV light transmitted at 300nm.
2.11 Formaldehyde gel electrophoresis of RNA
Electrophoresis and gel preparation were carried out essentially according to Sambrook et al. (1989). 1.5% agarose gels were made using RNase free water, 5x formaldehyde gel-running buffer and 12.3M (37%) formaldehyde (3.5:1.1:1.0 parts respectively). A total amount of lOug RNA in 4.5ul was loaded for each sample. Before loading, the following were mixed with each sample:
4.5ul RNA
2.0ul of 5x formaldehyde gel-running buffer 3.5ul formaldehyde lO.Oul formamide
Samples were incubated at 65°C for 15 minutes and chilled on ice before centrifuging briefly. 2ul of formaldehyde gel-loading buffer (50% glycerol, I m M EDTA pH 8.0, 0.25% bromophenol blue, 0.25% xylene cyanol FF) was added to each sample and then loaded on to gel. Before loading, gels were pre-run for 5 minutes at 50V. After loading, the gel was run for approximately 3 hours at 50V, using a pump to keep the running buffer circulating. Total pea RNA was used as a standard.
Gels were stained overnight in a solution of ammonium acetate (1.41g in 100ml) containing lOOul of lOmg/ml ethidium bromide. Then gels were destained for 2-3 hours in distilled water before viewing under UV light transmitted at 300nm.
2.12 Investigating the variability of the stock A solani
2.12.1 Variability in performance of A. solani on control artificial diet
A synchronised, apterous, parthenogenetic population of newly mature adults were taken from the stock and used to produce 1st instar nymphs overnight on control diet. These were used to set up feeding chambers (10 replicates), all with control diet sachets, and kept under the normal conditions (section 2.2.2). Survival and
53

fecundity of the aphids were recorded on a daily basis. Meanwhile, the adults used
to produce the nymphs were kept going on control potato (separate from the rest of
the culture) and used again when they were 8 days old to produce nymphs. This
enabled a further trial to be set up in the same way. Nymphs produced by these
adults during the first 24 hours on control potato were also kept, reared on potato,
and the whole process was repeated once these matured into adults.
2.12.2 Genomic DNA extraction from individual aphids
Individual aphids were taken from the laboratory culture, placed in eppendorf tubes,
frozen in liquid nitrogen and stored at -20°C for future use.
DNA was extracted from each individual aphid following the method of De Barro et al. (1995a). The DNA was quantified by reading the absorbance at 260 and 280nm on a Pye Unicam SP8-150 UV/VIS spectrophotometer. The A260/280 ratio was
worked out and the amount of DNA calculated on the following basis (Promega): for double stranded DNA: 1 A26O unit contains 50ug/ml DNA.
2.12.3 MAPB-PCR
De Barro et al. (1995a) suggest that the 10 base Primer 12 (Operon Kit F, Operon
technologies, INC, California, U.S.A.) was the most effective RAPD-PCR primer
for use with genomic DNA extracts from Sitobion avenae. The corresponding
primer sequence: 5 ACG GTA CCA G 3 ' was synthesised by J. Gilroy, University of
Durham, U.K).
RAPD-PCR reactions were set up with the individual aphid genomic DNA extracts
(prepared in section 2.12.2) as templates, using the conditions described in De Barro
et al. (1995a). The Taq polymerase was supplied by Promega (Southampton); all
other PCR reagents were obtained from MBI Fermentas (Immunogen International
Ltd, Sunderland, Tyne & Wear). The PCR reactions were carried out in a Pharmacia
LKB-Gene ATAQ Controller PCR block. A variety of other PCR conditions were
also tried, which included varying the temperatures and length of time for the
annealing reaction and varying the concentration of DNA template.
After the PCR reaction had terminated, 15(4.1 aliquots, mixed with 5ul of the gel
loading dye, fast orange, were loaded on to a 1.5% agarose minigel. (see section
2.10). A commercial digest of A.pst DNA was used as a size marker. Gels were run
at 50V for approximately 3 hours and then viewed under UV light.
54
2.13 Isolation of the gene encoding a lectin expressed in the rhizomes of Urtica dioica (Stinging nettle)
2.13.1 Genomic DNA extraction from Urtica dioica leaves
The small developing leaves, from new shoots, were picked off stinging nettle plants in Great High Wood, Durham, U.K. and immediately placed in liquid nitrogen. The leaves were ground up using a pestle and mortar, in liquid nitrogen, and the resultant powder transferred to eppendorf tubes (approximately lOOmg/eppendorf). Samples were kept on ice. 300ul of extraction buffer (see section 2.1.2) was added, vortexed for 15 seconds and then extracted for 1 hour with gentle agitation at room temperature. The extracts were centrifuged for 5 minutes in a bench top centrifuge at top speed. One-tenth the volume of 3M potassium acetate pH 5.2 was added to the supernatant, vortexed and stood on ice for 30 minutes. Extracts were centrifuged again at top speed for 5 minutes and the supernatants retained. During the following phenol extraction, tubes were vortexed for 15 seconds and centrifuged at top speed for 3 minutes in a bench top centrifuge, at each stage. An equal volume of phenol was added to each supernatant, after vortexing and centrifuging the aqueous layer was taken and retained and an equal volume of chloroform added. After vortexing and centrifuging the aqueous layer was transferred to a new tube and an equal volume of chloroform added to repeat the chloroform extraction, l u l of glycogen and two volumes of 100% ethanol (-20°C) were added to the resulting aqueous phase, the tubes inverted several times and left overnight at -20°C, for DNA precipitation to occur. Samples were centrifuged at 4°C (Sarsted) for 20 minutes and the supernatant discarded. 1ml of 70% ethanol (-20°C) was added to the pellets, tubes were inverted a couple of times and stood on ice for 1 hour before centrifuging again for 5 minutes at 4°C. Supernatants were poured off and the pellets dried in a vacuum dessicator for approximately 10 minutes. Pellets were resuspended in 50ul of sterile distilled water at room temperature for 3 hours (briefly vortexed beforehand), before pooling the samples into two aliquots (stored at -20°C).
After extraction, aliquots of the samples were electrophoresed on a 0.7% agarose gel. Before loading on gel, l u l of RNAase (Sigma; prepared according to Sambrook et al. (1989) was added to each 20ul aliquot of DNA extract and incubated for 1 hour at 37°C (to digest any RNA that might be present in the samples).
55

2.13.2 P C R using genomic DNA from Urtica dioica, to amplify the gene encoding nettle lectin
Two oligonucleotides were designed (aided by the gene sequence published by Lerner and Raikhel (1992), for use as PCR primers. The primers, made by J. Gilroy (University of Durham), had the following sequences:
5 'GAA AAG ATG ATG ATG AGG 3 ' as the 5' end primer (includes the start codon)
5 'GTT TTA CGC CGC AAC ACG 3 ' as the 3' end primer (reverse complementation
of the region encoding the stop codon).
PCR reaction tubes were prepared as follows:
50ul 2x PCR reaction buffer 30ul DNA template 1 ul of each primer (lOOpmols/ul) 1 ul Taq DNA polymerase sterile distilled water to bring the final volume up to lOOul.
Controls were set up containing all the necessary components but only one of each primer, to enable products to be checked against artefacts that the primers might yield. A l l reaction mixtures were overlaid with 100u.l of mineral oil to prevent evaporation. A Pharmacia LKB-Gene ATAQ controller PCR block was programmed to run an initial denaturation step at 94°C for 3 minutes, followed by 29 cycles of denaturation at 94°C for 40 seconds, annealing at 48°C for 1 minute, elongation at 72°C for 1 minute and a final elongation step at 72°C for 5 minutes. Once the reaction was complete 20ul samples were run on a 0.7% agarose minigel.
2.13.3 Extraction of RNA from Urtica dioica rhizomes
Stinging nettle rhizomes, dug up from Great High Wood, Durham, U.K. were washed in tap water, broken up, frozen in liquid nitrogen and stored at -80°C for future use.
Al l equipment and solutions used during RNA extraction must be free from RNAse contamination, to prevent degradation. Glassware was baked overnight at 180°C, polypropylene centrifuge tubes were treated with 0.1% diethyl pyrocarbonate (DEPC) overnight and then autoclaved. Corex glass centrifuge tubes were treated
56

with repelcote (BDH-Merck Ltd, Lutterworth, Leics) before baking. Al l solutions were treated with 0.1% DEPC overnight before autoclaving. Those that cannot be autoclaved were made up in baked bottles and RNase free water was used during preparation. The polytron rotor was treated with 0.1% DEPC overnight and then thoroughly washed with RNase free water.
Nettle rhizomes, weighed into 2g aliquots, were ground up using a pestle and mortar, in liquid nitrogen. The small yellow parts of the rhizomes were used because these are more grindable and should contain more RNA. 12ml of denaturing solution (see section 2.1.2) were pipetted into 50ml polypropylene centrifuge tubes and chilled on ice for 5 minutes. The ground tissue was added to the denaturing solution and homogenised using a polytron for 15-30 seconds. 1.2ml of 2M sodium acetate pH 4.0 were added and mixed thoroughly. 12ml of phenol:chloroform:isoamyl alcohol (25:24:1) were added and mixed by vigorously shaking for 10 seconds, then chilled on ice for 15 minutes. The mixture was divided into two 30ml corex glass centrifuge tubes and centrifuged (Beckman J2-HC) at 10,000g for 20 minutes at 4°C. The aqueous layer was retained, an equal volume of isopropanol added and samples incubated overnight at -20°C to allow the RNA to precipitate.
RNA was pelleted by centrifuging at 10,000g for 15 minutes at 4°C. The supernatant was poured off and the RNA resuspended in 5ml of denaturing solution. An equal volume of isopropanol was added and the RNA precipitated by leaving overnight at -20°C. RNA was again pelleted by centrifuging as before and the supernatant poured off. Pellets were washed with 10ml of 75% ethanol (ice cold) and left to stand for 10-15 minutes at room temperature, before centrifuging again. The supernatant was poured off and pellets dried using a vacuum dessicator before resuspending in 400 ul of RNase free water.
Absorbance from 300nm to 220nm was read on a Pye Unicam SP8-150 UV/VIS spectrophotometer. The quantity of RNA was calculated with the equation: 1 A260
unit of single stranded RNA = 40ug/ml (Promega). A sample of the extracted total RNA was run on a formaldehyde electrophoresis gel (see section 2.11).
RNA was stored at -80°C in 3 volumes of absolute ethanol for future use. On use, one-tenth the volume of 3M sodium acetate pH 5.2 was added, mixed and centrifuged (Sarsted) at top speed for 5 minutes at 4°C. The supernatant was discarded and the pellet dried in a vacuum dessicator before resuspending in a small amount of RNase-free water.
57
2.13.4 Extraction of mRNA from total RNA of Urtica dioica rhizomes
This was done using the PolyATtract® mRNA Isolation system from Promega following the protocol for small scale mRNA isolation (PolyATtract® systems I I I , IV). The total RNA samples were pooled and the final volume brought up to 500u,l in RNAse free water before starting. After isolating the mRNA, absorbance readings were taken as in section 2.13.3.
2.13.5 cDNA library synthesis from Urtica dioica rhizomes
The ZAP-cDNA® synthesis kit from Stratagene was used, following the supplied instructions, to prepare and amplify a cDNA library of U. dioica rhizomes, from the mRNA isolated in section 2.13.4.
2.13.6 Amplifying the gene encoding nettle lectin, using PCR, from the cDNA library of Urtica dioica rhizomes
DNA template from the cDNA library, was boiled for 10 minutes then chilled on ice, before using in PCR reactions. Reaction tubes were set up as follows:
50u,l of 2x PCR reaction buffer (see section 2.1.2) 20^1 cDNA \\x\ primer 1 1 JLLI primer 2
ljal Taq polymerase 27^1 sterile distilled water,
and overlaid with lOOjul of mineral oil. Controls were also set up where only one of the primers was included to ensure that products were not primer artefacts. Three different sets of primers were used in the PCR reactions, designed from the published nettle lectin gene sequence (Lerner and Raikhel, 1992). Primer set 1 were those described in section 2.13.2. They were tried in a series of reactions with the annealing temperature set at 48°C. Primer set 2, with the following sequences:
primer 1: 5 'TCT GCC GTA GTG ATC ATG 3 ' primer 2: 5'GTC GCA GTA CCT CTT GTA 3 ' ,
58

were supplied by Perkin-Elmer Ltd, Warrington and tried with an annealing temperature of 43°C. Primer set 3, with the following sequences:
primer 3:5'TGG GGN TGG TGY GGN GA 3 ' primer 4: 5 AGC GGT ACT GGC ATT TGC 3 ',
were also supplied by Perkin-Elmer, Warrington and were tried with an annealing temperature of 54°C, with the addition of luJ of enhanced perfect match (Stratagene) to the reaction tubes.
A Pharmacia LKB-Gene ATAQ controller PCR block was programmed to run 29 or 35 cycles of denaturation at 94°C for 40 seconds, annealing for 1 minute at the appropriate temperature for the primer set and elongation at 72°C for 1 minute. The initial denaturation step was for 3 minutes at 94°C and the final elongation was for 5 minutes at 72°C. After all PCR reactions, samples were electrophoresed on 0.7% agarose gels and under UV transmitted light.
2.13.7 Electroelution of PCR products from agarose gel
Slices of gel, containing the DNA bands of interest were cut from the gel, placed in dialysis tubing (prepared according to Sambrook et al. (1989), containing a minimum amount of TAE buffer, clipped at both ends, ensuring no air bubbles. The tubing was placed in a Pharmacia GNA-100 minigel apparatus containing TAE running buffer, perpendicular to the current flow. The voltage was set at 50V for 15 minutes, the tubing checked under UV light to ensure the DNA had migrated out of the gel slice, and then the polarity reversed for 15 seconds before removing the buffer (containing the DNA) with a micropipette.
2.13.8 Purification of PCR products for sequencing
DNA electroeluted from gels was purified using the Wizard Plus Minipreps DNA purification system (Promega). Half a volume of "Wizard" miniprep neutralising solution was added to the DNA-containing solution and mixed. 500u,l of DNA purification resin was added, the tubes inverted several times and stood at room temperature for 5 minutes with occasional shaking. The resin/DNA mix was transferred to a 5ml syringe barrel, the plunger inserted and the solution slowly pushed through a minicolumn which was then washed through with 3-4ml of column wash solution. The minicolumn was transferred to a 1.5ml microcentrifuge tube, spun at top speed (bench centrifuge) for 1 minute and the column transferred
59

to a new eppendorf tube. 50^1 of milli Q water (heated to 70°C) was added to the column, incubated for 1 minute and then spun at top speed for 1 minute. The eluent was re-applied to the column and spun through again. 1 ̂ 1 of purified product was electrophoresed on 0.7% agarose gel using pGEM3Z + as a standard, to ascertain the product concentration.
2.13.9 Sequencing of PCR products
Products were sequenced in both directions using an ABI automated sequencer by J. Bartley (University of Durham, U.K). A database search using the Basic Local Alignment Search Tool (BLAST) was performed to find matching sequences.
2.13.10 Excision and sequencing of random clones from the Urtica dioica cDNA library
The cDNA library was plated and titered on NZY agar plates (using dilutions of 1-1:100,000) following the procedure outlined in the cDNA synthesis kit protocol (Stratagene). Once plaques had grown, 20 were excised at random following the single-clone excision procedure outlined in the above cDNA synthesis kit protocol and miniprepped following the Promega modified Wizard miniprep procedure, for use with ABI Automated sequencing.
Six of these clones were then sequenced, in one direction, using the SK primer as described in section 2.13.9.
2.13.11 Plating out and primary screening of Urtica dioica cDNA library
The cDNA library was plated out on NZY agar following the procedure outlined in the Stratagene cDNA synthesis kit protocol, but plates were incubated at 37°C for only 4 hours (so that colonies did not become confluent) before transferring to 4°C until use.
Random clone 13 (see section 2.13.10) proved to have a high scoring match with an U. dioica lectin/endochitinase precursor sequence found in the database, so this was used to probe the cDNA library. The probe was labelled with 3 2P-dCTP by adding the following (orderwise) to an eppendorf tube:
60
31ul DNA probe to be labelled lOui OLB 2ul of lOmg/ml BSA 50ulCi 3 2P-dCTP 2u,l Klenow enzyme.
and incubating overnight at room temperature. A column was prepared by cutting the top off a 5ml disposable plastic pipette and plugging the bottom with a small amount of glass wool. This was filled with Sephadex G-50 (prepared by placing 2g in a universal bottle which was filled with l x column buffer (see section 2.1.2), heated at 90°C for 1 hour and more lx column buffer added). The column was saturated with l x column buffer (this was kept topped up to ensure the Sephadex never dried out). The incubated, radioactive DNA sample was loaded onto the column and the position of incorporated (lower signal) and unincorporated (higher signal) were monitored down the column using a Geiger counter. The incorporated radioactive labelled probe was collected in eppendorf tubes as it eluted off the column and the scintillation counts measured.
Plaques on the plates were transferred on to nitrocellulose membrane (soaked in distilled water and then blotted dry). Duplicates were made. A needle and waterproof ink was used to prick through the agar for orientation. Membranes were then soaked in the following solutions for 5 minutes each (blotted dry for 5 minutes between solutions): 10% SDS, denaturing solution (1.5M NaCl, 0.5M NaOH), neutralising solution (1.5M NaCl, 0.5M Tris/HCl pH8.0) and 2x SSC, before baking at 80°C for 2 hours (see section 2.1.2 for preparation of all solutions used).
Filters were incubated in pre-hybridisation solution (pre-heated to 65°C), in a 65°C waterbath, overnight. Then they were transferred to a plastic bag, hybridisation solution (pre-heated to 65°C) added and then the labelled DNA probe was added. Before adding the probe it was boiled for 5 minutes then immediately put on ice for 5-10 minutes. Hybridisation was carried out in a 65°C waterbath overnight. Filters were washed twice for 30 minutes each in 2x SSC, 0.1% SDS, at 65°C, before blotting dry and exposed to autoradiograph fi lm for 4 days. Films were developed and positive colonies (where the probe was bound) identified.
2.14 Statistical Analyses
All statistical analyses were performed using the Statview programme for Macintosh computers.
61

3. GNA BIOASSAYS: RESULTS AND DISCUSSION
3.1 Artificial diet bioassavs
3.1.1 First instar nymphs reared on diet incorporating 0.1% GNA
An artificial diet bioassay of GNA at 0.1% w/v against A. solani was set up as described in section 2.2.3, with 10 feeding chambers of control and treatment, each containing 5 aphids. The results of the bioassay can be seen in Fig. 4. In contrast to the rapid mortality of aphids on the "no diet" control (all dead by day 4), aphids on diet (with or without GNA) showed survival rates of >85% until maturity (10 days). However, the survival of aphids on diet containing GNA was lower (by approximately 10%) than on control diet, although this difference was not significant. Aphid mortalities increased on maturity so that by 20 days the survival of control and GNA-fed aphids had declined to approximately 35%. The difference in survival between control and GNA-fed insects declined during this period so that by 20 days there were no differences in survival between the two groups.
Parthenogenetic production of nymphs was used as a measure of adult fecundity. Differences between the control and GNA-fed insects were apparent both in the time taken to start nymph production, and in the rate and total number of nymphs produced. Nymph production in the control aphids commenced between days 10 and 11, whereas GNA-fed aphids did not produce offspring until between days 13 and 14. The rate of nymph production was higher in control insects; over comparable periods, the GNA-fed aphids produced nymphs at approximately 35% of the rate of the controls (1.4 nymphs per replicate per day, compared to 3.2 nymphs per replicate per day respectively). Consequently the delay in onset and a slower rate of nymph production, resulted in a highly significant difference (non-parametric Mann-Whitney U test, p = 0.0112) in the cumulative nymph production between the control and GNA-fed aphids by day 20 (Fig. 4).
3.1.2 First instar nymphs reared on control diet and transferred to diet incorporating 0.1% GNA upon maturity
This bioassay was set up to help determine whether GNA was affecting insect development or whether it was exercising a toxic effect on adult aphids. First instar nymphs were reared on control diet for 10 days (point of maturation), before being transferred to diet with or without 0.1% w/v GNA added. Ten replicates of
62

Total survivors (no diet) O * Cumulative nymphs(control)
Total survivors (control) — O — ® Cumulative nymphs(GNA)
Total survivors (GNA)
Cumulative Survivors / nymphs / replicate replicate
25
20
15
10
L 1
20 8 12 16 Days
Fig. 4. Graph showing the survival and cumulative nymph production per replicate of Aulacorthum solani against time, when fed on control diet with or without the addition of 0.1% w/v GNA. Ten replicates for all treatments each contained five first instar nymphs at the start of the assay which was run for 20 days.
63

treatment and control were set up. It was noted that some of the aphids used in this assay developed into the alate form. The assay was continued until all the aphids in one group had died. In this bioassay, no significant differences (Logrank x 2 test, p = 0.7287) were found in survival between control and experimental groups, both reaching zero survival by day 35 (Fig. 5).
GNA was less effective in reducing the fecundity of these aphids compared to when insects were exposed to GNA during development (Fig. 5). Nymph production was again delayed by 3 days in the GNA-fed group but the rates of nymph production were similar in both groups (approximately 1.0 nymphs per replicate per day) until day 23. At this point the cumulative nymph production was only 14% lower in the GNA-fed aphids, however after this the rate of nymph production declined markedly in these aphids and more slowly in the control insects so that cumulative nymph production was 23% lower in the GNA-fed group by day 34. Overall nymph production was less than in the previous assay (section 3.1.1) and differences in nymph production between the control and GNA-fed aphids were not significant at any one point in time (non-parametric Mann-Whitney U test, p = 0.6776 on day 20 and p = 0.1620 on day 34).
3.1.3 The effect of 0.1% GNA on the growth and development of A. solani
In this bioassay, feeding chambers were set up as described in section 2.4 and aphids fed on either control diet or diet with 0.1% GNA incorporated. The length and width of each aphid was measured on a daily basis, in addition to survival being recorded (see Figs. 6a and 6b). In this assay a significant difference was found between the survival of aphids on control diet and GNA-fed aphids (Logrank x 2 test, p < 0.0001) (Fig. 6b). Little mortality occurred in the control insects with survival at 95% over 8 days. However the survival of the GNA-fed insects had declined to 85% after 5 days and then declined rapidly to less than 10% by day 8.
The growth curves for control aphids showed that length increased by approximately 0.18mm per day over days 1-4 and by approximately 0.06mm per day over days 4-7; width increased by approximately 0.05mm per day over the first 5 days and showed little increase after that. The GNA-fed aphids showed significantly slower growth rates; the rate of increase in length and width decreased by approximately 30% and 40% respectively. Some increase in the width of the GNA-fed aphids, relative to the controls appears to occur at the end of the assay, but this is only due to the larger aphids surviving on the GNA-containing diet. Throughout
64

Survivors/rep (control) — O — • Nymphs/rep (control)
Survivors/rep (GNA) O • Nymphs/rep (GNA)
Cumulative nymphs/ Survivors/ replicate replicate
12
10
8
1
0 0 30 10 15 20 25 35
Days
Fig. 5. Graph showing the survival and cumulative nymph production per replicate of Aulacorthum solani against time. A l l aphids were fed on control diet until day 10, when they were transferred to diet with or without the addition of 0.1% w/v GNA. Ten replicates for both treatments each contained five aphids, some of which developed into the alate form. The bioassay was terminated on day 35 when all aphids had died.
65

Mean size 1.8 of Control Length
survivors, 1.6 mm GNA length
1.4 Control Width
GNA Wid 1.2
1
0.8
0.6
0.4
0.2 0 3 8 1
Days
Survivors 55
50
45
40
35
30
25
20
15
10 Control Survivors
GNA Survivors B o • •
0 1 2 3 4 5 6 7 8 9
Days
Fig. 6. Graphs showing a) the mean length and width of the surviving aphids and b) the number of survivors of Aulacorthum solani, against time, when fed control diet with or without the addition of 0.1% w/v GNA. The survival of the GNA-fed aphids was significantly worse than the control aphids (Logrank %2 test, p < 0.0001). The bioassay was run over 8 days with daily length and width measurements taken for each aphid. Ten replicates for each treatment each initially contained five first instar nymphs.
66

the assay the length and width of GNA-fed aphids were significantly smaller (p<0.01) than the control aphids (Fig. 6a).
3.1.4 First instar nymphs reared on diet incorporating 0.05% GNA
In this bioassay, A. solani were reared on diet with or without 0.05% w/v GNA added, from 1st instar using the method described in section 2.2.3 (ten replicates of each diet type were used). Again, the results typically show (Fig. 7) that the "no diet" controls are all dead by day 3. Also typical to this assay method, aphids feeding on diet with or without the addition of 0.05% GNA show survival >95% until day 8. From this point the survival of the control insects declines more markedly so that by day 20 only 32% of the aphids were still alive. In contrast the survival of the GNA-fed insects continued to be high (96%) until day 12 when it declined more rapidly until day 20 when 28% of the GNA-fed aphids had survived. It is interesting to note that between days 9 and 19 insect survival is higher on the diet containing GNA than the control survival, however, by day 20 the percent surviving is very similar and there is no significant difference between the survival of the two groups (Logrank y} test, p = 0.6422).
Unlike assays where a higher concentration of GNA was tested (see sections 2.3.1 and 2.3.2), GNA at 0.05% w/v does not exert any effect on the time taken to commence nymph production; both groups of aphids producing nymphs between days 9-10 (see Fig. 7). Also in contrast to bioassays testing GNA at 0.1% w/v, this assay shows that GNA has a stimulatory effect on the rate of nymph production. The control aphids had a fairly constant rate of nymph production of approximately 0.7 nymphs per replicate per day between days 10-20. However the rate of GNA-fed aphids varied throughout the same period, starting at 1.1 nymphs per replicate per day (days 9-11) then increasing to 3.3 (days 11-18) before decreasing to 1.3 nymphs per replicate per day (days 18-20). Over a comparable time (days 11-18) the GNA-fed aphids were producing nymphs at a rate of approximately 25% faster than the control group so that by day 20 a significantly greater number of nymphs had been produced by the GNA-fed aphids when compared to the controls (non-parametric Mann-Whitney U test, p = 0.0052). It should be noted that in this bioassay only 4 out of the 10 control replicates actually produced any nymphs at all.
Once the nymphs used to set up this 0.05% GNA diet bioassay had matured and started producing nymphs of their own, the nymphs were removed with each diet change and used to set up a further bioassay to investigate the effects of GNA on second generation aphids. The removed nymphs were distributed between feeding
67

Cumulative nymphs/ Survivors/ replicate replicate
30
25
20
15
10
0 0 i 24 8 12 16 20 0
Days
Total survivors (no diet) • Cumulative nymphs (control)
Total survivors (control) • Cumulative nymphs (GNA)
Total survivors (GNA)
Fig. 7. Graph showing the survival and cumulative nymph production per replicate of Aulacorthum solani against time, when fed on control diet with or without the addition of 0.05% w/v GNA. Ten replicates for all treatments each contained five first instar nymphs at the start of the assay which was run for 20 days.
68

chambers in such a way that nymphs originating from the control and GNA-fed aphids were divided between control diet and diet incorporating 0.05% w/v GNA. The survival of these nymphs was recorded over the next 14 days (see Fig. 8).
As can be seen from Fig. 8, nymphs originating from control aphids and kept on control diet showed 100% survival until day 7 when mortality commenced so that by day 14 only 57% remained alive (mortality rate is 4.8% per day between days 6 and 12). Nymphs originating from the control aphids and transferred to diet with GNA added showed high survival (90%) until day 6 when mortality markedly increased so that by day 14 only 18% survived (mortality rate 12.2% per day between days 6 and 12). Of the nymphs originating from the GNA-fed aphids and put back on control diet 14% died over the first 24 hours, then the mortality rate steadied to a slower rate so that by day 14, 61% were still alive (mortality rate of 2.7% between days 6 and 12). Nymphs born to the GNA-fed aphids and continued on GNA-containing diet also showed a sharp initial mortality (12% dying over the first 24 hours). Mortality then decreased so that 70% were still alive at day 13. A further 15% drop in survival was seen over the last 24 hours bringing survival to 55% (mortality rate 1.5% between days 6 and 12). However, only two significant differences were found in this data: nymphs born to GNA-fed aphids and transferred either to control diet or kept on diet with GNA added, both had a significantly higher survival (Logrank x 2 , p = 0.0138 and p = 0.0154 respectively) than nymphs born to control aphids and transferred to diet containing GNA. These second generation aphids failed to produce any nymphs so no fecundity data was obtained.
This bioassay was performed using GNA supplied by Dr. W. Peumans (Catholic University of Leuven, Belgium). A sample of this GNA was electrophoresed on a 15% SDS-PAGE minigel (see section 2.8.1) to ascertain the purity of the sample. It was determined that the GNA was sufficiently pure for insect bioassays, in so far as no contaminating proteins were found (gels not shown).
3.1.5 Dose response bioassay of A. solani against GNA
A dose response assay was set up using 5 replicates each of control diet and diet with GNA incorporated at varying concentrations (0.1%, 0.05%, 0.02% and 0.01% w/v). The bioassay was run in the usual manner (see section 2.2.3). However, nymph production was so poor on all treatments and control diet that the results are not presented and no conclusions can be drawn from the data.
69

Aphid survival (%)
100
80
60
40
control to control
control to GNA 20
GNA to control
GNA to GNA
0 i 3 11
Day
Fig. 8. Graph showing the percentage survival of second generation Aulacorthum solani against time when fed on diet with or without the incorporation of 0.05% w/v GNA. Nymphs produced by aphids feeding on control diet and diet incorporating 0.05% GNA were transferred to new chambers in such a way that nymphs from each treatment were put on diet with and without GNA. This assay was run for 14 days.
70

3.1.6 Honeydew analysis of A. solani feeding on 0.1% GNA
Aphids were fed on diet with or without the incorporation of 0.1% w/v GNA for 10 days. After this the honeydew was collected as described in section 2.9.1 and analysed on 15% SDS-PAGE minigels (see section 2.9.2). After 10 days of feeding on the diets, no significant differences were found between the survival of control and GNA-fed aphids (>96% in both cases).
When honeydew samples were electrophoresed on 15% SDS-PAGE minigels and stained with Kenacid Blue R solution, no protein bands were apparent in any of the honeydew samples (control or GNA-fed); a band corresponding to GNA (a total of 9jag was loaded) was observed in the lane containing the GNA standard, indicating that nothing had interferred with the running of the gel. A second minigel was prepared but this time stained using the silver staining technique described in section 2.8.2). However, again no bands in the control or GNA-fed aphid samples were observed. Minigels were also blotted on to nitrocellulose filters (see section 2.8.3). The filters were then probed with a GNA antibody and the ECL detection system employed to identify any GNA present in the samples. However, none was found.
3.2 Controlled-temperature plant bioassavs using transgenic potatoes expressing GNA
3.2.1 Aphids contained in clip-cages on transgenic potatoes expressing GNA (bioassay number 1)
Control and transgenic potato plants were grown to maturity under controlled environmental conditions, and exposed to aphids using the "clip-cage" bioassay protocol (see section 2.3.2). The initial nymphs showed 100% survival until maturity on both the control and transgenic plants (see Fig. 9). Mortality was observed on both control and GNA-expressing plants once nymph production started, so that by day 30 survival in both groups was in the range of 35-40%. However during days 15-28, survival on the GNA-expressing plants was higher than the control aphids; mortality of these aphids only increased rapidly over the last two days. However, over the whole bioassay there was no significant difference (Logrank y} test, p = 0.4689) between the survival of the aphids on control and transgenic plants.
71

Cumulative % survival nymphs/ of adults adult
100 70
0-0-0 90
ooooo 60 80
70 50
60 40
50
30 40
30 20
20
10 10
0 0 0 10 15 20 25 30
Days
Cumulative nymphs/adult (control)
% survival . . . . + . . . . Cumulative nymphs/adult (GNA expressing potato) (GNA expressing potato)
% survival (control)
Fig. 9. Graph showing the percentage survival and fecundity per adult of Aulacorthum solani on control and GNA-expressing potato plants. Aphids were contained individually in clip cages, with access to the lower leaf surface. 24 cages (8 plant replicates) were set up for each plant type and the bioassay run for 30 days.
72

Differences in the fecundity of aphids on the control and transgenic plants can also be seen (Fig. 9). There is no noticeable lag in nymph production between the control and experimental insects, both groups starting to produce nymphs between days 9-10. Nymph production in the control aphids averaged 2.0 nymphs per adult per day over days 9-25, however the rate of nymph production of aphids on the GNA-expressing plants was only 0.8 nymphs per adult per day over the same period. This shows a decrease in the production rate of approximately 60%, resulting in the fecundity of this aphid species being significantly reduced (unpaired t-test, p < 0.01 for total nymphs on day 25) on the GNA-expressing potatoes.
Just prior to this bioassay, leaf samples from the third compound leaf of each plant were taken and the expression levels of GNA in these leaves determined by immunodot blot analyses (see section 2.6.2). GNA levels in all the experimental plants lay in the range of 0-1.0%, with an average expression level of 0.47% of total soluble protein. GNA levels in the control plants were not above the background level in the dot-blot assay.
3.2.2 Aphids contained in clip cages on transgenic potatoes expressing GNA (bioassay number 2)
This second clip cage bioassay was set up using several different GNA-expressing lines of transgenic potato (GNA2-23, GNA2-28, GNA2-30, PWG85) and a line thought to be expressing wheat oc-amylase (WAI9-12); the plants used were mature. The second type of clip cage described in section 2.3.2 was used enabling the aphids to have access to the upper and lower leaf surfaces. The bioassay was set up as described in the same section, with an initial 30 cages for each plant type. The survival of the aphids was measured on a daily basis, along with the number of nymphs produced, upon maturity (nymphs were removed after counting). Most of the aphids used matured in to the alate form, which would account for some of the delay in the onset of nymph production.
Fig. 10a shows the percentage survival of aphids feeding on the different plant lines, on a daily basis. Up until day 11, the aphids showed 100% survival on all the plant types. Aphids feeding on the control plants were the first to show any mortality; the survival dropped in a series of steps from day 11 until day 19 before remaining steady at 83%. Aphids feeding on the GNA2-23 and the WAI9-12 lines showed 100% survival until day 14. From this point, insects on the GNA2-23 line showed a
73

% survival
100 •£
95 -
I II II I I I control
PWG85
GNA2-23
GNA2-28
GNA 2-30
WAI9-12
Cumulative nymphs produced per surviving adult
Days
control
PWG85
GNA2-23
GNA2-28
GNA2-30
WAI9-12
Fig. 10. Graphs showing a) the percentage survival and b) the fecundity per adult of Aulacorthum solani on control, GNA-expressing (GNA2-23, GNA2-28, GNA2-30 & PWG85) and wheat a-amylase (WAI9-12) expressing potato plants. Aphids were contained individually in clip cages with access to the upper and lower leaf surfaces. 30 replicates were set up for each plant type and the bioassay run for 30 days.
74

reduction in survival to 92% on day 15, but no further mortality occurred during the trial. The insects feeding on the WAR-12 line showed an increase in mortality to 95% between days 14 and 15, then no further mortality occurred until day 28 when survival dropped to 90%. Aphids feeding on the GNA2-28 potatoes showed no mortality until day 17 when survival dropped to 95%. Over the next 3 days there was a further drop in survival to 81% but no further mortality was seen during the trial. The aphids feeding on the GNA2-30 potatoes showed 100% survival until day 19 before dropping to 95% on day 20. No more mortality occurred until day 30 when survival dropped to 90%. Aphids feeding on the PWG85 potatoes showed 100% survival until the penultimate day when survival dropped to 95%. It should be noted that on all the plant lines survival was still very high (>80%) at the end of the trial. No significant differences were found between any of the transgenic lines and the controls (Logrank y}).
The fecundity of the aphids was measured in terms of parthenogenetic nymph production (see Fig. 10b). The start day of nymph production varied according to the plant type: production started between days 9-10 on the PWG85, GNA2-23 and WAI9-12 potato lines. Aphids feeding on the control and GNA2-30 potatoes commenced nymph production between days 11-12 and the first nymphs on the GNA2-28 line were seen between days 12-13. The rates of nymph production (measured between days 13 and 31) were all similar (2.58-2.93 nymphs per surviving adult per day), with the exception of those on the GNA2-23 plants whose rate of nymph production was noticeably greater (3.11 nymphs per surviving adult per day). The rates of production remained fairly constant throughout the bioassay, except on the control plants where the rate slowed down slightly from day 22. The only significant difference found in nymph production was between the aphids on control potato and those on the GNA2-23 line where nymph production was significantly higher (unpaired t-test, p = 0.0466). This is due to a combination of a slightly lower fecundity on the control plants (caused by a later start in nymph production, a slower rate, and a slowing of the rate as the trial progressed) and a higher fecundity on the GNA2-23 plants (caused by an earlier start to nymph production, a faster rate and no noticeable decline in the rate towards the end of the trial.
Again, comparable leaf samples were taken from the plants before the start of the bioassay and an immunodot blot used to estimate the expression level of GNA within the leaves (see Plate 3). Expression levels in the transgenic plants ranged
75

Plate 3. An example of an immunodot blot used to detect the expression level of GNA within transgenic plants. This particular blot demonstrates that very little GNA was present in the transgenic plants used in the second clip cage bioassay described in section 3.2.2. Al l leaf and standard samples were loaded in duplicate, with a total of 5ug protein loaded per well. 1A-H, 2A-H and 3A-F indicate the standard GNA samples at final concentrations of 0% 1A-B, 0.1% 1C-D, 0.2% 1E-F, 0.3% 1G-H, 0.4% 2A-B, 0.5% 2C-D, 0.7% 2E-F, 1.0% 2G-H, 1.5% 3A-B, 1.7% 3C-D and 2.0% 3E-F. Leaf samples were loaded as follows: 4A-D control leaves, 5A-D GNA2-23 leaves, 6A-D GNA2-28 leaves, 7A-D GNA2-30 leaves and 8A-D PWG85 leaves.
76

from 0.1-0.5% of total soluble protein. The GNA2-28 transgenic line showed the lowest average expression level (0.115%) and the GNA2-23 showed the highest average expression level (0.235%). It should be noted that these expression levels are considerably lower than those detected in the plants used in the first clip cage bioassay.
3.2.3 Whole-plant bioassay using transgenic potato plants expressing GNA
This assay was set up as described in section 2.3.1 and was run for 12 days with minimal disturbance to the plants, which were young. Upon termination the initial aphids (matured) were counted off each plant and weighed individually; image analysis was also used to measure the length and width of each adult. The nymphs produced during the 12 day period were weighed collectively.
It became clear on termination that the survival of the initial aphids was very high (>98%) on both control and GNA-expressing plants (see Fig. 11a). Neither were there any significant reductions in nymph production on the GNA-expressing plants compared to the controls (an approximate average of 190 nymphs per plant found) (shown in Fig. 1 lb). The GNA-expressing plants showed no reduction in the average adult biomass of aphids feeding on these plants (adults weighing an average of 0.8mg on the control and 0.84mg on the transgenic plants) (see Fig. 11c). No significant differences were found in the size, measured in terms of length and width per adult (average length and width of the control aphids were 2.05mm and 1.02mm respectively compared to 2.1mm and 1.02mm respectively for the aphids feeding on transgenic plants (see Fig. l i d ) . No significant reductions in average total nymph biomass per plant were observed (control nymphal biomass per plant was 18.32mg compared to 17.33mg for the transgenic plants) (see Fig. 1 le).
Leaf samples were taken from each plant before the start of the trial and immunodot assays performed to estimate the level of GNA expression in the transgenic plants. The expression levels were found to be extremely low, ranging from 0-0.04% of total soluble protein.
3.2.4 Growth measurements of aphids feeding on GNA-expressing potato
The GNA-expressing potato line GNA2-28 was used in this trial; the plants used were approximately 4 months old. The assay was set up using the method described in section 2.3.3, with 10 first instar nymphs per box and 5 replicates of control and experimental leaves. Length and width measurements (according to section 2.4)
77
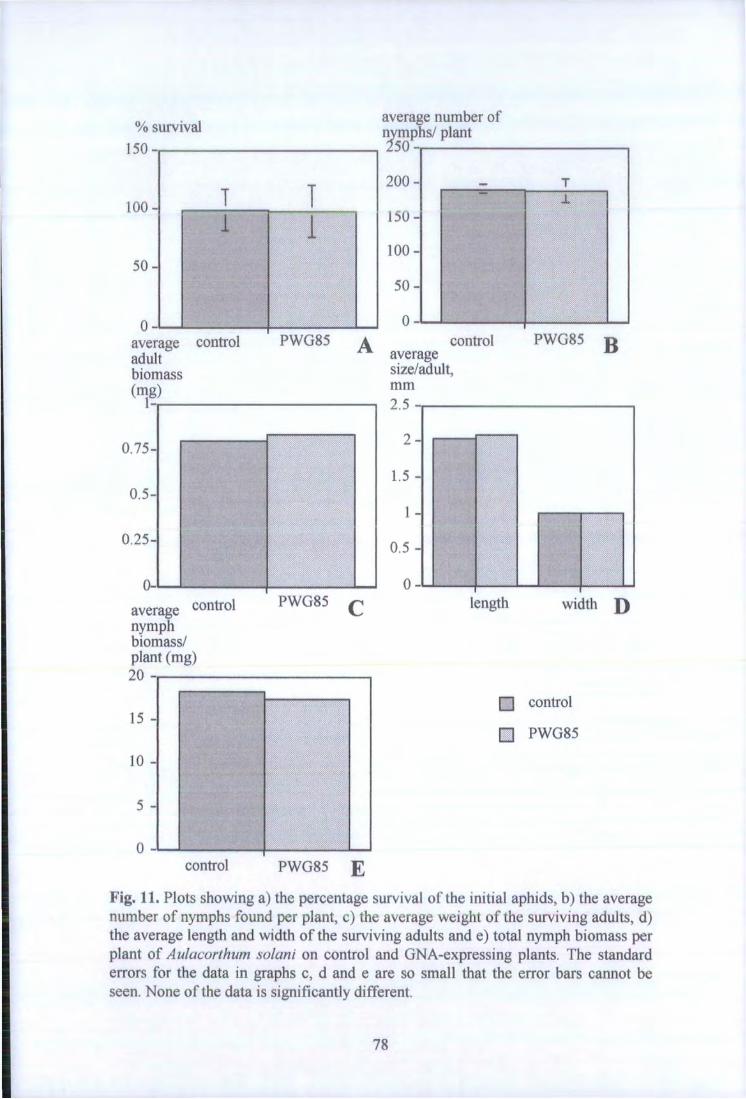
% survival 150
100-
average number of nymphs/ plant
average control PWG85 A control adult average biomass size/adult, (mg) m m
l - i 1 2.5
PWG85 B
0.75-
0.25-
average c o n t r o 1
nymph biomass/ plant (mg) 20
PWG85 width J)
control
PWG85
control PWG85
Fig. 11. Plots showing a) the percentage survival of the initial aphids, b) the average number of nymphs found per plant, c) the average weight of the surviving adults, d) the average length and width of the surviving adults and e) total nymph biomass per plant of Aulacorthum solani on control and GNA-expressing plants. The standard errors for the data in graphs c, d and e are so small that the error bars cannot be seen. None of the data is significantly different.
78
were taken daily up to and including day 5. On all days the average lengths and widths of the aphids feeding on control and GNA-expressing potato were very similar. On day 0, the average length for both sets of aphids was approximately 0.75mm and the average width was approximately 0.32mm. By day 5 these averages had increased to 1.65mm and 0.62mm respectively (data not shown). No significant differences were found between the two groups of aphids at any point during the bioassay (unpaired t-test).
Expression levels of GNA were estimated by taking leaf samples from the plants and immunodot blot analysis used to detect GNA within the leaves. No detectable GNA was found within the transgenic leaves.
3.3 Glasshouse trials
3.3.1 Glasshouse trial using GNA-expressing potato plants
This trial, set up as described in section 2.5, aimed to determine whether the presence of GNA affected the pattern of aphid colonisation. In order to do this, infestation levels were separately monitored in the upper, middle and lower layers of the leaf canopy. The mixed plot design of the trial meant that aphids had equal chances of infesting control and transgenic plants and could migrate between plants from the two groups. The results showed that the expression of GNA did not appear to influence the pattern of colonisation; in both the control and transgenic plants the top leaves were most favoured, the middle leaves the least favoured, and the bottom leaves, which were becoming senescent were preferred at an intermediate level. The presence of GNA did have a marked effect on the rate of population build-up on the plants; throughout the trial period the rate of population increase on all parts of the plant was significantly lower (p < 0.0001) on all the transgenic plants compared to the controls (Fig. 12). This difference in build-up became more marked as the trial proceeded. By the end of the trial the infestation levels were approximately four times greater on the control plants compared to that of the transgenic line, in all the three layers of the leaf canopy (Fig. 12).
Before commencing the trial tissue blots (as described in section 2.6.5) were prepared using leaves taken from the plants to establish whether or not the transgenic plants were expressing GNA. Blots were probed with anti-GNA primary antibodies and rabbit HRP-conjugated secondary antibodies; detection was carried out using the ECL system. Tissue blots cannot be used as an accurate measure of
79

20
1 5 -
1 CO E
LU 5 -
TOP LEAVES
At'
20'
~ 1 5 -
•& S Q. W 1 0-I (3 E
04
E
IS
1 CO
E ID
8 12 16
Day
MIDDLE LEAVES
Control Plants
- • — GNA-Expressing Plants
BOTTOM
Day
Fig. 12. Graphs showing the estimated number of aphids/cm2 in a) the top leaf layer, b) the middle leaf layer and c) the lower leaf layer. This trial, performed in the glasshouse, had mixed plant plots containing control and GNA-expressing potatoes. The plants were randomly infested with Aulacorthum solani. Observations were made over 16 days.
80
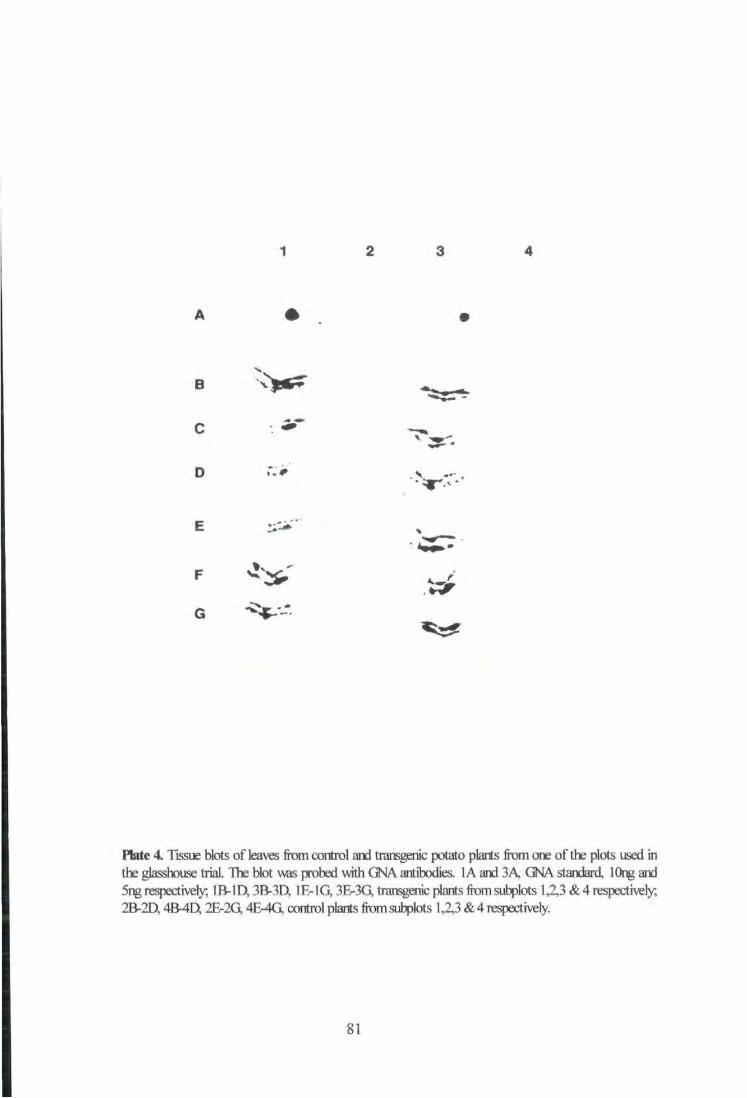
B
Plate 4 Tissue Hots of leaves from control and transgenic potato plants from one of the plots used in the glasshouse trial The blot was probed with GNA antibodies. 1A and 3A, GNA standard, lOng and 5ng respectively, 1B-1D.3B-3D, 1&1G, 3&3G, transgenic plants from subplots 1,2,3 & 4 respectively; 2B-2D, 4&4D, 2E-2G, 4E-4G, control plants from subplots 1,2,3 & 4 respectively.
81

expression levels, but as can be seen from Plate 4, expression of GNA could be detected in the transgenic plants, while none could be detected in the control plants.
3.4 Discussion of results
In this study GNA has shown varying degrees of toxicity towards the glasshouse potato aphid, Aulacorthum solani. In most cases when GNA was presented to aphids at a 0.1% w/v level no significant effects on aphid survival were observed; at most a 10% reduction in survival resulted (see section 3.1.1). The only deviation from this lack of toxicity was seen during the bioassay where growth measurements were made on a daily basis along with survival counts (see section 3.1.3). In this bioassay the survival of the GNA-fed aphids had declined to 85% by day 5 before showing a marked and significant reduction in survival to less than 10% by day 8. In all the assays aphids from the same clonal population were used, although the assays were set up at different times of the year. The source of the GNA was also the same, although different batches were used and so the activity (based on haemagglutination titre) may well have varied. However, the more likely explanation for this reduction in survival probably lies in the nature of this assay, where aphids were handled on a daily basis (with a paintbrush), placed on a microscope stage (where they will have encountered bright light and heat from the bulb) in order to take their body measurements. Sylvester (1954) reported that daily handling compared to handling on alternate days severely reduced the survival and larviposition of Myzus persicae. Hence it is thought that the combined effect of the daily handling, disturbance to feeding and GNA were enough to strongly affect survival. Rahbe et al. (1995) showed that GNA incorporated into artificial diet had significant detrimental effects, at a 250(a,g/ml concentration (fourfold lower than the concentration used here), on the survival of the pea aphid, Acyrthosiphon pisum. Sauvion et al. (1996) found that GNA (1500|^g/ml (0.15%) concentration in artificial diet) had a significant reduction (34%) in survival when compared to control aphids of the peach-potato aphid M. persicae, over the first eight days of development to adulthood.
The measurements of the developing nymphs, reported in section 3 .1.3 back up the observed delay in development to adulthood (seen in sections 3.1.1 and 3.1.2). Both the length and width of aphids feeding on artificial diet containing GNA were significantly smaller than those fed on control diet suggesting that GNA is inhibiting development. These results are very similar to those reported by Hilder et al. (1995)
82
where M. persicae fed on 0.1% GNA in artificial diet were all dead by day 8 and the size (length and width) on day 4 was substantially reduced. This inhibition is not complete since aphids feeding on GNA in other bioassays do go on to produce nymphs even though the onset of nymph production is delayed (see sections 3.1.1 and 3.1.2). These results are in agreement with those reported for M. persicae, by Sauvion et al. (1996), where biomass was used as a measure of growth; significant deleterious effects on weight gain, as compared to the controls, at concentrations as low as 50fig/ml were found. Rahbe et al. (1995) also showed that GNA exhibited a 51% growth inhibition, when compared to the weight of the control aphids, at a 250(Lig/ml concentration, against the pea aphid, A. pisum.
GNA was shown to cause a significant reduction in the fecundity of A. solani (in terms of parthenogenetic production of nymphs). This reduction resulted from two factors: a delay in the onset and a slower rate of nymph production (section 3.1.1). The delay of 3 days in the onset again suggests that GNA is inhibiting, to some extent, the development of the aphids through the nymphal stages. The actual number of nymphs produced by adults feeding on GNA-containing diet was also reduced suggesting that GNA also exerts a detrimental effect on fecundity as well as development. This maybe in terms of the aphids being less 'fit' than control insects or simply that nymphs are taking longer to develop inside the mother's body. A similar significant reduction in fecundity was also observed with M. persicae (Sauvion et al., 1996). It has been reported that a delay in feeding by early instar nymphs on an unusual host, could play a role in the later performance of an aphid; this is seen with aphids migrating to a different crop where they are frequently at a significant disadvantage compared to 'resident' aphids (Via, 1991a). Thus a slight delay in feeding by the first instar nymphs when transferred from the control artificial diet on which they were born, to the artificial diet containing GNA, could be sufficient to slow nymph development and also slow down the rate of embryo development within their bodies.
A delay in the onset of nymph production was also seen in aphids that were not fed GNA until day 10. This delay was not anticipated because nymphs develop within the mothers' body during her own development; since she was not in contact with GNA for the majority of her development there is no reason why nymph production should have been delayed. However, it was intended that the introduction of GNA in the diet should occur on the verge of maturity; since most of the aphids developed into the alate form where development takes longer, aphids were in contact with GNA before maturity. This could have slowed the development of the nymphs within their bodies, resulting in the unexpected delay in nymph production seen in
83

this assay. Rates of nymph production were similar and by the end of the bioassay, although fewer nymphs had been produced by those feeding on diet with GNA, the difference was not significant (section 3.1.2).
Artificial diet bioassays were also performed using varying concentrations of GNA; results of GNA tested at a 0.05% w/v level can be seen in section 3.1.4. A dose response assay (section 3.1.5) was also attempted but the data obtained was so poor that it is not presented and no conclusions can be drawn from it.
Again GNA (this time at a 0.05% w/v level) showed no significant toxicity towards A. solani. However, contrary to previous bioassays incorporating GNA in diet, GNA at a 0.05% w/v level appeared to have a stimulatory effect on nymph production. By the end of the trial the number of nymphs produced was significantly greater, representing nearly a fourfold increase compared to the control aphids. The concentration of GNA used in this bioassay (equivalent to 500|ug/ml) is double the concentration of GNA used by Rahbe et al. (1995) and Sauvion et al. (1996) where toxic effects were demonstrated against A. pisum and M. persicae respectively. It is possible that a much larger dose of GNA is required i f any detrimental effects are to be seen in A. solani. Sauvion et al. (1996) published a similar observation on M. persicae, where GNA at a 10p.g/ml concentration caused a slight but significant growth stimulation (these aphids weighed 11% more than the control aphids). GNA has also been shown to exert a probiotic effect in rats where it reduced the overgrowth ofE. coli caused by some other lectins (Pusztai et al., 1993a). A similar process could be occurring in the aphid gut where affinity for receptor sites on bacteria could be greater than for sites in the gut epithelium. It should be noted that in this bioassay only 4 out of the 10 control replicates produced any nymphs. It is not known why this is, but since the 1st instar nymphs were randomly distributed between control and GNA at the start of the assay, any consequences due to using 'unfit' aphids should have been seen in both groups, i f this was the case. Alternatively, the apparent stimulatory effect of a lower GNA concentration may be due to the addition of the protein or an impurity along with the GNA, adding something to the diet that it otherwise lacked. This would result in those feeding on GNA showing fairly typical numbers of nymphs being produced for aphids feeding on artificial diets, whereas the control aphids showed a below-average fecundity because they were lacking this addition to the diet (see also section 8.1). Nymphs produced during this bioassay were then used to set up a further assay to try to establish what happens to a second generation of aphids on GNA.
84

Several deductions can be made from this second generation data. Firstly, nymphs born to aphids reared on control diet, but transferred to GNA-containing diet did not show a significantly reduced survival (although it was lower) than those reared and produced by adults on control diet. Secondly nymphs born to GNA-fed aphids and then either transferred to control diet or continued on 0.05% GNA did not show any significant reductions in survival when compared to those born on and continued on control diet. This second deduction would suggest that GNA (at least at a 0.05% concentration) is not going to show a more marked effect as more generations come in to contact with it. Therefore, possible adverse effects may not accumulate through the generations and eventually produce 'unfit' aphids which are unable to survive; the opposite may occur through selection for adaptation to the GNA. In fact the next two deductions would rather point to the latter being seen: nymphs, produced by aphids reared on diet with GNA but fed on control diet have a significantly higher survival than those born to control and reared on diet with GNA. Lastly, nymphs produced by GNA-fed adults and continued on diet containing GNA do survive significantly longer than those produced by control aphids and transferred to diet with GNA added. These data again tie in with the observed stimulations in M. persicae growth caused by low (10Lig/ml) GNA concentrations (Sauvion et al., 1996); i f A.solani requires a much higher GNA concentration to exert toxic effects then a lower concentration (but still relatively higher than that used by Sauvion) could stimulate aphid fecundity. Alternatively it could be argued that i f an aphid is able to survive development on GNA (at a 0.05% concentration at least) and produce nymphs of its own, then the resulting nymphs will be 'acclimatised' to the GNA and better able to survive on it. De Barro et al. (1995b) showed using the grain aphid, Sitobion avenae, that clones generally performed better on their plant species of origin than clones that did not originate on that plant. This is also true for other aphid species, such as A. pisum (Via, 1991b). These results would indicate that the experience of the mother influences the subsequent performance of the offspring, as discussed by Moussea & Dingle (1991); the same could be true of aphids originating on different artificial diets. No nymphs were produced by any of these second generation aphids. However this is likely to be due simply to the fact that artificial diets are not ideal for rearing aphids. Considerable effort is needed to maintain more than two successive generations of insects (Akey & Beck, 1975) although continuous cultures of some aphid species on artificial diet have been reported (Dadd & Mittler, 1966; Akey & Beck, 1972).
From the honeydew analyses performed it can be concluded that i f GNA is excreted in the honeydew of A. solani it must be in minute quantities. This is possible since, although the GNA is incorporated into the artificial diet at 0.1% w/v, the aphids only
85

ingest a small volume. Faint bands (size 50-65kDa), present in both control and lectin-fed pea aphid honeydew samples run on minigels, were observed by Rahbe et al. (1995). The lack of any bands in our honeydew samples therefore points to the possibility that the amount of honeydew collected was insufficient for protein analysis by SDS-PAGE. The GNA may be acting as an antifeedant which could consequently reduce the rate of honeydew excretion. Two further possibilities exist for the lack of GNA present in the honeydew: either the GNA is broken down within the aphid gut or a large proportion of the GNA binds to the gut epithelium. The first suggestion is unlikely since aphids do not generally produce gut proteases, due to the lack of protein present in their natural diet, although some do possess endopeptidases (Srivastava & Auclair, 1963; Srivastava, 1987; Rahbe et al., 1995). The second explanation is more likely since GNA has been detected within the gut and binding to the epithelium of A. solani (see chapter 6).
Work by Powell et al. (1995a) using the rice brown planthopper, N. lugens, clearly indicated that diet containing GNA was ingested and excreted with the GNA intact, by these insects. Visual quantification (using ninhydrin) of the amount of amino acids present in the honeydew showed GNA-fed hoppers had a lower total amount of amino acids in the honeydew, implying that less honeydew was excreted. Quantitative analyses showed that initially, GNA in the diet acts as an antifeedant with the number and volume of honeydew droplets being significantly less for GNA-fed aphids compared with control aphids. However, over time these differences became insignificant, although the GNA did still result in some reduction of honeydew excretion. These results imply that hoppers feeding on diet containing GNA imbibe less diet than those feeding on control diet (Powell et al., 1995a). Honeydew analyses by Rahbe et al. (1995) showed that various lectins fed to the pea aphid, A. pisum, in artificial diets, could be recovered in the honeydew with no observed modification or degradation. However, a few of the lectins tested could not be detected in the honeydew; the authors suggested that this might be due to very different excretion rates or some sort of interaction within the gut.
The effects of GNA on the survival and fecundity of A. solani were also investigated in planta. In the first instance bioassays were carried out under controlled environmental conditions on clonally propagated transgenic potato plants. The plants were mature and the average level of GNA expression in the transgenic plants was approximately 0.47% of total soluble protein. The results graphed in Fig. 9 show that in contrast to artificial diet bioassays, no delay in the onset of nymph production was seen in the transgenic plants compared to the controls. However, in direct agreement with the diet assays the cumulative number of nymphs produced at
86

the onset of maturity was significantly reduced in comparison with those on control plants. Although there were no significant differences between the survival of aphids on control and transgenic plants, it is interesting to note that between days 16-29 the survival on the transgenic plants is higher than that on the control plants. This would suggest that the aphids feeding on the plants expressing GNA are living longer to try to compensate for the reduced fertility, but to no avail. These results are very similar to those presented by Gatehouse et al. (1996) where the same transgenic line (PWG85) was tested against M. persicae; it is interesting to note however that in this case, expression levels of GNA in the plants used were found to be up to 1.5% of total soluble protein (ie. nearly four times greater).
However, further attempts to reproduce these data were not so successful. In a second clip cage trial, a year later, the same transgenic potato line (PWG85) was tested again along with three different transgenic lines expressing GNA (GNA2-23, GNA2-28 and GNA2-30). Also tested at the same time was a line containing the transgene for wheat a-amylase inhibitor. As seen in the previous trial, no significant reductions in aphid survival were caused as a result of any of the transgenes. However, contrary to the previous data obtained for the PWG85 line, no significant reduction in the cumulative number of nymphs produced was found. This was also true for the other three lines containing the GNA transgene and for the plants containing the construct encoding wheat a-amylase inhibitor. In fact, fecundity was found to be significantly better on the GNA2-23 line compared to the aphids on control potato. It is not unusual for different transgenic plant lines containing the same transgene to express the gene product at varying levels, hence conveying varying degrees of insect resistance. Similar effects have also been seen in different transgenic potato lines expressing the gene encoding bean chitinase, conveying varying degrees of insecticidal properties (see chapter 4). Again, the plants used in this trial were mature, however expression levels were much lower than reported in the previous trial. Most of the aphids used in this trial developed in to the alate form; whether or not this could explain the lack of adverse effects by the transgenic plants is hard to say. The most likely explanation for the lack of insecticidal properties conveyed by the transgenic plants in this trial is that expression levels of GNA in these plants were not high enough.
In the whole plant bioassay no significant differences were found in survival, fecundity or any of the other parameters measured (biomass, length and width of the adults and total biomass of the nymphs) between aphids on control and GNA-expressing plants. In this assay, the transgenic potato line used was PWG85; plants used were young and expression levels were again very low (0-0.04% of total
87

soluble protein). As with the second of the two clip cage bioassays, it is assumed that this lower expression of GNA in the transgenics has resulted in the lack of insecticidal activity (particularly against aphid fecundity) in these plants. Hilder et al. (1995) tested M. persicae against transgenic tobacco containing the gene encoding GNA, using a similar method enabling aphids to have access to the whole plant, and found that the rate of population growth was reduced on the transgenic tobacco compared to on the control plants.
The detached leaf bioassay using leaves from GNA2-28 transgenic potatoes was set up to establish whether GNA delivered to aphids in planta had any inhibitory effects on development, as seen in artificial diet bioassays. However, no significant reductions had been found by day 5, in length or width of the aphids feeding on the transgenic leaves compared to the control insects. The plants used in this trial were approximately 4 months old and no detectable GNA was observed within the leaves. It is assumed that the absence of detectable expression levels of GNA is responsible for the lack of growth inhibition seen. Hilder et al. (1995) demonstrated a significant reduction in the size of aphid populations on transgenic (GNA) expressing leaf discs compared with control leaf discs, using M. persicae.
From some of the artificial diet data presented (where GNA was incorporated at a 0.1% level) and the clip cage bioassay using the PWG85 potato line, the data presented suggests that a population of aphids would build up significantly slower on plants containing GNA than on control potato plants, and so the presence of the transgene would confer a measure of protection to the crop. A similar result was also obtained in a glasshouse trial where the rate of population build-up was shown to be fourfold slower on the transgenic plants compared to that on the control plants. As far as I am aware this is the first report of such a glasshouse trial being carried out demonstrating significant levels of aphid resistance in genetically engineered crops. However, care must be taken that expression levels of GNA within transgenic crops do not fall to a level low enough to cause a stimulatory effect on aphid development, as seen in artificial diet bioassays (Sauvion et al., 1996 and results presented in section 3.1.4). Field condition factors, such as weather, stress and plant age need to be assessed to determine possible effects on transgene expression levels.
It is encouraging to find that the deleterious effect of GNA upon the development and fecundity of the glasshouse potato aphid has been reproducible from artificial diets to small scale controlled-environment plant trials and also under a larger glasshouse trial, suggesting that this strategy could make a viable contribution to crop protection.
88

4. BEAN CHITINASE BIOASSAYS: R E S U L T S AND DISCUSSION
4.1 Artificial diet bioassay testing 0.1% w/v bean chitinase
Five replicates of artificial diet feeding chambers with or without the addition of 0.1% w/v bean chitinase were prepared according to section 2.2.3. The results of this assay show that as usual the "no diet" controls were all dead by day 4. Until day 9, 100% survival was seen in aphids fed on control diet and those fed on diet containing bean chitinase (see Fig. 13). The control aphids then showed a slight decline in survival over the next two days (survival dropped to 92% on day 11) before showing a more rapid decline so that by day 20, only 24% of the initial aphids were still alive. However from day 10, the bean chitinase-fed aphids showed a rapid decline in survival so that by day 20 only 8% of the aphids were still alive. Between days 11-19 both groups of insects showed comparable mortality rates (approximately 0.4 adults dying per replicate per day). The overall effect of bean chitinase was to significantly reduce the survival (Logrank y} test, p = 0.0166) of aphids fed on a 0.1% w/v addition in diet, compared to aphids feeding on diet alone.
As seen in Fig. 13, the fecundity curves of control and bean chitinase-fed aphids are very similar. Both groups started producing nymphs between days 9-10 and until day 15 the rates of nymph production were similar (approximately 2.4 nymphs per replicate per day). Between days 15-18 the control nymph production slowed to a rate of 0.53 nymphs per replicate per day. Nymph production in the bean chitinase-fed aphids also slowed but not so quickly (0.86 nymphs produced per replicate per day). Over the final two days nymph production in both groups virtually stopped. At the end of the trial no significant differences were found in the number of nymphs produced between the two groups of insects (non-parametric Mann-Whitney U test, p = 0.6015).
4.2 Detached leaf bioassav using three different lines of bean chitinase-expressing potato plants
This bioassay was set up, using plants which were approximately 4 months old, in the manner described in section 2.3.3. Ten aphids were assayed in each blackman box, with 5 replicates for each potato type (control, BCH1-7, BCH1-21 and BCH1-35). Leaf samples from each plant were taken before the start of the trial so that expression levels of bean chitinase could be calculated (as described in section 2.6.2). The expression levels were calculated to be 0% for the control plants, an approximate average of 0.4% for the BCH1-21 transgenic line (ranging from 0-
89

Cumulative Total survivors/ nymphs/ replicate replicate
20
5
10
0 0 •
24 8 12 16 Days 20 0
Total survivors (no diet) Cumulative nymphs (control)
Cumulative nymphs ( B C H ) Total survivors (control)
Total survivors ( B C H )
Fig. 13. Graph showing the survival and cumulative nymph production per replicate of Aulacorthum solani against time, when fed on control diet with or without the addition of 0.1% w/v bean chitinase. Five replicates for all treatments each contained five first instar nymphs at the start of the assay which was run for 20 days.
90

0.64%) and an approximate average of 0.8% for the BCH1-7 and BCH1-35 transgenic lines (ranging from 0.64-1.08% and 0.37-1.34% respectively). Expression levels were also estimated, after a leaf change, from some of the leaves actually used in the bioassay. Calculated bean chitinase expression levels for these leaves were 0% for the controls, an approximate average of 0.35% for the BCH 1-21 transgenic line (ranging from 0-0.85%), an approximate average of 0.4% for the BCH1-7 transgenic line (ranging from 0.04-0.88%) and an approximate average of 1.52% (ranging from 0-2.2%) for the BCH1-35 line.
As shown in Fig. 14a, survival of the control aphids was 100% until day 5 of this assay; from this point mortality occurred in a series of steps until by day 20, only 54% of the initial aphids remained alive. Aphids feeding on the BCH 1-7 line of bean chitinase-expressing potatoes only showed 100% survival until day 3. A slight decline over the next 11 days to 89% survival occurred (the rate of mortality being approximately 0.83% of the initial aphids dying per day). A more rapid decrease in survival occurred over the last 6 days (approximate rate of 5.2% decrease in survival per day) so that by day 20 only 58% of the initial aphids were still living. Aphids feeding on the BCH 1-21 line similarly only showed 100% survival until day 3. A steady rate of mortality (4.1% dying per day) was seen until day 11; over the next 2 days, survival remained at approximately 67% before showing a further decline in survival (at a rate of 2.6% dying per day) to day 20 when only 49% of the initial aphids were still alive. Aphids feeding on the BCH1-35 potato line showed a slight decline in survival after only 2 days; mortality was at a rate of 2.3% dying per day until day 10; at this point survival was unchanged (82%) over the next 4 days before showing a further slight decline to 80% on day 20 (a rate of 0.3% dying per day). This particular result proved to be significant: aphids feeding on the BCH1-35 line of bean chitinase-expressing potatoes survived for a significantly greater length of time than those feeding on control plants (Logrank y}, p = 0.0184).
The fecundity of these aphids (measured in terms of cumulative parthenogenetic nymph production per surviving adult) can be seen in Fig. 14b. In all cases, nymph production on all the potato lines commenced on day 8. Aphids feeding on the control plants and two of the transgenic lines (BCH 1-7 and BCH 1-21) all showed a fairly constant rate of nymph production. The control rate was 2.8 nymphs produced per surviving adult per day; a slightly lower rate was observed on the BCH 1-7 plants (2.7 nymphs per surviving adult per day) and a still lower rate was seen on the BCH1-21 plants (2.2 nymphs per surviving adult per day). Nymph production on the BCH1-35 line appeared to occur in two steps. Until day 14, 1.8 nymphs were produced per surviving adult per day; then the rate dropped to 1.2 nymphs per
91

Percentage survival
Cumulative nymph production / surviving adult
mean length of surviving aphids, mm
Control
BCH1-7
BCH1-21
BCH1-35
Control
BC1I1 -7
B C H 1 - 2 1
BCH1-3
1.8
1.6 -
1.4 -
1.2 -
i r
15 Days 20 mean width of surviving aphids, mm
0.7
B
T""1- "' ""(" Control BCH1#7BCH1#2BCH1#35
T
Control
Plant Type
i r r p -nr. — 1 »
BCH1#7 BCH1#21 BCH1#35
Plant Type D
Fig. 14. Graphs showing a) the percentage survival, b) cumulative nymph production per surviving adult, c) the average length and d) the average width of the survivors on day 6 of Aulacorthum solani feeding on different transgenic lines of potato expressing bean chitinase (BCH1-7, BCH1-21 and BCH1-35). [* = significantly different to control (p < 0.05)].
92

surviving adult per day over the last 6 days. Although the rates of nymph production on all the transgenic lines were continually lower than on the control plants, none of them were significantly reduced.
On day 6, "one o f f length and width measurements were taken since visual differences in size were observed between aphids feeding on some of the plant types; these measurements were taken as described in section 2.4. The data acquired during these measurements (see Figs. 14c and 14d) shows that aphids feeding on all 3 of the BCH-expressing potato lines were smaller in both length and width, although not all of these differences were significant. The mean control length was 1.689mm and the mean control width was 0.604mm compared with a range from 1.546mm to 1.6mm for mean length and 0.565mm to 0.582mm for mean width of the aphids feeding on the various transgenic lines. Aphids feeding on the BCH1-21 and BCH1-35 bean chitinase-expressing potato lines were significantly smaller in length (unpaired t-tests, p < 0.05) but no significant reductions in their width were found when compared to aphids feeding on control leaves.
4.3 Discussion of results
To date, as far as 1 am aware this is the first case of a plant-derived chitinase alone being investigated with the potential of conveying resistance to homopteran pests, although Gatehouse et al. (1996) present data where transgenic potato plants, encoding the double construct for GNA and bean chitinase expression, have been tested against the peach-potato aphid, Myzus persicae. Work is also underway to investigate the use of bean chitinase in crop protection against lepidopteran pests (Gatehouse et al., 1997). Bean chitinase has already proved to have a role in fungal resistance, delaying the development of disease symptoms caused by fungal pathogens, in transgenic tobacco constitutively expressing a bean chitinase gene (Broglie^a/., 1991).
Bean chitinase was first tested in artificial diet at a 0.1% level against A. solani. Although the results did not yield any drastic effects as a result of bean chitinase being present, they were encouraging. Unlike artificial diet assays incorporating GNA, no significant reduction in the parthenogenetic fecundity of the aphid was observed; the onset of nymph production occurred at the same time in control and BCH-fed aphids and the rates of nymph production were very similar. However, unlike GNA the bean chitinase did have some significant effect on survival of the aphid. This increased mortality was not apparent at first, but by the end of the trial (day 20) there were significantly fewer aphids surviving on the diet containing 0.1%
93

BCH. This result is encouraging but not ideal since i f something is going to be used as an aphicide, a substantial mortality needs to be induced by about day 8, before the aphid becomes mature and starts producing nymphs. Increasing the rate of mortality at old age does not have much effect on population build up since the offspring produced in the length of time equivalent to that from birth to the start of reproduction account for 95% of the intrinsic rate of increase (Wyatt & White, 1977). It is interesting to note that Rahbe & Febvay (1993) reported that a chitinase purified from Streptomyces griseus, incorporated into artificial diet, showed some significant reduction in survival and a moderate growth inhibition against the pea aphid, Acyrthosiphon pisum. However, this same chitinase had no significant antimetabolic effect against the rice brown planthopper (Powell et al., 1993). Rahbe & Febvay (1993) presumed the chitinase was adversely interacting with fore- and hindgut chitinous structures in the digestive tract of the aphid.
Three different lines of bean chitinase-expressing potato plants were tested, using the detached leaf bioassay method, to establish whether similar results were obtained in planta and also whether the BCH showed any inhibitory effects on aphid development. This time, no significant reductions in aphid survival were seen as a result of bean chitinase expression. Instead, aphids feeding on the BCH1-35 leaves showed a significantly increased survival compared to the control aphids. However, contrary to the artificial diet data, the cumulative number of nymphs produced on all three transgenic plant lines was consistently lower than that of aphids feeding on control potato. This is a result of a lower rate of production since the aphids on all the plant types started producing nymphs on day 8. However, none of these reductions were significant.
Visual differences in size were observed between aphids feeding on the different plant lines so 'one-off size measurements were taken of all the individuals; these proved to be worthwhile. Again, like the fecundity data, all three transgenic plant lines showed reductions in both aphid length and width. Two of these results were significant: aphids feeding on the BCH1-21 and BCH1-35 transgenic plants were significantly smaller in length compared to aphids feeding on the control potatoes. It is interesting to note that although not significant, it was these same two lines that showed the greatest reductions in aphid fecundity. The other interesting observation is that the aphids on the BCH1-35 line, showing the greatest size and fecundity reductions, had the significantly greater survival. A similar observation was made in the initial clip cage bioassay using PWG85, GNA-expressing plants (chapter 3) and in the clip cage bioassay using PBG47 GNA and bean chitinase-expressing plants (chapter 5), where it was suggested that the aphids were living longer in an attempt
94

to develop normally and produce a viable number of nymphs to sustain the population. Similar results have been reported by Gatehouse et al. (1997) against a lepidopteran pest, where plants expressing bean chitinase did not significantly reduce survival but did significantly reduce the total larval biomass. Interestingly, the bean chitinase-expressing plants showed significantly more leaf damage compared to the control plants, implying that the caterpillars were attempting to compensate for the effects of the bean chitinase.
The results of the detached leaf trial do not really 'fit in' with the estimated bean chitinase expression levels. Looking at the expression levels in the plants before the start of the trial, the BCH1-21 line shows the lowest expression (an average of 0.4% total soluble protein) for the transgenic lines, yet this is one of the two lines that significantly reduced aphid length and showed some reduction in fecundity. Conversely, the transgenic line BCH1-7 has an average expression level which is twice that of the BCH1-21 line and similar to that of the BCH1-35 line but does not have any significant effects on the size or fecundity of aphids. The average expression levels of bean chitinase would appear to decrease when the leaves have been detached for 2/3 days in two of the transgenic lines but apparently increase considerably in the third (BCH1-35). However, this later estimation should be taken with caution since the standards on the dot blot containing these results were very poor; the actual expression was probably much lower.
Thus, from these results it would appear that bean chitinase alone, expressed in plants at values of around 0.4%, does not exert any significant deleterious effects on the survival and fecundity of A. solani. Indeed, aphids feeding on one of the transgenic lines had a significantly higher survival compared to aphids feeding on the control leaves. It is not known why a significant reduction in survival was seen in the artificial diet bioassay where bean chitinase was incorporated at 0.1% w/v. It is possibly due to the combined effect of bean chitinase and feeding on artificial diet, which is a less suitable medium for aphid rearing. Another possibility is that although the expression levels in the plants were estimated as averages ranging from 0.4% to 0.8%, this might not be the concentration of bean chitinase present in the phloem sap. The gene encoding the bean chitinase was under the control of the CaMV 35S promoter, which allows constitutive expression, but expression in the phloem sap may be lower than in other parts of the plant Basic chitinases are known to accumulate in cell vacuoles (Sahai & Manocha, 1993). Chitinases, present in the plant cell walls and encountered by aphids on route to the phloem tissue, are suspected of influencing aphid feeding activities (see references within Rahbe & Febvay, 1993). Some aphid species are also known to penetrate cells (Klingauf,
95
1987) and therefore could come into contact with bean chitinase stored in the vacuoles, on their route to the phloem tissue and so could encounter higher concentrations of bean chitinase in this way. Although some reduction in fecundity and growth inhibition were seen, these were not significant. Thus it is likely that bean chitinase alone is not sufficient to convey resistance to attack by this particular aphid species.
96

5 GNA AND BEAN CHITINASE COMBINED: R E S U L T S AND DISCUSSION
5.1 Controlled-environment plant bioassays
5.1.1 Clip cage bioassay using potato plants expressing GNA and bean chitinase
Transgenic potato plants (PBG47) containing the double construct encoding GNA and bean chitinase were used to investigate whether these two proteins had an additive effect against the control of the glasshouse potato aphid. This bioassay was set up with a total of 24 cages (8 plant replicates) for each plant type (control and PBG47 potatoes). Aphids were confined, individually to leaves by using the first type of clip cage described in section 2.3.2. The survival and cumulative number of nymphs produced were recorded on a daily basis and the assay terminated after 30 days. The plants used were mature. Before the start of the trial, leaf samples were taken from each plant in order to calculate the expression levels of the two proteins (as described in section 2.6.2). GNA expression levels within the PBG47 plants were calculated to range from 0.1-0.7% with an average of approximately 0.4% total soluble protein. Very little GNA was detected in the control plants. Bean chitinase expression levels within the PBG47 plants were estimated to be approximately 1.5% and higher.
Fig. 15 shows the percentage survival of A. solani on the control and transgenic plants as the trial progressed. Aphids on both the control and transgenic plants showed 100% survival up to and including day 14. From this point the control aphids showed an increase in mortality, occurring in a series of steps until by the end of the trial (day 30) approximately only 35% of them remained alive. The aphids feeding on the PBG47 transgenic plants, on the other hand, continued to show 100% survival for a further 6 days before mortality started to occur on day 20. The survival then decreased in steps so that by the end of the trial approximately half of them were still alive. Survival on the transgenic potato line was consistently greater than on the control plants, sometimes by as much as 36%, but by the end of the trial no significant differences were found in survival between the two groups of aphids.
Fecundity, measured in terms of cumulative nymph production per adult, over time can also be seen plotted in Fig. 15. No delay in the onset of nymph production occurred as a result of feeding on the transgenic potatoes, both groups starting to produce nymphs between days 9 and 10. Aphid fecundity on the control plants was very high: by day 30, the cumulative number of nymphs produced was
97

% survival of adults
Cumulative nymphs/adult
100 70
90
60 80
70 50
60 40
50
30 40
30 20
20
0 10
0 0 0 10 15 20 25 30 35
Days
Cumulative nymphs/adult(control) % mortahty(control)
% mortality(PBG47) Cumulative nymphs/adult(PBG47)
Fig. 15. Graph showing the percentage survival and cumulative nymph production per adult of Aulacorthum solani feeding on control and transgenic (containing a double construct for GNA and bean chitinase) potato plants. Aphids were confined individually in clip cages, with access to the lower leaf surface. 24 cages (8 plant replicates) for each plant type were set up and the bioassay was terminated after 30 days.
98

approximately 70 per surviving adult. The rate of nymph production between days 9-19 was calculated to be 2.74 nymphs produced per adult per day. However, aphid fecundity on the transgenic plants was effectively non-existent. By the end of the trial the cumulative number of nymphs produced was approximately only 4 per surviving adult and the rate of nymph production between days 9-19 was calculated as only 0.18 nymphs produced per adult per day. The difference in cumulative nymph production between the two groups of aphids proved to be highly significant (unpaired t-test, p < 0.0001 on day 25).
It should be noted that aphids confined on the GNA and bean chitinase expressing line (PBG47) also had a significantly lower fecundity (unpaired t-test, p = 0.0097) than aphids confined on the GNA-only expressing line (PWG85) (see section 3.2.1); the two assays were run concurrently.
5.1.2 Whole plant bioassay using potato plants expressing GNA and bean chitinase
In this assay 8 control and 8 transgenic (PBG47) potato plants were each inoculated with 15 first instar aphids, in the manner described in section 2.3.1. Then the plants were left undisturbed for 12 days before terminating the trial. The plants used were young. Once again leaf samples were taken from each plant in order to calculate the expression levels of GNA and bean chitinase within the plants (as described in section 2.6.2). However, only one plant appeared to be expressing GNA and this was at a very low concentration (0.01% total soluble protein). The expression levels of bean chitinase were higher, ranging from 0.01-0.35% with an average of approximately 0.14% total soluble protein (see Plate 5). No GNA or bean chitinase were detected in the control plants.
Upon termination a series of parameters were investigated. Fig. 16a shows that no significant differences were found in the percentage of initial aphids (now adults) surviving, although fewer (94%) were still alive on the transgenic plants compared to 99% on the control plants. No significant differences were found in the number of nymphs produced per plant (see Fig. 16b), although again aphid performance was slightly worse on the transgenic plants (171.7 nymphs found per transgenic plant compared to 190.29 nymphs per control plant. No significant differences were found in the average biomass per adult aphid but again, those feeding on the transgenic plants had a lower biomass (0.76mg per adult) compared to those feeding on the
99
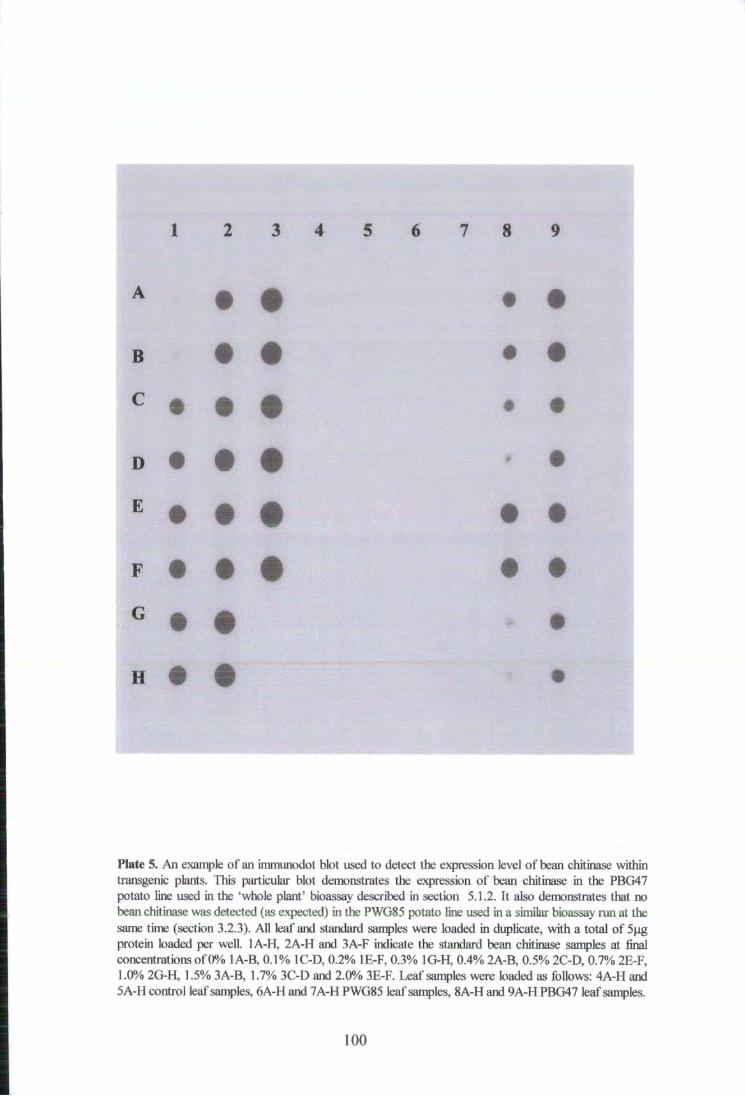
i 8
B
D • • • •
E
•••
H • •
Plate 5. An example of an immunodot blot used to detect the expression level of bean chitinase within transgenic plants. This particular blot demonstrates the expression of bean chitinase in the PBG47 potato line used in the 'whole plant' bioassay described in section 5.1.2. It also demonstrates that no bean chitinase was detected (as expected) in the PWG85 potato line used in a similar bioassay run at the same time (section 3.2.3). All leaf and standard samples were loaded in duplicate, with a total of 5ug protein loaded per well. 1A-H, 2A-H and 3A-F indicate the standard bean chitinase samples at final concentrations of 0% 1A-B, 0.1% 1C-D, 0.2% 1E-F, 0.3% 1G-H, 0.4% 2A-B, 0.5% 2C-D, 0.7% 2E-F, 1.0% 2G-H, 1.5% 3A-B, 1.7% 3C-D and 2.0% 3E-F. Leaf samples were loaded as follows: 4A-H and 5A-H control leaf samples, 6A-H and 7A-H PWG85 leaf samples, 8A-H and 9A-H PBG47 leaf samples.
100

% survival
100
average1
adult biomass (mg) 1
0.75
0.25
average nymph biomass/ plant (mg)
20
average number of 2QQ nymphs/ plant
100 -
PBG47 control PBG47 j± average control size/adult,mm
2.5 -
1.5 -
0.5
control PBG47 length width D
Control
PBG47
control PBG47 £
Fig. 16. Plots showing a) the percentage survival of the initial nymphs, b) the average number of nymphs found per plant, c) the average weight of the surviving adults, d) the average length and width of the surviving adults and e) total nymph biomass per plant of Aulacorthum solani on control potato and potato expressing GNA and bean chitinase. The standard errors for the data in graphs c, d and e are so small that the bars cannot be seen. Only the average length per adult proved to be significant (p < 0.01, denoted by *).
101
control plants (0.8mg per adult) (see Fig. 16c). Fig. 16d shows that the adults feeding on the PBG47 plants had a shorter mean length and width measurement per adult (1.96mm and 1.01mm respectively) compared to those feeding on the control plants (2.05mm and 1.02mm respectively). The difference in mean length per adult proved to be significant (unpaired t-test, p = 0.0099). Finally the average total nymph biomass per transgenic plant was less (15.52mg) than that per control plant (18.32mg) (see Fig. 16e), although this difference was not enough to prove significant. Thus the aphids feeding on the transgenic PBG47 potato plants had consistently lower statistics compared to aphids on the control plants but only the difference in length proved to be significant. The aphids feeding on the PBG47 plants also had consistently lower parameters compared to aphids feeding on the GNA-only expressing, PWG85 transgenic line (the two assays were run concurrently) where the results are discussed in section 3.2.3.
5.1.3 Detached leaf bioassay using transgenic potatoes expressing GNA and bean chitinase
This bioassay was set up using the detached leaf method described in section 2.3.3. Five replicate boxes were set up for control and transgenic potato leaves. The transgenic plants contained the double construct encoding GNA and bean chitinase (PBG47). Ten first instar nymphs were placed on each leaf, resulting in a total of 50 aphids per leaf type. As can be seen in Fig. 17a, no significant differences were found in the survival of aphids feeding on these two leaf types, both had a high survival (> 90%) on day 9. Neither were any significant differences found in the cumulative nymph production between these two groups of aphids, although fewer were produced on the PBG47 leaves (see Fig. 17a). On day 12 the cumulative number of nymphs produced per replicate on the PBG47 leaves was approximately 152 compared with 170 cumulative nymphs per replicate on the control leaves. Both groups commenced nymph production between days 8 and 9 and both started off with similar high rates of production. After 4 days, a difference was beginning to appear but it was quite clear that this time the PBG47 plants did not prevent nymph production (compared with the results of the clip cage assay described in section 5.1.1 where nymph production was virtually non existent). Overall rates of nymph production over the 4 days of data collection were 42.6 nymphs produced per replicate per day by the control aphids compared to 38.05 nymphs produced per day per replicate by those feeding on the PBG47 leaves.
Size measurements (length and width) of the individual aphids still alive on day 5 of this bioassay were also taken, following the method described in section 2.4. This
102

Survival/ replicate
8 -
0' 1— 5
control survival
BG47 survival
Cumulative nymphs/
2 0 ( f eplicate
Days 10 15 A
control cumulative nymphs
BG47 cumulative nymphs
Mean size 2 of surviving aphids (mm)
1.5 -
1 -
0.5
Mean length (mm) Mean width (mm)
Control BG47 B Plant type
Fig. 17. Graphs showing a) the survival and cumulative number of nymphs produced per replicate and b) the mean length and width of the survivors on day 5 for Aulacorthum solani feeding on control and transgenic (expressing GNA and bean chitinase) potato plants. The standard errors for the mean width are so small that they cannot be seen. None of the results are significant. Five replicates for each plant type were set up, initially containing 10 first instar nymphs. The bioassay was terminated after 12 days.
103

showed that although the aphids feeding on the PBG47 leaves were smaller in both length (approximately 0.011mm shorter) and width (approximately 0.023mm narrower) compared to the aphids feeding on control leaves, these differences were not enough to be significant (see Fig. 17b).
Once again leaf samples were taken from the plants at the start of the assay in order to determine the expression levels of GNA and bean chitinase within the plants. GNA expression levels at the start of the bioassay ranged from 0.05-0.45% total soluble protein, with an average of approximately 0.16% in the PBG47 plants. No GNA was detected in the control plants. Bean chitinase expression levels at the start of the bioassay ranged from 1.62-2.23%, with an approximate average of approximately 2.03% in the PBG47 plants. In this case a background level of approximately 0.14% bean chitinase was observed in the control plants. Protein estimations were also performed on some of the leaves actually used in the trial, after a leaf change had taken place. In these PBG47 leaves, GNA expression levels ranged from 0.33-0.57% with an average of 0.43% total soluble protein and bean chitinase expression levels ranged from 0-2.25% with an average of 1.54% total soluble protein. In the used control leaves background concentrations of approximately 0.13% and 0.2% total soluble protein were detected for GNA and bean chitinase respectively.
5.2 Discussion of results
Apart from results published by Gatehouse et al. (1996) this is, as far as I am aware, the only use of a double construct encoding two genes to convey enhanced resistance to homopteran species in transgenic plants. The data obtained using the clip cage method of bioassay on the PBG47 transgenic plants (see section 5.1.1), showed that this double construct resulted in extremely good levels of resistance to A. solani, with nymph production virtually prevented. The overall nymph production per surviving adult was only 5.5% of the control nymph production. The expression of GNA and bean chitinase combined did not result in a lag in nymph production. It would therefore appear that these two proteins combined do not slow down or inhibit the growth of the aphid, but do prevent the complete development of embryos, since the aphids feeding on the PBG47 plants used in the clip cage assay were effectively sterile. As mentioned in section 5.1.1, cumulative nymph production on the PBG47 plants also proved to be significantly lower than that on PWG85 plants (which express GNA but not bean chitinase). Similar results were reported by Gatehouse et al. (1996) where the peach potato aphid, hfyzus persicae, was tested against the PBG47 and PWG85 potato lines. In this study the overall
104

nymph production was also lower on the PBG47 line, but unlike the results for A. solani, a delay in the onset of nymph production was observed. However, although
fewer nymphs were produced by M. persicae on the PBG47 line compared to those
on the PWG85 line, this difference was not found to be significant. Despite the
fewer number of nymphs produced on the PBG47 plants, these plants had much less
of an impact on the intrinsic rate of increase ( r m value) of M persicae, than the
PWG85 plants. This was thought to be because the delay in the reproductive peak
was less severe on the PBG47 line (Gatehouse et al., 1996). No delay in
developmental period before the onset of nymph production was observed for A. solani feeding on either of these lines, contrasting with results observed with M
persicae. A further observation made by Gatehouse et al. (1996) was that survival of
the initial inoculating aphids was significantly reduced (by 20%) on the PBG47
plants; no such observation was made with A. solani on this plant line. The
expression levels in the plants used by Gatehouse et al. (1996) were approximately
1.5% and 2.0% of total soluble protein for GNA and bean chitinase respectively.
Although the expression levels of the two proteins in the PBG47 plants are lower,
particularly for GNA (where the average expression level is less than a third of that
found in plants used by Gatehouse et al. (1996)), these plants convey a much greater
reduction in aphid fecundity. This would imply that A. solani is more susceptible to
the combined effects of GNA and bean chitinase than M persicae. Gatehouse et al. (1996) did not observe any significant difference in the number of M. persicae nymphs produced on the two transgenic lines, although numbers were lower on the
PBG47 plants. From this it could be concluded that no additive or synergistic effects
were gained from the expression of bean chitinase alongside GNA. This directly
contrasts with the results obtained with A. solani where the number of nymphs was
further significantly reduced in plants expressing the double construct. However,
bean chitinase on its own has no significant effect on the fecundity of A. solani (see
section 4.2), thus implying that the effects of GNA and bean chitinase combined are
synergistic. Bean chitinase must be able to exert a significant effect on A. solani in
conjunction with GNA. Gatehouse et al. (1996) suggested that GNA and bean
chitinase had different effects on aphids, with the GNA primarily delaying the peak
of reproduction and secondarily reducing total fecundity, whereas the bean chitinase
just reduces total fecundity.
The results of the whole plant bioassay, using this transgenic potato type were less
convincing. Although the aphids on the PBG47 potatoes gave consistently reduced
parameters when compared to the control aphids, the only difference found to be
significant was the reduction in adult aphid length of those feeding on the GNA and
105

bean chitinase expressing potatoes. Again, the PBG47 plants were slightly better in reducing the aphid statistics than the PWG85 transgenic line although this time there were no significant differences between the performance of the transgenic lines (bioassays run concurrently). However, the lack of significant effects conveyed by the PBG47 plants is easy to explain when looking at the expression levels of these plants. Only one of the transgenic plants was found to have any detectable amounts of GNA, but even this was extremely low (0.01% total soluble protein) and the average level of bean chitinase was only estimated at 0.14% total soluble protein. Thus these plants were effectively only expressing bean chitinase which has already been shown not to have any significant effects on the fecundity or survival of the aphids (see section 4.2). This would also explain why the PBG47 plants still performed slightly better than the PWG85 plants: although the bean chitinase-expressing plants (section 4.2) didn't show any significant differences compared to the controls, some slight reductions were observed.
The PBG47 transgenic leaves used in the detached leaf bioassay also failed to show a significant level of resistance against A. solani, in terms of reduced survival, fecundity or size. Nymph production on both the control and transgenic leaves started very well. Although after four days of nymph production, the cumulative numbers were less on the PBG47 leaves, it does not resemble the virtual sterility observed in the clip cage bioassay (section 5.1.1). This lack of resistance can again be explained by the expression levels, particularly of GNA. Two sets of expression level data are available: those from leaves taken at the start of the trial and those from leaves actually used during the trial. The two sets have averages of 0.16% and 0.43% respectively. However, in the case of the latter data set, a background expression of approximately 0.13% was observed in the control leaves. I f these data are taken into account, it effectively lowers the level of GNA expression in the used leaves to approximately 0.3%. This is about 25% lower than the average GNA expression level of the PBG47 plants used in the clip cage assay (section 5.1.1) and also lower (by about 35%) than the average GNA expression level detected in the PWG85 plants used in the clip cage assay described in section 3.2.1. Although the bean chitinase expression levels are very high in both leaves taken before the start of the trial and in those used in the trial (averaging approximately 1.9% and 1.3% respectively i f background levels detected in the control leaves are taken into account), it still appears that it is the level of GNA expression which is crucial in conferring significant reductions in aphid fecundity. Unless GNA is expressed in sufficient quantities within the transgenic plants, no significant reductions in nymph production will be seen, even i f the levels of bean chitinase are very high.
106
The expression of GNA and bean chitinase combined (again in the PBG47 potato line) has been shown to reduce leaf damage, total larval biomass and survival of a lepidopteran pest (although the reduction in larval biomass was not significant). However, reductions were less than those observed for a GNA-only expressing potato line (GNA2-28) (Gatehouse et al., 1997). This shows that synergistic or additive effects are not always conveyed by this double construct against insect pests. Additive, but not synergistic effects have also been shown in tobacco plants expressing a double construct encoding the genes for cowpea trypsin inhibitor and pea lectin against the lepidopteran, Heliothis virescens (Boulter et al., 1990).
107

6. HISTOLOGY: R E S U L T S AND DISCUSSION
6.1 Adults fed on artificial diet with or without 0.1% w/v GNA incorporated
Newly mature, apterous, parthenogenetic A. solani were placed in feeding chambers and fed on control diet or diet incorporating 0.1% w/v GNA, for 5 days, as described in section 2.7.1.1. These aphids were fixed in a modified Karnovsky's fixative, dehydrated, embedded, sectioned and immunohistochemical techniques performed (using the Vectastain ABC kit) as described in sections 2.7.2 - 2.7.5).
Plate 6 shows two sections of aphids fed on control diet, and stained with toluidine blue to aid identification of the internal structures; (A) depicts a low power plan (xlO objective lens) of an adult aphid, showing the developing nymphs within the body and the presence of midgut, while (B) focuses (x20 objective lens) on one of the enclosed developing nymphs, showing structures such as the stomach, midgut and symbionts present within the nymph. Plate 7 shows features of the digestive tract from an aphid fed on control artificial diet; (A) is a high power photograph (x40 objective lens) of adult midgut; (B) is a low power plan (xlO objective lens) showing the position of the stomach and (C) is a high power photograph (x40 objective lens) depicting the structure of the stomach epithelium. This particular section through the stomach shows the region of attachment to the foregut.
Plate 8 shows sections of aphids fed on control artificial diet, incubated with primary GNA antibody and detected using the Vectastain ABC kit. Very little brown coloration (indicating the presence of GNA) was detected in these sections. (A) shows a photograph (x20 objective lens) of the adult stomach, where very little brown staining occurs in the lumen or around the epithelium; (B) is a high power photograph (x40 objective lens) showing that no brown staining was detected around the stomach epithelium of aphids fed on control artificial diet, and likewise (C) shows that no brown coloration is detected in the adult midgut of an aphid fed on control artificial diet (photographed under a x40 objective lens). Therefore the lack of brown coloration in the control aphid sections indicates that GNA is not present in the sections. Control aphid sections were also incubated with pre-immune serum, instead of primary GNA antibody, and detected using the Vectastain ABC kit. No brown staining was detected within the adult body or stomach (Plate 9). This indicates that any brown coloration observed in the sections is not an artefact of the incubation procedure or rabbit serum.
108
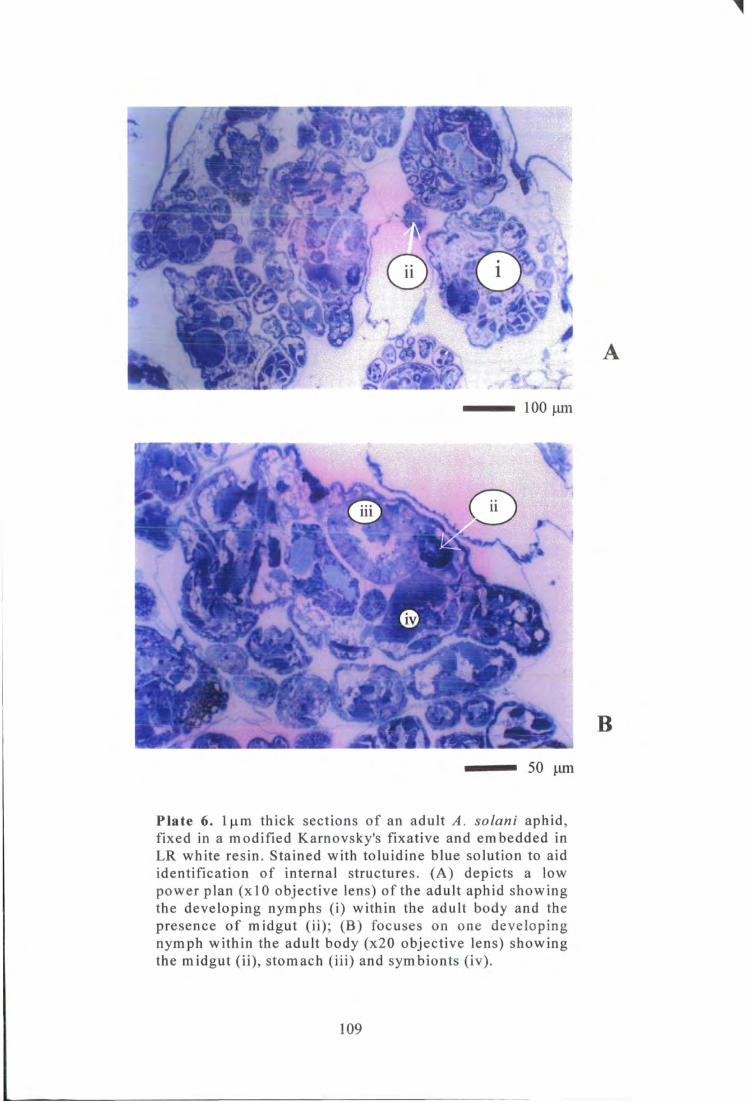
1
-
•
c
I 11
i i i
100 um
I i n
IV
B
50 um
Plate 6. l p m thick sections of an adult A. solani aphid, fixed in a modified Karnovsky's fixative and embedded in LR white resin. Stained with toluidine blue solution to aid identification of internal structures. (A) depicts a low power plan (xlO objective lens) of the adult aphid showing the developing nymphs (i) within the adult body and the presence of midgut ( i i ) ; (B) focuses on one developing nymph within the adult body (x20 objective lens) showing the midgut ( i i ) , stomach (i i i ) and symbionts (iv).
109

©
1
25 um
:•
1 : 9S> <
B \ • 100 um
V I
0
vu
50 um
Plate 7. l(im sections of an A. solani aphid fed on control artificial diet, fixed in a modified Karnovsky's fixative and embedded in L R white resin. Stained with a toluidine blue solution to aid identification of the internal structures. Symbols: lumen (v), epithelium (vi) and joining of foregut (vii). (A) high power (x40 objective lens) of a cross section through the midgut of an adult aphid, showing the lumen and the epithelium. (B) shows a low power plan (xlO objective lens) of the adult stomach and (C) is a high power photograph (x40 objective lens) focussing on part of the stomach where the lumen, epithelial cells and the joining foregut are clearly visible.
110

25 (im
25 \im
Plate 8. lum sections of an A. solani aphid fed on control artificial diet, fixed in a modified Karnovsky's fixative and embedded in LR white resin. The Vectastain ABC kit was used to detect the presence of GNA. Symbols: lumen (v) and epithelium (vi). (A) is a transverse section of the stomach, clearly showing the lumen and the epithelium where no brown coloration is detected in either (photographed under a x20 objective lens). (B) shows a high power photograph (x40 objective lens) of part of the stomach, again showing that no staining is detected around the epithelial cells or elsewhere in the lumen; (C) is a high power photograph (x40 objective lens) of the adult midgut, where no staining is seen either in the lumen or around the epithelium.
I l l
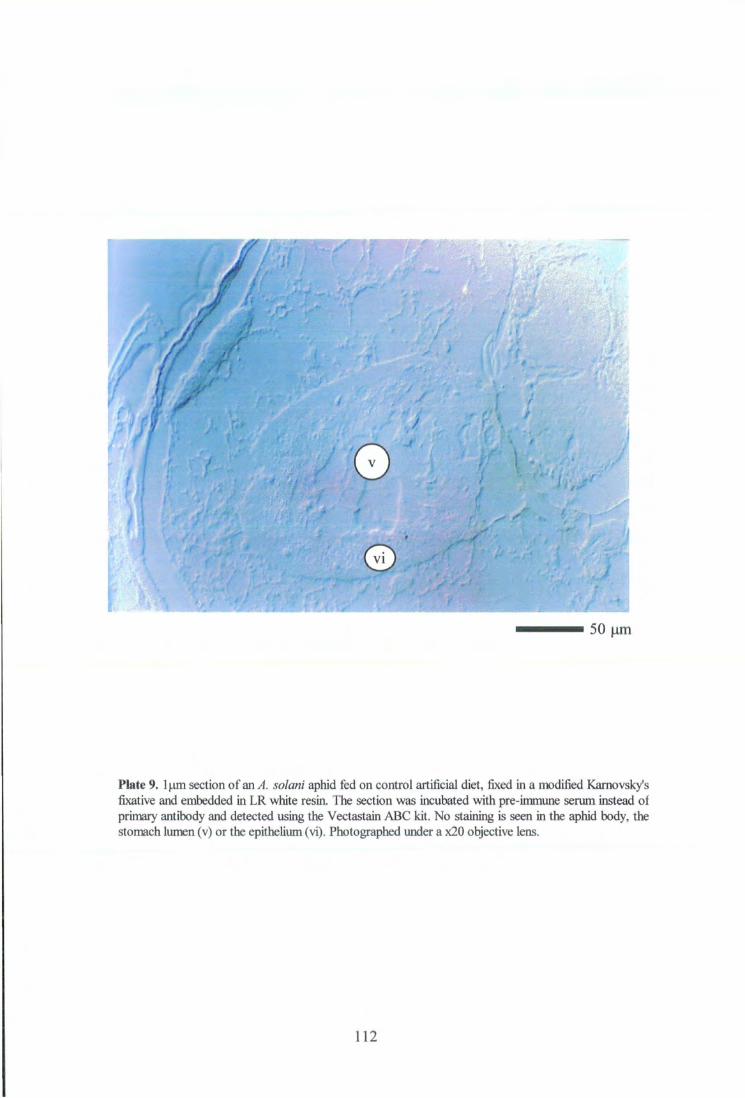
/
V I
50 \xm
Plate 9. lum section of an A. solani aphid fed on control artificial diet, fixed in a modified Karnovskys fixative and embedded in LR white resin. The section was incubated with pre-immune serum instead of primary antibody and detected using the Vectastain ABC kit. No staining is seen in the aphid body, the stomach lumen (v) or the epithelium (vi). Photographed under a x20 objective lens.
112
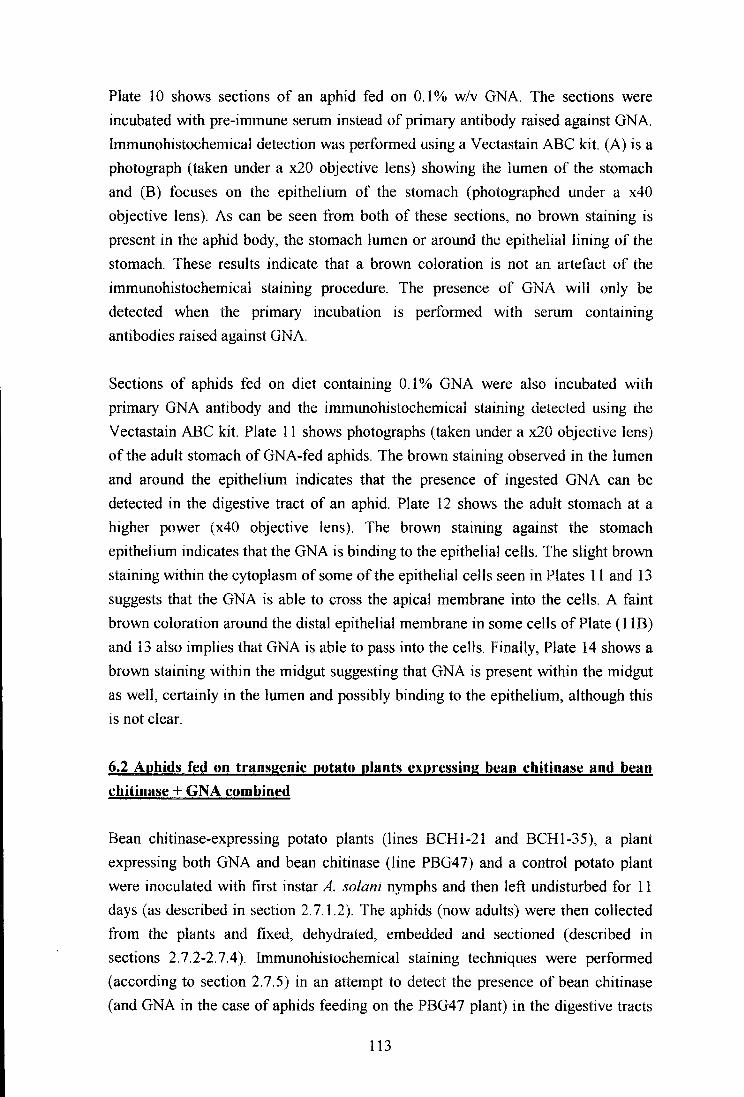
Plate 10 shows sections of an aphid fed on 0.1% w/v GNA. The sections were incubated with pre-immune serum instead of primary antibody raised against GNA. Immunohistochemical detection was performed using a Vectastain ABC kit. (A) is a photograph (taken under a x20 objective iens) showing the iumen of the stomach and (B) focuses on the epithelium of the stomach (photographed under a x40 objective lens). As can be seen from both of these sections, no brown staining is present in the aphid body, the stomach lumen or around the epithelial lining of the stomach. These results indicate that a brown coloration is not an artefact of the immunohistochemical staining procedure. The presence of GNA will only be detected when the primary incubation is performed with serum containing antibodies raised against GNA.
Sections of aphids fed on diet containing 0.1% GNA were also incubated with primary GNA antibody and the immunohistochemical staining detected using the Vectastain ABC kit. Plate 11 shows photographs (taken under a x20 objective lens) of the adult stomach of GNA-fed aphids. The brown staining observed in the lumen and around the epithelium indicates that the presence of ingested GNA can be detected in the digestive tract of an aphid. Plate 12 shows the adult stomach at a higher power (x40 objective lens). The brown staining against the stomach epithelium indicates that the GNA is binding to the epithelial cells. The slight brown staining within the cytoplasm of some of the epithelial cells seen in Plates 11 and 13 suggests that the GNA is able to cross the apical membrane into the cells. A faint brown coloration around the distal epithelial membrane in some cells of Plate (1 IB) and 13 also implies that GNA is able to pass into the cells. Finally, Plate 14 shows a brown staining within the midgut suggesting that GNA is present within the midgut as well, certainly in the lumen and possibly binding to the epithelium, although this is not clear.
6.2 Aphids fed on transgenic potato plants expressing bean chitinase and bean chitinase + GNA combined
Bean chitinase-expressing potato plants (lines BCH1-21 and BCH1-35), a plant expressing both GNA and bean chitinase (line PBG47) and a control potato plant were inoculated with first instar A. solani nymphs and then left undisturbed for 11 days (as described in section 2.7.1.2). The aphids (now adults) were then collected from the plants and fixed, dehydrated, embedded and sectioned (described in sections 2.7.2-2.7.4). Immunohistochemical staining techniques were performed (according to section 2.7.5) in an attempt to detect the presence of bean chitinase (and GNA in the case of aphids feeding on the PBG47 plant) in the digestive tracts
113

V I
50 urn
©
50 itm
P l a t e 1 0 . 1 p. m s e c t i o n s o f an A . so la n i a p h i d f e d o n a r t i f i c i a l d i e t w i t h 0 . 1 % G N A a d d e d , f i x e d in a m o d i f i e d K a r n o v s k y ' s f i x a t i v e a n d e m b e d d e d in L R w h i t e r e s i n . P r e - i m m u n e s e r u m w a s u s e d i n s t e a d o f p r i m a r y G N A a n t i b o d y , a n d d e t e c t i o n c a r r i e d o u t u s i n g the V e c t a s t a i n A B C k i t , to s h o w t h a t n o b r o w n s t a i n i n g o c c u r s w i t h o u t the a n t i b o d y ( i e . it is n o t a n a r t e f a c t o f the im m u n o h is to c h e m ic a 1 s y s t e m u s e d ) . S y m b o l s : l u m e n ( v ) a n d e p i t h e l i a l c e l l s ( v i ) . ( A ) p h o t o g r a p h ( x 2 0 o b j e c t i v e l e n s ) o f the a p h i d b o d y s h o w i n g t h a t no s t a i n i n g is p r e s e n t in the l u m e n o f the s t o m a c h a n d ( B ) is a h i g h p o w e r p h o t o g r a p h ( x 4 0 o b j e c t i v e l e n s ) o f the s t o m a c h e p i t h e l i a l l i n i n g w h e r e no b r o w n c o l o r a t i o n is d e t e c t e d .
114
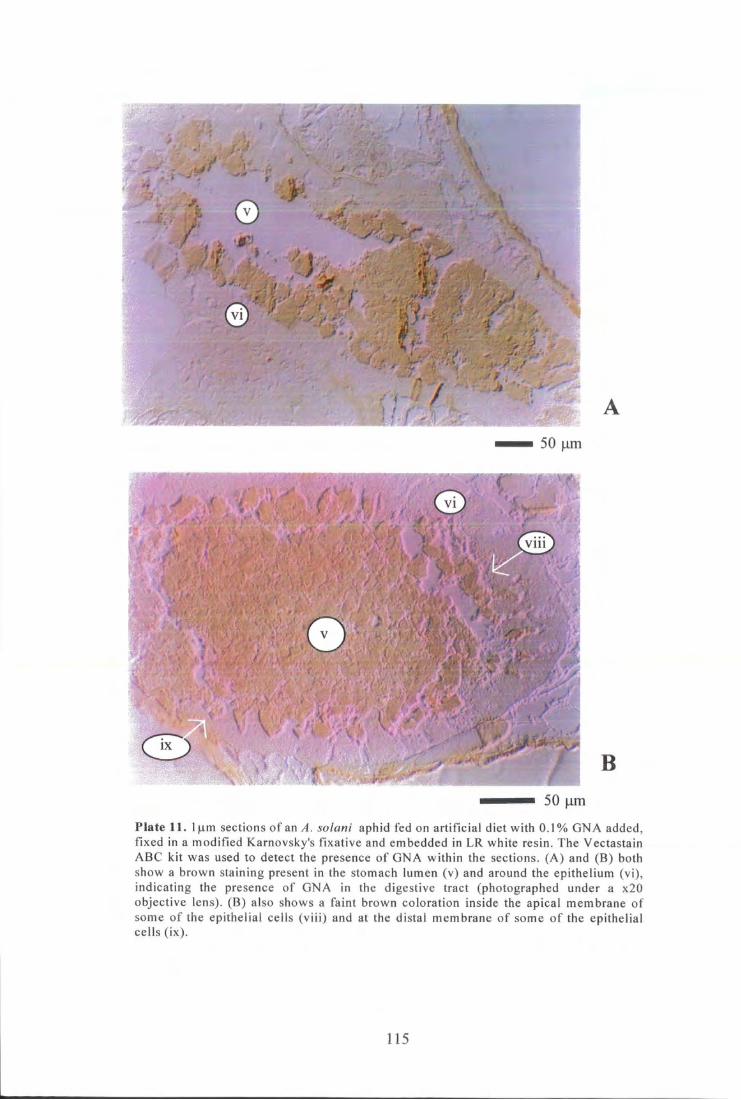
50 um
V I
B >
50 um
Plate 11. l(itn sections of an A. solani aphid fed on artificial diet with 0.1% GNA added, fixed in a modified Karnovsky's fixative and embedded in LR white resin. The Vectastain ABC kit was used to detect the presence of GNA within the sections. (A) and (B) both show a brown staining present in the stomach lumen (v) and around the epithelium (vi), indicating the presence of GNA in the digestive tract (photographed under a x20 objective lens). (B) also shows a faint brown coloration inside the apical membrane of some of the epithelial cells (viii) and at the distal membrane of some of the epithelial cells (ix).
115
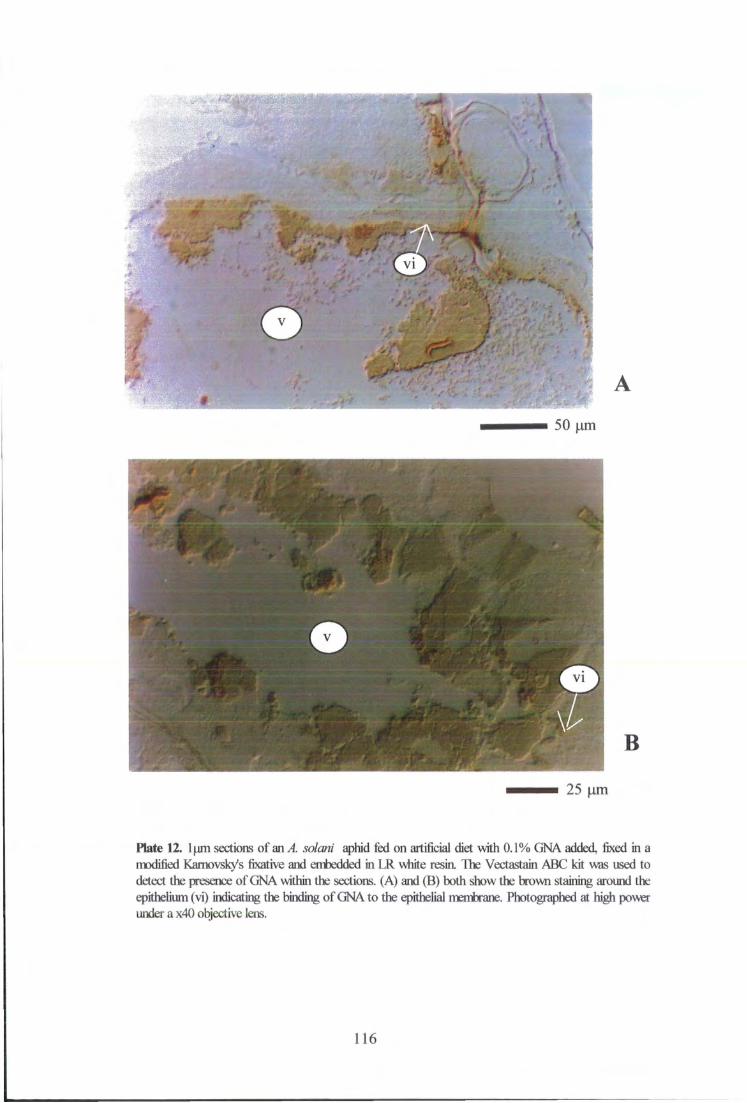
531 i
50 \xm
B
25 |im
Plate 12. lum sections of an A. solani aphid fed on artificial diet with 0.1% GNA added, fixed in a modified Karnovsky's fixative and embedded in LR white resin. The Vectastain ABC kit was used to detect the presence of GNA within the sections. (A) and (B) both show the brown staining around the epithelium (vi) indicating the binding of GNA to the epithelial membrane. Photographed at high power under a x40 objective lens.
116

& V l l l
m •
25 urn
v
B
25 um
Plate 13. lum sections of an A. solani aphid fed on artificial diet with 0.1% GNA added, fixed in a modified Karnovsky's fixative and embedded in LR white resin. The Vectastain ABC kit was used to detect the presence of GNA within the sections. Symbols: lumen (v), epithelial cells (vi) and cytoplasm of epithelial cells (viii). (A) and (B) again show GNA binding to the epithelial cells and the presence of brown regions within the cytoplasm of the epithelial cells suggests that GNA is passing across the apical membrane into the cells. Photographed under a x40 objective lens.
1 1 7

Plate 14. l u m section of an A. solani aphid fed on artificial diet with 0.1% G N A added, fixed in a modified Karnovsky's fixative and embedded in L R white resin. The Vectastain A B C kit was used to detect the presence of G N A within the section. A high power photograph (taken under a x40 objective lens) of the adult midgut indicating that G N A is present in the lumen (v) and possibly binding to the epithelium (vi).
118

of the aphids. However, no brown staining, indicating the presence of bean chitinase or GNA, was detected in any of the prepared sections (results not shown). This would indicate that i f either of these two proteins were present in the gut sections, they must have been in quantities below the limit of detection for the Vectastain detection kit used.
Leaf samples were taken from the plants before inoculating with the aphids so that immunodot blot assays could be performed to estimate the expression levels of bean chitinase (and GNA in the PBG47 plant) (method described in section 2.6.2). No GNA was detected in the PBG47 potato. High levels (approximately 2%) of bean chitinase were detected in the PBG47 and the BCH1-35 potato lines; none was detected in the BCH1 -21 potato plant.
6.3 Discussion of results
The results reported in section 6.1 show that a brown coloration, present on sections incubated with primary antibody raised against GNA, and processed using the Vectastain ABC kit, indicates the presence of GNA. GNA was found in the lumen of aphid stomach and midgut sections, binding to the stomach epithelium in aphids fed on 0.1% w/v GNA in artificial diet. Some slight brown staining within the cytoplasm of some stomach epithelial cells suggests that not only can the GNA bind to the apical membrane of these cells but can also pass across the membrane. Occasionally a faint brown coloration was detected around the distal membrane of the stomach epithelial cells, also suggesting that the GNA is able to pass into the cells. Similar results have been reported by Sauvion (1995), where lectin-binding studies were performed using the lectin from jackbean (Concanavalin A) against the pea aphid, Acyrthosiphon pisum. In this case a fluorescein labelled-Con A conjugate was fed to the aphids and showed up at the surface of the gut epithelial cells but not within the cytoplasm. Sauvion (1995) also used immunohistochemicai staining techniques to detect Con A bound to the apical membranes of the stomach epithelial cells. At a concentration of 800ug/ml the Con A was also observed within the epithelial cells, implying that it had been internalised. Sauvion (1995) observed that except for the oesophagus, the whole of the digestive tract was stained, indicating the presence of the lectin throughout. Epithelial cells were also shed when the aphids were fed on high concentrations of Con A. From these results, in conjunction with other observed detrimental effects on A. pisum, it was hypothesised that Con A accelerated the natural turnover of the striated border membrane of the stomach, reduced the intake of diet and restricted nutrient availability to the cells (Sauvion, 1995). However, no such increase in the shedding of the epithelial border was
119
observed in A. solani. In fact no disruptions or abnormalities in the epithelial cells were observed. It was noted that the sections of aphids fed on diet containing GNA had a slight brown coloration throughout, indicating that GNA might be able to pass through into the haemolymph.
Lectin (GNA) binding has also been reported in the rice brown planthopper, Nilaparvata lugens, where it was observed to be bound to the midgut epithelium of insects fed on artificial diet containing GNA (Powell, 1993) and may also increase the number of gut bacteria (Powell, pers. comm.).
Lectin-binding within the guts of insects belonging to other orders has also been published. Phaseolus vulgaris agglutinin (PHA) was observed to bind to the luminal membrane of midgut epithelial cells in the bruchid, Caliosobruchus maculatus, when fed on artificial seed containing the lectin (Gatehouse et al., 1984). In this study the PHA was also occasionally found bound to the distal cell membrane of the epithelial cells, implying that the lectin could cross over the luminal membrane. However, it was later shown by Heusing et al. (1991a) that purified PHA was not toxic to C. maculatus. It would therefore appear that although PHA binds and passes across the luminal epithelial cell membranes, it is harmless to the cells and insect as a whole. Lectins were observed binding to the peritrophic membrane in larvae of the dipteran, Lucilia cuprina (Eisemann et al., 1994). This was shown by a layer of precipitate on the luminal side of the peritrophic membrane. Eisemann et al. (1994) hypothesised from this result that lectin-binding to the peritrophic membrane causes the lectin and other proteins to precipitate and aggregate resulting in a restriction of bi-directional movement of nutrients and digestive enzymes across the membrane; however, the lectin must have been able to pass across the peritrophic membrane since it was found bound to the midgut epithelial cells. Gatehouse et al. (1984) did not report lectin binding to the peritrophic membrane in C. maculatus and it was not known whether the lectin disrupted the membrane or passed through it. Sap-sucking insects do not possess a chitinous peritrophic membrane since they feed on a liquid diet and therefore do not need to protect against food abrasion. Instead they possess a perimicrovillar lipid membrane (Terra, 1996). Parts of the aphid gut (foregut and hindgut) are surrounded by a chitinous intima, although the midgut does not possess such a structure (Ponsen, 1987).
Lectins have also been observed binding to fat cells at the outer edge of the gut epithelium in mature C. maculatus larvae (Gatehouse et al., 1984) and to fat-body cells in Drosophila larvae (Rizki & Rizki, 1983). Initially the fat-body cells were found to be polarised with a high concentration of lectin-binding sites on the cell
120

surfaces in contact with the basal membrane, rather than surfaces attached to other cells. During pupation the distribution became more equal over the ceil surface (Rizki & Rizki, 1983). Gatehouse et al. (1984) explained the presence of lectin binding to fat cells as a result of tissue re-organisation prior to pupation, allowing the lectin to diffuse through the tissue. However, in A. solani, GNA was not observed binding to the fat-body cells.
As yet, no lectin-receptor sites have been isolated in homopteran guts, although work is underway to identify a GNA receptor from rice brown planthopper midguts (Bharathi et al., University of Durham; pers. comm.). However, a GNA receptor in the iepidopteran pest, Lacanobia oleracea has been isolated from midgut preparations (Fitches et al., University of Durham, pers. comm.).
Lectins can cause a variety of effects within mammalian guts. Some can be endocytosed across the brush border membranes to induce enhanced metabolic activity, hyperplasia and hypertrophy of the small intestine. The development of the microvilli is disrupted and becomes abnormal (Pusztai et al., 1990). Nutrient absorption can be inhibited as a result of lectin binding (Pusztai et al., 1993b) and an overgrowth of gut bacteria can occur (Pusztai et al., 1993a). Systemic effects such as an enlargement of the pancreas can occur (Pusztai ei ai., 1993b).
The lack of GNA expression in the PBG47 plant used to feed aphids on, explains why no GNA could be detected in the gut sections of these aphids following immunohistochemical staining procedures. Likewise the lack of bean chitinase-expression in the BCH1-21 plant used explains why no bean chitinase could be detected in the guts of the aphids feeding on this plant. However, bean chitinase levels were found to be reasonably high in the BCH1-35 and PBG47 plants, yet none could be detected in the aphids feeding on these plants. Two explanations are likely: either the expression level of bean chitinase is much lower in the phloem sap which the aphids feed on, compared to within other parts of leaf tissue or, the bean chitinase is degraded within the gut. These results could help to explain why aphids feeding on bean chitinase-expressing plants did not show a reduction in survival or fecundity. I f the problem was down to low expression in the phloem sap, then aphids feeding on artificial diet containing bean chitinase could be expected to show reduced survival and fecundity. A slight but significant reduction in survival was seen in the artificial diet bioassays, but this only occurred in old age; no reduction in fecundity was seen in these aphids feeding on diet. This would therefore suggest that maybe the bean chitinase in the artificial diet is failing to reach the aphid, possibly because it is being degraded in the insect gut.
121

7. O T H E R PROTEIN BIOASSAYS: RESULTS AND DISCUSSION
7.1 R E S U L T S
7.1.1 Pea lectin
Pea lectin was tested in artificial diet at a 0.1% w/v concentration, with ten replicates set up for control and treatment, in the usual manner. Fig. 18 shows the survival per replicate over time of the two insect groups. Aphids feeding on the control diet had a high survival (>98%) up to and including day 6. The mortality then increased to a steady rate (7.4% dying per day between days 10-20) so that by day 20 only 14% of the aphids remained alive. Aphids feeding on the 0.1% pea lectin, however, showed 100% survival up to and including day 9, before showing a steady rate of mortality (9.6% dying per day between days 10-20) so that by day 20, 12% were still alive. Until the end of the bioassay, aphids feeding on the pea lectin consistently had a higher survival although this was not significant. This was presumably because no mortality occurred on the pea lectin diet until day 10, since after this the death rate was approximately 2% higher per day for aphids feeding on pea lectin.
Fig. 18 also shows the cumulative nymph production per replicate per day for the aphids feeding on the control diet with or without the addition of 0.1% pea lectin. Both groups of insects commenced nymph production between days 9 and 10. However the cumulative number of nymphs produced on the pea lectin diet very quickly outnumbered the amount produced by the control aphids. By the end of the trial the cumulative number of nymphs per replicate on the pea lectin was approximately 8 compared to about 3 on the control diet. Nymph production by the pea lectin-fed aphids started to decline from day 18, whereas the control aphids did not show much of a decrease in production towards the end of the trial. The rate of nymph production of the experimental group (0.83 nymphs produced per replicate per day) was approximately 2.5 times higher than the rate of the controls (0.32 nymphs produced per replicate per day); this difference was found to be significant (non-parametric Mann-Whitney U test, p = 0.0376 on day 20). Overall nymph production in this assay was lower than has been noted on previous occasions, although most replicates did produce nymphs.
122

Survival/ replicate
Cumulative nymph production/ replicate
Control survival/ replicate
0.1% pea lectin survival/replicate
control cumulativre nymphs/replicate
0.1% pea lectin cumulative nymphs/replicate
Fig. 18. Graph showing the survival and cumulative nymph production per replicate of Aulacorthum solani when fed artificial diet with or without the incorporation of 0.1% w/v pea lectin. Ten replicates for each treatment were set up, with each replicate initially containing five first instar nymphs. The bioassay was terminated after 20 days.
123

7.1.2 Nettle lectin
Artificial feeding chambers were set up as usual with diet sachets containing artificial diet with and without the addition of 0.1% w/v nettle lectin. Five replicates were set up for each diet type. Fig. 19 shows that up to and including day 12, survival was >92% in both aphid groups, although during this period after day 3 survival was slightly higher on the 0.1% nettle lectin. The control aphids then showed a sharp drop in survival until day 14 when it remained constant at 56% for the next four days before dropping again to 36% on day 20. The approximate mortality rate between days 11 and 14 was 0.6 aphids dying per replicate per day. Aphids feeding on the nettle lectin showed a slight decline in survival between days 10 and 17 (72% surviving on day 17) and then a sharp increase in mortality over the last 3 days to 36% by the end of the trial. The mortality rate between days 11 and 14 for the nettle lectin fed aphids was lower than that of the control aphids, being only approximately 0.27 dying per replicate per day. However, by the end of the trial, no significant differences were found in the survival of these two insect groups (Logrank y} test).
Fig. 19 also shows the fecundity of aphids feeding on diet with and without the addition of 0.1% nettle lectin. The control insects commenced parthenogenetic nymph production between days 13 and 14 while those on the lectin lagged behind by 24 hours. The control aphids showed a steady accumulation of nymphs, although overall the level was low; by the end of the trial 7.2 nymphs had been produced per replicate. Nymph production by aphids feeding on the lectin, however, occurred at a much slower rate so that by day 20 only 1.8 nymphs had been produced per replicate; a fourfold reduction in the cumulative number of nymphs compared to the control. Rates of nymph production between days 17 and 20 were 1.2 nymphs produced per replicate per day on the control and 0.33 nymphs produced per replicate per day in the lectin-fed aphids. However, this fourfold difference was not found to be significant (non-parametric Mann-Whitney U test).
7.1.3 Concanavalin A
A dose response bioassay was set up incorporating Concanavalin A into control artificial diet at 0.1, 0.05, 0.02 and 0.01% w/v concentrations. Five replicates were set up following the usual procedure, for all Con A concentrations and the control diet. However the performance of the aphids was very poor in this bioassay with very few nymphs produced in any of the feeding chambers, including the controls, thus the fecundity data is not presented here. Fig. 20a shows the survival of these
124

Survivors/ Cumulative Survivors/ nymphs/rep rep
8
1
0 0 0 10 15 20
Days
0.1% Nettle lectin survivors/ Control surwors
- • Control cumulative nymphs • 0.1% Nettle lectin cumulative nymphs
Fig. 19. Graph showing the survival and cumulative nymph production per replicate of Aulacorthum solani when fed artificial diet with or without the addition of 0.1% w/v nettle lectin. Five replicates for each treatment were set up with each replicate initially containg five first instar nymphs. The bioassay was terminated after 20 days.
125
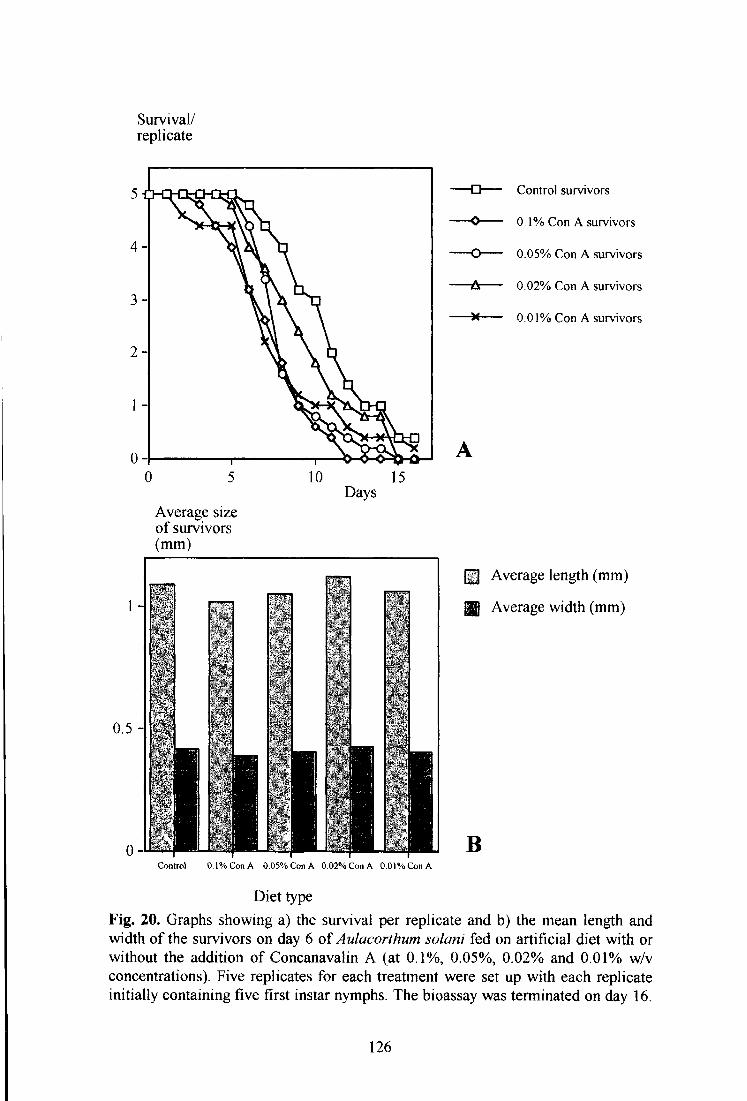
Survival/ replicate
Control survivors
0.1% Con A survivors
0.05% Con A survivors
-A 0.02% Con A survivors
-X 0.01% Con A survivors
Average size of survivors (mm)
0.5
0 -
§ | Average length (mm)
HI Average width (mm)
B Control 0.1% Con A 0.05% Con A 0.02% Con A 0.01% Con A
Diet type Fig. 20. Graphs showing a) the survival per replicate and b) the mean length and width of the survivors on day 6 of Aulacorthum solani fed on artificial diet with or without the addition of Concanavalin A (at 0.1%, 0.05%, 0.02% and 0.01% w/v concentrations). Five replicates for each treatment were set up with each replicate initially containing five first instar nymphs. The bioassay was terminated on day 16.
126

aphids against time, on a per replicate basis. Aphids on control diet and 0.05% Concanavalin A showed 100% survival over the first five days; those feeding on 0.02% Con A showed 100% survival over the first 4 days whereas those feeding on 0.1% and 0.01% Con A only showed 100% survival for the first 48 hours and 24 hours respectively. Al l the aphid groups showed a steady, fairly rapid decline in their survival once mortality started, until day 12 when the decline tended to lessen slightly. The mortality rates varied from the lowest rate of 0.43 dying per replicate per day (on 0.01% Con A) to the highest rate of 0.66 dying per replicate per day (on 0.05% Con A). Aphids feeding on 0.1%, 0.05% and 0.01% Con A showed highly significant reductions in aphid survival compared to the control aphids (Logrank x 2
test, p < 0.0001, p = 0.0014 and p = 0.0091 respectively).
A second bioassay was set up in the same way and the length and width of the individual aphids measured on day 6 following the method described in section 2.4. Fig. 20b shows a plot of the average length and width of aphids feeding on the control diet and different Con A concentrations. The average length and width of the aphids feeding on all, except the 0.02% Con A concentrations were smaller than the control aphids. However, only the difference found between aphids feeding on 0.1% Con A and the control diet was significant (unpaired t-test, p = 0.0433 for length and p = 0.0109 for width). Aphids feeding on the 0.1% Con A were approximately 0.072mm and 0.029mm smaller in length and width respectively than the control aphids. Aphids feeding on the 0.02% Con A had slightly bigger average lengths and widths compared to the control aphids but this was not found to be statistically different.
7.1.4 Canavalia brasiliensis lectin
A bioassay, incorporating 0.1% w/v Canavalia brasiliensis lectin into artificial diet was set up with ten replicates for control and treatment. Fig. 21 shows the survival of both groups of aphids over time. Both groups show 100% survival for only 3 days, then those feeding on diet with added lectin have a 98% survival over the next 4 days while control survival drops to 88% by day 6. From this point both groups show a steady rate of mortality between days 9 and 16 (0.4 dying per replicate per day on control diet compared to 0.53 dying per replicate per day on diet with lectin added). The rate slows over the final two days of the assay so that by the end, 12% are still alive on control diet and 2% remained on the diet incorporating C.
127

Survival/ replicate
Cumulative nymph production/ replicate
Days
- • — Control survival/replicate
-•— C. brasiliensis lectin survival/replicate
Control cumulative nymphs/replicate
C. brasiliensis cumulative nymphs/replicate
Fig. 21. Graph showing the survival and cumulative nymph production per replicate of Aulacorthum solani when fed artificial diet with or without the incorporation of 0.1% w/v Canavalia brasiliensis lectin. Ten replicates for each treatment were set up with each replicate initially containing five first instar nymphs. The bioassay was terminated after 20 days.
128
brasiliensis lectin. Overall, no significant differences were found between the two mortality curves (Logrank y} test).
Fig 21 also shows the cumulative nymph production of the same two groups of aphids over time. Both groups commenced nymph production between days 9 and 10. However those feeding on diet with added lectin showed a rapid rate of production (3.74 nymphs produced per replicate per day) compared to the control diet (0.98 nymphs produced per replicate per day) between days 10 and 15. After day 15 nymph production in both groups starts to decline. This nearly fourfold difference in nymph production proved to be significant (non-parametric Mann-Whitney U test, p = 0.0015); aphids feeding on diet containing C. brasiliensis lectin produced significantly more nymphs compared to the control aphids.
A dose response bioassay was also set up where C. brasiliensis lectin was incorporated into artificial diet at four different concentrations (0.2%, 0.1%, 0.05% and 0.025% w/v). Five replicates were set up for each lectin concentration and ten for the control feeding chambers. Until day 8, the survival of the control aphids and those feeding on all the lectin concentrations was high (> 84%) (see Fig. 22a), before the decline in survival became more marked in all groups. Between days 9 and 17 the control aphids had the lowest survival (mortality rate of 0.4 dying per replicate per day) and those feeding on 0.1% lectin had the highest survival (mortality rate of 0.125 dying per replicate per day); after day 17 the mortality rates decreased. By day 20 aphids on the 0.1 % lectin had a significantly higher survival (44%) than the control aphids (14%) (Logrank x 2 test, p = 0.0004), survival on the other lectin concentrations varied from 0-14%.
The parthenogenetic nymph production of these aphids can be seen in Fig. 22b. Al l groups, except aphids feeding on the lowest lectin concentration (where nymph production started a day earlier), commenced nymph production between days 9 and 10. On all the lectin concentrations nymph production was much higher compared to the control aphids. Between days 12 and 16 the rates of production varied from the lowest on control (0.35 nymphs produced per replicate per day) to the highest on 0.1% lectin (5 .6 nymphs produced per replicate per day). By the end of the trial the cumulative nymph production was approximately 5 times greater (on 0.2% lectin), 13 times greater (on 0.1% lectin), 8 times higher (on 0.05% lectin) and 2.5 times higher (on 0.025% lectin) compared to the cumulative production of the control
129

Survival/ replicate
Control survival 4
0.2% CBL survival
0.1% CBL survival
0.05% CBL survival
0.025% CBL survival
0 20 10 15 0
Days
Cumulative nymphs/ replicate
Control nymphs
0.2% CBL nymphs
0.1 % CBL nymphs
0.05% CBL nymphs
0.025% CBL nymphs
B
Days
Fig. 22. Graph showing a) survival and b) the cumulative nymph production per replicate of Aulacori'hum solani when fed artificial diet with or without the addition of Canavalia brasiliensis lectin (at 0.2%, 0.1%, 0.05% and 0.025% w/v concentrations). Five replicates for each treatment were set up with each replicate initially containing five first instar nymphs. The bioassay was terminated after 20 days.
130
aphids. In all cases, except those feeding on 0.05% lectin, the results were significant (non-parametric Mann-Whitney U test, 0.01 < p < 0.05).
7.1.5 Cratylia floribunda lectin
0.1% w/v Cratylia floribunda lectin was incorporated into artificial diet and used in a bioassay, set up as described in section 2.2.3, with ten replicates for control and treatment. Control survival over the first four days remained at 100%, before declining at a rate of 3.2% of the aphids dying per day, over the next 6 days. The mortality rate then increased to 10% dying per day, so that by the end of the trial (day 17) only 8% of the aphids were still alive (see Fig. 23). Survival of the aphids feeding on 0.1% C. floribunda lectin, on the otherhand, remained at 100% up to and including day 9 before dropping sharply at a rate of 8.7% of the aphids dying per day, so that by day 17 only 8% remained alive. These results were not significantly different. No fecundity results are presented for this bioassay, since the control aphids failed to produce any nymphs.
7.1.6 Ovalbumin
Ovalbumin was incorporated into artificial diet at a 0.1% w/v concentration as a 'neutral' protein to test whether aphids feeding on diet containing some protein did better than those on control diet with no protein added. Ten replicates were set up for control and treatment feeding chambers. In the first assay, survival of both aphid groups remained high (> 92%) over the first 6 days (see Fig. 24a). An increase in mortality then occurred in both groups (control death rate estimated at 0.24 dying per replicate per day compared to 0.33 dying per replicate per day on the 0.1% ovalbumin) until day 18 when the rates declined again. By the end of the trial 28% of the initial aphids were still alive on the control diet compared to only 8% on diet containing ovalbumin. The reduction in survival of the aphids feeding on the diet containing 0.1% ovalbumin was found to be significant (Logrank y} test, p = 0.0274).
Fig. 24a also shows the fecundity of these aphids, measured in terms of cumulative parthenogenetic nymph production. Both groups of aphids started to produce nymphs between days 8 and 9. Between days 10 and 18 the rates of production were very similar (control aphids producing approximately 1.59 nymphs per replicate per day compared to 1.65 nymphs per replicate per day on the 0.1% ovalbumin). Nymph production then declined over the final two days in both groups so that by the end of the trial both groups had produced approximately 15 cumulative nymphs per
131

Survival/ replicate
Control survival
C. floribunda lectin survival
0 10 15 20 0
Days
Fig. 23. Graph showing the survival per replicate of Aulacorthum solani when fed artificial diet with or without the addition of 0.1% w/v Cratylia floribunda lectin. Ten replicates for each treatment were set up with each replicate initially containing five first instar nymphs. The bioassay was terminated on day 17.
132

Survival/ replicate
Survival/ replicate
Cumulative nymphs/ replicate
- 15
-10
5 10
Control survival
1 5 Day 2 0
0.1% ovalbumin survival
control cumulative nymphs
0.1% ovalbumin cumulative nymphs Cumulative nymphs/ replicate
B
Fig. 24. Graphs showing the survival and cumulative nymph production per replicate of Aulacorthum solani when fed artificial diet with or without the addition of 0.1% w/v ovalbumin on two separate occasions. Ten replicates for each treatment were set up for each bioassay, with each replicate initially containing five first instar nymphs. Bioassays were terminated after 20 days.
133

replicate; no significant differences were observed between these two groups of aphids (non-parametric Mann-Whitney U test).
A second bioassay incorporating 0.1% ovalbumin into artificial diet produced slightly different results. Fig. 24b shows that up to and including day 7 the control survival was >98%, then mortality increased to a rate of 0.39 dying per replicate per day between days 10 and 18. Aphids on the diet containing ovalbumin showed survival of >98% for a further 4 days compared to the control aphids (until day 11), before mortality progressed at an approximate rate of 0.54 dying per replicate per day over a comparable time. Both groups showed a decline in mortality over the last 3 days so that by the end of the trial 14% remained alive on the control diet compared to 4% feeding on the ovalbumin; this difference was not found to be significant (Logrank y} test).
Fig. 24b also shows the cumulative nymph production with time. Aphids feeding on control diet commenced nymph production between days 9 and 10; those fed on ovalbumin produced their first nymphs a day earlier. Nymph production occurred at a quicker rate on the 0.1 % ovalbumin (0.54 nymphs produced per replicate per day compared to 0.33 nymphs per replicate per day on the control). However, nymph production on the ovalbumin slowed down towards the end of the trial so that by day 20 a difference of only 1.6 cumulative nymphs was found between the two groups of aphids (not significant, non-parametric Mann-Whitney U test).
7.1.7 Soybean Bowman-Birk Inhibitor
Soybean Bowman-Birk inhibitor (SBBI) was added to aphid artificial diet at 0.1% w/v and used in a bioassay prepared and maintained as described in section 2.2.3. Ten replicates of control and treatment were set up. Fig. 25 shows the survival of aphids feeding on control diet and diet with 0.1% SBBI added. Aphid survival in the two groups was high (>94%) over the first 7 days. From this point survival in the two groups decreases, although more rapidly on the diet containing inhibitor (mortality rates between days 11 and 18 are 5% dying per day on the control and aproximately 7.4% dying per day on the inhibitor). By the end of the trial 28% of the control aphids were still alive compared to only 2% on the diet containing the inhibitor. This difference of 26% was significant (Logrank y} test, p = 0.0004).
Fig. 25 also shows the cumulative nymph production over time of the two groups of aphids, both commencing nymph production between days 8 and 9. By day 11 those feeding on the inhibitor had produced 27% more nymphs than the control aphids.
134

Number of survivors /replicate
Cumulative nymphs /replicate
15
10
5
1
0 0 20 0 0 5
Day
Control survival
• t o — 0.1% Bowman-Birk inhibitor survival
1 3 — control cumulative nymphs
O — 0.1% Bowman-Birk inhibitor cumulative nymphs
Fig.25. Graph showing the survival and cumulative nymph production per replicate of Aulacorthum solani when fed artificial diet with or without the addition of 0.1% w/v soybean Bowman-Birk inhibitor. Ten replicates for each treatment were set up with each replicate initially containing five first instar nymphs. The bioassay was terminated after 20 days.
135

The cumulative number of nymphs continued to be higher on the diet with inhibitor over the following 8 days, even though the rate of nymph production was slightly higher on the control diet (1.57 nymphs produced per replicate per day compared to 1.47 nymphs produced per replicate per day on inhibitor). However, nymph production on the inhibitor virtually stopped over the last 3 days so that by the end of the trial the cumulative numbers of nymphs were very similar for both groups (approximately 15 nymphs per replicate). Consequently there were no significant differences (non-parametric Mann-Whitney U test) in the fecundity of aphids feeding on diet with or without inhibitor added.
7.1.8 5-Hydroxytryptamine
This bioassay was set up in the way described in section 2.3.3, with 5 first instar nymphs in each feeding chamber. Four different concentrations ( ImM, 0.1 mM, 0.0ImM and 0.00ImM) of 5-hydroxytryptamine were incorporated into the artificial diet. Five replicates were set up for each concentration and ten replicates were set up for the control diet. The survival of aphids feeding on these concentrations of 5-hydroxytryptamine can be seen in Fig. 26a. The survival of all the aphid groups was high (> 90%) over the first 8 days of the trial, then mortality began to increase. It was noticeable that aphids on all 5-hydroxytryptamine concentrations had a higher survival than the control aphids between days 8 and 14. However, the control mortality slowed over the final 4 days so that by the end of the trial aphids on the highest 5-hydroxytryptamine concentration had a lower survival (4%) than the control aphids (14%) and insects on the higher concentrations had a higher survival (20-28%). The mortality rates between days 8 and 14 varied from the lowest (0.17 dying per replicate per day) on I m M 5-hydroxytryptamine and the highest (0.43 dying per replicate per day) on the control. Overall no significant differences were found (Logrank x 2 test) amongst these results.
Fig. 26b shows how parthenogenetic nymph production varied on the different 5-hydroxytryptamine concentrations over time. Nymph production commenced between days 9 and 10 for control aphids and aphids on the highest 5-hydroxytryptamine concentration, between days 10 and 11 on the next highest concentration but started earlier (between days 8 and 9) on the two lowest concentrations. Aphids feeding on control diet had the lowest overall cumulative number of nymphs (3.2 nymphs per replicate on day 20) whereas those on the I m M 5-hydroxytryptamine had the highest (9.6 nymphs per replicate on day 20). The cumulative number of nymphs on the other concentrations ranged from 4.6-5.8 nymphs per replicate. Not surprisingly, the control aphids had the lowest rate of
136
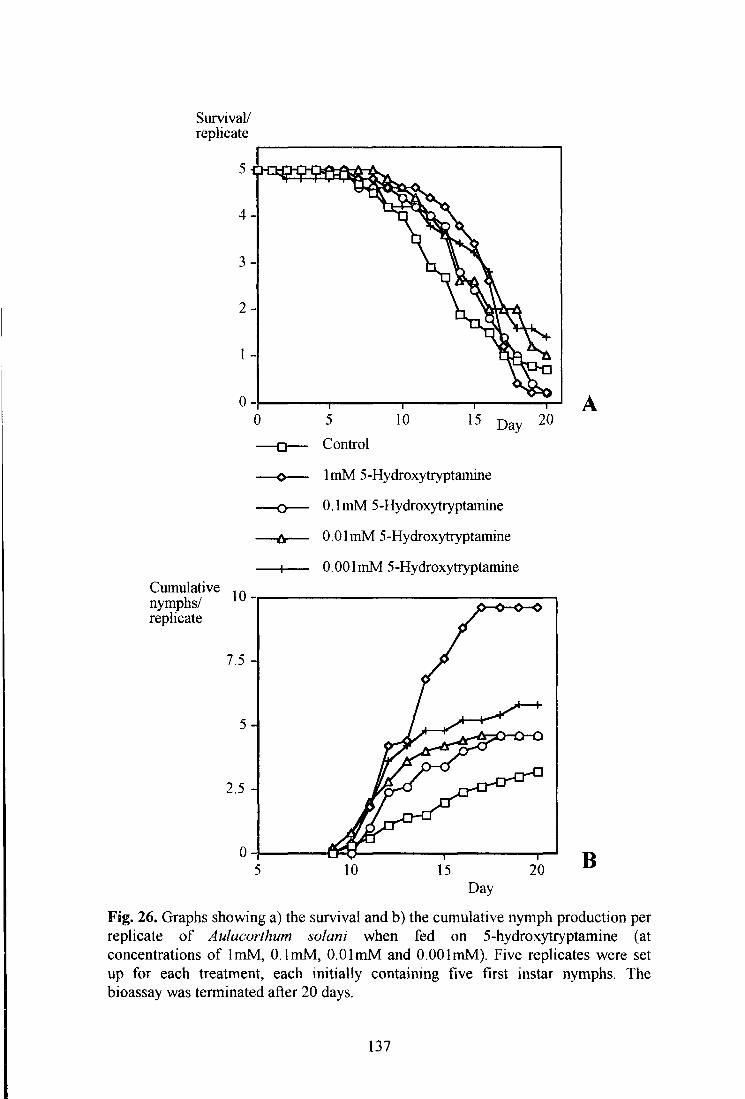
Survival/ replicate
Control
Cumulative nymphs/ replicate
ImM 5-Hydroxytryptairiine
0.1 mM 5-Hydroxytryptamine
0.0ImM 5-Hydroxytryptamine
0.00ImM 5-Hydroxytryptamine
B
Fig. 26. Graphs showing a) the survival and b) the cumulative nymph production per replicate of Aulacorthum solani when fed on 5-hydroxytryptamine (at concentrations of ImM, 0.ImM, 0.0ImM and 0.00ImM). Five replicates were set up for each treatment, each initially containing five first instar nymphs. The bioassay was terminated after 20 days.
137

production (0.34 nymphs produced per replicate per day between days 10 and 15) whereas those on the ImM 5-hydroxytryptamine had the highest rate (1.44 nymphs produced per replicate per day). These differences in fecundity were not found to be significant (non-parametric Mann-Whitney U test).
7.1.9 Lipoxygenase
An artificial diet bioassay was set up, following the usual method, with five first instar nymphs per feeding chamber and 10 replicate chambers for contol diet with and without 0.1% w/v lipoxygenase incorporated. Fig. 27a shows the number of surviving aphids per replicate over time. The survival of the control aphids remained at 100% over the first four days before steadily declining to approximately 36% by the end of the trial (day 20). However, aphid survival on the 0.1% lipoxygenase immediately dropped very slightly, over the first 24 hours to 98% and remained at this level until day 7. From this point a steady decrease in survival occurred so that by the end of the trial only 6% of these aphids remained alive. Between day 7 and 20 the rate of mortality was greater for the aphids feeding on the 0.1% lipoxygenase (approximately 6.6% dying per day) compared to the mortality rate of the control aphids (approximately 4% dying per day). This difference in the mortality rates resulted in the survival of aphids feeding on 0.1% lipoxygenase being significantly reduced compared to aphids feeding on control diet (Logrank x 2 , p = 0.0074).
Fig. 27a also shows the cumulative fecundity of the aphids per replicate as time progressed. Both groups of aphids started producing nymphs on day 10 of the trial. However, right from the start the rate of nymph production was much greater for the aphids feeding on the lipoxygenase (approximately 1.15 nymphs produced per replicate per day between days 9 and 17). The rate of reproduction did not decline until day 17 when an approximate rate of 0.6 nymphs produced per replicate per day was calculated for the remainder of the trial. Nymph production for the control aphids was much slower and virtually stopped from day 14 onwards (approximately 0.24 nymphs produced per replicate per day between day 9 and 17). The difference in the rates of reproduction proved to be significant (non-parametric Mann-Whitney U-test, p = 0.0191), with the aphids feeding on 0.1% lipoxygenase producing significantly more nymphs by parthenogenesis than the control aphids. However, it should be noted that only two out of the ten control replicates produced any nymphs.
A bioassay using artificial diet containing 0.2% w/v lipoxygenase was also set up with feeding chambers containing five first instar aphids. Ten replicates of control and treatment were set up. The results are presented in Fig. 27b. As can be seen
138

number of survivors /replicate
Cumulative nymphs /replicate
5
10
0 0 i 1
0 10 10 15 Days Number of Cumulative
survivors nymphs 1 \* I / 1 1VUVV /replicate
15
10
0 0 •
0 10 15 20 Day B
Control survival
0.1% lipoxygenase survival
control nymphs
0.1% lipoxygenase nymphs
Control survival
0.2% lipoxygenase survival
control nymphs
0.2% lipoxygenase nymphs
Fig. 27. Graphs showing the survival and cumulative nymph production per replicate of Aulacorthum solani when fed artificial diet with or without the addition of a) 0.1% and b) 0.2% w/v lipoxygenase. Ten replicates were set up for each treatment with each replicate initially containing five first instar nymphs. The bioassays were terminated after 20 days.
139

from the graph, aphid survival on the 0.2% lipoxygenase was consistently lower than on the control diet, after day 3. Control survival remained at 98% until day 4 when a steady mortality commenced so that by day 20 only 28% of the control aphids were still alive. Survival of those feeding on the 0.2% lipoxygenase remained at 100% until day 3 when mortality began to occur, slowly at first and then more rapidly from day 7 so that by day 20, 14% remained alive. By day 9, the survival of aphids feeding on the lipoxygenase was 12% lower than control aphids, but from this point the rates of mortality were very similar (5.6% mortality per day for the controls and 5.8% for the experimental group). No significant difference (Logrank X 2 test) was found in the survival of the two groups.
Fig. 27b also shows the cumulative nymph production per replicate of aphids feeding on control and 0.2% lipoxygenase over time. Unlike in the previous assay (above), the control aphid performance was much better, with a good number of nymphs being produced by the replicates. In this instance a lag of two days occurred between the onset of nymph production in the two groups; control aphids started producing between days 8 and 9 whereas nymphs were not produced until between days 10 and 11 on the lipoxygenase. The cumulative number of nymphs per replicate remained consistently lower on the lipoxygenase, due to this lag in commencement. The rate of nymph production was found to be very similar for the two insect groups (approximately 1.3 nymphs produced per replicate per day). The delay in nymph production by the insects feeding on lipoxygenase was not sufficient to create any significant differences (non-parametric Mann-Whitney U test) in the number of nymphs produced by the two groups.
7.1.10 Scoparone and Scopoletin
Scoparone and scopoletin were insoluble in water or ethanol, so were dissolved in acetone before adding to aphid artificial diet to give final concentrations of 10"4 and 10"5 M. Two control sets were also set up, one with the usual control diet feeding sachets and the other was control diet with a 10"4M concentration of acetone. Five replicates for each of the treatments and controls were set up in the usual manner. However, the results of the bioassay are not presented since the aphids, including the controls had high mortality rates, were very small in size and did not produce any nymphs.
140
7.1.11 Thaumatin
This bioassay was set up, with ten replicate chambers for control diet and diet incorporating 0.1% w/v thaumatin. However the results are not shown since the aphid survival on the control diet was poor and no nymphs were produced.
7.2 DISCUSSIONS
7.2.1 Pea lectin
Pea (Pisum sativum) lectin is structurally related to lentil lectin and concanavalin A (the lectin from jackbean, Canavalia enisformis); they all have a high affinity for D-glucose and D-mannose (Lis & Sharon, 1986). Lectin concentrations within the seed have been estimated as approximately 2% of total seed protein at seed maturation (Gatehouse et al., 1986b). Low levels of lectin in the root hairs of pea plants are thought to have an involvement in establishing a connection with the Rhizobmm symbiont (Diaz et al., 1986 & 1989).
From the results presented in section 7.1.1, it would appear that pea lectin, fed to A. solani at a 0.1% w/v concentration does not have any deleterious effects, instead it appears to significantly increase the cumulative number of nymphs produced over a 20 day period. However, the fecundity of the control aphids in this bioassay was low (in previous assays nymph production on the control diet has been a factor of 10 higher), although most replicates did produce nymphs. Thus the fecundity data should be interpretted with caution. Pea lectin incorporated at a 0.1% w/v level in artificial diet has also been reported to have no antimetabolic (Powell et a/., 1993; Powell, 1993) or antifeedant (Powell et al., 1995a) effects against the homopteran, rice brown planthopper, nymphs and adults respectively. These results are in direct contrast to those published by Rahbe et al. (1995) where pea lectin (at a concentration of 250jug/ml) showed a marked toxicity towards the pea aphid, A. pisum. The growth of this aphid was also inhibited by as much as 63% when fed on diet with 250ug/ml pea lectin added, compared to the growth of aphids fed on control diet. Other publications also report a degree of toxicity of pea lectin towards homopteran species. Habibi et al. (1993) demonstrated that the potato leafhopper, Empoasca fabae (Harris), had a significantly reduced survival time when fed on 1.5% pea lectin compared to those insects feeding on control diet. Transgenic tobacco plants engineered with the gene encoding pea lectin have successfully been shown to have some protection against Coleopteran (Gatehouse et al., 1992) and Lepidopteran pests (Boulter et al., 1990).
141
Although the toxic effects of pea lectin against homopteran pests appears to be variable, this lectin does provide enhanced resistance to some insect species. Therefore it could have a potential use in genetic engineering for crop plant protection against insect attack, especially since its toxicity towards mammals is very low (see review by Gatehouse el al., 1992).
7.2.2 Nettle lectin
Although no significant reductions in either survival or fecundity of A. solani were found on 0.1% w/v nettle lectin, a two day delay in nymph production and a slower rate of nymph production were observed. By the end of the trial a fourfold difference in the cumulative number of nymphs per replicate was obvious between the control and nettle lectin-fed aphids. The reduction in fecundity was probably not significant because of the large standard errors caused by a large variation in nymph production between control and lectin replicates; i f nymph production had been more even across the replicates, significant reductions in the fecundity of this aphid species, caused by the nettle lectin, could well have been seen. Varying degrees of insecticidal activity of nettle lectin (UDA), towards honiopteran species, have been reported in the literature; these range from no effect to complete kill . No significant antimetabolic effects (at a 0.1% w/v concentration) were observed (Powell et al., 1995b) against the rice brown planthopper, although the related wheatgerm agglutinin (WGA) showed a significant reduction in the survival of N. lugens nymphs. Rahbe et al. (1995) reported moderately toxic effects of UDA against the pea aphid, A. pisum, where a 250p.g/ml concentration caused a 25% growth inhibition when compared to the control aphids. The concentration causing 50% mortality was estimated at being greater than 500jng/ml (equivalent to 0.05%). In contrast, WGA was found to be inactive against A. pisum. Cole (1994a) showed that a 2.5mg/ml concentration of UDA killed the cabbage aphid, Brevicoryne brassicae, and concentrations ranging from 2.5mg/ml-2.5u,g/ml (following tenfold dilutions) significantly reduced the mean mortality of this aphid after 8 days, compared to the controls.
Although no significant reductions in survival or fecundity were seen against A. solani, it was felt that nettle lectin does have a potential use in providing protection against homopteran pests (due to results reported by Rahbe et al. (1995) and Cole (1994a)), or indeed possibly other insect families. Therefore work commenced to isolate the gene encoding this lectin from the rhizomes of stinging nettle (Urtica dioica) with a view to possibly performing a plant transformation (see Chapter 9).
142
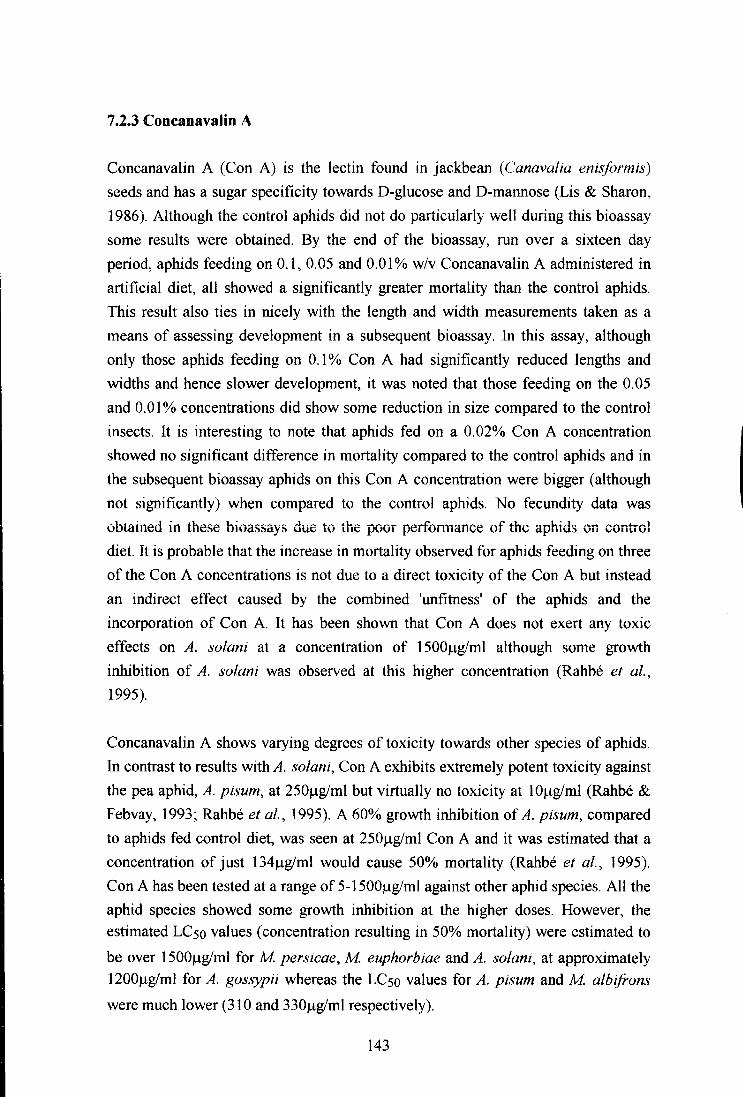
7.2.3 Concanavalin A
Concanavalin A (Con A) is the lectin found in jackbean (Canavalia enisformis)
seeds and has a sugar specificity towards D-glucose and D-mannose (Lis & Sharon,
1986). Although the control aphids did not do particularly well during this bioassay
some results were obtained. By the end of the bioassay, run over a sixteen day
period, aphids feeding on 0.1, 0.05 and 0.01% w/v Concanavalin A administered in
artificial diet, all showed a significantly greater mortality than the control aphids.
This result also ties in nicely with the length and width measurements taken as a
means of assessing development in a subsequent bioassay. In this assay, although
only those aphids feeding on 0.1% Con A had significantly reduced lengths and
widths and hence slower development, it was noted that those feeding on the 0.05
and 0.01% concentrations did show some reduction in size compared to the control
insects. It is interesting to note that aphids fed on a 0.02% Con A concentration
showed no significant difference in mortality compared to the control aphids and in
the subsequent bioassay aphids on this Con A concentration were bigger (although
not significantly) when compared to the control aphids. No fecundity data was
obtained in these bioassays due to the poor performance of the aphids on control
diet. It is probable that the increase in mortality observed for aphids feeding on three
of the Con A concentrations is not due to a direct toxicity of the Con A but instead
an indirect effect caused by the combined 'unfitness' of the aphids and the
incorporation of Con A. It has been shown that Con A does not exert any toxic
effects on A. solani at a concentration of 1500jag/ml although some growth
inhibition of A. solani was observed at this higher concentration (Rahbe et al.,
1995).
Concanavalin A shows varying degrees of toxicity towards other species of aphids.
In contrast to results with A. solani, Con A exhibits extremely potent toxicity against
the pea aphid, A. pisum, at 250u.g/ml but virtually no toxicity at 10)ig/ml (Rahbe &
Febvay, 1993; Rahbe et al., 1995). A 60% growth inhibition of A. pisum, compared
to aphids fed control diet, was seen at 250j^g/ml Con A and it was estimated that a
concentration of just 134j^g/ml would cause 50% mortality (Rahbe et al., 1995).
Con A has been tested at a range of 5-1500|ug/ml against other aphid species. All the
aphid species showed some growth inhibition at the higher doses. However, the
estimated L C 5 0 values (concentration resulting in 50% mortality) were estimated to
be over 1500)Lig/ml for M. persicae, M. euphorbiae and A. solani, at approximately 1200|iig/ml for A. gossypii whereas the LC50 values for A. pisum and M. albifrons
were much lower (310 and 330|iig/ml respectively).
143

Work using M. persicae by Sauvion et al. (1996) suggests some toxicity of Con A against this aphid. At 50u.g/ml Con A started to show deleterious effects on the growth of this aphid. Unlike the other mannose-binding lectins, including GNA, which were tested in this work, aphids fed on 10|ug/ml Con A did not show any significant increase in weight gain. However, after 8 days only a 5% reduction in mortality was seen at a concentration of 1500|ig/ml, the observed reduction in fecundity was also lower than expected. As suggested by Sauvion et al. (1996) these comparisons show that Con A has a less toxic effect towards a polyphagous feeder such as M. persicae. However, against the rice brown planthopper, N. lugens, Con A only showed a marginal effect on survival, despite the fact that this species is extremely restricted in its food source, only feeding on rice.
It is interesting to note that in this dose response assay against A. solani and also reported by Sauvion et al. (1996) for M. persicae, the low lectin concentrations stimulated the growth of the aphids. The mannose-specific lectins tested at a lOjag/ml concentration against M. persicae showed a significant growth stimulation; Con A was the only one to show a growth inhibition at a similar concentration (15ng/ml) (Sauvion et al., 1996). In the case of A. solani, the stimulation caused by a 0.02% concentration of Con A was not significant but no increase in mortality was observed either at this concentration. Stimulatory effects of low lectin concentrations have also been observed with the coleopteran, Callosobruchus maculatus (Gatehouse, A.M.R., unpublished data) and with mammals where low levels of GNA have a probiotic effect with rats (Pusztai et al., 1993a).
7.2.4 Canavalia brasiliensis lectin
Canavalia brasiliensis belongs to the same genera as jackbean (C. enisformis) which contains a lectin (Con A) exhibiting varying degrees of toxicity against several aphid species (see section 7.2.3). Like Con A, C. brasiliensis lectin is found in the seeds and shows a sugar specificity towards D-mannose and D-glucose (Moreira & Cavada, 1984).
From the results obtained from the initial bioassay incorporating 0.1% w/v C. brasiliensis lectin, no significant differences were observed in the survival of the lectin-fed aphids and the control insects, although by the end of the trial survival on the lectin was 10% lower than on the control diet. As seen with many of these protein toxicity trials, initial survival is higher on diet containing incorporated proteins, compared to on control diet. However in contrast to these results, in the
144

dose response assay, by the end of the trial aphids feeding on 0.1% C. brasiliensis lectin had a significantly reduced (by 30%) mortality compared to the control aphids. Aphids feeding on the other concentrations (0.2%, 0.05% and 0.025% w/v) all showed a slightly higher mortality compared to the controls but none of these were significant. To date, so far as I am aware this lectin has not been tested against other species of aphids. However the lectin has been tested against the rice brown planthopper, N. lugens, and proved to significantly reduce the survival of the nymphs within a matter of days (T. Grangiero, unpublished data).
The fecundity data obtained during these bioassays proved to be surprising. In the initial trial when lectin was present in the diet at 0.1% w/v, nymph production was enhanced fourfold compared to control nymph production. Again during the dose response bioassay, nymph production was much higher on all the lectin concentrations with the 0.1% concentration appearing to be the most stimulating in terms of nymph production. Aphids feeding on the 0.2% concentration had a considerably less stimulated fecundity although it was still five times greater than that of the controls. Those feeding on the lower concentrations also had marked increases in nymph production compared to the control aphids. This pattern of lectin effect, to a certain extent mirrors results seen in section 7.2.3 with Con A against A. solani and results by Sauvion et al. (1996) where low lectin concentrations had a stimulatory effect on M. persicae and high concentrations were inhibitory. In this case, the low lectin concentration has less of an enhancing effect while the higher concentrations showed a greater enhancement on aphid fecundity.
In contrast to the results observed against A. solani, nutritional studies using this lectin against rats showed that the lectin had an antinutritional effect (Oliveira et al., 1994). The lectin was incorporated into their diet at a level similar to that found in the C. brasiliensis seeds (20g/kg, equivalent to approximately 2%). This work showed that the lectin did not appear to have any effect on the amount of diet eaten, but rats fed on the lectin weighed less than the control animals and relative faecal dry matter and faecal nitrogen outputs were higher. It was suggested that this was a result of the poor digestability of plant proteins shown by Nielsin et al. (1988), including C. brasiliensis lectin as shown by Oliveira et al. (1994) and possibly due to an overproduction of mucus triggered by indigestible lectins which could reduce the absorption of dietary nutrients (Freed & Buckley, 1978).
145

7.2.5 Cratylia floribunda lectin
In this bioassay no observed differences were seen in the survival of aphids fed on 0.1% w/v C. floribunda lectin compared to those feeding on control diet; thus this lectin does not appear to have a toxic effect against A. solani. No meaningful fecundity data was obtained from this bioassay because the control aphids failed to produce any nymphs. As far as I am aware this is the first instance of this lectin being tested in artificial diets against aphid pests. Grangeiro (unpublished data) tested this lectin against the rice brown planthopper, N. lugens, where a limited toxicity was observed against the developing nymphs.
7.2.6 Ovalbumin
Ovalbumin was tested as a non-toxic protein to ascertain whether the aphids would perform any better on diets containing small amounts of protein. Two bioassays were performed both testing ovalbumin at a 0.1% w/v concentration. No differences were seen in survival over the initial days of the trial but in both cases, by the end of the trial the number of survivors on diet containing ovalbumin was lower (by 10-20%); the 20% reduction in survival proved to be significant. Neither were any significant differences found between the control and ovalbumin-containing diet in terms of aphid fecundity; by the end of the first trial the number of nymphs produced was similar in both groups and in the second slightly more were produced on the ovalbumin. So it would seem from these results that adding ovalbumin to the artificial diet has no beneficial effects on the aphids, indeed i f anything, it appears to slightly decrease their survival over a longterm period.
Powell et al. (1993) showed that ovalbumin and bovine serum albumin (BSA) (both inert proteins) showed no significant effect on the nymphal mortality of the rice brown planthopper. BSA was found to have little effect on the mortality and only a moderate to low growth inhibition on the pea aphid, A. pisum (Rahbe & Febvay, 1993). Finally casein was used as an inactive protein tested against A. pisum and showed no effect on mortality and only a 10% growth inhibition compared to the control aphids (Rahbe et al., 1995). These results show that these three different inert proteins appear to have little effect on the survival, development and fecundity of aphids feeding on artificial diets, and certainly do not enhance their chances of survival and nymph production.
146

7.2.7 Soybean Bowman-Birk Inhibitor
Many plants, animals and microorganisms contain proteins which are able to act as competitive inhibitors of proteolytic enzymes, and are known as proteinase inhibitors (Richardson, 1977). The complete amino acid sequence of soybean Bowman-Birk inhibitor (SBBI) has been identified and the primary structure shown to contain regions of internal homology (repetitive sequences) (Odani & Ikenaka, 1972). These sites contain the active sites responsible for binding to protease enzymes (Richardson, 1977). SBBI is able to inhibit trypsin and chymotrypsin, having two separate reactive sites for independent inhibition of the two enzymes.
The role of plant proteinase inhibitors is as yet unknown but several possibilities have been suggested. These include a defence mechanism against pathogen and insect attack (Richardson, 1977). There is now considerable evidence (Ryan, 1973) that these inhibitors are able to inhibit insect digestive enzymes. Studies testing these inhibitors against enzymes extracted from insect guts or incorporating protease inhibitors into artificial diets fed to insects have shown toxic effects in terms of reduced enzyme activity, increased mortality and inhibition of insect development (Wolfson & Murdock, 1987; Applebaum et al., 1964, Oppert el ai, 1993, Malone et al, 1995; Burgess et al, 1991; Burgess et al, 1994; Hines et al, 1990). The fact that tomato leaves, damaged by the adult Colorado potato beetle, accumulate high levels of inhibitors compared to undamaged leaves (Green & Ryan, 1972) also adds to the evidence.
From the results presented in section 7.1.7 it can be seen that SBBI significantly reduced the number of surviving A. solani compared to the number of aphids on control diet by the end of the trial (day 20). However, this toxic effect did not exert itself immediately, no significant increase in mortality was seen until day 7, just before maturity. No significant differences were seen in the fecundity of A. solani fed on control diet and diet containing 0.1% SBBI. Comparing these results with other work investigating the effect of proteinase inhibitors against homopterans, Rahbe & Febvay (1993) showed that SBBI had little effect on the mortality of the pea aphid, A. pisum, when tested at concentrations up to 250^g/ml. They estimated the concentration at which 50% of the aphids would be dead was over 500|ag/ml. A moderate growth inhibition of A. pisum was observed at a 250|^g/ml concentration compared to the control aphids. Other protease inhibitors tested in their study either produced similar findings or were totally inactive against A. pisum. CpTI has also been tested in artificial diet against A. solani but did not produce any significantly different results compared to the control aphids (Gatehouse, A.M.R., unpublished
147

data). Powell et al., (1993) tested two enzyme inhibitors, cowpea trypsin inhibitor and wheat a-amylase inhibitor against the rice brown planthopper and found that neither of them had any antimetabolic or toxic effects against nymphs of this insect. Cole (1994a), suggested that the survival of the cabbage aphid (Brevicoryne brassicae) was improved by the addition of soybean trypsin inhibitor in diet.
The fact that SBBI or other trypsin inhibitors do not have extremely toxic effects against aphids is not very surprising since most aphids do not possess proteases in their guts, although some do possess peptidases (Srivastava & Auclair, 1963; Rahbe et al., 1995). However, many aphid species do possess amylases so it might be expected that inhibitors of these enzymes could prove toxic to aphids. Transgenic potato plants containing the transgene encoding wheat a-amylase inhibitor however did not show any deleterious effects against A. solani survival or fecundity (see section 3.2.2).
7.2.8 5-Hydroxytryptamine
5-hydroxytryptamine (5-HT) acts as a neurotransmitter and/or a neurohormone in insect nervous systems (Evans, 1980). From the results described in section 7.1.8 it can be seen that all the concentrations of 5-hydroxytryptamine proved to have no effects on either survival or fecundity of A. solani, compared to the control insects. In fact until day 14, aphids feeding on the 5-HT concentrations showed less mortality than the control aphids although this was not significant. This is the only study investigating the effects of 5-HT and its derivatives on aphids. However, studies on other insect orders show that 5-HT and related compounds do have some involvement in insect feeding. 5-HT has been shown to be involved in activating salivary glands in blowflies (Trimmer, 1985). 5-HT may stimulate peristalsis and foregut contraction (Cooper & He, 1994; Huddart & Oldfield, 1982) although the exact opposite has been seen in other insect species (Osborne et al., 1990). Insect neurotransmitters, especially those known to be involved in regulating feeding in herbivorous insects, also exist in plants, sometimes in large quantities (Heinz et al., 1996). Their role is unknown, but they could be involved in plant-insect interactions, for example acting as oviposition stimulants for the swallowtail butterfly, Papilio xuthus (see references within Heinz et al., 1996). The related 5,7-dihydroxytryptamine severely disrupts the feeding behaviour of the blood-sucking bug, Rhodnius prolixus, by interferring with the peripheral serotonergic systems such as the gut and salivary glands (Cook & Orchard, 1993).
148

These compounds could therefore have a potential use in controlling some insect pests. Heinz et al. (1996) suggest that although these compounds may not cause immediate mortality they could have subtle effects since they are able to interfere with normal feeding behaviour of insect pests, in the case of 5-HT derivatives this is due to the involvement in synaptic transmission.
7.2.9 Lipoxygenase
Lipoxygenases are enzymes involved in the hydroperoxidation of polyunsaturated lipids containing cis and c/s-pentadiene structures (Hildebrand et al., 1988). Possible roles of plant lipoxygenases include direct and indirect methods of resistance against insects (Hildebrand et al., 1988). Lipoxygenases have been confirmed to be involved in induced responses, such as the hypersensitive response, against feeding damage caused by insect pests. Mite infestations on soybean cause lipoxygenase levels to increase, resulting in an induced, local and systemic, resistance (Hildebrand et al., 1988). However, Shukle & Murdock (1983) were the first to publish evidence showing that lipoxygenase had a deleterious effect against insects; Manduca sexta larvae showed stunted growth on artificial diet incorporating soybean lipoxygenase.
From the results of this study, it would appear that a 0.1% w/v concentration of lipoxygenase significantly reduces the survival of A. solani, over a 20 day period, compared to aphids feeding on control diet, but a 0.2% w/v concentration does not have any significant effects. A 0.1% lipoxygenase concentration was also shown to result in a significantly greater number of nymphs being produced compared to the controls whilst a 0.2% concentration showed no deleterious or enhancing effects on nymph production. However the enhancement at the 0.1% level is almost certainly due to the poor parthenogenetic reproduction of the control aphids (only 2 out of the 10 replicates produced any nymphs), rather than the lipoxygenase having a stimulatory effect on the aphids. Powell (1993) and Powell et al. (1993) reported strong antimetabolic effects of lipoxygenase against the rice brown planthopper, N. lugens. When third instar nymphs were fed on artificial diet incorporating 0.08% w/v soybean lipoxygenase, all the nymphs were dead after 6 days. However, 0.08% soybean lipoxygenase showed no antimetabolic effects against the green leafhopper, Nephotettix cinciteps (Powell et al., 1993). Soybean lipoxygenase was thought to exert an antifeedant effect on N. lugens, since the amount of honeydew produced by hoppers feeding on the lipoxygenase was significantly reduced compared to the control insects (Powell et al., 1995a). This is in agreement with an observation that A. solani appeared to take longer to settle and start feeding on diet containing
149
lipoxygenase compared to those feeding on control diet. Rahbe & Febvay (1993) reported that the peroxidase from horseradish had no effect on the mortality of the pea aphid, A. pisum.
Several mechanisms of action have been suggested for lipoxygenase in insect resistance. These include direct methods such as the action of lipoxygenase on linolenic acids, present in the diet, producing free radicles which are toxic to some insects (Shukle & Murdoch, 1983) or destroying other dietary components such as carotenoids and sterols (Hildebrand et al., 1988). Lipoxygenases may also be able to destroy the lipid component of cell membranes in the gut (Shukle & Murdoch, 1983) and presumably also the perimicrovillar membrane. Powell et al. (1993) suggested that the lipoxygenase could disrupt the production of the stylet sheath which contains lipoproteins. It has been suggested that lipoxygenase could act against insects by reducing protein digestability and therefore decreasing amino acid availability (discussed in Powell, 1993).
7.2.10 Scoparone and Scopoletin
Scoparone (6,7-dimethoxycoumarin) and scopoletin (6-methoxy-7-hydroxycoumarin) are coumarin phytoalexins which are synthesised de novo by plants, as part of the defence mechanism in response to microbial infection. Both compounds have been shown to inhibit the growth of several plant fungi (Afek & Sztejnberg, 1988; Tal & Robeson, 1986; Ahl Goy et al., 1993). However, due to the extremely poor performance of the control aphids, no reliable data was obtained from the bioassay. Thus no conclusions can be drawn as to the effects of scoparone and scopoletin on the glasshouse potato aphid.
7.2.11 Thaumatin
Thaumatin is a sweet protein isolated from the arils of the West African shrub, Thaumatococcus daniellii (Benth) (Van der Wei & Loeve, 1972). Thaumatin is estimated to be 2000-3000 times sweeter than sucrose on a weight basis and is thought to cause a slight delay in sweetness perception and a lingering sweet aftertaste (Higginbotham, 1981). Thaumatin-like pathogenesis-related (PR) proteins have been found in several plant families (Cusack & Pierpoint, 1988; Bryngelsson & Green, 1989; Pierpoint et al., 1990) and are thought to have antifungal properties (Vigers et al., 1992). Thaumatin has also been shown to have a homology with cereal a-amylase and trypsin inhibitors (Lazaro et al., 1988).
150

No reliable data was obtained from this bioassay, due to the extremely poor performance of the control aphids. It was hoped that thaumatin, incorporated into artificial diet and fed to A. solani would disrupt the normal feeding behaviour of this aphid by interacting with its taste receptors. This in turn could have resulted in growth inhibition and possibly death from starvation. This is to date, as far as I am aware, the only such investigation of the effects of sweet tasting proteins against aphids. However, it has been suggested that thaumatin may have an inhibitory effect against some insect species due to it homology with a maize inhibitor which inactivates an a-amylase found in Tribolium castaneum beetles (Richardson et al., 1987).
151

8. APHID C U L T U R E V A R I A B I L I T Y : R E S U L T S AND DISCUSSION
8.1 Performance of aphids on control diet
A series of bioassays were set up as described in section 2.12.1 to investigate the variability in performance of A. solani on control diet. The initial set of nymphs obtained overnight on artificial diet were used to set up the bioassay Gl /1 . Eight days later, the same adults, used to produce the nymphs, were placed back on artificial diet overnight and the resultant nymphs used to set up bioassay Gl/2. During the eight day interval the adults were fed on potato leaves and the nymphs produced over the first twenty four hours were taken and reared separately from the adults. On maturity these second generation adults were placed on artificial diet overnight and the resultant nymphs used to set up bioassay G2/1. Unfortunately little useful information, in terms of aphid fecundity, was obtained from these assays since no nymphs were produced; the aphids looked unhealthy and stunted. However some survival data (Fig. 28) was obtained, although some of the bioassays were terminated prematurely because of the lack of nymph production. Nymphs produced by the first generation of aphids both on maturity and 8 days later (Gl/1 and Gl/2 assays respectively) generally showed good survival (>90%) over the first 12 days. After this, the rate of mortality increased to approximately 0.26 aphids dying per replicate per day in the Gl/1 bioassay. However nymphs produced by the second generation of adults, used in the G2/1 bioassay, showed poorer survival on the artificial diet with numbers dropping from the start; by day 8, only 88% of the aphids were still alive. These differences were not found to be significant (Logrank yl test).
8.2 Investigating differences within the genome of aphids from the stock culture
The original aphid culture was thought to have been supplied as a clonal population. It was hoped that by performing genomic DNA extractions from individual aphids and using the method of RAPD-PCR, the possibility that the aphid culture was not clonal could be disproved.
Initially, genomic DNA extracts were prepared from six individual newly mature, apterous adults, taken at random from the stock culture of A. solani (described in section 2.12.2). Total DNA concentrations of the extracts were calculated to range from 2.8-3.15|ag/ul RAPD-PCR reactions were set up for each individual extraction (see section 2.12.3), using the reaction volumes and conditions used by De Barro et al. (1995a). Initial reactions included a 2 minute denaturation at 92°C followed by
152

Survival/ replicate
5
G l / l control survival/replicate
Gl/2 control survival/replicate
G2/1 control survival/replicate
i 1 i 1 r 0 5 10 15 20
Days
Fig. 28. Graph showing the survival per replicate of Aulacorthum solani, against time, when feeding on artificial diet in a series of three bioassays. Ten replicates were set up in each series, with five first instar aphids in each replicate at the start of the bioassays. G l / l represents the bioassay set up with nymphs from 1st generation newly mature adults; Gl/2 represents the bioassay set up with nymphs produced by the same 1st generation adults when they were 8 days old; G2/1 represents the bioassay set up using nymphs produced by newly mature 2nd generation adults. Two of the bioassays were terminated prematurely due to the unexpected poor performance on the artificial diets.
153

40 cycles of 1 minute at 92°C, annealing at 35°C for 1 minute and elongation at 72°C for 1 minute, with a final elongation of 6 minutes at 72°C. On completion of the reactions 15u.l aliquots were electrophoresed on 1.5% agarose gels and viewed under UV light; no bands were present in any of the samples. Further reactions were carried out using more concentrated volumes of DNA extracts, a lower annealing temperature (30°C), more concentrated volumes of primer, addition of detergents (DMSO and Tween 20 to final concentrations of 1% and 0.1% respectively), a slightly higher denaturing temperature (94°C) and a longer initial denaturing step (5 minutes), all to no avail. From this it can be concluded that the particular primer used is not a suitable RAPD-PCR primer for the DNA of A. solani.
8.3 Discussion
It is not known why the aphids used in the control variability bioassays failed to produce nymphs. The stock aphid culture, reared in the same incubator the bioassays were performed in, were surviving and reproducing reasonably well on the potato leaves although alate forms were emerging. Perhaps offspring of alate forms are less suited to feeding on artificial diets, as observed for Myzus persicae (Dadd & Mittler, 1966).
During these bioassays some problems with the incubator were experienced, with temperatures fluctuating uncontrollably from a high of 30°C to a low of 16°C, over a three day period. It is possible that these variable environmental conditions, especially coupled with an artificial diet being a less suitable medium for aphids, could have resulted in the poor health and sterility of the aphids. Temperature fluctuations between 16°C and 30°C may have caused an adverse effect. A range of temperatures exist for each aphid species, over which the rate of development increases linearly; at the extremes the aphids are adversely affected and mortality rises (Dixon, 1987). Low temperatures (5°C) increase the pre-reproductive period, decrease reproduction and slow nymphal development of A. solani compared to aphids reared at 20°C (Pozarowska, 1987a). Subsequent work (Pozarowska, 1987b) showed that i f A. solani was acclimatised to lower temperatures (by keeping one generation at 10°C), reproduction and development at 5°C was better than for non-acclimatised individuals, although there were significant differences in clonal variation. So, the fluctuations in the cabinet temperature, with no acclimatisation may have reduced the fecundity of A. solani. Aphids may take several generations to accustomise themselves to changes in rearing conditions (as reported in Dixon, 1987). Unpredictable short-term changes in temperature and food quality can have big effects on survival (Dixon, 1987). A. solani can obviously cope with separate
154

changes, from leaf-feeding to diets or fluctuations in temperature whilst feeding on potato, but together these two changes in rearing may have been too much for them.
A further explanation could be that something was wrong with the artificial diet used, although fresh diet was always made for a new bioassay, following the same procedure. Ascorbic acid, an essential component of aphid artificial diets, rapidly degrades in artifical diets at room temperature (Dadd et al., 1967). Aphids lacking sufficient amounts of ascorbic acid in their diets showed reduced growth which eventually stops completely before reaching maturity (Dadd et al., 1967). Mittler & Kleinjan (1970) suggested that with diets lacking 'minor' nutrients, maternal reserves may be sufficient to allow embryonic development but the post-natal development will depend on exogenous supplies. Thus i f rapid oxidation of ascorbic acid had occurred due to high temperatures while the incubator was fluctuating, levels may have become sufficiently limiting to arrest complete development of the nymphs to adulthood. Nutrient stress can also result in embryo resorption or arrested development (Dixon, 1987; Ward & Dixon, 1982; Leather et al., 1983). Severely nutrient-stressed aphids are less likely to resettle and feed (Leather et al., 1983). Thus after a diet change, when ascorbic acid levels may have been optimal again, the aphids may not have resettled sufficiently well to continue proper development.
I f the 6 test aphid DNA extractions had shared the same RAPD profiles it would have helped to disprove that the aphids were not from the same clone, and more extensive studies could have been performed using a larger number of individuals. It was also hoped that the variability bioassays would show no significant variations in the survival or fecundity of aphids, especially nymphs from newly mature aphids, feeding on control diet. Apart from this, the aim was also to ascertain whether nymphs produced by older adults were less viable. However, it should be noted that this hypothesis cannot be used to explain poor fecundities in some previous trials since in all cases the trial nymphs were produced by newly mature, apterous aphids. The older adults produced noticeably fewer nymphs during the 24 hours on artificial diet, prior to the setting up of the bioassay. It was also expected that nymphs produced by the older adults would be less fit than ones produced by newly mature aphids. The earliest progeny have the greatest influence on population growth (Dixon, 1987). Wyatt & White (1977) suggested that offspring produced in the length of time equivalent of that from birth to the start of reproduction, account for 95% of the intrinsic rate of increase. This implies that the numbers of later progeny are either relatively very small and/or they are less fit.
155

There are a number of reasons why a population thought to be clonal could show such variability, as observed in their performance on artificial diet. Assuming that the population is clonal, it could simply be due to one of the diet components being contaminated, resulting in poor development and nymph production on the diet. Having said this, very often aphids feeding on diet incorporating various test proteins, showed a relatively normal reproduction in terms of numbers of nymphs produced. I f one of the diet components had been contaminated, it would be expected that aphids feeding on both control and experimental diets would have been adversely affected.
A second explanation could be the prolonged culturing of the stock. In natural populations, the primary and overwintering host of A. solani is the foxglove, with aphids migrating off their summer crop (such as potato) in the autumn. Host alternation may be due to the different nutritional qualities supplied by the two hosts (Srivastava, 1987) or may be because of an intrinsic preference for primary and secondary hosts at different seasons (Dixon, 1971). When the original aphids were received they had been reared on aubergine. Thus they were transferred from aubergine to potato and had been reared for two seasons without overwintering on their primary hosts. De Barro et al. (1995b) observed that the survival of aphid clones declined when they were maintained on the same host for a number of generations, suggesting that this was due to accumulated nutritional stresses. A similar process could be occurring within our aphid population. Nutritional stress could have been accumulating in the stocks, but although it was not sufficiently bad to be seen in the stocks, removal onto diet could be enough to make this kind of stress noticeable. The experience of the mother may influence the quality of the offspring (Moussea & Dingle, 1991) such that mothers suffering from a degree of nutritional stress may be likely to produce less viable offspring. This hypothesis would fit in with the observation that aphids fed on control diet with protein added showed a more 'normal' nymph production; the addition of protein either directly or indirectly (such as a contaminant present in the protein sample) could be supplying something which helps to alleviate the nutrient stress.
A third explanation could be due to a form of acclimatisation being seen. Aphids have been observed to perform better on their hosts of origin than on alternate hosts ie. they become acclimatised (De Barro et al., 1995b; McCauley et al., 1990). For example, aphid populations reared on sorghum or corn showed varying degrees of colonisation when subsequently fed on sorghum and corn. Those reared on corn were better able to colonise corn and resistant-sorghum than the sorghum-reared population (McCauley et al., 1990). Thus in the cultured population, i f the potato is
156

assumed to be the host of origin and artificial diet is the alternate host, then the aphids could be expected to do better on potato than the diet. Indeed, this has always been observed to be the case, with the fecundity being much better on potato than diet. I f the stocks were suffering from a degree of nutritional stress, then this would confound these observations so that nymph production on the diet becomes minimal. Alternatively, the stock aphid culture could have become acclimatised to continual rearing on potato, var. desiree, so that they were less able to develop and produce viable nymphs on the artificial diet. Modifications such as physical adjustment (eg a change in salivary enzyme activity) or genetic adaptation could have occurred, as was suggested to have happened by McCauley et al. (1990).
However, the possibility still exists that the culture population was not clonal; it may not have been when first supplied or variability may have been introduced over the two years. The most obvious explanation for a supposedly clonal population not being clonal is contamination of the aphid stocks. However, this is thought to be unlikely since this was the only aphid culture reared in the laboratory. Cultures were reared on detached leaves, making it harder for 'foreign' aphids to be introduced (beacause each leaf was always checked before placing it in the box). Blackman (1979) reported that aphid parthenogenetic clones showed longterm genetic stability in cultured populations, although some variability has been known to occur. This was suggested to result from endomeiotic recombination during parthenogenesis (see references within Blackman, 1971). Electrophoretic clones of M. persicae have been shown to have stable fingerprints over nine generations (Carvalho et al., 1991) and De Barro et al. (1994a) have reported stable DNA profiles of S. avenue clones over 12 generations but did not test any further. Thus Carvalho et al. (1991) concluded that genetic rearrangements during parthenogenesis were rare. However, one of the clones observed by De Barro et al. (1994a) showed a single mutation, occurring somewhere between the 6th and 12th generation (shown as a one-band difference using a multilocus probe). The A. solani stock culture had been reared over many generations (more than 12), hence it is possible that some such mutation has occurred. I f the cultured population was not clonal, the variability in aphid performance on artificial diet can easily be explained. There is considerable evidence for clonal variability in aphid populations (De Barro et al., 1995c; Weber, 1985), including differences in intrinsic rate of increase and time from birth to nymph production (Simon et al., 1991). Thus an introduced clone may be more unsuitable for survival on artificial diet than the original clone. Seasonal changes in clonal frequency have been observed in parthenogenetic animals (Rossi & Menozzi, 1990 & 1992), including aphids (De Barro et al., 1994b) and can be caused by changes in temperature (Rossi & Menozzi, 1990). I f more than one clone was
157

present in the stock culture, then past changes in incubator temperature could have shifted the clonal frequencies, favouring a clone also less suitable to feeding on diet.
158
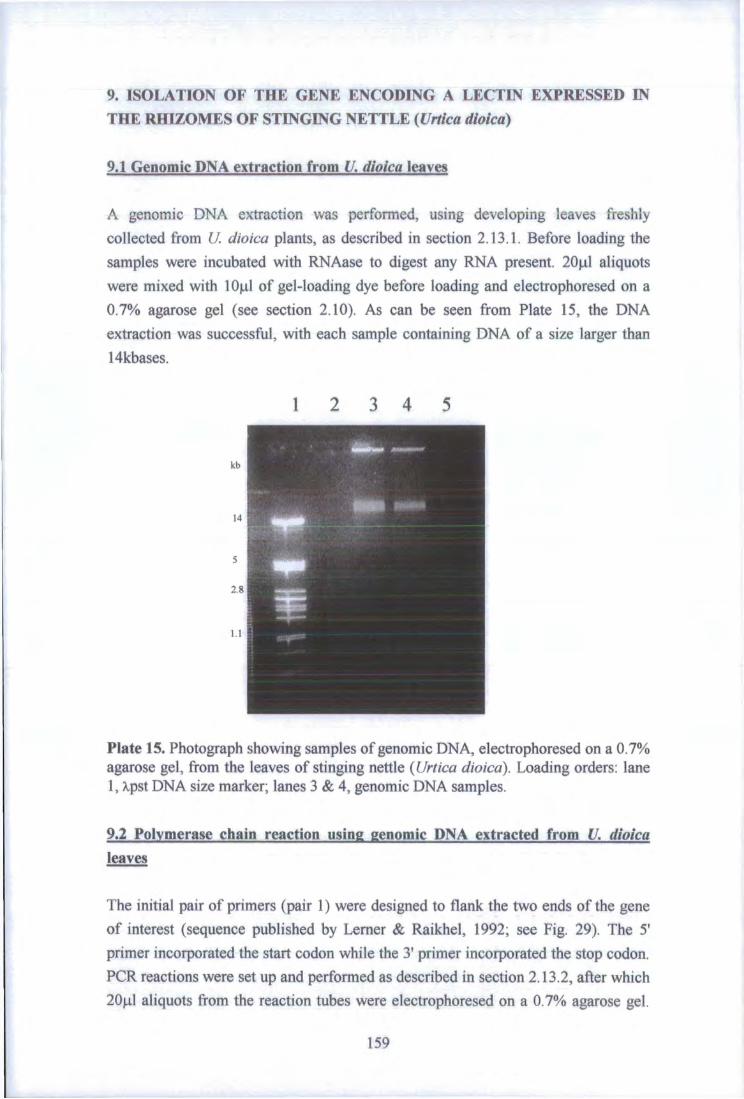
9. ISOLATION OF THE GENE ENCODING A LECTIN EXPRESSED IN THE RHIZOMES OF STINGING NETTLE (Urtica dioica)
9.1 Genomic DNA extraction from U. dioica leaves
A genomic DNA extraction was performed, using developing leaves freshly collected from U. dioica plants, as described in section 2.13.1. Before loading the samples were incubated with RNAase to digest any RNA present. 20ju.l aliquots were mixed with lOul of gel-loading dye before loading and electrophoresed on a 0.7% agarose gel (see section 2.10). As can be seen from Plate 15, the DNA extraction was successful, with each sample containing DNA of a size larger than 14kbases.
1 2 3 4 5
kb
Plate 15. Photograph showing samples of genomic DNA, electrophoresed on a 0.7% agarose gel, from the leaves of stinging nettle {Urtica dioica). Loading orders: lane 1, A.pst DNA size marker; lanes 3 & 4, genomic DNA samples.
9.2 Polymerase chain reaction using genomic DNA extracted from U. dioica leaves
The initial pair of primers (pair 1) were designed to flank the two ends of the gene of interest (sequence published by Lerner & Raikhel, 1992; see Fig. 29). The 5' primer incorporated the start codon while the 3' primer incorporated the stop codon. PCR reactions were set up and performed as described in section 2.13.2, after which 20/j.l aliquots from the reaction tubes were electrophoresed on a 0.7% agarose gel.
159

However, no PCR products were observed. Various changes were made to the reaction conditions outlined in section 2.13.2, in an attempt to produce a PCR product. These included restricting the genomic DNA for 4 hours at 37°C with EcoRl prior to the PCR; altering the M g 2 + concentration in the PCR reaction buffer so that final concentrations ranged between 0.5-4mM; lengthening the annealing times to 2 minutes and lowering the annealing temperature to 45°C. Al l these alterations were to no avail, with no PCR products observed for any of the reactions.
AAT CAT AGT AAG AAA *GAA AAG ATG ATG ATG AGG* TTT TTA "TCT GCC GTA GTG A T C A J G " TCC TCC GCT ATG GCG GTG GGT CTA GTG TCG GCA CAG AGG TGC GGA AGC CAA GGC GGC GGG GGT ACG TGT CCC GCC TTG TGG TGC TGC AGC ATC *"TGG GGC TGG TGC GGC GA***C TCG GAG CCC TAC TGC GGC CGC ACC TGC GAG AAC AAG TGC TGG AGC GGC GAG CGG TCG GAC CAC CGC TGC GGC GCC GCT GTA GGA AAC CCT CCG TGC GGC CAG GAC CGG TGC TGC AGC GTC CAC GGG TGG TGC GGT GGC GGC AAC GAC TAC TGC TCC GGG A"'GC AAA TGC CAG TAC CGC TG*"C TCC TCC TCC GTC CGT GGA CCC CGC GTC GCT CTC AGC GGC AAT TCC ACC GCC AAC TCC ATC GGC AAC GTC GTC GTC ACC GAG CCG CTG TTC GAC CAG ATG TTC TCC CAC CGC AAG GAC TGT CCG AGC CAG GGC TTC TAC AGC TAC CAC TCC TTC CTC GTA GCC GCC GAG TCC TTC CCA GCT TTC GGG ACC ATC GGA GAT GTT GCG ACA CGC AAG AGA GAG GTC GCA GCG TTC CTC GCC CAT ATC TCC CAA GCA ACA TCA GGG GAA AGG TCT GAC GTG GAA AAC CCT CAT GCA TGG GGG CTT TGT CAT ATC AAT ACA ACT ACT GTG ACT GAG AAT GAC TTC TGT ACC TCC TCC GAC TGG CCT TGC GCT GCC GGC AAA AAA TAC AGC CCT CGA GGA CCC ATC CAG CTC ACC CAC AAC TTC AAC TAC GGA CTT GCC GGC CAA GCC ATT GGA GAG GAC CTG ATT CAG AAC CCT GAC TTG GTA GAA AAG GAT CCA ATC ATA TCA TTC AAG ACG GCC TTG TGG TTC TGG ATG TCC CAG CAC GAC AAC AAA CCT TCA TGC CAT GAC ATT GTC CTC AAT GCC AAC TCC GCC GCG AAC AGA ATC CCA AAC AAA GGT GTG ATC GGC AAC ATT ATT AGC CGC GCT TTT GGG CAC GAC GAC TTT GCC GTT AGA TCT TCA AGC ATC GGA TTT "TAC AAG AGG TAC TGC GAC" ATG CTG GGA GTG AGC TAT GGA CAT GAC TTG AAG TAC TGG TTC GAT AAC ACT CCA TCA TCG GAG TTC CAA CGC ATC CAA ATG 'CGT GTT GCG GCG TAA AAC* AAG TAG TCC TCC CCA AGT GGC TCT CTA GTA GTA AGA GTA GCT CTC TCA TAG CGA GAG AGC GGC ATG TTG AAT CCC TGT TAT GCT ATG TAA TAT TAT GTTA CGC ATG TAT GTT AGA AAC ATA TAT GTG TGA TTT TCT AGC TCT TAC GAG TTA TAA ATA AAG TAG CCA CTT TCC T
Fig. 29. Diagram showing the published sequence of the gene encoding the lectin found in stinging nettle rhizomes (Lerner & Raikhel, 1992). The two underlined regions marked with a single asterisk (*) on either side represent the first primer pair (pair 1) used in the PCR reactions performed on the genomic DNA extracts. Primer pair 1 was also initially used in the PCR reactions performed on samples from the cDNA library of stinging nettle rhizomes. The two underlined regions marked with double asterisks (**) on either side represent the second pair of primers (pair 2) used in the PCR reactions performed on the cDNA library template. The two underlined regions marked with triple asterisks (***) on either side represent the third pair of primers (pair 3) used in the PCR reactions performed on the cDNA library template.
160

9.3 RNA extraction from U. dioica rhizomes
An RNA extraction was performed, following the methods described in section 2.13.3, using young rhizomes freshly collected from U. dioica plants. The RNA extractions appeared to be successful with amounts of RNA, calculated using the equation in section 2.13.3, to range from 352.24-737.04u£ depending on the samples. The A260/A28O ratios were calculated to range from 1.73-1.86 indicating that the samples were adequately pure. Spectrophotometric profiles (see Fig. 30), where absorbance was measured from 220-300nm also indicated that the RNA samples were pure. Aliquots of RNA samples were electrophoresed on a formaldehyde gel, following the method described in section 2.11. Total pea RNA was used as a standard. The results (not shown) from the electrophoresis indicated that the RNA samples had not degraded.
Wavelength (nm)
— • •
a i •
! 240 to i : • •
P i t — 1 J : i I r! 4= 1
: 260 --* m
- i — — f — 1
•
• •
: : •I-
• H 280 •
t : -4- E
f •
• •
i 1— -! • !—1
r 300 •
m 1 ! • ' - ft ! 1 i1 1 •
0 16 0.14 0.12 0.10 0.08 0.06
Absorbance
Fig. 30. Spectrophotometric profile showing the absorbance against wavelength (from 220-300nm) of an aliquot from one total RNA sample after the RNA extraction procedure (see section 2.13.3) had been completed.
9.4 Extraction of in RN A from total RNA of U. dioica rhizomes
This was performed using the PolyATtract® mRNA Isolation system from Promega, as described in section 2.13.4. The estimated amount of mRNA obtained was
161

approximately 13(j,g. A spectrophotometric profile between wavelengths of 220-300nm indicated that the mRNA was not degraded and relatively pure (see Fig. 31).
Wavelength (nm)
220 P ^4. i
r t i4 4-T H
1 240 t I If t—i 1 3
.J 260 f r t-) t-J-
t - r
I
280 r r r t -1- r.
H .1 ! t 300
0.014 Absorbance
Fig. 31. Spectrophotometric profile showing the absorbance against wavelength (from 220-300nm) of an aliquot of mRNA after following the mRNA isolation procedure decribed in section 2.13.4.
9.5 cDNA library synthesis using mRNA from U. dioica rhizomes
A cDNA library from U. dioica rhizomes was prepared using the ZAP-cDNA® synthesis kit supplied by Stratagene (see section 2.13.5). Following the kit instructions, ethidium bromide plates were used to quantify the concentration of cDNA produced. This was estimated from Plate 16 as being approximately 50ng/u,l, before ligation into the Uni-ZAP XR vector arms and amplification of the Uni-ZAP XR library.
162
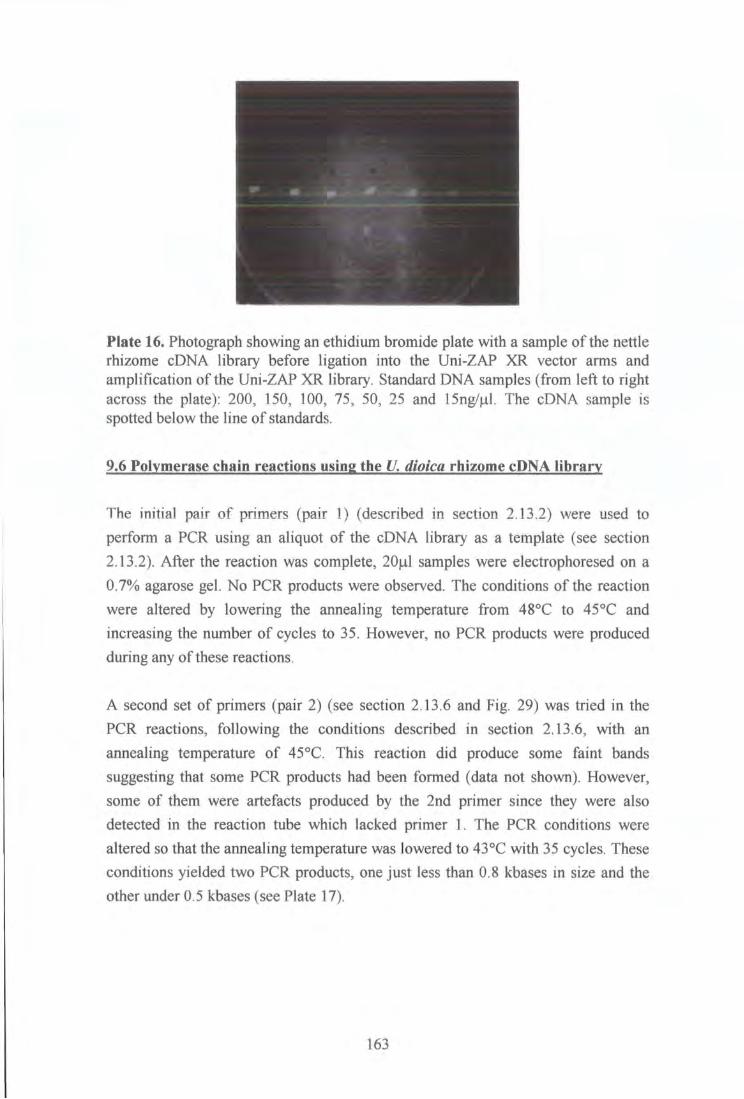
Plate 16. Photograph showing an ethidium bromide plate with a sample of the nettle rhizome cDNA library before ligation into the Uni-ZAP XR vector arms and amplification of the Uni-ZAP XR library. Standard DNA samples (from left to right across the plate): 200, 150, 100, 75, 50, 25 and 15ng/ul. The cDNA sample is spotted below the line of standards.
9.6 Polymerase chain reactions using the U. dioica rhizome cPNA library
The initial pair of primers (pair 1) (described in section 2.13.2) were used to perform a PCR using an aliquot of the cDNA library as a template (see section 2.13.2). After the reaction was complete, 20jnl samples were electrophoresed on a 0.7% agarose gel. No PCR products were observed. The conditions of the reaction were altered by lowering the annealing temperature from 48°C to 45°C and increasing the number of cycles to 35. However, no PCR products were produced during any of these reactions.
A second set of primers (pair 2) (see section 2.13.6 and Fig. 29) was tried in the PCR reactions, following the conditions described in section 2.13.6, with an annealing temperature of 45°C. This reaction did produce some faint bands suggesting that some PCR products had been formed (data not shown). However, some of them were artefacts produced by the 2nd primer since they were also detected in the reaction tube which lacked primer 1. The PCR conditions were altered so that the annealing temperature was lowered to 43 °C with 35 cycles. These conditions yielded two PCR products, one just less than 0.8 kbases in size and the other under 0.5 kbases (see Plate 17).
163

Plate 17. Photograph showing PCR analysis using cDNA library of U. dioica rhizomes as the template and primer pair 2. The PCR products were separated on a 0.7% agarose gel containing ethidium bromide (see section 2.10). Lane 1, Xpst DNA size marker; lane 2, empty; lane 3, aliquot from PCR reaction lacking primer 2; lane 4, aliquot from PCR reaction lacking primer 1; lane 5, aliquot from PCR reaction with both primers present. Two PCR products were generated.
In order to get a sufficient amount of the larger PCR product for sequencing, the product had to be electroeluted, ethanol precipitated and used as a template in a PCR reaction (with an annealing temperature of 43 °C and 35 cycles). The PCR product obtained from this was electroeluted (as in section 2.13.7) and purified for sequencing (as described in section 2.13.8). The purified product was sequenced in both directions and the sequence compared with other published sequences (as described in section 2.13.9). No sequence homology was found with the published sequence for nettle lectin (Lerner & Raikhel, 1992).
A third primer pair (pair 3) (see section 2.13.6) was tried in PCR reactions, following the conditions described in section 2.13.6, with an annealing temperature of 54°C and the addition of 1 ju.1 of enhanced perfect match. After the reaction was complete, samples were electrophoresed on a 0.7% agarose gel. A PCR product was obtained which was approximately 0.2 kbases in size (see Plate 18).
164

Plate 18. Photograph showing PCR analysis using cDNA library of U. dioica rhizomes as the template and primer pair 3. The PCR products were separated on a 0.7% agarose gel containing ethidium bromide (see section 2.10). Lane 1, Xpst DNA size marker; lanes 2-8, aliquots from PCR reaction.
Again, in order to get a sufficient amount of PCR product to sequence, the product was electroeluted, ethanol precipitated and used as a template in a further PCR reaction with an annealing temperature of 54°C. After the reaction was complete, samples were electrophoresed on a 0.7% agarose gel. The product was electroeluted (see section 2.13.7) and purified for sequencing (as described in section 2.13.8) and then sequenced in both directions (see section 2.13.9). The sequence was compared to other published sequences but no sequence homology was found with the published sequence for nettle lectin (Lerner & Raikhel, 1992).
165
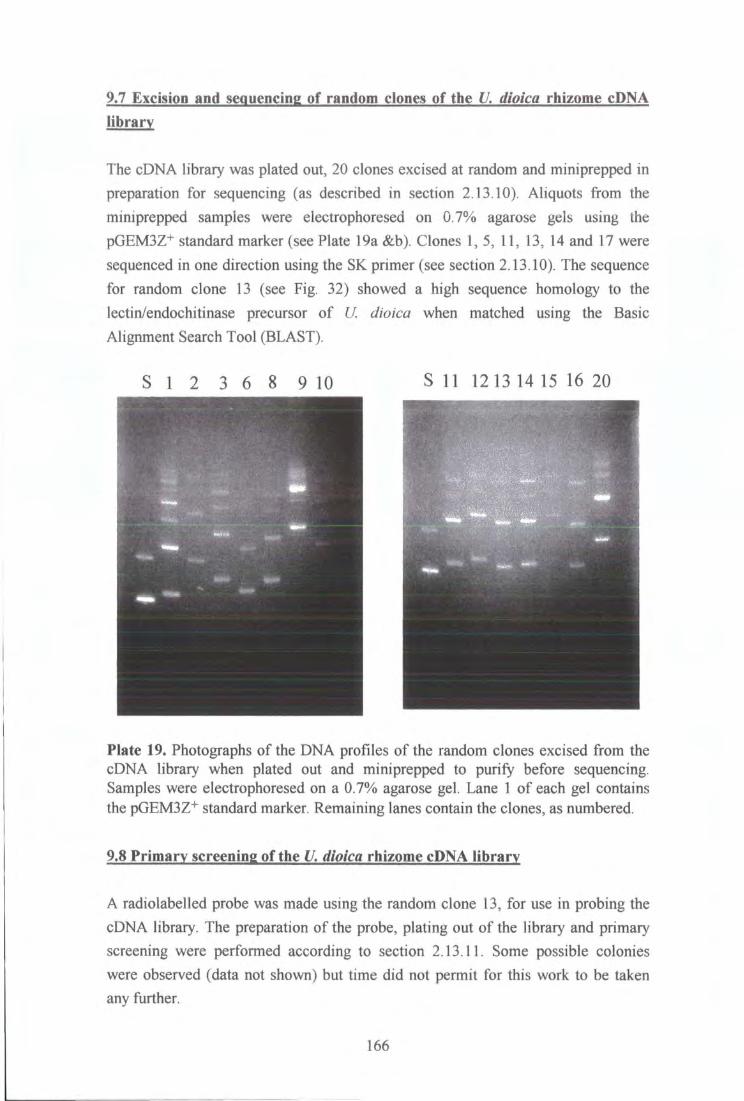
9.7 Excision and sequencing of random clones of the U. dioica rhizome cDNA library
The cDNA library was plated out, 20 clones excised at random and miniprepped in preparation for sequencing (as described in section 2.13.10). Aliquots from the miniprepped samples were electrophoresed on 0.7% agarose gels using the pGEM3Z+ standard marker (see Plate 19a &b). Clones 1, 5, 11, 13, 14 and 17 were sequenced in one direction using the SK primer (see section 2.13.10). The sequence for random clone 13 (see Fig. 32) showed a high sequence homology to the lectin/endochitinase precursor of U. dioica when matched using the Basic Alignment Search Tool (BLAST).
S 11 1213 14 15 16 20
* • ' sirtw ' mm
Plate 19. Photographs of the DNA profiles of the random clones excised from the cDNA library when plated out and miniprepped to purify before sequencing. Samples were electrophoresed on a 0.7% agarose gel. Lane 1 of each gel contains the pGEM3Z + standard marker. Remaining lanes contain the clones, as numbered.
9.8 Primary screening of the U. dioica rhizome cDNA library
A radiolabeled probe was made using the random clone 13, for use in probing the cDNA library. The preparation of the probe, plating out of the library and primary screening were performed according to section 2.13.11. Some possible colonies were observed (data not shown) but time did not permit for this work to be taken any further.
166
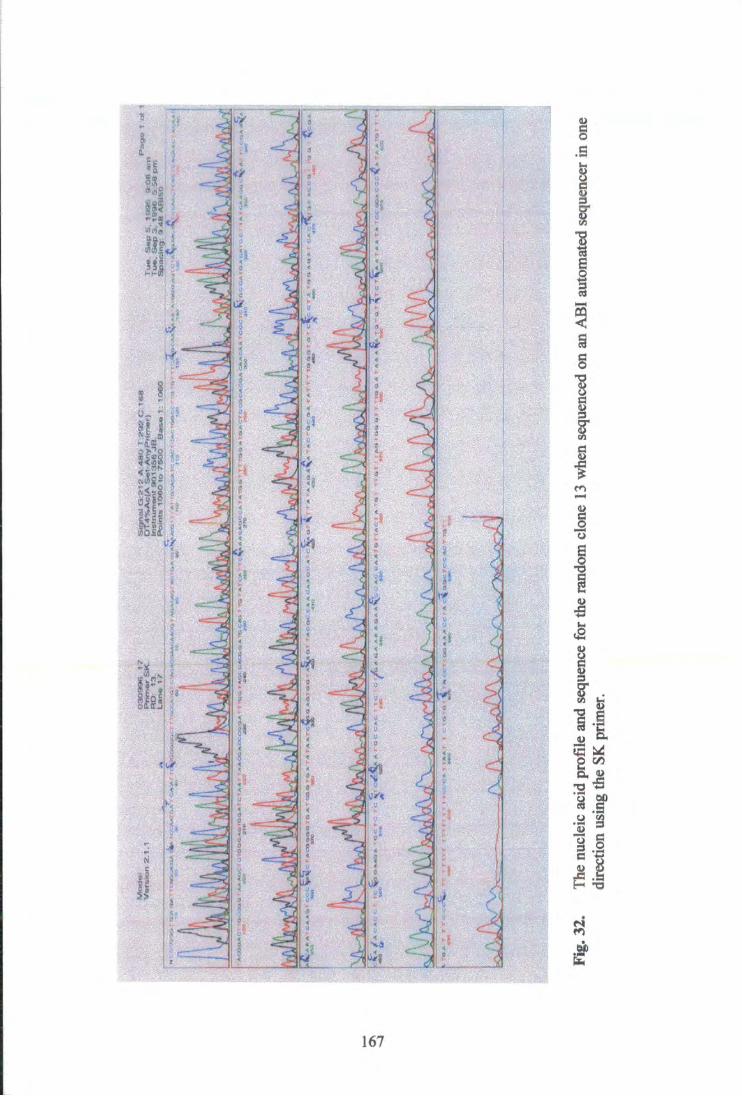
•ft'
i i
-a E
/ NT c/
[fir
1 i r
198 ft/ ..>
3
U
BU v; 1
/
s 3 «J •
<
11/
;
8
r t OWE J
•
m u 2 6 0
m i ! / «
* .3 4 i
3 u
1 / •
en V
167

9.9 Discussion
This work shows that the attempts made to isolate the gene encoding stinging nettle lectin, using the polymerase chain reaction, were unsuccessful. It is not known why the PCR reactions (with 3 different pairs of primers) failed to amplify up the gene of interest. The random excision of colonies from the plated-out cDNA library and subsequent screening of some of the clones, resulted in a colony with a high sequence homology to the lectin/endochitinase precursor published for Urtica dioica. This would therefore suggest that a fault in the cDNA library (eg. the library was not a full length copy) was not the reason why the PCR reactions failed to amplify the nettle lectin gene. After primary library screening using the excised clone with a high homology to the lectin/endochitinase precursor as a probe, some possible positive colonies were observed. This again suggests that the cDNA library template was not the reason why the PCR reactions failed to amplify the lectin gene. However, time did not permit this work to be investigated any further.
168

10. CONCLUDING DISCUSSION
Repetition of results obtained using transgenic plants proved somewhat difficult, especially with plants transformed with the gene encoding GNA. In all the bioassays, except the first clip cage bioassays, when significant reductions in aphid fecundity were seen (see sections 3.2.1 and 5.1.1), the plants used had extremely low expression levels of GNA. This could possibly be explained in two ways, either the plants/leaves used were young and/or the plants were gradually losing their ability to express GNA probably as a result of continual clonal propagation.
GNA expression within transgenic tobacco plants is known to be variable; the highest expression levels are found within the older, mature leaves whereas the lowest expression levels are in the upper developing leaves (Hilder et al., 1995). This would therefore suggest that i f young plants are used, expression levels of GNA within the leaves might be expected to be lower than in plants that are older. This would indeed seem to be the case since the plants used in the first clip cage bioassays (see sections 3.2.1 and 5.1.1) were older than those used in the whole plant bioassays and had higher expression levels of GNA (approximately 0.4%). However, the plants used in the whole plant bioassays (see sections 3.2.3 and 5.1.2) were young and expression levels of GNA were extremely low (<0.1%). The first clip cage assays and the whole plant assays were all performed at a similar point in time, within a couple of months of each other. Therefore there would have been little difference in the number of generations these two sets of plants had passed through during clonal propagation in tissue culture. A l l the GNA-expressing plants used in the other plant bioassays, where significant reductions in aphid fecundity and development were not observed (see sections 3.2.2, 3.2.4 and 5.1.3), were mature.
The bioassays discussed in sections 3.2.2, 3.2.4 and 5.1.3 were all performed at a later point in time (approximately 1 year+ later). The plants used would have gone through several more generations of clonal propagation in tissue culture. Further evidence which backs up the hypothesis that the plants are losing their expression levels through continual tissue culture is seen in the publication by Gatehouse et al. (1996). These authors used the same lines of GNA-expressing plants (PWG85 and PBG47), which came from the same source. However, their work was performed at an earlier date than any of the studies described in this thesis (including the first clip cage trials). Expression levels of GNA were found to be higher (up to 1.5% of total soluble protein) in the plants used by Gatehouse et al. (1996) compared to the levels found in the plants used in these investigations. Plant regeneration in tissue culture
169
can alter the genetic stability of cells resulting in somaclonal variation. Various factors, such as media constituents and duration of culture, can influence somaclonal variation. The choice of tissue used can also be important: somaclonal variation is more likely to occur when disorganised cell masses (eg. callus) are used compared to when pre-existing meristems are used (Webb & Morris, 1992). Although clonal propagation throughout this study was performed using pre-existing meristems, the possibility of somaclonal variation cannot be ruled out.
Great care must be taken that transgenic plants are not going to experience a decrease in expression levels of foreign proteins, over time, in the field, since this would potentially result in plants that showed no enhanced resistance to aphid attack. In fact it could potentially lead to an even worse scenario: stimulation of aphid growth and therefore possibly aphid population buildup. Reports are already available indicating that low concentrations of some mannose-binding lectins, including GNA, have a stimulatory effect on aphid growth; this is so with the peach potato aphid, Myzus persicae (Sauvion et ai, 1996). Limited data regarding the effects of low levels of GNA on the glasshouse potato aphid, A. solani, has been obtained. A concentration of 0.05% w/v, incorporated into artificial diet did significantly increase the fecundity of this aphid compared to the control aphids. However, it should be stressed that the overall control nymph production was much lower in this assay, compared to previous bioassays and the variability between the control replicates was high (only 4 out of the 10 replicates produced any nymphs). Nymph production was also found to be significantly greater on the transgenic potato line GNA2-23, compared to on the control potato plants in the second clip cage bioassay (see section 3.2.2). These plants had an average expression level of approximately 0.24% total soluble protein in their leaves. This is approximately only half of that found in the plants used in the first clip cage bioassay (see section 3.2.1) but double that used in the artificial diet bioassay (section 3.1.1). This would suggest that the expression level of GNA is much lower in the phloem sap than it is in the remaining leaf tissue. This is perhaps to be expected since anything which is secreted into the phloem sap will be translocated around the plant. Lectins produced in other plant tissues, however, are thought to accumulate in the cell vacuoles (Chrispeels & Raikhel, 1991). Although aphids will probably have some contact with lectins sequestered in vacuoles during intracellular penetration (Cole, 1994a), the majority of penetration is intercellular. Aphids therefore bypass accumulating lectins stored in vacuoles in the same way that they avoid a great many toxic secondary plant metabolites, also stored in vacuoles. Probiotic effects of some lectins at low concentrations have been seen in other insects, such as the
170

coleopteran, Callosobruchus maculatus (Gatehouse, A.M.R., unpublished data) and may be beneficial in mammals (Pusztai et al., 1993a).
An important consideration to be taken into account when deciding which foreign proteins to engineer into transgenic plants, is the toxicity of these proteins towards other organisms dependent on the plants. These include man, birds and mammals. Obviously toxic proteins, such as the lectin from Phaseolus vulgaris, cannot be expressed in crop plants produced for human consumption. It is also important that natural insect predators, such as ladybird larvae predating on aphids, are not adversely affected by accumulating levels of foreign protein within the bodies of aphids. A further important group of natural control agents, also playing an important role, are aphid parasitoid wasps. These wasps must be able to develop normally and complete their life cycles within aphids feeding on plants expressing foreign proteins, otherwise they wil l be rendered ineffective in terms of natural control agents. Work looking into these aspects of genetic engineering of crop plants is already underway in various laboratories.
Pollinators, such as bees, must also be considered and investigations are also underway looking into this aspect. Benfey & Chua (1989) reported that the expression of genes under the CaMV 35S promoter was dependent on the tissue and cell type. This promoter was originally thought to be constitutive and is active in many plant tissues, including the anthers, but appears to be inactive in the pollen grains themselves (Mascarenhas & Hamilton, 1992). Therefore the pollen of transgenic plants, where the transgenes are under the control of the CaMV 35S promoter, should be safe for bees. But how about the nectar? Other promoters are being investigated which would direct the target gene expression to the parts of the plant eaten by pests (Gasser & Fraley, 1989). Shi et al. (1994) have already used the rice sucrose synthase promoter and shown that it directs expression specifically to the phloem tissues. GNA was expressed, under the control of this promoter, in the phloem sap of tobacco, since it was detected in the honeydew of aphids feeding on these transgenic plants. Therefore it is likely that transgenic plants can be produced where the expression of the foreign protein is limited to specific tissues, thus minimising the action of these proteins on non-target insects, birds and mammals.
A further important advantage of being able to express the foreign proteins in specific tissues and at specific times of plant development, to correspond with insect attack, is that it helps to minimise the possibility of insect adaptation. Transgenic plants which continually and constitutively express a foreign insecticidal protein are particularly at risk from insect adaptation because insects feeding on the plants are
171
treated with a high dose of toxin, even when they are not causing economic damage (Mallet & Porter, 1992). There are two possible ways of minimising this likelihood. The first way lies in the choice of the gene used in the transformation. Insects are more likely to show rapid adaptation to a toxin which causes high levels of mortality due to the strong selection pressure exerted. Expressed proteins which cause small reductions in the fecundity of a pest species can lead to significant reductions in population buildup, i f the intrinsic rate of increase ( r m value) is lowered as a
consequence; strong selection pressures are thus avoided because high levels of mortality are not seen (Sauvion et ah, 1996). The second strategy for minimising insect adaptation involves ensuring there are regions of untransformed crop acting as an insect refuge. This can be done either by growing stands of untransformed crop alongside the transgenic crop or by using a seed mixture of insect resistant and untransformed plants in the same field (Mallet & Porter, 1992). However, both of these methods have disadvantages. Plant stands of untransformed crop are not beneficial in the short-term to farmers, who are therefore not likely to comply unless legislation exists (Mallet & Porter, 1992) or incentives are offered. I f stands of refuges are to work successfully there must be a complete pesticide ban within them; the only methods of insect control acceptable would be natural biological agents (Mallet & Porter, 1992). Investigations into the seed mixture method have shown that under some circumstances the results are worse than i f no strategy at all was used (ie. field contained pure transgenic crop) (Mallet & Porter, 1992). Seed mixtures would be favoured by farmers but are unlikely to be accepted by the public because it means they lose their right to choose between eating transformed or untransformed crop.
Aphids not only have direct adverse effects on plants but are also responsible for the transmission of a great number of plant viruses. Genetically altering plants may in turn influence the behaviour, physiology or morphology of the aphid vectors, even i f they themselves are not adversely affected or are not the target insect species (Shieh et ah, 1994). Anything which increases the probing activity of aphids could potentially increase the spread of some plant viruses. The probing activity could be influenced directly as a result of the foreign protein. For example, i f something acts as an antifeedant and the aphid spends less time in passive phloem feeding as a result, then the number of probes often increases (Montllor & Tjallingii, 1989; Leszczynski et ah, 1995). Alternatively probing activity could be indirectly affected by changes in amino acid composition, which would also affect aphid fitness (Shieh et ah, 1994). Some aphid species are able to feed better on virus-infected plants than on healthy ones (Montllor & Gildow, 1986).
172

Consideration must also be given to the possibility that aphids might perform better on some transgenic plants, designed to control other insect pests. I f the target pests are successfully controlled and the plants have no deleterious effects on aphids, the aphids could do better simply because they are not competing with other insects for the plant resources. This sort of situation may not be economically advantageous. Just as a natural enemy suitable for controlling a pest in one crop cannot always be successfully used in controlling the same pest in a different crop (Van Steekelenburg, 1992), so a foreign gene inserted into one crop species may not control the same pest as effectively as the same gene inserted into a different crop species.
Engineering plants to express more than one foreign gene is a better strategy than just transferring one gene. Not only might it give additive (Boulter et al., 1990) or synergistic (see section 5.1.1) protection but should also reduce the likelihood of insect resistance developing towards the plants. However, care must be taken when choosing genes intended to work together. For instance, with A. solani, potato plants expressing GNA and bean chitinase appeared to have a synergistic effect on aphid fecundity (section 5.1.1) compared to those expressing GNA only (section 3.2.1). However, i f aphids were to overcome the deleterious effects of GNA, then the crop would probably be no better off than an untransformed crop since potatoes expressing bean chitinase alone do not have any significant effects on the survival or fecundity of A. solani. It would be preferable to use two genes together which are known to significantly reduce insect survival and/or fecundity on an individual basis. Double constructs which successfully control one insect pest may not affect, or could even stimulate another insect pest. This would appear to be the case with the double construct encoding GNA and bean chitinase. Although it seems this construct could potentially control A. solani effectively, it does not work so well against lepidopteran species, with larvae devouring more of these plants than plants expressing GNA alone (Gatehouse et al., 1997).
So far few proteins have shown potential for use in the control of homopteran sap-sucking insects. Of those that have been investigated in various studies (Habibi et al., 1993; Powell et al., 1993, 1995a & 1995b; Rahbe & Febvay, 1993; Cole, 1994a; Rahbe et al., 1995; Hilder et al., 1995; Sauvion et al., 1996; Gatehouse et al., 1996; Down et al., 1996), it is the lectins which probably have the most potential in homopteran control. It is a well known fact that due to the phloem sap diet of homopteran insects, they possess little in the way of digestive enzymes. Many aphids do not possess proteases, although some do have endopeptidases in their guts (Srivastava & Auclair, 1963). Most also have some form of amylase (Srivastava,
173
1987). Therefore it is not that surprising that few enzyme inhibitors have been found which are toxic towards this group of insects. Because aphids have few enzymes within their digestive tract they are less likely than other insect orders to overcome the toxicity of inhibitors by overproducing or switching production to another enzyme (Rahbe et al, 1995). Another interesting observation is that some proteases have been shown to be toxic to aphids, when incorporated into artificial diets. This was presumed to be due to the fact that aphids have lost the peritrophic membrane which protects the alimentary canal from protease attack in other insects (Rahbe & Febvay, 1993). These same authors also suggest that antibiotic polypeptides active against the bacterial endosymbiont, Buchnera aphidicola, may have potential in engineered crop plants since aposymbiotic aphids are only viable in their first generation due to complete sterility (Douglas, 1989). A further possibility would be to engineer crop plants so that they can produce an enzyme which would then enable them to complete a pathway leading to a toxic secondary metabolite. This was the idea behind the artificial diet bioassays incorporating scopoletin and scoparone (see section 7.1.10). Scopoletin is present in potatoes, therefore it is unlikely to be toxic to aphids feeding on potato. However potato plants lack the enzyme which can methylate scopoletin to scoparone. I f scoparone proves to be toxic to aphids, the enzyme responsible for the methylation could potentially be used in crop protection via transgenic plants. However, research of this kind involving homopterans is relatively recent, with past work mainly concentrating on other insect orders. There is therefore still the possibility that many more effective proteins which are toxic to homopterans will be found.
At present the mechanism of lectin action in insects is unknown although several suggestions have been proposed. Heusing et al. (1991a & 1991b) suggested that the varying degrees of lectin toxicity of the GlcNAc-binding lectins was related to molecular size and the binding site number. However, other workers have disagreed. Powell et al. (1993 & 1995b) suggested that lectins must have specific mechanisms of action against certain insect groups, since not all lectins with the same sugar specificity are toxic to any one insect. Sauvion et al. (1996) explained observed differences in antimetabolic effects of related mannose-binding lectins as being due to the degree of affinity to mannose-binding oligosaccharides.
It has been suggested that lectins act as antifeedants, at least in the short-term (Powell et al., 1995a; Cole, 1994a). Antifeedant effects could be due to disrupted phagostimulation, although proteins have not been implemented in having phagostimulatory properties (Rahbe & Febvay, 1993). An alternative effect would be lectin binding and disruption of chemoreceptor sites involved in diet recognition
174
(Powell et al., 1995a; Eisemann et al., 1994). Cole (1994a) suggested that low concentrations of certain lectins act as antifeedants whereas higher concentrations are toxic. Several reports have been published showing that lectins are able to bind to midgut cells of the insect gut epithelium (Powell, 1993; Sauvion, 1995; Gatehouse et al., 1984; Eisemann et al., 1994) and possibly cause some blockage of the peritrophic membrane (Eisemann et al., 1994). However, disruptions of these midgut cells are not always seen in insects, so it is still unknown as to how the binding of lectin disrupts normal gut functioning. Studies have shown that intact protein can be transported across the midgut epithelium in insects (Allingham et al., 1992) and evidence supports this case in some of the studies on gut-lectin interactions (Gatehouse et al., 1984; Sauvion, 1995; chapter 6 of this thesis). Lectins may also disrupt normal gut functioning by binding to enzymes, as has been suggested by Powell et al. (1993) and Peumans & Van Damme, 1995. Lectins have already been shown to inhibit various digestive enzymes, such as sucrase, maltase and leucine aminopeptidase (Higuchi et al., 1984). Oliveira et al. (1994) also suggest that lectins may interfere with carbohydrate utilisation and with protein digestion and transport by inhibiting endo- and di-peptidases and Eisemann et al. (1994) suggested they could act by reducing diet uptake.
Whatever form transgenic plants take in terms of the choice of foreign genes used, the most likely way of successful insect control is not in the use of transgenic plants alone, but lies in an integrated pest management scheme which includes the use of transgenic plants. The more strategies that are used for the control of a particular pest species at any one time, the more likely it is that pest populations wil l be kept under check. However, great care must be taken in designing these strategies otherwise they could backfire. Ladybirds are a major group of aphidophagous arthropods (Evans, 1991), They are normally found at aphid outbreaks (Elliot & Kieckhefer, 1990) and often keep aphid populations at low densities. However, it is known that the presence of more than one species of predator can reduce the effectiveness of biological control due to disturbance of the aphids (Evans, 1991). Therefore i f a transgenic plant interferes with the normal behaviour of an aphid, for example making it more unsettled so that it spends less time feeding and more time walking about and probing, this could in turn reduce the effectiveness of biological control programmes involving predators in use at the same time, but could increase the effectiveness of fungal pathogens. Interactions between a natural enemy and the target pest can depend on a density-dependence factor for successful biological control (Stiling, 1987). Therefore the use of transgenic plants reducing the density of the pest species could potentially disturb density-dependent attack by the biological control predators. A similar situation could arise with the combined use of
175

transgenic crop plants and parasitoids, such as the parasitoid wasps of aphids. The transgenic plants may only kill aphids already infected with the parasites and doomed to die in this manner. This would result in the unparasitised aphids surviving and the parasitoid wasp numbers declining because they are unable to complete their life cycles.
Thus, the use of transgenic crop plants expressing foreign plant proteins has great potential in the battle of protecting crops against aphid attack. The lectin from snowdrop (GNA) has great potential in controlling at least two potato feeding aphids ( M persicae and A. solani) even though it does not show severe toxic effects. Indeed it is likely that proteins such as this, which result in reductions in aphid fecundity, will make better candidates for aphid control than highly toxic proteins. However, investigations into aphid control using this strategy are very recent. Many considerations have to be taken into account and many questions still have to be answered before aphid-resistant transgenic crops wil l be seen in the field.
176

11. B I B L I O G R A P H Y
Adams, J.B. and McAllan, J.W. (1958) Pectinase in certain insects. Canadian Journal of Zoology 36, 305-308.
Adams, J.B. and Drew, M.E. (1965) A cellulose-hydrolysing factor in aphid saliva. Canadian Journal of Zoology 43, 489-496.
Afek, U. and Sztejnberg, A. (1988) Accumulation of scoparone, a phytoalexin associated with resistance of citrus to Phytophthora citrophthora. Phytopathology 78, 1678-1682.
AM Goy, P., Signer, H., Reist, R., Aichholz, R., Blum, W., Schmidt, E. and Kessmann, H. (1993) Accumulation of scopoletin is associated with the high disease resistance of the hybrid Nicotiana glutinosa x Nicotiana debneyi. Planta 191, 200-206.
Akey, D.H. and Beck, S.D. (1972) Nutrition of the pea aphid, Acyrothosiphon pisum: requirements for trace metals, sulphur and cholesterol. Journal of Insect Physiology 18, 1901-1914.
Akey, D.H. and Beck, S.D. (1975) Programmable automated system for continuous rearing of the pea aphid, Acyrthosiphon pisum, on holidic diets. Entomologia Experimentalis et Applicata 18, 1-16.
Allingham, P.G., Kerlin, R.L., Tellam, R.L., Briscoe, S.J. and Standfast, H.A. (1992) Passage of host immunoglobulin across the mid-gut epithelium into the haemolymph of blood-fed buffalo flies, Haematobia irritans exigua. Journal of Insect Physiology 38, 9-17.
Altabella, T. and Chrispeels, M.J. (1990) Tobacco plants transformed with the bean ocai gene express an inhibitor of insect a-amylase in their seeds. Plant Physiology 93, 805-810.
An, G., Watson, B.D. and Chiang, C.C. (1986) Transformation of tobacco, tomato, potato and Arabidopsis thaliana using binary Ti vector system. Plant Physiology 81, 301-305.
Anuratha, C.S., Zen, K.C., Cole, K.C., Mew, T. and Muthukrishnan, S. (1996) Induction of chitinases and p-l,3-glucanases in Rhizoctonia so/ara-infected rice plants: isolation of an infection-related chitinase cDNA clone. Physiologia Plantarum 97, 39-46.
Applebaum, S.W., Birk, Y. , Harpaz, I . and Bondai, A. (1964) Comparative studies on proteolytic enzymes of Tenebrio molitor L. Comparative Biochemistry and Physiology 11, 85-103.
177
Argandona, V.H., Luza, J.G., Niemeyer, H.M. and Corcuera, L.J. (1980) Role of hydroxamic acids in the resistance of cereals to aphids. Phytochemistry 19, 1665-1668.
Argandona, V.H., Niemeyer, H.M. and Corcuera, L.J. (1981) Effect of content and distribution of hydroxamic acids in wheat on infestation by the aphid Schizaphis graminum. Phytochemistry 20, 673-676.
Argandona, V.H., Corcuera, L.J., Niemeyer, H.M. and Campbell, B.C. (1983) Toxicity and feeding deterrency of hydroxamic acids from gramineae in synthetic diets against the greenbug, Schizaphis graminum. Entomologia Experimental et Applicata 34, 134-138.
Auclair, J.L. (1963) Aphid feeding and nutrition. Annual Review of Entomology 8, 439-490.
Balzarini, J., Neyts, J., Schols, D., Hosoya, M. , Van Damme, E., Peumans, W. and De Clercq, E. (1992) The mannose-specific plant lectins from Cymbidium hybrid and Epipactis helleborine and the (N-acetylglucosamine)n-specific plant lectin from Urtica dioica are potent and selective inhibitors of human immunodeficiency virus and cytomegalovirus replication in vitro. Antiviral Research 18, 191-207.
Barbieri, L. , Batelli, G.B. and Stirpe, F. (1993) Ribosome-inactivating proteins from plants. Biochimia et Biophysica Acta 1154, 237-282.
Barkai-Golan, R., Mirelman, D. and Sharon, N. (1978) Studies on growth inhibition by lectins of Penicillia and Aspergilli. Archives of Microbiology 116, 119-124.
Barlow, C.A. and Randolph, P.A. (1978) Quality and quantity of plant sap available to the pea aphid. Annals of the Entomological Society of America 71, 46-48.
Barton, K.A., Whiteley, H.R. and Yang, N.S. (1987) Bacillus thuringiensis 8-endotoxin expressed in transgenic Nicotiana tabacum provides resistance to lepidopteran insects. Plant Physiology 85, 1103-1109.
Basky, Z. and Raccah, B. (1990) Aphids colonising peppers in Hungary and their importance as virus vectors. Acta Phytopathologica et Entomologica Hungarica 25 (1-4), 383-391.
Begbie, R. and King, T.P. (1985) The interaction of dietary lectin with porcine small intestine and the production of lectin-specific antibodies. In Lectins, Vol IV, ed. T.C. Bog-Hansen & J. Breborowicz. Walter de Gruyter & Co., Berlin, pp 15-17.
Beintema, J.J. and Peumans, W.J. (1992) The primary structure of stinging nettle (Urtica dioica) agglutinin: A two-domain member of the hevein family. FEBS Letters 299 (2), 131-134.
178
Benfey, P.N. and Chua, N. (1989) Regulated genes in transgenic plants. Science 244, 174-181.
Benhamu, N. , Broglie, K., Broglie, R. and Chet, I . (1993) Antifungal effect of bean endochitinase on Rhizoctonia solani: ultrastructural changes and cytochemical aspects of chitin breakdown. Canadian Journal of Microbiology 39, 318-328.
Birch, N. and Wratten, S.D. (1984) Patterns of aphid resistance in the genus Vicia. Annals of Applied Biology 104, 327-338.
Birk, Y., Gertler, A. and Khalef, S. (1963) Separation of a Tribolium-protease inhibitor from soybeans on a calcium phosphate column. Biochimia et Biophysica Acta 67, 326-328.
Blackman, R.L. (1971) Variation in the photoperiodic response within natural populations of Myzus persicae (Sulz.). Bulletin of Entomological Research 60, 533-546.
Blackman, R.L. (1979) Stability and variation in aphid clonal lineages. Biological Journal of the Linnean Society 11, 259-277.
Bloch Jr, C. and Richardson, M . (1991) A new family of small (5kDa) protein inhibitors of insect a-amylases from seeds of sorghum {Sorghum bicolor (L.) Moench) have sequence homologies with wheat y-purothionins. FEBS Letters 279 (1), 101-104.
Bohlool, B.B. and Schmidt, E.L. (1974) Lectins: a possible basis for specificity in the Rhizobium-legume root nodule sybiosis. Science 185, 269-271.
Boiler, T., Gehri, A., Mauch, F. and Vogeli, U. (1983) Chitinase in bean leaves: induction by ethylene, purification, properties and possible function. Planta 157, 22-31.
Boulter, D. (1989) Genetic Engineering of plants for insect resistance. Outlook on Agriculture 18 (1), 2-6.
Boulter, D., Edwards, G.A., Gatehouse, A.M.R., Gatehouse, J.A. and Hilder, V.A. (1990) Additive protective effects of incorporating two different higher plant derived insect resistant genes in transgenic tobacco plants. Crop Protection 9, 351-354.
Bradford, M . (1976) A rapid and sensitive method for the quantification of microgram quantities of protein using the principle of dye-binding. Analytical Biochemistry 72, 248-254.
Brambl, R. and Gade, W. (1985) Plant seed lectins disrupt growth of germinating fungal spores. Physiologia Plantarum 64,402-408.
179

Broadway, R.M. and Duffey, S.S. (1986) Plant proteinase inhibitors: mechanism of action and effect on the growth and digestive physiology of larval Heliothis zea and Spodoptera exiqua. Journal of Insect Physiology 32 (10), 827-833.
Broekaert, W.F. and Peumans, W.J. (1988) Pectic polysaccharides elicit chitinase accumulation in tobacco. Physiologia Plantarum 74, 740-744.
Broekaert, W.F., Van Parijs, J., Leyns, F.,J oos, H. and Peumans, W.J. (1989) A chitin binding lectin from stinging nettle rhizomes with antifungal properties. Science 245, 1100-1102.
Broekaert, W.F., Marien, W., Terras, F.R.G., De Bolle, M.F.C., Proost, P., Van Damme, J., Dillen, L. , Claeys, M. , Rees, S.B., Vanderleyden, J. and Cammue, B . P.A. (1992) Antimicrobial peptides from Amaranthus caudatus seeds with sequence homology to the cysteine/glycine-rich domain of chitin-binding proteins. Biochemistry 31, 4308-4314.
Broglie, K.E., Gaynor, J.J. and Broglie, R.M. (1986) Ethylene-regulated gene expression: molecular cloning of the genes encoding an endochitinase from Phaseolus vulgaris. Proceedings of the National Academy of Sciences (USA) 83, 6820-6824.
Broglie, K.M., Biddle, P., Cressman, R. and Broglie, R. (1989) Functional analysis of DNA sequences responsible for ethylene regulation of a bean chitinase gene in transgenic tobacco. The Plant Cell 1, 599-607.
Broglie, K., Chet, I . , Holliday, M. , Cressman, R., Biddle, P., Knowlton, S., Mauvais, C.J. and Broglie, R. (1991) Transgenic plants with enhanced resistance to the fungal pathogen Rhizoctonia solani. Science 254, 1194-1197.
Bryngelsson, T. and Green, B. (1989) Characterisation of a pathogenesis-related, thaumatin-like protein isolated from barley challenged with an incompatible race of mildew. Physiological and Molecular Plant Pathology 35,45-52.
Burgess, E.P.J., Stevens, P.S., Keen, G.K., Laing, W.A. and Christeller, J.T. (1991) Effects of protease inhibitors and dietary protein level on the black field cricket Teleogryllus commodus. Entomologia Experimentalis et Applicata 61, 123-130.
Burgess, E.P.J., Main, C.A., Stevens, P.S., Christeller, J.T. and Gatehouse, A.M.R. (1994) Effects of protease inhibitor concentration and combinations on the survival, growth and gut enzyme activities of the black field cricket, Teleogryllus commodus. Journal of Insect Physiology 40 (9), 803-811.
Callaghan, A. (1991) Insecticide resistance: mechanisms and detection methods. Science Progress Edinburgh 75, 423-438.
Campbell, B.C. and Nes, W.D. (1983) A reappraisal of sterol biosynthesis and metabolism in aphids. Journal of Insect Physiology 29, 149-156.
180

Campbell, B.C. and Dreyer, D.L. (1985) Host-plant resistance of sorghum differential hydrolysis of sorghum pectic substances by polysaccharases of green bug biotypes (Schizaphis graminum, Homoptera: Aphididae). Archives of Insect Biovhemistry and Physiology 2, 203-216.
Carvalho, G.R., Maclean, N., Wratten, S.D., Carter, R.E. and Thurston, J.P. (1991) Differentiation of aphid clones using DNA fingerprints from individual aphids. Proceedings of the Royal Society of London B243, 109-114.
Chrispeels, M.J. and Raikhel, N.V. (1991) Lectins, lectin genes, and their role in plant defense. The Plant Cell 3, 1-9.
Christeller, J.T. and Shaw, B.D. (1989) The interaction of a range of serine proteinase inhibitors with bovine trypsin and Costelytra zealandica trypsin. Insect Biochemistry 19, 233-241.
Cole, R.A., Riggall, W. and Morgan, A. (1993) Electronically monitored feeding behaviour of the lettuce root aphid (Pemphigus bursarius) on resistant and susceptible lettuce varieties. Entomologia Experimentalis et Applicata 68, 179-185.
Cole, R.A. (1994a) Isolation of a chitin-binding lectin, with insecticidal activity in chemically-defined synthetic diets, from two wild brassica species with resistance to cabbage aphid Brevicoryne brassicae. Entomologia Experimentalis et Applicata 72, 181-187.
Cole, R.A. (1994b) Locating a resistance mechanism to the cabbage aphid in two wild Brassicas. Entomologia Experimentalis et Applicata 71, 23-31.
Collinge, D.B., Kragh, K.M. , Mikkelsen, J.D., Nielsen, K.K., Rasmussen, U. and Vad, K. (1993) Plant Chitinases. The Plant Journal 3 (1), 31-40.
Cook, H. and Orchard, I . (1993) The short term effects of 5,7-dihydroxytryptamine on peripheral serotonin stores in Rhodnius prolixus and their long-term recovery. Insect Biochemistry and Molecular Biology 23 (8), 895-904.
Cooper, P.D. and He, P. (1994) Control of foregut contraction in the black field cricket, Teleogryllus commodus Walker (Gryllidae, Orthoptera). Journal of Insect Physiology 40 (6), 475-481.
Cusack, M. and Pierpoint, W.S. (1988) Similarities between sweet protein thaumatin and a pathogenesis-related protein from tobacco. Phytochemistry 27 (12), 3817-3821.
Czapla, T.H. and Lang, B.A. (1990) Effect of plant lectins on the larval development of European corn borer (Lepidoptera: Pyralidae) and southern corn rootworm (Coleoptera: Chrysomelidae). Journal of Economic Entomology 83, 6, 280-285.
181
Dadd, R.H. and Mittler, T.E. (1966) Permanent culture of an aphid on a totally synthetic diet. Experientia 22, 832-833.
Dadd, R.H., Krieger, D.L. and Mittler, T.E. (1967) Studies on the artificial feeding of the aphid Myzus persicae (Sulz.) TV Requirements for water-soluble vitamins and ascorbic acid. Journal of Insect Physiology 13, 249-272.
Damsteegt, V.D. and Hewings, A.D. (1987) Relationships between Aulacorthum solani and soybean dwarf virus: effect of temperature on transmission. Phytopathology 11 (3), 515-518.
Damsteegt, V.D. and Voegtlin, D.J. (1990) Morphological and biological variation among populations of Aulacorthum solani (Homoptera: Aphididae), the vector of soybean dwarf virus. Annals of the Entomological Society of America 83 (5), 949-955.
De Barro, P., Sherratt, T., Wratten, S. and Maclean, N. (1994a) DNA fingerprinting of cereal aphids using (GATA)4. European Journal of Entomology 91, 109-114.
De Barro, P.J., Sherratt, T.N., Carvalho, G.R., Nicol, D., Lyengar, A. and Maclean, N. (1994b) An analysis of secondary spread by putative clones of Sitobion avenae within a Hampshire wheat field using the multilocus (GATA)4 probe. Insect Molecular Biology 3 (4), 253-260.
De Barro, P.J., Sherratt, T.N., Brookes, CP., David, O. and Maclean, N . (1995a) Spatial and temporal genetic variation in British field populations of the grain aphid Sitobion avenae (F.) (Hemiptera: Aphididae) studied using RAPD-PCR. Proceedings for the Royal Society of London B262, 321-327.
De Barro, P.J., Sherratt, T.N., David, O. and Maclean, N . (1995b) An investigation of the differential performance of clones of the aphid Sitobion avenae on two host species. Oecologia 104, 379-385.
De Barro, P.J., Sherratt, T.N., Carvalho, G.R., Nicol, D., Iyengar, A. and Maclean, N . (1995c) Geographic and microgeographic genetic differentiation in two aphid species over southern England using the multilocus (GATA)4 probe. Molecular Ecology 4, 375-382.
De Jong, A.J., Cordewener, J., lo Sciavo, F., Terzi, M. , Vandekerckhove, J., Van Kammen, A. and de Vries, S. (1992) A carrot somatic embryo mutant is rescued by chitinase. Plant Cell 4, 425-433.
De la Pena, A., Lorz, H. and Schell, J. (1987) Transgenic rye plants obtained by injecting DNA into young floral tillers. Nature 325, 274-276.
Deponte, R., Parlamenti, R., Petrucci, T., Silano, V. and Tomasi, M . (1976) Albumin a-amylase inhibitor families from wheat flour. Cereal Chemistry 53, 805-820.
182

Devonshire, A.L. (1989) Insecticide resistance in Myzus persicae; from field to gene and back again. Pesticide Science 26, 375-382.
Devonshire, A.L. and Field, L .M. (1991) Gene amplification and insecticide resistance. Annual Review of Entomology 36, 1-23.
Diaz, C.L., van Spronsen, P.C., Bakhuisen, R., Logman. G.L., Lugtenberg, E.J. and Kijne, J.W. (1986) Correlation between infection of Rhizobium leguminosarum and lectin on the surface of Pisum sativum L. roots. Planta 168, 350-359.
Diaz, C , Melchers, L.S., Hooykaas, P.J.J., Lugtenberg, B.J.J, and Kijne, J.W. (1989) Root lectin as a determinant of host-plant specificity in the Rhizobium-legume symbiosis. Nature 338, 579-581.
Dixon, A.F.G. (1971) The life cycle and host preference of the bird cherry-oat aphid, Rhopalosiphum padi L. and their bearing on the theories of host alternation in aphids. Annals of Applied Biology 68, 135-147.
Dixon, A.F.G. (1973) Biology of Aphids. Edward Arnold Ltd, London.
Dixon, A.F.G. (1987) Parthenogenetic reproduction and the rate of increase in aphids. Aphids, their biology, natural enemies and control, ed. L.A.K. Minks and P. Harrewijn. Elsevier, Amsterdam, pp. 269-287.
Douglas, A.E. (1989) Mycetocyte symbiosis in insects. Biological Reviews of the Cambridge Philosophical Society 64,409-434.
Down, R.E., Gatehouse, A.M.R., Hamilton, W.D.O. and Gatehouse, J.A. (1996) Snowdrop lectin inhibits development and decreases fecundity of the glasshouse potato aphid (Aulacorthum solani) when administered in vitro and via transgenic plants both in laboratory and glasshouse trials. Journal of Insect Physiology 42 (11-12), 1035-1045.
Dreyer, D.L. and Campbell, B.C. (1983) Association of the degree of methylation of intercellular pectin with plant resistance to aphids and with induction of aphid biotypes. Experimentia 224-226.
Dreyer, D. L. and Campbell, B.C. (1987) Chemical basis of host plant resistance to aphids. Plant, Cell and Environment 10, 353-361.
Dulmage, H.T. (1970) Insecticidal activity of HD-1, a new isolate of Bacillus thuringiensis var. alesti. Journal of Invertebrate Pathology 15, 232-239.
Eisemann, C.H., Donaldson, R.A., Pearson, R.D., Cadagon, L.C., Vuocola, T. and Tellam, R.L. (1994) Larvicidal activity of lectins on Lucilia cuprina: Mechanism of action. Entomologia Experimentalis etApplicata 72, 1-11.
183
Elliot, N.C. and Kieckhefer, R.W. (1990) Dynamics of aphidophagous coccinellid assemblages in small grain fields in eastern South Dakota. Environmental Entomology 19, 1320-1329.
Ernst, W.H.O. (1987) Impact of the aphid Aulacorthum solani KTLB. on the growth and reproduction of winter and summer annual life forms of Senecio sylvaticus L . Acta Oecologica - Oecologia Generous 8 (4), 537-547.
Etzler, M.E. (1985) Plant lectins: molecular and biological aspects. Annual Review of Plant Physiology 36, 209-234.
Evans, P.D. (1980) Biogenic amines in the insect nervous system. Advances in Insect Physiology 5, 317-473.
Evans, E.W. (1991) Intra versus interspecific interactions of ladybeetles (Coleoptera: Coccinellidae) attacking aphids. Oecologia 87,401-408.
Evert, R.F., Escrich, W. and Eichorn, S.E. (1973) P-protein distribution in mature sieve elements of Cucurbita maxima. Planta 109, 193-210.
Febvay, G., Delobel, B. and Rahbe, Y. (1988) Influence of the amino acid balance on the improvement of an artificial diet for a biotype of Acyrthosiphon pisum (Homoptera: Aphididae). Canadian Journal of Zoology 66, 2449-2453.
Fishhoff, D.A., Bowdish, K.S., Perlak, F.J., Marrone, P.G., McCormick, S.M., Niedermeyer, J.G., Dean, D.A., Kusano-Kretzmer, K., Mayer, E.J., Rochester, D.E., Rogers, S.G. and Fraley, R.T. (1987) Insect tolerant tomato plants. Bio/Technology 5, 807-813.
Fisken, A.G. (1959) Factors affecting the spread of aphid-borne viruses in potato in eastern Scotland I Overwintering of potato aphids, particularly Myzus persicae (Sulzer). Annals of Applied Biology 47 (2), 264-273.
Fitches, E., Gatehouse, A.M.R. and Gatehouse, J.A. (1997) Effects of snowdrop lectin (GNA) delivered via transgenic plants on the development of Tomato moth (Lacanobia oleracea) larvae in laboratory and glasshouse trials. Journal of Insect Physiology, in press.
Forrest, J.M.S. and Knights, B.A. (1972) Presence of phytosterols in the food of the aphid, Myzus persicae. Journal of Insect Physiology 18, 723-728.
Freed, D.L.J, and Buckley, C.H. (1978) Mucotractive effect of lectins. Lancet 1, 585-586.
Fromm, M.E., Taylor, L.P. and Walbot, V. (1986) Stable transformation of maize after gene transfer by electroporation. Nature 319, 791-793.
184

Galelli, A. and Truffa-Bachi, P. (1993) Urtica dioica agglutinin. The Journal of Immunology 151 (4), 1821-1831.
Garcia-Olmedo, F., Salcedo, G., Sanchez-Mange, R. Gamez, L., Roya, J. and Carbonera, P. (1987) Plant proteinaceous inhibitors and a-amylases. In Oxford Surveys of Plant Molecular and Cell Biology Vol IV, ed. B.J. Mifl in. Oxford University Press, Oxford pp275-334.
Gasser, C.S. and Fraley, R.T. (1989) Genetic engineering plants for crop improvement. Science 244, 1293-1299.
Gatehouse, A.M.R., Gatehouse, J.A., Dobie, P., Kilminster, A.M. and Boulter, D. (1979) Biochemical basis of insect resistance in Vigna unguiculata. Journal of the Science of Food and Agriculture 30, 948-958.
Gatehouse, A.M.R. Boulter, D. (1983) Assessment of the antimetabolic effects of trypsin inhibitors from cowpea (Vigna unguiculata) and other legumes on development of the bruchid beetle Callosobruchus maculatus. Journal of the Science of Food and Agriculture 34, 345-350.
Gatehouse, A.M.R., Dewey, F.M., Dove, J., Fenton, K.A. and Pusztai, A. (1984) Effect of seed lectins from Phaseolus vulgaris on the development of larvae of Callosobruchus maculatus; mechanism of toxicty. Journal of the Science of Food and Agriculture 35, 373-380.
Gatehouse, A.M.R., Fenton, K.A., Jepson, I . and Pavey, D.J. (1986a) The effects of cc-amylase inhibitors on insect storage pests: inhibition of oc-amylase in vitro and effects on development in vivo. Journal of the Science of Food and Agriculture 37, 727-734.
Gatehouse, J.A., Evans, I .M. , Croy, R.D.D. and Boulter, D. (1986b) Differential expression of seed genes during legume seed development. Philosophical Transactions of the Royal Society of London B314, 367-384.
Gatehouse, A.M.R., Dobie, P., Hodges, R.J., Meik, J., Pusztai, A. and Boulter, D. (1987) Role of carbohydrates in insect resistance in Phaseolus vulgaris. Journal of Insect Physiology 33, 843-850.
Gatehouse, A.M.R., Barbieri, L. , Stirpe, F. and Croy, R.R.D. (1990) Effects of ribosome inactivating proteins on insect development - differences between Lepidoptera and Coleoptera. Entomologia Experimentalis et Applicata 54,43-51.
Gatehouse, A.M.R., Hilder, V.A. and Boulter, D. (1992) Potential of plant-derived genes in the genetic manipulation of crops for insect resistance. In Plant Genetic Manipulation for Crop Protection, ed. A.M.R. Gatehouse, V.A. Hilder and D. Boulter. C A B International, Wallingford, UK, pp. 155-181.
185

Gatehouse, A.M.R., Shi, Y., Powell, K.S.,Brough, C , Hilder, V.A., Hamilton, W.D.O., Newell, C.A., Merryweather, A., Boulter, D. and Gatehouse, J.A. (1993) Approaches to insect resistance using transgenic plants. Philosophical Transactions of the Royal Society of London B342, 279-286.
Gatehouse, A.M.R., Down, R.E., Powell, K.S., Sauvion, N. , Rahbe, Y., Newell, C.A., Merryweather, A., Hamilton, W.D.O. and Gatehouse, J.A. (1996) Transgenic potato plants with enhanced resistance to the peach-potato aphid Myzus persicae. Entomologia Experimentalis etApplicata 79, 295-307.
Gatehouse, A.M.R., Davison, G.M., Newell, C.A., Merryweather, A., Hamilton, W.D.O., Burgess, E.P.J., Gilbert, R.J.C. and Gatehouse, J.A. (1997) Transgenic potato plants with enhanced resistance to the tomato moth, Lacanobia oleracea: growth room trials. Molecular Breeding 3,49-63.
Gaynor, J.J. (1988) Primary structure of an endochitinase mRNA from Solanum tuberosum. Nucleic Acids Research 16, 5210.
Gentile, A.G. and Stoner, A.K. (1968) Resistance in Lycopersicon and Solanum to the potato aphid. Journal of Economic Entomology 61, 1152-1154.
Gibson, R.W. (1972) The distribution of aphids in potato leaves in relation to vein size. Entomologia Experimentalis etApplicata 15, 213-223.
Gietl, C., Kauss, H. and Ziegler, H. (1979) Affinity chromatography of a lectin from Robinia pseudoacacia L. and demonstration of lectins in sieve-tube sap from other tree species. Planta 144, 367-371.
Goffreda, J.C., Mutschler, M.A. and Tingey, W.M. (1988) Feeding behaviour of potato aphid affected by glandular trichomes of wild tomato. Entomologia Experimentalis etApplicata 48, 101-107.
Goffreda, J.C., Are, D.A., Mutschler, M.A., Steffens, J.C. and Tingey, W . M . (1989) Aphid deterrence by glucose esters in glandular trichomes of the wild tomato, Lycopersicon pennellii. Journal of Chemical Ecology 15, 2135-2147.
Goffreda, J.C., Szymkowiak, E.J., Sussex, I .M. and Mutschler, M.A. (1990) Chimeric tomato plants show that aphid resistance and triacylglucose production are epidermal autonomous characters. The Plant Cell 2, 643-649.
Goldstein, I.J. and Hayes, C.E. (1978) The lectins: carbohydrate-binding proteins of plants and animals. Advances in Carbohydrate Chemistry and Biochemistry 35, 127-340.
Green, T.R. and Ryan, C.A. (1972) Wound induced proteinase inhibitor in plant leaves: a possible defense mechanism against insects. Science 175, 776-777.
Griffiths, G.W. and Beck, S.D. (1977) In vivo sterol biosynthesis by pea aphid symbiotes as determined by digitonin and electron microscopic autoradiography. Cell and Tissue Research 176, 179-190.
186
Grosset, J., Meyer, Y., Chartier, Y., Kauffmans, S., Legrand, M . and Fritig, B . (1990) Tobacco mesophyll protoplasts synthesize 1,3-p-glucanase, chitinases and "osmotins" during in vitro culture. Plant Physiology 92, 520-527.
Habibi, J., Backus, E.A. and Czapla, T.H. (1993) Plant lectins affect survival of the potato leafhopper (Homoptera: Cicadellidae). Journal of Economic Entomology 8 6 (3), 945-951.
Hames, B.D. (1981) An introduction to polyacrylamide gel electrophoresis. In Gel Electrophoresis of proteins - a practical approach, ed. B.D. Hames & D. Rickwood. IRL Press, Oxford.
Hannay, C.L. (1953) Crystalline inclusions in aerobic spore-forming bacteria. Nature 172, 1004.
Hannay, C.L. and Fitz-James, P. (1955) The protein crystals of Bacillus thuringiensis Berliner. Canadian Journal of Microbiology 1, 694-710.
Harris, K.F. and Bath, J.E. (1973) Regurgitation by Myzus persicae during membrane feeding: its likely function in transmission of non-persistent plant viruses. Annals of the Entomological Society of America 66, 793-796.
Heinz, C.A., Zangerl, A.R. and Berenbaum, M.R. (1996) Effects of natural and synthetic neuroactive substances on the growth and feeding of cabbage looper, Trichoplusia ni. Entomologia Experimentalis etApplicata 80,443-451.
Higgins, T.J.V., Chandler, P.M., Zurawaski G., Button, S.C. and Spencer D. (1983) The synthesis and primary structure of pea seed lectin. Journal of Biological Chemistry 9544-9549.
Higginbotham, J.D. (1981) Sensory properties and potential applications of thaumatin, an intensely sweet protein. Journal of the Science of Food and Agriculture 32, 843.
Higuchi, M. , Tsuchiya, I . and Iwai, K. (1984) Growth inhibition and small intestinal lesions in rats after feeding with isolated winged bean lectin. Agricultural and Biological Chemistry 48 (3), 695-701.
Hildebrand, D.F. and Hamilton-Kemp, T.R. (1988) Plant lipoxygenases: occurrence, properties and possible functions. Current Topics in Plant Biochemistry and Physiology 1, 201-219.
Hilder, V.A., Gatehouse, A.M.R., Sheerman, S.E., Barker, R.F. and Boulter, D. (1987) A novel mechanism of insect resistance engineered into tobacco. Nature 330 (12), 160-163.
187

Hilder, V.A., Boulter, D. and Gatehouse, A.M.R. (1992) Introduction. In Plant genetic manipulation for crop protection, ed. A.M.R. Gatehouse, V.A.Hilder and D. Boulter. C A B International, Wallingford, UK., pp. 1-5.
Hilder, V.A., Powell, K.S., Gatehouse, A.M.R., Gatehouse, J.A., Gatehouse, L.N., Shi, Y., Hamilton, W.D.O., Merryweather, A., Newell, C.A., Timans, J.C., Peumans, W.J., Van Damme, E. and Boulter, D. (1995) Expression of snowdrop lectin in transgenic tobacco plants results in added protection against aphids. Transgenic Research 4, 18-25.
Hil l , D.S. (1987) Agricultural insect pests of temperate regions and their control. Cambridge University Press.
Hines, M.E., Nielsen, S.S., Shade, R.E. and Pomeroy, M.A. (1990) The effect of two proteinase inhibitors, E-64 and the Bowman-Birk inhibitor, on the developmental time and mortality of Acanthoscelides obtectus. Entomologia Experimentalis et Applicata 57, 201-207.
Houk, E.J., Griffiths, G.W. and Beck, S.D. (1976) Lipid metabolism in the symbiotes of the pea aphid, Acyrothosiphon pisum. Comparative Biochemistry and Physiology 54B, 427-431.
Houk, E.J. and Griffiths, G.W. (1980) Intracellular symbiotes of the Homoptera. Annual Review of Entomology 25, 161-187.
Houk, E.J. (1987) Symbionts. In Aphids, their biology, natural enemies and control, ed. L.A.K. Minks and P. Harrewijn. Elsevier, Amsterdam, pp. 123-129.
Howard, I.K., Sage, H.J. and Horton, C.B. (1972) Studies on the appearance and location of hemagglutinins from a common lentil during the life cycle of the plant. Archives of Biochemistry and Biophysics 149, 323-326.
Huddart, H. and Oldfield, A.C. (1982) Spontaneous activity of foregut and hindgut visceral muscle of the locust, Locusta migratoria I I . The effect of biogenic amines. Comparative Biochemistry and Physiology 73C, 303-311.
Huesing, J.E., Shade, R.E., Chrispeels, M.J. and Murdock, L.L. (1991a) oc-amylase inhibitor, not phytohaemagglutinin, explains resistance of common bean seeds to cowpea weevil. Plant Physiology 96, 993-996.
Huesing, J.E., Murdock, L.L. and Shade, R.E. (1991b) Effect of wheat germ isolectins on development of cowpea weevil. Phytochemistry 30, 785-788.
Huesing, J.E., Murdock, L.L. and Shade, R.E. (1991c) Rice and stinging nettle lectins: insecticidal activity similar to wheat germ agglutinin. Phytochemistry 30 (11), 3565-3568.
188

Ishimoto, M. and Kitamura, K. (1989) Growth inhibitory effects of an a-amylase inhibitor from kidney bean, Phaseolus vulgaris on three species of bruchids (Coleoptera, Bruchidae). Applied Entomology and Zoology 24, 281-286.
Ishimoto, M. , Sato, T., Chrispeels, M.J. and Kitamura, K. (1996) Bruchid resistance of transgenic azuki bean expressing seed a-amylase inhibitor of common bean. Entomologia Experimentalis et Applicata 79, 309-315.
Janzen, D.H., Juster, H.B. and Liener, I.E. (1976) Insecticidal action of the phytohemagglutinin in black beans on a bruchid beetle. Science 192, 795-796.
Jayne-Williams, D.J. and Burgess, C D . (1974) Further observations on the toxicity of navy beans (P. vulgaris) for Japanese quail (Coturnix coturnix japonica). Journal of Applied Bacteriology 37, 149-169.
Johnson, R., Narvaez, J., An, G. and Ryan, C.A. (1989) Expression of proteinase inhibitors I and I I in transgenic tobacco plants: effects on natural defense against Manduca sexta larvae. Proceedings of the National Academy of Sciences (USA) 86, 9871-9875.
Johnston, K.A., Gatehouse, J.A. and Anstee, J.H. (1993) Effects of soybean protease inhibitors on the growth and development of larval Helicoverpa armigera. Journal of Insect Physiology
Kaku, H. and Goldstein, I.J. (1989) Snowdrop lectin. Methods in Enzymology 179, 327-331.
Kaloshian, I . , Lange, W.H. and Williamson, V.M. (1995) An aphid-resistance locus is tightly linked to the nematode-resistance gene, M i , in tomato. Proceedings of the National Academy of Science, USA 92, 622-625.
Karnovsky, M.J. (1965) A formaldehyde-gluteraldehyde fixative of high osmolality for use in eletron microscopy. Journal of Cell Biology 27, 137-138A.
Kennedy, J.S., Ibbotson, A. and Booth, CO. (1950) The distribution of aphid infestation in relation to leaf age I Myzus persicae (Sulz.) and Aphis fabae Scop, on spindle trees and sugar beet plants. Annals of Applied Biology 37 (4), 651-679.
Kirsi, M . and Mikola, J. (1971) Occurrence of proteolytic inhibitors in various tissues of barley. Planta 96, 281-291.
Klein, T.M., Kornstein, L., Sanford, J.C and Fromm, M.E. (1989) Genetic transformation of maize cells by particle bombardment. Plant Physiology 91, 440-444.
Kleinig, H., Thores, J., Dorr, I . and Kollman, R. (1975) Filament formation in vitro of a sieve-tube protein from Curcurbita maxima and Curcubita pepo. Planta 127, 163-170.
189

Klingauf, F.A. (1987) Feeding, Adaptation and Excretion. In Aphids, their biology, natural enemies and control, ed. L.A.K. Minks and P. Harrewijn. Elsevier, Amsterdam, pp. 225-253.
Knox, R.B., Clark, A., Harrison, S., Smith, P. and Marchalanis, J.J. (1976) Cell recognition in plants: determinants of the stigma surface and their pollen interactions. Proceedings of the National Academy of Sciences (USA) 73, 2788-2792.
Krens, F.A.,Molendijk, L . , Wullems, G.J. and Schilperoort, R.A. (1982) In vitro transformation of plant protoplasts with Ti plasmid DNA. Nature 296, 72-74.
Kyhse-Andersen, J. (1984) Electroblotting of multiple gels: a simple apparatus without buffer tank for rapid transfer of proteins from polyacrylamide to nitrocellulose. Journal of Biochemical and Biophysical Methods 10, 203-209.
Lazaro, A., Rodriguez-Palenzuela, P., Marana, C , Carbonero, P. and Garcia-Olmedo, F. (1988) Signal peptide homology between the sweet protein thaumatin I I and unrelated cereal oc-amylase/trypsin inhibitors. FEBS Letters 239 (1), 147-150.
Le Moal, M.A., Colle, J.H., Galelli, A. and Truffa-Bachi, P. (1992a) Mouse T lymphocyte activation by Urtica dioica agglutinin (UDA) I . UDA-sensitivity delineates the existence of two lymphocyte subsets. Research in Immunology 143, 691-700.
Le Moal, M.A., Colle, J.H., Galelli, A. and Truffa-Bachi, P. (1992b) Mouse T lymphocyte activation by Urtica dioica agglutinin (UDA) I I . Original pattern of cell activation and cytokine production induced by UDA. Research in Immunology 143, 701-709.
Leather, S.R., Ward, S.A. and Dixon, A.F.G. (1983) The effect of nutrient stress on some life history parameters of the black bean aphid, Aphis fabae Scop. Oecologia 57, 156-157.
Lerner, D.R. and Raikhel, N.V. (1992) The gene for stinging nettle (Urtica dioica agglutinin) encodes both a lectin and a chitinase. The Journal of Biological Chemistry 267 (16), 11085-11091.
Leszczynski, B., Tjallingii, W.F., Dixon, A.F.G. and Swiderski, R. (1995) Effect of methoxyphenols on grain aphid feeding behaviour. Entomologia Experimentalis et Applicatald, 157-162.
Lipke, H., Fraenkel, G.S. and Liener, I.E. (1954) Effect of soybean inhibitors on growth of Tribolium confusum. Journal of Agricultural Food Chemistry 2, 410-415.
Lis, H. and Sharon, N. (1986) Lectins as molecules and tools. Annual Review of Biochemistry 55, 35-68.
190

Mallet, J. and Porter, P. (1992) Preventing insect adaptation to insect-resistant crops: are seed mixtures or refugia the best strategy? Proceedings of the Royal Society of London B250, 165-169.
Malone, L.A., Giacon, H.A., Burgess, E.P.J., Maxwell, J.Z., Christeller, J.T. and Laing, W.A. (1995) Toxicity of trypsin endopeptidase inhibitors to honey bees (Hymenoptera: Apidae). Journal of Economic Entomology 88 (1), 46-50.
Margis-Pinheiro, M. , Martin, C , Didierjean, L. and Burkard, G. (1993) Differential expression of bean chitinase genes by virus infection, chemical treatment and UV irradiation. Plant Molecular Biology 22, 659-668.
Mascarenhas, J.P. and Hamilton, D.A. (1992) Artifacts in the localisation of Gus activity in anthers of Petunia transformed with a CaMV 35s-Gus construct. Plant Journal 2, 405-408.
Matthews, B.F. and Cress, D.E. (1981) Liposome-mediated delivery of DNA to carrot protoplasts. Planta 153, 90-94.
Mauch, F., Hodwiger, L.A. and Boiler, T. (1984) Ethylene: symptom, not signal for the induction of chitinase and p-l,3-glucanase in pea pods by pathogens and elicitors. Plant Physiology 76, 607-611.
Mauch, F., Hodwiger, L.A. and Boiler, T. (1988) Antifungal hydrolases in pea tissue I . Purification and characterisation of 2 chitinases and 2 (3-1,3 glucanases differentially regulated during development in response to fungal infection. Plant Physiology 87, 325-333.
McAllan, J.W. and Adams, J.B. (1961) The significance of pectinase in plant penetration by aphids. Canadian Journal of Zoology 39, 305-310.
McCauley, G.W., Margolies, D.C. and Reese, J.C. (1990) Feeding behaviour, fecundity and weight of sorghum- and corn-reared greenbugs on corn. Entomologia Experimentalis etApplicata 55, 183-190.
McGaughey, W.H. (1985) Insect resistance to the biological insecticide Bacillus thuringiensis. Science 224, 193-195.
McLean, D.L. and Houk, E.J. (1973) Phase contrast and electron microscopy of the mycetocytes and symbiotes of the pea aphid, Acyrthosiphon pisum. Journal of Insect Physiology 19, 625-633.
McManus, M.T., White, D.W.R. and McGregor, P. (1994) Accumulation of a chymotrypsin inhibitor in transgenic tobacco affects the growth of closely related insect pests differently. Transgenic Research 3, 50-58.
Metcalf, R.L. (1986) The ecology of insecticides and the chemical control of insects. In Ecological theory and integrated pest management, ed. M . Kogan. John Wiley & Sons, New York, pp251-297.
1 9 1
Metraux, J.P. and Boiler, T. (1986) Local and systemic induction of chitinase of cucumber plants in response to viral, bacterial and fungal infections. Physiological and Molecular Plant Pathology 28, 161 -169.
Metraux, J.P., Burkhart, W., Moyer, M. , Dincher, S., Middlesteadt, W., Williams, S., Payne, G., Carnes, M . and Ryals, J. (1989) Isolation of a complementary DNA encoding a chitinase with structural homology to a bifunctional lyzozyme/chitinase. Proceedings of the National Academy of Science (USA) 86, 896-900.
Miles, P.W. (1965) Studies on the salivary physiology of plant-bugs: the salivary secrections of aphids. Journal of Insect Physiology 11, 1261-1268.
Mirelman, D., Galun, E., Sharon, N. and Lotan, R. (1975) Inhibition of fungal growth by wheat germ agglutinin. Nature 256, 414-416.
Mishkind, M. , Raikhel, N.V., Palevitz, B.A. and Keegstra, K. (1982) Immunocytochemical localisation of wheat germ agglutinin in wheat. The Journal of Cell Biology 92, 753-764.
Mittler, T.E. (1958) Studies on the feeding and nutrition of Tuberolachnus salignus (Gmelin) I I . The nitrogen and sugar composition of ingested phloem sap and excreted honeydew. Journal of Experimental Biology 35, 74-84.
Mittler, T.E. and Kleinjan, J.E. (1970) Effect of artificial diet composition on wing-production by the aphid Myzus persicae. Journal of Insect Physiology 16, 833-850.
Moericke, V. and Mittler, T.E. (1966) Oesophageal and stomach inclusions of aphids feeding on various cruciferae. Entomologia Experimentalis etApplicata 9, 287-297.
Montllor, C.B. and Gildow, F.E. (1986) Feeding reponses of two grain aphids to barley yellow dwarf virus-infected oats. Entomologia Experimentalis et Applicata 42, 63-70.
Montllor, C.B. and Tjallingii, W.F. (1989) Stylet penetration by two aphid species on susceptible and resistant lettuce. Entomologia Experimentalis et Applicata 52, 103-111.
Moreira, R.A. and Cavada, B.S. (1984) Lectin from Canavalia brasiliensis (Mart.). Isolation, characterisation and behaviour during germination. Biological Plantation (Praha) 26, 113-120.
Moussea, T.A. and Dingle, H. (1991) Maternal effects in insect life histories. Annual Review of Entomology 36, 511-534.
Murdock, L.L., Huesing, J.E., Nielsen, S.S., Pratt, R.C. and Shade, R.E. (1990) Biological effects of plant lectins on the cowpea weevil. Phytochemistry 29 (1), 85-89.
192
Nielsen, S.S., Deshpande, S.S., Hermodson, M.A. and Scott, M.P. (1988) Comparative digestibility of legume storage proteins. Journal of Agricultural Food Chemistry 36, 896-902.
Odani, S. and Ikenaka, T. (1972) Studies on soybean trypsin inhibitors IV Complete amino acid sequence and the anti-proteinase sites of Bowman-Birk proteinase inhibitor. Journal of Biochemistry 71, 839-848.
Oliveira, J.T.A., Vasconelos, I .M., Gondim, M.J.L., Cavada, B.S., Moreira, R. A. , Santos, C.F. and Moreira, L.I .M. (1994) Canavalia brasiliensis seeds, protein quaility and nutritional implications of dietary lectin. Journal of the Science of Food and Agriculture 64, 417-424.
Oppert, B., Morgan, T.D., Culbertson, C. and Kramer, K.J. (1993) Dietary mixtures of cysteine and serine proteinase inhibitors exhibit synergistic toxicty toward the red flour beetle, Tribolium castaneum. Comparative Biochemistry and Physiology 105C (3), 379-385.
Osborne, R.H., Banner, S.E. and Wood, S.J. (1990) The pharmacology of the gut of the desert locust Schistocerca gregaria and other insects. Comparative Biochemistry and Physiology, 96C, 1-9.
Pan, S.Q., Ye, X.S. and Kuc, J. (1992) Induction of chitinases in tobacco plants systemically protected against blue mold by Peronospora tabacina or tobacco mosaic virus. Phytopathology 82, 119-123.
Parry, W.H. (1971) Differences in the probing behaviour of Elatobium abietinum feeding on Sitka and Norway spruces. Annals of Applied Biology 69, 177-185.
Payne, G., Ahl, P., Moyer, M. , Harper, A., Beck, J., Meins, F. and Ryals, J. (1990) Isolation of complementary DNA clones encoding pathogenesis-related proteins P and Q, two acidic chitinases from tobacco. Proceedings of the National Academy of Sciences USA 87, 98-102.
Peferoen, M . (1992) Engineering of insect-resistant plants with Bacillus thuringiensis crystal protein genes. In Plant genetic manipulation for crop protection, ed. A.M.R. Gatehouse, V.A. Hilder and D. Boulter. C A B International, Wallingford, UK., pp. 135-153.
Pereira, S., Carvalho, H., Sunkel, C. and Salema R. (1992) Immunocytolocation of glutamine synthetase in mesophyll and phloem leaves of Solanum tuberosum L . Protoplasma 167, 66-73.
Peumans, W.J., De Ley, M . and Broekaert, W.F. (1984) An unusual lectin from stinging nettle (Urtica dioicd) rhizomes. FEBS Letters 111 (1), 99-103.
Peumans, W.J. and Van Damme, E.J.M. (1995) Lectins as Plant Defense Proteins. Plant Physiology 109, 347-352.
193

Pierpoint, W.S., Jackson, P.J. and Evans, R.M. (1990) The presence of a thaumatin-like protein, a chitinase and a glucanase among the pathogenesis-related proteins of potato (Solatium tuberosum). Physiological and Plant Molecular Pathology 36, 325-338.
Ponsen, M.B. (1987) Alimentary Tract. In Aphids, their biology, natural enemies and control, ed. L.A.K. Minks and P. Harrewijn. Elsevier, Amsterdam, pp. 79-97.
Powell, K.S., Gatehouse, A.M.R., Hilder, V.A. and Gatehouse, J.A. (1993) Antimetabolic effects of plant lectins and the fungal enzymes on the nymphal stages of two important rice pests, Nilaparvata lugens and Nephotettis cinciteps. Entomologia Experimentalis etApplicata 66, 119-126.
Powell, K.S. (1993) Antimetabolic effects of plant proteins on Homopteran insect pests. Ph.D. thesis, University of Durham, England, UK.
Powell, K.S., Gatehouse, A.M.R., Hider, V.A. and Gatehouse, J.A. (1995a) Antifeedant effects of plant lectins and an enzyme on the adult stage of the rice brown planthopper, Nilaparvata lugens. Entomologia Experimentalis etApplicata 75, 51-59.
Powell, K.S., Gatehouse, A.M.R., Hilder, V.A., Van Damme, E.J.M., Peumans, W.J., Boonjawat, J., Horsham, K. and Gatehouse, J.A. (1995b) Different antimetabolic effects of related lectins towards nymphal stages of Nilaparvata lugens. Entomologia Experimentalis etApplicata 75, 61-65.
Pozarowska, B. (1987a) Studies on low temperature survival, reproduction and development in Scottish clones of Myzus persicae (Sulzer) and Aulacorthum solani (Kaltenbach) (Hemiptera: Aphididae) susceptible and resistant to organophosphates. Bulletin of Entomological Research 77, 123-134.
Pozarowska, B. (1987b) Acclimation to, and recovery from, low temperatures in Scottish clones of Myzus persicae (Sulzer) and Aulacorthum solani (Kaltenbach) (Hemiptera: Aphididae) susceptible and resistant to organophosphates. Bulletin of entomological Research 77, 467-476.
Pueyo, J.J., Morgan, T.D., Ameenuddin, N. , Liang, C , Reeck, G.R., Chrispeels, M.J. and Kramer, K.J. (1995) Effects of bean and wheat cc-amylase inhibitors on cc-amylase activity and growth of stored product insect pests. Entomologia Experimentalis et Applicata 75, 237-244.
Pusztai, A., Ewen, S.W.B., Grant, G., Peumans, W.J., Van Damme, E.J.M., Rubio, L. and Bardocz, S. (1990) The relationship between survival and binding of plant lectins during small intestine passage and their effectiveness as growth factors. Digestion 46, 308-316.
194

Pusztai, A., Grant, G., Spencer, R.J., Duguid, T.J., Brown, T.S., Ewen, S.W.B., Peumans, W. J., Van Damme, E.J.M. and Bardocz, S. (1993a) Kidney bean lectin-induced Escherichia coli overgrowth in the small intestine is blocked by GNA, a mannose-specific lectin. Journal of Applied Bacteriology 75, 360-368.
Pusztai, A., Ewen, S.W.B., Grant, G., Brown, D.S., Stewart, J.C., Peumans, W.J., Van Damme, E.J.M. and Bardocz, S. (1993b) Antinutritive effects of wheat germ agglutinin and other N-acetylglucosamine specific lectins. British Journal of Nutrition 70, 313-321.
Rahbe, Y. and Febvay, G. (1993) Protein toxicity to aphids: an in vitro test on Acyrthosiphon pisum. Entomologia Experimentalis et Applicata 67, 149-160.
Rahbe, Y., Sauvion, N. , Febvay, G., Peumans, W.J. and Gatehouse, A.M.R. (1995) Toxicity of lectins and processing of ingested proteins in the pea aphid Acyrthosiphon pisum. Entomologia Experimentalis et Applicata 76, 143-155.
Raikhel, N.V., Mishkind, M.L. and Palevitz, B.A. (1984) Characterisation of a wheat germ agglutinin-like lectin from adult wheat plants. Planta 162, 55-61.
Read, S.M. and Northcote, D.H. (1983) Chemical and immunological similarities between the phloem proteins of three genera of the Cucurbitaceae. Planta 158, 119-127.
Richardson, M. (1977) The proteinase inhibitors of plants and micro-organisms. Phytochemistry 16, 159-169.
Richardson, M. , Valdes-Rodriguez, S. and Blanco-Labra, A. (1987) A possible function for thaumatin and a TMV-induced protein suggested by homology to a maize inhibitor. Nature 327, 432-434.
Rizki, T.M. and Rizki, R.M. (1983) Basement membrane polarises lectin binding sites of Drosophila larval fat body cells. Nature 303, 340-342.
Romanow, L.R. and Van Eijk, J.P. (1985) Aulacorthum solani as a vector of tulip breaking virus - a cautionary tale. Netherlands Journal of Plant Pathology 91, 151-152.
Rossi, V. and Menozzi, P. (1990) The clonal ecology of Heterocypris incongruens (Ostracoda). Oikos 57, 388-398.
Rossi, V. and Menozzi, P. (1992) The clonal ecology of Heterocypris incongruens (Ostracoda): life-history traits and photoperiod. Functional Ecology 7, 177-182.
Ryan, C.A. (1973) Proteolytic enzymes and their inhibitors. Annual Review of Plant Physiology 24, 184-.
195

Ryan, C.A. (1988) Oligosaccharides as recognition signals for the expression of defensive genes in plants. Biochemistry 27, 8879-8883.
Sabnis, D.D. and Hart, J.W. (1978) The isolation and some properties of a lectin (haemagglutinin) from Cucurbita phloem exudate. Planta 142,97-101.
Sahai, A.S. and Manocha, M.S. (1993) Chitinases of fungi and plants: their involvement in morphogenesis and host-parasite interaction. FEMS Microbiology Reviews 11, 317-338.
Samac, D.A., Hironaka, C M . , Yallay, P.E. and Shah, D.M. (1990) Isolation and characterisation of the genes encoding basic and acidic chitinase in Arabidopsis thaliana. Plant Physiology 93, 907-914.
Sambrook, J., Fritsch, E.F. and Maniatis, T. (1989) Molecular cloning: a laboratory manual, 2nd edn, Cold Spring Harbor Laboratory Press, New York.
Sauvion, N. (1995) Mode d'action de deux lectines a mannose sur les peucerons, Acyrothsiphon pisum (Harris): pantentiels d'utilisation des lectines vegeteles dans une strategic de creation de plantes transgeniques resistantes aux peucerons. Ph.D. thesis, INSA, Laboratoire de Biologie Appliquee 406, Villeurbanne, France.
Sauvion, N . , Rahbe, Y., Peumans, W.J., Van Damme, E., Gatehouse, J.A. and Gatehouse, A.M.R. (1996) Effects of GNA and other mannose binding lectins lectins on development and fecundity of the peach-potato aphid Myzus persicae. Entomologia Experimentalis etApplicata 79, 285-293.
Saxena, P.N. and Chada, H.L. (1971) The greenbug, Schizaphis graminum I . mouthparts and feeding habits. Annals of the Entomological Society of America 6 4, 897-904.
Schnepf, H.E. and Whiteley, H.R. (1981) Cloning and expression of the Bacillus thuringiensis crystal protein gene in Escherichia coli. Proceedings of the National Academy of Sciences (USA) 78, 2893-2897.
Schulbaum, A., Mauch, F., Vogeli, U. and Boiler, T. (1986) Plant chitinases are potent inhibitors of fungal growth. Nature 324, 365-367.
Shi, Y., Wang, M.B., Powell, K.S., Van Damme, E., Hilder, V.A., Gatehouse, A.M.R., Boulter, D. and Gatehouse, J.A. (1994) Use of the rice sucrose synthase-1 promoter to direct phloem-specific expression of (3-glucuronidase and snowdrop lectin genes in transgenic tobacco plants. Journal of Experimental Botany 45 (274), 623-631.
Shibuya, N. , Goldstein, I.J., Shafer, J.A., Peumans, W.J. and Broekaert, W.F. (1986) Carbohydrate binding properties of the stinging nettle (Urtica dioica) rhizome lectin. Archives of Biochemistry and Biophysics 249 (1), 215-224.
196
Shibuya, N. , Berry, J.E. and Goldstein, I.J. (1988) One step purification murine IgM and human a2-macroglobulin by affinity chromatography on immobilised snowdrop bulb lectin. Archives of Biochemistry and Biophysics 267, 676.
Shieh, J.N., Berry, R.E., Reed, G.L. and Rossignol, P.A. (1994) Feeding activity of green peach aphid (Homoptera: Aphididae) on transgenic potato expressing a Bacillus thuringiensis ssp. tenebrionis 8-Endotoxin Gene. Journal of Economic Enotomology 87 (3), 618-622.
Shukle, R.H. and Murdock, L.L. (1983) Lipoxygenase, trypsin inhibitor and lectin from soybeans: effects on larval growth of Manduca sexta (Lepidoptera: Sphingidae). Environmental Entomology 12 (3), 787-791.
Simon, J.C., Dedryver, C.A., Pierre, J.S., Tanguy, S. and Wegorek (1991) The influence of clone and morph on the parameters of intrinsic rate of increase in the cereal aphids Sitobin avenae and Rhopalosiphum padi. Entomologia Experimentalis et Applicata 58, 211-220.
Srivastava, P.N. and Auclair, J.L. (1962) Amylase activity in the alimentary canal of the pea aphid, Acyrothosiphon pisum (Harris) (Homoptera: Aphididae). Journal of Insect Physiology 8, 349-355.
Srivastava, P.N. and Auclair, J.L. (1963) Characteristics and nature of proteases from the alimentary canal of the pea aphid, Acyrothosiphon pisum (Harris) (Homoptera: Aphididae). Journal of Insect Physiology 9, 469-474.
Srivastava, P.N. (1987) Nutritional Physiology. In Aphids, their biology, natural enemies and control, ed. L.A.K. Minks and P. Harrewijn. Elsevier, Amsterdam, pp. 99-121.
Staehelin, C , Granado, J., Muller, J., Wiemken, A., Mellor, R.B., Felix, G., Regenass, M. , Broughton, W.J. and Boiler, T. (1994) Perception of Rhizobium nodulation factors by tomato cells and inactivation by root chitinases. Proceedings of the National Academy of Sciences (USA) 91, 2196-2200.
Starks, K.J., Muniappan, R. and Eikenbary, R.D. (1972) Interaction between plant resistance and parasitism against the greenbug on barley and sorghum. Annals of the Entomological Society of America 65, 650-655.
Stewart, L.M.D., Hirst, M. , Ferber, M.L. , Merryweather, A.T., Cayley, P.J. and Possee, R.D. (1991) Construction of an improved baculovirus insecticide containing an insect-specific toxin gene. Nature 352, 85-88.
Stiling, P. (1987) The frequency of density dependence in insect-host-parasitoid systems. Ecology 68, 844-856.
Stirpe, F. and Barbieri, L. (1986) Ribosome inactivating proteins up to date. FEBS Letters 195, 1-8.
197

Sylvester, E.S. (1954) Insectary life history and apterous instar morphology of Myzus persicae (Sulzer) (Homoptera: Aphididae). Annals of the Entomological Society of America 47, 397-406.
Tal, B. and Robeson, D.J. (1986) The metabolism of sunflower phytoalexins ayapin and scopoletin. Plant Physiology 82, 167-172.
Terra, W.R. (1996) The spatial organisation of digestion in insects. In Proceedings of XX International Cogress of Entomology, Firenze, Italy, pp. 119.
Tomalski, M.D. and Miller, L.K. (1991) Insect paralysis by baculovirus-mediated expression of a mite neurotoxin gene. Nature 352, 82-85.
Topfer, R., Gronenborn, B., Schell, J. and Steinbiss, H.H. (1989) Uptake and transient expression of chimeric genes in seed-derived embryos. Plant Cell 1, 133-139.
Trimmer, B.A. (1985) Serotonin and the control of salivation in the blowfly, Calliphora. Journal of Experimental Biology 114, 307-328.
Trowbridge, I.S. (1974) Isolation and characterisation of a mitogenic lectin from Pisum sativum. Journal of Biological Chemistry 249, 6004-60012.
Unal, G. and Jepson, P,C, (1991) The toxicity of aphicide residues to beneficial invertebrates in cereal crops. Annals of Applied Biology 118, 493-502.
Vaeck, M. , Reynaerts, A., Hofte, H., Jansens, S., De Beuckeleer, M. , Dean, C , Zabeau, M. , Van Montagu, M . and Leemans, J. (1987) Transgenic plants protected from insect attack. Nature 328, 33-37.
Van Damme, E.J.M., Allen, A.K. and Peumans, W.J. (1987) Isolation and characterisation of a lectin with exclusive specificity towards mannose from snowdrop (Galanthus nivalis) bulbs. FEBS Letters 215, 140-144.
Van Damme, E.J.M., Broekaert, W.F. and Peumans, W.J. (1988) The Urtica dioica agglutinin is a complex mixture of isolectins. Plant Physiology 86, 598-601.
Van Damme, E.J.M., Balzarini, J., Smeets, K., Van Leuven, F. Peumans, W.J. (1994) The monomelic and dimeric mannose binding proteins from the Orchidaceae species Listera ovata and Epipactis hellborine: sequence homologies and differences in biological activities. Glycoconjugate Journal 11, 321-332.
Van Parijs, J., Broekaert, W.F., Goldstein, I.J. and Peumans, W.J. (1991) Hevein: an antifungal protein from rubber-tree (Hevea brasiliensis) latex. Planta 183, 258-264.
198

Van der Wei, H. and Loeve, K. (1972) Isolation and characterisation of thaumatin I and I I , the sweet tasting proteins from Thaumatococcus daniellii (Benth). European Journal of Biochemistry 31, 221-225.
Van Rie, J., McGaughey, W.H., Johnson, D.E., Barnett, B.D. and Van Mellaert, H . (1990) Mechanism of insect resistance to the microbial insecticide Bacillus thuringiensis. Science 247,12-1A.
Van Steekelenburg, N.A.M. (1992) Novel approaches to integrated pest and disease control in glasshouse vegetables in The Netherlands. Pesticide Science 36, 359-362.
Via, S. (1991a) Specialised host plant performance of pea aphid clones is not altered by experience. Ecology 72, 1420-1427.
Via, S. (1991b) The genetic structure of host plant adaptation in a spatial patchwork: demographic variability among reciprocally transplanted pea aphid clones. Evolution 45 (4), 827-852.
Vigers, A.J., Wiedemann, S., Roberts, W.K., Legrand, M. , Selitrennikoff, CP. and Fritig, B. (1992) Thaumatin-like pathogenesis-related proteins are antifungal. Plant Science 83, 155-161.
Walters, D.S., Craig, R. and Mumma, R.O. (1989a) Glandular trichome exudate is the critical factor in geranium resistance to foxglove aphid. Entomologia Experimentalis et Applicata 53, 105-109.
Walters, D.S., Grossman, H., Craig, R. and Mumma, R.O. (1989b) Geranium defense agents IV. Chemical and morphological bases of resistance. Journal of Chemical Ecology 15 (1), 357-372.
Walters, D.S., Craig, R. and Mumma, R.O. (1990) Effects of mite resistance mechanisms of geranium on mortality and behaviour of foxglove aphid {Acyrthosiphon solani Kaltenbach). Journal of Chemical Ecology 16(3), 877-886.
Walters, D.S., Harman, J., Craig, R. and Mumma, R.O. (1991) Effect of temperature on glandular trichome exudate composition and pest resistance in geraniums. Entomologia Experimentalis et Applicata 60, 61-69.
Walters, F.S. and English, L.H. (1995) Toxicity of Bacillus thuringiensis 8-endotoxins toward the potato aphid in an artificial diet bioassay. Entomologia Experimentalis et Applicata 11, 211-216.
Ward, S.A. and Dixon, A.F.G. (1982) Selective resorption of aphid embryos and habitat changes relative to life-span. Journal of Animal Ecology 51, 859-864.
Ward, E.R., Uknes, S.J., Williams, S.C., Dincher, S.S., Wielderhold, D.L. , Alexander, D.C., Ahl-Goy, P., Metraux, J.P. and Ryals, J.A. (1991) Coordinate gene activity in response to agents that induce systemic acquired resistance. Plant Cell 3, 1085-1094.
199

Wearing, C.H. (1972) Selection of Brussels sprouts of different water status by apterous and alate M. persicae and B. brassicae in relation to age of leaves. Entomologia Experimentalis et Applicata 15, 139-154.
Webb, K.J. and Morris, P. (1992) Methodologies of plant transformation. In Plant genetic manipulation for crop protection, ed. A.M.R. Gatehouse, V.A. Hilder and D. Boulter. C A B International, Wallingford, UK., pp. 7-43.
Weber, G. (1985).Genetic variability in host plant adaptation of the green peach aphid, Myzus persicae. Entomologia Experimentalis et Applicata 38,49-56.
Wolfson, J.L. and Murdock, L.L. (1987) Supression of larval Colorado potato beetle growth and development by digestive proteinase inhibitors. Entomologia Experimentalis etApplicata 44, 235-240.
Woodford, J.A.T., Jolly, C.A. and Aveyard, C.S. (1995) Biological factors influencing the transmission of potato leafroll virus by different aphid species. Potato Research^, 133-141.
Wyatt, I.J. and White, P.F. (1977) Simple estimation of intrinsic rates for aphids and tetranychid mites. Journal of Applied Ecology 14, 757-766.
2 0 0

Pergamon PII: S0022-1910(96)00065-0
J. Insect Physiol. Vol. 42. Nos 11-12, pp. 1035-1045. 1996 Copyright © 1996 Elsevier Science Ltd
Printed in Great Britain. All rights reserved 0022-1910/96 $15.00 + 0.00
Snowdrop Lectin Inhibits Development and Decreases Fecundity of the Glasshouse Potato Aphid (Aulacorthum solani) When Administered In Vitro and Via Transgenic Plants Both in Laboratory and Glasshouse Trials RACHEL E. DOWN,* ANGHARAD M. R. GATEHOUSE,** W I L L I A M D. O. HAMILTON, t JOHN A. GATEHOUSE*
Received 29 February 1996; revised 8 May 1996
The effects of snowdrop lectin (Galanthus nivalis agglutinin, GNA) on the Glasshouse Potato Aphid (Aulacothum solani) were tested by bioassays where the protein was incorporated into an artificial diet at a single concentration of 0.1% (w/v). The results showed that the presence of GNA in the diet throughout the insect's life cycle decreased the fecundity of adult aphids, as measured by nymph production, by up to 65%, but normally caused only a marginal decrease (<10%) in aphid survival. The deleterious effect of GNA was significantly reduced if insects were reared on control diet, and transferred to diet containing GNA at maturity. GNA was also shown to affect the development of nymphal aphids by measuring growth using image analysis software. The presence of GNA in the diet decreased the rate of increase in length and width of the aphids by up to 40%, and, in this assay, also caused high levels of mortality. GNA was expressed in potato plants, {Solatium tuberosum L.) cv. Desiree, after transformation with a construct containing a gene encoding the protein driven by the CaMV 35S promoter. GNA expression levels in transgenic potato leaves were found to be in the range 0.3-0.4% of total soluble protein, as measured by immunodot blot analysis using polyclonal antibodies raised against the protein. Bioassays carried out under controlled environmental conditions, using clip cages, showed that the number of nymphs produced on these transgenic plants was significantly (/><0.01) reduced compared to that on non-transgenic control plants. The decrease in fecundity observed in this bioassay was similar to that seen in the artificial diet bioassays. Large scale glasshouse trials showed that the rate of population build-up on the GNA-expressing plants was approximately four-fold lower than on the control plants. These experiments demonstrate that the insecticidal effects of GNA observed in artificial diets can be reproduced in planta, both under laboratory bioassay conditions and in the glasshouse. Copyright © 1996 Elsevier Science Ltd
Aphid Bioassay Lectin Insecticidal Resistant transgenic potatoes
INTRODUCTION
The Glasshouse Potato Aphid. Aulacorthum solani (Kalt.) is a major pest of potato (Solanum tuberosum L.) which occurs sporadically in Europe and North America.
It is polyphagous and can also be a major pest of Capsicum spp. and a minor pest of buckwheat (Fagopyrum esculentum). carnation (Dianthus caryophyllum), tobacco (Nicotiana tabacum) and tomato (Lycopersicum
'Department of Biological Sciences. University of Durham. Science t A X I S Genetics Company Ltd. Babraham. Cambridge CB2 4AZ. U.K. Laboratories. South Road. Durham DH1 3 L E . U.K. iTo whom all correspondence should be addressed.
1035

1036 R A C H E L E . D O W N ei nl.
esculentum). Minor damage is caused by the aphids feeding on sprouts of stored potato tubers but most field damage is due to the aphid acting as a vector for more than 30 different virus diseases (Hil l . 1987). Chemical control to date includes the use of a wide range of systemic and contact insecticides. However, insecticide-resistant aphid populations have arisen as a direct result of intensive and widespread use of these chemicals (Devonshire. 1989). Therefore integrated control schemes, preferably incorporating some degree of host plant insect resistance, are becoming more desirable for aphid control. One method by which endogenous resistance can be provided in crop plants where the available gene pool does not contain suitable resistance genes, is that of genetic engineering.
The production of insecticidal compounds by transgenic plants is essentially limited by existing technology to toxic or antimetabolic proteins. The use of endogenous plant defensive proteins, such as enzyme inhibitors and lectins, which can be transferred from resistant to non-resistant species is our strategy for protecting crop plants (see review by Gatehouse et al., 1992). Various lectins have already proved toxic towards members of the Coleoptera (Gatehouse et al., 1984, 1989: Czapla and Lang. 1990; Murdoch et al., 1990), Lepidoptera (Shukle and Murdoch, 1983; Czapla and Lang. 1990; Gatehouse et al., 1992), Diptera (Eisemann et al.. 1994) and Homoptera (Powell et al., 1993; Habibi et al., 1993). Recently several mannose-specific lectins, including snowdrop lectin (Galanthus nivalis agglutinin, GNA), have been shown to inhibit development of the peach-potato aphid, Myzus persicae (Sulzer); GNA had a significant effect on parthenogenetic fecundity as well as on insect development (Sauvion et al., 1996). GNA has the potential to be exploited in crop protection, using genetic manipulation since it is non-toxic to mammals and may even be beneficial (Pusztai et al., 1993).
This paper examines the effects of GNA on survival, development and fecundity of A. solani, when tested in artificial diet. It also describes comparable effects obtained in transgenic plant studies, both under controlled environmental conditions and in large-scale glasshouse trials.
MATERIALS AND METHODS
Insect culture
A culture of A. solani (Kalt.) was obtained from a laboratory clone maintained at INRA/INSA. Lyon, France. Insects were maintained on potato, Solanum tuberosum L. cv. Desiree, under glasshouse conditions using methods described by Blackman (1971).
Chemicals and materials
GNA was supplied by Vector (Peterborough, U.K.). A l l other dietary components were obtained from the Sigma Chemical Company (Poole, U.K.) or BDH (Poole, U.K.).
Artificial diet preparation The diet used was that of Febvay et al. (1988) and is
referred to as diet AS. The diet was modified by substituting phenylalanine for /3-alanyltyrosine on a mole for mole basis. Diet was filter-sterilized through 0.2 /xm Millipore filters into 5 ml aliquots and stored at - 2 0 ° C .
Artificial diet bioassays In the normal bioassay method, mature, apterous, par
thenogenetic A. solani were taken from the stock culture and placed at a density of three insects per feeding chamber with feeding sachets containing 200 /x\ of A5 diet, as described by Powell et al. (1993). After 24 h the newly emerged first instar nymphs were transferred to new feeding chambers (five insects per dish) with feeding sachets containing either 200 ju.1 of A5 diet, diet +0.1% (w/v) GNA, or no diet. Ten replicates were set up for each treatment and for the controls. The feeding chambers were kept in an illuminated Gallenkamp cooled incubator at a temperature of 21°C±2°C and a L16 : D8 lighting regime. Feeding sachets were replaced every 2 days to avoid contamination and deterioration of the diet. The number of surviving insects in each feeding chamber was recorded daily, as was cumulative nymph production following maturity (newly emerged nymphs were removed with each diet change).
In a modified bioassay technique, first instar nymphs were obtained as before but were reared on A5 diet. On Day 10 these maturing aphids were re-distributed, five insects per feeding chamber, to 10 replicates each of A5 diet only and A5 diet +0.1% (w/v) GNA. The feeding chambers were kept in the above conditions except that diet sachets were replaced every 3 days and the parafilm was sterilized using a UV transilluminator. Adult mortality and cumulative nymph production were recorded daily.
Growth measurements Aphid artificial diet bioassays were set up as described
above ('normal' method), except that a plastic ring (diameter 4 cm) was used for the feeding chamber instead of a Petri dish, enabling the aphids to be handled with a paintbrush every day without removing the diet sachet. Length (from the tip of the head to the tip of the cauda) and width (across the metathorax) measurements were taken for each individual aphid on a daily basis by using a video monitor linked to a Microscale Image Analysis package.
Plant material Virus-free, sterile plantlets of S. tuberosum L. cv.
Desiree were obtained from the Scottish Office, Agriculture and Fisheries Department, Edinburgh, U.K. Shoot cultures were maintained in test tubes containing 10 ml potato medium (PM) as described in Newell et al. (1991). The cultures were grown at 22°C with a 16 h photop-eriod. Shoots were subcultured monthly by excising ca. lem of the shoot tip and transferring to fresh PM. When

G N A I N H I B I T S A P H I D D E V E L O P M E N T 1037
the shoots were about 12 cm in length, the internode sections were used in transformation experiments.
Production of transgenic plants
Details of plasmid construction are given elsewhere (Gatehouse et al., 1996). In brief, the GNA gene was obtained as clone LECGNA2 (van Damme, 1991) and the coding region fragment was cloned between the cauliflower mosaic virus (CaMV) 35S promoter sequence and the nopaline synthase (NOS) transcriptional terminator sequence to produce an expression cassette. This was introduced into a binary vector system and mobilized into Agrobacterium tumefaciens (strain LBA4404).
For transformation, A. tumefaciens LBA4404 containing gene constructs as part of a binary vector, was inoculated into 50 ml of liquid YEP (10 g/1 bacto-peptone, 10 g/1 yeast extract, 5 g/1 sodium chloride) medium containing 1 mg/1 tetracycline in a 250 ml flask. The flasks were shaken overnight at 30°C. After approximately 16 h growth, the suspension was centrifuged at 1800 g for 20 min and the pellet resuspended in a volume of liquid inoculation medium sufficient to give an A600 O.D. reading for the suspension of 0.5. The inoculation medium consisted of Murashige and Skoog (1962) (MS) medium (1CN Biomedicals Ltd, Thame. U.K.) with 30 g/1 sucrose.
Transformation of stem tnternode explants was performed according to the method of Newell et al. (1991), with the following exceptions. The stem sections were incubated in 10 ml of bacterial suspension in a Petri dish. 100 sections per dish, for 30 min; following inoculation they were transferred to co-culture plates containing a feeder layer of 1.5 ml of a Nicotiana benthamiana cell suspension, maintained by weekly subculturing in a liquid medium of MS salts, B5 medium vitamins (Gamborg et al., 1968), 30 g/1 sucrose. 0.2 mg/1 6-ben-zylaminopurine (BAP) and 1 mg/1 2,4-dichloroacetic acid (2,4-D), and covered by a sterile filter paper. Shoots which developed were initially screened for GUS activity with the indigogenic substrate, 5-bromo-4-chloro-3-indolyl-, /3-D-glucuronide (X-gluc), according to the method of Jefferson (1987) with some modifications. The substrate solution contained 0.5 mg/ml X-gluc. cyclohexylammonium salt (Biosynth Ag.) in 0.1 M sodium phosphate buffer. 0.5 mM K^FefCN)^, 0.5 mM K 4Fe(CN) 6 , 10 mM Na.EDTA and 0.06% Triton-X. Sections of stem were immersed in substrate and incubated at 37°C overnight before being transferred to 70% etha-nol. Once confirmed, transgenic plantlets were assayed for activity of the introduced genes of interest.
Plant propagation
All plants used in insect bioassays. including non-transformed control plants, were propagated in tissue culture. Once a good root system had developed, plantlets were potted out in John Innes no. 3 compost and a polythene bag placed over each plant. On reaching a height of 10 cm. the top of the bag was opened to enable venti
lation: after a week the bag was removed. Plants were grown at a temperature of 20°C under a L16 : D8 lighting regime.
Determination of transgene expression levels
The expression of GNA in transgenic plants used for insect bioassays was determined using an immunodot-blot assay detection system. Comparable leaf samples (the end leaflet from the third compound leaf) were taken from each plant, frozen in liquid nitrogen and freeze-dried. The samples were ground manually and proteins were extracted in 50 mM Tris-HCl pH 9.5 (containing 1% fresh 36 mg/ml PMSF in ethanol) using 10 mg dried leaf/ml buffer. Extraction was carried out overnight at 4°C. The samples were centrifuged for 10 min at 12 000 g, 4°C. The supematants were transferred to clean tubes and the total protein concentration was quantified against BSA using the protein assay system of Bradford (1976); reagents from Bio-Rad, Hemel Hempstead, U.K.).
For the dot-blot assay 5 ju.g total protein per well was loaded on to 0.2 tim nitrocellulose (Schleider and Schuell BA83) in a Bio-Rad dot-blot apparatus. Standards were prepared by adding purified GNA to 5 /xg total protein from an untransformed control plant, so that GNA was present at levels ranging from 0-2.0% of total soluble protein. After loading the samples the filter was blocked in 20 mM Tris-HCl pH 7.2. 0.9% NaCl (TN) containing 5% low fat milk powder (Blotto), overnight at 4°C, before incubating with GNA antibody (1 in 5000 dilution in TN buffer) for 2 h at 37°C. After washing the filter in Blotto, it was incubated with 5 tiCi l 2 5 I-don-key anti-rabbit IgG in 25 ml TN buffer, for 2 h at 37°C. Then the blot was washed in Blotto, rinsed in TN buffer, blotted dry and exposed to Hyperfilm (Kodak, Cambridge, U.K.) for 24 h.
Confirmation of GNA expression in potato trans-formants was obtained by Western blotting. Leaf extracts containing 5 tig of total protein were analysed by SDS-polyacrylamide gel elctrophoresis on 15% acrylamide gels. Following separation, proteins were electroblotted onto nitrocellulose filters (Schleicher and Schuell BA85). The filter was processed as described for the dot-blot procedure above, and the GNA polypeptides were detected by ECL following the protocol supplied by the kit manufacturer (Amersham. U.K.).
Plant bioassays
Following the method of Birch and Wratten (1984). three clip cages per plant and eight plants of each type (control and GNA expressing) were set up using a synchronized population of mature, apterous, parthenogenetic aphids. thus giving a total of 24 replicas for each of the two different plant lines. In all cases aphids were caged on the abaxial leaf surfaces and these cages where placed throughout the leaf canopy. After 24 h. all adults, and all but two of the resulting nymphs were removed from the cages. These were left undisturbed until maturity
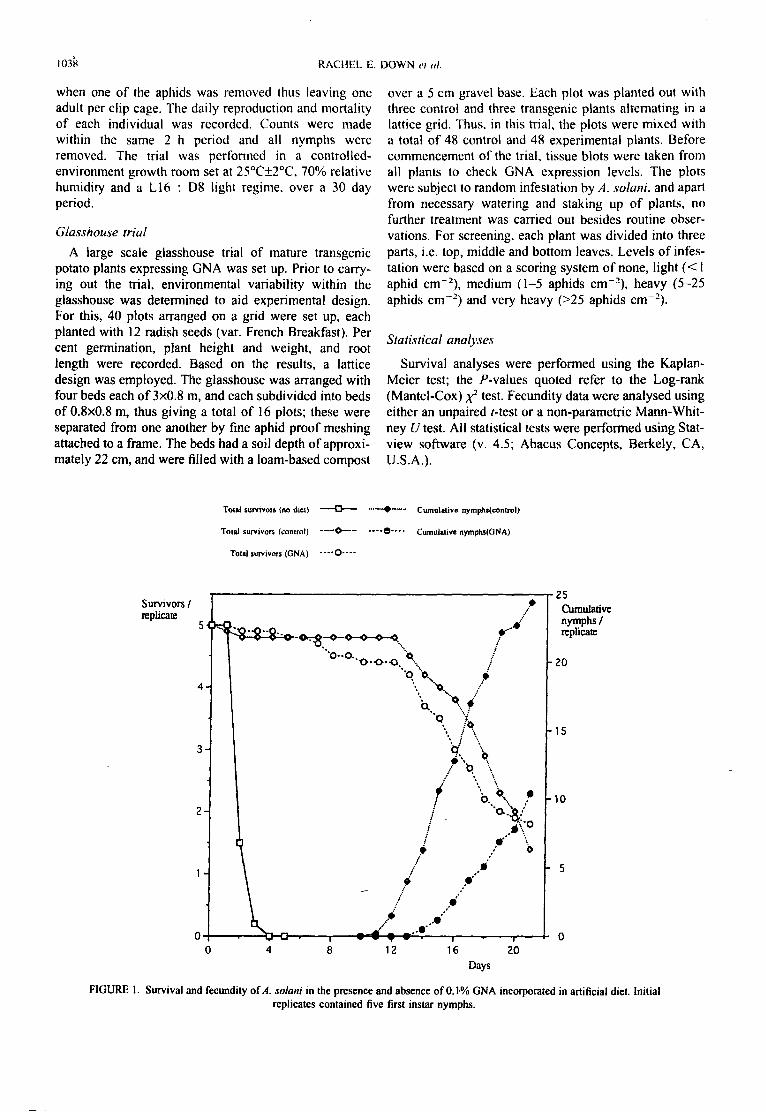
1038 R A C H E L E . DOWN et til.
when one of the aphids was removed thus leaving one adult per clip cage. The daily reproduction and mortality of each individual was recorded. Counts were made within the same 2 h period and all nymphs were removed. The trial was performed in a controlled-environment growth room set at 25°C±2°C, 70% relative humidity and a L16 : D8 light regime, over a 30 day period.
Glasshouse trial
A large scale glasshouse trial of mature transgenic potato plants expressing GNA was set up. Prior to carrying out the trial, environmental variability within the glasshouse was determined to aid experimental design. For this, 40 plots arranged on a grid were set up, each planted with 12 radish seeds (var. French Breakfast). Per cent germination, plant height and weight, and root length were recorded. Based on the results, a lattice design was employed. The glasshouse was arranged with four beds each of 3x0.8 m, and each subdivided into beds of 0.8x0.8 m, thus giving a total of 16 plots; these were separated from one another by fine aphid proof meshing attached to a frame. The beds had a soil depth of approximately 22 cm, and were filled with a loam-based compost
over a 5 cm gravel base. Each plot was planted out with three control and three transgenic plants alternating in a lattice grid. Thus, in this trial, the plots were mixed with a total o f 48 control and 48 experimental plants. Before commencement of the trial, tissue blots were taken from all plants to check GNA expression levels. The plots were subject to random infestation by A. solani, and apart from necessary watering and staking up of plants, no further treatment was carried out besides routine observations. For screening, each plant was divided into three parts, i.e. top, middle and bottom leaves. Levels of infestation were based on a scoring system of none, light ( < 1 aphid c m - 2 ) , medium (1-5 aphids cm" 2 ) , heavy (5-25 aphids c m - 2 ) and very heavy (>25 aphids cm" 2 ) .
Statistical analyses
Survival analyses were performed using the Kaplan-Meier test; the /"-values quoted refer to the Log-rank (Mantel-Cox) x2 test. Fecundity data were analysed using either an unpaired /-test or a non-parametric Mann-Whitney U test. A l l statistical tests were performed using Stat-view software (v. 4.5; Abacus Concepts, Berkely, CA, U.S.A.).
Tola! survivors (no dicl) ~ - ~ O — ~ • Cumulative nyrnphs(control)
Toial survivors (control) 9 . . . . Cumulaiive nymphs(GNA)
Toial survivors (GNA) - — O — •
Survivors / replicate
0 - 0 - 0 . \
•25 Cumulative nymphs/ replicate
•20 •O ft
A 4 X X
"i \ f to \
- 1 5
2 -b. °x •10
•
12 16 20 Days
F I G U R E 1. Survival and fecundity of/1, solani in the presence and absence of 0.1% GNA incorporated in artificial diet. Initial replicates contained five first instar nymphs.
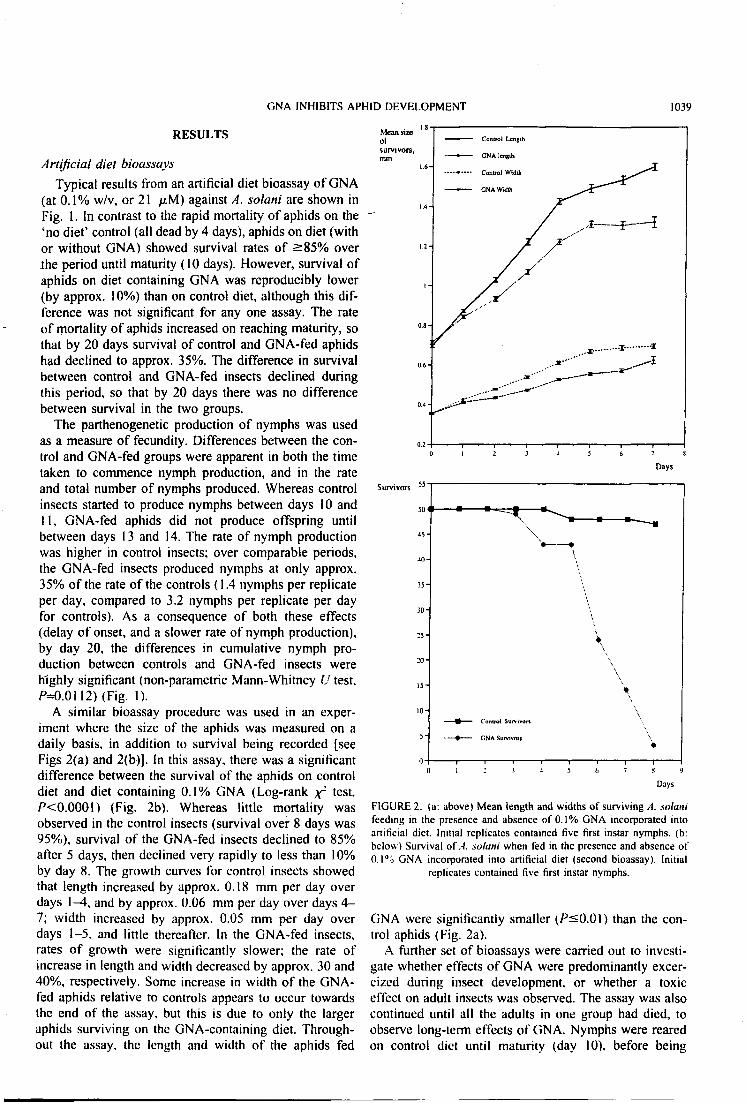
GNA INHIBITS APHID D E V E L O P M E N T 1039
RESULTS
Artificial diet bioassays Typical results from an artificial diet bioassay of GNA
(at 0 .1% w/v, or 21 p.M) against A. solani are shown in Fig. 1. In contrast to the rapid mortality of aphids on the 'no diet' control (all dead by 4 days), aphids on diet (with or without GNA) showed survival rates of s85% over the period until maturity (10 days). However, survival of aphids on diet containing GNA was reproducibly lower (by approx. 10%) than on control diet, although this difference was not significant for any one assay. The rate of mortality of aphids increased on reaching maturity, so that by 20 days survival of control and GNA-fed aphids had declined to approx. 35%. The difference in survival between control and GNA-fed insects declined during this period, so that by 20 days there was no difference between survival in the two groups.
The parthenogenetic production of nymphs was used as a measure of fecundity. Differences between the control and GNA-fed groups were apparent in both the time taken to commence nymph production, and in the rate and total number of nymphs produced. Whereas control insects started to produce nymphs between days 10 and 11, GNA-fed aphids did not produce offspring until between days 13 and 14. The rate of nymph production was higher in control insects; over comparable periods, the GNA-fed insects produced nymphs at only approx. 35% o f the rate of the controls (1.4 nymphs per replicate per day, compared to 3.2 nymphs per replicate per day for controls). As a consequence of both these effects (delay of onset, and a slower rate of nymph production), by day 20, the differences in cumulative nymph production between controls and GNA-fed insects were highly significant (non-parametric Mann-Whitney U test, Z^O.0112) (Fig. 1).
A similar bioassay procedure was used in an experiment where the size of the aphids was measured on a daily basis, in addition to survival being recorded [see Figs 2(a) and 2(b)]. In this assay, there was a significant difference between the survival of the aphids on control diet and diet containing 0.1% GNA (Log-rank y test. / J<0.0001) (Fig. 2b). Whereas little mortality was observed in the control insects (survival over 8 days was 95%), survival of the GNA-fed insects declined to 85% after 5 days, then declined very rapidly to less than 10% by day 8. The growth curves for control insects showed that length increased by approx. 0.18 mm per day over days 1-4, and by approx. 0.06 mm per day over days 4 -7; width increased by approx. 0.05 mm per day over days 1-5, and little thereafter. In the GNA-fed insects, rates of growth were significantly slower; the rate of increase in length and width decreased by approx. 30 and 40%, respectively. Some increase in width of the GNA-fed aphids relative to controls appears to occur towards the end of the assay, but this is due to only the larger aphids surviving on the GNA-containing diet. Throughout the assay, the length and width of the aphids fed
Mean size Control Length
survivors. GNA length
Control width
GNA Width
Days
c 55 Survivors
Control Survivor,
GNA Survivor,
0 1 : 3 - 5 6 7 8 9
Days
F I G U R E 2. (a: above) Mean length and widths of surviving A. solani feeding in the presence and absence of 0.1% GNA incorporated into artificial diet. Initial replicates contained rive first instar nymphs, (b: below) Survival of A. solani when fed in the presence and absence of 0.1% GNA incorporated into artificial diet (second bioassay). Initial
replicates contained five first instar nymphs.
GNA were significantly smaller (P<0.01) than the control aphids (Fig. 2a).
A further set of bioassays were carried out to investigate whether effects of GNA were predominantly excer-cized during insect development, or whether a toxic effect on adult insects was observed. The assay was also continued until all the adults in one group had died, to observe long-term effects of GNA. Nymphs were reared on control diet until maturity (day 10), before being

1040 R A C H E L E . DOWN et til.
transferred to diet with or without the addition of 0.1% GNA. In this experiment, there were no significant differences in survival between control and experimental (Log-rank x1 test. /MX7287). with both groups declining to zero survival by day 35 (Fig. 3). The effects of GNA on the fecundity of aphids in this bioassay were less than when the insects were exposed to GNA during development to maturity. A delay in the onset of nymph production of 3 days was again apparent in the GNA-fed group, but the rates of nymph production were similar in both groups (approx. 1.0 nymphs per replicate per day) until day 23. and the cumulative nymph production was only decreased by 14%. After this time, the nymph production rate declined markedly in the GNA-fed insects, but declined more slowly in the control insects, so that by day 34 the cumulative nymph production was 23% lower in the GNA-fed group. In this assay, overall nymph production was observed to be less than in previous assays, however differences in nymph production between control and GNA-fed groups were not significant at any one time point (non parametric Mann-Whitney U test, /M).6776 on day 20 and />=0.1620 on day 34).
Transgenic plant bioassays
Production and selection of transgenic plants Potato plants expressing GNA under the control of the
constitutive Cauliflower Mosaic Virus (CaMV) 35S promoter were produced by Agrobacterium tumefaciens— mediated gene transfer technology (see Materials and Methods section). Transformants were screened for the presence of GNA by immunoassay. Proteins from leaf tissue samples were analysed by SDS-polyacrylamide gel electrophoresis, and GNA polypeptides were detected by Western blotting using polyclonal anti-GNA antibodies. These blots showed that GNA was present in the transgenic potatoes as a single polypeptide of 12 000 M r (Fig. 4). The protein was shown to be functionally active by haemagglutination assays and by binding to affinity matrices (results not presented).
On the bases of expression levels of GNA, one potato line was selected for aphid bioassays. Both transgenic and control plants were multiplied by clonal propagation in tissue culture before being planted out, so that the assays were carried out on genetically uniform plants. Just prior to infestation, leaf samples were taken from all plants, ensuring that comparable leaves were taken. The expression levels of GNA in these samples were determined by immunodot blot analyses, using leaf extracts from control potato plants spiked with different concentrations of the purified protein to form a calibration. GNA levels in all experimental plants were similar, and lay in the range 0.3-0.4% of total soluble protein. No GNA could be detected in leaves from control plants.
Survivors/rep (control)
Survivors/rep (GNA) - O
• Nymphs/rep (control)
- • Nymphs/rep (GNA)
Survivors/ replicate
Cumulative nymphs/ replicate
-12
-10
- 8
- 4
- 2
F I G U R E 3. Survival and fecundity of A. solani when fed on 0.1% GNA incorporated into artificial diet from the onset of maturity, and diet only. Initial replicates contained five first instar nymphs.

GNA INHIBITS APHID D E V E L O P M E N T
A B C D E
1041
— Mr 12,000
F I G U R E 4. Western blot of GNA transgenic potato plants showing correct processing of the transgene. Tracks A, GNA standards (5 ng); B. C . non-transformed potato (control), clonal replicates; D, E , transformed line, clonal replicates. The blot
was probed with GNA antibodies.
Growth cabinet bioassay of transgenic potatoes against aphids Control and transgenic potato plants were grown to maturity under controlled environmental conditions, and exposed to aphids under a standard 'clip-cage' bioassay protocol (see Materials and Methods). Survival of the initial nymphs to maturity was 100% on both control and experimental plants under these conditions. No significant lag in nymph production between control and experimental groups was observed, both groups producing nymphs between days 9 and 10. However, whereas nymph production averaged 2.0 nymphs per adult per day for aphids on the control plants over the assay period 9-25 days (Fig. 5). the rate of production on the GNA-expressing plants was only 0.8 nymphs per adult per day, a decrease of approximately 60%. The fecundity of the aphids on the GNA-expressing plants was thus highly significantly reduced (unpaired /-test, / 3 <0.01 for total nymphs on day 25). In the assay period 25-30 days, rates of nymph production per adult increased in both control and experimental groups, as the plants were becoming senescent, but fecundity on the control plants remained over twice as high as on the GNA-expressing plants. Mortality of aphids on both control and GNA-expressing plants was observed once nymph production started, so that by day 30 survival in both groups was in the range 35^40%. Taken over the whole assay (30 days), there was no significant difference between the survival of the aphids on control plants and transgenic plants (log-rank x2 test, P=0.4689). However, survival of the aphids on GNA-expressing plants was higher than the control
group over the time range 15-28 days, at times by as much as 35%, and declined rapidly only during the last 2 days of the assay.
Large scale glasshouse bioassay of transgenic potatoes against aphids Environmental variability within the glasshouse was assessed before commencement of the glasshouse trials. The results showed that there were no differences in seed germination between the plots, and although there were differences in the growing conditions within the glasshouse, these differences were small and not significant. Based on these results, a lattice design was employed using mixed plots of transgenic and control plants, where each plot, containing three control and three transgenic plants, was separated from the others. Tissue blots were used to show that GNA expression was present in all the clonal replicates of the transgenic plants to be assayed, and was absent from control plants (Fig. 6).
The glasshouse was randomly infested with aphids, and the progress of infestation was monitored by sampling all the plants. Because of the mixed plot design of the trial, aphids had equal chances of infesting control and transgenic plants, and could migrate between plants from the two groups. In order to determine whether the presence of GNA affected the pattern of aphid colonization, infestation levels were seperately monitored in the upper, middle and lower layers of the leaf canopy. These results showed that expression of GNA did not influence the pattern of colonization: in both control and transgenic plants the top leaves were the most favoured for infes-
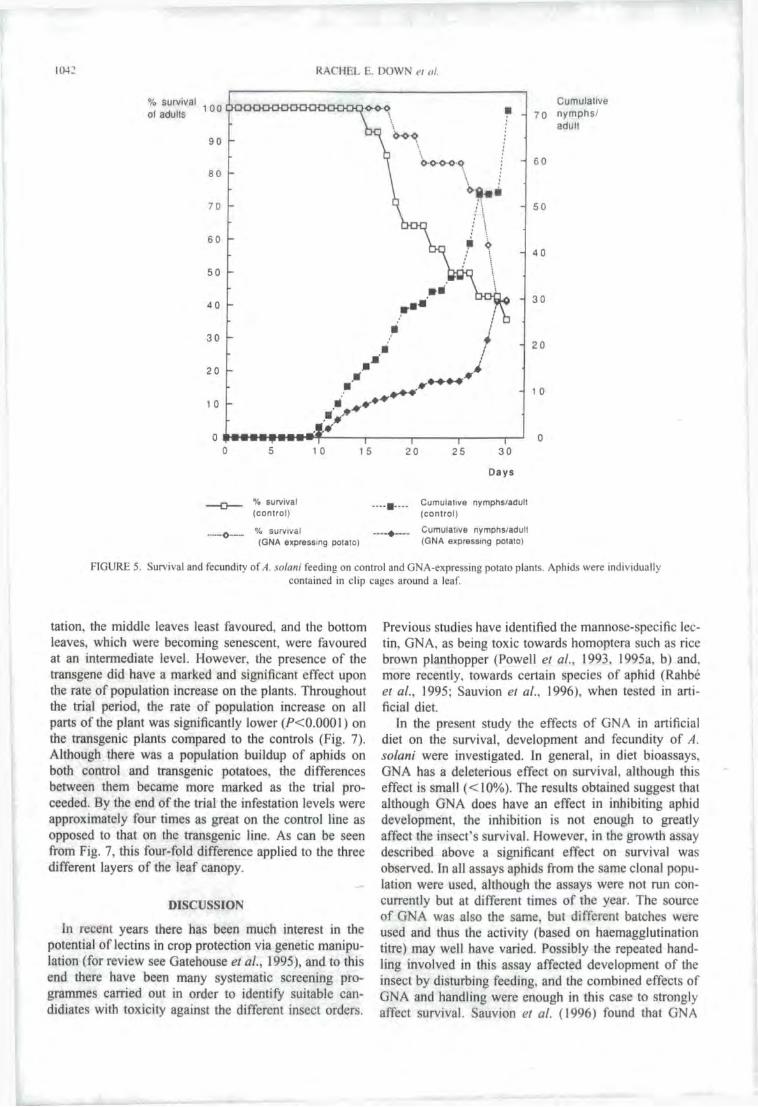
R A C H E L E. DOWN <•/ al.
% survival of adults
Cumulative 1 0 0 Q-OO 7 0 nymphs.'
,'>rlu'!
ooo
o o o o o
6 0
4 0
1 0 1 0
0 5 10 15 20 25 30
Days
Cumulative nymphs/adult (control)
Cumulative nymphs/adult (GNA expressing potato)
F I G U R E 5. Survival and fecundity of A. solani feeding on control and GNA-expressing potato plants. Aphids were individually contained in clip cages around a leaf.
% survival (control)
% survival (GNA expressing potato)
tation. the middle leaves least favoured, and the bottom leaves, which were becoming senescent, were favoured at an intermediate level. However, the presence of the transgene did have a marked and significant effect upon the rate of population increase on the plants. Throughout the trial period, the rate of population increase on all parts of the plant was significantly lower (/ 5<0.0001) on the transgenic plants compared to the controls (Fig. 7). Although there was a population buildup of aphids on both control and transgenic potatoes, the differences between them became more marked as the trial proceeded. By the end of the trial the infestation levels were approximately four times as great on the control line as opposed to that on the transgenic line. As can be seen from Fig. 7, this four-fold difference applied to the three different layers of the leaf canopy.
DISCUSSION
In recent years there has been much interest in the potential of lectins in crop protection via genetic manipulation (for review see Gatehouse et al., 1995), and to this end there have been many systematic screening programmes carried out in order to identify suitable can-didiates with toxicity against the different insect orders.
Previous studies have identified the mannose-specific lectin, GNA, as being toxic towards homoptera such as rice brown planthopper (Powell et al., 1993, 1995a, b) and. more recently, towards certain species of aphid (Rahbe et al., 1995; Sauvion et al., 1996), when tested in artificial diet.
In the present study the effects o f GNA in artificial diet on the survival, development and fecundity of A. solani were investigated. In general, in diet bioassays, GNA has a deleterious effect on survival, although this effect is small (<10%). The results obtained suggest that although GNA does have an effect in inhibiting aphid development, the inhibition is not enough to greatly affect the insect's survival. However, in the growth assay described above a significant effect on survival was observed. In all assays aphids from the same clonal population were used, although the assays were not run concurrently but at different times of the year. The source of GNA was also the same, but different batches were used and thus the activity (based on haemagglutination titre) may well have varied. Possibly the repeated handling involved in this assay affected development of the insect by disturbing feeding, and the combined effects of GNA and handling were enough in this case to strongly affect survival. Sauvion et al. (1996) found that GNA
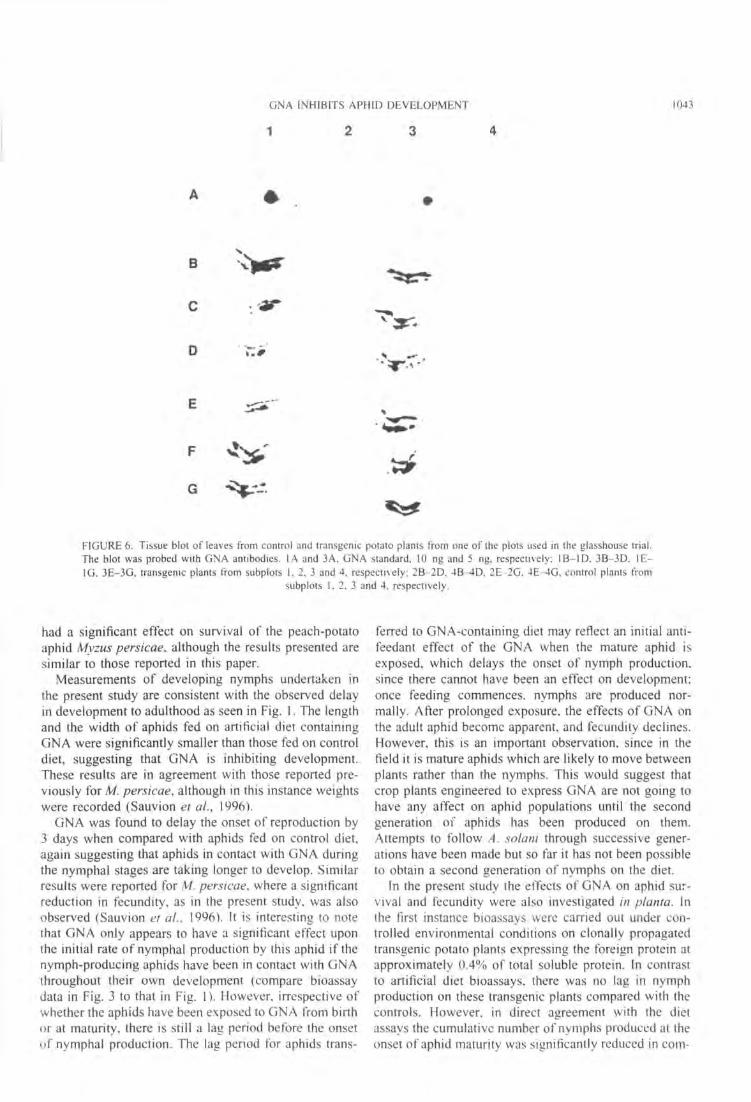
GNA INHIBITS APHID D E V E L O P M E N T
1 2 3 4
1043
A *
B
G
F I G U R E 6. Tissue blot of leaves from control and transgenic potato plants from one of the plots used in the glasshouse trial. The blot was probed with GNA antibodies. lA and 3A, GNA standard. 10 ng and 5 ng. respectively: I B - I D . 3B-3D. I E -l G . 3 E - 3 G , transgenic plants from subplots l . 2. 3 and 4, respectively: 2B-2D. 4B^4D. 2E-2G. 4E-4G. control plants from
subplots l . 2. 3 and 4. respectively.
had a significant effect on survival of the peach-potato aphid Myzus persicae, although the results presented are similar to those reported in this paper.
Measurements of developing nymphs undertaken in the present study are consistent with the observed delay in development to adulthood as seen in Fig. I . The length and the width of aphids fed on artificial diet containing GNA were significantly smaller than those fed on control diet, suggesting that GNA is inhibiting development. These results are in agreement with those reported previously for M. persicae, although in this instance weights were recorded (Sauvion et a/., 1996).
GNA was found to delay the onset of reproduction by 3 days when compared with aphids fed on control diet, again suggesting that aphids in contact with GNA during the nymphal stages are taking longer to develop. Similar results were reported for M, persicae. where a significant reduction in fecundity, as in the present study, was also observed (Sauvion et al„ 1996). It is interesting to note that GNA only appears to have a significant effect upon the initial rate of nymphal production by this aphid i f the nymph-producing aphids have been in contact with GNA throughout their own development (compare bioassay data in Fig. 3 to that in Fig. I) . However, irrespective of whether the aphids have been exposed to GNA from birth or at maturity, there is still a lag period before the onset of nymphal production. The lag period for aphids trans
ferred to GNA-containing diet may reflect an initial anti-feedant effect of the GNA when the mature aphid is exposed, which delays the onset of nymph production, since there cannot have been an effect on development: once feeding commences, nymphs are produced normally. After prolonged exposure, the effects of GNA on the adult aphid become apparent, and fecundity declines. However, this is an important observation, since in the field it is mature aphids which are likely to move between plants rather than the nymphs. This would suggest that crop plants engineered to express GNA are not going to have any affect on aphid populations until the second generation of aphids has been produced on them. Attempts to follow A. solani through successive generations have been made but so far it has not been possible to obtain a second generation of nymphs on the diet.
In the present study the effects of GNA on aphid survival and fecundity were also investigated in planta. In the first instance bioassays were carried out under controlled environmental conditions on clonally propagated transgenic potato plants expressing the foreign protein at approximately 0.4% of total soluble protein. In contrast to artificial diet bioassays. there was no lag in nymph production on these transgenic plants compared with the controls. However, in direct agreement with the diet assays the cumulative number of nymphs produced at the onset of aphid maturity was significantly reduced in com-

1044 R A C H E L E. DOWN ei at
MIDDLE
Comrol Planis
— • GNA-Expressmg Plants
Day
r. 1 5 -
BOTTOM
Day
F I G U R E 7. Population build-up of A. solani on control and GNA-expressing potato in glasshouse trial.
parison with those on control plants. Although there were no significant differences between the survival of aphids on control and transgenic plants, it is interesting to note that between days 16 and 29 the survival on the transgenic plants is consistently better than that on the control plants. This would suggest that the aphids feeding on plants containing GNA are living longer to try and compensate for the reduced fertility, but to no avail.
From the data presented it can be concluded that a population of aphids would build up significantly slower on plants containing GNA than on control potato plants, and thus the presence of the transgene is conferring a measure of protection to the crop. Similar results were also obtained in large-scale glasshouse trials, where the rate of population build-up was four-fold slower on the transgenic plants compared with that on control plants. These results are in broad agreement with those recently reported for M. persicae (Gatehouse el al., 1996), although in this study they did not carry out any glasshouse trials.
The present study shows that in artificial diet GNA has a marked and significant deleterious effect upon development and fecundity of the Glasshouse Potato Aphid A. solani. Of importance is the finding that these results are not only reproducible in small-scale trials carried out under controlled environmental conditions, but also under large-scale glasshouse trials. As far as the authors are aware, this is the first report of such glasshouse trials being carried out demonstrating significant levels of aphid resistance of genetically engineered crops. The relevance of these results to crop protection in the field has yet to be tested, although the results obtained so far are encouraging, and suggest that this strategy could make a viable contribution to crop protection, particularly when used as part of an IPM (Integrated Post Management) system. Since aphids are also responsible for transmission of viral diseases, in addition to direct physical damage of the plant itself, the consequences of expressing foreign proteins on the probing behaviour, and subsequent uptake and transmission of viruses by the aphid, are being investigated.
R E F E R E N C E S
Birch N. and Wratten S. D. (1984) Patterns of aphid resistance in the Genus Vicia. Ann. App. Biol. 104, 327-338.
Blackman R. L . (1971) Variation in the photoperiodic response within natural populations of My:us persicae (sulz). Bull. Enl. Res. 60, 533-546.
Bradford M. M. (1976) A rapid and sensitive method for the quantification of microgram quantities of protein using the principle of protein-dye binding. Analyi. Biochem. 72. 248-254.
Czapla T. H. and Lang B. A. (1990) Effect of plant lectins on the larval development of European corn borer (Lepidoptera: Pyralidae) and Southern corn rootworm (Coleoptera: Chrysomelidae). J. Econ. Em. 83, 280-285.
Devonshire A. L . (1989) Insecticide resistance in Myzuspersicae: from field to gene and back again. Pestic. Sci. 26, 375-382.
Eisemann C. H.. Donaldson R. A.. Pearson R. D„ Cadagon L . C , Vuocolo T. and Tellam R. L . (1994) Larvicidal activity of lectins on Lucilia cuprina: Mechanism of action. Ent. Exp. Appl. 72 , 1-11.
Febvay G. . Delobel B. and Rahbe Y. (1988) Influence of the amino acid balance on the improvement of an artificial diet for a biotype of Acvrthnsiphon pisum (Homoptera: Aphididae). Can. J. Zool. 66, 2449-2453.
Gamborg O. L . , Miller R. A. and Ojima K. (1968) Nutrient requirements of suspension cultures of soybean root cells. Exp. Cell Res. 50, 151-158.
Gatehouse A. M. R.. Boulter D. and Hilder V. A. (1992) Potential of plant-derived genes in the genetic manipulation of crops for insect resistance. In Plant Genetic Manipulation for Crop Protection (Eds Gatehouse A. M. R.. Hilder V. A. and Boulter D.), pp. 135-153. C A B International. Wallingford.
Gatehouse A. M. R., Dewey F. M., Dove J . , Fenton K. A. and Pusztai A. J (1984) Effect of seed lectins from Phaseolus vulgaris on the development of larvae of Callosobntchus maculatus; mechanism of toxicity. J. Sci. Food Agric. 35 , 373-380.
Gatehouse A. M. R.. Down R. E . . Powell K. S.. Sauvion N., Rahbe Y. , Newell C . A., Merryweather A., Hamilton W. D. O. and Gatehouse J. A. (1996) Transgenic potato plants with enhanced resistance to the peach-potato aphid Myzus persicae. Ent. Exp. Appl. 79, 295-307.
Gatehouse A. M. R.. Powell K. S., Peumans W. J . , van Damme E. J. M. and Gatehouse J. A. (1995) Insecticidal properties of lectins: their potential in plant protection. In Lectins: Biomedical perspec-
GNA INHIBITS APHID D E V E L O P M E N T 1045
lives (Eds Pusztai A. J. and Bardocz S ), pp. 35-57. Taylor and Francis, Hants, U.K.
Gatehouse A. M. R.. Shackley S. J . . Fenton K. A.. Bryden J. and Pusztai A. (1989) Mechanism of seed lectin tolerance by a major insect storage pest of Phaseolus vulgaris. Acanthoscelides obtectus. J Sci. Food Agric. 47, 269-280.
Gatehouse A. M. R., Shi Y , Powell K. S., Brough C , Hilder V. A , Hamilton W. D. O.. Newell C. A., Fairweather A., Boulter D. and Gatehouse J. A. (1993) Approaches to insect resistance using transgenic plants. Proc. Royal Soc. 342 , 279-286.
Habibi J. , Backus E . and Czapla T. (1993) Plant lectins affect survival of the potato leafhopper (Homptera: Cicadellidae). J. Econ. Ent. 86, 945-951.
Hill D. S. (1987) Agricultural Insect Pests of Temperate Regions and their Control, pp. 216. Cambridge University Press, Cambridge.
Jefferson R. A. (1987) Assaying chimeric genes in plants: the G U S gene fusion system. PI. Mol. Biol. Rep. 5, 387-405.
Murashige T. and Skoog F. (1962) A revised medium for rapid growth and bio assays with tobacco tissue cultures. Phys. Planta. 15, 473-497.
Murdoch L . L„ Huesing J. E . , Nielsen S. S., Pratt R. C. and Shade R. E . (1990) Biological effects of plant lectins on the cowpea weevil. Phyiochemistry 29, 85-89.
Newell C . A.. Rozman R., Hinchee M. A.. Lawson E . C , Haley L„ Sanders P.. Kaniewski W., Turner N. E . . Horsch R. B. and Fraley R. T. (1991) Agrobacterium-mediated transformation of Solanum tuberosum L. cv. Russet Burbank. Plant Cell Reports 10, 30-34.
Powell K. S., Gatehouse A. M. R.. Hilder V. A. and Gatehouse J. A. (1993) Antimetabolic effects of plant lectins and plant and fungal enzymes on the nymphal stages of two important rice pests. Nila-parwta lugens and Nephotettix cinciteps. Ent. Exp. Appl. 66, 119-126.
Powell K. S., Gatehouse A. M. R.. Hilder V. A. and Gatehouse J. A. (1995a) Antifeedant effect of plant lectins and an enzyme on the adult stage of the rice brown plant hopper Nilaparvata lugens. Ent. Exp. Appl. 75, 51-59.
Powell K. S., Gatehouse A. M. R., Hilder V. A„ Van Damme E. J. M„ Peumans E . J . , Boonjawat J.. Horsham K. and Gatehouse J. A. (1995b) Different antimetabolic effects of related lectins towards nymphal stages of Nilaparvata lugens. Ent. Exp. Appl. 75 , 61-65.
Pusztai A., Grant G. , Spencer R. J„ Duguid T. J . , Brown D. S., Ewen S. W. B., Peumans W. J. , Van Damme E. J. M. and Bardocz S. (1993) Kidney bean lectin-induced Escherichia coli overgrowth in the small intestine is blocked by GNA. a mannose-specific lectin. J. Appl. Bacterial. 75 , 360-368.
Rahbe Y . , Sauvion N., Febvay G., Peumans W. J. and Gatehouse A. M. R. (1995) Toxicity of lectins and processing of ingested proteins in the pea aphid Acyrthosiphon pisum. Ent. Exp. Appl. 76, 143-155.
Sauvion N., Rahbe Y . , Peumans W. J.. Van Damme E . , Gatehouse J. A. and Gatehouse A. M. R. (1996) Effects of GNA and other man-nose binding lectins on development and fecundity of the peach-potato aphid Myzus persicae. Ent. Exp. Appl. 79, 285-293.
Shukle R. H. and Murdock L . L . (1983) Lipoxygenase, trypsin inhibitor and lectin from soybeans: Effects on larval growth of Manduca sexta (Lepidoptera: Sphingidae). Environ. Ent. 12, 787-791.
Damme E. van (1991) Analysis of lectin cDNA clones from Amarylli-daceae and Alliaceae species. Ph.D. Thesis, Katholieke University Leuven, pp. 152.
Acknowledgements—Grateful thanks go to Dr K. S. Powell for help with the artificial diet bioassays and useful discussions, and to Dr L . N. Gatehouse and Dr R. R. D. Croy for producing anti-GNA antibodies. We would also like to thank Dr C. Newell and Dr A. Mer-ryweather of Axis Genetics Ltd for producing and providing the initial transgenic plant material, and Miss G M. Davison for tissue culture and maintenance of the plants. The authors would also like to acknowledge funding from B B S R C , the Department of Trade and Industry in a Link Programme with Axis Genetics, and The Scottish Office (SOAEFD). Work involving transgenic potato plants was carried out under M A F F licence No. PHF346B/1459/35.