Embed Size (px)
Citation preview

Durham E-Theses
PREPARATION OF TYPE 2 AND TYPE 3 POROUS
LIQUIDS FOR THE ABSORPTION OF VOLATILE
ORGANIC COMPOUNDS
BRASCHINSKY, ALAN
How to cite:
BRASCHINSKY, ALAN (2020) PREPARATION OF TYPE 2 AND TYPE 3 POROUS LIQUIDS FOR
THE ABSORPTION OF VOLATILE ORGANIC COMPOUNDS, Durham theses, Durham University.Available at Durham E-Theses Online: http://etheses.dur.ac.uk/13831/
Use policy
The full-text may be used and/or reproduced, and given to third parties in any format or medium, without prior permission orcharge, for personal research or study, educational, or not-for-pro�t purposes provided that:
• a full bibliographic reference is made to the original source
• a link is made to the metadata record in Durham E-Theses
• the full-text is not changed in any way
The full-text must not be sold in any format or medium without the formal permission of the copyright holders.
Please consult the full Durham E-Theses policy for further details.

Academic Support O�ce, Durham University, University O�ce, Old Elvet, Durham DH1 3HPe-mail: [email protected] Tel: +44 0191 334 6107
http://etheses.dur.ac.uk
2

PREPARATION OF TYPE 2 AND TYPE 3 POROUS LIQUIDS
FOR THE ABSORPTION OF VOLATILE ORGANIC
COMPOUNDS
THESIS SUBMITTED IN PARTIAL FULFILLMENT OF THE REQUIREMENTS
FOR THE DEGREE OF MASTER OF SCIENCE IN THE DEPARTMENT OF
CHEMISTRY
BY
ALAN BRASCHINSKY
DURHAM, UNITED KINGDOM
2020

2
Table of Contents Abstract ...............................................................................................................................................5
Abbreviations .....................................................................................................................................6
1. Introduction ....................................................................................................................................8
1.1 Ionic Liquids .............................................................................................................................9
1.1.1 Room-Temperature Ionic Liquids ................................................................................ 14
1.1.2 Imidazolium-Based Ionic Liquids ................................................................................. 15
1.1.3 Phosphonium-Based Ionic Liquids ............................................................................... 17
1.1.4 Toxicity of Ionic Liquids ................................................................................................ 18
1.1.5 Deep Eutectic Solvents ................................................................................................... 20
1.2 Porous Materials ................................................................................................................... 22
1.2.1 Techniques for the Characterisation of Pore Properties ............................................ 23
1.3 Porous Liquids ...................................................................................................................... 24
1.3.1 Type 1 Porous Liquids ................................................................................................... 24
1.3.2 Type 2 Porous Liquids ................................................................................................... 25
1.3.3 Type 3 Porous Liquids ................................................................................................... 26
1.4 Project Aims .......................................................................................................................... 27
2. Results and Discussion ................................................................................................................ 30
2.1 C-Propylpyrogallol[4]arene ................................................................................................. 30
2.2 Magnesium Seamed Hexameric Nanocapsules .................................................................. 33
2.3 Copper Seamed Hexameric Nanocapsules ......................................................................... 35
2.4 Zinc Seamed Dimeric Nanocapsules ................................................................................... 37
2.5 Guest Exchange of Zinc Seamed Dimeric Nanocapsules ................................................... 40
2.6 Metal-Organic Frameworks ................................................................................................. 42
2.6.1 Basolite® F300 ................................................................................................................. 42
3. Future Work ................................................................................................................................ 47
4. Conclusions .................................................................................................................................. 48
5. Experimental ............................................................................................................................... 49
5.1 Synthesis and Materials ........................................................................................................ 49
5.2 Synthesis of C-propylpyrogallol[4]arene ............................................................................ 50
5.3 Synthesis of metal-seamed nanocapsules ............................................................................ 50
5.3.1 Mg-seamed hexameric nanocapsules............................................................................ 50
5.3.2 Cu-seamed hexameric nanocapsules ............................................................................ 50

3
5.3.3 Zn-seamed dimeric nanocapsule ................................................................................... 51
5.4 Dye adsorption ...................................................................................................................... 51
5.5 Analysis .................................................................................................................................. 51
5.5.1 Gas diffusion of VOCs ................................................................................................... 51
5.6 Single Crystal X-ray Diffraction .......................................................................................... 52
5.6.1 Single crystal X-ray diffraction data of PgC3 .............................................................. 53
5.6.2 Single crystal X-ray diffraction data of Mg-PgC3 ....................................................... 53
6. Appendix: Structure and Abbreviation of Ionic Liquids ........................................................ 55
References ........................................................................................................................................ 57

4
Statement of Copyright
The copyright of this thesis rests with the author. No quotation from it should be published
without the author's prior written consent and information derived from it should be
acknowledged.
Acknowledgments
I would like to thank my supervisor Prof. Jonathan W. Steed for his continuous support and
help throughout the period of study. Additionally, I am grateful to the Steed Group for being
wonderfully welcoming and creating an environment conducive to learning and discovery.
5
Abstract
Porous materials have been widely used in various applications from gas capture to
electrochemistry. So far, the utilised materials have been of solid phase. However, it has been
established that liquid phase materials are more efficient in industrial settings. Thus,
engineering accessible porosity into the liquid phase can result in highly efficient and sought-
after materials.
The aim of this work was to prepare Type 2 and Type 3 porous liquids for the capture
of volatile organic compounds. For the former, dimeric and hexameric nanocapsules were
selected due to their relatively small cavity window sizes, which would allow for the
encapsulation of small VOCs, yet prevent the entrance of larger solvent molecules. To
prepare Type 3 porous liquids, a commercially available Basolite® F300 MOF was selected
due to its well-defined pore size and thermal stability. Two types of ionic liquid were
employed: imidazolium- and phosphonium-based ionic liquids. Due to the unknown
solubility of the porous solids, it was desirable to select both types of IL.
Type 2 porous liquids were not successfully prepared. This was due to the presence
of solvent molecules within the cavities of the nanocapsules as evidenced via mass
spectrometry and NMR spectroscopy and single crystal X-ray diffraction. NMR results
showed that the Zn-PgC3 nanocapsule was incapable of guest exchange. Thus, these
nanocapsules were not used for the preparation of Type 2 porous liquids.
On the other hand, stable colloids of Basolite® F300 with the phosphonium-based
ILs were prepared. To characterise the presence of empty pores within these colloids, a
biphasic dye extraction setup was used and analysed with UV-Vis spectroscopy. The results
show that PL2 does not possess superior dye absorption capabilities compared to its ionic
liquid counterpart, indicating that there is no intrinsic porosity within these porous liquids,
or that it does not affect dye absorption.

6
Abbreviations PL Porous liquid
IL Ionic liquid
VOC Volatile organic compound
MOF Metal-organic framework
MONC Metal-organic nanocapsule
DES Deep eutectic solvent
P-IL Phosphonium ionic liquid
im-IL Imidazolium ionic liquid
DMSO Dimethylsulfoxide
DMF Dimethylformamide
MeCN Acetonitrile
MALDI-MS Matrix-assisted laser desorption/ionization mass spectroscopy
NMR Nuclear magnetic resonance
DOSY Diffusion-ordered NMR spectroscopy
SXRD Single crystal X-ray diffraction
FT-IR Fourier transform infrared
UV-Vis Ultraviolet-visible
PXRD Powder X-ray diffraction
DSC Differential scanning calorimetry
TGA Thermogravimetric analysis
HBA Hydrogen bond acceptor
HBD Hydrogen bond donor
MFC Microbial fuel cell
BOD Biochemical oxygen demand
COD Chemical oxygen demand
BET Brunauer-Emmett-Teller
BJH Barrett-Joyner-Halenda
DFT Density functional theory
SANS Small-angle neutron scattering

7
USANS Ultra-small-angle neutron scattering
SAXS Small-angle X-ray scattering
SEM Scanning electron microscopy
TEM Transmission electron microscopy
HS Hollow silica
PEG (Poly)ethylene glycol
BF300 Basolite® F300
ARS Alizarin Red S
AB25 Acid Blue 25
NAC Nitrogen-doped activated carbon

8
1. Introduction
The presence of porosity in various materials has been widely observed in nature. For
example, bamboo, honeycomb, sponges, and soil all contain pores. Porous materials are of
significant interest in various applications due to their ability to interact with other
compounds not only on their surface but throughout the porous bulk.1 Such porous materials
include zeolites, porous carbon, metal-organic frameworks (MOFs), nanotubes, nanorods
and aerogels, along with various polymers. They have found use in many applications in
areas such as solar energy systems, gas storage and separation, drug delivery, and
crystallisation.2–5
Generally, porous materials utilised in such areas are solids. Even though they
might be efficient at the desired function, their scale-up and commercialisation can be
difficult. For example, post-combustion carbon capture is still mainly performed with
amine-based liquids due to their easy manufacture and application.6 However, these liquids
possess many drawbacks, including corrosiveness, which leads to costly implementation
and poor recyclability after the end of their lifetime. Thus, the preparation of a benign,
easily recycled liquid adsorbent for such applications could significantly improve the
effectiveness of current processes.
There are three types of porous liquids (PLs) (Figure 1).7 Neat liquid hosts incapable
of interpenetration are described as Type 1 PLs. Type 2 PLs involve the dissolution of host
molecules in a solvent incapable of entering the pores of the host solute. Type 3 PLs are
prepared via the dissolution of framework-compounds in sterically hindered solvent
molecules.

9
Figure 1: Three types of liquids with permanent porosity. Empty circles represent cage-
type compounds and rectangles with empty spaces represent framework-type compounds.
Reproduced from ref. 7 with permission
The first example of a permanently porous liquid was reported by James and Cooper.8
Essentially, a crown ether functionalised amine-based cage (Figure 2) was dissolved in a
bulky crown ether solvent. The team found that the presence of a high concentration of empty
cages in the solvent resulted in an eightfold increase in the solubility of methane gas
compared to the pure crown solvent. While this porous liquid proved to significantly enhance
the equilibrium solubility of methane gas, the synthetic route of the cage is very costly and
uses volatile solvents that are known to harm the environment. The aim of this work is to
prepare a novel porous liquid for the uptake of volatile organic compounds (VOCs) using an
environmentally friendly porous liquid.
Figure 2: Cage molecule used to prepare a permanently porous liquid by James et al.
Reproduced from ref. 8 with permission.
1.1 Ionic Liquids Throughout this work, ionic liquids (ILs) will be denoted as [cation][anion]. For example, in
the case of [Cnmim][NTf2], mim represents the methyl-imidazolium cation and n represents
the alkyl chain length off the neutral nitrogen atom. The anion, in this case, is a bistriflimide,
also known as bis(trifluoromethanesulfonyl)imide. For example, 1-ethyl-3-
methylimidazolium nitrate, as shown in Figure 3, would be denoted as [C2mim][NO3].
However, due to the vast number of ILs, it is difficult to formulate a systematic, yet self-
consistent naming system for all of them. Thus, in order to avoid confusion, all ILs mentioned
in this work will also be accessible in the appendix, with their abbreviations, structures and
empirical formulas.

10
ILs can be classified as salts whose melting point are below 100°C. It is generally
accepted that ILs whose melting point lies above this temperature are called molten salts.9
ILs are composed of a cation and an anion, which means that a plethora of such compounds
can be synthesized. In fact, including binary and ternary mixtures, it is estimated that 1018
different ILs could be prepared.10 Interestingly, even though ILs have emerged as very
interesting compounds, their history dates back to as far as 1914 when the first IL was
synthesised by Walden.11,12 The first patent related to an IL was granted in 1938, where the
use of a molten pyridinium salt at 120°C for water-repellency of cellulosic fibre was
described.13,14 Even though that was almost 90 years ago, research of ILs gained popularity
much later, when in the early 1990s the first air and water stable ILs were synthesised.15
Figure 3 depicts one of the ILs prepared in that study. With the establishment of green
chemistry around the same time, ILs became very promising and popular compounds as
solvents as they were described as “green” solvents due to their designer properties and
nonvolatility.
Figure 3: 1-ethyl-3-methylimidazolium nitrate, [C2mim][NO3], one of the air and water-
stable ionic liquids first reported by Wilkes and Zaworotko.15
The research into ILs has grown substantially in recent decades because of their low
vapour pressure and low flammability, wide electrochemical window, and high thermal
stability.16,17 They have been labelled “designer solvents”, suggesting their properties can be
easily tuned for particular applications by a careful selection of a wide variety of cations and
anions. A NIST database of ILs is available, where various physicochemical properties of
different ILs are documented. ILs have been employed in various applications in areas such
as electrochemistry, separation techniques, and catalysis.16,18–21
The most common cations in ILs include imidazolium, pyridinium, pyrrolidinium,
tetraalkyl ammonium, phosphonium, and sulfonium. Furthermore, there are a wide variety
of anions that can be used to accompany the cation, but the most common are tosylate,
(C7H7O3S–), tetrafluoroborate (BF4
–), hexafluorophosphate (PF6–),
bis(trifluoromethylsulfonyl)imide (NTf2–), and dicyanamide (N(CN)2
–). These cations and

11
anions can form stable, room-temperature ionic liquids with varying properties.22,23 For
example, the [C4mim][PF6] IL is stable at room temperature, possesses poor water solubility
and high density (denser than water, but less dense than chloroform), and thus has found
application in liquid-liquid extraction methods.24 Ultimately, the physicochemical properties
of ILs are dependent on the properties of the cation and anion from which they are composed.
Figure 4: Viscosity of linear ILs (black line) as a function of their alkyl chain length
compared to their branched counterparts (red line) with the same carbon chain length.
Reproduced from ref. 10 with permission.
Thus, much research has been dedicated toward understanding IL behaviour not only
in regard to the cation and anion size, but also their shape, symmetry, alkyl chain length and
many other factors. For example, Quitevis et al. reported on how alkyl chain branching
affects the physicochemical properties of imidazolium-based ILs (Figure 4).10 It was found
that the branched ILs experienced higher glass transition temperatures, viscosities, and
melting temperatures compared to their linear counterparts. An explanation for this may lie
in liquid phase packing. Maginn et al. reported that branched ILs showed more stable packing
between the cation and anion in the liquid phase compared to their linear counterparts.25
Based on simulations, the branched ILs showed longer ion-pair lifetimes compared to their
linear counterparts, which was correlated to higher viscosities of the former. Thus, high
viscosities might arise due to the specific arrangement of the ion-pairs so that the anion is
blocked from approaching the cation (in this case imidazolium) ring.25 The effect of aromatic
and aliphatic substituents on the thermophysical properties of imidazolium-based ILs has
also been investigated by Quitevis et al.22 It was found that aromatic substituents showed
12
higher Tg and density values compared to their aliphatic counterparts. Higher density values
of the aromatic substituents were correlated to higher C/H (carbon-to-hydrogen) values and
higher Tg values were attributed to their lower decomposition temperaturesl.26 Schubert et al.
found that the Tg of (BF4–)-containing aromatic ILs was the highest compared to all other
tested ILs, while also having the lowest decomposition temperature. Thus, these results lead
to the conclusion that aromatic ILs are generally more stable and possess higher Tg values
compared to their aliphatic analogues.
Generally, there are two main steps to the synthesis of ILs. Firstly, the desired cation
is synthesised. For nitrogen-based cations, this can be achieved via the protonation of an
amine by an acid or its quaternization with a haloalkane under raised temperatures.18
Quaternisation reactions generally yield salts consisting of a desired cation and a halide. An
example is the reaction between 1-methylimidazole and 1-chlorobutane at reflux (70°C),
resulting in the formation of [C4mim][Cl].24 However, in order to tune the properties of the
resulting salt, anion exchange is undertaken, which yields the desired cation-anion pair. For
example, Dinares et al. reported on the preparation of various imidazolium-based ILs with
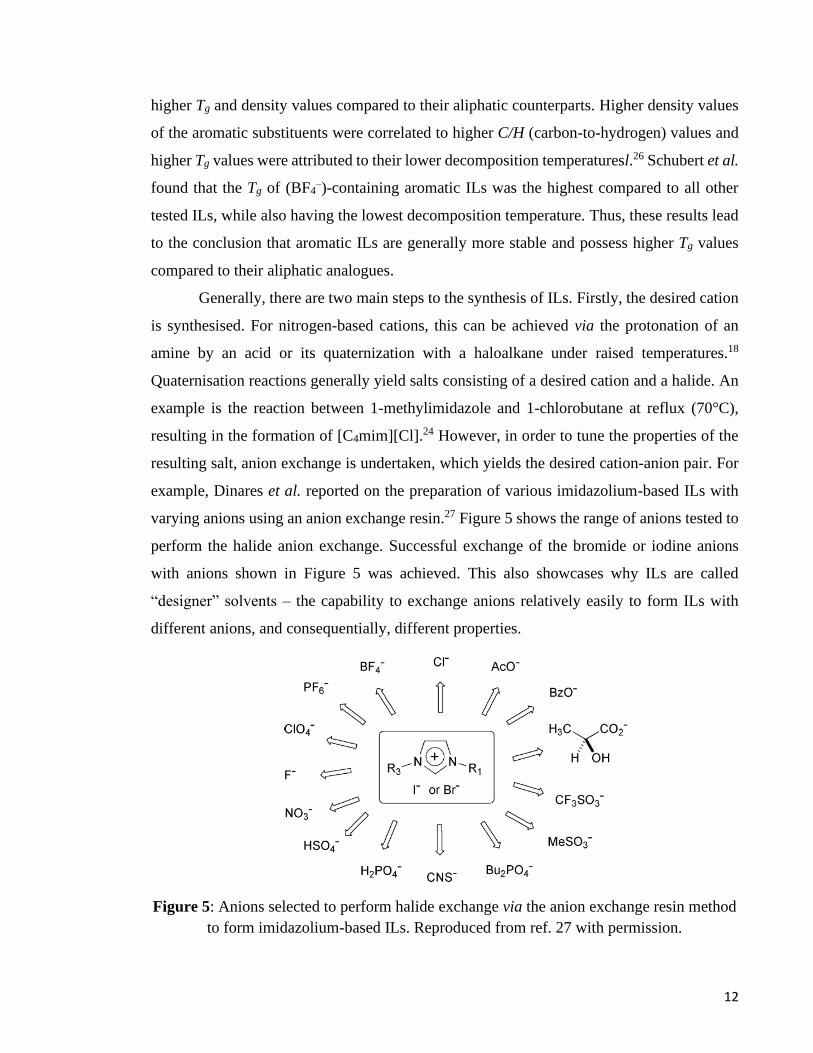
varying anions using an anion exchange resin.27 Figure 5 shows the range of anions tested to
perform the halide anion exchange. Successful exchange of the bromide or iodine anions
with anions shown in Figure 5 was achieved. This also showcases why ILs are called
“designer” solvents – the capability to exchange anions relatively easily to form ILs with
different anions, and consequentially, different properties.
Figure 5: Anions selected to perform halide exchange via the anion exchange resin method
to form imidazolium-based ILs. Reproduced from ref. 27 with permission.

13
ILs are generally characterised by thermogravimetric analysis (TGA) and differential
scanning calorimetry (DSC), which provide information about thermal properties such as
melting point, thermal stability, glass transition temperature and degradation temperature.28,23
A DSC trace of 1-octyl-3-methylimidazolium hexafluorophosphate, [C8mim][PF6], is shown
in Figure 6. The glass transition of [C8mim][PF6] is approximately at -75°C along with an
exothermic peak between -25°C and 0°C, indicating the reorganisation of water molecules
prior to melting as postulated by the authors. The presence of water molecules is of no
surprise as ILs are generally hygroscopic. In order to minimise the water content, ILs can be
pre-treated before use in a standard or vacuum oven or a rotary evaporator, then stored in a
tightly sealed vial, desiccator or under argon atmosphere.22,24,29 Infrared (IR) spectroscopy
can be used to determine the presence of the desired functional groups in various ILs. As
discussed, anion exchange can be used to introduce a wide variety of anions with different
functionalities, and IR spectroscopy can be utilised to determine the presence of such anions.
1H and 13C NMR are generally used to assess the purity of ILs.30 However, due to the viscous
nature of many ILs, high resolution spectra can be difficult to acquire. This is because
increased viscosity results in shorter relaxation times, leading to broader spectra which are
difficult to resolve. Instruments such as titrometers, coulometers, viscometers, and
densimeters are very useful for measuring the physicochemical properties such as density,
viscosity and surface tension.
Figure 6: DSC trace of [C8mim][PF6], with a glass transition at approximately -75°C
(exothermic up). Reproduced from ref. 23 with permission.

14
1.1.1 Room-Temperature Ionic Liquids
Room-temperature ionic liquids (RTILs) are currently one of the most desirable types of IL
for use as solvents. RTILs are easy to use and do not require elevated temperatures to reach
their liquid phase. Understandably, a significant amount of research has been put into
understanding and characterising these ILs as the scientific community is searching for
alternatives to replace traditional organic solvents that are harmful to human health and the
environment. It has been found for alkylimidazolium ILs that the longer the alkyl chain on
the cation, the higher the melting temperature (Tm) of the IL. This trend is due to inter-chain
hydrophobic packing effects for ILs with n > 8 (where n designates number of carbon atoms
in the alkyl chain).23 However, for ILs with n < 8, Tm does not necessarily increase with the
increasing number of alkyl chain. It has been reported that Tm of alkylimidazolium ILs such
as [Cnmim][NTf2], [Cnmim][PF6], and [Cnmim[Br] does not increase as the alkyl chain on
the cation is increased.31It has been shown that in the case of non-spherical ion pairs (with
the cation being [C6mim]), the Tm is driven by anisotropic interactions.32 Ngo et al. concluded
that the melting point of bulkier asymmetrical cations and anions was lower than that of
smaller and symmetrical ones.28
The main advantage of RTILs is that they are liquid at room temperature. This has
opened up the door for RTILs to be used in various relevant industrial applications. Green
chemistry has become a prominent research field over the last few decades, thus prompting
researchers to find various applications for RTILs in the field. Recently, a novel family of
closo-boron-cluster based RTILs for energy storage devices was synthesised by Mohtadi et
al.20 The closo-boron-based RTILs displayed excellent physical and thermal properties, such
as low melting point and high thermal stability, along with compatibility with both lithium
and magnesium metals. Remarkably, the closo-monocarborane based RTILs exhibit high
anodic stability with the magnesium metal, showing the potential of ILs to be tailored
compatible with more metals. Although, it must be added that the practical applicability of
polyhedral borane hydrides clusters is difficult to achieve due to their generally unstable
nature, volatility, and difficult synthesis.33,34 RTILs have also been successfully used for
surface modification of zeolites membranes for CO2/CH4 separation.35 The resulting
membranes experience a 44% decrease in CO2 permeability and a 7-fold increase in CO2/CH4

15
selectivity. These results highlight the potential of RTILs to be used in various applications
in the field of green chemistry.
Furthermore, RTILs have found extensive use in electrochemistry. For example,
Knipping et al. studied the efficiency of various RTILs as lithium-oxygen battery
electrolytes.36 It was found that RTILs offered many advantages of organic liquids at room
and elevated temperatures. The main disadvantage of the tested RTILs was the degradation
of the imidazolium cation, which lead to low cyclability. However, high thermal stability
allows RTILs to be used at elevated temperatures, where their ionic conductivity is higher,
thus leading to better performances compared to organic solvents. RTILs can also be
employed as nanocomposites for efficient microbial fuel cells (MFCs).37 In this work,
[C4mim][BF4] was used to prepare the anode for the microbial fuel cell, which resulted in a
highly efficient MFC. In addition to these versatile applications of RTILs, they have also
found use in the wood industry for cellulose dissolution and in organic synthesis for catalysis
and hydrosilylation.38
1.1.2 Imidazolium-Based Ionic Liquids
Imidazolium-based ILs (im-ILs) are one of the most widely studied type of ILs due to their
good stability at ambient temperature. In 2001, Huddleston et al. reported on the
characterization of a set of im-RTILs.23 It was concluded that the characteristics of the anion
are of the utmost importance when it comes to the physical properties of the synthesized ILs.
In addition, the authors found that cation substitution is important in regard to water content
and hydrophilicity. In a similar study, it was reported that as the alkyl chain length of the
imidazolium cation increases, the density of the ILs decreases.39 For example, the density of
[C2mim][NTf2] is higher than that of [C4mim][NTf2]. It is not only the alkyl chain length of
the cation, though, that affects the density of a particular IL (Figure 7). As the molecular
weight of the anion increases, the density of the resulting IL is higher. Thus, selection of the
chemical structure of the cation and anion can have a significant impact on the behaviour and
efficiency of the IL in a desired application.
In practical terms, viscosity is one of the most important properties of an IL as it plays
a more direct role in scale-up and commercialisation. Im-ILs also hinder the efficiency of
fuel cells as their high viscosity inhibits the redox couple diffusion.40 Im-ILs are known for
their high viscosities, which has unfortunately made it difficult to reach their full potential.

16
Having said this, much progress has been made in order to reduce the viscosity of im-ILs.
For example, it has been established that ILs containing the (NTF2–) anion have lower
viscosities compared to ILs containing the nonfluorinated anion analogue.41 In addition, im-
ILs with mid-range (3-6 carbon atoms) alkyl chain lengths also experience lower viscosities
due to decreased van der Waals forces between the imidazolium cations and increased
electrostatic interactions between the cation and the anion.42 These results indicate that there
is much potential to engineer low viscosity im-ILs for smoother scale-up and
commercialisation.
Im-ILs have also been widely studied and applied as solvents.43,44 The need for
environmentally benign solvents is vastly increasing due to the toxic nature of traditional
organic solvents, most of which are classified as volatile organic compounds (VOCs). This
has driven research toward next-generation solvents such as im-ILs. The main advantages of
im-ILs over traditional solvents is that the former do not emit such a large quantity of VOCs
to the atmosphere due to their non-volatile nature. Kumar et al. recently reported on the use
of im-ILs for the dissolution of lignin from water hyacinth.44 The authors reported that both
hydrophobic and hydrophilic interactions between the solvent and lignin were responsible
for efficient dissolution. However, longer alkyl chain im-ILs were not as efficient as shorter
chain im-ILs, possibly due to steric hindrance.
Figure 7: Density of a set of ILs with varying chain lengths bearing the same anion, [NTf2].
Cations: Black circle – [C2mim], white circle – [C2C1mim], black triangle – [C3C1mim],
white triangle – [C4mim] Reproduced from ref. 38 with permission.

17
1.1.3 Phosphonium-Based Ionic Liquids
Phosphonium-based ILs (P-ILs) are another type of ILs that have gained much attention in
recent decades. The research into P-ILs picked up in the late 1990s and early 2000s when
multiple reports described their application in various synthetic reactions, such as
hydroformylation, Heck reactions, and Suzuki cross-coupling reactions, where they are used
as novel solvents.45–47 Since then, their application has widely expanded into fields such as
chromatography, supercapacitors, and antifouling.48–50 The interest in P-ILs has rapidly
grown since and has been sustained for a decade. More recently, they have been utilised in
applications such as wastewater purification, CO2 capture, and biodiesel production.9,51,52
The ongoing popularity of P-ILs is likely to result in their utilisation in many more
applications. P-ILs are relatively new solvents compared to im-ILs and as a result are
relatively underexplored. Research into P-ILs is likely to increase as they possess properties
that im-ILs do not, such as incapability of aromatic interactions and less efficient hydrogen
bonding.
These unique properties are potentially beneficial as they can prevent P-ILs from
interacting with desired compounds. For example, the lack of hydrogen bonding capabilities
results in a hydrophobic behaviour of P-ILs, which can be used for extraction purposes in
polar media. For example, two P-ILs were used for the efficient extraction of phenolic
compounds from water.9 The results showed that the tetraalkylphosphonium-based IL
extracted more than 99% of 2,4-dichlorophenol at a volume ratio of 1:135 P-IL:water. A
commercially available P-IL was also used for the extraction of zinc from a multi element
mixture under acidic conditions with 99% purity.53 These results demonstrate how the unique
properties of P-ILs can be used for efficient extraction applications.
The nomenclature of P-ILs is similar to that of im-ILs with no changes to the anions,
but with slight changes toward the cation nomenclature. Namely, the cation is designated as
P for phosphonium, to which numbers in subscript are added indicating the length and
number of alkyl chains. For example, the trihexyltetradecylphosphonium cation with four
alkyl chains is designated as (P6,6,6,14)+. So, nomenclature of the IL
trihexyltetradecylphosphonium bis(trifluoromethylsulfonyl)amide is [P6,6,6,14][NTf2].
In terms of their synthesis, the main two routes for the preparation of P-ILs are
quaternization and metathesis.54 For example, an SN2 reaction between a tertiary phosphine

18
(PR3) and a haloalkane (R’X) can be used to prepare asymmetrical tetraalkylphosphonium
ionic liquids [PR3R’][X]. An advantage of such reactions is their superior kinetics compared
to similar reactions with amines. This is due to the larger radii and polarizability of tertiary
phosphines. Overall, they are synthesised in a similar manner as other ILs.
The thermal properties of P-ILs have been studied extensively. Their thermal stability
is mainly controlled by the cation or by the strength of the cation-anion interactions.55 P-ILs
generally exhibit high thermal stabilities – above 300°C and sometimes even above 400°C.56
In addition, they possess higher thermal stability in basic and nucleophilic environments
compared to im-ILs as they do not have any acidic protons unlike the latter. Thus, P-ILs can
be utilised more efficiently than im-ILs in applications that require such conditions (for
instance, synthetic chemistry reactions under basic conditions).
Even though the thermal properties seem to be mainly guided by the nature of the
cation, the anion has a more significant effect on density. Bhattacharjee et al. noted that P-
ILs containing anions with higher molecular weights have higher densities.57 This behaviour
seems to be common in ILs in general as the density of im-ILs is also governed by the
molecular weight of the anion. Increasing the alkyl chain length of the cation substituents
results in a lower density of the P-IL due to the low density of methylene groups.
The viscosity of P-ILs is governed by π-π interactions, which can be introduced with
various anions. For example, the viscosity of [Pi(444)1][Tos] is greater than that of P-ILs like
[P4441][CH3SO4], [P8888][Br] and [P4442][(C2H5O)2PO2], which do not participate in π-π
interactions.57 Similar trends have been observed for ILs containing imidazolium and
pyridinium cations.22 However, viscosity data is apparently difficult to acquire accurately
since large variations of up to 167% occur for the same material in different data sets. This
is most likely due to the handling difficulties associated with ILs as they are very sensitive
to atmospheric moisture.
1.1.4 Toxicity of Ionic Liquids
The excitement around the research of ILs has been mostly due to them being believed to be
environmentally benign. For example, their non-volatile nature significantly decreases their
waste management costs. Furthermore, due to their designer properties, ILs can be tailored
to increase the yield of a reaction when used as a solvent while also limiting the waste.58
19
However, even though ILs have been generally considered to be “green” solvents,
they can exhibit significant toxicity. The belief of ILs being a “green” solvent has been put
under high doubt.59,60 For instance, many ILs are corrosive due to the presence of halogen
atoms, which can dangerously react with water. Furthermore, it has been suggested that ILs
can have more toxic effects on aquatic life compared to organic solvents based on research
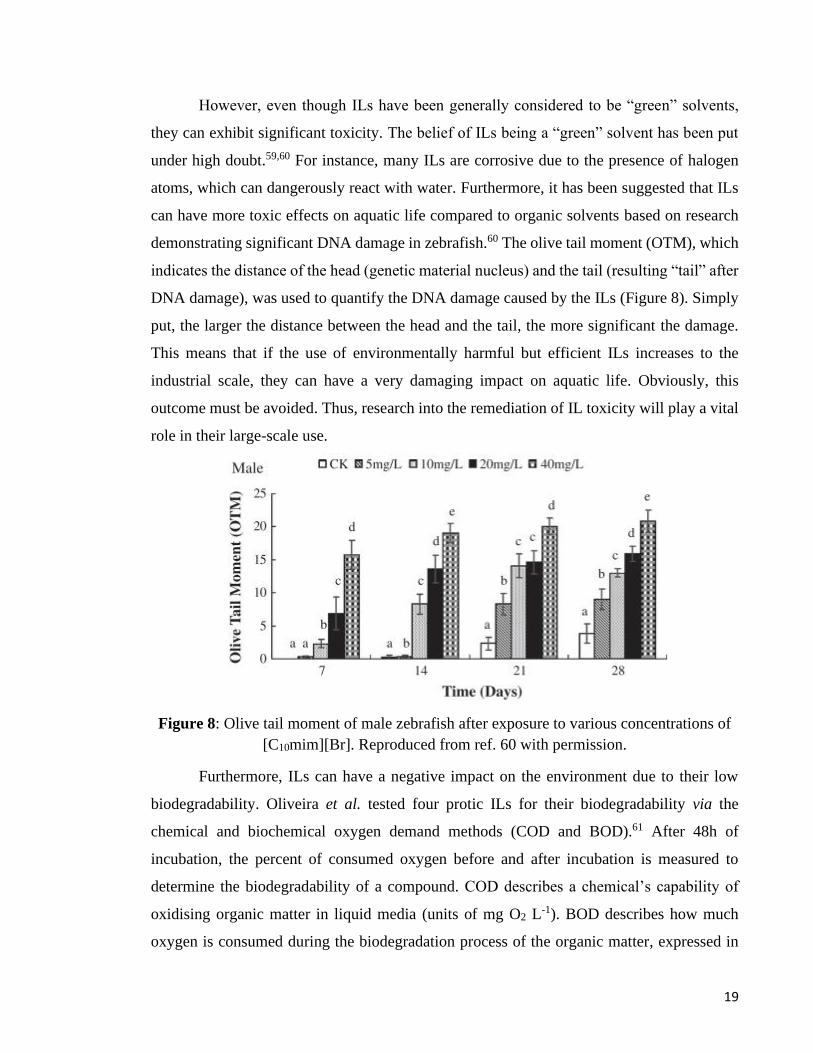
demonstrating significant DNA damage in zebrafish.60 The olive tail moment (OTM), which
indicates the distance of the head (genetic material nucleus) and the tail (resulting “tail” after
DNA damage), was used to quantify the DNA damage caused by the ILs (Figure 8). Simply
put, the larger the distance between the head and the tail, the more significant the damage.
This means that if the use of environmentally harmful but efficient ILs increases to the
industrial scale, they can have a very damaging impact on aquatic life. Obviously, this
outcome must be avoided. Thus, research into the remediation of IL toxicity will play a vital
role in their large-scale use.
Figure 8: Olive tail moment of male zebrafish after exposure to various concentrations of
[C10mim][Br]. Reproduced from ref. 60 with permission.
Furthermore, ILs can have a negative impact on the environment due to their low
biodegradability. Oliveira et al. tested four protic ILs for their biodegradability via the
chemical and biochemical oxygen demand methods (COD and BOD).61 After 48h of
incubation, the percent of consumed oxygen before and after incubation is measured to
determine the biodegradability of a compound. COD describes a chemical’s capability of
oxidising organic matter in liquid media (units of mg O2 L-1). BOD describes how much
oxygen is consumed during the biodegradation process of the organic matter, expressed in

20
the same units as COD. Numerically speaking, if the COD test values are at least twice as
high as the BOD values, it can be assumed that the material is non-biodegradable. All tested
ILs exhibited BOD/COD ratios of below 0.03. These results clearly illustrate the non-
biodegradability of some protic ILs. Many other reports have highlighted the non-
biodegradability and negative environmental impact of some ILs.62,63 In fact, it has been
recently concluded that most ILs should not be considered environmentally safe chemicals.63
In order to synthesise biocompatible ILs, their cytotoxicity must be well understood.
Sarkar et al. reported on the cytotoxicity of im-ILs toward the model oleate ethyl amine
membrane.64 When the pH of the environment around fatty acids is similar to that of their
pKa, they spontaneously form bilayer vesicles. These vesicles can be treated as model
membrane systems to evaluate the cytotoxicity of a chemical based on the extent of their
swelling in the presence of a toxic chemical. Swelling is the result of the insertion of the IL
into the bilayer vesicle. The authors concluded that the imidazolium cation caused swelling
of the vesicle via strong electrostatic and hydrophobic interactions through its long alkyl
chain. In another study, a variety of ILs was tested for their cytotoxicity.65 The cytotoxicity
was found to be dependent on time; long alkyl chain phosphonium ILs showed cytotoxicity
within 2 hours while it took other ILs longer. There seems to be a general trend that longer
alkyl chain ILs are more toxic compared to their shorter chain counterparts. Although, the
mechanistic understanding of IL toxicity has not yet been fully unravelled.
Having said this, it is important not to conclude that all ILs have a negative impact
on the environment. The purpose of this section was to stress that although ILs possess many
favourable properties, it is important to keep in mind the impact some ILs can have on the
environment. Promising research into the preparation of biodegradable ILs has been
conducted and it seems like the use of “green” ILs is becoming more important than before.66
1.1.5 Deep Eutectic Solvents
A new class of ILs called deep eutectic solvents (DESs) are a rising alternative for traditional
ILs due to their much greener and less harmful nature. DESs can be prepared via the addition
of a hydrogen bond donor (HBD) to a hydrogen bond acceptor (HBA) in a stoichiometric
ratio. Typical HBAs include quaternary ammonium salts such as choline chloride and
acetylcholine chloride, which are generally coupled with common HBDs, such as ethylene
glycol, levulinic acid and urea. DESs are widely known for their eutectic points when

21
compared to the melting point of their constituting compounds. This phenomenon is ascribed
to the charge delocalization that results from the interactions between the HBD and HBA,
which is also considered to be the main driving force for DES formation.67,68
The main advantage of DESs over ILs is their cost-effective environmentally benign
synthesis. By simply mixing together hydrogen bond accepting and hydrogen bond donating
compounds, the synthesis of the resulting DES proceeds with 100% atom economy.
However, such synthesis usually requires elevated temperatures.69,70 The properties of DESs
can be tailored by the careful and rational selection of the HBD to accompany the HBA.
Notably, a wide variety of HBDs are commercially available, making a wide variety of DESs
possible to synthesise. For instance, choline chloride (ChCl) is known for its non-toxicity and
biodegradability. A 2:1 mixture of urea:ChCl (ChU) stirred at 80ºC yields a homogeneous
liquid. Even though it is not fully understood how DESs form, a model for ChU formation
was proposed based on spatial density functions.67 In this, two urea molecules are hydrogen
bonded to a chloride with a bond distance of 2.2 Å while choline forming hydrogen bonding
interactions with the chloride as well. These interactions result in the sandwich-type structure
of the ChU DES (Figure 9).
Figure 9: A proposed three-dimensional structure of the DES reline. Yellow – choline
cations, purple – urea molecules, green – chloride anions. Reproduced from ref. 67 with
permission. Published by the Royal Society of Chemistry.
22
Practically speaking, DESs possess advantages over ILs not only due to their facile
synthesis, but also in terms of biodegradability. The biodegradability of ChCl also applies to
one of its derivatives, acetylcholine chloride (AChCl), which is present in the human body
and also enhances the ion permeability of plant roots.17 Thus, the lifecycle of certain DES is
not only cost-effective but also environmentally friendly and sustainable. For these reasons,
DESs have been widely applied in various fields, such as electrochemistry71, extraction
processes70,72 and gas absorption73, in addition to being widely used as solvents for different
synthetic strategies.74,75
1.2 Porous Materials
Porous materials have been widely used for their unique properties for a variety of
applications such as ion exchange, adsorption, separation, and catalysis.76–79 The most well-
known porous substances are zeolites, which are a family of aluminosilicates that naturally
occur in crystalline hydrate form. In addition to zeolites, other porous substances such as
porous metal-organic frameworks (MOFs), aerogels, polymers, and nanomaterials have
recently been developed.80–83 In such cases, porosity can be used in various ways. For
example, He et al. reported a MOF catalyst for chemical fixation of carbon dioxide, where
the pores of the MOF material act as sites to facilitate the conversion of carbon dioxide to
carbonic ester product with high yields.82 In another example, molybdenum phosphite (MoP)
nanowires were used for hydrogen evolution reaction (HER), where the porosity of the
nanowires was responsible for the excellent efficiency of HER in various pH conditions.84
The authors stated that the porosity of the nanowires was responsible for an increase in the
number of active sites, which played a significant role in the efficiency of HER.
Porous materials can be classified by their pore size – ultramicropores are classified
as pores with diameters up to 0.7nm, micropores and mesopores range from 0.7 to 2nm and
2 to 50nm, respectively, and pores larger than 50nm in diameter are macropores.
Furthermore, knowing the pore size, diameter and structure is of utmost importance for their
function in a chosen application. For example, in the use of cellulose acetate polymer as an
adsorbent material for the uptake of various pollutants, understanding the pore size and
distribution of the polymer will give a good indication on what molecules will be able to
diffuse through the pores freely and which molecules might be too large to enter.

23
1.2.1 Techniques for the Characterisation of Pore Properties
One of the most widely used technique for pore size determination in solids is gas
sorption.85,86 This technique allows for a precise measurement of the amount of gas adsorbed
on the surface of the porous material, which reveals the pore properties and structure.
Furthermore, this technique is relatively fast and can be used with various gases such as Ar,
CO2, and N2 at low temperatures. In addition, the use of methane gas in the gas adsorption
technique has also been reported.87 The gas sorption method allows for the calculation of the
specific surface area of a porous material. For example, the efficiency of hydrogen storage
applications is of utmost importance upon its use as an alternative fuel. One of the most
promising methods for hydrogen storage is its adsorption by porous materials. Rapid
adsorption and desorption kinetics and minimal energy requirements associated with the
process are the main advantages of the method. The use of N2 adsorption/desorption isotherm
has been described for the hydrogen storage capabilities of nitrogen-doped activated carbon
(Figure 10).1 The authors found that materials composed of ultramicropores and wider pores
had a negligible contribution to the uptake of N2. Thus, gas sorption was effectively used to
assess the structural components of the pores, which allowed for the understanding of how
the activation temperature affected the pores, which then affected the hydrogen storage
efficiency. Amongst the most widely utilised methods to evaluate gas sorption data are the
Brunauer-Emmett-Teller (BET) theory, Barrett-Joyner-Halenda (BJH) and various density
functional theory (DFT) models.88,89
Figure 10: N2 adsorption/desorption isotherms obtained for the nitrogen-doped activated
and non-activated carbons. NAC stands for nitrogen-doped activated carbon and CP stands
for carbon precursor. Reproduced from ref. 1 with permission.

24
In addition to gas adsorption, small-angle and ultra-small-angle neutron scattering
(SANS and USANS) have been utilised as indirect methods toward characterising pore
structure.86,90 SANS and USANS both give information about the surface of the porous
material, where the scattering occurs. Structural information such as accessible porosity and
pore size distribution can be obtained by analysing the scattering intensity. A significant
advantage of this method is its non-destructive nature. Compared to small-angle X-ray
scattering (SAXS) technique which can be destructive toward radiation-sensitive samples,
SANS, by using neutrons instead of X-rays, can see this issue remediated.
Additionally, scanning electron microscopy (SEM) and transmission electron
microscopy (TEM) have been used to probe pore properties. These techniques are used to
visualise matter on a very small scale. Both utilize the electrons bouncing back from a sample
to give an image of its surface. In regard to porous materials, SEM and TEM can be used to
visualize and describe a porous structure based on its surface. For example, Zhang et al.
described the use of SEM and TEM to reveal the porous nature of a magnetic porous carbon.91
Ultimately, both SEM and TEM are not quantitative methods and are used to confirm or
reveal the porous nature of a material.92,93,94
1.3 Porous Liquids
So far, only solid porous materials have been discussed. Even though they can achieve high
efficiencies for particular tasks, applications involving separation and absorption are easier
to control with liquids, can achieve higher efficiencies and are more energy-effective.95 For
example, it has been reported that it is easier to achieve the retrofitting of liquid circulation
systems for post-combustion capture of carbon dioxide.8 In addition, liquid materials have
been widely implemented into various large-scale applications, such as carbon capture via
amine-based liquids.6 Thus, a free-flowing material with permanent porosity can be of high
demand in industrial applications.
1.3.1 Type 1 Porous Liquids
Since the introduction of PLs, significant advances have been made in the field. As porous
compounds generally have high melting points, the only viable method to prepare Type 1
PLs is via elevated temperatures to force the solid-to-liquid transition. However, melting
processes can have negative effects on the pore properties of porous compounds, making
Type 1 PLs extremely difficult to prepare.96 Thus, the application of Type 1 PLs as liquid

25
sorbents is difficult to envisage. Furthermore, examples of Type 1 PLs are limited due to the
difficulty in efficiently producing such systems. Nonetheless, Coudert et al. reported on the
synthesis of the first MOF-based Type 1 PL by melting ZIF-4 MOF at 865K, while retaining
intrinsic porosity.97 Another Type 1 PL was reported by Dai et al. based on hollow silica
(HS) spheres.98 HS spheres were treated with organosilane and poly(ethylene glycol) (PEG)
tailed sulfonate canopy to yield a clear liquid. The porosity of the resulting hollow sphere
was confirmed via N2 adsorption/desorption and TGA. This approach seems to be more
promising of the two examples due to the ability to modify the functional groups of the
canopy, which can aid in controlling the diffusivity of gas particles through the PL. Most
notably, a recyclable Type 1 PL was prepared by functionalising an aniline-based precursor
with PEG-imidazolium to yield neat liquid cages with empty cavities.99 Long PEG chains
were used to decrease the melting point of the resulting cage below room temperature
resulting in a viscous liquid. In addition, the imidazolium cation prevented the chains of the
cage from interpenetrating the positively charged cavities. This porous liquid was employed
for the uptake of environmentally dangerous chlorofluorocarbons.
1.3.2 Type 2 Porous Liquids
Type 2 PLs have been more widely reported compared to Type 1. The first Type 2 PL was
demonstrated by Cram et al. in 1994.100 The authors demonstrated that by heating a
hemicarcerand in diphenyl ether solution to 195°C, the guest N,N-dimethylacetamide
molecule was removed from the void of the carcerand host. Thus, empty hemicarcerand
molecules remained in the solvent, classifying the system as a Type 2 PL. In 2003, Hsu et al.
demonstrated an inorganic example of a Type 2 PL.101 An ionophilic molecular box, Co4Ru4
(Figure 11), was dissolved in acetonitrile while retaining its empty voids and rigidity. The
box was capable of encapsulating small ions such as CH3NH3+, K+, and Cs+ while keeping
acetonitrile solvent molecules outside of the pore.

26
Figure 11: Preparation of the Co4Ru4 metallocube with empty and filled void. Reproduced
from ref. 100 with permission.
The aforementioned Type 2 PL prepared by James et al. is an archetype of the
potential of PLs to overtake standard sorbent liquids in their commercial use.8 However, the
main disadvantage of their method is the complexity and cost of the synthetic route combined
with the use of ethers, which are known to be environmentally “unfriendly” as groundwater
contaminants.102 Still, this report serves as a strong starting point toward designing more cost-
effective and environmentally friendly Type 2 PLs.
1.3.3 Type 3 Porous Liquids
The first Type 3 PL was prepared by Liu et al. in 2014.103 A porous slurry composed of ZIF-
8 nanoparticles dissolved in glycol-2-methylimidazole was prepared for selective CO2
capture. It was found that the presence of 2-methylimidazole significantly increased the
solubility of CO2 in the solvent, enabling it to be efficiently used at low partial pressures. The
efficiency of this PL was compared to that of current industrial technology used to separate
CO2 from biogas. Based on column breakthrough tests, it was determined that the CO2
breakthrough occurred much slower in the ZIF-8 containing PL (Figure 12), showing its
superior performance. Most Type 3 PLs prepared so far have utilised the ZIF-8 MOF and
share similar approaches. For example, the dispersion of ZIF-8 in various bulky ILs has
resulted in the successful preparation of Type 3 PLs.103–105

27
Figure 12: Column breakthrough tests showing the ZIF-8 containing slurry performance
compared to industrial water-based technology. Reproduced from ref. 102. This content is
licensed under a Creative Commons Attribution 4.0 International License, which can be
accessed via the following link: https://creativecommons.org/licenses/by/4.0/.
However, more recently, a report describing the preparation of Type 3 PLs using a
variety of microporous liquids in combination with non-ionic solvents for the purpose of gas
uptake.106 The range of porous hosts included zeolites, MOFs and a porous organic polymer.
The range of solvents included various oils, such as silicone, sesame, sunflower and olive
oil. Notably, many dispersions exhibited higher gas uptake compared to their solid
counterparts and could potentially be used for gas separation applications.
Overall, it seems like the use of bulky ILs is the standard route to preparing
permanently porous systems. It has been shown that liquids with permanent porosity can be
prepared upon the careful selection of the solvent and pore generator molecules. This is very
promising toward utilising DESs, a type of IL, which are also ionic by nature, but have the
advantage of being more cost-effective and “green”. In this context, employing
environmentally friendly ILs or DESs as the solvent medium for the preparation of PLs can
be very promising, as the potential of PLs to become commercially employable is excellent.
1.4 Project Aims
The main objective of this work is to prepare Type 2 and Type 3 porous liquids using
involatile solvents such as ILs and DESs. For Type 2 porous liquids, dimeric and hexameric
metal-organic nanocapsules (MONCs) prepared by Atwood et al. were chosen as the porous
hosts.107–109 Single-crystal structure analysis performed via the Cambridge Structural
Database suggests that the cavity window sizes of the MONCs are sufficient to allow for the
uptake of small volatile organic compounds (VOCs). The pore window sizes were
determined by measuring the distance between two sets of closest adjacent hydrogen atoms.
For Zn-PgC3, these are the hydrogen atoms labelled blue and orange on Figure 13e. This
estimation of the window sizes (taking into account the van der Waals radius of hydrogen
atoms, 1.2 Å110)lead to the values of 3.171 Å by 3.120 Å (distance between the blue and
green hydrogen atoms, respectively). The cavity windows of Mg-PgC3 and Cu-PgC3 are
3.032 Å by 3.097 Å and 3.033 Å by 3.054 Å, respectively. For comparison, the cavity
window of the cucurbituril CB[5] is approximately 3.0 Å and it has been found that it can
only include small molecules such as water, methanol, and acetonitrile.7 A selection of

28
various sizes of VOCs are shown in Figures 13a-d. Smaller molecules such as chloroform
and dichloromethane are small enough to enter the cavity of each MONC. However, larger
molecules such as benzene and toluene are expected to not enter the cavity windows due to
steric hindrance.
Figure 13: Depiction of Zn-PgC3 and the guest molecules tested: a) benzene, b) toluene, c)
dichloromethane and d) chloroform. Distances were calculated after using the MO-G
geometry calculation with PM6 parameters using the Scigress software. e) Spacefill view of
Zn-PgC3 (referenced as YEVVOL in the CSD database). Grey: C, green: Cl, red: Zn,
purple: N, dark green: H, blue: H. The cavity window size of the MONCs was measured
between the hydrogen atoms shown as blue and dark green.
For Type 3 porous liquids, Basolite F300 metal-organic framework (MOF) was
selected as the porous host. This MOF contains pores of approximately 2 nm in size
suggesting that the VOCs depicted in Figure 15 would not be sterically hindered from the
pores of these MOFs.
In terms of solvent selection, one of the main constraints is that the solvent molecules
must be bulky enough not to occupy the cavities of the MONCs. In this context, ionic liquids
are a good choice of solvent as they exist in various shapes and sizes. Solvent screening can
be performed efficiently as a wide selection of ILs exists. Three ILs have been selected for
the preparation of PLs in this work. More specifically, an imidazolium-based IL
([C4mim][BF4]) and two phosphonium-based ILs ([P6,6,6,14][NTf2] and [P6,6,6,14][TMP]).
These ILs differ in cation and anion hydrophilicity and size. For instance, [C4mim][BF4] is
smaller, protic and more hydrophilic compared to the P-ILs. However, the P-ILs only differ

29
in the nature of the anion to help further investigate and understand their solvation
capabilities. The cations of both P-ILs are rather hydrophobic and large, but the anion of
[P6,6,6,14][TMP] is more hydrophobic. Overall, the aforementioned ILs will provide a good
starting point for the preparation of porous liquids.

30
2. Results and Discussion
2.1 C-Propylpyrogallol[4]arene
C-propylpyrogallol[4]arene (PgC3) was prepared through a condensation reaction between
butyraldehyde and pyrogallol under acidic conditions. Refluxing this mixture in ethanol for
24 hours gave a dark red precipitate, which was recrystallised from methanol resulting in a
white powder in 21% yield. Recrystallisation gave good quality crystals and single crystal
X-ray diffraction (SXRD) studies were performed resulting in a precise structure
determination with R1 = 5.56%. The crystal was determined to be a novel PgC3 hexasolvate
(Figure 17, henceforth referred to as PgC3-MeOH) and was also characterised by 1H NMR
spectroscopy, proton decoupled 13C NMR spectroscopy and thermogravimetric analysis
(TGA).
Based on its structure (Figure 14a), PgC3 is fourfold symmetric in solution. The
unique portion of the molecule contains four different types of hydrogen atoms on the alkyl
substituent, one hydrogen atom of an aromatic CH group, and two different hydroxyl
hydrogen atoms. In total, seven 1H NMR signals (excluding solvent resonances) are expected.
Peaks at 7.22 and 8.12 ppm were observed in a 1:2 ratio, respectively, which are assigned to
the hydroxyl hydrogen atoms. This assignment was confirmed by the addition of a few drops
of deuterated water, which resulted in the disappearance of these signals due to H/D
exchange. In addition, no unassigned peaks remained. Eight distinct signals were observed
in the {1H}13C NMR spectrum, further confirming the successful synthesis of the calixarene.
The results of both 1H NMR and {1H}13C proton decoupled NMR spectra were in close
agreement with previous results.111
Based on the CSD, there are only three known crystal structures of PgC3 containing
methanol (reference codes DOQFAS, LUMXEY and RORBAD).112–114 However, these
crystal structures were obtained as cocrystals using 1-(2-pyridylazo)-2 naphthol, rhodamine
B and xanthone as co-formers, respectively. These co-crystals will be referred to as PgC3-
PAN, PgC3-RB and PgC3-XAN, respectively. There are many similarities between PgC3-
MeOH and the reported crystal structures. For example, all belong to the P1̅ space group and
exhibit bilayer-type packing. Furthermore, in all crystal structures, PgC3 is stabilised by inter-
and intramolecular hydrogen bonding interactions, suggesting it is an efficient way to
crystallise PgC3 molecules. All structures are in the pinched cone conformation, apart from

31
PgC3-RB, which exhibits the conical conformation. The pinched cone conformation exhibits
C2V symmetry and has two aromatic rings almost parallel to each other with the other two
more flattened (Figure 14b).115 The conical conformation exhibits C4V symmetry in which
all four aromatic rings are angled similarly.
Figure 14: a) Structure of Pg-C3. b) Top view of the crystal structure of PgC3-MeOH with
two methanol molecules inside the cavity. c) Intermolecular hydrogen bonding between
two methanol and PgC3-MeOH molecules. Hydrogen atoms have been omitted for clarity.
PgC3-MeOH is triclinic and contains intra- and intermolecular OH···O hydrogen
bonding between PgC3–PgC3, PgC3–methanol and methanol–methanol molecules. The
intramolecular O···O hydrogen bond lengths between the hydroxyl oxygens of PgC3 vary
from 2.7499(18) to 2.8382(17) Å. Nineteen hydrogen bonds are present in the PgC3-MeOH
structure. Eleven of those are intermolecular hydrogen bonds between methanol and the
calixarene. Four are intramolecular calixarene hydrogen bonds and four more are
intermolecular methanol-methanol hydrogen bonds.
The intermolecular O···O hydrogen bonding distances vary from 2.5972(19) to
2.939(2) Å. The former value is remarkably short for a neutral hydrogen bond and is more
common for ionic hydrogen bonds.116 In fact, this is the shortest hydrogen bond recorded for

32
PgC3. Notably, there are other compounds that exhibit hydrogen bonds this short. For
instance, the crystal structure of a cocrystal including p-hydroxybenzoic acid (p-HBA) and
glutaric acid contains a hydrogen bond with the distance of 2.597 Å between the carboxylic
acid groups of two adjacent p-HBA molecules.117
Figure 14c shows intermolecular hydrogen bonding between two PgC3 and two
methanol molecules that are sandwiched between the two calixarenes. Two methanol
molecules act as bridging units between the symmetry equivalent PgC3 molecules via five
hydrogen bonds. This phenomenon is also observed in the crystal structure of PgC3-PAN
with a slight difference of four hydrogen bonds included in the bridging. The shortest
hydrogen bond is between O1 and O4 atoms and arises due to the compression of the two
adjacent PgC3-MeOH molecules by O2 participating in hydrogen bonding with O4. This
results in a hydrogen bond between O2 and O6, which has the length 3.0705(18) Å.
The cavity of PgC3 is occupied by two methanol molecules (Figure 14b). By looking
at the packing arrangement, it is revealed that these methanol molecules, among many, are
between the hydrophilic ends of separate layers of PgC3-MeOH molecules and form a
hydrogen bonding belt (Figure 15b). Figure 15a displays the bilayer-type packing of the
calixarene. This is most likely driven by van der Waals and hydrophobic forces.
Figure 15: a) Packing arrangement of PgC3 to illustrate the bilayer-type packing. b)
Packing arrangement of PgC3 as viewed from the side of Figure 15a. Hydrogen atoms have
been omitted for clarity.

33
TGA was undertaken to establish the thermal stability of the as-synthesised PgC3. It
is important to know the thermal stability of this compound as subsequent synthesis requiring
elevated temperature will be undertaken (solvothermal synthesis of the magnesium hexamer
discussed below). The sample was heated from room temperature to 450°C under helium
atmosphere with a ramp rate 10°C min-1. The thermogram revealed a decrease in weight of
1.4% up to 86.9°C, which could be the result of solvent loss from the crystals. A
decomposition onset temperature of 360.4°C accompanied by a weight loss of 90% was
observed. Hence, PgC3-MeOH has a high thermal stability and can be used for the synthesis
of Mg-PgC3.
2.2 Magnesium Seamed Hexameric Nanocapsules
Magnesium seamed hexameric nanocapsules (Mg-PgC3) were prepared via a solvothermal
method previously reported.107 A mixture of Mg(NO3)·6H2O and PgC3 in DMF:MeCN was
heated at 100°C overnight, resulting in black prism-shaped crystals. The crystals were
characterised by SXRD, NMR spectroscopy, MALDI mass spectroscopy and
thermogravimetric analysis.
The crystal structure of Mg-PgC3 (Figure 16) contains a large amount of disordered
solvent molecules and as a result the R1 value of 14.58% is relatively high. However, the
determination is of sufficient precision to give a qualitative picture of the main structure
details. The unit cell parameters are very similar to that of the magnesium MONC previously
reported and the materials are isomorphous.107 The Mg-PgC3 nanocapsules are made up of
six PgC3 ligands and 24 divalent magnesium cations. The coordination bond lengths between
magnesium cations and the oxygen atoms of the pyrogallol[4]arene ligand vary between
1.987(7) – 2.068(7) Å. These values are similar to the reported bond lengths, which are
between 1.99 – 2.03 Å.107 Mg-PgC3 contains eight Mg3O3 units in which the Mg–O–Mg bond
angles range between 137.2(4) – 140.0(5)° and the O–Mg–O angles are between 99.4(3) –
103.2(4)°. These results are also in close agreement with the reported values. The 24 divalent
magnesium cations are in an octahedral geometry. Equatorial positions are coordinated to the
O atoms of the PgC3 ligands and the axial positions are coordinated to solvent molecules.
Figure 18b shows the packing arrangement of Mg-PgC3. The MONCs are stacked in an
alternating arrangement, which is most likely guided by the alkyl tails. This type of packing
arrangement has also been previously reported for Mg-PgC3.

34
Figure 16: Magnesium seamed metal organic nanocapsules. a) Structure of a single
Mg-PgC3 capsule. Hydrogen atoms have been omitted for clarity. b) Packing arrangement
of Mg-PgC3 viewed down the 001 axis. Hydrogen atoms and alkyl tails have been omitted
for clarity.
Performing solvent masking on the disordered solvent molecules inside the Mg-PgC3
cavity indicated that the volume of the cavity is 782 Å3 and that it contains 505 electrons. It
is difficult to accurately determine the contents of the cavity considering it could contain
acetonitrile, dimethylformamide and water molecules in any possible combination.
Furthermore, it is likely that different combinations of these solvent molecules are inside
each Mg-PgC3 nanocapsule.
MALDI–MS was performed to aid in the characterisation of the contents of the Mg-
PgC3 cavity. Unfortunately, the spectrum contained a wide spread of peaks across the m/z
scale which were difficult to assign. This could mean that the as-prepared Mg-PgC3 crystals
are unstable and decompose into various fragments. To support this hypothesis, TGA was
performed. The thermogram (Figure 17) revealed that Mg-PgC3 gradually decomposes and
loses 50% of its weight by 148°C. The decomposition pathway most likely lies in the nature
of the metal coordination bonds as other MONCs exhibited significantly higher thermal
stabilities. The decomposition of these magnesium coordination bonds would lead to various
sized fragments as observed in the MALDI-MS spectrum. 1H NMR spectroscopy was also
performed on Mg-PgC3, but no identifiable peaks apart from those of solvent were obtained
because of the low solubility of the MONC.
35
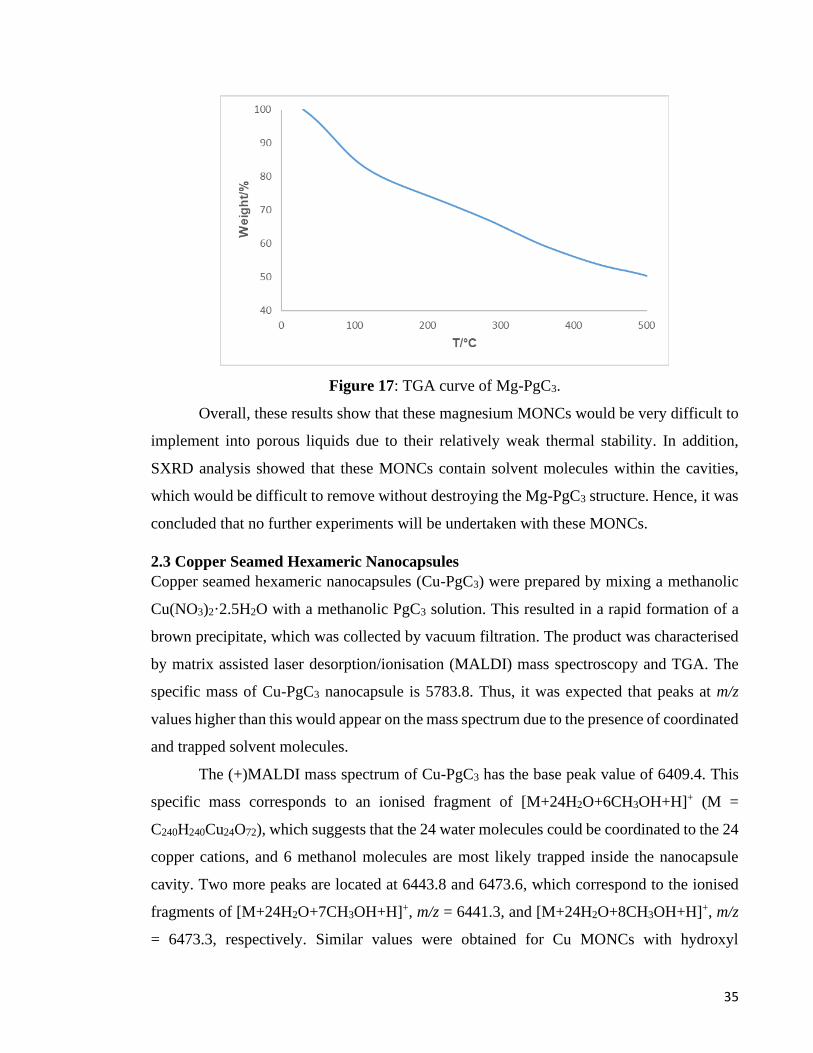
Figure 17: TGA curve of Mg-PgC3.
Overall, these results show that these magnesium MONCs would be very difficult to
implement into porous liquids due to their relatively weak thermal stability. In addition,
SXRD analysis showed that these MONCs contain solvent molecules within the cavities,
which would be difficult to remove without destroying the Mg-PgC3 structure. Hence, it was
concluded that no further experiments will be undertaken with these MONCs.
2.3 Copper Seamed Hexameric Nanocapsules
Copper seamed hexameric nanocapsules (Cu-PgC3) were prepared by mixing a methanolic
Cu(NO3)2·2.5H2O with a methanolic PgC3 solution. This resulted in a rapid formation of a
brown precipitate, which was collected by vacuum filtration. The product was characterised
by matrix assisted laser desorption/ionisation (MALDI) mass spectroscopy and TGA. The
specific mass of Cu-PgC3 nanocapsule is 5783.8. Thus, it was expected that peaks at m/z
values higher than this would appear on the mass spectrum due to the presence of coordinated
and trapped solvent molecules.
The (+)MALDI mass spectrum of Cu-PgC3 has the base peak value of 6409.4. This
specific mass corresponds to an ionised fragment of [M+24H2O+6CH3OH+H]+ (M =
C240H240Cu24O72), which suggests that the 24 water molecules could be coordinated to the 24
copper cations, and 6 methanol molecules are most likely trapped inside the nanocapsule
cavity. Two more peaks are located at 6443.8 and 6473.6, which correspond to the ionised
fragments of [M+24H2O+7CH3OH+H]+, m/z = 6441.3, and [M+24H2O+8CH3OH+H]+, m/z
= 6473.3, respectively. Similar values were obtained for Cu MONCs with hydroxyl

36
functionalised PgC3 alkyl tails, indicating that the desired Cu-PgC3 has been successfully
synthesised.118 It has been previously suggested that 24 water molecules form a metal-
coordinated water cluster inside the capsule cavity.118 This indicates that the axial copper
coordination sites directed toward the inside of the cavity are most likely taken up by these
water molecules.
Table 1: MALDI mass fragments of copper seamed hexameric nanocapsules.
The thermal stability of Cu-PgC3 was evaluated by TGA from room temperature to
500°C under helium atmosphere. The thermogram (Figure 18) shows a similar behaviour to
that of PgC3. A slow decrease of approximately 10% weight is observed up to 250°C, which
could indicate the loss of surface and entrapped solvent. The estimated entrapped solvent
molecules of the base peak consist of 24 water and 6 methanol molecules (Table 1),
corresponding to approximately 10% weight of Cu-PgC3. This indicates that the cavity
window of Cu-PgC3 is of sufficient size to permit the host-guest exchange of molecules the
size of methanol and water. This is followed by a sharp weight loss of approximately 40%
with an onset temperature of 338.5°C. The onset decomposition temperature of PgC3 is
360.4°C, which is very similar to that of Cu-PgC3. This could indicate that the decomposition
pathway starts by the breakdown of the pyrogallol[4]arene ligands rather than the
coordination bonds. Nonetheless, these results show superior thermal stability of Cu-PgC3
over Mg-PgC3, making it a more desirable MONC for the preparation of porous liquids than
the latter. Having said this, it is important to add that the potential application of Cu-PgC3 as
Type 2 PLs was not further investigated due to the time constraints from the ongoing COVID-
19 pandemic.

37
Figure 18: TGA curve of Cu-PgC3.
2.4 Zinc Seamed Dimeric Nanocapsules
Zinc seamed dimeric nanocapsules (Zn-PgC3) were prepared based on the reported
procedure, with slight modifications.109 A solution of zinc nitrate hexahydrate in pyridine
was sonicated until dissolved, then added to a methanolic solution of PgC3. This resulted in
the precipitation of a yellow powder, which was collected by vacuum filtration. The product
was characterised by 1H and 13C proton decoupled NMR spectroscopy and TGA.
The 1H NMR spectrum (partially shown in Figure 19) confirmed the structure of Zn-
PgC3. Integration of the NMR resonances suggest that the MONC consists of two PgC3
ligands seamed together by eight zinc(II) ions, along with a single pyridine molecule
encapsulated in the cavity. Resonances at 0.98, 1.34, 2.19 and 4.19 ppm were assigned to the
-CH3, -CH2, -CH2 and -CH hydrogen atoms of the alkyl substituents, respectively. Three
pyridyl hydrogen atom resonances appear where expected in DMSO at 7.41, 7.81 and 8.58
ppm. However, three additional resonances appear significantly upfield (denoted with stars
in Figure 21). Integration of these two sets of peaks revealed that these two types of pyridine
molecules are present in an 8:1 ratio. This pattern is interpreted in terms of eight pyridine
molecules coordinated to the zinc cations on the outside of the cavity and one encapsulated
pyridine guest. This observation is in agreement with previous reports.109 13C{1H} NMR
spectroscopy provides further support for this hypothesis. The observation of two sets of
pyridyl resonances implies slow exchange on the NMR spectroscopic timescale and hence a
kinetically stable capsule despite the relatively labile nature of zinc(II).

38
Figure 19: Partial 1H NMR spectrum of Zn-PgC3. Stars denote the resonances assigned to
the encapsulated pyridine molecule. These signals experience a significant upfield shift as a
result of the shielding effect of the aromatic rings of the cavity wall.
Diffusion-ordered NMR spectroscopy (DOSY) was used to verify the encapsulation
of the pyridine molecule. Zn-PgC3 was expected to have a smaller diffusion constant
compared to that of solvent molecules and coordinated pyridine ligands outside of the cavity.
It was found that the high field resonances corresponding to the encapsulated pyridine
molecule had a similar diffusion coefficient to that of the PgC3 ligands that comprise the
MONC. In addition, the diffusion coefficient values of the encapsulated pyridine and PgC3
ligands were significantly smaller compared to the pyridine ligands outside of the cavity. The
spectrum also shows multiple diffusion coefficient signals for the ligated pyridyl hydrogen
atoms (signals sets between 7 to 9 ppm). This suggests that the coordinated pyridine
molecules outside of the cavity could be actively in exchange.
The diffusion coefficient values obtained from DOSY NMR were also used to
estimate the molecular weight of Zn-PgC3 to confirm whether the Zn MONC holds together
in solution. This was performed based on the work by Morris et al. who proposed a model to
roughly estimate the molecular mass of a compound based on its diffusion coefficient
values.119 There are slight deviations between diffusion coefficient values of Zn-PgC3. For
example, the propyl alkyl tail -CH3, -CH2 and -CH2 hydrogen atoms of PgC3 have diffusion
coefficient values of 1.09x10⁻¹⁰, 1.10x10⁻¹⁰ and 1.11x10⁻¹⁰ m2 sec-1, respectively. These
values yield an estimated molecular weight of 2422.1, 2369.4 and 2318.4 g mol-1,
respectively. Assuming full occupancy of Zn-PgC3 based on the 1H and 13C NMR results, the
true molecular weight of Zn-PgC3 can be calculated to 2447.32g mol-1. Thus, the estimated
molecular weight from DOSY is very similar to the theoretical molecular weight. The
molecular weight derived from DOSY NMR is an approximation and does not account for
factors such as shape, solvation and concentration. However, the close agreement between

39
the DOSY and theoretical molecular weight values implies that Zn-PgC3 retains its structure
in solution.
Figure 20: DOSY Transform NMR spectrum of Zn-PgC3. Peaks are labelled as following:
1 – alkyl substituents of PgC3, 2 – encapsulated pyridine and 3 – free pyridine. Other peaks
are that of solvent molecules or hydrogen atoms of PgC3.
The thermal stability of Zn-PgC3 was evaluated using TGA. This was performed
under nitrogen environment whilst heating the compound from room temperature to 500°C.
The thermogram (Figure 21) reveals a weight loss of 1.4% up to 188°C, which could be the
result of solvent loss from the powder. The decomposition onset temperature is 188°C, which
is significantly lower compared to PgC3 and Cu-PgC3. Nonetheless, this thermal stability is
high enough for the purpose of preparing PLs. The weight loss is relatively linear as the
temperature is increased, and a 37.1% decrease in weight is observed. The axially
coordinated pyridine ligands make up approximately 26% of the weight of the MONC. Thus,
this weight loss can be attributed to a more significant decomposition than loss of the pyridine
ligands. It is most likely that further increase in temperature would result in more decrease
in weight as the full decomposition of Zn-PgC3 is not observed on the thermogram.

40
Figure 21: TGA curve of Zn-PgC3.
2.5 Guest Exchange of Zinc Seamed Dimeric Nanocapsules
Recently, a coordination cage was subjected to liquid state and gas diffusion guest
encapsulation experiments, monitored via NMR spectroscopy.99 Upon successful
encapsulation, the NMR spectrum exhibited an upfield shift of the encapsulated guest
resonances relative to the free guest resonances. Thus, similar shifts were expected to be
observed upon successful guest exchange in this work.
Guest exchange was performed on Zn-PgC3 MONCs due to their high thermal
stability and the diamagnetic nature of zinc(II), which means that changes in the environment
of the capsule can be monitored via 1H NMR spectroscopy. The experiments were performed
in the liquid state and via gas diffusion. For the former, a 2 mM solution of Zn-PgC3 in
deuterated dimethyl sulfoxide (d6-DMSO) was prepared in an NMR tube. To that, 10 μL of
the guest (1-propanol, 1-butanol, isobutanol, and toluene) was added. These guests were
selected due to their varying size and shape. Each mixture was equilibrated for 18 hours, after
which the 1H NMR spectra were acquired. For the gas diffusion experiments, 2 mg of solid
Zn-PgC3 was placed in a vial, which was set inside a larger vial containing 1 mL of the guest
(benzene, toluene, chloroform and dichloromethane). Again, these guests were selected due
to their varying size and shape along with their volatile nature. The larger vial was capped
and left to equilibrate for 24 hours. The Zn-PgC3 powder was then dissolved in d6-DMSO
and taken for 1H NMR spectroscopy.

41
The 1H NMR spectra of the liquid state experiments showed the presence of
resonances assigned to the newly added potential guests. However, no upfield shifts were
observed for the guest molecule resonances, indicating that they have not entered the cavity
of Zn-PgC3. Gas diffusion experiments showed similar results – all guest resonances were
observed where expected in d6-DMSO without the appearance of any shifts that would
suggest that guest molecules were encapsulated. Figure 22 shows the 1H NMR spectrum of
Zn-PgC3 with dichloromethane. The hydrogen atom resonance of dichloromethane is
observed at 5.77 ppm, which is where it is expected to appear in d6-DMSO. No upfield shifts
corresponding to this resonance are observed, leading to the conclusion that dichloromethane
does not enter the Zn-PgC3 cavity. However, the presence of this resonance suggests some
type of host-guest interaction, resulting in the absorption of the guest molecules onto the
surface of Zn-PgC3.
Figure 22: 1H NMR spectrum of Zn-PgC3 after gas diffusion with dichloromethane.
Furthermore, the resonances previously assigned to the encapsulated pyridine
molecule (Figure 19) remained, further indicating that no host-guest exchange has occurred.
In Figure 24, these resonances are observed between 4 and 5 ppm. Even though the guest
molecules are small enough to fit through the window, the occupied cavity experiences
significant restrictions. The cavity volume of Zn-PgC3 is approximately 141 Å3, of which
75.1 Å3 is taken up by the encapsulated pyridine, leaving minimal space to bind other

42
molecules.109 In addition, even though calculations indicate that pyridine could be small
enough to exit the cavity, then in reality this does not occur.
Overall, these results show that the selected guest molecules do not participate in
guest exchange with pyridine inside the MONC. The 1H NMR spectra clearly show that
pyridine does not leave the cavity of Zn-PgC3. Subsequently, the cavity volume is too small
to be occupied by other guests. However, the presence of guest resonances in the 1H NMR
spectra indicates some host-guest interactions. This could be the result of the interactions
between the newly added guests and ligated pyridine molecules, resulting in the absorption
of the guests onto the surface of Zn-PgC3.
2.6 Metal-Organic Frameworks
This work discusses the use of Basolite® F300 MOF for the preparation of Type 3 porous
liquids (PL). The prepared PL will be tested for dye absorption efficiency. This technique
has been selected as it can be used for the determination of empty spaces within the ionic
liquids. For instance, an aqueous dye solution can be added to the PL colloid. If the prepared
colloid is stable and capable of dye uptake, the dye will permeate from the aqueous phase to
the PL phase. This results in the colour change of the aqueous solution which means that the
kinetics of this change can be monitored via UV-Vis spectroscopy. This gives the opportunity
to quantify the efficiency of the PL. Furthermore, if successful, the as-prepared PLs could be
potentially used for wastewater remediation purposes.
2.6.1 Basolite® F300
Basolite® F300 (BF300), empirical formula C9H3FeO6, was purchased from Merck and
characterised via TGA and PXRD. This MOF is prepared commercially using an
electrochemical method resulting in a brown amorphous powder.120 XANES and EXAFS
studies have concluded that BF300 consists of Fe3+ ions coordinated to the 1,3,5-
benzenetricarboxylic acid with the ligands arranged in an octahedral geometry.121 TGA
results reveal an initial weight loss of approximately 15.6% by 105.4°C, which is most likely
the decomposition of residual solvent. The decomposition onset temperature of the
framework is 340.7°C, accompanied by a 45.5% weight loss. These values are in agreement
with previous reports.122,123 Figure 23 shows the PXRD pattern of BF300. The pattern
contains broad peaks and low resolution, which can be attributed to the disordered nature of
the framework and the small crystallite size. The Scherrer equation is used to estimate the

43
average crystallite size, which was calculated to be 7.4 nm, in accurate agreement with
previous reports.122,123
Figure 23: X-ray powder diffraction pattern of Basolite F300.
The absorption capability of BF300 was tested on two anionic dyes, Alizarin Red S
(ARS) and Acid Blue 25 (AB25) (Figure 24). A specific amount of absorbent was stirred in
each aqueous dye solution for 24 hours to confirm absorption of dyes. After the addition of
BF300 to aqueous solutions of ARS and AB25, it was determined that the MOF is capable
of ARS absorption. The solution containing AB25 changed from blue to green and remained
as such. The green colour is the result of the pH drop to approximately 5.5. More importantly,
it was determined that BF300 is not capable of efficient absorption of the AB25 dye. Thus,
AB25 was not used for the evaluation of the uptake efficiency of the porous liquids.
Figure 24: Structures of a) Alizarin Red S and b) Acid Blue 25.
The porous liquids (PLs) were prepared by adding 10 mg of BF300 to 1 mL of each
ionic liquid (IL), shown in Figure 25. The resulting mixture was sonicated until a well-
dispersed brown-orange colloid formed. The resulting colloids were tested for dye absorption

44
capabilities by adding 1 mL of an aqueous ARS to 1 mL of each PL. The resulting mixture
contained two phases (aqueous dye phase and the ionic liquid phase containing BF300) and
the dye permeation from the aqueous to the PL phase was monitored for 24 hours.
Figure 25: Ionic liquids used for the preparation of porous liquids by the addition of 10 mg
of BF300 and sonication until the formation of the brown colloids shown below.
a) Trihexyltetradecylphosphonium bis(2,4,4-trimethylpentyl)phosphinate and the resulting
porous liquid PL1. b) Trihexyltetradecylphosphonium bis(trifluoromethylsulfonyl)amide
and the resulting porous liquid PL2. c) 1-butyl-3methyl-imidazolium tetrafluoroborate and
the resulting porous liquid PL3.
The stability of the PLs was evaluated by monitoring the solutions visually. It was
hypothesised that less stable PLs would exhibit precipitation of BF300 faster compared to
more stable PLs. Within 24 hours, PL3 displayed such behaviour as the mixture became clear
and BF300 had precipitated out of the IL. As for PL1 and PL2, these mixtures retained
stability for several days. This leads to the assumption that the hydrophobic interactions
between BF300 and the phosphonium-based ILs lead to higher stability of the resulting PLs
while the hydrophilic nature of [C4mim][BF4] does not provide solution stabilizing
interactions.
Figure 26 shows dye permeation into PL1, PL2 and PL3. Within 24 hours, most of
the dye has permeated form the aqueous phase into the ionic liquid phase of PL1 and PL2.
This could suggest that porous liquids have been successfully prepared. However, when this
was repeated with pure ILs, the same phenomenon occurred. It has been determined that the
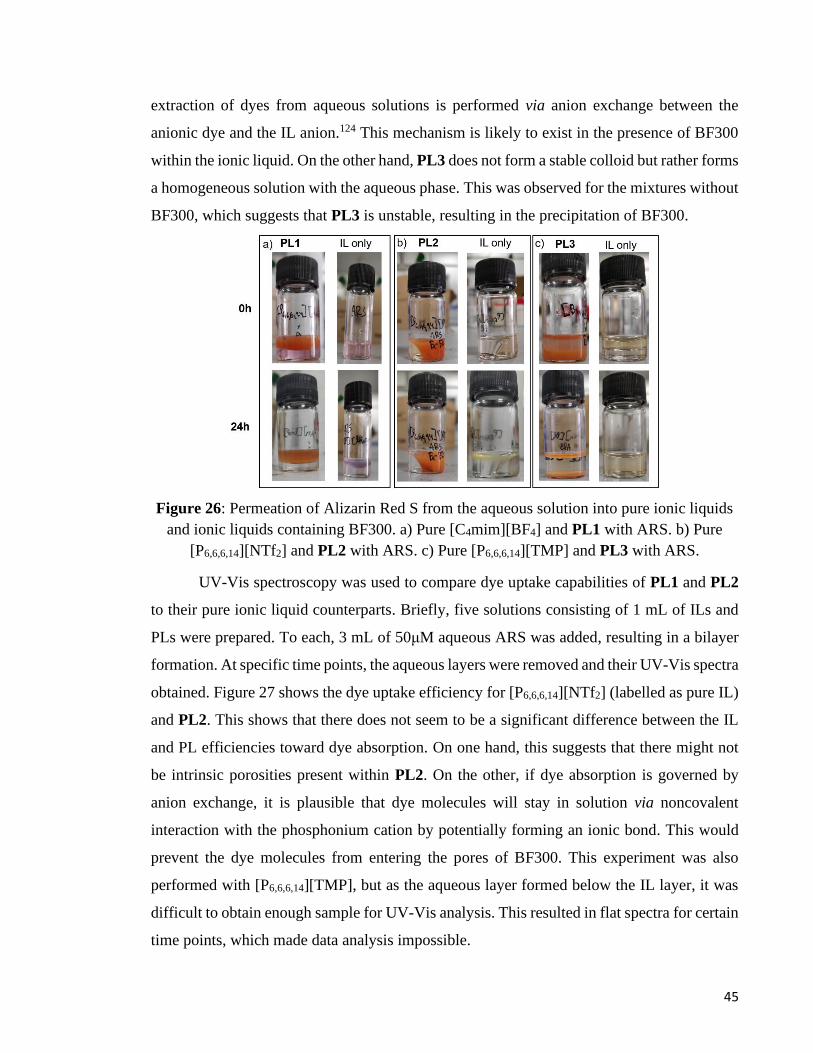
45
extraction of dyes from aqueous solutions is performed via anion exchange between the
anionic dye and the IL anion.124 This mechanism is likely to exist in the presence of BF300
within the ionic liquid. On the other hand, PL3 does not form a stable colloid but rather forms
a homogeneous solution with the aqueous phase. This was observed for the mixtures without
BF300, which suggests that PL3 is unstable, resulting in the precipitation of BF300.
Figure 26: Permeation of Alizarin Red S from the aqueous solution into pure ionic liquids
and ionic liquids containing BF300. a) Pure [C4mim][BF4] and PL1 with ARS. b) Pure
[P6,6,6,14][NTf2] and PL2 with ARS. c) Pure [P6,6,6,14][TMP] and PL3 with ARS.
UV-Vis spectroscopy was used to compare dye uptake capabilities of PL1 and PL2
to their pure ionic liquid counterparts. Briefly, five solutions consisting of 1 mL of ILs and
PLs were prepared. To each, 3 mL of 50μM aqueous ARS was added, resulting in a bilayer
formation. At specific time points, the aqueous layers were removed and their UV-Vis spectra
obtained. Figure 27 shows the dye uptake efficiency for [P6,6,6,14][NTf2] (labelled as pure IL)
and PL2. This shows that there does not seem to be a significant difference between the IL
and PL efficiencies toward dye absorption. On one hand, this suggests that there might not
be intrinsic porosities present within PL2. On the other, if dye absorption is governed by
anion exchange, it is plausible that dye molecules will stay in solution via noncovalent
interaction with the phosphonium cation by potentially forming an ionic bond. This would
prevent the dye molecules from entering the pores of BF300. This experiment was also
performed with [P6,6,6,14][TMP], but as the aqueous layer formed below the IL layer, it was
difficult to obtain enough sample for UV-Vis analysis. This resulted in flat spectra for certain
time points, which made data analysis impossible.

46
Figure 27: Dye uptake efficiency of [P6,6,6,14][NTf2] (pure IL) and PL2.
Overall, it is rather difficult to confirm the presence of permanent porosity in the IL
phase without further experiments. Using UV-Vis spectroscopy to study the absorption
intensity changes within the aqueous phase could be effective. Overall, due to the
inconclusive nature of these results, it is difficult to determine whether the prepared PL1 and
PL2 are permanently porous liquids as more work is required.

47
3. Future Work
Future work would heavily include further characterisation techniques for PL1 and PL2. By
definition, porous liquids must contain empty spaces provided by the pore generator – i.e.,
Basolite F300 MOF in this work. Positron annihiliation lifetime spectroscopy (PALS) has
been proven to be one of the most efficient pore characterisation methods. This technique
would allow for the accurate determination of empty pore networks of Basolite F300 along
with the determination of the pore sizes. On the other hand, if the solvent molecules occupy
the pore spaces, this could be confirmed via PALS as smaller pore values would be obtained.
This technique could be coupled with rheology studies, which could further assess the
stability and fluid-like behaviour of the PLs. In addition, the potential application of Cu-
PgC3 as Type 2 PLs could be undertaken by applying similar characterisation methods to
evaluate their porosity and stability.
More quantitative results for PL1 and PL2 could be obtained by using smaller
molecules than the dyes mentioned in this work. For instance, various gases (N2, O2 or CO2)
could be bubbled through the PLs for a specific amount of time. Subsequently, FT-IR spectra
could be obtained to confirm any adsorption of gas molecules. Coupling these techniques
with aforementioned characterisation techniques would provide a full picture to effectively
evaluate the porosity and efficiency of the prepared porous liquids.

48
4. Conclusions
This work describes the preparation of porous liquids of Type 2 and 3 using metal-organic
nanocapsules and metal-organic frameworks, respectively. The main challenge regarding the
preparation of Type 2 porous liquids was ensuring the cavities of the capsules were empty of
solvent molecules. This challenge was not overcome as evidenced via NMR studies on Zn-
PgC3. Rather, it was confirmed that guest exchange of pyridine with smaller molecules was
unsuccessful.
Three Type 3 PLs (PL1, PL2, and PL3) were prepared. PL1 and PL2 exhibited
superior stability compared to PL3 and remained stable colloids for days. All PLs were
evaluated qualitatively for dye absorption using a biphasic setup. It was shown that dyes
permeated from the aqueous phase to the ionic liquid phase leaving the former transparent.
This is most likely due to the anion exchange between the IL anion and the anionic dye in
the aqueous phase. UV-Vis results showed that PL2 has a similar dye uptake efficiency
compared to the IL that it is composed of. This suggests that there is no intrinsic porosity
within this PL. However, it could also be argued that if dye absorption mechanism is
governed by anion exchange, then the dye molecules will stay in solution via noncovalent
attraction forces and will not enter the pores of BF300.

49
5. Experimental
5.1 Synthesis and Materials
All starting materials were purchased from Merck and used without further purification. All
ionic liquids were purchased from Merck and used without further treatment or purification.
1H and {1H}13C NMR spectra were obtained using the Bruker Avance III-HD-400
spectrometer with operating frequency of 400.07 MHz. DOSY NMR spectra were obtained
using the Varian VNMRS-700 spectrometer with operating frequency of 699.73 MHz.
Chemical shifts are relative to internal TMS. FT-IR spectra were obtained using the
PerkinElmer Spectrum 100 series spectrometer in the range of 4000 cm-1 to 550 cm-1 at a
resolution of 0.5 cm-1. Three spectra of each sample were obtained, and the average was
plotted. PXRD patterns were measured using the Bruker AXS D8 Advance in Bragg-
Brentano geometry, equipped with a Lynxeye Soller PSD detector. Samples were measured
on a Si low background sample holder and analysed using Cu-Kα radiation at a wavelength
of 1.5406 Å. Samples were scanned over an angle range of 2-30° 2θ with a step size of 0.02°
and a scan rate of 1s per step. Crystallite size analysis was performed using the equation
below:
𝐷 = 𝐾𝜆
𝜏𝑐𝑜𝑠𝜃𝐵 (1)
Where D is the crystallite size, τ is full-width at half maximum, K is a constant close to unity
(0.9 was used in this work), λ is the X-ray wavelength, and θB is the Bragg angle. MALDI-
MS spectra were acquired using the Autoflex II ToF/ToF mass spectrometer (Bruker
Daltonik GmBH), equipped with a 337 nm nitrogen laser. The linear mode of analysis was
used between m/z 1097.0 to 9663.3. Trans-2-[3-(4-tert-Butylphenyl)-2-methyl-2-
propenylidene]malononitrile (DCTB) was used as the matrix. Prior to the analysis, 1μL of
the sample was placed onto a metal target and allowed to evaporate. TGA spectra were
obtained using the Perkin Elmer Pyris I thermogravimetric analyser and DSC was performed
using the Q1000 DSC from TA Instruments. Samples were run from room temperature up to
designated temperatures under nitrogen, helium or oxygen atmosphere. Elemental analysis
was performed with the Exeter CE-440 Elemental Analyser and all analysed samples were
dried prior to analysis using the Abderhalden’s drying pistol under toluene reflux. UV-Vis
spectra were recorded using the Cary 5000 UV-Vis-NIR spectrophotometer with 1 nm
resolution.

50
5.2 Synthesis of C-propylpyrogallol[4]arene
The procedure to prepare C-propylpyrogallol[4]arene was taken from the work of
Gerkensmeier et al.125 Pyrogallol (5.00 g, 39.6 mmol) was added to a solution of ethanol (30
mL) and concentrated hydrochloric acid (6 mL). To the resulting mixture, 1 eq. of aldehyde
was added dropwise under ice. The mixture was heated under reflux for 24h after which the
reaction was cooled to room temperature and the precipitate, white powder, was vacuum
filtered and washed with cold ethanol, then recrystallised from methanol. The product was
characterised by SXRD, 1H and proton decoupled 13C NMR. Yield = 1.50 g, 2.1 mmol, 21%.
1H NMR (400 MHz, acetone-d6): δ = 0.96 (12H, t, J = 7.4 Hz, CH3), 1.26 – 1.40 (8H, m,
CH2), 2.22 – 2.33 (8H, m, CH2), 3.32 (4H, s, CH), 4.37 (4H, t, J = 8.0 Hz, ArH), 7.14 (4H,
s, ArH), 7.21 (4H, s, OH), 8.12 (8H, s, OH).
{1H}13C NMR (101 MHz, acetone-d6) δ = 13.42, 20.96, 33.72, 35.00, 113.64, 124.84, 132.78,
139.23.
5.3 Synthesis of metal-seamed nanocapsules
5.3.1 Mg-seamed hexameric nanocapsules
The Mg-seamed hexameric MONCs were prepared based on the synthesis described by
Atwood et al.126 C-propylpyrogallol[4]arene (360 mg, 0.5 mmol) and Mg(NO3)·6H2O (513
mg, 2.0 mmol) were dissolved in 5 mL of DMF and 5 mL MeCN. To this mixture, 500µL of
deionized water and imidazole (0135 mg, 2.0 mmol) were added. The mixture was sonicated
for 5 minutes resulting in a dark blue solution, which was heated at 100°C overnight. Plate-
like crystals were collected by vacuum filtration and characterised by SXRD. Yield = 0.22
g, 0.040 mmol, 48% based on the formula C240H318Mg24O120.
5.3.2 Cu-seamed hexameric nanocapsules
Cu-seamed hexameric MONCs were prepared via a known procedure.108 By adding
methanolic Cu(NO3)2·2.5H2O (40 mM) to a methanol solution of PgC3 (10 mM), the
instantaneous formation of a brown precipitate was observed. To obtain the product, the
precipitate was vacuum filtered and characterized by TGA, MALDI MS and elemental
analysis. Yield = 0.066 g, 0.011 mmol, 69% based on the formula Cu24C246H312O102.
MALDI MS (m/z): 6409.3 [M+H+24H2O+6CH3OH]+, 6443.8 [M+H+24H2O+7CH3OH]+,
6473.6 [M+H+24H2O+8CH3OH].

51
5.3.3 Zn-seamed dimeric nanocapsule
Zn-seamed dimeric MONCs were prepared via a known procedure, with slight
modifications.109 Zinc nitrate hexahydrate (0.1654 g, 0.56 mmol) was dissolved in 2 mL of
pyridine, which was sonicated for 10 minutes. The resulting solution was mixed with a 4 mL
methanol solution of PgC3 (0.10 g, 0.139 mmol). A yellow precipitate was collected via
vacuum filtration and characterised via TGA, 1H and 13C NMR. Yield = 0.10 g, 47%.
1H NMR (400 MHz, DMSO-d6): δ = 0.97 (24H, t, J = 7.4 Hz, CH3), 1.33 (16H, p, J = 7.4
Hz, CH2), 2.18 (16H, d, J = 7.4 Hz, CH2), 4.12 (1H, t, J = 7.9 Hz, encapsulated pyridine)
overlaying with 4.18 (8H, t, J = 8.0 Hz, CH), 4.43 (2H, t, J = 6.8 Hz, encapsulated pyridine),
4.93 (2H, dd, J = 6.8 Hz, 5.3 Hz, encapsulated pyridine), 6.49 (8H, s, ArH), 7.41 (16H, ddd,
J = 7.6, 4.3, 1.5 Hz, pyridine), 7.81 (8H, tt, J = 7.6, 1.8 Hz, pyridine), 8.58 (16H, dt, J = 4.3,
1.8 Hz, pyridine). Obtained peaks are in close agreement with literature.109
{1H}13C NMR (101 MHz, DMSO-d6): δ = 14.58, 21.53, 32.68, 35.54, 107.40, 124.39,
124.48, 125.35, 136.80, 139.31, 141.82, 150.06.
5.4 Dye adsorption
Two dyes, Acid Blue 25 and Alizarin Red S, were selected as adsorbates. Stock solutions of
both dyes having 50μM concentration were prepared. To test the dye adsorption capability
of Basolite F300, 0.1g of the adsorbent was added to 50 mL of dye solution. The mixture was
stirred for 24 hours, then filtered to obtain the MOF. Porous liquid dye adsorption was
performed via a two-phase method. 1 mL of ionic liquid including 10 mg of BF300 was
stirred until a homogeneous colloid was obtained. To this, 1 mL of dye solution was added,
which resulted in the formation of two phases. The mixture was allowed to equilibrate for 24
hours. For UV-Vis analysis, samples were prepared by adding 3 mL of aqueous dye solution
to 1 mL of either IL only or PL colloid. Samples were collected at t = 0, 10, 30, 60, 180, and
360 min. time points by removing the aqueous layer with a Pasteur pipette. One sample was
prepared for each time point.
5.5 Analysis
5.5.1 Gas diffusion of VOCs
The inclusion of VOCs into the Zn MONCs was studied by 1H NMR spectroscopy. A small
vial containing 2 mg of the Zn MONC was placed in a larger vial containing 1 mL of the
guest VOC, which was then capped and sealed tightly. Four such vials containing toluene,

52
chloroform, dichloromethane and benzene as VOCs were prepared. The samples were
equilibrated for 24 hours, then prepared for NMR spectroscopy.
1H NMR (400 MHz, DMSO-d6, benzene VOC): δ = 0.97 (24H, t, J = 7.2 Hz), 1.32 (16H, p,
J = 7.3 Hz), 2.18 (14H, d, J = 7.7 Hz), 4.11 (1H, t, J = 7.7 Hz, enc. pyridine), 4.18 (8H, t, J
= 7.9 , ), 4.42 (2H, t, J = 6.8H, enc. pyridine), 4.89 – 4.95 (2H, m, enc. pyridine), 6.48
(6H, s), 7.37 (132H, s, benzene), 7.80 (7H, J = 7.60, 1.80 Hz), 8.58 (14H, dt, J = 4.4, 1.8
Hz).
1H NMR (400 MHz, DMSO-d6, CHCl3 VOC): δ = 0.93 – 1.00 (24H, m), 1.33 (16H, q, J =
7.4 Hz), 2.18 (14H, d, J = 7.8 Hz), 4.11 (1H, t, J = 7.9 Hz, enc. pyridine), 4.18 (8H, t, J =
7.9 Hz), 4.42 (2H, t, J = 6.9 Hz, enc. pyridine), 4.91 (2H, t, J = 6.1 Hz, enc. pyridine),
6.48 (6H, s), 7.40 (15H, ddd, J = 7.6, 4.3, 1.5 Hz), 7.80 (8H, tt, J = 7.6, 1.9 Hz), 8.33 (50H,
s, CHCl3), 8.55 – 8.62 (15H, m).
1H NMR (400 MHz, DMSO-d6, CH2Cl2 VOC): δ = 0.97 (24H, t, J = 7.2 Hz), 1.33 (16H, q,
J = 7.4 Hz), 2.12 – 2.23 (14H, m), 4.11 (1H, t, J = 7.6 Hz, enc. pyridine), 4.18 (8H, t, J =
8.0 Hz), 4.41 (2H, t, J = 6.8 Hz, enc. pyridine), 4.91 (1H, m, enc. pyridine), 5.77 (146H, s,
CH2Cl2), 5.77 – 5.93 (8H, m), 6.48 (6H, s), 7.40 (15H, ddd, J = 7.6, 4.3, 1.5 Hz), 7.80 (8H,
tt, J = 7.6, 1.8 Hz), 8.55 – 8.62 (14H, m).
1H NMR (400 MHz, DMSO-d6, toluene VOC): δ = 0.97 (24H, t, J = 7.3 Hz), 1.32 (16H, p,
J = 7.3 Hz), 2.17 (15H, m) overlaying with 2.31(53H, d, J = 0.7 Hz, toluene), 4.11 (1H, t, J
= 7.8 Hz, enc. pyridine), 4.18 (8H, t, J = 8.0 Hz), 4.42 (2H, t, J = 6.8 Hz, enc. pyridine),
4.89 – 4.94 (2H, m, enc. pyridine), 6.49 (7H, s), 7.11 – 7.20 (51H, m, toluene), 7.20 – 7.32
(37H, m, toluene), 7.40 (15H, ddd, J = 7.6, 4.3, 1.5 Hz), 7.80 (7H, tt, J = 7.6, 1.8 Hz), 8.58
(14H, dt, J = 4.3, 1.7 Hz).
5.6 Single Crystal X-ray Diffraction
Single Crystal X-ray diffraction was performed using the Bruker D8 Venture diffractometer
(high intensity Mo/Cu dual IμS2 sources, CMOS area detector, 3 circle goniometer and
focusing mirrors) at 120.0 K using Mo Kα radiation (λ = 0.71073 Å). The diffractometer is
equipped with the Cryostream 700+ (Oxford Cryosystems) open flow nitrogen cryostat
(temp. range 80 – 500 K) and HELIX (Oxford Cryosystems) open flow helium cryostat
(temp. range 25 – 300 K). The structures were solved and refined using the Olex2 and
SHELXTL softwares.

53
5.6.1 Single crystal X-ray diffraction data of PgC3
Empirical formula C40H48O12 x 6 CH3OH
Formula weight 913.03
Crystal system triclinic
Space group P1
a (Å) 11.4710(7)
b (Å) 11.5460(7)
c (Å) 19.0494(12)
α (°) 75.464(2)
β (°) 74.498(2)
γ (°) 79.090(2)
Volume (Å3) 2333.1(3)
Z 2
ρcalc (g/cm3) 1.300
μ (mm-1) 0.099
F(000) 984.0
Crystal size (mm3) 0.22 × 0.17 × 0.08
2Θ range for data collection(°) 4.634 to 59
Index ranges -15 ≤ h ≤ 15, -15 ≤ k ≤ 15, -26 ≤ l ≤ 26
Reflections collected 49603
Independent reflections 12972 [Rint = 0.0651, Rsigma = 0.0941]
Data/restraints/parameters 12972/0/854
Goodness-of-fit on F2 1.019
Final R indexes [I>=2σ (I)] R1 = 0.0556, wR2 = 0.1167
Final R indexes [all data] R1 = 0.1042, wR2 = 0.1337
Largest diff. peak/hole (e Å-3) 0.32/-0.29
5.6.2 Single crystal X-ray diffraction data of Mg-PgC3
Empirical formula C240H318Mg24O120
Formula weight 5706.37

54
Crystal system monoclinic
Space group C2m
a (Å) 28.622(5)
b (Å) 35.281(6)
c (Å) 21.974(7)
α (°) 90
β (°) 119.878(3)
γ (°) 90
Volume (Å3) 19241(8)
Z 2
ρcalc (g/cm3) 0.985
μ (mm-1) 0.112
F(000) 6012.0
Crystal size (mm3) 0.21 × 0.13 × 0.06
2Θ range for data collection/° 3.7 to 53
Index ranges -35 ≤ h ≤ 35, -44 ≤ k ≤ 44, -27 ≤ l ≤ 27
Reflections collected 114050
Independent reflections 20279 [Rint = 0.3263, Rsigma = 0.3583]
Data/restraints/parameters 20279/1048/886
Goodness-of-fit on F2 1.026
Final R indexes [I>=2σ (I)] R1 = 0.1458, wR2 = 0.3763
Final R indexes [all data] R1 = 0.3049, wR2 = 0.4450
Largest diff. peak/hole (e Å-3) 0.83/-0.61

55
6. Appendix: Structure and Abbreviation of Ionic Liquids
Name Chemical Structure Abbreviation and
reference
1-butyl-3-methylimidazolium
hexafluorophosphate
[C4mim]PF6], ref. 24
1-ethyl-3-methylimidazolium
nitrate
[C2mim][NO3], ref.
15
1-butyl-3-methylimidazolium
chloride
[C4mim][Cl], ref. 24
1-octyl-3-methylimidazolium
hexafluorophosphate
[C8mim][PF6], ref.
23
1-butyl-3-methylimidazolium
tetrafluoroborate
[C4mim][BF4], ref.
35
1-ethyl-3-methylimidazolium
bis(trifluoromethanesulfonyl)imide
[C2mim][NTf2], ref.
37
1-butyl-3-methylimidazolium
bis(trifluoromethanesulfonyl)imide
[C4mim][NTf2], ref.
37
Tri(isobutyl) methylphosphonium
tosylate
[Pi(444)1][Tos], ref. 57

56
Tri(butyl) methylphosphonium
methylsulfate
[P4441][CH3SO4], ref.
57
Tetraoctylphosphonium bromide
[P8888][Br],
ref. 57
Tri(butyl) ethylphosphonium
diethylphosphate
[P4442][(C2H5O)PO2],
ref. 57

57
References
1 G. Sethia and A. Sayari, Carbon N. Y., 2016, 99, 289–294.
2 M. X. Wu and Y. W. Yang, Chinese Chem. Lett., 2017, 28, 1135–1143.
3 S. Rashidi, J. A. Esfahani and A. Rashidi, Renew. Sustain. Energy Rev., 2017, 73, 1198–
1210.
4 Y. Yang, J. Yu, A. Monemian Esfahani, K. Seiffert-Sinha, N. Xi, I. Lee, A. A. Sinha, L.
Chen, Z. Sun, R. Yang and L. Dong, Nanoscale, 2018, 10, 12704–12712.
5 M. I. Gonzalez, A. B. Turkiewicz, L. E. Darago, J. Oktawiec, K. Bustillo, F. Grandjean, G.
J. Long and J. R. Long, Nature, 2020, 577, 64–68.
6 L. Zou, Y. Sun, S. Che, X. Yang, X. Wang, M. Bosch, Q. Wang, H. Li, M. Smith, S. Yuan,
Z. Perry and H. C. Zhou, Adv. Mater., 2017, 29, 1–35.
7 N. O’Reilly, N. Giri and S. L. James, Chem. - A Eur. J., 2007, 13, 3020–3025.
8 N. Giri, M. G. Del Pópolo, G. Melaugh, R. L. Greenaway, K. Rätzke, T. Koschine, L. Pison,
M. F. C. Gomes, A. I. Cooper and S. L. James, Nature, 2015, 527, 216–220.
9 E. Skoronski, M. Fernandes, F. J. Malaret and J. P. Hallett, Sep. Purif. Technol., 2020, 248,
117069.
10 L. Xue, E. Gurung, G. Tamas, Y. P. Koh, M. Shadeck, S. L. Simon, M. Maroncelli and E. L.
Quitevis, J. Chem. Eng. Data, 2016, 61, 1078–1091.
11 P. Walden, Bull. l’Académie Impériale des Sci. St.-pétersbg., 1914, 405–422.
12 M. Deetlefs, M. Fanselow and K. R. Seddon, RSC Adv., 2016, 6, 4280–4288.
13 J. H. Shipp, United States Pat. Off., 1939, 1–3.
14 M. Armand, F. Endres, D. F. MacFarlane, H. Ohno and B. Scrosati, Nat. Mater., 2009, 8,
621–629.
15 J. S. Wilkes and M. J. Zaworotko, J. Chem. Soc. Chem. Commun., 1992, 965–967.
16 A. Berthod, M. J. Ruiz-Ángel and S. Carda-Broch, J. Chromatogr. A, 2018, 1559, 2–16.
17 D. Czuryszkiewicz, A. Maćkowiak, K. Marcinkowska, A. Borkowski, Ł. Chrzanowski and
J. Pernak, Chempluschem, 2019, 84, 268–276.
18 R. Ratti, Adv. Chem., 2014, 2014, 1–16.
19 D. M. Piper, T. Evans, K. Leung, T. Watkins, J. Olson, S. C. Kim, S. S. Han, V. Bhat, K. H.
Oh, D. A. Buttry and S. Lee, Nat. Commun., 2015, 6, 1–10.
20 M. Kar, O. Tutusaus, D. R. MacFarlane and R. Mohtadi, Energy Environ. Sci., 2019, 12,
566–571.
21 N. Vucetic, P. Virtanen, A. Nuri, I. Mattsson, A. Aho, J. P. Mikkola and T. Salmi, J. Catal.,
2019, 371, 35–46.
22 R. Tao, G. Tamas, L. Xue, S. L. Simon and E. L. Quitevis, J. Chem. Eng. Data, 2014, 59,
2717–2724.

58
23 J. G. Huddleston, A. E. Visser, W. M. Reichert, H. D. Willauer, G. A. Broker and R. D.
Rogers, Green Chem., 2001, 3, 156–164.
24 S. Carda–Broch, A. Berthod and D. W. Armstrong, Anal. Bioanal. Chem., 2003, 375, 191–
199.
25 Y. Zhang, L. Xue, F. Khabaz, R. Doerfler, E. L. Quitevis, R. Khare and E. J. Maginn, J.
Phys. Chem. B, 2015, 119, 14934–14944.
26 T. Erdmenger, J. Vitz, F. Wiesbrock and U. S. Schubert, J. Mater. Chem., 2008, 18, 5267–
5273.
27 I. Dinarès, C. Garcia De Miguel, A. Ibáñez, N. Mesquida and E. Alcalde, Green Chem.,
2009, 11, 1507–1510.
28 H. L. Ngo, K. LeCompte, L. Hargens and A. B. McEwen, Thermochim. Acta, 2000, 357–
358, 97–102.
29 C. Kimble and C. M. Burba, J. Phys. Chem. B, 2017, 121, 3099–3110.
30 M. G. Freire, A. R. R. Teles, M. A. A. Rocha, B. Schröder, C. M. S. S. Neves, P. J.
Carvalho, D. V. Evtuguin, L. M. N. B. F. Santos and J. A. P. Coutinho, J. Chem. Eng. Data,
2011, 56, 4813–4822.
31 Y. Shimizu, Y. Ohte, Y. Yamamura and K. Saito, Chem. Phys. Lett., 2009, 470, 295–299.
32 H. Abe, S. Tsuzuki and S. Ozawa, Chem. Phys. Lett., 2018, 712, 30–33.
33 B. Grüner, Z. Janoušek, B. T. King, J. N. Woodford, C. H. Wang, V. Všetečka and J. Michl,
J. Am. Chem. Soc., 1999, 121, 3122–3126.
34 R. B. King, Chem. Rev., 2001, 101, 1119–1152.
35 B. Liu, R. Zhou, N. Bu, Q. Wang, S. Zhong, B. Wang and K. Hidetoshi, J. Memb. Sci.,
2017, 524, 12–19.
36 C. Aucher, G. Guirado and E. Knipping, New J. Chem., 2018, 42, 4693–4699.
37 L. Mahrokh, H. Ghourchian, K. H. Nealson and M. Mahrok, J. Mater. Chem. A, 2017, 5,
7979–7991.
38 F. Javed, F. Ullah, M. Razlan and H. Akil, J. Mol. Liq., 2018, 271, 403–420.
39 C. P. Fredlake, J. B. Crosthwaite, D. G. Hert, S. N. V. K. Aki and J. F. Brennecke, J. Chem.
Eng. Data, 2004, 49, 954–964.
40 M. Gorlov and L. Kloo, J. Chem. Soc. Dalt. Trans., 2008, 2655–2666.
41 S. M. Nabavizadeh, H. Sepehrpour, H. R. Shahsavari and M. Rashidi, New J. Chem., 2012,
36, 1739–1743.
42 Y. Fang, P. Ma, H. Cheng, G. Tan, J. Wu, J. Zheng, X. Zhou, S. Fang, Y. Dai and Y. Lin,
Chem. - An Asian J., 2019, 14, 4201–4206.
43 M. P. Cumplido, A. Cháfer, J. de la Torre and H. Poy, J. Chem. Thermodyn., 2020, 140,
105889.
44 J. K. Singh, R. K. Sharma, P. Ghosh, A. Kumar and M. L. Khan, Front. Chem., 2018, 6, 1–

59
12.
45 D. E. Kaufmann, M. Nouroozian and H. Henze, Synlett, 1996, 1091.
46 N. Karodia, S. Guise, C. Newlands and J. Andersen, ChemComm, 1998, 2341–2342.
47 J. Mcnulty, A. Capretta, J. Wilson, J. Dyck, G. Adjabeng, A. Robertson, N. Falls and T.
Suzuki, ChemComm, 2002, 1986–1987.
48 M. P. Wylie, S. E. J. Bell, P. Nockemann, R. Bell and C. P. Mccoy, ACS Omega, 2020, 5,
7771–7781.
49 L. Timperman, H. Galiano, D. Lemordant and M. Anouti, Electrochem. commun., 2011, 13,
1112–1115.
50 N. R. Ronco, C. Lancioni, L. M. Romero and C. B. Castells, J. Chromatogr. A, ,
DOI:10.1016/j.chroma.2020.461127.
51 J. Chen, M. Li, M. Li, X. Lin and T. Qiu, ACS Sustain. Chem. Eng., 2020, 8, 6956–6963.
52 L. M. dos Santos, F. L. Bernard, B. B. Polesso, I. S. Pinto, C. L. L. Frankenberg, M. Corvo,
P. L. Almeida, E. Cabrita and S. Einloft, J. Environ. Manage., 2020, 268, [In press].
53 H. Mahandra, R. Singh and B. Gupta, Sep. Purif. Technol., 2017, 177, 281–292.
54 C. J. Bradaric, A. Downard, C. Kennedy, A. J. Robertson and Y. Zhou, Green Chem., 2003,
5, 143–152.
55 K. K. Thasneema, M. Shahin, T. Rosalin, K. K. Elyas, T. Dipin, P. K. Sahu, N. S. K. Kumar,
V. C. Saheer, M. Messali and T. Ben, J. Mol. Liq., 2020, 307, 112960.
56 M. D. Green, C. Schreiner and T. E. Long, J. Phys. Chem. A, 2011, 115, 13829–13835.
57 A. Bhattacharjee, J. A. Lopes-da-silva, M. G. Freire, J. A. P. Coutinho and P. J. Carvalho,
Fluid Phase Equilib., 2015, 400, 103–113.
58 M. J. Earle and K. R. Seddon, Pure Appl. Chem., 2000, 72, 1391–1398.
59 M. Ke, A. Zhou, Z. Song and Q. Jiang, Prog. Chem., 2007, 19, 671–679.
60 M. Dong, L. Zhu, S. Zhu, J. Wang, J. Wang, H. Xie and Z. Du, Chemosphere, 2013, 91,
1107–1112.
61 M. V. S. Oliveira, B. T. Vidal, C. M. Melo, R. de C. M. de Miranda, C. M. F. Soares, J. A.
P. Coutinho, S. P. M. Ventura, S. Mattedi and Á. S. Lima, Chemosphere, 2016, 147, 460–
466.
62 E. Gomez-Herrero, M. Tobajas, A. Polo, J. J. Rodriguez and A. F. Mohedano, Ecotoxicol.
Environ. Saf., 2020, 187, 109836.
63 A. Oskarsson and M. C. Wright, Environ. Sci. Technol., 2019, 53, 10539–10541.
64 N. Kundu, S. Roy, D. Mukherjee, T. K. Maiti and N. Sarkar, J. Phys. Chem. B, 2017, 121,
8162–8170.
65 S. K. Ruokonen, C. Sanwald, A. Robciuc, S. Hietala, A. H. Rantamäki, J. Witos, A. W. T.
King, M. Lämmerhofer and S. K. Wiedmer, Chem. - A Eur. J., 2018, 24, 2669–2680.
66 M. V. Fedotova, S. E. Kruchinin and G. N. Chuev, J. Mol. Liq., 2019, 112081.

60
67 O. S. Hammond, D. T. Bowron and K. J. Edler, Green Chem., 2016, 18, 2736–2744.
68 V. Migliorati, F. Sessa and P. D’Angelo, Chem. Phys. Lett. X, 2019, 2, 100001.
69 T. Moufawad, L. Moura, M. Ferreira, H. Bricout, S. Tilloy, E. Monflier, M. Costa Gomes,
D. Landy and S. Fourmentin, ACS Sustain. Chem. Eng., 2019, 7, 6345–6351.
70 Y. Ji, Z. Meng, J. Zhao, H. Zhao and L. Zhao, J. Chromatogr. A, 2019, 460520.
71 J. Aldana-González, A. Sampayo-Garrido, M. G. Montes De Oca-Yemha, W. Sánchez, M.
T. Ramírez-Silva, E. M. Arce-Estrada, M. Romero-Romo and M. Palomar-Pardavé, J.
Electrochem. Soc., 2019, 166, D199–D204.
72 M. Faraji, Microchem. J., 2019, 150, 104130.
73 M. B. Haider, D. Jha, R. Kumar and B. Marriyappan Sivagnanam, Int. J. Greenh. Gas
Control, 2020, 92, 102839.
74 J. D. Mota-Morales, R. J. Sánchez-Leija, A. Carranza, J. A. Pojman, F. del Monte and G.
Luna-Bárcenas, Prog. Polym. Sci., 2018, 78, 139–153.
75 J. Jiang, C. Yan, X. Zhao, H. Luo, Z. Xue and T. Mu, Green Chem., 2017, 19, 3023–3031.
76 J. S. Seo, D. Whang, H. Lee, S. I. Jun, J. Oh, Y. J. Jeon and K. Kim, Nature, 2000, 404,
982–986.
77 L. Mi, H. Hou, Z. Song, H. Han, H. Xu, Y. Fan and S. W. Ng, Cryst. Growth Des., 2007, 7,
2553–2561.
78 C. E. Wilmer, O. K. Farha, Y. S. Bae, J. T. Hupp and R. Q. Snurr, Energy Environ. Sci.,
2012, 5, 9849–9856.
79 P. Nugent, E. G. Giannopoulou, S. D. Burd, O. Elemento, E. G. Giannopoulou, K. Forrest,
T. Pham, S. Ma, B. Space, L. Wojtas, M. Eddaoudi and M. J. Zaworotko, Nature, 2013, 495,
80–84.
80 S. Hou, S. Razzaque and B. Tan, Polym. Chem., 2019, 10, 1299–1311.
81 D. W. Kim, S. M. Jung and H. Y. Jung, J. Power Sources, 2019, 227422.
82 Q. Q. Zhu, W. W. Zhang, H. W. Zhang, Y. Yuan, R. Yuan, F. Sun and H. He, Inorg. Chem.,
2019, 58, 15637–15643.
83 X. Li, H. Xiong and Q. Jia, ACS Appl. Mater. Interfaces, 2019, 11, 46205–46211.
84 C. Pi, C. Huang, Y. Yang, H. Song, X. Zhang, Y. Zheng, B. Gao, J. fu, P. K. Chu and K.
Huo, Appl. Catal. B Environ., 2019, 118358.
85 J. C. Groen, L. A. A. Peffer and J. Pérez-Ramírez, Microporous Mesoporous Mater., 2003,
60, 1–17.
86 B. Nie, X. Liu, L. Yang, J. Meng and X. Li, Fuel, 2015, 158, 908–917.
87 X. Huang and Y. P. Zhao, J. Pet. Sci. Eng., 2017, 159, 197–204.
88 E. P. Barrett, L. G. Joyner and P. P. Halenda, J. Am. Chem. Soc., 1951, 73, 373–380.
89 J. Landers, G. Y. Gor and A. V. Neimark, Colloids Surfaces A Physicochem. Eng. Asp.,
2013, 437, 3–32.

61
90 R. Yang, S. He, Q. Hu, M. Sun, D. Hu and J. Yi, Fuel, 2017, 197, 91–99.
91 T. Zhang, S. Wei, G. I. N. Waterhouse, L. Fu, L. Liu, W. Shi, J. Sun and S. Ai, Powder
Technol., 2020, 360, 55–64.
92 J. Liang, Y. Ling, X. wen Wu, H. A. Acciari and Z. Zhang, J. Appl. Electrochem., 2019, 49,
1211–1226.
93 X. Xiao, Y. Wang, H. Cheng, Y. Cui, Y. Xu, T. Yang, D. Zhang and X. Xu, Mater. Chem.
Phys., 2020, 240, 122202.
94 T. I. Shabatina, O. I. Vernaya, A. V. Nuzhdina, V. P. Shabatin, A. M. Semenov and M. Y.
Mel’nikov, Russ. J. Phys. Chem. A, 2019, 93, 1970–1975.
95 A. Bavykina, A. Cadiau and J. Gascon, Coord. Chem. Rev., 2019, 386, 85–95.
96 S. He, L. Chen, J. Cui, B. Yuan, H. Wang, F. Wang, Y. Yu, Y. Lee and T. Li, J. Am. Chem.
Soc., 2019, jacs.9b08458.
97 R. Gaillac, P. Pullumbi, K. A. Beyer, K. Chapman, D. A. Keen, T. D. Bennett and F. X.
Coudert, Nat. Mater., 2017, 16, 1149–1155.
98 J. Zhang, S. H. Chai, Z. A. Qiao, S. M. Mahurin, J. Chen, Y. Fang, S. Wan, K. Nelson, P.
Zhang and S. Dai, Angew. Chemie - Int. Ed., 2015, 54, 932–936.
99 L. Ma, C. J. E. Haynes, A. B. Grommet, A. Walczak, C. C. Parkins, C. M. Doherty, L.
Longley, A. Tron, A. R. Stefankiewicz, T. D. Bennett and J. R. Nitschke, Nat. Chem., 2020,
12, 1–6.
100 T. A. Robbins, C. B. Knobler, D. R. Bellew and D. J. Cram, J. Am. Chem. Soc., 1994, 116,
111–122.
101 S. C. N. Hsu, M. Ramesh, J. H. Espenson and T. B. Rauchfus, Angew. Chemie - Int. Ed.,
2003, 42, 2663–2666.
102 S. Vainberg, K. McClay, H. Masuda, D. Root, C. Condee, G. J. Zylstra and R. J. Steffan,
Appl. Environ. Microbiol., 2006, 72, 5218–5224.
103 H. Liu, B. Liu, L. C. Lin, G. Chen, Y. Wu, J. Wang, X. Gao, Y. Lv, Y. Pan, X. Zhang, X.
Zhang, L. Yang, C. Sun, B. Smit and W. Wang, Nat. Commun., 2014, 5, 1–7.
104 M. Costa Gomes, L. Pison, C. Červinka and A. Padua, Angew. Chemie - Int. Ed., 2018, 57,
11909–11912.
105 W. Shan, P. F. Fulvio, L. Kong, J. A. Schott, C. L. Do-Thanh, T. Tian, X. Hu, S. M.
Mahurin, H. Xing and S. Dai, ACS Appl. Mater. Interfaces, 2018, 10, 32–36.
106 J. Cahir, M. Y. Tsang, B. Lai, D. Hughes, M. A. Alam, J. Jacquemin, D. Rooney and S. L.
James, Chem. Sci., 2020, 2077–2084.
107 C. Zhang, R. S. Patil, T. Li, C. L. Barnes and J. L. Atwood, Chem. Commun., 2017, 53,
4312–4314.
108 H. Kumari, S. R. Kline, N. J. Schuster and J. L. Atwood, Chem. Commun., 2011, 47, 12298–
12300.
109 N. P. Power, S. J. Dalgarno and J. L. Atwood, New J. Chem., 2007, 31, 17–20.

62
110 A. Bondi, J. Phys. Chem., 1964, 68, 441–451.
111 R. M. Mckinlay, P. K. Thallapally, G. W. V Cave and J. L. Atwood, Angew. Chemie - Int.
Ed., 2005, 117, 5879–5882.
112 C. R. Pfeiffer, D. A. Fowler, S. Teat and J. L. Atwood, CrystEngComm, 2014, 16, 10760–
10773.
113 C. R. Pfeiffer, D. A. Fowler and J. L. Atwood, CrystEngComm, 2015, 17, 4475–4485.
114 C. R. Pfeiffer, D. A. Fowler and J. L. Atwood, Cryst. Growth Des., 2014, 14, 4205–4213.
115 Cho, Rudkevich, Shivanyuk, Rissanen and Rebek, Chemistry, 2000, 6, 3788–96.
116 D. Braga, F. Grepioni and J. J. Novoa, Chem. Commun., 1998, 2, 1959–1960.
117 J. Yang, B. Hong, N. Wang, X. Li, X. Huang, Y. Bao, C. Xie and H. Hao, CrystEngComm,
2019, 21, 6374–6381.
118 R. M. McKinlay, G. W. V. Cave and J. L. Atwood, Proc. Natl. Acad. Sci. U. S. A., 2005,
102, 5944–5948.
119 R. Evans, Z. Deng, A. K. Rogerson, A. S. McLachlan, J. J. Richards, M. Nilsson and G. A.
Morris, Angew. Chemie - Int. Ed., 2013, 52, 3199–3202.
120 N. Stock and S. Biswas, Chem. Rev., 2012, 112, 933–969.
121 L. Sciortino, A. Alessi, F. Messina, G. Buscarino and F. M. Gelardi, J. Phys. Chem. C, 2015,
119, 7826–7830.
122 X. Hu, X. Lou, C. Li, Y. Ning, Y. Liao, Q. Chen, E. S. Mananga, M. Shen and B. Hu, RSC
Adv., 2016, 6, 114483–114490.
123 M. Sanchez-Sanchez, I. De Asua, D. Ruano and K. Diaz, Cryst. Growth Des., 2015, 15,
4498–4506.
124 Q. Zhang, W. Wu, B. Xin and C. Li, J. Chem. Technol. Biotechnol., 2007, 82, 196–204.
125 T. Gerkensmeier, W. Iwanek, C. Agena, R. Fröhlich, S. Kotila, C. Näther and J. Mattay,
Eur. J. Org. Chem., 1999, 2257–2262.
126 C. Zhang, R. S. Patil, T. Li, C. L. Barnes and J. L. Atwood, ChemComm, 2017, 47, 7634–
7639.

63