Embed Size (px)
Citation preview

0
Duration Analysis of Farmer Adoption of New Technologies and
Markets in Nicaragua: Quality-Niche versus Commodity Vegetables
Ricardo Hernández and Thomas Reardon Michigan State University
Submitted to AMA CRSP February 2012
Acknowledgements. This report was made possible by support provided in part by the US
Agency for International Development (USAID) Agreement No. EDH-A-00-06-0003-00
awarded to the Assets and Market Access Collaborative Research Support Program (AMA
CRSP). The data for the research were generated by the authors in collaboration with Nitlapan
Institute at the Universidad Centro Americana in Managua, Nicaragua.

1
Product choice, Technology Adoption and Modern Markets in
Nicaragua: A Duration Analysis
1. INTRODUCTION
Reduction of poverty and economic growth have been among the benefits of market
participation by smallholders, making market participation an important topic for development
policy debate. In developing countries, agricultural markets are evolving. There is evidence of
market transformations, such as the rise of private standards and the shift of modern market
procurement from spot markets to centralized procurement systems. These market
transformations are presumably creating new opportunities and new challenges for smallholders.
Yet, the analysis of participation by smallholders into these “new market opportunities”
is not a new topic in the literature. There is a growing strand of qualitative and quantitative
studies, that focuses on analyzing the smallholder’s choice between the traditional sector and a
representative modern market such as food processors (Key and Runsten, 1999, on frozen
vegetables to large processors in Mexico), exporters (Von Braun et al., 1989, on vegetable
exports from Guatemala; Saenz and Ruben, 2004, on chayote exports from Costa Rica; Dolan
and Humphrey, 2000, on fresh vegetable exports from Kenya and Zimbabwe to UK
supermarkets), and more recently domestic supermarkets (Hernandez et al., 2007 on tomato
growers in Guatemala selling to supermarkets in Guatemala, Blandon et al., 2009, on fresh fruit
and vegetables in Honduras).
A common finding of the analysis of smallholder participation into modern markets is
that these new opportunities require a set of incentives and capacities from the farmer’s
perspective. In order to participate in a modern market channel and its implied standards, the

2
farmer may have the challenge to have minimum land and non-land assets that were not
necessary for supplying the traditional market. These required assets, can in turn become
minimum investment thresholds at the private or public level (Reardon et al. 1999). For example,
in order to have constant supply all year round, and minimum aesthetic characteristics farmers
may have to invest in irrigation systems. After the harvest, they might need a packing shed (may
be a collective investment), and transportation (in a truck, which could be private or collective
investment) via paved roads (public good, to avoid mechanical damage) to the modern market
procurement center.
Yet, the empirical evidence that analyzes the relation between household assets and
modern market participation is very limited. In the supermarket market segment, only a few
papers test hypotheses concerning farm size and non-land asset determinants of participation,
and come to mixed conclusions. Rao and Qaim (2011) and Neven et al. (2009) show in Kenya
that the larger the farm, the greater the probability of participation in the local supermarket
channel; yet in Guatemala, Hernandez et al. (2007), and in Honduras, Blandon et al. (2009) show
that farm size is not a significant determinant, and that small farmers sell to local supermarkets;
this result is also shown in some export market studies, such as Minten et al. (2009) for
Madagascar. Several studies show that non-land assets play a role, with different assets
highlighted over studies. Most studies such as Rao and Qaim (2011) show that infrastructure
cum transaction costs, for example in road access, are important to channel participation; some
studies such as Blandon et al. (2009) show that membership in cooperatives is important; some
like Rao and Qaim show that rural nonfarm employment (RNFE) plays a positive role, while
Hernandez et al. (2007) show that irrigation plays a key role.
3
The upshot is that to date there are few cross-section survey-based studies of the
determinants and impacts of farmer participation in supermarket channels in developing
countries. There is a gap in the literature in that empirical evidence is only beginning to be
brought to bear on this issue. The evidence of the rapid development of supermarkets suggests
that this is an area that requires further empirical exploration (Berdegué et al. 2005). But the
emerging evidence tends to point to positive impacts on incomes, mixed determination by farm
size, and varied but usual determination by non-land assets.
Furthermore, modern market channel participation has usually been analyzed under static
scenarios and therefore ignoring the dynamic structure of market participation. Markets represent
post-harvest technologies, then the decision to participate in markets is analogous to adoption of
a technology. While there have been a number of theoretical and empirical papers modeling the
dynamics of adoption of technologies (Besley and Case, 1993, and a few using duration analysis,
de Souza Filho, 1997; Dadi et al. 2004; Burton et al. 2003; and Fuglie and Kascak, 2001), there
have been far fewer modeling the dynamics of market participation. As exceptions to the rule of
rarity of these studies, one can cite two sets of studies of the dynamics of farmer participation in
food markets.
On the one hand, some studies in Africa have examined the dynamics of farmers moving
from autarchy to participation in the market (commercialization) and sometimes back out (such
as Bellemare and Barrett, 2006 and Holloway et al. 2005).
On the other hand, a few studies on Guatemala (Carletto et al. 1999 and 2010) have
modeled farmers’ time to adoption and duration as an adopter of crops sold in non-traditional
export markets. To our knowledge, this is the sole use of dynamic analysis in general, and

4
duration analysis in particular, to study farmers’ participation (and income effects) of modern
market channels per se.
This nascent duration-analysis literature has, however, not treated two important subjects:
(1) the choice of traditional versus modern market channels in general, and local supermarket
channels in particular; (2) the relation of farm capital and farm technology adoption with modern
market channel adoption.
Particularly the relation between farm technology adoption and modern market
participation is very intriguing as farm technology (such as product choice and the use of modern
technologies) can be both cause and consequence of market participation.
In this paper we propose to address the above two relative gaps in the literature. Using a
constructed-panel over 10 years of horticultural growers in Nicaragua, we address three
questions: (1) What are the determinants of adoption per se, and (waiting) time to adoption, of
farmers into the supermarket channel? (2) What are the determinants of “duration” as
supermarket suppliers? (3) What is the effect of time to adoption and duration on farm capital
and farm technology choice, in particular of modern technologies for “capital-led intensification”
(a term used by Lele and Stone, 1989)? For questions 1 and 2 we want to particularly analyze the
effect of product choice (production of niche crops) and use of drip irrigation (a modern
technology) as determinants of adoption and duration as supermarket suppliers.
We address these questions with a single-spell duration model framework with time-
varying and time-invariant covariates. The analysis uses a panel constructed from a stratified
random sample of horticultural growers (supermarket suppliers and non-suppliers) collected in
2010 (with 10 year recalls). We follow Carletto et al. (2010) in the general empirical approach
for the determinants of time to adoption and duration, but add a stage of analysis of impacts of
5
these on farm assets and technology choice (two categories of analysis absent in the Carletto
analysis.)
The paper proceeds as follows. Section 2 describes the model. Section 3 describes the
data and descriptive results. Section 4 describes the econometric results. Section 5 concludes.
THE MODEL: THE DETERMINANTS AND EFFECTS OF FARMERS’ ENTRY AND
DURATION IN THE MODERN CHANNEL
(a) Theoretical and General Implementation models
As our focus is an empirical contribution, we do not present a new theoretical model but
draw heavily in this sub-section on the conceptual framework laid out in Carletto et al. (1999,
2010). While their work focused on entry in the non-traditional horticulture exports market by
adoption of the crops for that market, it is directly relevant to our treatment of adoption of –
entry in – and duration in the supermarket channel in the domestic food market. Thus we merely
summarize their conceptual model in this subsection.
Carletto et al. specify a farm household model where a household decides the allocation
of its land endowment (A) between traditional market (crops), Ao, and non-traditional (modern)
market crops, A1. Participation in the traditional market is perceived as less production-risky but
also has a lower expected return compared to the modern market. However, modern market entry
costs are perceived higher than those of traditional markets, as modern markets demand higher
quality and consistent supply all year long, which can imply capital led investments (such as
irrigation). With the vector of variable inputs valued at the cost wx, the income per hectare can be
written as follows:
For traditional market (crops),

6
∏ ( ) (2.1)
For modern market (crops),
∏ ( ) (2.2)
With
( ) ( ) ∑( ) (
) (2.3)
where
(1) po and p1, are the expected crop prices in the traditional and modern markets
respectively;
(2) Π0 and Π1 are the expected incomes per hectare of the crops sold to the traditional and
modern market;
(3) Σ is the variance-covariance matrix of the risk terms θ0 and θ1; and
(4) z0 and zl household assets that affect expected income from each market channel.
If the household decides to allocate land to the modern market channel (A1 > 0), then the
household’s total income is
( ) ( ) (2.4)
where
(1) c1 is the modern markets’ fixed entry costs; and
(2) T is other sources of income.
Assuming that the household is risk averse, it will decide to adopt the modern market
channel when the change in utility due to adoption (∆Ua) is positive, given an optimal level of
allocation to modern market (A1). That change in utility is determined by the following function:
7
(
)[( ) (
)] (2.5)
We now proceed to the specification of the regression model and estimation procedure
we use to implement the conceptual model.
We “translate” the theoretical model into an implementation model that has the general
form of the equations, and the general categories of variables used in Carletto et al. Following
the theoretical model presented we can rewrite equation 2.5, the change in utility from adoption,
as follows:
( (2.6)
In an analogous way the decision to withdraw is determined by the change in utility that
determines withdrawal ∆Uw; initially this change is negative, but may become positive (∆Uw > 0)
and encourage the household to withdraw.
( ) (2.7)
2.7 is similar to 2.6, with the difference that the earliest time for withdrawal is the time
when the household adopts the supermarket market channel (Ta) and the duration of the
withdrawal spell is included as tw.
The equations show that the change in utility from adoption or withdrawal is a function
of the following:
1) The exogenous output prices,
2) The exogenous input prices,
3) Household assets: human capital (HK); farm capital (FK); social capital (SK); and
community capital (CK).

8
4) Time, which enters the duration equations in several ways:
a. To, the potential earliest year for adoption which is either when the modern
market becomes accessible to the household or when the household is
formed;
b. ta, the household’s “time to adoption” which is the time period between To
and the year the household adopted (Ta);
c. tw ,the time from adoption to the time of withdrawal, or the “duration,”
which is the time as a supplier if they adopted; note that withdrawal may
not yet (or never occur).
In most duration models, observations on ta are of two types:
(1) The household has adopted the supermarket market channel, then the value of ta is
directly observed; and
(2) The household has not yet adopted at the time of the survey, so that we have
truncated information, since the length of the duration spell (ta) is greater than the
length of the observed pre-adoption spell.
We will analyze the “time to adoption” (waiting time of the household before adoption
also called in the duration literature the adoption spell) and if the household adopts, the time to
withdraw (or duration). Therefore, we manipulate equations 2.6 and 2.7 to express t(a) and t(w)
as functions of the explanatory variables in those equations. This will be a prelude to specifying
the regression equations in the next subsection. Thus,
( ) (2.8)

9
Since we analyze farm duration as supermarket supplier (waiting time before withdrawal,
also known as the withdrawal spell), it is as follows:
( ) (2.9)
We will also analyze the effects of duration itself on farm households, with a particular
focus on effects on farm capital, product choice and the use of modern technologies in
horticulture production, which can be modeled as follows:
( ̃ ) (2.10)
( ̃ ) (2.11)
where (FK) are farm assets, (q) is a vector of variable inputs and modern technologies,
and ̃ is the predicted duration from the first stage.
(b) Regression specification, First Stage
Following the general theoretical framework laid out above, in this sub-section we lay out
and the details of the regression specification.
The two regressions we use to determine t(a) and t(w) are as follows, with a discussion of
each variable thereafter. As t(a) and t(w) equations have most of the same arguments we
represent them as follows.
ta, tw = f(age of HHH, education of HHH, gender of HHH, adults in HH, share of adults in OFE
(off-farm employment), HH is member of cooperative, land, drip irrigation, livestock, farm
assets (other than land and livestock), nonfarm productive assets, distance to ag-store,
distance to market, horticultural price index, farm elevation, urban share in the district,
rural density of the district, production of niche crops, product choice dummies; (in the
ta equation only), and Ta (only in the equation for tw)
The dependent variables for this model are:
10
(a) Time to adoption (Adoption spell, ta): this variable is defined as the period of time (in
years) the household takes from the initial exposure to the possibility of adoption of the
supermarket market channel, to the actual time when the household adopts the supermarket
channel. Duration analysis accounts for right censoring, as the value of ta is not always observed.
Some households that are exposed to the possibility of adoption do not adopt at the time of the
survey, and therefore we have truncated information.
(b) Duration (withdrawal spell, tw): Once households have adopted the supermarket
market channel, this variable is defined as the period of time (in years) that the household takes
from the initial time of adoption of the supermarket market channel, to the actual time when the
household withdraws from the supermarket market channel. Similar to the definition of ta, not all
households that have adopted the supermarket channel withdraw from it before the time of the
survey, therefore we do not observe withdrawal for some households and thus have truncated
information. However, duration analysis accounts for right censored data.
The explanatory variables are as follows.
Output prices
Output price index (time-varying, 2005-2010). Using factor analysis of the principal
component to calculate a price index. The index is based on the village-level traditional-market
prices for tomato, lettuce and sweet peppers. Households recalled the village price for first-grade
quality for each crop for each year from 2005 to 20101. Since the current period price can be
1 We did not collect historic prices from 2000-2004, and thus use the 2005 recalled village price
for that period of time. For robustness, we re-estimated the econometric analysis, only using the
2005-2010 period. Results are presented in Annex A.
11
endogenous we use a one year lagged price as the expected price is formed assuming a naive
price expectation.
Input prices
Input prices charged by the vendor are in general similar over households for a given
input, as the geographic zone is not broad. To then get variation in input prices, we instead use
the distance from the household to the nearest agro-inputs store, measured in kilometers (wx,
time invariant).
Household assets (z0 and z1)
Human capital (HK)
(a) Number of adults in the household from 2000 to 2010 (time-varying): the availability of
household labor each year is posited to increase the probability of adoption and delay the
decision of withdrawing from the supermarket channel, presumed to be more labor
demanding to meet quality requirements.
(b) Age of the household head (HHH) at the time of adoption (time-invariant): The hypothesis is
ambiguous. Younger HHHs may be less risk averse and willing to chance new market
channels. But older HHHs have more experience that allows them to address the
requirements of adapting to the modern channel.
(c) Years of education of the HHH at the time of adoption (time-invariant):
(d) Average years of education of the adults of the household (time-invariant): We have included
this to control for all adults’ education, as it may not be only the HHH who decides or
executes the participation. The a priori effect on time-to-adoption is ambiguous. More
education could aid the household to adapt to the more demanding channel’s technology and

12
commercial requirements. But more education can also increase the household’s options to
work in nonfarm employment (Taylor and Yunez-Naude, 2000) and thus not depend on
upgrading the farm market channel. The a priori effect on duration is also ambiguous. More
education confers more flexibility in activity choice and so would facilitate options should
the household want to withdraw from the modern channel. But more education could help the
household to adapt to the evolving requirements of the modern channel and prolong their
participation in it.
(e) Share of adults working in local off-farm employment in 2005 and 2010: The effect of this
variable is a priori ambiguous. In the presence of credit constraints, in principal off-farm
earnings can fund investments to participate in the modern channel, and off-set market risk.
But off-farm employment can act as a substitute to new farm technology adoption (Huang et
al. 2009) or the need to upgrade to a modern market channel.
(f) Nonfarm (productive) assets from 2000 to 2010 (time-varying): We used factor analysis of
the principal component to calculate an asset index (using the Thomson scoring method); its
effect is posited to be similar to the share of adults working in off-farm employment.
However, non-farm productive assets are important for participation in off-farm self-
employment, while the share of adults working off-farm is related to participation in off-farm
wage employment and self-employment.
Farm physical capital (FK)
(a) Total land owned (ha) each year from 2000 to 2010 (time-varying): This is land for all uses
(cropping, pasture, fallow, and rocky/bush land) each year in the past 10 years. Land owned
is posited to decrease time to adoption and increase duration due to wealth effects (increasing
access to credit and reducing aversion to risk (Newbery and Stiglitz, 1981)).

13
(b) Drip irrigation (dummy) each year from 2000 to 2010 (time-varying): This is posited to
reduce time to adoption and increase duration as drip irrigation increases produce quality and
allows multiple seasons and thus delivery to supermarket channels all year (a practice known
to be desired by supermarkets).
(c) Non-land farm assets from 2000 to 2010 (time-varying): This vector includes irrigation
equipment, greenhouses, tractors, plows, sprayers, fumigators, small tools, and other
equipment. We posit that these assets decrease time to adoption and increase duration
because they allow the farmer to meet quality and consistency requirements and may embody
previous farming experience and performance (Carletto et al. 2010). We used factor analysis
of the principal component to calculate asset indexes (using the Thomson scoring method)
(d) Total value of livestock owned in 2005 and 2010 (time-varying): The effects posited echo
those of other assets.
(e) Farm elevation in 2010 (time-invariant). The elevation of the farm was measured by our
survey team by GPS during data collection. Farm households that are located in the
mountains tend to be in the “hinterlands” and thus present higher transaction costs to access
modern market channels. Mountain areas tend also to have less favorable farming conditions.
(f) Cultivation of niche crops from 2000 to 2010 (time varying): this is a dummy variable that
shows whether the household grew a niche variety crop. We posit that growing a niche
variety crop reduces the time to adoption period, and extends the duration as supermarket
supplier. These kind of crops are very important for supermarket buyers to attract customers,
and therefore farmers who grow niche crops have a competitive advantage compared to
farmers who don’t.

14
(g) Cultivation of target crops (tomato, sweet peppers and lettuce) from 2000 to 2010 (time
varying): we have included three dummy variables that show whether the household grew
any of the three target crops in our sample (or combinations of them). Therefore we are able
to control whether the household is specialized in one crop, or grows multiple crops.
Furthermore, these crops represent three different degrees of perishability (high, medium and
low perishability for lettuce, tomato and sweet peppers respectively), an therefore we can
analyze the effect of perishability on time to adoption and duration as supermarket suppliers.
Community Capital (CK)
(a) Urban share of total population at the municipality level in 2005 (time-invariant). We use this
as a proxy of density of road infrastructure. Procurement divisions of supermarket chains
logically tend to want to work with areas with better road networks to reduce transaction
costs. The data come from the Instituto Nacional de Informacion de Desarrollo (INIDE),
http://www.inide.gob.ni/.
(b) Rural density at the municipality level in 2005 (time-invariant). This variable is another
proxy for road infrastructure, and therefore we expect similar effects as posited for the urban
share of population. The data come from the Instituto Nacional de Informacion de Desarrollo
(INIDE), http://www.inide.gob.ni/.
Time variable
T0 (for the ta equation only) is either 2001, which is the earliest year that supermarket chains
began procuring directly from farmers in Nicaragua, or the year of the household farm formation,
if that occurred later than 2001. Note that about 10% of the households were formed after 2001,
so there is significant variation in this variable. We posit ambiguous effects of this variable on

15
time to adoption: it can shorten it as those being exposed later enter a situation where many other
households have adopted and they can more quickly assess the risk and learn the techniques from
them; but a later exposure also means they enter a situation that may have (we cannot test for
this) greater competition and requirements relative to the situation faced by those exposed
earlier.
Instrumental variables
Both time and adoption and duration as supermarket supplier can be endogenous
determinants of the use of modern technologies, cultivation of niche/highly perishable crops, and
capital led intensification in the farm. One can posit that for example natural ability (an
unobserved household characteristic) can influence not just the decisions to adopt and remain as
modern market suppliers, but can also influence the decision to adopt modern technologies, use
of purchased variable inputs, and the choice of crops that the household grows.
Therefore, we need to find at least one instrumental variable which is (1) correlated with
the decision of participation in a modern market (as supplier) , after controlling for other factors,
but that is (2) not correlated with the error terms (unobserved household characteristics).
We have chosen the following two predetermined time-invariant variables as instruments:
(a) Distance from household to the nearest wholesale market;
(b) Distance from household to the nearest traditional retail market;
We have chosen these variables as instruments because of the following reasons:
First, both wholesale and retail markets are the main alternative traditional markets where
horticultural households sell their produce. Shorter distances to any of the traditional alternatives

16
represent lower transaction costs, and will negatively impact the decision to adopt a modern
market.
Second, controlling for zone and other meso level characteristics, there is no economic
reasoning of why these distance variables are correlated with unobserved variables that will
affect the decision to adopt modern technologies or the choice of inputs used in horticulture
production.
Last, both traditional markets (and their respective distances) are exogenously
predetermined to the individual household.
To estimate the first stage equations, we proceed as follows. Duration models are based
on the implementation of hazard rates which are used to analyze decisions over time. The
specification of the hazard rate can be done using both parametric and non-parametric methods.
Our estimation is performed using Maximum Likelihood. We chose a parametric approach using
a Weibull distribution. Drawing on Carletto et al. (2010) we specify the hazard function as
follows:
(4.1)
where
(4.2)
(1) is the scale parameter, a function of the vector of covariates (x), and
(2) ρ is the shape parameter, which captures the monotonic time dependency of the event.
We use the Accelerated Failure Time (AFT) transformation of the proportional hazards
model, as it yields easier results for interpretation. The AFT coefficients reflect the acceleration
1)()( txth
xex ')(

17
and deceleration effect on time-to-adoption and time-to-withdrawal, which is an analogous
interpretation of common regression models. The AFT model can be written form as follows:
(4.4)
where
(1) t is a non-negative random variable denoting the time of the event (adoption or
withdrawal),
(2) X is the vector of explanatory variables,
(3) β is the vector of coefficients,
(4) ε is the error term2,
(5) σ is a scalar that is equivalent to the inverse of the shape parameter (σ=1/ρ).
(c) The Effects equations, second stage
The second stage models the effects of farm households’ time to adoption and duration as
supermarket channel suppliers (among other variables) on farm assets and technology use in
20103. The latter is selectively represented by indicators of technology modernization in
horticulture cultivation:
2 The error term, in the case of a Weibull hazard function, follows an Extreme value distribution.
3 There are two details about the second stage analysis that are important to address: First, since
we are interested in analyzing duration as supermarket suppliers as a right hand side variable,
then the second stage uses the subsample of farmers who at some point have adopted the
supermarket market channel as you need to “adopt” the supermarket channel in order to have a
record of duration as supplier. Second, the “time to adoption” period (adoption spell) stops when
,')log( Xt

18
(a) Area under drip irrigation: This is a substantial investment and important for plant growth
and quality control as well as multiple season production to ensure steady supply to buyers,
and thus we posit a positive effect of duration on this.
(b) Use of purchased tray-seedlings (dummy variable): These are superior to the traditional
open-field nurseries on-farm as the latter are susceptible to pests and can produce weak
seedlings (and thus affect output and uniformity of quality). Tray seedlings, produced in
greenhouses, are more uniform in output and quality, though more expensive. Again we
hypothesize a positive effect of duration as supermarkets seek consistency and quality.
(c) Hired labor used: We posit that duration is positively associated with hired labor as the latter
relaxes labor constraints over the season thus avoiding quality-diminishing practices (like
skipping weedings).
(d) Fertilizer used: We hypothesize that duration is associated with more fertilizer use; more
fertilizer used, and more frequent fertilizer application allow both greater tomato quality
consistency over the season and more harvestings from a given field.
(e) Pesticide used per ha: We posit that this is correlated with duration as supermarket buyers
seek less blemished produce.
(f) Share of “highly-toxic” pesticide (red-labeled chemicals, as opposed to other chemical
labels, which are yellow, blue, and green) in all pesticides used (red + yellow + blue +
green). We posit that duration is negatively related to this share as supermarket buyers
indicate their preference for pesticide safety; for example, Walmart provides manuals to its
Nicaraguan suppliers wherein they note that highly-toxic pesticides should be avoided.
the “duration” period (withdrawal spell) begins, therefore our panel is reduced to a cross section,
hence the reason why we chose to analyze the effects on farm assets and technology use in 2010.

19
(g) Farm non-land assets (as defined in the first stage): This variable is the total value of non-
land farm assets that includes irrigation equipment, greenhouses, tractors, plows, sprayers,
fumigators, small tools, and other equipment. We posit that that duration should be positively
related to farm asset as earnings from selling to supermarkets can be invested back into the
farm.
The above variables are modeled as determined by the following.
a) Duration (fitted value from the first stage)4
b) Time to adoption (fitted value from the first stage)
c) Farm productive non-land assets. (this variable is in all technology equations but not in the
farm asset equation);
d) The age of HHH and gender of the household head;
e) Number of adults in the household;
f) Land and livestock holdings;
g) and a measure of net profitability via including the price index (lagged one year) and input
costs proxied by distance to input stores (time invariant).
The effects equations are estimated as a system using Zellner’s seemingly unrelated
regression (SUR) model to exploit potential correlation across the errors in all system equations.
Since we are using two variables not actually observed (fitted values for time to adoption and
4 We use the fitted values of duration and time to adoption derived from the first stage (duration
and time to adoption equations); as time to adoption and duration as a supermarket supplier can
be endogenous determinants in the technology equations.

20
duration periods), we use a bootstrapping procedure to obtain the correct standard errors
(Wooldridge, 2002).
3. DATA AND DESCRIPTIVE STATISTICS
The analysis uses a longitudinal data set of farm household information for 10 years,
2000 to 2010; this was constructed through recalled information by surveying a sample of
producers of three target crops (tomato, sweet peppers and lettuce) selling to supermarkets and
traditional sector in 2010.
The sample was constructed by using a stratified random sampling procedure that relied
on the identification of the quasi-population of supermarket producers as the treatment group; the
control group was chosen from a nationally representative random sample of traditional
producers (selling only to traditional wholesale markets, not to supermarkets) constructed from
the 2005 agrarian census and revisited by the ministry of agriculture in 2009. The sample
consisted of 794 households: 337 selling to supermarkets (and possibly also traditional markets);
and 457 selling to traditional wholesalers.
We used a structured questionnaire to collect information about household and farm
characteristics, production and farm income, market channel choices, participation in
organizations, and access to services like credit and technical assistance.
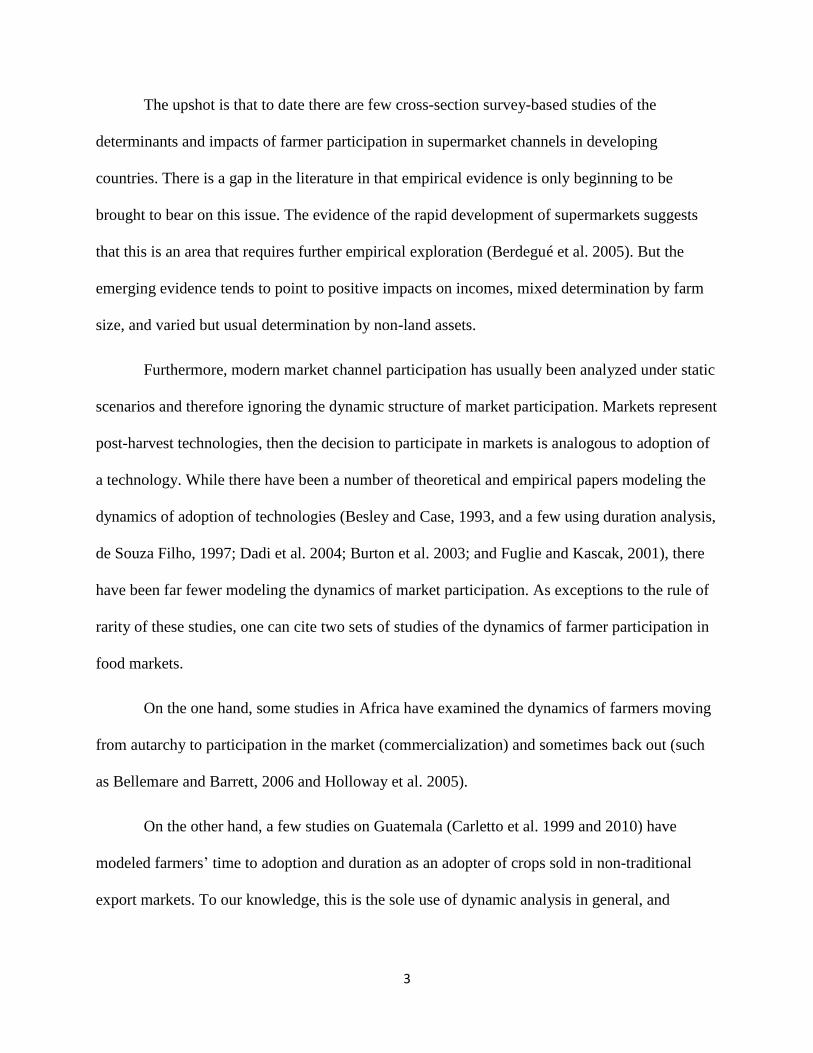
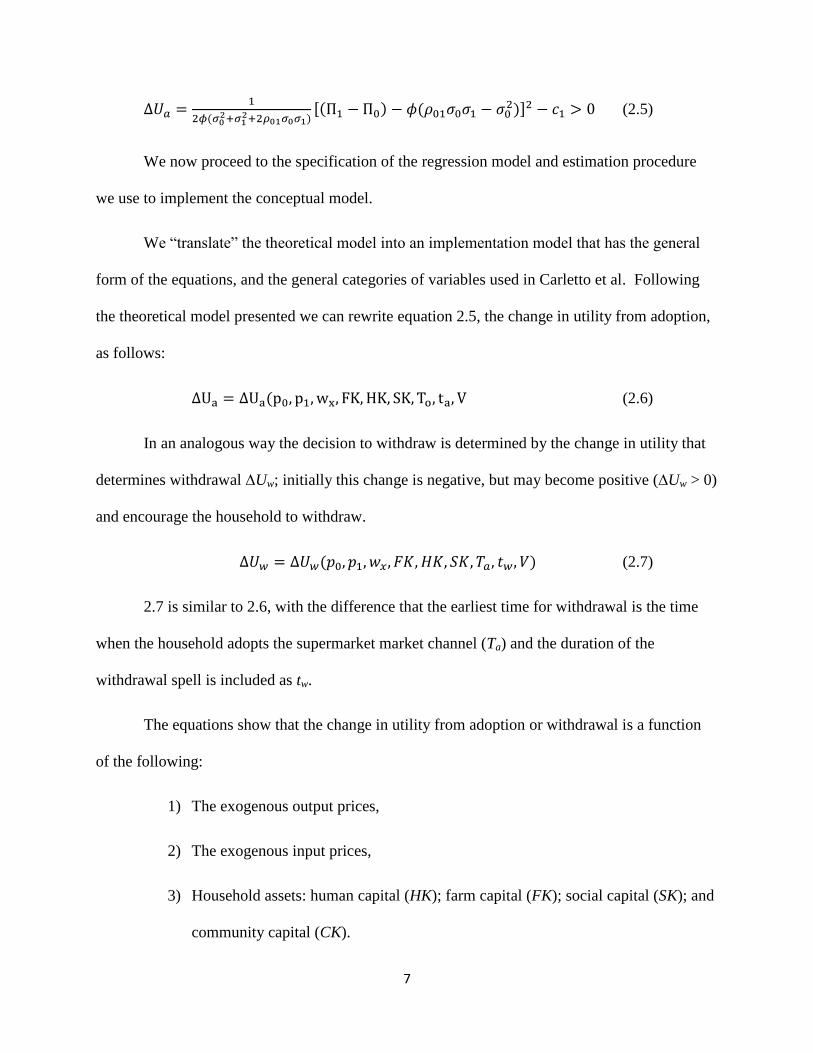
42% of farmers included in the sample adopted the supermarket channel at some point
over the observation period (10 years). However, the diffusion was gradual; Figure 1 shows the
survivor function for the market channel adoption decision, which can be interpreted as the share
of households that have not adopted the supermarket channel at a given time t. This graph shows

21
that farmers began adopting the supermarket channel soon after being exposed to the “risk” of
adoption, but the shape of the survival function might suggests high entry costs of adoption, as
the share of households not yet participating in the supermarket market channel decreased
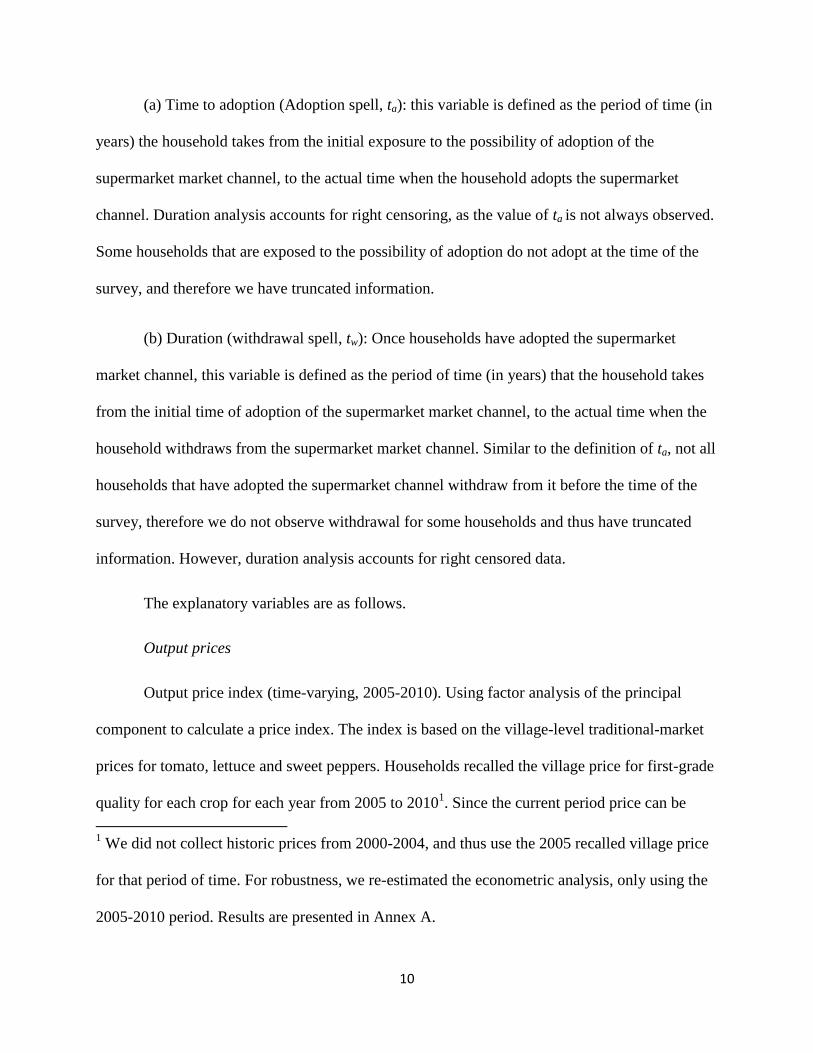
slowly. This is also confirmed by looking at the hazard function (Figure 2) of the adoption spell,
which explains the likelihood of adoption in each time period, conditional on not having adopted
by the previous time period. The adoption hazard function peaks around six years and then
sharply declines after the peak, which implies that if farmers did not adopt the new market
channel within six years of being exposed to the risk of adoption, then they are less likely to
adopt in the following years.
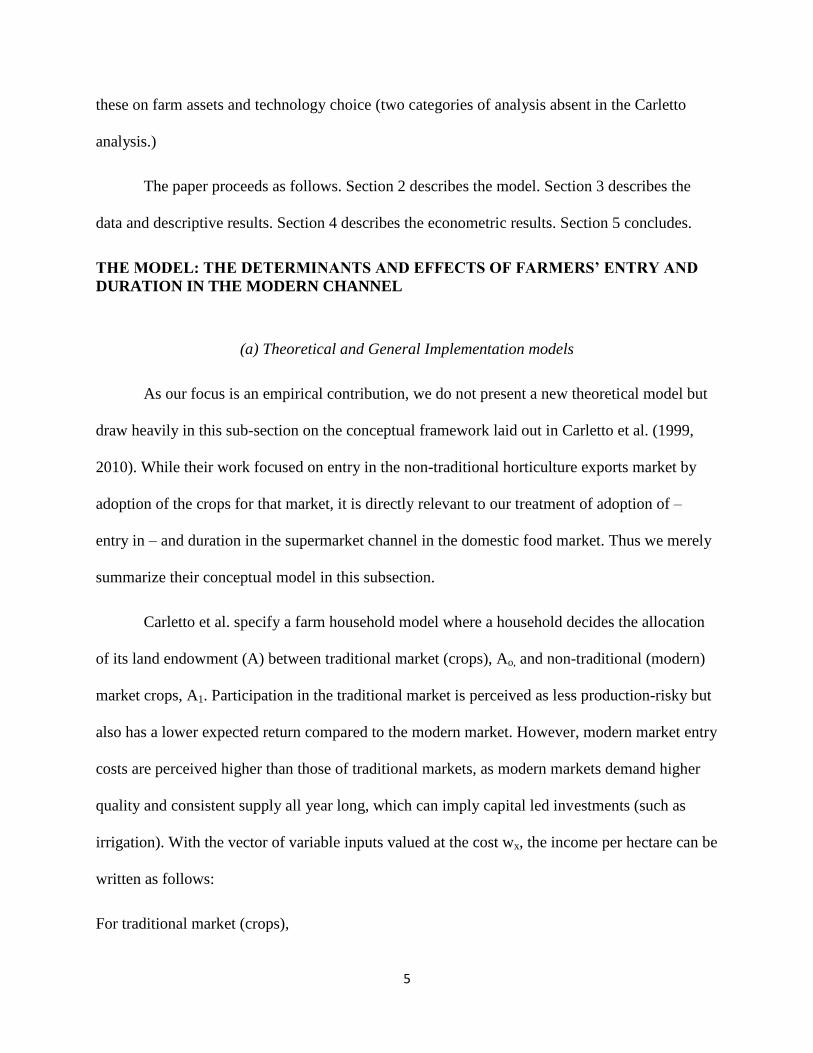
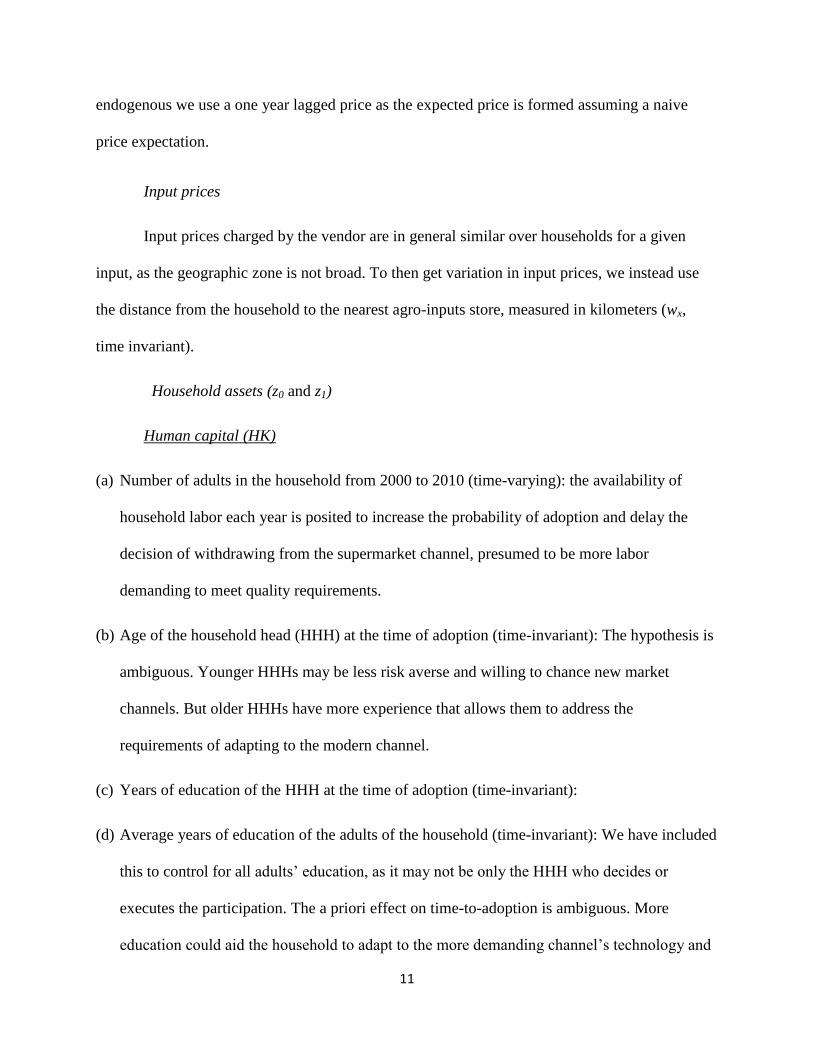
Interestingly, once farmers adopted the supermarket market channel, they seem to remain
as steady suppliers, and do not abandon the new market channel immediately. Figure 3 shows the
survival function of the withdrawal decision; it shows that the first signs of desertion do not
occur before four years after the household has adopted the supermarket channel. By the tenth
year (which is the end of the observation period), 75% of the adopters remained as supermarket
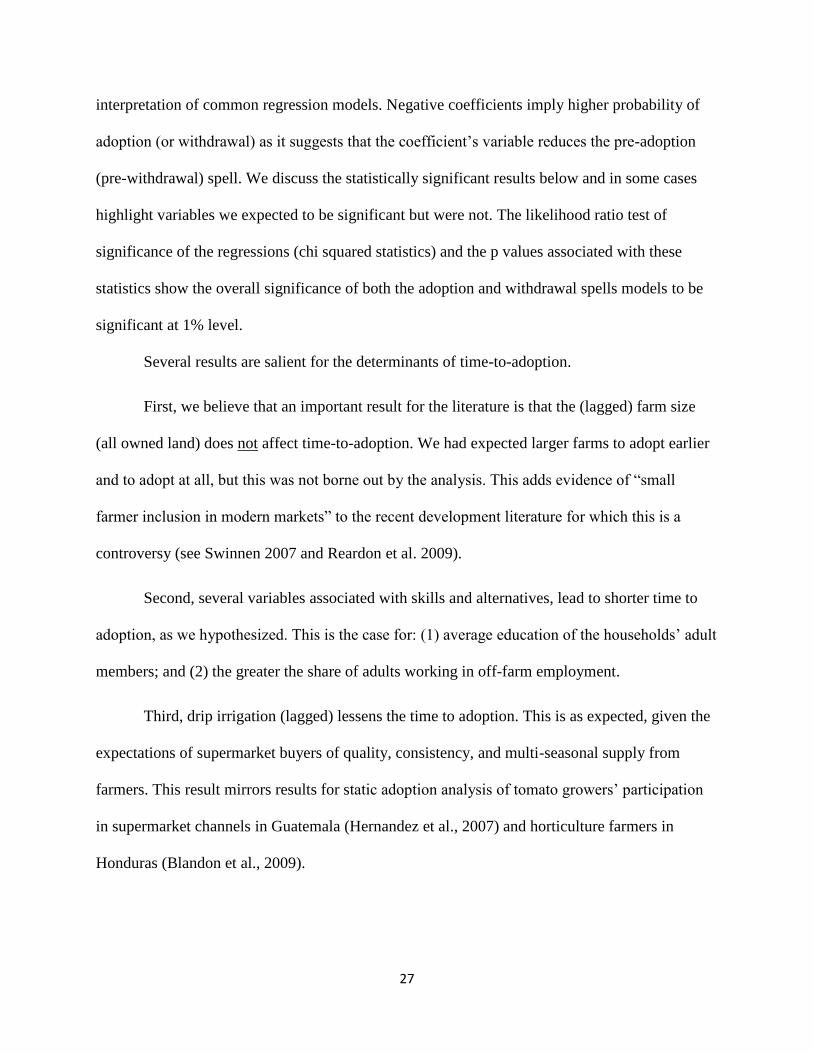
suppliers, and therefore supplied uninterruptedly. The withdrawal hazard function (Figure 4)
shows similar results, as farmers supplying the supermarket channel (adopters) have an
increasing pressure to withdraw that peaks between 7 to 8 years, implying that if farmers did not
abandon the supermarket channel in this period, they are less likely to do it in the upcoming
years. The results of the survivor functions (Figures 1 and 3) and hazard functions (Figures 2 and
4) should be interpreted with caution as a 10 year period is a relatively short period of
observation.
Below we present selected descriptive statistics, analyzing first the households’
characteristics and income distribution (Tables 1) and then their farm characteristics and

22
technology use (Table 2). We first discuss the strata of adopters vs. non-adopters (of the modern
channel), and then, among adopters, early adopters (adopting within the first four years from
being exposed to the risk of adoption) versus late adopters (adopting after five or more years),
and then, also among adopters, those with short duration as suppliers (participating less than five
years as supermarket suppliers) versus long duration (more than five years as supermarket
suppliers).
(a) Household Characteristics
First, the household characteristics, including household size, age, and gender of the
HHH, do not differ much between adopters and non-adopters households. However all education
measures (education of the HHH, average education of the household, and the highest education
level attained by any member of the household) are significantly higher for adopters vs. non-
adopters and this difference is magnified when we divide adopters into short vs. long duration
where education measures are significantly higher for households who have a long duration,
compared with those with short duration. This suggests that education helps households adapt to
evolving requirements of modern channels.
Second, households who have adopted the supermarket channel participate more in off-
farm employment (compared with non-adopters). This could be because of the liquidity (retained
earnings) effects of off-farm employment, or its risk management cum diversification role, or
both. The off-farm participation is even more striking between long and short duration as modern
suppliers; the latter are actually are not statistically different from non-adopters in this respect.
Third, the adopter group has a higher share of households participating in production
cooperatives. This corroborates empirically what our key informant qualitative interviews with

23
supermarket procurement officers, who noted that they like to work with farm cooperatives to
reduce their transaction costs, and with small farmers, who noted that when supplying
supermarkets they like to work in cooperatives to overcome asset thresholds (such as by
accessing a collective packing/sorting facility). Moreover, the share of late adopters participating
in cooperatives is 10% higher than among non-adopters. This special importance of cooperatives
for late adopters could imply that cooperatives are an important facilitator and inducement for
small farmers to participate in modern channels, as suggested by von Braun et al. (1989) for non-
traditional exports from Guatemala.
Fourth, adopters and non-adopters have similar profiles with respect to migration,
distance to infrastructure and nonfarm assets. Nevertheless adopters seems to be less dependent
on temporary migration and are closer to secondary schools and hospitals (proxies for transaction
costs). However differences are magnified when we distinguish short duration (as supplier to
supermarkets) from long duration, we find the latter to live closer to retail and wholesale
markets, hospitals, and schools, which are clustered in towns and proximity to these proxies
lower transaction costs.
Fifth, total household income is significantly different between adopters and non-
adopters, as adopters earn 256% higher per capita income than non-adopters and this difference
is considerably higher for early adopters (292%) and long duration households (433%). Only
short duration households are statistically not different from non-adopters, which in turn are very
similar to the Nicaragua’s GNI ($1,008) for 2010.
Both adopters and non-adopters are mainly dependent on farm income. However adopters
are more specialized horticulture growers, as they earn two thirds of their total income from
production of tomatoes, sweet peppers and/or lettuce, while non-adopters only earn 38% from

24
production of those crops. Furthermore, when we analyze the difference in earnings from target
crops, we can see that adopters make 370% higher earnings compared to non-adopters and this
difference is even more striking when analyzing early adopters (495% higher) and long duration
(as supermarket suppliers) households (566% higher).
(b) Farm characteristics: land and non-land assets and tomato production
First, contrary to expectations fueled by worries in the debate about whether small
farmers will be excluded from modern supply chains, we find that modern market channel
adopters and non-adopters have similar farm sizes and cropped land. Segregating adopters
between early vs. late adopters, and short vs. long duration households show no statistical
difference on farm size and cropped land with non-adopters, hence reinforcing the conclusion of
no smallholder exclusion.
Second, farm assets show a different result as non-adopters have significantly lower non-
land farm asset holdings compared to adopters. However, the results are even more striking when
we segregate early vs. late adopters and short vs. long duration as early adopters and long
duration households have significantly more farm assets than non-adopters, while late adopters
and short duration households are not statistically different from non-adopters.
Third, adopters and non-adopters grow similar areas of target crops (with the exception of
lettuce area, where adopters grow 57% more area than non-adopters). However, it seems that
adopters are more specialized producers, as they harvest around twice the amount of produce,
and have on average twice higher yields for all target crops both in 2005 and 2010. The results
are even more striking when we analyze the differences between early and late adopters, where
late adopters have more comparable yields with non-adopters, while early adopters are the group
with the highest yields and production. This result is interesting because combined with the

25
previous results, it begins to show how late adopters seem to be as small, asset poor and non-
specialized producers as non-adopters. Shorter and longer-duration adopters have similar yields
and production for all crops in 2005 and 2010. However they are significantly higher than non-
adopters. We will see below that these yield differences are linked to early adopters and longer-
duration adopters having more capital-intensive production.
Fourth, the share of farmers having drip-irrigation is significantly higher for adopters
than non-adopters in 2005 and 2010. There are around 33% more households with drip irrigation
in both years, and the difference increases as we analyze short vs long duration adopters. Long
duration adopters have around 50% more households with drip irrigation compared to non-
adopters. This result reinforce the conclusion that adopters are more specialized, capital-
intensive production systems.
Fifth, as expected, in both 2005 and 2010, adopters are three times as likely to use
purchased-tray-seedlings compared to non-adopters (about 67 versus 22%). Within the adopter
group, early adopters and long-duration farms are much more likely to use this technology – and
to have increased substantially the use of it over five years – compared with the late adopters and
short-duration farms. The bulk of the diffusion of this technology was thus among the “leading
group” of modern market channel farmers.
Sixth, we expected a more widespread diffusion of tunnels overall, and a sharp difference
between adopters and non-adopters, but found that only about 5-9% of the adopters used tunnels,
versus 3-4% among non-adopters. The most differentiation was between early and late adopters,
with 10% and 3% using tunnels, respectively. Once again this results is supporting previous
results portraying late adopters as the asset poorest category of small farmers.

26
Finally, adopters have much more variable-input intensive technology than non-adopters
– spending 20% more per hectare overall. But the main sources of difference are from
expenditure on chemical fertilizers (giving better yields and greater consistency) and seedlings
(from more use of purchased tray seedlings to get higher quality and yields); however, in terms
of labor and pesticides, the two groups do not have statistically significant differences.
Moreover, the share of labor (own and hired) in total variable input outlays is similar (a sixth)
between adopters and non-adopters. However, non-adopters have higher family labor
expenditures while adopters have higher hired labor expenditures.
Moreover, the comparison of adopters and non-adopters masks an important difference
within the adopter group: while early adopters’ variable input use (excluding seedlings) is not
statistically different from non-adopters, the late-adopters (recall this is a smaller and more asset-
constrained group than the early adopters) use slightly more variable inputs than the early
adopters. Interestingly (and unexpectedly), the labor share in total costs is about a sixth for each
of them, so it is not that the small-farmer late adopters are using a higher labor intensity.
4. ECONOMETRIC FINDINGS
(a) Determinants of Time-to-Adoption
Table 3 shows the results of regressions explaining time-to-adoption and duration (time
to withdrawal), which we call adoption spell and withdrawal spell, after the literature. As noted
above in the section on the regression specification, we use an Accelerated Failure Time (AFT)
transformation of the proportional hazards model; the AFT coefficients reflect the acceleration
and deceleration effect on time-to-adoption and time-to-withdrawal, which is an analogous
27
interpretation of common regression models. Negative coefficients imply higher probability of
adoption (or withdrawal) as it suggests that the coefficient’s variable reduces the pre-adoption
(pre-withdrawal) spell. We discuss the statistically significant results below and in some cases
highlight variables we expected to be significant but were not. The likelihood ratio test of
significance of the regressions (chi squared statistics) and the p values associated with these
statistics show the overall significance of both the adoption and withdrawal spells models to be
significant at 1% level.
Several results are salient for the determinants of time-to-adoption.
First, we believe that an important result for the literature is that the (lagged) farm size
(all owned land) does not affect time-to-adoption. We had expected larger farms to adopt earlier
and to adopt at all, but this was not borne out by the analysis. This adds evidence of “small
farmer inclusion in modern markets” to the recent development literature for which this is a
controversy (see Swinnen 2007 and Reardon et al. 2009).
Second, several variables associated with skills and alternatives, lead to shorter time to
adoption, as we hypothesized. This is the case for: (1) average education of the households’ adult
members; and (2) the greater the share of adults working in off-farm employment.
Third, drip irrigation (lagged) lessens the time to adoption. This is as expected, given the
expectations of supermarket buyers of quality, consistency, and multi-seasonal supply from
farmers. This result mirrors results for static adoption analysis of tomato growers’ participation
in supermarket channels in Guatemala (Hernandez et al., 2007) and horticulture farmers in
Honduras (Blandon et al., 2009).
28
In the same line (regarding growing conditions), by contrast, a greater elevation of the
farm has the effect of lengthening the time to adoption. farms located in the mountains have
worse agroclimatic and transaction cost situations compared to those on the plains.
Fourth, the lagged first-grade (quality) traditional-market price index lengthens the time
to adoption of the modern market, apparently as a simple situation of inter-channel competition
via profitability.
Fifth, interestingly lagged decisions to grow tomatoes (medium degree of perishability)
and lettuce (highly perishable) significantly reduces the time to adoption period. This may
corroborate other findings from our semi-structure key informant interviews with supermarket
buyers, where they point out the challenge to find adequate suppliers for these products as highly
perishable products are more difficult to handle, and once supermarkets find suppliers they are
interested in developing a long term relationship.
Sixth, the year of first exposure to supermarket participation significantly determines
adoption of the supermarket channel. Farmers who were exposed late to the possibility of
adoption tend to have shorter periods of time to entry. This may be attributed to “learning from
others” where farmers take advantage from the experience from prior adopters.
(b) Determinants of duration or Withdrawal spell
We discuss the main findings below.
First, we found that (lagged) farm size was a significant determinant of duration in the
supermarket channel. Farm households with larger land holdings tend to withdraw from
supplying supermarkets than smallholders. This is a fascinating result as it corroborates recent
findings in the literature (Michelson et al., 2011) where supermarkets have lower prices

29
compared to traditional market prices, but they also have lower price volatility, and therefore
represent a lower risk alternative for smallholders. Therefore, larger farmers are more willing to
take the risk associated with supplying the traditional market, rather than taking a more stable
(but lower) supermarket price.
Second, analogous to our findings that drip irrigation shortens the time to adoption, the
same factor lengthen the duration as a supermarket supplier for those households that adopted the
modern channel.
Third, livestock has a negative effect on duration as supermarket supplier. This result
might show the importance of specialization in horticulture, as farmers have an alternative farm
income source as their livestock holdings increase.
Fourth, growing (lagged one year) niche crop varieties lengthen duration as supermarket
suppliers. This result was expected as supermarkets are specially interested in recruiting farmers
who have the capacity to grow niche varieties, as they are important supermarket products to
attract customers.
Fifth, the earlier the (year of) adoption, the longer the duration of the adopter in the
modern channel. This result may reflect a “first mover advantage” as they have time to
accumulate the needed knowledge and skills to cope with the requirements and vicissitudes of
being in the modern channel.
c) Effect of Duration on Farm Capital Accumulation and Technology Use
Table 4 shows the effects of duration and other variables. Several significant results
emerged from the regressions.
30
First and most important for our purposes, duration is positively correlated with use of
capital-intensive “modern technologies” including drip irrigation, purchased tray seedlings, hired
labor, and production of niche crops.Thus supporting the main hypothesis that consistent
participation in modern markets is correlated with capital led modernization and diversification.
Second, interestingly, duration is negatively correlated with the share of highly toxic
pesticides in overall pesticide use. We had posited that this would be so because the supermarket
chains tend to want this from their suppliers and our key informants from the chains noted that
they communicate that to the farmers. Our finding that the modern channel reduces use of toxic
pesticides stands in contrast to the impact of modern market channel development’s raising toxic
pesticide use in horticulture in Latin America, posited (in the case of non-traditional export
markets) by Lori Ann Thrupp in her 1995 book “Bittersweet harvests for global supermarkets:
challenges in Latin America's agricultural export boom.”
Third, time to adoption is on the other hand positively correlated with use of pesticides.
This result might show how farmers who wait longer to enter the market channel tend to overuse
pesticides, which might be an effect of not being subjected to the stricter pesticide use policy
instituted by supermarkets to their suppliers.
Fourth, both duration and time to adoption are positively correlated with higher use of
hired labor, which might be a result of life cycle.
Fifth, various farm household characteristics are correlated with specific technologies
used. Household head being more educated have a positive effect on farm assets. This might be
the result of educated households investing in farm assets that allow for more capital-labor
substitution..

31
Sixth, the share of adults working in local off-farm employment is positively correlated
with the total value of farm assets in 2010. This is an interesting result, as it might be signaling
how earnings from off-farm employment are invested back in the farm.
Moreover, total cropped land in 2010 is negatively correlated with the use of drip
irrigation in the same period.
5. CONCLUSIONS
First, our analysis suggests that there are significant entry costs for participation by
farmers in the supermarket channel. This is inferred because: (1) although farmers began
adopting the supermarket market channel soon after being exposed to the possibility of adoption,
the speed of adoption appeared somewhat slow; and (2) once farmers adopted the new market
channel, they most remained as steady suppliers.
Second, our descriptive results have shown different types of farm households and their
relation to modern market participation. The segregation of early and late adopters have shown
two very different types of farm households: while early adopters seem to have the “ideal”
characteristics that are desired by supermarket procurement agents (more education, more
income, higher use “modern” technologies, without overusing pesticides), late adopters lack
these characteristics, and in some specific characteristics, are no different from non-adopters.
Greater differences have been observed by segregating adopters into short versus long duration
suppliers; long duration households have more education, more income and assets, more off-
farm employment participation, higher yields, and tend to have greater use of modern
technologies, compared to short duration households.

32
Third, there is evidence of a link between off-farm employment and modern market
participation. Our results suggests that income diversification into nonfarm activities might
bolster participation in supermarkets.
Fourth, our results have shown that indeed small farmers are “included” in the modern
market channel; although we find land is not an excluding factor, we do find that non-land assets
are a barrier to entry. Our results show that consistent suppliers have more capital (in particular
drip irrigation, but also education) and use modern technologies that allow them to supply all
year and position themselves to achieve greater production, and uniform and consistent quality,
which are desired characteristics by supermarket procurement officers.
Fifth, production of niche crops is a competitive advantage to enter modern markets.
Farmers growing niche varieties are well positioned to supply supermarkets. Moreover, product
perishability brings another competitive advantage for smallholders, as supermarkets are eagerly
looking for suppliers of these type of products. Both production of niche varieties and high
perishable products imply necessary farmer’s conditions (such as drip irrigation) and capacities
(such as education and experience) that can become thresholds for adoption.
These results imply for policymakers working to help small farmers access modern
supply channels in domestic markets that there is a need to promote access to non-land assets, in
particular education and farm capital assets most needed to participate in these channels, as well
as formation of production cooperatives that will provide collective assets to help small asset-
poor farmers participate in modern markets.

33
REFERENCES
Bellemare, M.F. & Barrett, C.B. (2006). An ordered tobit model of market participation:
evidence from Kenya and Ethiopia. American Journal of Agricultural Economics, 88(2),
324-337.
Berdegué, J., Balsevich F., Flores L., & Reardon, T. (2005). The rise of supermarkets in Central
America: implications for private standards for quality and safety of fruits and vegetables.
Food Policy, 30(3), 254-269.
Besley, T., & Case, A. (1993). Modeling technology adoption in developing countries. American
Economic Review, 83, 396- 402.
Blandon, J., S. Henson, and J. Cranfield. 2009. “Small-Scale Farmer Participation in New Agri-
Food Supply Chains: Case of the Supermarket Supply Chain for Fruit and Vegetables in
Honduras.” Journal of International Development, 21: 971–984.
Burton, M., Rigby, D., & Young, T. (2003). Modeling the adoption of organic horticultural
technology in the UK using duration analysis. Australian Journal of Agricultural and
Resource Economics, 47, 29–54.
Carletto, G., de Janvry, A., & Sadoulet, E. (1999). Sustainability in the diffusion of innovation:
smallholder non-traditional agro-exports in Guatemala. Economic Development and Cultural
Change, 47(2), 345-369.
Carletto, G., Kirk, A., Winters, P., & Davis, B., (2010). Globalization and smallholders: the
adoption, diffusion and welfare impact of non-traditional export crops in Guatemala. World
Development, 38(6), 814-827.
Dadi, L., Burton, M., & Ozanne, A. (2004). Duration analysis of technological adoption in
Ethiopian agriculture. Journal of Agricultural Economics, 55(3), 613–631.
de Souza Filho, H.M. 1997, The adoption of sustainable agricultural technologies: a case study
in the state of Espirito Santo, Brazil, Ashgate Publishing, Aldershot , England.
Fuglie, K. O., & Kascak, C. A. (2001). Adoption and diffusion of natural resource-conserving
agricultural technology. Review of Agricultural Economics, 23(2), 386–403.
Hernández, R., Reardon, T. and Berdegué, J. (2007), Supermarkets, wholesalers, and tomato
growers in Guatemala. Agricultural Economics, 36: 281–290.
Holloway, G., Barrett, C.B., & Ehui., S. (2005). The double-hurdle model in the presence of
fixed costs. Journal of International Agricultural Trade and Development, 1, 17-28.
Huang, J., Wu, Y. and Rozelle, S. (2009), Moving off the farm and intensifying agricultural
production in Shandong: a case study of rural labor market linkages in China. Agricultural
Economics, 40: 203–218.
Lele, U., & Stone, S.W. (1989). Population pressure, the environment and agricultural
intensification: variations on the Boserup hypothesis. Washington, DC: World Bank
(MADIA Discussion Paper 4).
Michelsen, H., T. Reardon, and F. Perez. In Press. 2012. Small Farmers And Big Retail: Trade-
Offs Of Supplying Supermarkets In Nicaragua,” World Development. 40(2).
Minten, B., Randrianarison, L., & Swinnen, J.F.M. (2009). Global retail chains and poor
farmers: evidence from Madagascar. World Development, 37(11), 1728-1741.
Neven, D., Odera, M., Reardon, T., & Wang, H. (2009) Kenyan supermarkets and emerging
middle-class horticultural farmers, and employment impacts on rural poor. World
Development, 37(11), 1802-1811.

34
Newbery, D., & Stiglitz, J. (1981). The theory of commodity price stabilization: A study in the
economics of risk. Clarendon Press (Oxford and New York), XV 462p.
Pingali, P.L., & Rosegrant, M.W. (1995). Agricultural commercialization and diversification:
processes and policies. Food Policy, 20(3), 171-185
Rao, E., & Qaim, M. (2011). Supermarkets, farm household income, and poverty: insights from
Kenya. World Development, 39, 784-796.
Reardon, T., Barrett, C.B., Berdegué, J.A., & Swinnen, J.F.M. (2009). Agrifood industry
transformation and farmers in developing countries. World Development, 37(11), 1717-27.
Saenz, F, & Ruben, R. (2004). Export contracts for non-traditional products: chayote from Costa
Rica. Journal on Chain and Network Science, 4(2), 139-150.
Swinnen, J. (Ed.) (2007). Global supply chains, standards and the poor. Wallingford: CABI
Publishing.
Taylor, J.E., & Yunez-Naude, A. (2000). The returns from schooling in a diversified rural
economy. American Journal of Agricultural Economics, 82, 287–297.
Thrupp, L.A. 1995. Bittersweet harvests for global supermarkets: challenges in Latin America's
agricultural export boom. Washington DC: World Resources Institute.
Von Braun, J., Hotchkiss, D., & Immink, M. (1989). Non-traditional export crops in Guatemala:
effects on production, income, and nutrition. Research report 73,Washington: IFPRI.
Wooldridge, J., (2002). Econometric analysis of cross section and panel data, 2nd ed. MIT Press,
Cambridge, MA.

35
Figure 1. Adoption survivor function.
Figure 2. Hazard function, adoption.

36
Figure 3. Withdrawal survivor function.
Figure 4. Hazard function, withdrawal.

37
Table 1. Household characteristics and income distribution of vegetable growers in Nicaragua in 2010, by adoption category.
NON ADOPTERS ADOPTERS
TOTAL All Early Adopters Late Adopters Short Duration Long Duration
Observations 457 337 124 213 207 130 794
1 Household Characteristics
1.1 Number of people in the household (HH)
(unweighted)
5.1 5.3 5.4 5.3 5.4 5.2 5.2
1.2 Number of adults in HH (age older than 14 and
younger than 60)
3.5 3.7 3.8 3.6 3.7 3.6 3.6
1.3 Female headed HH (share over all HH SOH) 3% 4% 2% 5% 4% 3% 3%
1.4 Age of head of household (HHH) (years) 47.1 47.4 48.2 47.0 47.7 47.0 47.3
1.5 share of HH members who work on the farm
(SOH)
33%y 30%** 29% 30% 29%x 31%xy 31%
1.6 share of HH members who work off the farm
(SOH)
9%x 12%** 11% 12% 10%xy 13%y 10%
1.7 Education of HHH (years) 4.1ax 4.9*** 4.5ab 5.1b 4.5x 5.6y 4.4
1.8 Average years of education in HH (taken over
all adults members of the HH)
6.4ax 7.2*** 7.0ab 7.4b 7.0y 7.6y 6.7
1.9 Highest level of education attained by any
member of HH (taken over all members of the
HH)
9.6ax 10.6*** 10.2ab 10.9b 10.5y 10.9y 10.0
1.10 Member of a production cooperative / farmer
association/ farmer enterprise in 2010 (SOH)
32%ax 42%*** 41%ab 43%b 34%x 55%y 36%
1.11 Member of a production cooperative / farmer
association/ farmer enterprise in 2005 (SOH)
17%ax 28%*** 32%b 27%b 23%x 38%y 22%
2 Household Local Non-farm and Migration
2.1 Total value of HH nonfarm consumption
durables (USD 100s) in 2010
$747 $731 $681 $755 $720 $739 $739
2.2 Total value of HH nonfarm production assets
(USD 100s) in 2010
$84 $91 $115 $80 $96 $87 $88
2.3 Total value of HH nonfarm consumption
durables (USD 100s) in 2005
$208ax $276** $250ab $295b $270xy $292y $238
2.4 Total value of HH nonfarm production assets
(USD 100s) in 2005
$35a $52 $77b $39a $52 $55 $43
2.5 Share of HH who had a temporary migrant in
the past five years
14%by 10%** 6%a 12%b 13%y 5%x 12%
2.6 Share of HH who had a permanent migrant in
the past five years
25% 22% 23% 22% 24% 19% 23%
3 Collective assets
3.1 Distance to the closest agrochemicals 18.6y 16.8 14.6 18.4 19.1y 13.6x 17.8

38
NON ADOPTERS
ADOPTERS TOTAL
All Early Adopters Late Adopters Short Duration Long Duration
commercial distributor (kms)
3.2 Distance to the closest wholesale market (kms) 80.7y 78.3 74.6 81.0 86.7y 65.8x 79.8
3.3 Distance to the closest retail market (kms) 19.0y 19.0 18.0 19.5 22.2y 13.5x 19.0
3.4 Distance to the closest secondary school (kms) 4.6by 3.5*** 3.6ab 3.4a 3.3x 3.8xy 4.1
3.5 Distance to the closest hospital (kms) 20.6by 16.9*** 17.1a 17.0a 18.6y 14.5x 19.1
3.6 Distance to the center of the village (kms) 3.4 3.0 3.0 3.1 2.8 3.4 3.2
4 Household Income
4.1 On-farm income $3,303ax 71% $7,957*** 81% $10,409c 87% $6,454b 76% $5,563x 75% $11,194y 86% $5,281 77%
4.1.1Target crops income $1,769ax 38% $6,548*** 67% $8,758c 74% $5,205b 61% $4,029x 55% $10,016y 77% $3,805 56%
4.2 Off-farm income $1,000a 21% $1,467* 15% $1,265b 11% $1,563b 18% $1,360 18% $1,603 12% $1,193 17%
4.3 Not earned income $358 8% $391 4% $237 2% $489 6% $467 6% $283 2% $374 5%
4.4 Total household income $4,441ax 100% $8,953*** 100% $11,134c 100% $7,748b 100% $6,670x 100% $12,695y 100% $6,374 100%
4.5 Total income per capita (considering all HH
members) $1,053 ax $2,699*** $3,079b $2,505b $1,559 x $4,560y $1,759
*,**,*** = show statistically difference at 10%, 5%, 1% significant level.
a, b, c, show differences between non-adopters, early adopters and late adopters using Tukey-Kramer test at 10% significance level.
x, y, z, show differences between non-adopters, early adopters and late adopters using Tukey-Kramer test at 10% significance level.

39
Table 2. Farm assets and technology choice of horticultural growers in Nicaragua in 2010, by adoption category.
NON
ADOPTERS
ADOPTERS ADOPTERS ADOPTERS
TOTAL All
Early
Adopters
Late
Adopters
Short
Duration
Long
Duration
Observations 457 337 124 213 207 130 794
1 Land operated (for all crops in Ha)
1.1 Total land owned and not rented out
in Ha in 2010 7.7 9.8 7.4 11.4 10.0 9.9 8.7
1.2 Total land owned and rented out in
Ha in 2010 0.3 0.4 0.3 0.4 0.4 0.3 0.3
1.3 Total land rented in in Ha in 2010 1.0 0.9 0.7 1.0 0.9 0.9 0.9
1.4 Total land owned and not rented out
in Ha in 2005 7.4 8.9 7.0 10.1 8.7 9.4 8.1
1.5 Total land rented in in Ha in 2005 0.3 0.3 0.3 0.3 0.4 0.2 0.3
1.6 Total cropped land in Ha in 2010 2.7 2.9 2.8 3.0 2.9 2.9 2.8
1.7 Total cropped land in Ha in 2005 2.5 2.5 2.4 2.5 2.3 2.8 2.5
2 Non land assets
2.1 Total value of farm assets (USD) in
2010 $1,946ax $2,978*** $3,148b $2,896ab $2,770xy $3,338y $2,388
2.2 Total value of farm assets (USD) in
2005 $966 $1,382** $1,422 $1,352 $1,269 $1,550 $1,141
2.3 Total value of animals owned
(USD) in 2010 $1,483 $1,484 $1,316 $1,588 $1,526 $1,427 $1,485
2.4 Total value of animals owned
(USD) in 2005 $1,241 $1,010 $940 $1,075 $1,003 $1,061 $1,150
3 Production in 2010
3.1 Tomato production (MT/year) 25.1x 37.3*** 38.4 36.6 38.7y 34.9xy 30.2
3.2 Total area grown (Ha) 0.8 0.8 0.7 0.8 0.9 0.6 0.8
3.3 Yield (MT/Ha) 28.4ax 48.0*** 63.6c 38.9b 43.4y 54.3y 36.6
3.4 Sweet pepper production (MT/year) 5.7ax 12.4*** 12.0b 12.6b 12.3y 12.4y 8.1
3.5 Total area grown (Ha) 0.5 0.4 0.5 0.4 0.5 0.4 0.5
3.6 Yield (MT/Ha) 11.1ax 33.5** 21.7ab 41.1b 40.3y 23.0xy 19.2
3.7 Lettuce production (MT/year) 15.2 32.5** 31.3 33.8 32.5 33.0 25.4
3.8 Total area grown (Ha) 0.7ax 1.1*** 1.2b 1.0ab 1.0xy 1.3y 0.9
3.9 Yield (MT/Ha) 21.6 31.0 26.2 34.7 31.6 30.1 27.0
4 Irrigation Technology in 2010
4.1 Share of HH without irrigation 20% 0% 0% 0% 0% 0% 12%

40
NON
ADOPTERS
ADOPTERS ADOPTERS ADOPTERS
TOTAL All
Early
Adopters
Late
Adopters
Short
Duration
Long
Duration
4.2 Share of HH with drip irrigation 29%ax 62%** 56%b 65%b 50%y 78%z 43%
4.3 Share of HH with canal irrigation 48%by 35%** 40%b 32%a 49%y 16%x 42%
4.4 Share of HH with other type of
irrigation 3% 4% 5% 3% 2% 6% 3%
5 Seedling Technology 2010
5.1 Share of HH using direct seeding 2% 1% 2% 0% 0% 1% 1%
5.2 Share of HH using owned produced
seedlings 76%cz 32%*** 21%a 38%b 46%y 15%x 57%
5.3 Share of HH using purchased tray
seedlings 22%ax 67%*** 78%c 62%b 54%y 84%z 42%
6 Tunnel Technology 2010
6.1 Share of HH using tunnels 3%a 5% 10%b 3%a 6% 5% 4%
6.2 Share of HH using open field 97% 95% 90% 97% 94% 95% 96%
7 Production in 2005
7.1 Tomato production (MT/year) 35.0 36.7 49.0 28.1 39.1 32.5 35.6
7.2 Total area grown (Ha) 0.8 0.7* 0.7 0.7 0.7 0.6 0.8
7.3 Yield (MT/Ha) 35.8ax 57.4** 84.6c 39.9b 46.9xy 74.7y 44.6
7.4 Sweet pepper production (MT/year) 6.7 13.4* 13.7 13.4 13.1 14.5 9.5
7.5 Total area grown (Ha) 0.5 0.5 0.5 0.5 0.5 0.4 0.5
7.6 Yield (MT/Ha) 14.5 40.4* 22.9 52.2 48.1 27.1 25.1
7.7 Lettuce production (MT/year) 21.1a 31.3** 39.6b 26.2ab 30.6 32.4 26.8
7.8 Total area grown (Ha) 0.8 0.9 0.9 0.9 0.9 1.0 0.9
7.9 Yield (MT/Ha) 27.1ax 58.9 104.6b 31.1a 37.2xy 92.6y 44.8
8 Irrigation Technology in 2005
8.1 Share of HH without irrigation 22% 3% 0% 5% 5% 0% 14%
8.2 Share of HH with drip irrigation 14%ax 48%*** 47%b 48%b 34%y 65%z 29%
8.3 Share of HH with canal irrigation 59%by 46% 50%b 43%a 57%y 31%x 53%
8.4 Share of HH with other type of
irrigation 5% 4% 3% 4% 3% 4% 4%
9 Seedling Technology 2005
9.1 Share of HH using direct seeding 4% 3% 2% 4% 4% 1% 3%
9.2 Share of HH using owned produced
seedlings 82%bz 41%*** 33%a 46%ab 51%y 28%x 64%
9.3 Share of HH using purchased tray 14%ax 56%*** 66%b 50%b 45%y 71%z 32%

41
NON
ADOPTERS
ADOPTERS ADOPTERS ADOPTERS
TOTAL All
Early
Adopters
Late
Adopters
Short
Duration
Long
Duration
seedlings
10 Tunnel Technology 2005
10.1 Share of HH using tunnels 4%ax 9%*** 11%b 8%b 11%y 6%xy 5%
10.2 Share of HH using open field 96% 91% 89% 92% 89% 94% 95%
11 Inputs for Horticulture Production in
2010 (USD/Ha)
11.1 Seedlings/seeds expenditures 172ax 330*** 331b 332b 259y 448z 240
11.2 Labor expenditure 332 355 345 364 350 368 343
11.2.1 Imputed family labor 144b 123** 110a 132ab 124 124 135
11.2.2 Hired labor 188ax 232*** 235b 232b 226xy 244y 207
11.3 Fertilizers expenditure 672ax 796*** 796ab 808b 719x 939y 728
11.3.1 Chemical fertilizers 520x 583** 590 588 545x 659y 549
11.3.2 Organic fertilizers 4x 9 11 7 4x 16y 6
11.3.3 Foliar fertilizers 149ax 204*** 196ab 212b 170x 264y 173
11.4 Pesticides expenditure 472 495 460 522 456 568 484
11.4.1 Insecticides 270 279 241 308 257 324 275
11.4.2 Herbicides 16ax 20** 17ab 22b 23y 16x 18
11.4.3 Fungicides 187 195 203 191 176 227 191
11.4 Other inputs expenditure# 237x 304** 280 314 261x 367y 264
11.5 TOTAL 1886ax 2281*** 2213b 2340b 2045x 2689y 2059
*,**,*** = show statistically difference at 10%, 5%, 1% significant level.
a, b, c, show differences between non-adopters, early adopters and late adopters using Tukey-Kramer test at 10% significance level.
x, y, z, show differences between non-adopters, early adopters and late adopters using Tukey-Kramer test at 10% significance level. # Other inputs include Rope, plastic, sticks, filters, fuel, connectors, and wire.

42
Table 3. Duration analysis
Adoption
Spell
Withdrawal
Spell
Household Characteristics
Age of the head of the household (HHH) 0.005 -0.003
(0.004) (0.007)
Average years of education taken within the adult members of the
household
-0.043*** -0.009
(0.015) (0.029)
HHH is female 0.001 0.822
(0.277) (0.711)
Number of adults (14 to 60 years old) in the household -0.021 0.010
(0.033) (0.053)
Share of adults working in local off farm employment -0.528* -0.032
(0.309) (0.553)
Farm and Non Farm Characteristics
Lagged (1 year) participation in a production cooperative by any adult
member of the household
-0.011 0.065
(0.128) (0.182)
Lagged (1 year) total owned land in Ha -0.000 -0.004***
(0.001) (0.001)
Total value of livestock holdings (USD thousands) 0.006 -0.039**
(0.017) (0.016)
Lagged (1 year) farm assets index 0.054 0.121
(0.070) (0.127)
Lagged (1 year) non farm productive assets index 0.064 0.045
(0.061) (0.087)
Lagged (1 year) access to drip irrigation (yes=1, no=0) -0.390** 0.717***
(0.163) (0.261)
Distance to the nearest agri-inputs distribution store 0.032 -0.048
(0.045) (0.056)
Distance to the nearest wholesale market (kms) 0.009 -0.013
(0.008) (0.011)
Distance to the nearest local market (kms) 0.024 -0.058
(0.034) (0.044)
LN[Elevation of the farm (meters above sea level)] 0.124* -0.128
(0.071) (0.169)
Meso Level Characteristics
Lagged (1 year) price index of tomato/sweet peppers/lettuce per lb
prices at the village level
0.067 -0.063
(0.056) (0.101)
Rural density at the municipality level 0.001 0.006
(0.002) (0.005)
Share of urban population over total population at the municipality level 0.009*** -0.007
(0.003) (0.005)
crop production (lagged 1 year)
HH produced a niche crop (yes=1, no=0) 0.217 0.854**
(0.247) (0.434)
HH grows sweet peppers (yes=1, no=0) 0.089 0.596**
(0.140) (0.250)
HH grows tomatoes (yes=1, no=0) -0.631*** 0.929***

43
(0.130) (0.221)
HH grows lettuce (yes=1, no=0) -1.209*** 0.963***
(0.173) (0.243)
Household time
Origin of the adoption spell (To) -0.102***
(0.039)
Origin of the withdrawal spell (year of adoption of the supermarket
channel, Ta)
-0.401***
(0.048)
Constant 206.610*** 806.402***
(78.504) (96.373)
ρ 1.117 1.453
σ=1/ ρ 0.895 0.688
Observations 5,767 1,119
LR Chi2 (24) 122.0 136.0
Prob > Chi2 0.000 0.000
***,**,* = Statistically significant at 1,5,10% level.

44
Table 4. Effect of time to adopt and duration as supermarket suppliers on farm assets and technology in 2010.
Farm
Assets
Drip
irrigation
area
Niche
cropped
area
Purchased
tray
seedlings
Hired Labor Fertilizers Pesticides
Share of
toxic
pesticides
Age of the head of the household (HHH) 0.010 -0.008** 0.004 0.001 0.277 -1.466 0.291 0.001
(0.025) (0.004) (0.003) (0.002) (2.648) (2.997) (2.119) (0.001)
HHH is female -0.006 -0.063 -0.075 -0.017 -32.492 -96.256 -217.874* 0.054
(1.680) (0.129) (0.064) (0.123) (163.127) (176.515) (115.149) (0.049)
Years of education of the HHH 0.280*** 0.012 0.029 0.005 0.736 -5.948 7.964 0.004
(0.087) (0.010) (0.020) (0.007) (6.831) (8.717) (7.210) (0.003)
Number of adults (14 to 60 years old) in the
household
-0.015 0.001 0.023 0.004 -16.224 -19.072 -11.980 -0.002
(0.219) (0.017) (0.024) (0.013) (20.771) (21.489) (13.682) (0.003)
Share of adults working in local off farm
employment
5.273** 0.406 -0.324 0.017 -183.320 -209.403 -243.697 0.076
(2.533) (0.295) (0.276) (0.173) (215.414) (283.094) (188.898) (0.060)
Total cropped land in Ha -0.001 -0.029** 0.014 -0.000 14.465 -10.513 -4.565 0.004
(0.136) (0.013) (0.012) (0.012) (13.158) (14.325) (11.711) (0.003)
Farm assets index 0.065 0.019 0.016 5.108 3.764 -12.859 -0.009
(0.070) (0.038) (0.023) (24.857) (22.070) (20.334) (0.006)
Total value of livestock holdings (USD
thousands)
0.487* -0.004 0.000 -0.004 -5.973 -5.846 -6.264 0.001
(0.257) (0.014) (0.009) (0.008) (7.845) (8.294) (6.401) (0.002)
Distance to the nearest agri-inputs distribution
store (km)
-0.260 -0.032 -0.000 -0.052 -5.669 1.460 5.375 -0.006
(0.294) (0.031) (0.015) (0.033) (26.728) (27.689) (26.461) (0.006)
LN[Elevation of the farm (meters above sea
level)]
0.829 -0.042 0.045 -0.019 84.383 -50.637 -165.339 -0.047
(0.715) (0.100) (0.067) (0.063) (85.699) (88.684) (110.943) (0.029)
Duration as supermarket supplier (fitted
value)
0.470 0.084*** 0.085** 0.095*** 84.425*** 37.533 38.902 -0.008*
(0.348) (0.031) (0.033) (0.021) (28.223) (30.711) (24.103) (0.005)
Time to adopt the supermarket channel (fitted
value)
0.514 0.032 -0.012 0.012 176.051*** 103.368 120.029** 0.022
(0.501) (0.065) (0.057) (0.055) (53.641) (67.289) (57.169) (0.016)
HH is located in semi-dry zone 2.855 -0.060 -0.002 -0.233 -298.157 -393.031 179.618 0.068
(2.652) (0.340) (0.156) (0.241) (366.737) (293.376) (505.871) (0.114)
HH is located in humid zone -0.377 -0.127 0.089 -0.419*** -359.689*** -74.671 18.375 0.055**
(0.656) (0.079) (0.055) (0.060) (77.193) (79.406) (72.775) (0.024)
Constant -7.243 0.852 -0.823 0.578 -309.843 1,158.523* 1,281.498* 0.254
(6.084) (0.769) (0.655) (0.463) (580.328) (629.860) (743.437) (0.196)
Observations 305 305 305 305 305 305 305 305
R squared 0.209 0.188 0.117 0.294 0.141 0.112 0.090 0.135
Wald Chi2 (14) 80.7 66.89 42.1 126.98 49.69 38.4 31.15 48.14

45
Prob > Chi2 0.000 0.000 0.000 0.000 0.000 0.000 0.008 0.000
***,**,* = Statistically significant at 1,5,10% level.

46
ANNEX A: Econometric analysis using 2005-2010 data only

47
Table 5. Duration analysis
Adoption Spell Withdrawal
Spell
Household Characteristics Age of the head of the household (HHH) 0.003 -0.005
(0.003) (0.006)
Average years of education taken within the adult members of the household
-0.028*** -0.017 (0.011) (0.027)
HHH is female -0.191 0.762 (0.181) (0.642)
Number of adults (14 to 60 years old) in the household
-0.026 0.021 (0.023) (0.051)
Share of adults working in local off farm
employment
-0.353* -0.099
(0.215) (0.533) Farm and Non Farm Characteristics
Lagged (1 year) participation in a production cooperative by any adult member of the household
-0.060 0.006 (0.088) (0.172)
Lagged (1 year) total owned land in Ha 0.000 -0.003*** (0.001) (0.001)
Total value of livestock holdings (USD thousands) -0.004 -0.044***
(0.010) (0.014) Lagged (1 year) farm assets index 0.001 0.213
(0.050) (0.139) Lagged (1 year) non farm productive assets index 0.080* 0.016
(0.044) (0.081) Lagged (1 year) drip irrigated land in Ha -0.335*** 0.686***
(0.119) (0.247)
Distance to the nearest agri-inputs distribution store 0.012 -0.045 (0.028) (0.051)
Distance to the nearest wholesale market (kms) 0.003 -0.012 (0.005) (0.011)
Distance to the nearest local market (kms) -0.004 -0.055 (0.020) (0.041)
LN[Elevation of the farm (meters above sea level)] -0.006 -0.054
(0.055) (0.165) Meso Level Characteristics
Lagged (1 year) price index of tomato/sweet peppers/lettuce per lb prices at the village level
0.071* -0.065 (0.041) (0.103)
Rural density at the municipality level 0.001 0.006 (0.002) (0.005)
Share of urban population over total population at
the municipality level
0.005** -0.005
(0.002) (0.005) crop production (lagged 1 year)
Lagged (1 year) HH produced a niche crop (yes=1, no=0)
0.513** 0.622* (0.202) (0.379)
HH grows sweet peppers (yes=1, no=0) 0.196** 0.708***

48
(0.095) (0.252) HH grows tomatoes (yes=1, no=0) -0.189** 0.955***
(0.083) (0.215) HH grows lettuce (yes=1, no=0) -0.486*** 0.873***
(0.119) (0.231) Household time
Origin of the adoption spell (To) -0.219*** (0.023)
Origin of the withdrawal spell (year of adoption of
the supermarket channel, Ta)
-0.467***
(0.053) Constant 440.439*** 937.665***
(46.499) (105.510) ρ 2.076 1.618 σ=1/ ρ 0.482 0.618 Observations 3,262 958 LR Chi
2 (24) 148.0 157.9
Prob > Chi2 0.000 0.000
***,**,* = Statistically significant at 1,5,10% level.

49
Table 6. Effect of time to adopt and duration as supermarket suppliers on farm assets and technology in 2010.
Farm
Assets
Drip
irrigation
area
Niche
cropped
area
Purchased
tray
seedlings
Hired Labor Fertilizers Pesticides
Share of
toxic
pesticides
Age of the head of the household (HHH) 0.006 -0.007** 0.004*** 0.001 1.313 -1.733 0.229 0.001
(0.031) (0.003) (0.001) (0.002) (1.314) (1.341) (1.990) (0.001)
HHH is female 0.230 -0.046 -0.055 0.008 31.123 -56.103 -172.066*** 0.059
(1.297) (0.107) (0.037) (0.100) (40.675) (81.289) (61.379) (0.041)
Years of education of the HHH 0.281*** 0.010 0.031 0.006 -2.146 -5.433 7.826 0.004
(0.101) (0.008) (0.019) (0.007) (8.289) (6.630) (7.612) (0.003)
Number of adults (14 to 60 years old) in the
household
-0.016 -0.001 0.024 0.004 -18.858 -19.429 -12.704 -0.002
(0.208) (0.011) (0.019) (0.013) (18.178) (21.142) (17.839) (0.004)
Share of adults working in local off farm
employment
5.153** 0.347 -0.310 0.019 -284.845*** -226.474** -276.985** 0.074*
(2.131) (0.220) (0.273) (0.243) (82.577) (104.766) (126.843) (0.040)
Total cropped land in Ha 0.004 -0.029* 0.013 -0.001 13.981** -10.909 -5.053* 0.004
(0.136) (0.015) (0.014) (0.010) (6.627) (16.780) (2.773) (0.003)
Farm assets index 0.067 0.017 0.012 6.643 -1.170 -15.411* -0.010
(0.048) (0.024) (0.019) (26.691) (9.719) (9.365) (0.006)
Total value of livestock holdings (USD
thousands)
0.495*** -0.005 0.000 -0.004 -6.035 -4.410 -5.299 0.001
(0.172) (0.008) (0.005) (0.004) (4.975) (5.308) (4.299) (0.001)
Distance to the nearest agri-inputs
distribution store (km)
-0.231* -0.030 -0.003 -0.053*** -1.369 3.590 7.598 -0.005***
(0.119) (0.020) (0.010) (0.009) (25.867) (15.953) (5.416) (0.002)
LN[Elevation of the farm (meters above sea
level)]
0.851 -0.048 0.042 -0.021 89.359*** -42.618 -157.622 -0.045**
(0.662) (0.076) (0.063) (0.064) (32.707) (62.000) (123.766) (0.022)
Duration as supermarket supplier (fitted
value)
0.567* 0.069** 0.067** 0.081*** 53.285** 28.098 22.964* -0.007**
(0.290) (0.033) (0.030) (0.015) (22.587) (25.723) (13.905) (0.004)
Time to adopt the supermarket channel (fitted
value)
0.993 -0.123*** 0.025 0.035 28.821 150.040** 133.576 0.034*
(0.655) (0.030) (0.019) (0.061) (98.346) (70.408) (92.503) (0.020)
HH is located in semi-dry zone 2.669** -0.043 -0.012 -0.240 -275.659 -396.365*** 180.787 0.067
(1.235) (0.373) (0.136) (0.264) (329.156) (142.645) (143.717) (0.154)
HH is located in humid zone -0.426** -0.105 0.076*** -0.426*** -337.028*** -80.298 16.793 0.054**
(0.177) (0.086) (0.028) (0.062) (72.588) (102.011) (53.542) (0.022)
Constant -8.691* 1.293** -0.848 0.570 115.317 1,033.879*** 1,258.784* 0.214
(4.609) (0.626) (0.616) (0.485) (340.718) (382.235) (690.616) (0.145)
Observations 305 305 305 305 305 305 305 305
R squared 0.222 0.188 0.109 0.291 0.118 0.115 0.087 0.134
Wald Chi2 (14) 87.14 67.22 38.96 125.25 40.26 39.72 30.4 48.18
50
Prob > Chi2 0.000 0.000 0.001 0.000 0.000 0.001 0.011 0.000
***,**,* = Statistically significant at 1,5,10% level.