Embed Size (px)
Citation preview

Listed company
National Register of Corporate Taxpayers - (CNPJ)
No. 97.837.181/0001-47
NIRE -35300154410
Interim Financial Information on the Second Quarter of 2018
Duratex S.A.

DURATEX S.A. CNPJ. 97.837.181/0001-47 A Publicly Listed Company NIRE 35300154410
SUMMARIZED MINUTES OF THE MEETING OF THE BOARD OF OFFICERS HELD ON AUGUST 1st, 2018
DATE, TIME AND PLACE: on August 1st, 2018 at 8:30 a.m, at Avenida Paulista, 1938, 5th
floor, Room 505, in the city and state of São Paulo.
PRESIDING: Antonio Joaquim de Oliveira (Chairman) and Carlos Henrique Pinto Haddad
(Secretary).
QUORUM: the totality of the elected members.
RESOLUTIONS ADOPTED: following examination of the Company’s individual and
consolidated interim financial information for the quarter ended June 30, 2018, the Board of
Officers decided, unanimously and pursuant to the provisions in Sub-items V and VI, Article
25 of CVM Instruction 480/09, as amended, to declare that:
a) it has reviewed, discussed and agreed with the opinions expressed in the review report
issued by Ernst & Young Auditores Independentes S/S; and,
b) it has reviewed, discussed and agreed with the Company's individual and consolidated
interim financial information for the quarter ended June 30, 2018.
CONCLUSION: with the work of the meeting concluded, these minutes were drafted, read,
approved and signed by all. São Paulo (SP), August 1st, 2018. (aa) Antonio Joaquim de
Oliveira – Chief Executive Officer; Marcelo José Teixeira Izzo – Vice President of the Deca
Business Unit; Henrique Guaragna Marcondes – Vice President of the Wood Business Unit;
Bruno Basile Antonaccio, Carlos Henrique Pinto Haddad; José Ricardo Paraíso Ferraz,
Marcelo Koji Tahara, Marco Antonio Milleo, Maria Julieta Pinto Rodrigues Nogueira and
Nelson Ricardo Teixeira – Officers.
CARLOS HENRIQUE PINTO HADDAD
Investor Relations Officer
DURATEX S.A. CNPJ. 97.837.181/0001-47 A Publicly Traded Company NIRE 35300154410
OPINION OF THE FISCAL COUNCIL
The members of Fiscal Council of DURATEX S.A. have proceeded to examine the
Company’s individual and consolidated interim financial information for the quarter
ended June 30, 2018, which were reviewed by Ernst & Young Auditores
Independentes S/S (“E&Y”), as an independent auditor.
The Fiscal Councilors have verified the exactness of the elements examined and in
view of the unqualified review report issued by E&Y, understand that these
documents adequately reflect the equity situation, the financial position and the
activities of the Company in the period. São Paulo (SP), August 1st, 2018. (signed)
Flávio César Maia Luz – President; Carlos Eduardo de Mori Luporini and Guilherme
Tadeu Pereira Júnior – Councilors.
CARLOS HENRIQUE PINTO HADDAD Investor Relations Officer

(A free translation from Portuguese into English of Interim Financial Information prepared in Brazilian currency in accordance with accounting practices adopted in Brazil and International Financial Reporting Standards (IFRS), issued by International Accounting Standards Board – IASB) and consistently with the standards issued by the Brazilian Securities Commissions (CVM). Report on review of quarterly information To the Shareholders, Board of Directors and Officers of Duratex S.A. São Paulo - SP Introduction We reviewed the accompanying individual and consolidated interim financial information of Duratex S.A. and its subsidiaries (“the Company”), included in the Quarterly Information Form (ITR) for the quarter ended June 30, 2018, which comprise the balance sheet as of June 30, 2018, the related statement of profit or loss and comprehensive income for the three and six-month period then ended, and the statement of changes in equity and cash flows for the six month period then ended, including other explanatory information.
Management is responsible for the preparation of individual and consolidated interim financial
information in accordance with Accounting Pronouncement CPC 21 (R1) -– Demonstração
Intermediária (“CPC 21 (R1)”) and International Accounting Standard IAS 34 - Interim Financial
Reporting (“IAS 34”), issued by the International Accounting Standards Board (IASB), as well
as for the presentation of this information in a manner consistent with the standards issued by
the Brazilian Securities and Exchange Commission (CVM) applicable to the preparation of the
Quarterly Information Form (ITR). Our responsibility is to express a conclusion on this interim
financial information based on our review. Scope of review
We conducted our review in accordance with Brazilian and International Standards on Review
Engagements (NBC TR 2410 Revisão de Informações Intermediárias Executada pelo Auditor
da Entidade) and ISRE 2410 - Review of Interim Financial Information Performed by the
Independent Auditor of the Entity). A review of interim financial information consists of making
inquiries, primarily of persons responsible for financial and accounting matters, and applying
analytical and other review procedures. A review is substantially less in scope than an audit
conducted in accordance with Brazilian and International Standards on Auditing and
consequently does not enable us to obtain assurance that we would become aware of all
significant matters that might be identified in an audit. Accordingly, we do not express an audit
opinion.
Conclusion on the individual and consolidated interim financial information Based on our review, nothing has come to our attention that causes us to believe that the accompanying individual and consolidated interim financial information included in the quarterly
information referred to above is not prepared, in all material respects, in accordance with CPC
21 (R1) and IAS 34, applicable to the preparation of Quarterly Information Form (ITR),
consistently with the rules issued by the CVM. Other matters Statements of value added
We have also reviewed the individual and consolidated statements of value added for the six
month period ended June 30, 2018, prepared under the responsibility of the Company’s
management, the presentation of which in the interim financial information is required by rules
issued by the Brazilian Securities Commission (CVM) applicable to the preparation of Quarterly
Financial Information (ITR), and considered as supplementary information under IFRS -
International Financial Reporting Standards, which does not require the presentation of the
statement of value added. These statements have been subjected to the same review
procedures previously described and, based on our review, nothing has come to our attention that causes us to believe that they are not prepared, in all material respects, in accordance with
the overall individual and consolidated interim financial information.
São Paulo, August 01
st, 2018.
ERNST & YOUNG Auditores Independentes S.S. CRC-2SP034519/O-6 Drayton Teixeira de Melo Accountant CRC-1SP236947/O-3

1
Interim Financial Information Index on the second quarter of 2018 Management Report ................................................................................................................................................................. 02 Balance Sheet .......................................................................................................................................................................... 09 Statement of Income ................................................................................................................................................................ 10 Statement of Comprehensive Income ...................................................................................................................................... 11 Statement of Cash Flows …………………………...................................................................................................................... 12 Statement of Value Added ...................................................................................................................................................... 13 Statement of Changes in Stockholders’ Equity 2017 ............................................................................................................... 14 Statement of Changes in Stockholders’ Equity 2018 ............................................................................................................... 15 Note 1 – Operations ................................................................................................................................................................ 16 Note 2 – Basis of preparation and significant accounting practices…....................................................................................... 17 2.1 Accounting policies........................................................................................................................................................... 17 2.2 Consolidation of the interim financial information………..................................................................................................... 21 2.3 New accounting standards, amendments and interpretations.......................................................................................... 21 2.4 Presentation of segmented information............................................................................................................................ 21 Note 3 – Critical Accounting Judgments and Estimates............................................................................................................. 21 Note 4 – Financial Risk Management ....................................................................................................................................... 22 4.1 Financial Risk Factors ….................................................................................................................................................. 22 4.2 Capital Management ........................................................................................................................................................ 25 4.3 Fair Value Estimates ........................................................................................................................................................ 25 Note 5 – Cash and Cash Equivalents ….................................................................................................................................... 26 Note 6 –Securities………………….............................................................................................................................................. 26 Note 7 – Trade Accounts Receivable ........................................................................................................................................ 27 Note 8 – Inventories .................................................................................................................................................................. 28 Note 9 – Other Receivables ...................................................................................................................................................... 28 Note 10 – Recoverable Taxes and Contributions ..................................................................................................................... 28 Note 11 – Non-current assets available for sale........................................................................................................................ 29 Note 12 – Deferred Income Tax and Social Contribution …...................................................................................................... 29 Note 13 – Related Parties ......................................................................................................................................................... 31 Note 14 – Investments in Subsidiaries………………................................................................................................................... 33 Note 15 – Property, Plant and Equipment ................................................................................................................................. 35 Note 16 – Biological Assets (Forest Reserves) ......................................................................................................................... 36 Note 17 – Intangible Assets ...................................................................................................................................................... 38 Note 18 – Loans and Financing ............................................................................................................................................... 39 Note 19 – Accounts Payable ..................................................................................................................................................... 42 Note 20 –Taxes and contributions.............................................................................................................................................. 42 Note 21 – Contingencies............................................................................................................................................................ 43 Note 22 – Rural Leases …….................................................................................................................................................... 44 Note 23 – Stockholders’ Equity ................................................................................................................................................. 45 Note 24 – Insurance Coverage ................................................................................................................................................. 46 Note 25 – Net Sales Revenue ………........................................................................................................................................ 46 Note 26 – Expenses, by Nature ............................................................................................................................................... 47 Note 27 – Financial Income and Expenses ............................................................................................................................... 47 Note 28 – Other Operating Income (Expenses), Net ................................................................................................................ 48 Note 29 – Income Tax and Social Contribution …..................................................................................................................... 48 Note 30 – Stock Option Plan ..................................................................................................................................................... 48 Note 31 – Private Pension Plan ................................................................................................................................................ 49 Note 32 – Medical Assistance Plan “Post-Employment”………………………………………………………………………………. 50 Note 33 – Earnings Per Share .................................................................................................................................................. 50 Note 34 –Business Segments ................................................................................................................................................... 51 Note 35 – Subsequent events………………… .......................................................................................................................... 51

2
MANAGEMENT REPORT 2Q2018 MARKET AND BUSINESS SCENARIO The set of macroeconomic indicators suggests that the economy continues to recover. Nonetheless, the expectations indicate that the pace of this recovery is more gradual than at the beginning of the year, signaling a slower recovery than previously expected. During the second quarter of 2018, we noticed a pick up in the domestic activity levels due to the growth in demand and unemployment rates following a downward trend at a moderate pace. The performance of the quarter was negatively impacted by the halt in the transportation sector, which occurred in May. Our operations faced supply and shipping issues, which hampered the performance of all business divisions. This effect was partially offset in June. According to ABRAMAT, the deflated sales of the building materials industry dropped by 0.4% in the first half of 2018. This data was impacted by the effects of the truck drivers' strike; thus, the association maintains a positive expectation regarding the evolution of this indicator in the rest of the year, sustaining the growth estimate of 1.5% in 2018. Employment level in the sector continues to show a decreasing trend, with a decline of 1.2% year to date. In the wood panels industry, IBÁ recorded a 2% growth in the local demand for wood panels during the first half of 2018. The demand for MDP grew 4% in volumes and the demand for MDF increased 1%. In the foreign market, exports grew 9% compared to the first half of 2017. MDP's volumes in exports increased 19%, while the MDF volumes grew 2%. Despite the revised estimates, projections still point to a growth in GDP during 2018. The growth in household consumption and investments, coupled with continued monetary policy and a reduction in the level of unemployment may have a positive impact on our operations throughout the year. STRATEGIC MANAGEMENT AND INVESTMENTS Consolidated investments in the quarter amounted to BRL 115.3 million, mainly directed towards the sustaining of our operations. This amount consists of BRL 68.0 million for manufacturing maintenance and projects and BRL 47.3 million invested in the formation of biological assets. In the first half of the year, the total amount invested was BRL 196.6 million. The internal agenda, supported by the solid Duratex Management System, remains a daily priority. The slower than expected resumption of the economy will demand even more efforts to save costs, gain productivity, and efficiently manage working capital and investments, with the clear objective of reaching a better return on our capital. In 2018, we are stepping forward in an important stage of the Journey of Cultural Transformation, strengthening a new way of approaching our business. In order to stimulate a more results-oriented organizational culture, we are investing in innovation and digital technology to sustain the growth of our operations. As a result of a deep review of our asset base, we have implemented movements that will be material to improving the returns in our business. Earlier this year, we announced the transaction with Eucatex for the sale of machinery and equipment dedicated to the production of hardboard, which remains under analysis by CADE for its effective conclusion. In addition, we have sold forest assets in the state of São Paulo to Suzano Papel e Celulose. This operation was completed at the beginning of July, with the exercise of the call option by Suzano. Finally, we dedicate part of our forests in the Triângulo Mineiro region to an association with the Austrian group Lenzing AG, through the constitution of a Joint Venture, to produce dissolving wood pulp. These initiatives ended a cycle of adjustments of surplus assets in the Wood Division, contributing to leverage the results without harmful effects in current operations.

3
Lastly, as a subsequent event, we announced in July 2018 an investment plan to expand production capacity in Ceramic Tiles. We have announced our debut in this industry through the acquisition of Ceusa in the second half of 2017 and this project shall increase market share and has the target of increasing margins and the return of this operation. It will be invested BRL 94 million in the years 2018 and 2019 to modernize the existing lines and build a new line, increasing production capacity by 83%. Therefore, the Ceramic Tiles operations will have annual production capacity of 11 million square meters after this project. We are positioning the Company in a strategic competitiveness level through financial deleveraging, management excellence, a renewed organizational culture and the definition of avenues for growth. CONSOLIDATED FINANCIAL RESULTS
(1) EBITDA (Earnings Before Interest, Tax, Depreciation and Amortization): Measure of operational performance in accordance with CVM Instruction 527/12.
(2) EBITDA adjusted for non-cash events arising from variation in the fair value of biological assets and combination of businesses, in addition to extraordinary events.
(3) For better understanding, the net revenue of BRL 57,072 related to the sale of timber to Suzano Papel e Celulose was excluded from the calculation of Adjusted and Recurring EBITDA margin.
(4) Current liquidity: Current Assets Divided by Current Liabilities. Indicates the amount available in BRL to cover each BRL of short-term obligations.
(5) Net Indebtedness: Total Financial Debt (–) Cash balance. (6) Financial leverage calculated on the rolling EBITDA over the last 12 months, adjusted for events of a purely
accounting and non-cash nature. (7) ROE (Return on Equity): measure of performance obtained by taking the annualized Net Earnings over the
period, annualized, and dividing by Average Net Equity. (8) Net earnings per share is calculated by dividing the earnings attributable to the company’s shareholders by the
average weighted number of ordinary shares issued during the period, excluding the ordinary shares held by the Treasury.
ADDED VALUE Value Added in the quarter totaled BRL 621.9 million. Of this amount, BRL 176.2 million, equivalent to 28.3% of total Added Value, was allocated to the federal, state and municipal governments in the form of taxes and contributions.
In BRL '000 2Q18 2Q17 % 1Q18 % 1H18 1H17 %
Highlights
Volume shipped Deca (‘000 items) 6.821 6.252 9,1% 6.268 8,8% 13.089 13.058 0,2%
Volume shipped Ceramic tiles (m2) 1.237.116 - - 1.261.123 -1,9% 2.498.239 - 0,0%
Volume shipped Wood (m3) 613.601 526.572 16,5% 600.697 2,1% 1.214.298 1.112.558 9,1%
Consolidated Net Revenue 1.167.477 916.724 27,4% 1.005.982 16,1% 2.173.459 1.868.713 16,3%
Gross profit 309.858 245.306 26,3% 274.318 13,0% 584.176 477.398 22,4%
Gross margin 26,5% 26,8% 27,3% 26,9% 25,5%
EBITDA according to CVM No. 527/12 (1) 501.521 218.639 129,4% 224.889 123,0% 726.410 411.507 76,5%
EBITDA Mg CVM No. 527/12 43,0% 23,9% 22,4% 33,4% 22,0%
Adjustments for non-cash events (28.248) (40.542) -30,3% (42.761) -33,9% (71.009) (82.567) -14,0%
Non-recurring events (253.254) - - (253.254) (2.672) 9378,1%
Adjusted and Recurring EBITDA (2) 220.019 178.097 23,5% 182.128 20,8% 402.147 326.268 23,3%
Adjustred and Recurring EBITDA margin (3) 19,8% 19,4% 18,1% 19,0% 17,5%
Net income 166.584 24.767 572,6% 30.823 440,5% 197.407 17.253 1044,2%
Recurring net income 27.498 24.767 11,0% 30.823 -10,8% 58.321 15.489 276,5%
Recurring net margin 2,5% 2,7% 3,1% 2,8% 0,8%
INDICATORS
Current ratio(4) 2,86 2,30 24,4% 1,98 44,6% 2,86 2,30 24,4%
Net debt(5) 2.163.101 2.108.077 2,6% 2.216.066 -2,4% 2.163.101 2.108.077 2,6%
Net debt/EBITDA LTM(6) 2,59 2,89 -10,5% 2,79 -7,3% 2,59 2,89 -10,5%
Average Shareholder's equity 4.884.211 4.582.442 6,6% 4.743.865 3,0% 4.828.247 4.578.512 5,5%
ROE (7) 13,6% 2,2% 2,6% 8,2% 0,8%
Recurring ROE 2,3% 2,2% 2,6% 2,4% 0,7%
SHARES
Earnings per share (BRL) (8) 0,2415 0,0359 572,7% 0,0447 440,3% 0,2862 0,0250 1044,8%
Closing share price (BRL) 8,70 8,17 6,5% 11,85 -26,6% 8,70 8,17 6,5%
Net equity per share (BRL) 7,25 6,67 8,7% 6,92 4,7% 7,25 6,67 8,7%
Treasury Shares 2.410.659 2.485.759 -3,0% 2.478.659 -2,7% 2.410.659 2.485.759 -3,0%
Market Cap (BRL1.000) 5.997.552 5.631.571 6,5% 8.168.274 -26,6% 5.997.552 5.631.571 6,5%

4
OPERATIONS Wood
(1) EBITDA (Earnings Before Interest, Taxes, Depreciation and Amortization): Measure of operational performance
according to Instruction CVM527/12; (2) Non-recurring events: 2Q18: results from the sale of lands from Duratex Florestal (-) BRL 196.182; Results from
the sale of timber from Duratex Florestal in the transaction with Suzano Papel e Celulose (-) BRL 57.072; 1Q17: results from the sale of land from Duratex Florestal (-) BRL 2.672.
(3) For better understanding, the net revenue of BRL 57,072 related to the sale of timber to Suzano Papel e Celulose was excluded from the calculation of Adjusted and Recurring EBITDA margin.
The second quarter of 2018 was positive for the Wood Division, continuing the process of recovery in the main markets, in spite of the negative effects of the truck drivers' strike. We noted a growth in volumes sold and the profitability of operations, following the gradual pace of recovery. Net revenue for the quarter was BRL 747.5 million, up 32.6% over the previous year. The growth in the volume sold of wood panels was a result of a better level of local demand in the period, with an increase in market share and an increase in exports. In addition, there were important forest sales in the quarter, which also contributed to this growth. In the first tranche of the operation with Suzano Papel e Celulose, accounted in this quarter, approximately BRL 60.0 million of timber was sold. Moreover, there was also a sale of timber to other customers around BRL 20.0 million above the average level in other quarters. In relation to the second quarter of last year, we had a higher concentration of lower value-added products goods in the composition of the product mix as a consequence of the market recovery in the furniture manufacturing chain. On the other hand, we noticed a better performance in the wood panel retail sector compared to the first quarter of that year, resulting in a slightly better mix than at the beginning of the year. In the Division's cost structure, we had a concentration of planned shutdowns to maintenance in the first half of this year. In addition, we noted an increase in the cost of the main commodities, both for price hikes and for the depreciation of the Brazilian Real. The adjusted and recurring EBITDA for the quarter was 163.3 million, with an EBITDA margin of 23.7%. It is worth mentioning that the recurring EBITDA and the respective margin disregard the sale of land and forests to Suzano Papel e Celulose. This result was also benefited by FX effect in the consolidation of Colombia's results, due to the appreciation of the Colombian Peso in relation to the Brazilian Real in the period.
HIGHTLIGHTS 2Q18 2Q17 % 1Q18 % 1H18 1H17 %
SHIPMENTS (IN M³)
STANDARD 357.601 294.887 21,3% 356.428 0,3% 714.029 608.343 17,4%
COATED 256.000 231.685 10,5% 244.269 4,8% 500.269 504.215 -0,8%
TOTAL 613.601 526.572 16,5% 600.697 2,1% 1.214.298 1.112.558 9,1%
FINANCIAL HIGHLIGHTS (BRL 1,000)
NET REVENUE 747.488 563.536 32,6% 628.103 19,0% 1.375.591 1.172.462 17,3%
DOMESTIC MARKET 535.494 417.654 28,2% 468.729 14,2% 1.004.223 888.575 13,0%
FOREIGN MARKET 211.994 145.882 45,3% 159.374 33,0% 371.368 283.887 30,8%
Net revenue per unit (BRL/m3 shipped) 1125,19 1070,20 5,1% 1045,62 7,6% 1085,83 1053,84 3,0%
cash cost per unit (BRL/m3 shipped) (679,82) (711,19) -4,4% (662,03) 2,7% (671,02) (710,95) -5,6%
Gross profit 189.769 129.925 46,1% 169.448 12,0% 359.217 255.805 40,4%
Gross margin 25,4% 23,1% - 27,0% - 26,1% 21,8% -
Selling expenses (93.811) (86.805) 8,1% (89.263) 5,1% (183.074) (175.001) 4,6%
General and administrative expenses (22.014) (18.403) 19,6% (18.026) 22,1% (40.040) (37.566) 6,6%
Operating profit before financial results 268.212 35.305 659,7% 57.751 364,4% 325.963 55.170 490,8%
Depreciation, amortization and depletion 113.075 77.291 46,3% 79.554 42,1% 192.629 159.196 21,0%
Depletion tranche of biological assets 64.134 27.385 134,2% 31.146 105,9% 95.280 61.463 55,0%
EBITDA according to CVM No. 527/12 (1) 445.421 139.981 218,2% 168.451 164,4% 613.872 275.829 122,6%
EBITDA margin according to CVM No. 527/12 59,6% 24,8% - 26,8% - 44,6% 23,5% -
Variation in fair value of biological assets (29.271) (38.582) -24,1% (42.579) -31,3% (71.850) (81.303) -11,6%
Employee benefits 419 (743) -156,4% 458 -8,5% 877 398 120,4%
Non Recurring events (2) (253.254) - - - - (253.254) (2.672) 9378,1%
Adjusted and Recurring EBITDA 163.315 100.656 62,3% 126.330 29,3% 289.645 192.252 50,7%
Adjusted and Recurring EBITDA margin (3) 23,7% 17,9% - 20,1% - 21,1% 16,4% -

5
We remain aiming attention at sustaining a commercial policy that focus on margins, without giving up our market share. Supported by the Duratex Management System and an efficient productivity management, we expect to continue the positive trend of profitability in the Wood Division. Deca
(1) EBITDA (Earnings Before Interest, Taxes, Depreciation and Amortization): Measure of operational performance
according to Instruction CVM527/12.
In spite of the still challenging scenario of the civil construction, the volumes shipped in the Deca showed a growth of approximately 9% in relation to the periods of comparison. Demand from new homes remained depressed; thus, the retail channel continued to be driver of demand for building materials in the period. In basic goods, we presented an increase of 14.2% compared to the same period of last year, in contrast to the 6.3% decrease compared to the previous quarter. Deca’s net revenue was BRL 374.3 million in the quarter, driven by the higher volume sold. This result represents a growth of 6.0% in relation to 2Q17 and 12.2% in relation to the first quarter of this year. The positive evolution of revenue signals the recovery compared to the negative scenario presented at the beginning of 2018. In relation to the same period last year, we noticed a deterioration of the mix of products sold in both Deca's three main businesses, with a concentration of sales of lower value-added goods. This change reflected a reduction of 2.9% in net revenue per unit. Compared to 1Q18, there was a greater increase in sales of electronic showers, stimulated by the seasonality of sales of this type of product. In addition, metals and ceramic sanitary ware showed a slight improvement in the mix of products sold compared to the previous quarter. Overall, costs continue to negatively pressure the results. The inflation of the raw materials in the Deca has been harmful to the profitability of the operations, with emphasis on the increase of the exchange rate and commodities costs. The initiatives within Duratex Management System partially offset this setback, but they were not sufficient to absorb all the worsening. We also noticed deterioration in industrial performance in the quarter, influenced mainly by the change of mix and instability in production. Adjusted and recurring EBITDA in the quarter was BRL 47.2 million, with an EBITDA margin of 12.6%. This performance was worse than the same period of last year, intensified by tax gains recorded at the time of around BRL 15.5 million. Compared to the first quarter of the year, there was an improvement of 3.3%.
HIGHLIGHTS 2Q18 2Q17 % 1Q18 % 1H18 1H17 %
SHIPMENTS (IN ‘000 ITEMS)
BASIC GOODS 1.851 1.621 14,2% 1.975 -6,3% 3.826 3.719 2,9%
FINISHING GOODS 4.970 4.631 7,3% 4.293 15,8% 9.263 9.339 -0,8%
TOTAL 6.821 6.252 9,1% 6.268 8,8% 13.089 13.058 0,2%
FINANCIAL HIGHLIGHTS (BRL1,000)
NET REVENUE 374.334 353.188 6,0% 333.534 12,2% 707.868 696.251 1,7%
DOMESTIC MARKET 351.696 338.835 3,8% 319.476 10,1% 671.172 671.016 0,0%
EXPORTS 22.638 14.353 57,7% 14.058 61,0% 36.696 25.235 45,4%
Net revenue per unit (BRL per item shipped) 54,88 56,49 -2,9% 53,21 3,1% 54,08 53,32 1,4%
Cash cost per unit (BRL per item shipped) (36,36) (34,12) 6,6% (35,50) 2,4% (35,95) (32,64) 10,1%
Gross profit 101.746 115.381 -11,8% 87.108 16,8% 188.854 221.593 -14,8%
Gross margin 27,2% 32,7% - 26,1% - 26,7% 31,8% -
Selling expenses (61.490) (66.199) -7,1% (53.913) 14,1% (115.403) (124.754) -7,5%
General and administrative expenses (18.722) (16.795) 11,5% (17.848) 4,9% (36.570) (32.368) 13,0%
Operating profit before financial results 17.591 50.789 -65,4% 17.864 -1,5% 35.455 80.731 -56,1%
Depreciation and amortization 28.980 27.869 4,0% 28.425 2,0% 57.405 54.947 4,5%
EBITDA according to CVM No. 527/12(1) 46.571 78.658 -40,8% 46.289 0,6% 92.860 135.678 -31,6%
EBITDA margin according to CVM No. 527/12 12,4% 22,3% - 13,9% - 13,1% 19,5% -
Employee benefits 604 (1.217) -149,6% (640) -194,4% (36) (1.662) -97,8%
Non-recurring events - - - - - - - -
Adjusted and Recurring EBITDA 47.175 77.441 -39,1% 45.649 3,3% 92.824 134.016 -30,7%
Adjusted and Recurring EBITDA margin 12,6% 21,9% - 13,7% - 13,1% 19,2% -

6
Despite the uncertainties regarding the resumption of the construction segment and, consequently, the demand for building materials, we are concentrating efforts to recover the margins and profitability of the operation for the rest of the year. We have structured a plan with a holistic approach to the reversal of this scenario, with emphasis on the implementation of a second price readjustment in the year, execution capacity at the point of sale, establishment of industrial initiatives aimed at improving the Division's operational performance and productivity gains, revaluation of fixed expenses and restructuring in the manufacturing areas at the end of the second quarter to make the hierarchy leaner and more agile. Ceramic Tiles
(1) EBITDA (Earnings Before Interest, Taxes, Depreciation and Amortization): Measure of operational performance
according to Instruction CVM527/12. Among the businesses that make up our portfolio of solutions, Ceusa was the largest affected by the transportation sector strike. Since the ceramic tiles operations are running with a high rate of capacity utilization, the stoppage directly affected the performance of the business. We recorded a slight reduction of volumes compared to 1Q18, down 1.9%, due entirely to the effects of the truck drivers’ strike. On the other hand, there was an improvement in the mix of products sold, partially offsetting the effects of volume reduction. Net revenue was BRL 45.7 million, an increase of 3.0% over the previous period. The worst dilution of fixed costs of the Ceramic Tiles Division had a direct impact on the performance of the quarter. Adjusted and recurring EBITDA was BRL 9.5 million, reflecting an EBITDA margin of 20.9%. This result was 6.1% lower than the one presented at the beginning of 2018. EBITDA totaled BRL 19.7 million in the six-month period, representing a margin of 21.9%, a benchmark in the ceramic tile industry.
HIGHLIGHTS 2Q18 1Q18 % 1H18
SHIPMENTS (IN M²)
FINISHING GOODS 1.237.116 1.261.123 -1,9% 2.498.239
TOTAL 1.237.116 1.261.123 -1,9% 2.498.239
FINANCIAL HIGHLIGHTS (BRL1,000)
NET REVENUE 45.655 44.345 3,0% 90.000
DOMESTIC MARKET 41.480 40.693 1,9% 82.173
EXPORTS 4.175 3.652 14,3% 7.827
Net revenue per unit (BRL per m² shipped) 36,90 35,16 5,0% 36,03
Cash cost per unit (BRL per m² shipped) (20,88) (19,95) 4,6% (20,41)
Gross profit 18.343 17.762 3,3% 36.105
Gross margin 40,2% 40,1% - 40,1%
Selling expenses (8.478) (7.377) 14,9% (15.855)
General and administrative expenses (1.817) (1.554) 16,9% (3.371)
Operating profit before financial results 8.002 8.698 -8,0% 16.700
Depreciation and amortization 1.527 1.451 5,2% 2.978
EBITDA according to CVM No. 527/12(1) 9.529 10.149 -6,1% 19.678
EBITDA margin according to CVM No. 527/12 20,9% 22,9% - 21,9%
Employee benefits - - -
Non-recurring events - - - -
Adjusted and Recurring EBITDA 9.529 10.149 -6,1% 19.678
Adjusted and Recurring EBITDA margin 20,9% 22,9% 21,9%

7
We expect a slight improvement over the result presented in this quarter for the rest of the year, including the total recovery of volumes not shipped at the strike. In the Ceramic Tiles Division, we remain focused on integrating our businesses and constantly improving the mix of products sold. CAPITAL MARKETS AND CORPORATE GOVERNANCE In the end of the second quarter of 2018, the market cap was equivalent to BRL 5,997.6 million as a result of a final share price of BRL 8.70. During this period, there were 309,251 trades with our shares in the spot market of B3. It represented a trading volume of BRL 1,246.9 million or an average daily trading volume of BRL 19.8 million. Our shares are listed on the Novo Mercado, a segment of B3 that brings together companies with the highest corporate governance standards. We also have a differentiated dividend distribution policy, with a payout ratio equivalent to 30% of adjusted net income. Lastly, we adhered to the Abrasca Code of Self-Regulation and Good Practices of Publicly-held Companies. SOCIAL AND ENVIRONMENTAL RESPONSABILITY The headcount showed a slight increase compared to the previous quarter, ending the period with 11,450 employees. In the comparison of the quarters, we presented a reduction in the workforce in spite of the incorporation of Ceusa employees, acquired in October 2017.
In April, we launched the project "Proteger e Sorrir em Rede" in partnership with Childhood Brasil, which aims to contribute to the reduction of sexual violence against children and adolescents in Brazil. As a first step in the initiative, stakeholders were gathered around the Deca Louças unit in João Pessoa, Paraíba, to develop a methodology to help companies in the region identify and curb cases of sexual violence against children and adolescents. In the next steps of this work, Duratex will host, in the third quarter of 2018, a workshop to map the activities already carried out by the local communities for the protection of children and adolescents, regarding the care, prevention and diagnosis of situations of violence against this public. Duratex launched in June a pilot project, through the brand Hydra, in which it encourages its consumers to return used electric showers for proper disposal. It was an unprecedented initiative in this industry and foreseen in the Sustainability Strategy 2025. The initiative covers the metropolitan region of São Paulo, in addition to the city of Sorocaba, and was developed in partnership with the network of building materials stores Leroy Merlin and the company Sinctronics, which operates systems for the collection and reuse of electronic components. INDEPENDENT AUDITORS – CVM INSTRUCTION Nº 381 Procedures adopted by the Company and its subsidiaries The Company's and its subsidiaries' policy of contracting services not related to external auditing with our independent auditors is based on internationally accepted principles that preserve the independence of these auditors and consist of: (a) the auditor should not audit their own work (b) the auditor should not perform managerial duties on his client and (c) the auditor should not promote the interests of his client.
(BRL'000) 2Q18 2Q17 % 1Q18 % 1H18 1H17 %
Employees (quantity) 11.450 11.510 -0,5% 11.437 0,1% 11.450 11.510 -0,5%
Remuneration 112.885 106.925 5,6% 109.882 2,7% 222.767 209.657 6,3%
Obligatory legal charges 60.411 58.504 3,3% 52.542 15,0% 112.953 108.423 4,2%
Differentiated benefits 28.741 26.333 9,1% 26.644 7,9% 55.385 51.953 6,6%
8
In the period from January to June 2018, the independent auditors Ernst & Young Auditores Independentes S.S. provided the following services not related to external auditing:
Review of accounting and tax accounting records - ECF, date of hiring on May 16, 2018, for the total amount of BRL 0.105 million.
The amount represents 5.2% of the total audit fees for the 2018 financial statements. Explanation from the Independent Auditors - Ernst & Young Auditores Independentes S.S. The professional services described above do not affect the independence or the objectivity in conducting the external audit examinations provided to the Company and its subsidiaries. The policy of providing the Company and its subsidiaries in services not related to external auditing is based on the principles that preserve the independence of the Independent Auditor and all the services are in compliance with this policy. ACKNOWLEDGEMENTS We are grateful for all the support received from shareholders, the dedication and commitment of our employees, the partnerships we have with our suppliers and the confidence placed on us by our clients and consumers.
The Management

ASSETS LIABILITIES AND STOCKHOLDERS' EQUITY
06/30/2018 12/31/2017 06/30/2018 12/31/2017 06/30/2018 12/31/2017 06/30/2018 12/31/2017
CURRENT ASSETS Note 1,980,419 2,022,042 3,313,163 3,023,458 CURRENT LIABILITIES Note 885,532 1,219,308 1,159,729 1,551,576
Cash and cash equivalents 5 287,296 402,698 826,516 1,074,364 Loans and financing 18 373,870 696,882 447,545 764,824
Securities 6 - 57,292 - - Suppliers 272,987 216,040 358,737 296,372
Trade accounts receivable 7 713,488 765,188 971,535 932,917 Related parties suppliers 13 24,079 22,958 - -
Related parties accounts receivable 7 97,240 53,307 40,949 35,146 Personnel 99,488 95,538 125,227 119,037
Inventories 8 696,747 614,843 876,314 760,093 Accounts payable 19 85,202 92,311 155,051 163,704
Other receivables 9 30,733 25,915 185,224 63,529 Related parties accounts payable 13 2,050 2,050 2,640 2,640
Recoverable taxes and contributions 10 104,152 87,955 162,565 138,878 Taxes and contributions 20 27,583 32,390 70,097 143,726
Other credits 13,473 9,336 18,313 13,023 Dividends and interest on capital 273 61,139 432 61,273
Non current assets available for sale 11 37,290 5,508 231,747 5,508
NON-CURRENT ASSETS 5,928,680 5,753,996 6,174,728 6,442,116 NON-CURRENT LIABILITIES 2,027,862 1,841,365 3,331,152 3,197,679
Restricted deposits 49,952 48,183 53,982 51,343 Loans and financing 18 1,721,370 1,541,038 2,542,072 2,410,000
Other receivables 9 69,017 53,544 111,742 106,493 Contingencies 21 84,010 82,641 114,697 114,432
Pension plan credits 31 95,207 96,093 104,899 105,740 Deferred income tax and social contribution 12 166,365 162,331 481,815 483,338
Recoverable taxes and contributions 10 9,300 10,999 11,547 13,215 Accounts payable 19 50,993 49,206 185,968 181,989
Deferred income tax and social contribution 12 246,547 230,089 319,737 313,146 Related parties 13 5,124 6,149 6,600 7,920
Investments in subsidiaries and associates 14 2,653,704 2,397,310 5,588 6,260
Other investments 921 921 3,446 1,638
Property, plant and equipment 15 2,329,982 2,435,529 3,346,080 3,490,141 STOCKHOLDERS' EQUITY 23 4,995,705 4,715,365 4,997,010 4,716,319
Biological assets 16 - - 1,559,202 1,698,855 Capital 1,970,189 1,970,189 1,970,189 1,970,189
Intangible assets 17 474,050 481,328 658,505 655,285 Costs on issue of shares (7,823) (7,823) (7,823) (7,823)
Capital reserves 346,564 345,300 346,564 345,300
Capital transactions with partners (18,731) (18,731) (18,731) (18,731)
Revaluation reserves 55,085 57,344 55,085 57,344
Revenue reserves 2,172,263 1,980,082 2,172,263 1,980,082
Treasury shares (27,087) (27,851) (27,087) (27,851)
Carrying value adjustments 505,245 416,855 505,245 416,855
Equity attributable to equity holders
of the parent company 4,995,705 4,715,365 4,995,705 4,715,365
Noncontrolling interests - - 1,305 954
TOTAL ASSETS 7,909,099 7,776,038 9,487,891 9,465,574 TOTAL LIABILITIES AND STOCKHOLDERS' EQUITY 7,909,099 7,776,038 9,487,891 9,465,574
(A free translation of the original in Portuguese)
Duratex S.A. - Listed companyNational Register of Corporate Taxpayers - (CNPJ) No. 97.837.181/0001-47
BALANCE SHEET
PARENT COMPANY CONSOLIDATED PARENT COMPANY CONSOLIDATED
(In thousands of Reais)
9

Note 06/30/2018 06/30/2017 06/30/2018 06/30/2017
NET SALES REVENUE 25 1,660,256 1,551,097 2,173,459 1,868,713
Variations in the fair value of biological assets 16 - - 71,850 81,303
Cost of products sold (1,319,049) (1,284,893) (1,661,133) (1,472,618)
GROSS PROFIT 341,207 266,204 584,176 477,398
Selling expenses (248,810) (244,027) (314,332) (299,755)
General and administrative expenses (54,315) (51,861) (79,981) (69,934)
Management fees (7,658) (7,293) (8,252) (7,683)
Other operating income (expenses), net 28 (8,796) 31,181 196,507 35,875
Equity in the results of investees 229,509 83,603 - -
OPERATING PROFIT BEFOREFINANCIAL RESULT AND TAXES 251,137 77,807 378,118 135,901
Financial income 27 39,142 36,566 58,039 86,268
Financial expenses 27 (107,675) (128,542) (149,858) (208,186)
PROFIT (LOSS) BEFORE INCOME TAX ANDSOCIAL CONTRIBUTION 182,604 (14,169) 286,299 13,983
Income tax and social contribution - current 29 (1,142) - (114,883) (24,687)
Income tax and social contribution - deferred 29 15,857 31,370 25,991 27,957
NET INCOME FOR THE PERIOD 197,319 17,201 197,407 17,253
Net income attributable to:
Owners of the company 197,319 17,201 197,319 17,201
Noncontrolling interests - - 88 52
Net income per share (R$):
Basic: 33 0.2862 0.0250 0.2862 0.0250
Diluted: 33 0.2827 0.0246 0.2827 0.0246
Duratex S.A. - Listed companyNational Register of Corporate Taxpayers - (CNPJ) No. 97.837.181/0001-47
STATEMENT OF INCOME
PARENT COMPANY
(A free translation of the original in Portuguese)
CONSOLIDATED
10

(A free translation of the original in Portuguese)
Periods ended June 30
(In thousands of Reais)
06/30/2018 06/30/2017 06/30/2018 06/30/2017
NET INCOME FOR THE PERIOD 197,319 17,201 197,407 17,253
Other components of comprehensive income
Items that will not be reclassified for net income
Equity of investees on comprehensive of subsidiaries (162) - (162) (311)
Adjustments from CPC 47 and 48 transition (4,833) - (4,833) -
Equity of investees reflex on transition adjustments CPC 47 and 48 (2,048) - (2,048) -
Items that will be reclassified for net income
Accumulated conversion adjustments 88,390 7,971 88,722 7,998
COMPREHENSIVE INCOME FOR THE PERIOD, NET OF TAX 278,666 25,172 279,086 24,940
Attributable to:
Owners of the company 278,666 25,172 278,666 25,172
Noncontrolling interests - - 420 (232)
Duratex S.A. - Listed companyNational Register of Corporate Taxpayers - (CNPJ) No. 97.837.181/0001-47
STATEMENT OF COMPREHENSIVE INCOME
PARENT COMPANY CONSOLIDATED
11

(A free translation of the original in Portuguese)
06/30/2018 06/30/2017 06/30/2018 06/30/2017
OPERATING ACTIVITIES:
182,604 (14,169) 286,299 13,983
ADJUSTMENTS:
Depreciation, amortization and depletion 153,876 149,535 348,292 275,606
Variations in the fair value of biological assets - - (71,850) (81,303)
Interest, foreign exchange and monetary variations, net 77,519 122,849 113,790 192,145
Equity in the results of investees (229,509) (83,603) - -
Allowance for doubtful accounts 2,431 8,119 4,214 7,974
Provisions, disposal of assets 11,375 33,614 83,910 31,938
(Increase)/Decrease in Assets
Trade accounts receivable (1,249) (2,177) (47,764) (56,104)
Inventories (79,227) (69,065) (99,864) (78,587)
Other assets (41,455) (81,418) (290,378) (53,254)
Increase (Decrease) in Liabilities
Suppliers 58,068 60,019 54,590 75,108
Personnel liabilities 3,950 20,828 5,708 26,908
Accounts payable (6,838) (2,840) (21,407) (6,423)
Taxes and contributions (349) (7,238) (75,641) (54,642)
Other liabilities (3,804) (8,975) (7,373) (17,160)
Cash provided by operations 127,392 125,479 282,526 276,189
Income tax and social contribution paid (5,600) (4,257) (116,065) (11,638)
Interests paid (45,367) (72,525) (77,099) (126,894)
CASH PROVIDED BY OPERATING ACTIVITIES 76,425 48,697 89,362 137,657
INVESTMENT ACTIVITIES:
Securities 57,925 - - -
Investments in fixed assets (62,430) (73,016) (96,377) (94,750)
Investments in intangible assets (9,707) (3,742) (9,801) (3,768)
Investments in biological assets - - (90,412) (98,269)
Receipt by sale of property, plant and equipment - - 126,515 -
Dividends received from subsidiaries 199,999 250,000 - -
Advance for future capital increase in subsidiaries (144,762) (9,410) - -
CASH USED IN INVESTMENT ACTIVITIES 41,025 163,832 (70,075) (196,787) - - - -
FINANCING ACTIVITIES:
Financing 385,000 15,069 389,850 16,083
Amortization of financing (557,843) (308,383) (605,029) (332,174)
Interest on capital and dividends (60,773) (6,046) (60,773) (6,084)
Tresury shares 764 - 764 -
NET CASH FLOW FROM FINANCING ACTIVITIES (232,852) (299,360) (275,188) (322,175)
Exchange variations on cash and cash equivalents - - 8,053 470
INCREASE (DECREASE) IN CASH FOR THE PERIOD (115,402) (86,831) (247,848) (380,835)
OPENING BALANCE 402,698 361,923 1,074,364 1,416,360
FINAL BALANCE 287,296 275,092 826,516 1,035,525
Duratex S.A. - Listed company
National Register of Corporate Taxpayers - (CNPJ) No. 97.837.181/0001-47
STATEMENT OF CASH FLOWS
PARENT COMPANY CONSOLIDATED
PROFIT (LOSS) BEFORE INCOME TAX AND SOCIAL
CONTRIBUTION
12
(In thousands of Reais)
06/30/2018 06/30/2017 06/30/2018 06/30/2017
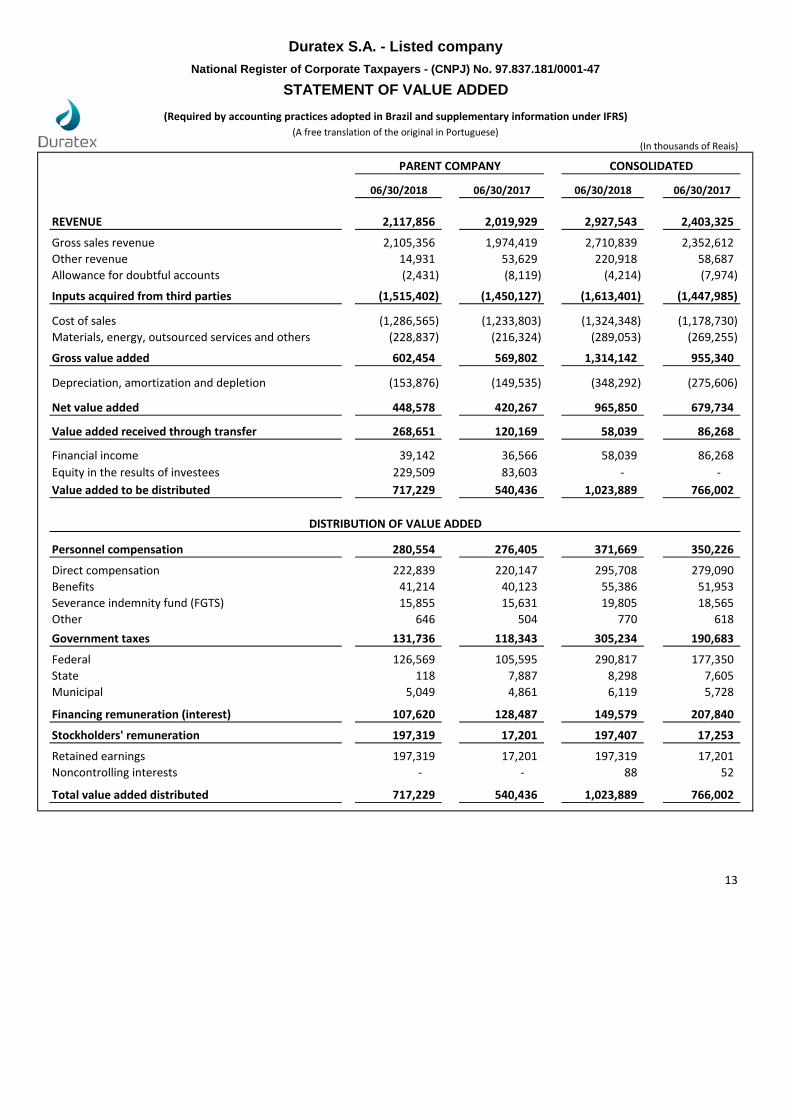
REVENUE 2,117,856 2,019,929 2,927,543 2,403,325
Gross sales revenue 2,105,356 1,974,419 2,710,839 2,352,612
Other revenue 14,931 53,629 220,918 58,687
Allowance for doubtful accounts (2,431) (8,119) (4,214) (7,974)
Inputs acquired from third parties (1,515,402) (1,450,127) (1,613,401) (1,447,985)
Cost of sales (1,286,565) (1,233,803) (1,324,348) (1,178,730)
Materials, energy, outsourced services and others (228,837) (216,324) (289,053) (269,255)
Gross value added 602,454 569,802 1,314,142 955,340
Depreciation, amortization and depletion (153,876) (149,535) (348,292) (275,606)
Net value added 448,578 420,267 965,850 679,734
Value added received through transfer 268,651 120,169 58,039 86,268
Financial income 39,142 36,566 58,039 86,268
Equity in the results of investees 229,509 83,603 - -
Value added to be distributed 717,229 540,436 1,023,889 766,002
Personnel compensation 280,554 276,405 371,669 350,226
Direct compensation 222,839 220,147 295,708 279,090
Benefits 41,214 40,123 55,386 51,953
Severance indemnity fund (FGTS) 15,855 15,631 19,805 18,565
Other 646 504 770 618
Government taxes 131,736 118,343 305,234 190,683
Federal 126,569 105,595 290,817 177,350
State 118 7,887 8,298 7,605
Municipal 5,049 4,861 6,119 5,728
Financing remuneration (interest) 107,620 128,487 149,579 207,840
Stockholders' remuneration 197,319 17,201 197,407 17,253
Retained earnings 197,319 17,201 197,319 17,201
Noncontrolling interests - - 88 52 - - - -
Total value added distributed 717,229 540,436 1,023,889 766,002
13
DISTRIBUTION OF VALUE ADDED
Duratex S.A. - Listed company
National Register of Corporate Taxpayers - (CNPJ) No. 97.837.181/0001-47
STATEMENT OF VALUE ADDED
(Required by accounting practices adopted in Brazil and supplementary information under IFRS)
PARENT COMPANY CONSOLIDATED
(A free translation of the original in Portuguese)

(In thousands of Reais) (A free translation of the original in Portuguese)
BALANCES AS AT DECEMBER 31, 2016 1,970,189 (7,823) 342,212 (18,731) 60,903 1,852,527 398,161 (27,931) - 4,569,507 1,145 4,570,652
COMPREHENSIVE INCOME FOR THE YEAR
Net Income for the year - - - - - - - - 184,875 184,875 140 185,015
Accumulated conversion adjustments - - - - - - 19,999 - - 19,999 206 20,205
Actuarial net gain (loss) - - - - - - (1,305) - - (1,305) - (1,305)
TOTAL COMPREHENSIVE INCOME FOR THE YEAR - - - - - - 18,694 - 184,875 203,569 346 203,915
Noncontrolling interest acquisition - - - - - - - - - - (246) (246)
Ceusa acquisition - non controlling interest - - - - - - - - - - (291) (291)
Share options granted - - 3,088 - - - - - - 3,088 - 3,088
Realization of revaluation reserve - - - - (3,559) - - - 3,559 - - -
Sale of treasury shares - - - - - - - 80 (39) 41 - 41
Interests on capital - - - - - - - - (60,840) (60,840) - (60,840)
APPROPRIATION OF NET INCOME FOR THE YEAR - - - - - - - - - - - -
Allocated to the legal reserve - - - - - 9,244 - - (9,244) - - -
Appropriation of tax incentives article 195-A Law 6.404/76 - - - - - 26,786 - - (26,786) - - -
Appropriation to reserves - - - - - 91,525 - - (91,525) - - -
BALANCES AS AT DECEMBER 31, 2017 1,970,189 (7,823) 345,300 (18,731) 57,344 1,980,082 416,855 (27,851) - 4,715,365 954 4,716,319
14
Total
Stockholders'
equity
Duratex S.A - Listed company
STATEMENT OF CHANGES IN STOCKHOLDERS' EQUITYNational Register of Corporate Taxpayers - (CNPJ) No. 97.837.181/0001-47
Note CapitalCosts on issue
of sharesCapital reserves
Revaluation
reserves
Capital
transactions
with partners
Revenue
reserves
Carrying value
adjustments
Treasury
shares
Retained
earningsTotal
Noncontrolling
interests

(In thousands of Reais) (A free translation of the original in Portuguese)
BALANCES AS AT DECEMBER 31, 2017 1,970,189 (7,823) 345,300 (18,731) 57,344 1,980,082 416,855 (27,851) - 4,715,365 954 4,716,319
COMPREHENSIVE INCOME FOR THE PERIOD
Net Income for the period - - - - - - - - 197,319 197,319 88 197,407
Accumulated conversion adjustments - - - - - - 88,390 - - 88,390 332 88,722
Equity of investees reflex - - - - - - - - (162) (162) - (162)
Transition adjustments CPC 47 and 48 - - - - - - - - (4,833) (4,833) - (4,833)
Equity of investees reflex on CPC 47 and 48 - - - - - - - - (2,048) (2,048) - (2,048)
TOTAL COMPREHENSIVE INCOME FOR THE PERIOD - - - - - - 88,390 - 190,276 278,666 420 279,086
Noncontrolling interest acquisition - - - - - - - - - - (69) (69)
Share options granted - - 1,264 - - - - - - 1,264 - 1,264
Sale of treasury shares - - - - - - - 764 (354) 410 - 410
Realization of revaluation reserve - - - - (2,259) - - - 2,259 - - -
APPROPRIATION OF NET INCOME FOR THE PERIOD
Allocated to the legal reserve - - - - - 9,866 - - (9,866) - - -
Appropriation to reserves - - - - - 182,315 - - (182,315) - - -
BALANCES AS AT JUNE 30, 2018 1,970,189 (7,823) 346,564 (18,731) 55,085 2,172,263 505,245 (27,087) - 4,995,705 1,305 4,997,010
15
Total
Stockholders'
equity
Duratex S.A - Listed company
STATEMENT OF CHANGES IN STOCKHOLDERS' EQUITYNational Register of Corporate Taxpayers - (CNPJ) No. 97.837.181/0001-47
Note CapitalCosts on issue
of sharesCapital reserves
Revaluation
reserves
Capital
transactions
with partners
Revenue
reserves
Carrying value
adjustments
Treasury
shares
Retained
earningsTotal
Noncontrolling
interests

Interim Financial Information of Duratex S.A. and its subsidiaries as at June 30, 2018.
16
NOTES TO THE INTERIM FINANCIAL INFORMATION AS AT JUNE 30, 2018
(All amounts in thousands of Brazilian Reais, unless otherwise indicated)
Note 1 – Operations a) General information Duratex S.A. (“the Company”) is a publicly-traded corporation headquartered in the city of São Paulo, SP, Brazil. Its controlling stockholders are Itaúsa - Investimentos Itaú S.A., which has significant operations in the financial and industrial sectors, and Companhia Ligna de Investimentos, which operates principally in the retail market and distribution of civil construction and woodworking materials, and in property construction and rental. The main activities of Duratex and its subsidiaries (collectively “Group”) comprise the manufacture of wood panels (Wood Division), and ceramics, sanitary metals and showers (Deca Division) and Ceramic Tiles Division. Duratex presently has seventeen industrial plants in Brazil and three industrial plants in Colombia, through of its subsidiary Duratex S.A. (current name of Tablemac S.A.), maintaining branches in the main Brazilian cities and commercial subsidiaries in the United States, Belgium and Peru. The Wood Division operates five industrial plants in the country and three in Colombia, responsible for the production of hardboard, medium density particle (MDP) panels, medium and high density fiberboard (MDF and HDF) panels, laminate flooring of Durafloor trademark and semi-finished components for furnitures. The Deca Division operates with ten industrial plants in the country, responsible for the production of sanitary ceramic, metal products, showers and ceramic tiles under the trademarks Deca, Hydra, Belize, Elizabeth and Hydra Corona. The Ceramic Tiles Division operates with two industrial plants in the country, responsible by production of ceramic tiles, with the brand Ceusa. b) Celebration’s agreement with Austrian group LENZING On June 21, 2018, the Company celebrated with LENZING AG, Austrian group world leader in the cellulosic fiber production, an agreement to establish a joint venture for production and commercialization of dissolving wood pulp (type viscose). Duratex will participate with 49% and Lenzing with 51% from the New Company. The results of the New Company will be recognized in the Duratex’s results by equity in the results of investees. Besides establishing the joint venture’s governance, the Agreement also assures the sale of the totality of dissolving wood pulp production to Lenzing, in the standard market condition will be strategically located in the state of Minas Gerais, within the Triângulo Mineiro region, close to São Paulo. The annual capacity of this project might be 450,000 tons of dissolving wood pulp and the initial estimated investment will be approximately USD 1.0 billion. The investment by Duratex in the New Company’s capital will be 43 thousand hectares of eucalyptus forests that it holds in the region, in addition to cash disbursements. The New Company will have its’ own capital structure, and it will fund part of the investment in order to optimize its cost of capital. The Agreement will not affect Duratex’s capacity to supply its wood panel business, nor does it affect the costs of its operations of own timber, at the same time it will optimize its forest assets which are currently idle, thus improving the returns of its recurring operations and will diversify the Company’s risk exposure as it broadens the Company’s range of activities to include the dissolving wood pulp market, which has lower exposure to Brazilian domestic activity. The final decision relating to the implementation of the project will occur in the 2nd semester 2019 and the beginning of the production is planned to 2022. There are no accounting impacts relating to this transaction on 2nd quarter 2018.

Interim Financial Information of Duratex S.A. and its subsidiaries as at June 30, 2018.
17
c) Approval of Interim financial information The issuance of interim financial information of Duratex S.A. and its subsidiaries (Parent company and Consolidated) was approved by the Board of Directors on August 01, 2018. Note 2 – Basis of preparation and significant accounting practices The interim financial information has been prepared in accordance with technical pronouncement nº 21 R1 - Interim Reporting, issued by the Brazilian Accounting Pronouncements Committee (CPC) as well as in accordance with International Accounting Standard (IAS) nº 34 – “Interim Financial Reporting”, issued by the International Accounting Standards Board (IASB) and presented consistently with the standards issued by Brazilian Securities Commission (CVM), applicable to interim financial information. As described in Circular Letter CVM/SNC/SEP n° 03/2011, the Company has opted to present the explanatory notes in these interim financial information in a summarized manner when the information is the same as that presented in the annual financial statements. Thus this interim financial information should be read in conjunction with the annual financial statements ended December 31, 2017, which were disclosed on February 05, 2018. The non-financial data included in this interim financial information, such as planted area and number of units, and others, have not been subject of audit or revision by our independent auditors. 2.1 - Accounting policies 2.1.1. Main changes in the accounting policies
In exception to described below, the accounting policies applied in these interim financial information are the same as applied in the consolidated financial statements from the Group in the year ended on December 31, 2017. The Group adopted initially the CPC 47/ IFRS 15 – Revenues from contracts with customers (vide a) and the CPC 48/ IFRS 9 – Financial Instruments (vide b) from January 1, 2018. The effect of the initial application of these standards is attributed mainly: - Adequacy in the recognition of sales deduction by bonuses given to the customers by
attainment of purchases volumes of products;
- Increase in the losses by impairment recognized as financial assets.
Effect on transition
on January 1, 2018 47/IFRS 15 48/IFRS 9 Total
Asset
Accounts receivable from customers - (5,001) (5,001)
Non-current assets
Deferred income tax and social contribution 1,844 1,700 3,544
Current liability
Accounts payable / provisions 5,424 - 5,424
Stockholders' equity
Retained earnings (3,580) (3,301) (6,881)
New CPCs

Interim Financial Information of Duratex S.A. and its subsidiaries as at June 30, 2018.
18
a) CPC 47/ IFRS 15 Revenues from contracts with customers The CPC 47/ IFRS 15 establish a model of five steps for record of revenues from contracts of customers. The revenue is recognized by an amount that reflects the counterpart that the entity expects to have rights in return of transfer of goods or services for a customer. This standard replaces CPC 30/ IAS 18 – Revenues, the CPC 17/ IAS 11 Construction contracts and related interpretations. The Group adopted CPC 47/ IFRS 15 using cumulative method with effect of adoption of the standard recognized in the initial application date on January 1, 2018. Consequently, the information presented for 2017 was not resubmitted and, of this form, was presented in accordance to early reported in according with CPC 30/ IAS 18 and related interpretations. Sales of goods For contracts with clients in that generally expects that sale of products being the only obligation of execution, the adoption of CPC 47 didn’t impact the revenue and results from the Group, once the revenue is recognized in the moment that the control of the good is transferred for the customer in the delivery of the goods. After analysis of contracts with customers, we verified the necessity of adjustments in the recognition of deductions from sales by bonuses given to the customers by attainment of purchases volume of products. The following table resumes the impact, net of taxes, of CPC 47/ IFRS 15 transition on retained earnings on January, 1 2018.
Asset
Deferred income tax and
social contribution 1,844
Liability
Accounts payable 5,424
Stockholders' equity
Retained earnings (3,580) The following tables resume the impact from adoption of CPC 47/ IFRS 15 in the interim balance sheet consolidated on June 30, 2018, interim statement of income and statement of comprehensive income consolidated.

Interim Financial Information of Duratex S.A. and its subsidiaries as at June 30, 2018.
19
Impact in the Interim Balance Sheet Consolidated
01/01/2018 06/30/2018
Asset Transition Posterior
Current asset 3,313,163 3,313,163
Deferred income tax and social contribution 319,737 (1,844) (109) 317,784
Other non current assets 5,854,991 - - 5,854,991
Non-current asset 6,174,728 (1,844) (109) 6,172,775
Total asset 9,487,891 (1,844) (109) 9,485,938
Liability
Accounts payable / provisions 155,051 (5,424) (322) 149,305
Other current liability 1,004,678 - - 1,004,678
Current liability 1,159,729 (5,424) (322) 1,153,983
Non-current liability 3,331,152 3,331,152
Stockholders' equity
Others accounts of stockholders' equity 4,807,652 - - 4,807,652
Retained earnings 189,358 3,580 213 193,151
Stockholders' equity 4,997,010 3,580 213 5,000,803
Total liability and stockholders'equity 9,487,891 (1,844) (109) 9,485,938
As Presented
Adjustments
No effect of CPC
47 / IFRS 15
Impact in the Interim Statement of Income and Statement of Comprehensive income Consolidated for the period of six months ended on June 30, 2018
As No effect of
Presented CPC 47 / IFRS 15
Net sales revenue 2,173,459 10,313 2,183,772
Variations in the fair value of biological assets 71,850 - 71,850
Cost of products sold (1,661,133) - (1,661,133)
Gross profit 584,176 10,313 594,489
Operacional expenses (206,058) - (206,058)
Operating profit before financial 378,118 10,313 388,431
Financial result (91,819) - (91,819)
Income before taxes 286,299 10,313 296,612
Income tax and social contribution (88,892) (3,506) (92,398)
Net income for period 197,407 6,807 204,214
Comprehensive income total 279,086 6,807 285,893
Adjustments
b) CPC 48/ IFRS 9 Financial Instruments The CPC 48/ IFRS 9 establish requirements for recognize and to measure financial assets and liabilities and some purchase contracts or sale of non-finance items. This standard replaces the CPC 38/ IAS 39 Financial Instruments: Recognition and measurement. The follow table resumes the impact, net of taxes, of transition for CPC 48/ IFRS 9 on retained earnings on January 1, 2018.

Interim Financial Information of Duratex S.A. and its subsidiaries as at June 30, 2018.
20
Asset
Accounts receivable from customers (5,001)
Deferred income tax and social
contribution 1,700
Stockholders' equity
Retained earnings (3,301) Classification and measurement of Financial Assets and Liabilities The CPC 48/ IFRS 9 hold in largely part the requirements existents in the CPC 38/ IAS 39 for classification and measurement of financial liabilities. However, eliminates the olds categories of CPC 38/ IAS 39 for financial assets: held until the maturity, loans and receivables and available for sale. The adoption of CPC 48/ IFRS 9 do not have significant effect in the accounting policies from the Group related to financial liabilities and financial instruments derivatives. The impact of CPC 48/ IFRS 9 in the classification and measurement of financial assets are described below. Impairment The adoption effect of CPC 48/ IFRS 9 on book values of financial assets refers to trade accounts receivable of customers and other receivables that were classified in the category of loans and receivables in accordance to CPC 38/IFRS 39 and are currently classified to the amortized cost. An increase of R$ 5,001 in the provision for impairment of these receivables were recognized in the initial balance of retained earnings on January 1, 2018 in the transition for CPC 48/ IFRS 9. Accounting of Hedge Once CPC 48/ IFRS 9 not changed the general principles of how an entity record effectives hedges, the application of requirements do not have impact in the financial statements from the Group. The follow table and the notes below explain the original categories of measurement in the CPC 48/ IAS 39 and new categories of measurement of CPC 48/ IFRS9 for each class of financial assets from the Group on January 1, 2018.
New Original value New value
Classification Classification according with effect of
CPC 38/IAS 39 CPC 48/IFRS 9 CPC 38 / IAS 39 CPC 48 / IFRS 9
Financial assets
800,786 800,786
988,429 983,428
Accounts receivable
and other receivables
Loans and
receivables
Loans and
receivables
Amortized cost
Amortized cost
Cash and cash
equivalents
2.1.2 Going concern The Management evaluated the Company and its subsidiaries capacity to continue in normally operating and is convinced that has resources to give continually in its business in the future. Additionally, the Management doesn’t have knowledge of any material uncertainty that can generate significate doubts about its capacity to continue operating. So, these interim financial information were prepared based on the presupposed of continuity.

Interim Financial Information of Duratex S.A. and its subsidiaries as at June 30, 2018.
21
2.2 - Consolidation of the interim financial information The interim financial information includes the companies: Duratex S.A. and its direct subsidiaries: Duratex Florestal Ltda., Hydra Corona Sistemas de Aquecimento de Água Ltda., Cerâmica Urussanga S.A. (Ceusa), Estrela do Sul Participações Ltda., Duratex Empreendimentos Ltda., Bale Comércio de Produtos para Construção S.A., Pescara Administração e Participações S.A., Trento Administração e Participações S.A., Duratex Europe N.V., Duratex Andina S.A.C. and its indirect subsidiaries: Duratex North America Inc., Duratex Belgium N.V., Duratex S.A. (current name of Tablemac S.A.), Tablemac MDF S.A.S and Forestal Rio Grande S.A.S.. 2.2.1 – Transactions with and participation in non-controlling entities For acquisitions of non-controlling ownership interests, the difference between any consideration paid and the acquired portion of the controlling stockholder's net assets are recorded in stockholders’ equity (on capital transactions with partners), as along with the gains or losses on sales to non-controlling stockholders. 2.3 – New accounting standards, amendments and interpretations IFRS 16 - Leases, which replaces IAS 17, unifying the accounting treatment of operating and finance leases for the similar model to financial leasing with impact on fixed asset and financial liability. This standard will effective on January 1st, 2019 and the Group is evaluating the content and the possible impacts of the adoption of this pronouncement. As at disclosure date of this interim financial information, these works do not have concluded, impossible the disclosure of any possible effect that can come from application of these new normative. There are no other standards and interpretations issued and not yet adopted that, in Management's opinion, can have a significant impact on the results or stockholders’ equity disclosed by the Group. 2.4 – Presentation of segmented information Segmented information is presented consistently with the main operating decision maker. The main operating decision maker, responsible for allocating funds and evaluating the performance of operating segments, is the Company's Board of Directors, which is in charge of the Group's strategic decision making, with the support of the Supervisory Board. Note 3 – Critical accounting judgments and estimates During the preparation of the interim financial information, accounting judgments, estimates and assumptions are utilized to record the amounts of certain assets, liabilities and other transactions. The definition of estimates and accounting judgments adopted by Management were based on the information available on the date, based on experience of past events and forecasts of future events. The interim financial information includes several estimates, such as: useful lives of property plant and equipment items, the realization of deferred tax credits, the allowance for doubtful accounts, inventory losses, the evaluation of the fair value of biological assets, and provision for contingencies and impairment testing of goodwill, pension plan and health benefits, and others. The following are the main estimates and assumptions that entail a substantial risk with probability to causes adjustments in the book values of assets and liabilities:

Interim Financial Information of Duratex S.A. and its subsidiaries as at June 30, 2018.
22
a) Risk of variations in the fair value of biological assets The Group used several estimates to evaluate its forestry reserves in accordance with the methodology established by CPC 29/IAS 41 – “Biological asset and agriculture product”. These estimates were based on market references, and are subject to changes which could impact the interim financial statements. Specifically, a 5% reduction in standing wood prices would result in a reduction in the fair value of biological assets in order to R$ 55.9 million, net of tax effects. If the discount rate used were increased by 0.5%, this would result in a reduction in the fair value of biological assets of about R$ 10.0 million, net of tax effects. b) Estimated impairment of goodwill The Company and its subsidiaries test the goodwill on annual basis or if there is an indication any time that the goodwill may be impaired. The balance could be impacted by changes in the economic or market scenario. c) Pension plan and health benefits The current value of assets/ liabilities related to pension plans and health depends on a number of factors that are determined using actuarial calculations. These calculations involve a series of assumptions, including the discount rate and current market conditions. Any changes in these assumptions will affect the corresponding book values. d) Provision for contingencies The Group constitute provision for tax, labor, civil and social security contingencies, based on valuation of probability of loss that are made by legal advisors from the Company, the amounts are updated and believe that the constituted provisions as at closing date are sufficient for cover eventual losses with lawsuits and administrative in progress. e) Fair value of financial instruments When the fair value from financial assets and liabilities presented in the balance sheet cannot be obtained of market assets, are determined utilizing valuation techniques, including cash flow discounted method. The data for these methods is based in those practiced in the market, when it possible, however, when this does not viable, a determined level of judgement is required for establishes the fair value. The judgment includes considerations on used data, for example, risk of liquidity, risk of credit and volatility. Changes in the assumptions on these factors could affect the fair value presented of the financial instruments. Note 4 – Financial risk management 4.1 Financial risk factors The Group are exposed to market risk in relation to fluctuations of interest, exchange rates and credit. So, the risk manage follows the policies approved by Board of Directors, including monitoring by Audit and Management of Risk Committee. The Company and its subsidiaries have procedures to manage these situations and can use hedging instruments to reduce the impact of the risks. These procedures include monitoring the level of exposure to each market risk, in addition to establish limits for the respective decision-making. All hedging transactions entered into by the Group are intended to protect its debts and investments. The Group does not utilize any leveraged financial derivatives.
Interim Financial Information of Duratex S.A. and its subsidiaries as at June 30, 2018.
23
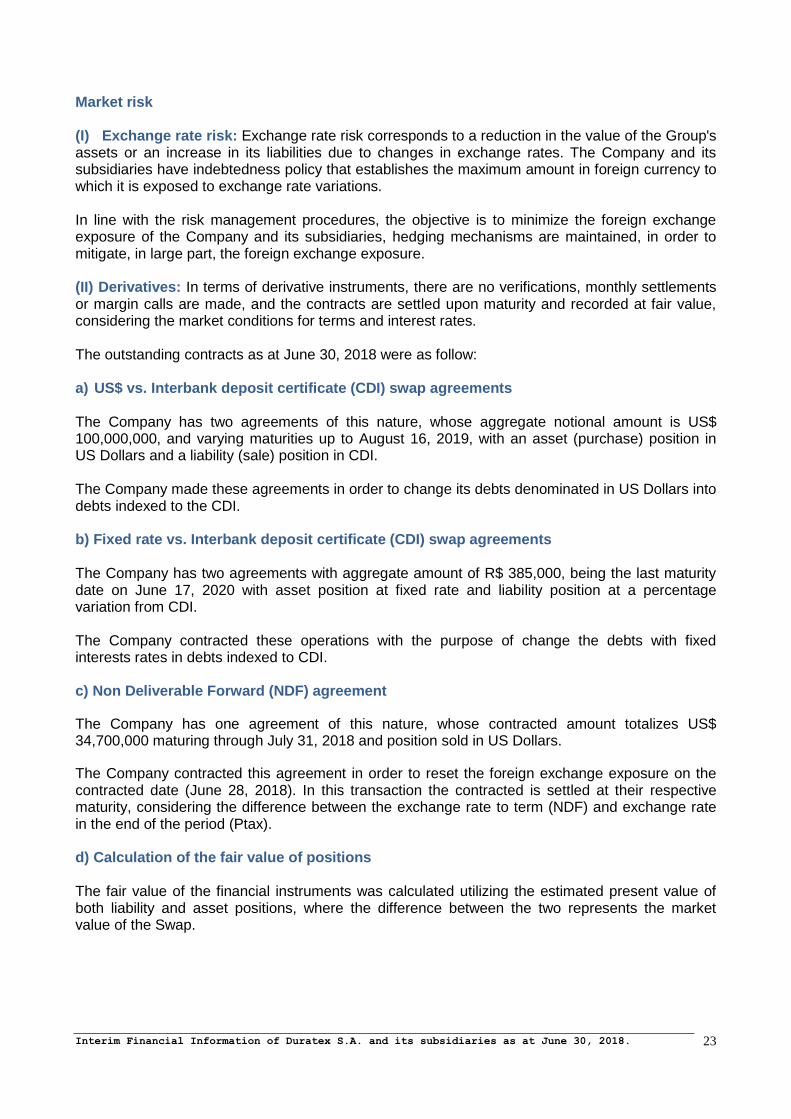
Market risk (I) Exchange rate risk: Exchange rate risk corresponds to a reduction in the value of the Group's assets or an increase in its liabilities due to changes in exchange rates. The Company and its subsidiaries have indebtedness policy that establishes the maximum amount in foreign currency to which it is exposed to exchange rate variations. In line with the risk management procedures, the objective is to minimize the foreign exchange exposure of the Company and its subsidiaries, hedging mechanisms are maintained, in order to mitigate, in large part, the foreign exchange exposure. (II) Derivatives: In terms of derivative instruments, there are no verifications, monthly settlements or margin calls are made, and the contracts are settled upon maturity and recorded at fair value, considering the market conditions for terms and interest rates. The outstanding contracts as at June 30, 2018 were as follow: a) US$ vs. Interbank deposit certificate (CDI) swap agreements The Company has two agreements of this nature, whose aggregate notional amount is US$ 100,000,000, and varying maturities up to August 16, 2019, with an asset (purchase) position in US Dollars and a liability (sale) position in CDI. The Company made these agreements in order to change its debts denominated in US Dollars into debts indexed to the CDI. b) Fixed rate vs. Interbank deposit certificate (CDI) swap agreements The Company has two agreements with aggregate amount of R$ 385,000, being the last maturity date on June 17, 2020 with asset position at fixed rate and liability position at a percentage variation from CDI. The Company contracted these operations with the purpose of change the debts with fixed interests rates in debts indexed to CDI. c) Non Deliverable Forward (NDF) agreement
The Company has one agreement of this nature, whose contracted amount totalizes US$ 34,700,000 maturing through July 31, 2018 and position sold in US Dollars.
The Company contracted this agreement in order to reset the foreign exchange exposure on the contracted date (June 28, 2018). In this transaction the contracted is settled at their respective maturity, considering the difference between the exchange rate to term (NDF) and exchange rate in the end of the period (Ptax). d) Calculation of the fair value of positions The fair value of the financial instruments was calculated utilizing the estimated present value of both liability and asset positions, where the difference between the two represents the market value of the Swap.

Interim Financial Information of Duratex S.A. and its subsidiaries as at June 30, 2018.
24
Amount Amount
06/30/2018 12/31/2017 06/30/2018 12/31/2017 receivable/ payable/
received paid
I. Swap contracts
Asset position
Foreign currency (USD) 354,985 584,333 391,263 607,911 30,434 -
Fixed rate 385,000 20,000 379,115 20,236 - (8,969)
Liability position
CDI (739,985) (604,333) (748,913) (611,764) - -
II. Futures contracts (NDF)
Agreement of Sale
NDF 133,654 102,420 133,331 102,153 - (699)
Statement of consolidated position of derivative financial instruments
Reference Value
(notional)Fair Value
Accumulated Effect of 6
months ended on
06/30/2018
Gains or losses on the transactions listed above were offset in interest rates and foreign currency positions, assets and liabilities, whose effects are already registered on the result of the Company. e) Sensitivity analysis The table below sets out a sensitivity analysis of financial instruments, including derivatives, that describes the risk scenarios which could generate material losses for the Company and its subsidiaries with a Probable Scenario (Base Scenario) plus two scenarios under the terms determined by CVM 475/08 representing 25% and 50% possible and remote, respectively, of deterioration in the risk variables. For the variables rates of risk used in the probable scenario, BM&FBOVESPA (São Paulo Stock, Futures and Commodities Exchange)/ Bloomberg quotations in the maturity dates of the financial instruments exposed with foreign exchange and interest rates. The average dollar of R$ 4.0081 and the average CDI of 8.19% p.a. was used.
Sensitivity analysis table
Risk Instrument/Operation Description Probable Possible Remote
of risk Scenario Scenario Scenario
Foreign exchange SWAP - US$ / CDI ( Res. 4131 ) Decrease US$ 1,181 (105,236) (211,654)
Subject of hedge: foreign currency debt ( US$ ) (increase US$) (1,181) 105,236 211,654
Net Effect - - -
Foreign exchange NDF (US$) Decrease US$ (4) 33,386 67,376
Subject of hedge: foreign currency debt ( US$ ) (increase US$) 4 (33,386) (67,376)
Net Effect - - -
Total - - -
Amounts in thousands of R$
(III) Cash flow or fair value risk associated with interest rate Interest rate risk is the risks of the Company suffer economic losses due to adverse changes in these interest rates. This risk is continually monitored in order to evaluate any possible need to contract derivative transactions to hedge against interest rate volatility. (a) Credit Risk The Company policy of sales are directly associated to the level of credit risk that are willing to accept in the course of its business. The diversification of its portfolio of receivables, selection of its customers, as well as monitoring of the sales financing terms and individual limits are procedures adopted in order to minimize defaults or losses on the realization of accounts receivable.

Interim Financial Information of Duratex S.A. and its subsidiaries as at June 30, 2018.
25
In relation to temporary cash investments and all other investments, the Group follows the policy of working only with blue-chip institutions and not concentrating its investments on any one economic group. (b) Liquidity risk The Company and its subsidiaries have a indebtedness policy which defines the limits and parameters of indebtedness, and the minimum funds which should be maintained, the latter being the higher of the following values: an amount equivalent to 60 days of consolidated net revenue of the last quarter or the amount of the debt servicing expenses plus dividends and/or interest on capital forecast for the following six months. The control of liquidity position occurs daily through of cash flow monitoring. The table below shows the maturities of certain financial liabilities and obligation with suppliers contracted by the Company and its subsidiaries in the interim financial information:
06/30/2018
Loans 373,870 1,670,573 50,797 447,545 1,751,901 787,155 3,016
Suppliers 272,987 - - 358,737 - - -
Suppliers related parties 24,079 - - - - - -
Total 670,936 1,670,573 50,797 806,282 1,751,901 787,155 3,016
Parent company Consolidated
Less than
one year
2019 and
2020
From
2021 to
2025
Less than
one year
2019 and
2020
From 2021
to 2025
2026
Onwards
The budget projection approved by the Board of Directors for the next fiscal year, shows capacity and generation of cash to meet its obligations. 4.2 Capital management The Company and its subsidiaries manage their capital to ensure the continuity of their operations, as well as providing return to its stockholders, including the optimization of the cost of capital and controlling the level of indebtedness by monitoring of the financial leverage index. This index corresponds to net debit value divided by stockholders’ equity.
06/30/2018 12/31/2017 06/30/2018 12/31/2017
A -Loans and financing 2,095,240 2,237,920 2,989,617 3,174,824
Short - term 373,870 696,882 447,545 764,824
Long - term 1,721,370 1,541,038 2,542,072 2,410,000
B-(-) Cash and cash equivalents 287,296 402,698 826,516 1,074,364
C-(-) Securities - 57,292 - -
D=(A-B-C) Net debt 1,807,944 1,777,930 2,163,101 2,100,460
E- Stockholders' equity 4,995,705 4,715,365 4,997,010 4,716,319
D/E=Financial leverage index 36% 38% 43% 45%
Parent company Consolidated
4.3 Fair value estimates It is assumed that the book values of trade account receivable and accounts payable to suppliers, less the loss (impairment), are close to their fair values. The fair value of the financial liabilities for disclosure purposes is estimated by discounting of the future contractual cash flow by current

Interim Financial Information of Duratex S.A. and its subsidiaries as at June 30, 2018.
26
market interest rate which is available for the Company and its subsidiaries for similar financial instruments. The Company and its subsidiaries apply CPC 40-R1/ IFRS 7 “Financial instruments: disclosures” for financial instruments measured on balance sheet at fair value, which requires the disclosure of the measurement criteria used. As the Company has only Level 2 derivatives, it uses the following valuation techniques: • The fair value of the interest rate “swap” is calculated based on the present value of the estimated future cash flow based on the yield curves adopted by the market; • The fair values foreign currency forward contracts are determined based on future exchange rates at the balance sheet dates, with the resulting amounts discounted to their present values. The consolidated financial instruments (by category/level) are presented below:
06/30/2018 12/31/2017 06/30/2018 12/31/2017 06/30/2018 12/31/2017 06/30/2018 12/31/2017
ASSETS
Cash equivalents 736,142 992,558 - - - - 736,142 992,558
Trade accounts receivable 971,535 932,917 - - - - 971,535 932,917
Trade accounts receivable related parties 40,949 35,146 - - - - 40,949 35,146
Restricted deposits 53,982 51,343 - - - - 53,982 51,343
Total 1,802,608 2,011,964 - - - - 1,802,608 2,011,964
LIABILITIES
Loans - - 2,240,704 2,563,060 748,913 611,764 2,989,617 3,174,824
Dividends/ Interest on capital - - 432 61,273 - - 432 61,273
Total - - 2,241,136 2,624,333 748,913 611,764 2,990,049 3,236,097
Loans and receivables Financial liabilities
Financial liabilities
designated at fair value Total
Note 5 – Cash and cash equivalents
06/30/2018 12/31/2017 06/30/2018 12/31/2017
Cash and banks 2,648 3,331 67,710 54,536
Banks remunerated accounts of foreign
subsidiaries - - 22,664 27,270
Fixed income securities 627 562 45,515 564
Bank deposit certificates 284,021 398,805 690,627 991,994
Total 287,296 402,698 826,516 1,074,364
Parent company Consolidated
The bank deposit certificates in Brazil earn interest with reference to the CDI rate, and deposits abroad in US Dollars earn a fixed interest rate. The bank deposit certificates (CDB) are remunerated at rates higher than the CDI rates and although they have long-term maturities, bank deposit certificates can be redeemed at any time without loss of remuneration. Note 6 – Securities On August 28, 2017, the Company acquired Cerâmica Urussanga S.A., 56,000,000 of simple debentures, single series with personal guarantee and real guarantee, nominal, no convertible in shares with nominal value of R$ 1.00, in the amount of R$ 56,000 totally integralized. On December 31, 2017, this asset was eliminated in the consolidated balance sheet. In February 2018 the debentures were settled in the amount of R$ 57,643, totally integralized and updated with interests remuneration at the reason of 105% of CDI incident from the integralization date.

Interim Financial Information of Duratex S.A. and its subsidiaries as at June 30, 2018.
27
Note 7 - Trade accounts receivable
06/30/2018 12/31/2017 06/30/2018 12/31/2017
Domestic customers 643,661 733,615 892,224 894,044
Foreign customers 143,737 102,062 164,046 117,605
Impairment in accounts receivable (73,910) (70,489) (84,735) (78,732)
Total customers - Third parties 713,488 765,188 971,535 932,917
Total customers - Related parties 97,240 53,307 40,949 35,146
Total accounts receivable 810,728 818,495 1,012,484 968,063
Parent company Consolidated
The balances of accounts receivable by maturity are as follow:
06/30/2018 12/31/2017 06/30/2018 12/31/2017
Not yet due 687,792 775,641 880,693 910,720
Past-due up to 30 days 63,532 32,055 73,604 38,754
From 31 to 60 days 22,180 10,997 24,992 14,216
From 61 to 90 days 12,136 4,444 10,986 6,883
From 91 to 180 days 14,491 5,277 14,448 8,087
More than 180 days 84,507 60,570 92,496 68,135
Total 884,638 888,984 1,097,219 1,046,795
Parent company Consolidated
The Company and its subsidiaries have a Credit Policy whose objective is to establish the procedures to be followed when granting credit in commercial operations, and sales of products and services, both domestically and abroad market. The credit limit is determined based on a credit analysis, considering the history of the customer, its capacity as a borrower, and market information. The credit limit is defined with reference to a percentage of net revenue and the stockholders’ equity, or a combination of these, still considering the average volume of monthly purchases, but always supported by an evaluation of the economic and financial situation, an examination of the relevant documents and the customer's reputation. Customers are classified as A, B, C and D based on the length of the Company’s relationship with the customer and their payment history.
Length of Payment historyrelationship
06/30/2018 12/31/2017
over 5 years Current 53% 58%
over 3 years Up to 1 day late, on average 4% 3%
below 3 years Over 1 day late, on average 34% 31%
Overdue 9% 8%
% of the balance from
customer portfolio
A
B
C
D
Classification
The maximum credit risk exposure at the date of this report is the book value of each class of trade accounts receivable listed above. The impairment in the accounts receivable (allowance for doubtful accounts) is recorded based on the trade notes overdue more than 180 days and as individual analysis of the relevant overdue amounts. We show below the changes of impairment in the accounts receivable (allowance for doubtful accounts) for the period of six months ended on June 30, 2018.

Interim Financial Information of Duratex S.A. and its subsidiaries as at June 30, 2018.
28
06/30/2018 12/31/2017 06/30/2018 12/31/2017
Opening Balance (70,489) (61,801) (78,732) (69,974)
Constitution/ reversion (2,431) (12,889) (4,214) (12,600)
Write-offs 2,973 4,201 3,212 3,842
Transition adjustment CPC 48 (3,963) - (5,001) -
Closing Balance (73,910) (70,489) (84,735) (78,732)
Parent company Consolidated
Note 8 - Inventories
06/30/2018 12/31/2017 06/30/2018 12/31/2017
Finished goods 291,037 246,660 407,000 344,183
Raw materials 205,980 174,449 264,169 224,917
Work in progress 89,955 78,007 118,373 104,150
General warehouse 103,231 104,003 111,257 110,566
Advances to suppliers (*) 21,691 29,550 188 2,520
Provision for losses (-) (15,147) (17,826) (24,673) (26,243)
Total 696,747 614,843 876,314 760,093
Parent company Consolidated
(*) On the consolidated position the advances from parent company to subsidiary Duratex Florestal Ltda. have been eliminated.
Note 9 – Other receivables
06/30/2018 12/31/2017 06/30/2018 12/31/2017
Fundação Itaúsa Industrial (pension plan) (1) 3,148 2,983 3,148 2,983
Sale of farms/ properties and other assets 13,342 13,037 166,684 47,427
Retention values from business acquisitions 2,931 2,931 2,931 2,931
Claims to receive 3,081 2,357 3,080 2,728
Electricity sales 5,099 3,601 5,099 3,601
Others 3,132 1,006 4,282 3,859
Total Current 30,733 25,915 185,224 63,529
Fundação Itaúsa Industrial (pension plan) (1) - 1,490 - 1,490
Sale of farms/ properties 2,292 2,422 33,764 32,024
Forest incentives (2) - - 12,021 13,218
Amounts receivable from participating partners of SCPs - - 5,206 5,206
Indemnifiable assets (3) 25,158 19,464 25,158 19,464
Retention values from business acquisitions 28,613 27,437 28,613 27,437
Others 12,954 2,731 6,980 7,654
Total Non-Current 69,017 53,544 111,742 106,493
Parent company Consolidated
(1) Credits from the review of defined benefit plan of Fundação Itaúsa Industrial; (2) Forest planting modality in which the company provides incentives, raw materials and technical assistance and maintenance as established in the contract; (3) The amounts have recorded in the acquisition of subsidiaries Ceusa and Massima related to rights to receive of old owners in case of Duratex to have future disbursements arise from referred acquisition.
Note 10 – Recoverable taxes and contributions The Company and its subsidiaries have recoverable federal and state tax credits, the composition of which is as follows:

Interim Financial Information of Duratex S.A. and its subsidiaries as at June 30, 2018.
29
06/30/2018 12/31/2017 06/30/2018 12/31/2017
Income tax and social contribution to be offset 72,489 52,973 104,291 74,252
ICMS, PIS and COFINS on the acquisition of property,
plant and equipment (*) 8,987 9,929 11,396 12,204
PIS and COFINS to be offset 13,984 10,519 14,695 16,786
ICMS and IPI recoverable 6,253 12,105 25,631 30,405
Others 2,439 2,429 6,552 5,231
Total current 104,152 87,955 162,565 138,878
ICMS, PIS and COFINS on the acquisition of property,
plant and equipment (*) 9,300 10,999 11,547 13,215
Total non current 9,300 10,999 11,547 13,215
Parent company Consolidated
(*) State Value-Added Tax (ICMS), Social Integration Program (PIS) and Social Contribution on Revenue (COFINS) to be offset were mainly generated from the acquisitions of property, plant and equipment items for the industrial plants. Under current legislation, the PIS/COFINS credits will be utilized within 12 and 24 months, and the ICMS credits within 48 months.
Note 11 – Non-current assets available for sale In compliance to the CPC 31/ IFRS 5, since first quarter the assets related to negotiations of future disposal of facilities and equipments for Eucatex Group and disposal of lands and farms for Suzano Papel e Celulose, disclosed in the subsequent event note nº 36 from financial statements on December 31, 2017 are being presented as non-current assets available for sale in accordance to table below.
Parent company Consolidated
Equipments and facilities (1) 31,022 31,022
Lands (2) - 55,892
Biological assets - forest reserves (2) - 138,565
Real Estate (3) 6,268 6,268
Total 37,290 231,747
(1) Future disposal of equipment and facilities for Eucatex
(2) Future disposal of land and forests for Suzano Papel e Celulose
(3) Transactions from prior periods - Property received from customer for settlement of receivables Note 12 – Deferred income tax and social contribution
Deferred income tax and social contributions are calculated on income tax losses and negative base of social contribution, temporary differences between tax calculation bases on assets and liabilities and on the application of CPCs/IFRS. The tax rates defined to determination of deferred income tax are 25% for income tax and of 9% for social contribution. Deferred tax assets are recognized to the extent that it is probable that future taxable income will be available to utilize in the offset of temporary differences, considering the projections of future income. These projections are prepared on the basis of internal assumptions and using future economic scenarios, can be, therefore, subject to change. On June 30, 2018 the Group had tax credits not constituted on fiscal losses and negative base from social contribution being: R$ 13,524 relating to credits held by subsidiary Cerâmica Urussanga S.A. and R$ 15,175 of credits held by subsidiary Hydra Corona Sistemas de Aquecimento de Água Ltda.
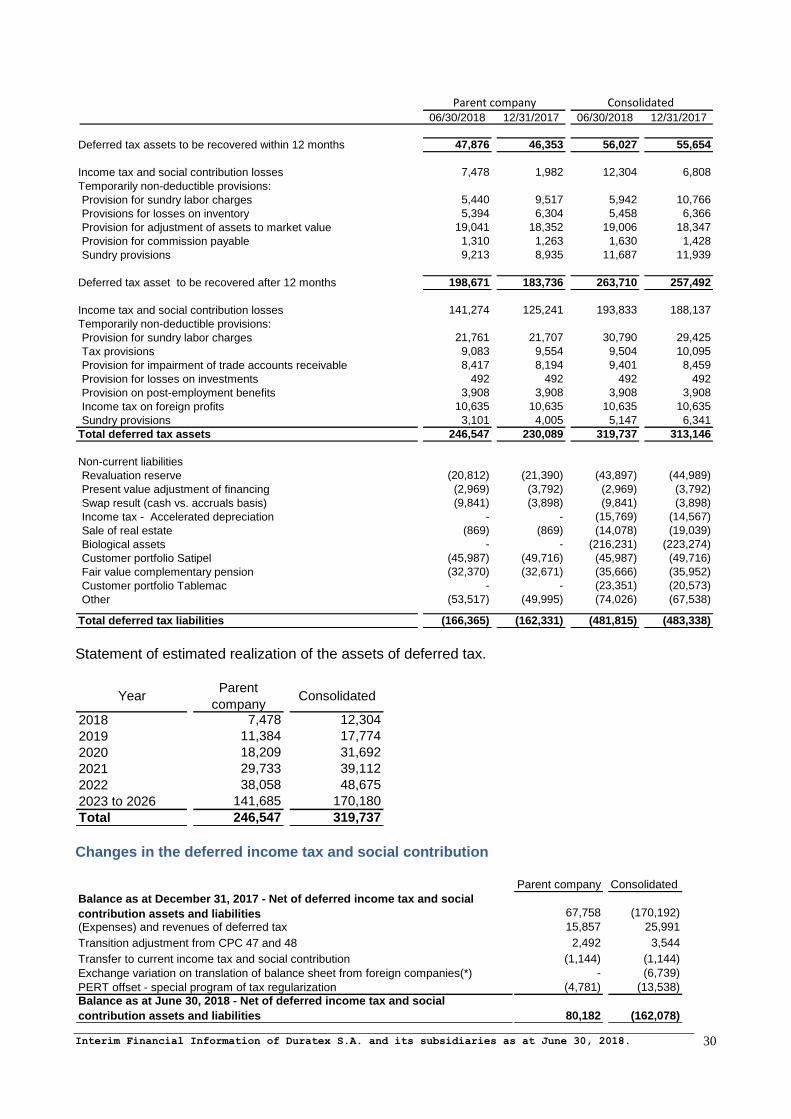
Interim Financial Information of Duratex S.A. and its subsidiaries as at June 30, 2018.
30
06/30/2018 12/31/2017 06/30/2018 12/31/2017
Deferred tax assets to be recovered within 12 months 47,876 46,353 56,027 55,654
Income tax and social contribution losses 7,478 1,982 12,304 6,808
Temporarily non-deductible provisions:
Provision for sundry labor charges 5,440 9,517 5,942 10,766
Provisions for losses on inventory 5,394 6,304 5,458 6,366
Provision for adjustment of assets to market value 19,041 18,352 19,006 18,347
Provision for commission payable 1,310 1,263 1,630 1,428
Sundry provisions 9,213 8,935 11,687 11,939
Deferred tax asset to be recovered after 12 months 198,671 183,736 263,710 257,492
Income tax and social contribution losses 141,274 125,241 193,833 188,137
Temporarily non-deductible provisions:
Provision for sundry labor charges 21,761 21,707 30,790 29,425
Tax provisions 9,083 9,554 9,504 10,095
Provision for impairment of trade accounts receivable 8,417 8,194 9,401 8,459
Provision for losses on investments 492 492 492 492
Provision on post-employment benefits 3,908 3,908 3,908 3,908
Income tax on foreign profits 10,635 10,635 10,635 10,635
Sundry provisions 3,101 4,005 5,147 6,341
Total deferred tax assets 246,547 230,089 319,737 313,146
Non-current liabilities
Revaluation reserve (20,812) (21,390) (43,897) (44,989)
Present value adjustment of financing (2,969) (3,792) (2,969) (3,792)
Swap result (cash vs. accruals basis) (9,841) (3,898) (9,841) (3,898)
Income tax - Accelerated depreciation - - (15,769) (14,567)
Sale of real estate (869) (869) (14,078) (19,039)
Biological assets - - (216,231) (223,274)
Customer portfolio Satipel (45,987) (49,716) (45,987) (49,716)
Fair value complementary pension (32,370) (32,671) (35,666) (35,952)
Customer portfolio Tablemac - - (23,351) (20,573)
Other (53,517) (49,995) (74,026) (67,538)
Total deferred tax liabilities (166,365) (162,331) (481,815) (483,338)
Parent company Consolidated
Statement of estimated realization of the assets of deferred tax.
YearParent
companyConsolidated
2018 7,478 12,304
2019 11,384 17,774
2020 18,209 31,692
2021 29,733 39,112
2022 38,058 48,675
2023 to 2026 141,685 170,180
Total 246,547 319,737 Changes in the deferred income tax and social contribution
Parent company Consolidated
Balance as at December 31, 2017 - Net of deferred income tax and social
contribution assets and liabilities 67,758 (170,192)
(Expenses) and revenues of deferred tax 15,857 25,991
Transition adjustment from CPC 47 and 48 2,492 3,544
Transfer to current income tax and social contribution (1,144) (1,144)
Exchange variation on translation of balance sheet from foreign companies(*) - (6,739)
PERT offset - special program of tax regularization (4,781) (13,538)
Balance as at June 30, 2018 - Net of deferred income tax and social
contribution assets and liabilities 80,182 (162,078)
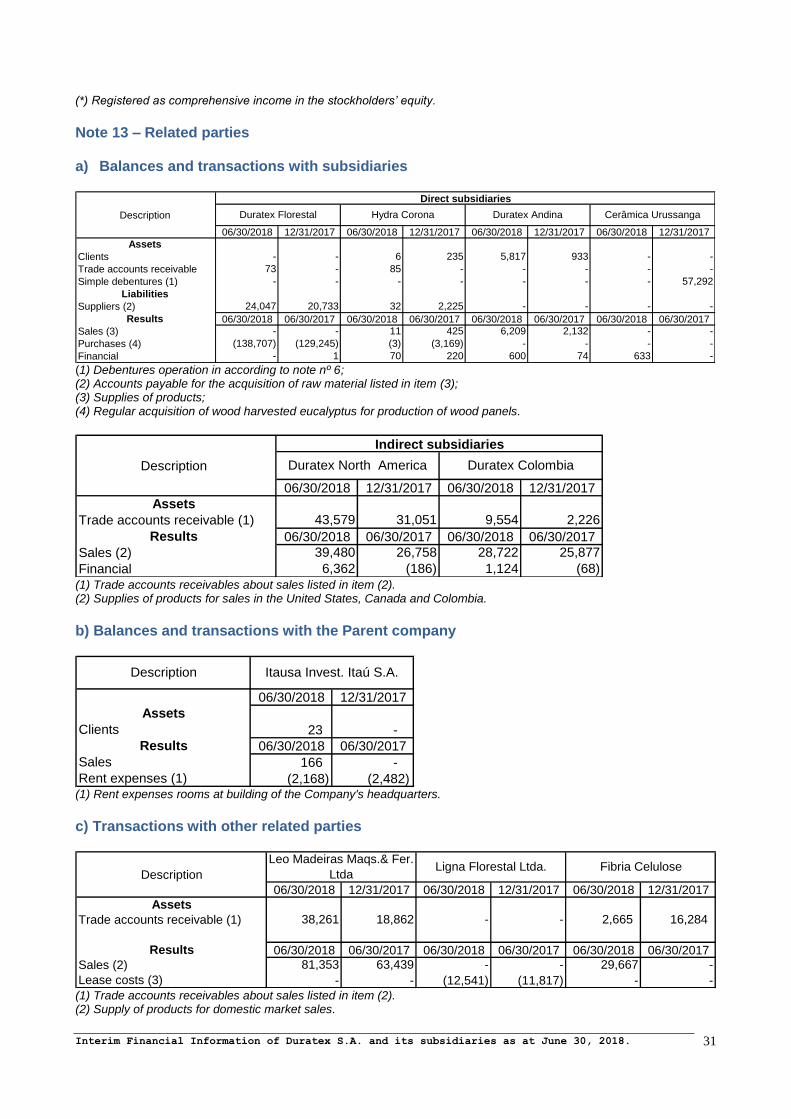
Interim Financial Information of Duratex S.A. and its subsidiaries as at June 30, 2018.
31
(*) Registered as comprehensive income in the stockholders’ equity.
Note 13 – Related parties a) Balances and transactions with subsidiaries
Description
06/30/2018 12/31/2017 06/30/2018 12/31/2017 06/30/2018 12/31/2017 06/30/2018 12/31/2017
Assets
Clients - - 6 235 5,817 933 - -
Trade accounts receivable 73 - 85 - - - - -
Simple debentures (1) - - - - - - - 57,292
Liabilities
Suppliers (2) 24,047 20,733 32 2,225 - - - -
Results 06/30/2018 06/30/2017 06/30/2018 06/30/2017 06/30/2018 06/30/2017 06/30/2018 06/30/2017
Sales (3) - - 11 425 6,209 2,132 - -
Purchases (4) (138,707) (129,245) (3) (3,169) - - - -
Financial - 1 70 220 600 74 633 -
Duratex Florestal Hydra Corona Duratex Andina
Direct subsidiaries
Cerâmica Urussanga
(1) Debentures operation in according to note nº 6; (2) Accounts payable for the acquisition of raw material listed in item (3); (3) Supplies of products; (4) Regular acquisition of wood harvested eucalyptus for production of wood panels.
Description
06/30/2018 12/31/2017 06/30/2018 12/31/2017
Assets
Trade accounts receivable (1) 43,579 31,051 9,554 2,226
Results 06/30/2018 06/30/2017 06/30/2018 06/30/2017
Sales (2) 39,480 26,758 28,722 25,877
Financial 6,362 (186) 1,124 (68)
Indirect subsidiaries
Duratex North America Duratex Colombia
(1) Trade accounts receivables about sales listed in item (2). (2) Supplies of products for sales in the United States, Canada and Colombia.
b) Balances and transactions with the Parent company
06/30/2018 12/31/2017
Assets
Clients 23 -
Results 06/30/2018 06/30/2017
Sales 166 -
Rent expenses (1) (2,168) (2,482)
Description Itausa Invest. Itaú S.A.
(1) Rent expenses rooms at building of the Company's headquarters.
c) Transactions with other related parties
Description
06/30/2018 12/31/2017 06/30/2018 12/31/2017 06/30/2018 12/31/2017
Assets
Trade accounts receivable (1) 38,261 18,862 - - 2,665 16,284
Results 06/30/2018 06/30/2017 06/30/2018 06/30/2017 06/30/2018 06/30/2017
Sales (2) 81,353 63,439 - - 29,667 -
Lease costs (3) - - (12,541) (11,817) - -
Leo Madeiras Maqs.& Fer.
LtdaLigna Florestal Ltda. Fibria Celulose
(1) Trade accounts receivables about sales listed in item (2). (2) Supply of products for domestic market sales.
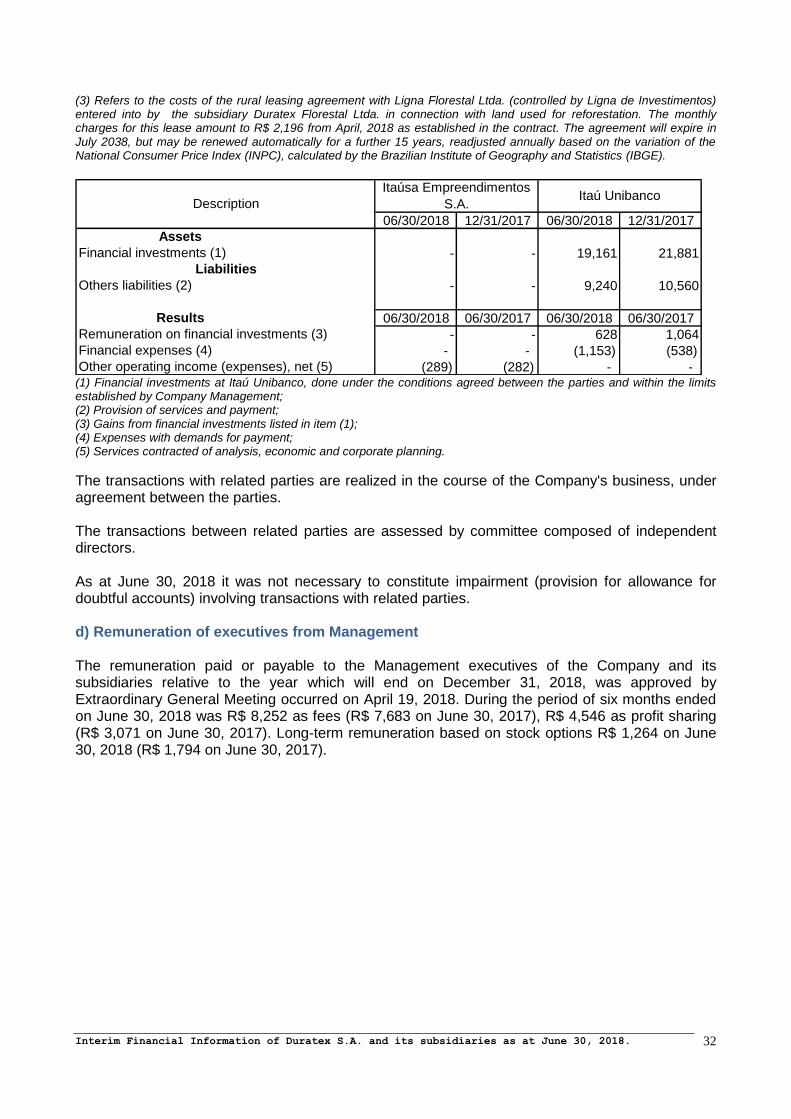
Interim Financial Information of Duratex S.A. and its subsidiaries as at June 30, 2018.
32
(3) Refers to the costs of the rural leasing agreement with Ligna Florestal Ltda. (controlled by Ligna de Investimentos) entered into by the subsidiary Duratex Florestal Ltda. in connection with land used for reforestation. The monthly charges for this lease amount to R$ 2,196 from April, 2018 as established in the contract. The agreement will expire in July 2038, but may be renewed automatically for a further 15 years, readjusted annually based on the variation of the National Consumer Price Index (INPC), calculated by the Brazilian Institute of Geography and Statistics (IBGE).
06/30/2018 12/31/2017 06/30/2018 12/31/2017
Assets
Financial investments (1) - - 19,161 21,881
Others liabilities (2) - - 9,240 10,560
Results 06/30/2018 06/30/2017 06/30/2018 06/30/2017
Remuneration on financial investments (3) - - 628 1,064
Financial expenses (4) - - (1,153) (538)
Other operating income (expenses), net (5) (289) (282) - -
Itaú Unibanco
Liabilities
Itaúsa Empreendimentos
S.A.Description
(1) Financial investments at Itaú Unibanco, done under the conditions agreed between the parties and within the limits established by Company Management; (2) Provision of services and payment; (3) Gains from financial investments listed in item (1); (4) Expenses with demands for payment; (5) Services contracted of analysis, economic and corporate planning.
The transactions with related parties are realized in the course of the Company's business, under agreement between the parties. The transactions between related parties are assessed by committee composed of independent directors. As at June 30, 2018 it was not necessary to constitute impairment (provision for allowance for doubtful accounts) involving transactions with related parties. d) Remuneration of executives from Management The remuneration paid or payable to the Management executives of the Company and its subsidiaries relative to the year which will end on December 31, 2018, was approved by Extraordinary General Meeting occurred on April 19, 2018. During the period of six months ended on June 30, 2018 was R$ 8,252 as fees (R$ 7,683 on June 30, 2017), R$ 4,546 as profit sharing (R$ 3,071 on June 30, 2017). Long-term remuneration based on stock options R$ 1,264 on June 30, 2018 (R$ 1,794 on June 30, 2017).

Interim Financial Information of Duratex S.A. and its subsidiaries as at June 30, 2018.
33
Note 14 – Investments in subsidiaries a) Change in investments
Associate
Number of shares/quotas held (Thousand) 301 12 374 - - 1 47 100 3,112 220,240 1,637 - 796,718 - -
Interest % 99.99 99.99 99.99 90.00 90.00 100.00 100.00 5.05 63.08 100.00 100.00 99.99 99.98 28.57 -
Capital 901,542 12 374 10 1 1 392,358 50,872 426 220,240 1,771 - 95,416 10 -
Equity 1,491,704 359 1,614 10 1 1 588,916 71,048 (1,878) 194,081 2,152 - 125,815 2,225 -
Net income (loss) for the period 184,216 71 5 - - - 30,575 3,634 (435) 3,960 259 3,691 7,131 (2,352) -
Changes in investmentsAs at December 31, 2016 1,596,160 282 1,511 9 1 1 408,164 2,490 - 199,380 1,577 - - - 2,209,575
Equity in results of investees 158,571 6 96 - - - 42,792 248 (689) 12,535 (33) 4,006 15,763 - 233,295 Acquisition - associate - - - - - - - - - - - - - 481 481
Acquisition - book value - - - - - - - - - - - 24,432 (160,675) - (136,243)
Appreciation of assets - acquisition of subsidiaries - - - - - - - - - - - 29,430 88,392 - 117,822
Amount receivable referring to reimbursement of provisions that
will be discounted from the amount payable on the acquisition of
Ceusa. - - - - - - - - - - - - (20,710) - (20,710)
Goodwill - expectation of future profitability - - - - - - - - - - - 6,111 92,943 5,779 104,833
Advance for future capital increase - - - - - - - - - 39,410 - 15,262 69,638 - 124,310
Exchange variations on equity - - - - - - 19,784 138 - - 79 - - - 20,001
Change in unrealized result 145 - - - - - - - - - - - - - 145
Dividends (250,000) - - - - - - - - - - - - - (250,000)
Provision for unsecured liability - - - - - - - - 689 - - - - - 689
Amortization of appreciation of assets, net of taxes - - - - - - - - - (3,561) - (651) (447) - (4,659)
Amortization of appreciation of inventories, net of taxes - - - - - - - - - - - (1,628) (601) - (2,229)
As at December 31, 2017 1,504,876 288 1,607 9 1 1 470,740 2,876 - 247,764 1,623 76,962 84,303 6,260 2,397,310
Equity in results of investees 184,215 71 5 - - - 30,575 184 91 3,960 259 3,691 7,130 (672) 229,509
Advance for future capital increase - - - - - - - - - - - 14,601 130,161 - 144,762
Massima Incorporation by the subsidiary Ceusa - - - - - - - - - - - (63,873) 63,873 - -
Transfer by incorporation - - - - - - - - - - - (30,878) 30,878 - -
Exchange variations on equity - - 2 - - - 87,589 528 - - 270 - - - 88,389
Equity of investees reflex - - - - - - - - - (2,048) - - (162) - (2,210)
Provision for unsecured liability - - - - - - - - (91) - - - - - (91)
Amortization of appreciation of assets, net of taxes - - - - - - - - - (1,702) - (651) (1,543) - (3,896)
Dividends (199,999) - - - - - - - - - - - - - (199,999)
Amortization of appreciation of inventories, net of taxes - - - - - - - - - - - 148 (218) - (70)
As at June 30, 2018 1,489,092 359 1,614 9 1 1 588,904 3,588 - 247,974 2,152 0 314,422 5,588 2,653,704
TotalMassima
Revest.
Cerâmica
Urussanga
Viva
Decora
Direct subsidiaries
Pescara
Admin.
Part.
Trento
Admin. Part.
Duratex
Europe
Duratex
Belgium
Griferia
Sur
Hydra
Corona
Duratex
Andina
Description Duratex
Florestal
Estrela
do Sul
Duratex
Empreend.
Bale Com.
Prod.
Number of shares/quotas held (Thousand) 500 33,622 1,880
Interest % 100.00 99.73 94.95
Capital 886 54,332 50,872
Equity 15,313 479,239 71,048
Net income (loss) for the period (771) 32,433 3,634
Changes in investments
As at December 31, 2016 12,879 348,674 46,806
Equity in results of investees 732 44,212 4,656
Exchange variations on equity 212 8,250 2,600
Dividends - (29,191) -
As at December 31, 2017 13,823 371,945 54,062
Equity in results of investees (771) 32,346 3,450
Exchange variations on equity 2,261 73,668 9,947
As at June 30, 2018 15,313 477,959 67,459
Description
Indirect subsidiaries
North
America
Duratex
Colombia
Duratex
Belgium
b) Incorporation of subsidiary On April 02, 2018 was approved in Extraordinary General Meeting from subsidiary Cerâmica Urussanga S.A., the incorporation of Massima Revestimentos Cerâmicos Ltda. The incorporation is part of the project of consolidation and correlated business unification to the commercial establishments from the Group whose purpose is to create synergies, optimize the control of assets from companies, as well as to generate scale gains, increase the participation, results, commercial and financial benefits that will be absorbed by the Group as a whole.

Interim Financial Information of Duratex S.A. and its subsidiaries as at June 30, 2018.
34
Incorporation’s Balance Sheet on April 02, 2018 Massima Revestimentos Ltda.
Assets
Current Assets 48,491
Cash and cash equivalents 5,221
Trade accounts receivable 31,920
Inventories 9,904
Other assets 1,446
Non-current Assets 39,899
Other accounts receivable and judicial deposits 564
Deferred income tax and social contribution 1,780
Property, plant and equipment 37,470
Intangible and investments 85
Total Assets 88,390
Liabilities
Current Liabilities 23,705
Loans and financing 8
Suppliers 14,016
Personnel 2,447
Accounts payable and taxes 7,234
Non-current 810
Contingencies 810
Total Liabilities 24,515
Incorporated net asset 63,875 Ceusa have succeeded Massima in its rights and obligations, answering support by obligations from Massima in according to the terms in the article 227 and 232 from Lei das S.A. The accounting balance from Ceusa was impacted by the amounts incorporated presented in the table above.

Interim Financial Information of Duratex S.A. and its subsidiaries as at June 30, 2018.
35
Note 15 – Property, plant and equipment a) Change
Balance as at 12/31/2016
Cost 128,481 881,802 3,827,998 99,539 42,393 23,023 159,826 5,163,062
Accumulated depreciation - (361,673) (2,034,576) - (27,793) (22,115) (106,725) (2,552,882)
Net book value 128,481 520,129 1,793,422 99,539 14,600 908 53,101 2,610,180
As at 12/31/2017
Opening balance 128,481 520,129 1,793,422 99,539 14,600 908 53,101 2,610,180
Acquisitions 8,500 1,947 26,522 97,894 805 17 5,178 140,863
Write-offs - - (270) (24) (6) - (2) (302)
Provision for losses on asset recovery - (2,863) (47,780) - (57) - (96) (50,796)
Depreciation - (29,515) (219,310) - (2,490) (361) (12,740) (264,416)
Transfers - 8,248 59,480 (75,879) 611 350 7,190 -
Net book value 136,981 497,946 1,612,064 121,530 13,463 914 52,631 2,435,529
Balance as at 12/31/2017
Cost 136,981 889,134 3,865,950 121,530 43,746 23,390 172,096 5,252,827
Accumulated depreciation - (391,188) (2,253,886) - (30,283) (22,476) (119,465) (2,817,298)
Net book value 136,981 497,946 1,612,064 121,530 13,463 914 52,631 2,435,529
As at 06/30/2018
Opening balance 136,981 497,946 1,612,064 121,530 13,463 914 52,631 2,435,529
Acquisitions - 359 9,974 49,195 509 34 2,610 62,681
Write-offs - (54) (3,835) (25) (2) - (364) (4,280)
Depreciation - (14,544) (110,386) - (1,240) (198) (6,558) (132,926)
Transfers - 5,548 77,089 (86,059) 157 354 2,911 -
Transfers to current asset (*) - - (31,022) - - - - (31,022)
Net book value 136,981 489,255 1,553,884 84,641 12,887 1,104 51,230 2,329,982
Balance as at 06/30/2018
Cost 136,981 894,987 3,918,156 84,641 44,410 23,778 177,253 5,280,206
Accumulated depreciation - (405,732) (2,364,272) - (31,523) (22,674) (126,023) (2,950,224)
Net book value 136,981 489,255 1,553,884 84,641 12,887 1,104 51,230 2,329,982
Furniture and
fixturesVehicles Other assets TotalParent company Land
Structures and
improvements
Machinery,
equipment and
facilities
Assets in
progress
(*) Refers to non-current asset available for sale in accordance to note 11.
Balance as at 12/31/2016
Cost 725,368 986,332 4,122,970 106,774 53,101 56,555 192,492 6,243,592
Accumulated depreciation - (384,025) (2,085,328) - (36,347) (48,837) (117,160) (2,671,697)
Net book value 725,368 602,307 2,037,642 106,774 16,754 7,718 75,332 3,571,895
As at 12/31/2017
Opening balance 725,368 602,307 2,037,642 106,774 16,754 7,718 75,332 3,571,895
Acquisitions 8,797 2,218 34,049 132,472 1,106 462 9,044 188,148
Write-offs (20,836) (14) (1,159) (24) (21) (75) (2,534) (24,663)
Provision for losses on asset recovery - (2,863) (47,780) - (57) - (96) (50,796)
Depreciation - (31,717) (249,538) - (2,815) (1,815) (17,052) (302,937)
Transfers - 9,564 90,847 (116,108) 629 2,943 12,125 -
Acquisition of subsidiaries Ceusa and Massima 2,061 20,446 27,772 2,279 804 92 986 54,440
Appreciation of assets Ceusa and Massima 6,573 24,370 10,920 - - - 3,405 45,268
Amortization - Appreciation of assets - (969) (3,483) - (22) (7) (178) (4,659)
Exchange variations 8,637 1,351 3,282 31 11 5 128 13,445
Net book value 730,600 624,693 1,902,552 125,424 16,389 9,323 81,160 3,490,141
Balance as at 12/31/2017
Cost 730,600 1,040,435 4,237,418 125,424 55,551 59,975 215,372 6,464,775
Accumulated depreciation - (415,742) (2,334,866) - (39,162) (50,652) (134,212) (2,974,634)
Net book value 730,600 624,693 1,902,552 125,424 16,389 9,323 81,160 3,490,141
As at 06/30/2018
Opening balance 730,600 624,693 1,902,552 125,424 16,389 9,323 81,160 3,490,141
Acquisitions 8,172 448 20,569 68,072 1,026 764 5,429 104,480
Write-offs (55,620) (54) (4,232) (25) (7) (50) (723) (60,711)
Depreciation - (16,165) (128,539) - (1,462) (1,030) (9,150) (156,346)
Transfers - 5,834 87,195 (99,520) 169 2,184 4,138 -
Amortization - Appreciation of assets - (1,386) (2,449) - (11) (4) (46) (3,896)
Exchange variations 14,575 12,927 29,967 217 126 62 1,452 59,326
Transfer to current asset (*) (55,892) - (31,022) - - - - (86,914)
Net book value 641,835 626,297 1,874,041 94,168 16,230 11,249 82,260 3,346,080
Balance as at 06/30/2018
Cost 641,835 1,058,204 4,337,446 94,168 56,854 62,931 225,622 6,477,060
Accumulated depreciation - (431,907) (2,463,405) - (40,624) (51,682) (143,362) (3,130,980)
Net book value 641,835 626,297 1,874,041 94,168 16,230 11,249 82,260 3,346,080
Furniture
and fixturesVehicles
Other
assetsTotalConsolidated Land
Structures and
improvements
Machinery,
equipment and
facilities
Assets in
progress
(*) Refers to non-current asset available for sale in accordance to note 11.

Interim Financial Information of Duratex S.A. and its subsidiaries as at June 30, 2018.
36
b) Assets in progress
Assets in progress refer to investments on the units of: (i) Wood Division the industrial plants in Agudos - SP, Botucatu – SP, Itapetininga - SP, Uberaba - MG and Taquari - RS for producing wood panels (ii) Deca Division the industrial plants of Paraíba - PB, Recife- PE, São Leopoldo - RS, Queimados - RJ and Jundiaí - SP for producing sanitary ceramic and in plants São Paulo - SP, Jundiaí - SP and Jacareí - SP for producing metals, Tubarão - SC and Aracaju - SE for producing showers products and in Urussanga – SC for producing ceramic tiles, (iii) in the forests plants of Agudos – SP, Botucatu – SP, Itapetininga – SP, Lençóis Paulista – SP, Monte Carmelo – MG and Uberaba – MG. As at June 30, 2018, these formalized contracts for the expansion of industrial plants totaled approximately R$ 102.6 million. On the second quarter of 2018, it didn’t have capitalized expenses in the property, plant and equipment, mainly by the no existence of qualified assets. Annual depreciation rates 06/30/2018
Structures and improvements 4.0%
Machinery, equipment and facilities 6.6%
Furniture and fixtures 10.0%
Vehicles 20% to 25%
Other assets 10% to 20% c) Assets offered as guarantee As at June 30, 2018, the Company had in its fixed assets, lands, farms e vehicles offered as guarantee in lawsuits totalizing R$ 19,358. Note 16 – Biological assets (forest reserves) Through its subsidiaries Duratex Florestal Ltda. and Duratex S.A. (new name of Tablemac S.A.), as well as, its jointly controlled, Caetex Florestal S.A., eucalyptus and pine forest reserves, which are primarily utilized as raw materials for producing wood panels, floors and complementarily for sale to third parties. The reserves guarantee supplies to the factories, and also protect the Company against the risk of future wood price increases. Operating in a sustainable way and integrated with the manufacturing facilities, these reserves, together with a supply network, provide the Company with a high degree of self-sufficiency in terms of wood supplies. As at June 30, 2018 the Group had roughly 173,200 hectares, of planted areas (December 31, 2017: 179,600 hectares) that are cultivated in the States of São Paulo, Minas Gerais, Rio Grande do Sul, Alagoas and in Colombia. a) Fair value estimate The fair value is calculated based on an estimate of the volume of wood ready for harvesting, at the current prices for standing wood, exception for: the Eucalyptus forests until one year old, and Pinus until 4 years old, which are stated at cost, because the values approximates to the fair value. Biological assets are measured at fair value, less selling costs at the time of harvesting. Fair value is determined by valuing the estimated ready-to-harvest volumes at current market prices, based on volume estimates. The assumptions utilized were:

Interim Financial Information of Duratex S.A. and its subsidiaries as at June 30, 2018.
37
i. Discounted cash flow – the estimated volume of ready-to-harvest wood, considering current market prices, net of costs to be incurred and the capital costs of the lands (brought to their present value) by the discount rate of 5.7% p.a., on June 30, 2018. The discount rate used in the cash flows corresponds to the weighted average cost of the Company, which is revised in annual basis by the Management. ii. Prices –prices in R$/ cubic meter obtained through market price surveys disclosed by specialized firms in regions and similar products to the Group, in addition to prices obtained from third party transactions, also in active markets. iii. Differentiation - the volumes harvested were categorized and valued according to: specie, (a) pinus and eucalyptus, (b) region, (c) destination: sawmill and processing. iv. Volume – the estimated volumes to be harvested (in the sixth year for eucalyptus and in the twelfth year for pine) based on the projected average productivity for each region and specie. Average productivity may vary based on age, rotation, climatic conditions, quality of seedlings, fires, and other natural risks. For mature forests are utilized the current volumes of wood. The estimates of volume are corroborate for rotating physical inventory realized for technical specialists from the second year of a forest's life, and its effects incorporated into the interim financial information. v. Regularity - expectations regarding to future wood prices and volumes are reviewed at least every quarter, or when the rotational physical inventory is concluded. b) Composition of balance The biological assets balance is made up of the cost of forest formation and adjustments to fair value, as shown below:
06/30/2018 12/31/2017
Formation cost of biological assets 994,328 1,044,450
Difference between cost and fair value 564,874 654,405
Fair value of the biological assets 1,559,202 1,698,855 The forests are unencumbered by any third party liens or pledges, including to financial institutions. In addition, none of the Company's forests has a restricted legal title. c) Changes in balance The following are the changes in the balance from the beginning to the end of the period:
06/30/2018 12/31/2017
Opening balance 1,698,855 1,528,917
Variation in fair value
Volume/price 71,850 214,933
Depletion (95,281) (123,118)
Transfer to current asset (*) (66,100) -
Variation in book value
Formation 97,305 176,343
Depletion (74,962) (98,220)
Transfer to current asset (*) (72,465) -
Final balance 1,559,202 1,698,855 (*) Refers to non-current asset available for sale in accordance to note 11.
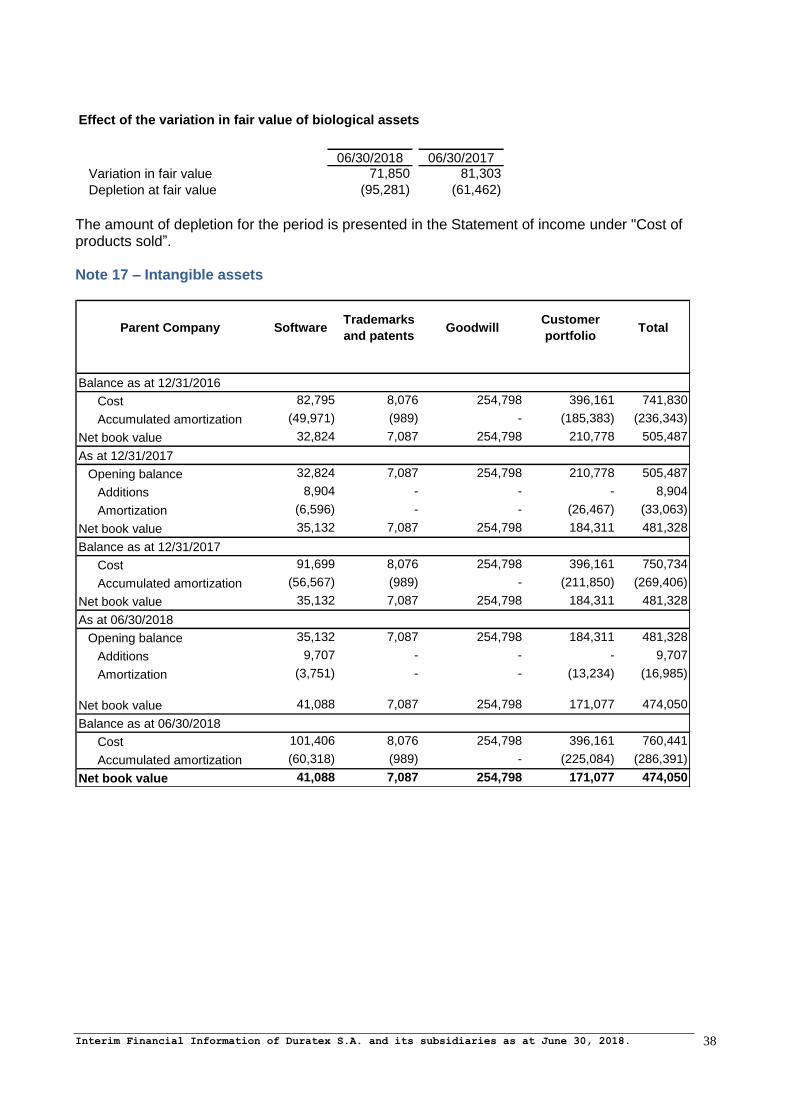
Interim Financial Information of Duratex S.A. and its subsidiaries as at June 30, 2018.
38
06/30/2018 06/30/2017
Variation in fair value 71,850 81,303
Depletion at fair value (95,281) (61,462)
Effect of the variation in fair value of biological assets
The amount of depletion for the period is presented in the Statement of income under "Cost of products sold”. Note 17 – Intangible assets
Balance as at 12/31/2016
Cost 82,795 8,076 254,798 396,161 741,830
Accumulated amortization (49,971) (989) - (185,383) (236,343)
Net book value 32,824 7,087 254,798 210,778 505,487
As at 12/31/2017
Opening balance 32,824 7,087 254,798 210,778 505,487
Additions 8,904 - - - 8,904
Amortization (6,596) - - (26,467) (33,063)
Net book value 35,132 7,087 254,798 184,311 481,328
Balance as at 12/31/2017
Cost 91,699 8,076 254,798 396,161 750,734
Accumulated amortization (56,567) (989) - (211,850) (269,406)
Net book value 35,132 7,087 254,798 184,311 481,328
As at 06/30/2018
Opening balance 35,132 7,087 254,798 184,311 481,328
Additions 9,707 - - - 9,707
Amortization (3,751) - - (13,234) (16,985)
Net book value 41,088 7,087 254,798 171,077 474,050
Balance as at 06/30/2018
Cost 101,406 8,076 254,798 396,161 760,441
Accumulated amortization (60,318) (989) - (225,084) (286,391)
Net book value 41,088 7,087 254,798 171,077 474,050
TotalParent Company SoftwareTrademarks
and patentsGoodwill
Customer
portfolio

Interim Financial Information of Duratex S.A. and its subsidiaries as at June 30, 2018.
39
Balance as at 12/31/2016
Cost 85,689 17,126 259,807 411,736 774,358
Accumulated amortization (51,629) (989) - (188,436) (241,054)
Net book value 34,060 16,137 259,807 223,300 533,304
As at 12/31/2017
Opening balance 34,060 16,137 259,807 223,300 533,304
Additions 8,975 - - - 8,975
Amortization (6,951) - - (27,307) (34,258)
Foreign exchange variances 14 - - 579 593
Acquisition of subsidiaries Ceusa and Massima 16 - - - 16
Goodwill - expectation of future profitability Ceusa and Massima - - 99,054 - 99,054
Appreciation of assets - Ceusa - 47,601 - - 47,601
Net book value 36,114 63,738 358,861 196,572 655,285
Balance as at 12/31/2017
Cost 94,694 64,727 358,861 412,315 930,597
Accumulated amortization (58,580) (989) - (215,743) (275,312)
Net book value 36,114 63,738 358,861 196,572 655,285
As at 06/30/2018
Opening balance 36,114 63,738 358,861 196,572 655,285
Additions 9,807 - 8,767 - 18,574
Write - offs - (5) - - (5)
Amortization (3,916) - - (13,832) (17,748)
Foreign exchange variances 119 - - 2,280 2,399
Net book value 42,124 63,733 367,628 185,020 658,505
Balance as at 06/30/2018
Cost 104,620 64,722 367,628 414,595 951,565
Accumulated amortization (62,496) (989) - (229,575) (293,060)
Net book value 42,124 63,733 367,628 185,020 658,505
TotalConsolidated SoftwareTrademarks and
patentsGoodwill
Customer
portfolio
Note 18 – Loans and financing
TYPE CHARGES AMORTIZATION GUARANTEESCURRENT
NON
CURRENTCURRENT
NON
CURRENTParent Company - Local currency
BNDES TJLP + 2.2% p.a. Monthly and Quarterly Surety - Itaúsa - Investimentos Itaú S.A. - - 289 -
BNDES TJLP + 2.7% p.a. Monthly Guarantee - Cia Ligna de Investimentos 362 240 361 419
BNDES TJLP + 2.8% p.a. Monthly and Quarterly Surety - 70% Itaúsa Investimentos Itaú S.A. and 30% natural person 21,554 32,714 23,518 42,438
BNDES Fixed 2.5% p.a. up to 7% p.a. Monthly and QuarterlySurety - 70% Itaúsa Investimentos Itaú S.A. and 30% natural person
997 434 1,410 759
BNDES Selic + 2.16% p.a. MonthlySurety - 70% Itaúsa Investimentos Itaú S.A. and 30% natural person
402 - 885 -
FINAME TJLP + 2.3% p.a./Fixed 6% p.a. Monthly and QuarterlyChattel mortgage and Promissory note
14,185 36,152 11,015 43,990
FINAME 6% p.a. Monthly Chattel mortgage and guarantee 848 4,214 850 4,633
EXPORT CREDIT with Swap 8 % p.a. Up to January 2018 - - - 20,186 -
EXPORT CREDIT 104.8 % of CDI Up to January 2021 - 208,929 303,333 203,411 404,167
EXPORT CREDIT 107.5 % of CDI Up to October 2019 - - 134,702 - 130,251
Commercial papers 104.5% of CDI Up to October 2020 - - 522,684 - 505,632
FUNDIEST 30 % IGP-M per month Up to December 2020 Guarantee - Companhia Ligna de Investimentos 31,067 35,919 28,555 49,973
PROINVEST / PRO FLORESTA
IGP-M + 4% p.a./IPCA + 6%
p.a. Up to January 2018Guarantee - Cia Ligna de investimentos and Mortgage of assets
- - 99 -
EXIM TJLP TJLP + 3.3% p.a. Up to September 2018 Promissory Note - - 117,406 -
EXIM SELIC Selic + 3.6% p.a. Up to September 2018 Promissory Note - - 56,429 -
FGPP - BANCO DO BRASIL with Swap Fixed 6,6% to 7,90% p.a Up to June 2020 1,787 383,887 - -
Total Parent Company - Local currency 280,131 1,454,279 464,414 1,182,262
Parent company - Foreign currency
RESOLUTION 4131 with Swap US$ + Libor + 1.5% p.a. August 2019 Promissory Note 1,142 177,119 756 177,631
RESOLUTION 4131 with Swap US$ + 2.82% p.a. June 2018 Promissory Note - - 175,690 -
RESOLUTION 4131 with Swap US$ + 2.11% p.a. June 2018 Promissory Note - - 53,735 -
RESOLUTION 4131 with Swap US$ + 3.66% p.a. August 2019 Promissory Note 92,597 89,972 2,287 181,145
Total Parent company - Foreign currency 93,739 267,091 232,468 358,776
TOTAL PARENT COMPANY 373,870 1,721,370 696,882 1,541,038
Subsidiaries - Local currency
EXPORT CREDIT NOTE 104.9% of CDI Up to January 2021 Surety - Duratex S.A. 38,017 70,715 39,632 106,073
BNDES TJLP + 2.8% p.a. Monthly and QuarterlySurety - 70% Itaúsa Investimentos Itaú S.A. and 30% natural person
30,962 42,062 18,843 59,136
BNDES 3.5 % p.a. MonthlySurety - 70% Itaúsa Investimentos Itaú S.A. and 30% natural person
1,148 764 1,150 1,337
CRA 98% of CDI Semiannually Guarantee - Duratex S.A. 843 693,199 726 692,429
FINAME Fixed 5.6 % p.a. Monthly and QuarterlyChattel mortgage and surety Duratex S.A.
451 997 675 1,068
FINAME Fixed 9 % p.a. Semiannually Chattel mortgage and surety Duratex S.A. 612 1,117 645 1,479
FINAME TJLP + 4 % p.a. Monthly Chattel mortgage and surety Duratex S.A. 1,121 5,536 582 6,181
FINAME SELIC + 4.28% p.a. Quarterly Chattel mortgage and surety Duratex S.A. 37 615 7 632
FNE Fixed 7.53% p.a. Annually Guarantee - Duratex Florestal Ltda. - 4,952 - -
DISCOUNTED INVOICES 1.65% per month Monthly - 366 - 3,631 -
CCB 100.5% of CDI Monthly Promissory Note - - 366 -
Total Subsidiaries - Local currency 73,557 819,957 66,257 868,335
Subsidiaries - Foreign currency
LEASING DTF + 2 % Monthly Promissory Note 118 745 293 627
CII Libor + 3.95 % p.a. Semiannually Pledge and mortgage of equipments - - 1,054 -
ACC 9.0 % p.a. Monthly - - - 338 -
Total Subsidiaries - Foreign currency 118 745 1,685 627
TOTAL SUBSIDIARIES 73,675 820,702 67,942 868,962
TOTAL CONSOLIDATED 447,545 2,542,072 764,824 2,410,000
06/30/2018 12/31/2017

Interim Financial Information of Duratex S.A. and its subsidiaries as at June 30, 2018.
40
Loans and financing designated at fair value The Company's management has elected to designate, at initial recognition, certain loans and financing (which may be identified in the previous table as swap) as liabilities at fair value through the results. The adoption of fair value on the debt justify the necessity to avoid accounting mismatch between debt instrument and protect instrument contracted by the Company, that is classified to fair value through the results. a) Sureties and letters of guarantee Sureties and letters of guarantee securing of borrowing of Duratex S.A. were granted by Itaúsa S.A., totaling R$ 39,271 (R$ 48,596 as at December 31, 2017), by Companhia Ligna de Investimentos, amounting to R$ 67,588 (R$ 79,407 as at December 31, 2017). In the case of loans and financing obtained by subsidiaries, sureties were granted by Itaúsa S.A., in the amount of R$ 52,455 (R$ 56,326 as at December 31, 2017), by Duratex S.A., in the amount of R$ 813,260 (R$ 850,129 as at December 31, 2017) and by Duratex Florestal Ltda. .in the amount of R$ 4,952. b) Covenants Loans and financing from the National Bank for Economic and Social Development (BNDES) are subject to restrictive clauses in accordance with usual market practice, which establishes in addition to certain common obligations, specify the following: b.1) The MDF plant in Uberaba – presentation of operating licenses, adoption of measures and actions intended to avoid or remedy damage to the environment, and measures related to occupational health and safety. In the financing agreement for the Uberaba MDF plant, the maintenance of “covenants” are based on the balance sheet of Duratex S.A., should the Company maintain a debt coverage limit by means: (i) EBITDA (*)/ Net financial expenses: equal or above 3.0; (ii) Stockholders’ equity/ total assets: equal or above 0.45, and (iii) EBITDA (*)/ Net operating revenue equal or above 0.20. b.2) HDF plant in Botucatu, MDFII plant in Agudos, Industrial Resins in Agudos, Ceramics in Jundiaí, Deca Sanitary Metals in São Paulo and Jundiaí and forestry area – maintenance during the contractual period, of the follow index based on Duratex S.A. annual audited balance sheet: (i) EBITDA (*)/Net Financial Expenses: above or equal to 3.0; (ii) EBITDA (*)/Net operating revenue equal or above 0.20, and (iii) Stockholders' Equity/Total Assets: equal or above 0.45. If these contractual obligations are not met, Duratex S.A. should provide additional guarantees. The Company declares that on June 30, 2018 the contractual obligations above are fully complied. (*) EBITDA (Earnings before Interest, Taxes, Depreciation and Amortization).

Interim Financial Information of Duratex S.A. and its subsidiaries as at June 30, 2018.
41
c) Loans and financing from non-current liability by maturity
Year
Local Foreign Local Foreign
currency currency currency currency
2019 162,225 267,090 429,315 183,681 267,297 450,978
2020 1,241,258 - 1,241,258 1,300,800 123 1,300,923
2021 42,116 - 42,116 82,227 101 82,328
2022 5,037 - 5,037 699,273 76 699,349
2023 2,234 - 2,234 2,762 84 2,846
2024 1,379 - 1,379 1,938 93 2,031
2025 31 - 31 542 59 601
Other - - - 3,016 - 3,016
Total 1,454,280 267,090 1,721,370 2,274,239 267,833 2,542,072
Loans and financing - Maturities
06/30/2018
Parent company Consolidated
Total Total
Year
Local Foreign Local Foreign
currency currency currency currency
2019 291,393 358,775 650,168 367,053 358,951 726,004
2020 840,093 - 840,093 899,551 103 899,654
2021 42,097 - 42,097 81,837 85 81,922
2022 5,037 - 5,037 698,171 64 698,235
2023 2,234 - 2,234 2,415 71 2,486
2024 1,378 - 1,378 1,540 78 1,618
2025 31 - 31 31 50 81
Total 1,182,263 358,775 1,541,038 2,050,598 359,402 2,410,000
TotalTotal
Parent company Consolidated
12/31/2017

Interim Financial Information of Duratex S.A. and its subsidiaries as at June 30, 2018.
42
Note 19 – Accounts payable
06/30/2018 12/31/2017 06/30/2018 12/31/2017
Advances from customers 2,051 12,564 6,840 19,163
Statutory share 4,546 7,676 4,546 7,676
Freight and insurance payable 13,156 9,669 21,604 14,439
Acquisition of Business 32,091 36,930 32,091 36,930
Distributed earnings (from SCP's) to shareholders (1) - - - 17,347
Commission payable 6,917 5,700 9,552 7,740
Bonuses,product warranty, technical support and maintenance 14,362 10,630 18,829 12,697
Acquisition of land used for reforestation - - 7,915 5,334
Accounts payable (from SCPs) to shareholders - - 32,505 27,043
Consigned loans 1,458 1,406 1,766 1,702
Sales for future delivery 5,877 5,171 5,877 5,171
Others 4,744 2,565 13,526 8,462
Total Current 85,202 92,311 155,051 163,704
Acquisition of Business 32,389 32,254 32,389 32,254
Advances from customers - - 1,535 5,392
Partnerships in which some partners are passive (2) - - 93,538 93,538
Product warranty and technical support 4,060 4,118 4,060 4,118
Commercial leasing - - 9,136 9,403
Liabilities provisioned with joint operation partner - - 31,583 25,303
Post-employment benefits(3) 11,495 11,495 11,495 11,495
Other 3,049 1,339 2,232 486
Total Non-Current 50,993 49,206 185,968 181,989
Parent company Consolidated
(1) SCPs: Partnerships in which some partners are passive (2) Refers to the value of the participation of third parties in reforestation projects at the Group, which the subsidiary Duratex Florestal has contributed with forest assets, basically forest reserves and equity holders has contributed in kind. (3) Refers to post-employment benefits related to medical assistance.
Note 20 – Taxes and contributions The Company and its subsidiaries have provisions and federal and state taxes liabilities to pay, in according to composition presented:
06/30/2018 12/31/2017 06/30/2018 12/31/2017
Income tax and social contribution payable / provision 317 314 23,009 16,331
PIS and COFINS payable / provision 4,672 4,517 7,366 4,542
ICMS and IPI payable 21,975 22,113 38,326 33,663
INSS payable 353 406 1,049 1,283
Tax installment - PERT (1) - 4,781 - 87,585
Other taxes payable 266 259 347 322
Total current 27,583 32,390 70,097 143,726
Parent company Consolidated
(1) In the heading tax installment – PERT are recorded the amounts of federal tax object of Special Program of Tax Regularization (PERT) together with Procuradoria da Fazenda Nacional, under the terms of Law 13.496/2017, considering the discounts arising by adhesion to this program. In the companies Cerâmica Urussanga and Massima, that became to be controlled by Duratex in October 2017, the balance in the liability on December 31, 2017, related to the tax included on PERT totalized R$ 82,803 and was settled in the first quarter. In the parent company, Duratex S.A., the balance in the liabilities of tax in PERT on December 31, 2017 totalizes R$ 4,781. Duratex settled the totality of amount due in the PERT on December 31, 2017, using tax credit of income tax from accumulated fiscal loss, as provide the Law.
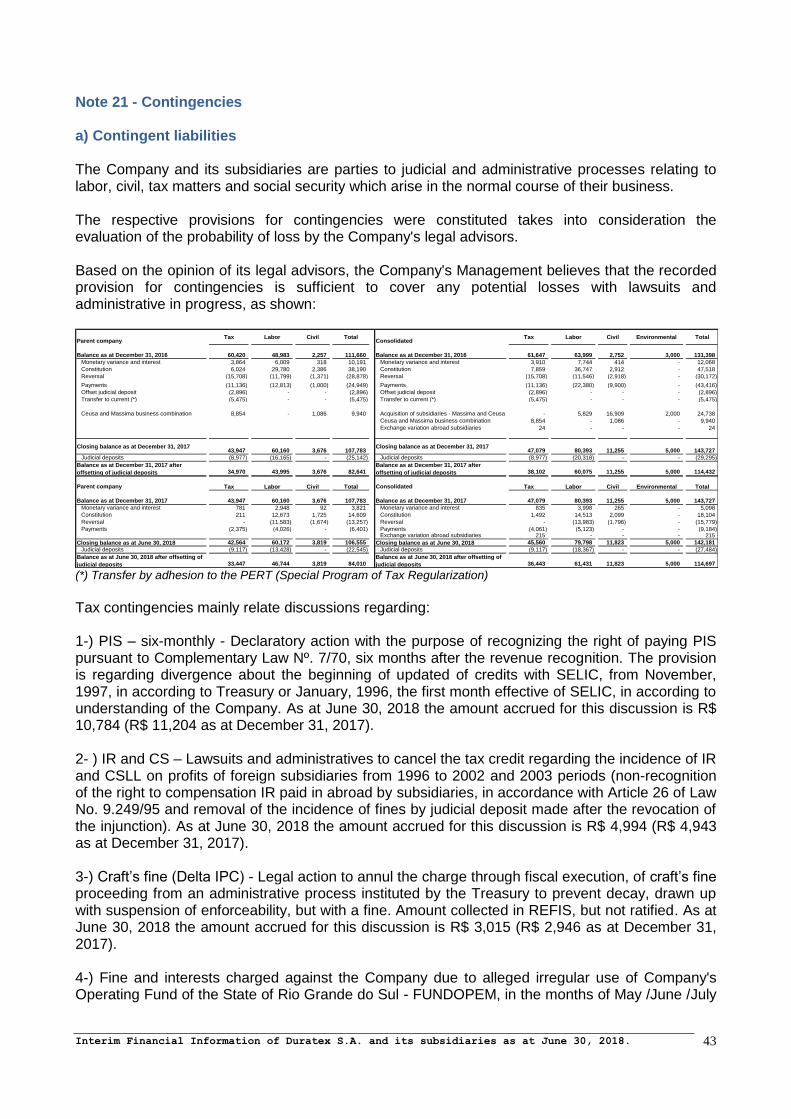
Interim Financial Information of Duratex S.A. and its subsidiaries as at June 30, 2018.
43
Note 21 - Contingencies a) Contingent liabilities The Company and its subsidiaries are parties to judicial and administrative processes relating to labor, civil, tax matters and social security which arise in the normal course of their business. The respective provisions for contingencies were constituted takes into consideration the evaluation of the probability of loss by the Company's legal advisors. Based on the opinion of its legal advisors, the Company's Management believes that the recorded provision for contingencies is sufficient to cover any potential losses with lawsuits and administrative in progress, as shown: Parent company
Tax Labor Civil TotalConsolidated
Tax Labor Civil Environmental Total
Balance as at December 31, 2016 60,420 48,983 2,257 111,660 Balance as at December 31, 2016 61,647 63,999 2,752 3,000 131,398
Monetary variance and interest 3,864 6,009 318 10,191 Monetary variance and interest 3,910 7,744 414 - 12,068
Constitution 6,024 29,780 2,386 38,190 Constitution 7,859 36,747 2,912 - 47,518
Reversal (15,708) (11,799) (1,371) (28,878) Reversal (15,708) (11,546) (2,918) - (30,172)
Payments (11,136) (12,813) (1,000) (24,949) Payments (11,136) (22,380) (9,900) - (43,416)
Offset judicial deposit (2,896) - - (2,896) Offset judicial deposit (2,896) - - - (2,896)
Transfer to current (*) (5,475) - - (5,475) Transfer to current (*) (5,475) - - - (5,475)
Ceusa and Massima business combination 8,854 - 1,086 9,940 Acquisition of subsidiaries - Massima and Ceusa - 5,829 16,909 2,000 24,738
Ceusa and Massima business combination 8,854 - 1,086 - 9,940
Exchange variation abroad subsidiaries 24 - - - 24
Closing balance as at December 31, 201743,947 60,160 3,676 107,783
Closing balance as at December 31, 201747,079 80,393 11,255 5,000 143,727
Judicial deposits (8,977) (16,165) - (25,142) Judicial deposits (8,977) (20,318) - - (29,295)
Balance as at December 31, 2017 after
offsetting of judicial deposits 34,970 43,995 3,676 82,641 Balance as at December 31, 2017 after
offsetting of judicial deposits 38,102 60,075 11,255 5,000 114,432
Parent company Tax Labor Civil Total Consolidated Tax Labor Civil Environmental Total
Balance as at December 31, 2017 43,947 60,160 3,676 107,783 Balance as at December 31, 2017 47,079 80,393 11,255 5,000 143,727
Monetary variance and interest 781 2,948 92 3,821 Monetary variance and interest 835 3,998 265 - 5,098
Constitution 211 12,673 1,725 14,609 Constitution 1,492 14,513 2,099 - 18,104
Reversal - (11,583) (1,674) (13,257) Reversal - (13,983) (1,796) - (15,779)
Payments (2,375) (4,026) - (6,401) Payments (4,061) (5,123) - - (9,184) Exchange variation abroad subsidiaries 215 - - - 215
Closing balance as at June 30, 2018 42,564 60,172 3,819 106,555 Closing balance as at June 30, 2018 45,560 79,798 11,823 5,000 142,181
Judicial deposits (9,117) (13,428) - (22,545) Judicial deposits (9,117) (18,367) - - (27,484)
Balance as at June 30, 2018 after offsetting of
judicial deposits 33,447 46,744 3,819 84,010 Balance as at June 30, 2018 after offsetting of
judicial deposits 36,443 61,431 11,823 5,000 114,697
(*) Transfer by adhesion to the PERT (Special Program of Tax Regularization)
Tax contingencies mainly relate discussions regarding: 1-) PIS – six-monthly - Declaratory action with the purpose of recognizing the right of paying PIS pursuant to Complementary Law Nº. 7/70, six months after the revenue recognition. The provision is regarding divergence about the beginning of updated of credits with SELIC, from November, 1997, in according to Treasury or January, 1996, the first month effective of SELIC, in according to understanding of the Company. As at June 30, 2018 the amount accrued for this discussion is R$ 10,784 (R$ 11,204 as at December 31, 2017). 2- ) IR and CS – Lawsuits and administratives to cancel the tax credit regarding the incidence of IR and CSLL on profits of foreign subsidiaries from 1996 to 2002 and 2003 periods (non-recognition of the right to compensation IR paid in abroad by subsidiaries, in accordance with Article 26 of Law No. 9.249/95 and removal of the incidence of fines by judicial deposit made after the revocation of the injunction). As at June 30, 2018 the amount accrued for this discussion is R$ 4,994 (R$ 4,943 as at December 31, 2017). 3-) Craft’s fine (Delta IPC) - Legal action to annul the charge through fiscal execution, of craft’s fine proceeding from an administrative process instituted by the Treasury to prevent decay, drawn up with suspension of enforceability, but with a fine. Amount collected in REFIS, but not ratified. As at June 30, 2018 the amount accrued for this discussion is R$ 3,015 (R$ 2,946 as at December 31, 2017). 4-) Fine and interests charged against the Company due to alleged irregular use of Company's Operating Fund of the State of Rio Grande do Sul - FUNDOPEM, in the months of May /June /July
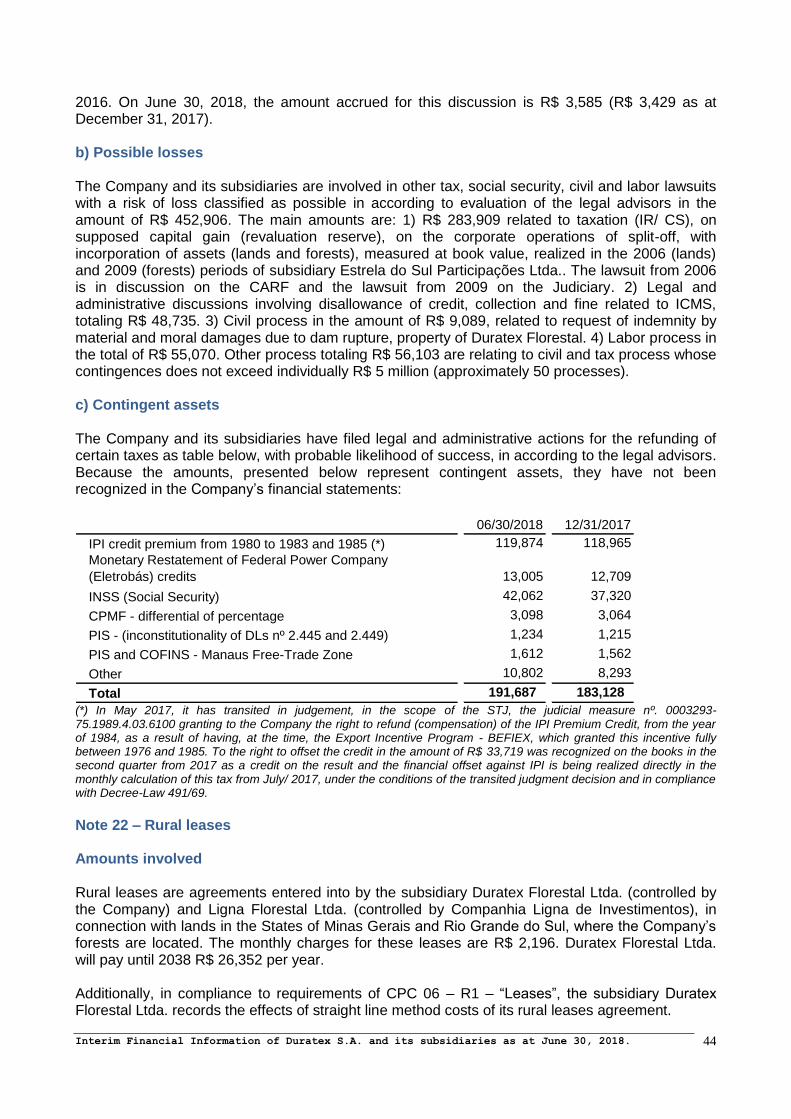
Interim Financial Information of Duratex S.A. and its subsidiaries as at June 30, 2018.
44
2016. On June 30, 2018, the amount accrued for this discussion is R$ 3,585 (R$ 3,429 as at December 31, 2017). b) Possible losses The Company and its subsidiaries are involved in other tax, social security, civil and labor lawsuits with a risk of loss classified as possible in according to evaluation of the legal advisors in the amount of R$ 452,906. The main amounts are: 1) R$ 283,909 related to taxation (IR/ CS), on supposed capital gain (revaluation reserve), on the corporate operations of split-off, with incorporation of assets (lands and forests), measured at book value, realized in the 2006 (lands) and 2009 (forests) periods of subsidiary Estrela do Sul Participações Ltda.. The lawsuit from 2006 is in discussion on the CARF and the lawsuit from 2009 on the Judiciary. 2) Legal and administrative discussions involving disallowance of credit, collection and fine related to ICMS, totaling R$ 48,735. 3) Civil process in the amount of R$ 9,089, related to request of indemnity by material and moral damages due to dam rupture, property of Duratex Florestal. 4) Labor process in the total of R$ 55,070. Other process totaling R$ 56,103 are relating to civil and tax process whose contingences does not exceed individually R$ 5 million (approximately 50 processes). c) Contingent assets The Company and its subsidiaries have filed legal and administrative actions for the refunding of certain taxes as table below, with probable likelihood of success, in according to the legal advisors. Because the amounts, presented below represent contingent assets, they have not been recognized in the Company’s financial statements:
06/30/2018 12/31/2017
IPI credit premium from 1980 to 1983 and 1985 (*) 119,874 118,965
Monetary Restatement of Federal Power Company
(Eletrobás) credits 13,005 12,709
INSS (Social Security) 42,062 37,320
CPMF - differential of percentage 3,098 3,064
PIS - (inconstitutionality of DLs nº 2.445 and 2.449) 1,234 1,215
PIS and COFINS - Manaus Free-Trade Zone 1,612 1,562
Other 10,802 8,293
Total 191,687 183,128 (*) In May 2017, it has transited in judgement, in the scope of the STJ, the judicial measure nº. 0003293-75.1989.4.03.6100 granting to the Company the right to refund (compensation) of the IPI Premium Credit, from the year of 1984, as a result of having, at the time, the Export Incentive Program - BEFIEX, which granted this incentive fully between 1976 and 1985. To the right to offset the credit in the amount of R$ 33,719 was recognized on the books in the second quarter from 2017 as a credit on the result and the financial offset against IPI is being realized directly in the monthly calculation of this tax from July/ 2017, under the conditions of the transited judgment decision and in compliance with Decree-Law 491/69.
Note 22 – Rural leases Amounts involved Rural leases are agreements entered into by the subsidiary Duratex Florestal Ltda. (controlled by the Company) and Ligna Florestal Ltda. (controlled by Companhia Ligna de Investimentos), in connection with lands in the States of Minas Gerais and Rio Grande do Sul, where the Company’s forests are located. The monthly charges for these leases are R$ 2,196. Duratex Florestal Ltda. will pay until 2038 R$ 26,352 per year. Additionally, in compliance to requirements of CPC 06 – R1 – “Leases”, the subsidiary Duratex Florestal Ltda. records the effects of straight line method costs of its rural leases agreement.
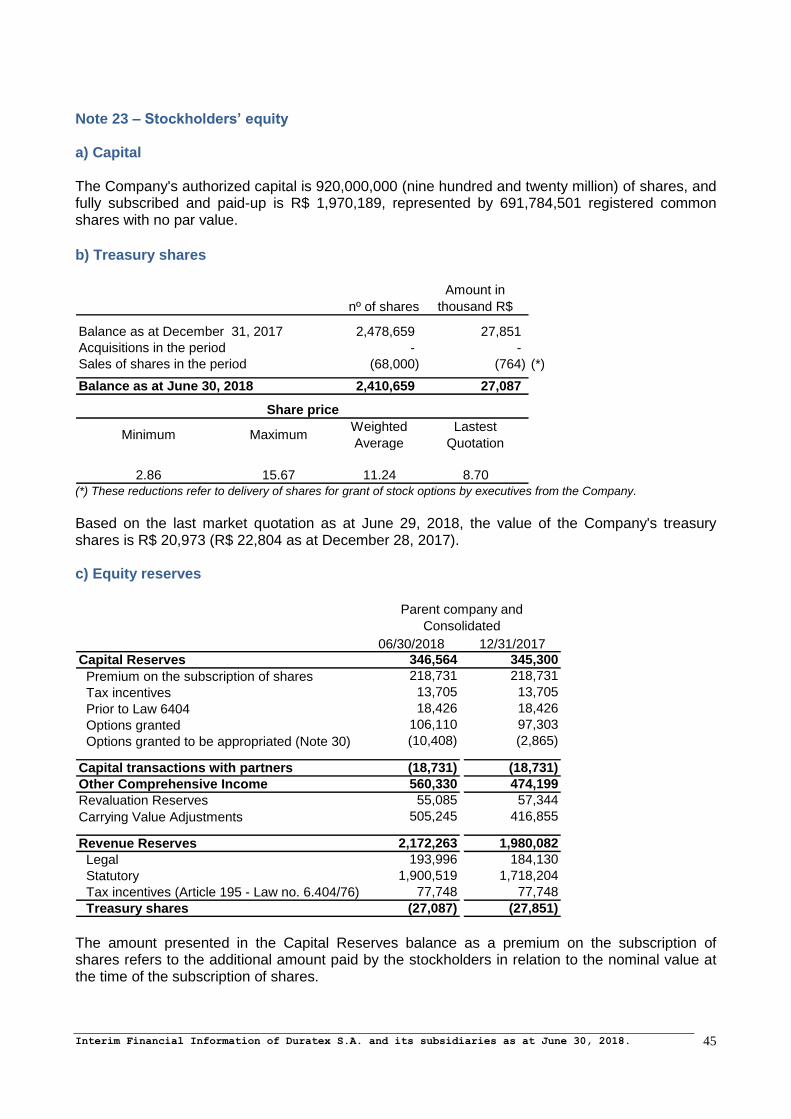
Interim Financial Information of Duratex S.A. and its subsidiaries as at June 30, 2018.
45
Note 23 – Stockholders’ equity a) Capital The Company's authorized capital is 920,000,000 (nine hundred and twenty million) of shares, and fully subscribed and paid-up is R$ 1,970,189, represented by 691,784,501 registered common shares with no par value.
b) Treasury shares
nº of shares
Amount in
thousand R$
Balance as at December 31, 2017 2,478,659 27,851
Acquisitions in the period - -
Sales of shares in the period (68,000) (764) (*)
Balance as at June 30, 2018 2,410,659 27,087
Minimum MaximumWeighted
Average
Lastest
Quotation
2.86 15.67 11.24 8.70
Share price
(*) These reductions refer to delivery of shares for grant of stock options by executives from the Company.
Based on the last market quotation as at June 29, 2018, the value of the Company's treasury shares is R$ 20,973 (R$ 22,804 as at December 28, 2017). c) Equity reserves
06/30/2018 12/31/2017
Capital Reserves 346,564 345,300
Premium on the subscription of shares 218,731 218,731
Tax incentives 13,705 13,705
Prior to Law 6404 18,426 18,426
Options granted 106,110 97,303
Options granted to be appropriated (Note 30) (10,408) (2,865)
Capital transactions with partners (18,731) (18,731)
Other Comprehensive Income 560,330 474,199
Revaluation Reserves 55,085 57,344
Carrying Value Adjustments 505,245 416,855
Revenue Reserves 2,172,263 1,980,082
Legal 193,996 184,130
Statutory 1,900,519 1,718,204
Tax incentives (Article 195 - Law no. 6.404/76) 77,748 77,748
Treasury shares (27,087) (27,851)
Parent company and
Consolidated
The amount presented in the Capital Reserves balance as a premium on the subscription of shares refers to the additional amount paid by the stockholders in relation to the nominal value at the time of the subscription of shares.

Interim Financial Information of Duratex S.A. and its subsidiaries as at June 30, 2018.
46
The amount of Options Granted in the Capital Reserves represents the recognition of the awarding of the options on the grant date. As provided in the bylaws, the balance appropriated to the statutory reserve will be utilized for: (i) The Reserve for Dividend Equalization, (ii) The Reserve for Increasing Working Capital, and (iii) The Reserve for Capital Increases in Investees. Reserve for Dividend Equalization: Will be limited to 40% (forty percent) of the capital and its purpose will be the payment of dividends, including as interest on capital (Article 29,2) or its advances, to maintain the payment to stockholders being formed with resources: (a) the equivalent to up to 50% (fifty percent) of net income, adjusted in accordance with Article 202 of Brazilian Corporation Law; (b) equivalent to up to 100% (one hundred percent) of the portion of the Revaluation Reserves, recorded as retained earnings; (c) equivalent to up to 100% (one hundred percent) of prior year adjustments, recorded as retained earnings; and (d) resulting from the credit to dividends anticipation (Article 29,1 of the bylaws) The Reserve for Increasing Working Capital: Will be limited to 30% (thirty percent) of the capital and its purpose is to guarantee funds for the company's operations, comprising resources equivalent to up to 20% (twenty percent) of net income, adjusted in accordance with Article 202 of Brazilian Corporation Law.
The Reserve for Capital Increases in Investees: Will be limited to 30% (thirty percent) of registered capital and its purpose will be of exercising preemptive subscription right in capital increases of such companies, being made resources equivalent of to up to 50% (fifty percent) of the net income, adjusted in accordance with Article 202 of Brazilian Corporation Law.
Note 24 – Insurance coverage As at June 30, 2018, the Company and its subsidiaries had insurance coverage against fire and various risks relating to property, plant and equipment and inventory. Under the terms of the insurance policies, the value of the coverage are R$ 4,368 million. The Group does not have insurance coverage for its forests. To minimize the risk to these assets, it maintains an internal fire brigade, observation towers system, fire trucks and motorized forest guards. The Group has not suffered losses as a result of forest fires. Note 25 – Net sales revenue The reconciliation of gross sales revenue for net sales revenue are presented as follows:
06/30/2018 06/30/2017 06/30/2018 06/30/2017
Gross sales revenue 2,105,356 1,974,419 2,710,839 2,352,612
Domestic market 1,888,654 1,811,656 2,255,668 2,014,133
Foreign market 216,702 162,763 455,171 338,479
Taxes and contributions on sales (445,100) (423,322) (537,380) (483,899)
Net sales revenue 1,660,256 1,551,097 2,173,459 1,868,713
Parent Company Consolidated

Interim Financial Information of Duratex S.A. and its subsidiaries as at June 30, 2018.
47
Note 26 – Expenses, by nature
06/30/2018 06/30/2017 06/30/2018 06/30/2017
Variation in fair value of biological assets - - 71,850 81,303
Variations in the inventories of finished products
and work in process 254,898 204,972 179,548 149,383
Raw materials and consumption materials (1,081,590) (995,222) (1,079,480) (963,832)
Remuneration, charges and benefits to employees (330,984) (331,038) (433,300) (409,222)
Depreciation charges, amortization and depletion (134,813) (132,988) (329,110) (258,965)
Transport expenses (131,524) (133,636) (158,851) (160,470)
Advertising expenses (34,209) (43,052) (42,986) (57,821)
Other expenses (163,952) (149,817) (191,267) (141,380)
Total expenses, by nature (1,622,174) (1,580,781) (1,983,596) (1,761,004)
Parent Company Consolidated
The expenses by nature described above represent the following captions of the statement of income.
06/30/2018 06/30/2017 06/30/2018 06/30/2017
Variation in the fair value of the biological assets - - 71,850 81,303
Cost of products sold (1,319,049) (1,284,893) (1,661,133) (1,472,618)
Selling expenses (248,810) (244,027) (314,332) (299,755)
General and administrative expenses (54,315) (51,861) (79,981) (69,934)
Total (1,622,174) (1,580,781) (1,983,596) (1,761,004)
Parent company Consolidated
Note 27 – Financial income and expenses
06/30/2018 06/30/2017 06/30/2018 06/30/2017
Financial income
Remuneration on financial investments 11,452 22,842 27,487 65,641
Foreign exchange variances 20,636 2,409 20,192 1,814
Indexation adjustment 1,848 4,332 2,179 4,574
Interest and discounts obtained 5,098 6,766 7,739 13,821
Other 108 217 442 418
Total 39,142 36,566 58,039 86,268
Financial expenses
Charges on financing -Local currency (59,346) (72,055) (89,844) (135,374)
Charges on financing -Foreign currency (99,188) (19,078) (99,272) (19,701)
Foreign exchange variances (5,787) (839) (7,323) (5,175)
Indexation adjustment (1,147) (3,314) (1,624) (4,271)
Derivatives 62,590 (28,774) 64,966 (26,129)
Bank charges (2,729) (2,508) (4,114) (3,527)
Tax on financial operations (55) (55) (279) (346)
Other (2,013) (1,919) (12,368) (13,663)
Total (107,675) (128,542) (149,858) (208,186)
Total financial result (68,533) (91,976) (91,819) (121,918)
Parent company Consolidated
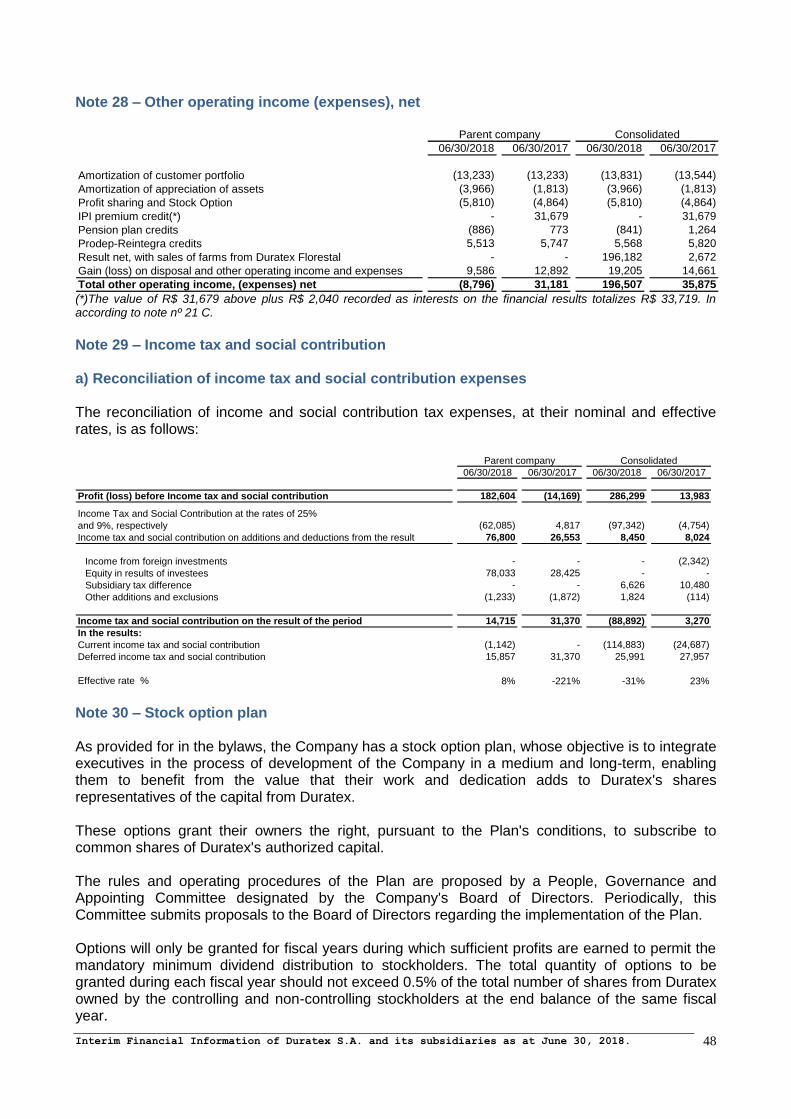
Interim Financial Information of Duratex S.A. and its subsidiaries as at June 30, 2018.
48
Note 28 – Other operating income (expenses), net
06/30/2018 06/30/2017 06/30/2018 06/30/2017
Amortization of customer portfolio (13,233) (13,233) (13,831) (13,544)
Amortization of appreciation of assets (3,966) (1,813) (3,966) (1,813)
Profit sharing and Stock Option (5,810) (4,864) (5,810) (4,864)
IPI premium credit(*) - 31,679 - 31,679
Pension plan credits (886) 773 (841) 1,264
Prodep-Reintegra credits 5,513 5,747 5,568 5,820
Result net, with sales of farms from Duratex Florestal - - 196,182 2,672
Gain (loss) on disposal and other operating income and expenses 9,586 12,892 19,205 14,661
Total other operating income, (expenses) net (8,796) 31,181 196,507 35,875
Parent company Consolidated
(*)The value of R$ 31,679 above plus R$ 2,040 recorded as interests on the financial results totalizes R$ 33,719. In according to note nº 21 C.
Note 29 – Income tax and social contribution a) Reconciliation of income tax and social contribution expenses The reconciliation of income and social contribution tax expenses, at their nominal and effective rates, is as follows:
06/30/2018 06/30/2017 06/30/2018 06/30/2017
Profit (loss) before Income tax and social contribution 182,604 (14,169) 286,299 13,983
Income Tax and Social Contribution at the rates of 25%
and 9%, respectively (62,085) 4,817 (97,342) (4,754)
Income tax and social contribution on additions and deductions from the result 76,800 26,553 8,450 8,024
Income from foreign investments - - - (2,342)
Equity in results of investees 78,033 28,425 - -
Subsidiary tax difference - - 6,626 10,480
Other additions and exclusions (1,233) (1,872) 1,824 (114)
Income tax and social contribution on the result of the period 14,715 31,370 (88,892) 3,270
In the results:
Current income tax and social contribution (1,142) - (114,883) (24,687)
Deferred income tax and social contribution 15,857 31,370 25,991 27,957
Effective rate % 8% -221% -31% 23%
Parent company Consolidated
Note 30 – Stock option plan As provided for in the bylaws, the Company has a stock option plan, whose objective is to integrate executives in the process of development of the Company in a medium and long-term, enabling them to benefit from the value that their work and dedication adds to Duratex's shares representatives of the capital from Duratex. These options grant their owners the right, pursuant to the Plan's conditions, to subscribe to common shares of Duratex's authorized capital. The rules and operating procedures of the Plan are proposed by a People, Governance and Appointing Committee designated by the Company's Board of Directors. Periodically, this Committee submits proposals to the Board of Directors regarding the implementation of the Plan. Options will only be granted for fiscal years during which sufficient profits are earned to permit the mandatory minimum dividend distribution to stockholders. The total quantity of options to be granted during each fiscal year should not exceed 0.5% of the total number of shares from Duratex owned by the controlling and non-controlling stockholders at the end balance of the same fiscal year.

Interim Financial Information of Duratex S.A. and its subsidiaries as at June 30, 2018.
49
The exercise price payable to Duratex will be defined by the People, Governance and Appointing Committee when granting the option. In order to define the exercise price, the People Committee will consider the average price of Duratex's common shares in BM&FBOVESPA trading sessions for a period of five to ninety days prior to the option issue date. This will be at the discretion of the Committee, which may make an upward or downward adjustment of up to 30%. The prices established will be readjusted, until the prior month to the exercise of the options, based on the IGP-M index, or, in its absence, by index designated by the people Committee.
2007 2008 2009 2010 2011 2012 2013 2014 2016 2018
Total stock options granted 2,787,034 2,678,887 2,517,937 1,333,914 1,875,322 1,290,994 1,561,061 1,966,869 1,002,550 1,046,595
Exercise price on the grant date 11.82 15.34 9.86 16.33 13.02 10.21 14.45 11.44 5.74 9.02
Fair value on the grant date 8.88 7.26 3.98 7.04 5.11 5.69 6.54 4.48 4.00 5.19
Deadline to exercise 10 years 10 years 8 years 8 years 8.5 years 8.8 years 8.9 years 8.10 years 8,9 anos 8,8 anos
Vesting period 1.5 years 1.5 years 3 years 3 years 3.5 years 3.8 years 3.9 years 3.10 years 3,9 anos 3,8 anos
The following economic assumptions were utilized to determine these amounts:
2007 2008 2009 2010 2011 2012 2013 2014 2016 2018
Volatility of share price 36.60% 36.60% 46.20% 38.50% 32.81% 37.91% 34.13% 28.41% 39.82% 38.09%
Dividend yield 2.00% 2.00% 2.00% 2.00% 2.00% 2.00% 2.00% 2.00% 2.00% 2.00%
Risk-free rate of return (1) 7.60% 7.20% 6.20% 7.10% 5.59% 4.38% 3.58% 6.39% 6.95% 4.67%
Actual exercise rate 96.63% 96.63% 96.63% 96.63% 96.63% 96.63% 96.63% 96.63% 94.90% 94.90%
The Company settles this benefit plan by transferring shares, which are kept in treasury until the actual exercise of the options by the executives.
In 2015 and 2017 there were no stock option grant of the Company.
(1) General Market Price Index (IGP-M)
Statement of value and appropriation of the options granted:
Grant Qty Vesting Term for Grant Option Total Other
Date Granted Date Maturity price 12/31/2017 06/30/2018 Price Value Value from 2007
to 2014 2015 2016 2017 2018Periods
02/08/2006 2,659,180 06/30/2007 12/31/2016 11.16 - - 9.79 - 586 586 - - - -
01/31/2007 2,787,034 06/30/2008 12/31/2017 11.82 - - 8.88 - 24,758 24,758 - - - -
02/13/2008 2,678,887 06/30/2009 12/31/2018 15.34 1,132,434 1,132,434 7.26 19,456 - 19,456 - - - -
06/30/2009 2,517,937 06/30/2012 12/31/2017 9.86 - - 3.98 - 9,194 9,194 - - - -
04/14/2010 1,333,914 12/31/2013 12/31/2018 16.33 685,019 685,019 7.04 8,716 - 8,716 - - - -
06/29/2011 1,875,322 12/31/2014 12/31/2019 13.02 1,227,778 1,215,323 5.11 9,208 - 9,208 - - - -
04/09/2012 1,290,994 12/31/2015 12/31/2020 10.21 658,552 652,757 5.69 6,390 - 5,203 1,187 - - -
04/17/2013 1,561,061 12/31/2016 12/31/2021 14.45 1,025,843 1,017,620 6.54 8,443 - 4,399 2,290 1,754 - -
02/11/2014 1,966,869 12/31/2017 12/31/2022 11.44 1,872,257 1,862,299 4.48 8,214 - 2,062 2,240 2,232 1,680 -
03/09/2016 1,002,550 12/31/2019 12/31/2024 5.74 990,050 914,400 4.00 5,632 - - - 1,251 1,515 867 1,999
04/26/2018 1,046,595 12/31/2021 12/31/2026 9.02 - 1,046,595 5.19 9,429 - - - - - 461 8,968
Total 20,720,343 7,591,933 8,526,447 75,488 34,538 83,582 5,717 5,237 3,195 1,328 10,967
Effective exercise rate 94.90% 96.63% 96.63% 96.63% 96.63% 96.63% 94.90% 94.90%
Value established 72,736 33,374 80,765 (1) 5,524 (2) 5,061 (3) 3,087 (4) 1,265 (5) 10,408 (6)
(1) Amount recorded against income from 2007 to 2014
(2) Amount recorded against income for 2015
(3) Amount recorded against income for 2016
(4) Amount recorded against income for 2017
(5) Amount recorded against income in the six months of 2018
(6) Amount to be recorded against income in other periods
Balance to be Exercised Competence
As at June 30, 2018, the Company had 2,410,659 treasury shares that could be utilized for the eventual exercise of options. Note 31 – Private pension plan The Company and its subsidiaries are part of a group of sponsors of Fundação Itaúsa Industrial, a non-profit organization which has as its objective the administration of private plans providing pensions or supplementary income benefits, similar to those of the National Social Security. The Fundação manages a Defined Contribution Plan (DC Plan) and a Defined Benefit Plan (DB Plan). Defined contribution plan – (DC Plan) This plan is offered to every employee eligible to the plan and as at June 30, 2018 had 6,370 participants (6,201 participants as at December 31, 2017). In the DC Plan - PAI (Individual Retirement Plan) there is no actuarial risk, and the investment risk is borne by the participants. The current regulation stipulates sponsor contributions of 50% to 100% of the amounts paid in by participants.

Interim Financial Information of Duratex S.A. and its subsidiaries as at June 30, 2018.
50
Pension Program Fund The contributions by sponsors that remain in the plan as a result of participants who opted to be paid out or who anticipated their retirement formed the Pension Program Fund, which, according to the plan's regulations, is being utilized to compensate the contributions by sponsors. Defined benefit Plan – (DB Plan) The DB Plan has the basic purpose of granting benefits in the form of a lifetime monthly income to complement National Social Security payments, according to the plan’s regulations. This plan is being discontinued, and enrollment by new participants is not permitted. The plan includes the following benefits: a retirement supplement, based on the period of contribution, special conditions by age, disability, lifetime monthly income, retirement premium, and a death benefit. During the period of three months ended on June 30, 2018, do not have changes in the conditions and benefits of the plan, as well as in relation to the assumptions used for its evaluation and accounting record. Note 32 – Medical assistance Plan “Post-employment” The Company offers both contributory plans, currently with co-participation, as contributories plans (Tubarão – SC unit) to its employees and their dependents, through 13 health care providers, totaling 29,000 lives (actives, dismissed, retired and dependents) characterizing the obligation of extension to coverage for dismissed and retired persons according to Law 9,656/98. As at June 30, 2018 the actuarial passive net of tax is R$ 6,520. Note 33 – Earnings per share (a) Basic The basic earnings per share are calculated dividing the net income attributable to the Company’s stockholders by the weighted average number of common shares outstanding during the period, excluding common shares purchased by the Company as treasury shares.
06/30/2018 06/30/2017
Earnings attributable to the Company's stockholders 197,319 17,201
Weighted average number of common shares issued (In thousands) 691,785 691,785
Weighted average of treasury shares (In thousands) (2,446) (2,486)
Weighted average number of common shares outstanding (In thousands) 689,339 689,299
Basic earnings per share 0.2862 0.0250 (b) Diluted Diluted earnings per share are calculated dividing the net income attributable to the Company’s stockholders after the adjustments of weighted average common shares outstanding, assuming the conversion of all potential diluted common shares adjusted by the program of Stock Options.
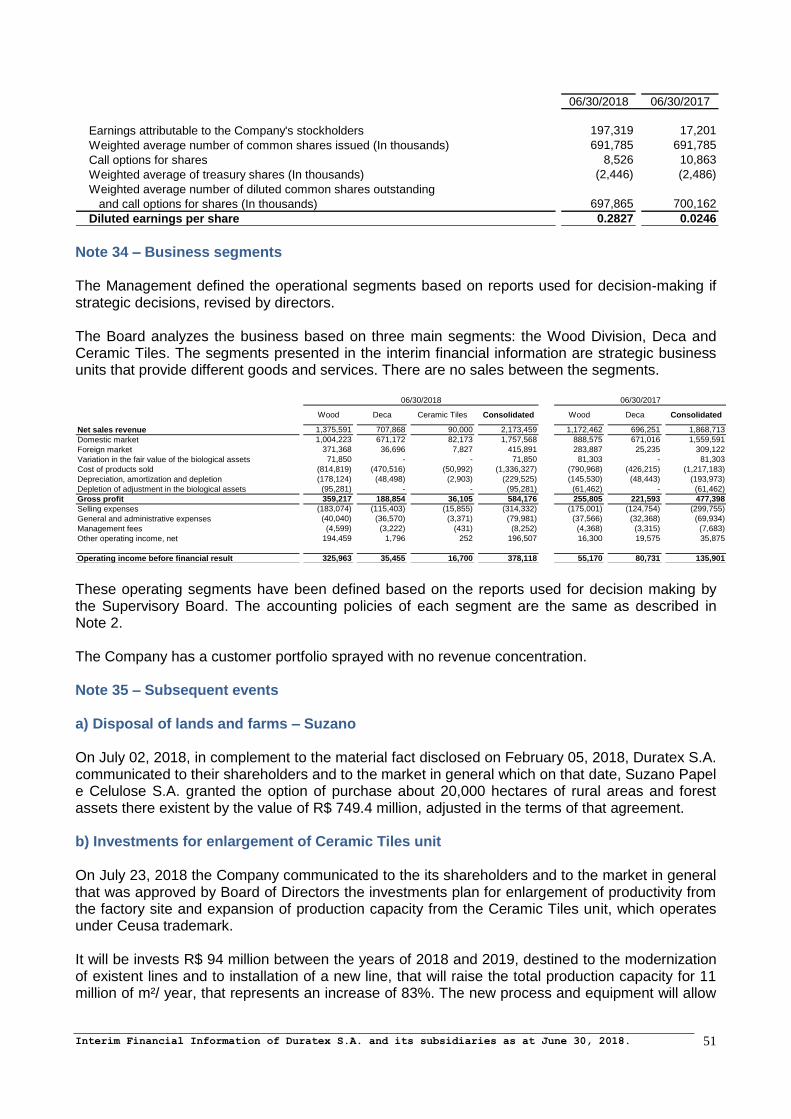
Interim Financial Information of Duratex S.A. and its subsidiaries as at June 30, 2018.
51
06/30/2018 06/30/2017
Earnings attributable to the Company's stockholders 197,319 17,201
Weighted average number of common shares issued (In thousands) 691,785 691,785
Call options for shares 8,526 10,863
Weighted average of treasury shares (In thousands) (2,446) (2,486)
Weighted average number of diluted common shares outstanding
and call options for shares (In thousands) 697,865 700,162
Diluted earnings per share 0.2827 0.0246
Note 34 – Business segments The Management defined the operational segments based on reports used for decision-making if strategic decisions, revised by directors. The Board analyzes the business based on three main segments: the Wood Division, Deca and Ceramic Tiles. The segments presented in the interim financial information are strategic business units that provide different goods and services. There are no sales between the segments.
Net sales revenue 1,375,591 707,868 90,000 2,173,459 1,172,462 696,251 1,868,713
Domestic market 1,004,223 671,172 82,173 1,757,568 888,575 671,016 1,559,591
Foreign market 371,368 36,696 7,827 415,891 283,887 25,235 309,122
Variation in the fair value of the biological assets 71,850 - - 71,850 81,303 - 81,303
Cost of products sold (814,819) (470,516) (50,992) (1,336,327) (790,968) (426,215) (1,217,183)
Depreciation, amortization and depletion (178,124) (48,498) (2,903) (229,525) (145,530) (48,443) (193,973)
Depletion of adjustment in the biological assets (95,281) - - (95,281) (61,462) - (61,462)
Gross profit 359,217 188,854 36,105 584,176 255,805 221,593 477,398
Selling expenses (183,074) (115,403) (15,855) (314,332) (175,001) (124,754) (299,755)
General and administrative expenses (40,040) (36,570) (3,371) (79,981) (37,566) (32,368) (69,934)
Management fees (4,599) (3,222) (431) (8,252) (4,368) (3,315) (7,683)
Other operating income, net 194,459 1,796 252 196,507 16,300 19,575 35,875
Operating income before financial result 325,963 35,455 16,700 378,118 55,170 80,731 135,901
WoodConsolidated ConsolidatedDecaWood Deca Ceramic Tiles
06/30/2018 06/30/2017
These operating segments have been defined based on the reports used for decision making by the Supervisory Board. The accounting policies of each segment are the same as described in Note 2. The Company has a customer portfolio sprayed with no revenue concentration. Note 35 – Subsequent events a) Disposal of lands and farms – Suzano On July 02, 2018, in complement to the material fact disclosed on February 05, 2018, Duratex S.A. communicated to their shareholders and to the market in general which on that date, Suzano Papel e Celulose S.A. granted the option of purchase about 20,000 hectares of rural areas and forest assets there existent by the value of R$ 749.4 million, adjusted in the terms of that agreement. b) Investments for enlargement of Ceramic Tiles unit On July 23, 2018 the Company communicated to the its shareholders and to the market in general that was approved by Board of Directors the investments plan for enlargement of productivity from the factory site and expansion of production capacity from the Ceramic Tiles unit, which operates under Ceusa trademark. It will be invests R$ 94 million between the years of 2018 and 2019, destined to the modernization of existent lines and to installation of a new line, that will raise the total production capacity for 11 million of m²/ year, that represents an increase of 83%. The new process and equipment will allow

Interim Financial Information of Duratex S.A. and its subsidiaries as at June 30, 2018.
52
the production of products with more aggregated value and will provide relevant increase of industrial productivity, allowing improves and enlarge the customer service.