Embed Size (px)
Citation preview

CIVIL ENGINEERING STUDIES Illinois Center for Transportation Series No. 19-015
UILU-ENG-2019-2015 ISSN: 0197-9191
Durability Aspects of Stabilized Quarry By-product Pavement
Base and Subbase Applications
Prepared by Issam Qamhia, PhD Erol Tutumluer, PhD
Hasan Ozer*, PhD Huseyin Boler
University of Illinois at Urbana–Champaign (UIUC) * Arizona State University, formerly with UIUC
Research Report No. FHWA-ICT-19-012
A report of the findings of
ICT PROJECT R27-SP38 Durability Aspects of Stabilized Quarry By-product
Pavement Applications
https://doi.org/10.36501/0197-9191/19-015
Illinois Center for Transportation
October 2019


TECHNICAL REPORT DOCUMENTATION PAGE
1. Report No. FHWA-ICT-19-012
2. Government Accession No.
N/A
3. Recipient’s Catalog No.
N/A
4. Title and Subtitle
Durability Aspects of Stabilized Quarry By-product Pavement Base and Subbase Applications
5. Report Date
October 2019
6. Performing Organization Code
N/A
7. Authors
Issam Qamhia (https://orcid.org/0000-0002-2020-8437), Erol Tutumluer (https://orcid.org/0000-0003-3945-167X), Hasan Ozer (https://orcid.org/0000-0003-1526-6840), and Huseyin Boler
8. Performing Organization Report No.
ICT 19-015
UILU-ENG-2019-2015
9. Performing Organization Name and Address Illinois Center for Transportation Department of Civil and Environmental Engineering University of Illinois at Urbana-Champaign 205 North Mathews Avenue, MC-250, Urbana, IL 61801
10. Work Unit No.
N/A
11. Contract or Grant No.
R27-SP38
12. Sponsoring Agency Name and Address Illinois Department of Transportation (SPR) Bureau of Research 126 East Ash Street Springfield, IL 62704
13. Type of Report and Period Covered
Final Report 2/1/19–10/31/19
14. Sponsoring Agency Code
15. Supplementary Notes
Conducted in cooperation with the U.S. Department of Transportation, Federal Highway Administration.
https://doi.org/10.36501/0197-9191/19-015
16. Abstract
Recent research conducted at the Illinois Center for Transportation (ICT-R27-168) evaluated sustainable applications of quarry by-products (QB) or QB blended with coarse-recycled aggregates as chemically stabilized base and subbase layers. The research proved that stabilized QB pavement applications have satisfactory pavement performance. This project (ICT-R27-SP38) investigates the durability aspects of previously evaluated stabilized base/subbase QB applications due to fluctuations in temperature and moisture content, which induce freeze-thaw cycles during winter and wetting-drying conditions in the stabilized QB layers. Durability tests were conducted on samples extracted from field test sections previously evaluated with Accelerated Pavement Testing (APT) as well as on new samples compacted in the laboratory with the same material types and combinations. Field-extracted samples were exposed to multiple cycles of freezing and thawing and wetting and drying over three years in the field. Both laboratory and field samples were evaluated following the AASHTO T 135 wet-dry and AASHTO T 136 freeze-thaw durability test protocols, respectively. Results of durability testing indicated better wet-dry durability performance of QB samples when compared to freeze-thaw durability, particularly for samples stabilized with Type I Portland cement. The majority of field and laboratory samples had a cumulative soil-cement loss of 10% or lower following 12 cycles of wetting and drying indicating satisfactory performance. Note that 10% soil-cement loss is used in Illinois DOT practice to determine the percentage of stabilizing agent that ensures durability. Results also indicated that cement-stabilized QB materials benefited from long-term curing in the field, while fly ash–stabilized QB materials were less durable after exposure to multiple freeze-thaw and wet-dry cycles during and after APT testing. Further, durability samples having QB materials from dolomitic aggregate sources, i.e. having higher percentages of magnesium in their chemical composition as determined by X-Ray Fluorescence (XRF), exhibited better field performance trends than QB materials with primarily limestone (calcium oxide content) fines. This durability improvement was linked to the cementation observed in the dolomitic fines after exposure to freeze-thaw cycles in the field. Further, higher density and improved packing of QB materials observed in samples compacted at or near maximum dry density resulted in consistently better durability.
17. Key Words Quarry By-product, Durability, Freeze-Thaw, Wet-Dry, Chemical Stabilization, Aggregates, Recycled Aggregates, Sustainability
18. Distribution Statement No restrictions. This document is available through the National Technical Information Service, Springfield, VA 22161.
19. Security Classif. (of this report) Unclassified
20. Security Classif. (of this page) Unclassified
21. No. of Pages 43 +appendices
22. Price N/A
Form DOT F 1700.7 (8-72) Reproduction of completed page authorized


i
ACKNOWLEDGMENT, DISCLAIMER, MANUFACTURERS’ NAMES
This publication is based on the results of “ICT-R27-SP38: Durability Aspects of Stabilized Quarry By-product Pavement Applications.” ICT-R27-SP38 was conducted in cooperation with the Illinois Center for Transportation; the Illinois Department of Transportation; and the U.S. Department of Transportation, Federal Highway Administration.
Members of the Technical Review Panel (TRP) were the following:
• Heather Z. Shoup, TRP Chair, Illinois Department of Transportation
• Andrew Stolba, Illinois Department of Transportation
• Megan Swanson, Illinois Department of Transportation
• Kurt Schmuck, Illinois Department of Transportation
• Rustin Keys, Illinois Department of Transportation
• Michael Short, Illinois Department of Transportation
• Bablibile Seck, Illinois Department of Transportation
• Dennis Bachman, Federal Highway Administration
• Kyle Hanselman, Illinois Department of Transportation
• Mark Mathon, Mason County
• Eric Seibring, Piatt County
• Stephane Seck, Illinois Department of Transportation
The authors would like to extend their appreciation to the TRP Chair and TRP members for their time and significant contributions to this research project. Sincere acknowledgments are also due to Kurt Schmuck from the Illinois Department of Transportation Central Bureau of Materials (IDOT CBM) for conducting all freeze-thaw and wet-dry durability tests on field and laboratory samples. Thanks are extended to Kyle Hanselman and Mohammed Altowayti with IDOT CBM for their help with sample testing and documenting sample conditions during durability testing by taking periodic pictures.
The authors express their great appreciation to Illinois Center for Transportation (ICT) research engineer Greg Renshaw for his help with the extraction of field samples and with the setup of the saw equipment used for cutting the field samples into prisms. Thanks are extended to Marc Killion and Jamar Brown from the machine shop at the University of Illinois for their help with equipment preparation and sample testing. The authors would also like to express their sincere gratitude to all University of Illinois and ICT students who helped with sample preparation: Jordan Ouellet, Mingu Kang, Sushobhan Sen, and Omar Jadallah. Finally, thanks are extended to Kristi Anderson, Audrey Donoho, and McCall Macomber for their contribution to ICT project management.
The contents of this report reflect the view of the authors, who are responsible for the facts and the accuracy of the data presented herein. The contents do not necessarily reflect the official views or

ii
policies of the Illinois Center for Transportation, the Illinois Department of Transportation, or the Federal Highway Administration. This report does not constitute a standard, specification, or regulation.
Trademark or manufacturers’ names appear in this report only because they are considered essential to the object of this document and do not constitute an endorsement of product by the Federal Highway Administration, the Illinois Department of Transportation, or the Illinois Center for Transportation.

iii
EXECUTIVE SUMMARY
This Illinois Center for Transportation (ICT) report (R27-SP38) presented results from a study conducted at ICT and the Illinois Department of Transportation (IDOT) Central Bureau of Materials (CBM) to investigate the freeze-thaw and wet-dry durability behavior of chemically stabilized applications of quarry by-products (QB) in flexible pavements. The QB applications investigated for durability were previously evaluated for field performance using Accelerated Pavement Testing (APT) in the ICT-R27-168 project. From the field evaluations, the chemically stabilized QB applications could provide economical and sustainable bases and subbases for flexible pavements with observed satisfactory performance trends in terms of adequate strength/stiffness and resistance to rutting and fatigue. The ICT-R27-168 project recommended these applications to be evaluated for wet-dry and freeze-thaw durability before they could be considered readily implementable and incorporated in standard practices for road construction by IDOT. Thus, this project ICT-R27-SP38 followed up on a research effort to investigate the stabilized QB mixture durability, which is a key aspect for evaluating long-term field performances of pavement layer applications. The constructed field test sections provided a unique opportunity to collect field samples to check their durability aspects under climatic/seasonal variations of temperature (freeze-thaw) and moisture (wet-dry) conditions.
The base and subbase applications of QB studied involved 3% cement- or 10% fly ash–stabilized QB materials and QB blends with recycled coarse aggregates, namely Fractionated Reclaimed Asphalt Pavements (FRAP) or Fractionated Reclaimed Concrete Aggregates (FRCA). Blending ratios of 70% QB and 30% FRAP/FRCA were investigated. Two QB sources used in the R27-168 project were also utilized in this durability study. These are denoted by QB2 and QB3 hereafter. In total, 56 samples were tested for wet-dry and freeze-thaw durability. Half of the samples were newly prepared samples in the laboratory, while the other half was extracted from seven full-scale field test sections studied in the ICT-R27-168 project. Attempts were made without much success to extract cores from the field test sections. At the end, large slabs of the chemically stabilized QB layers were extracted and cuboid prisms were saw-cut with the dimensions of an inscribed cuboid fitting in the standard Proctor compaction mold. Freeze-thaw and wet-dry durability tests were conducted as per AASHTO T 136 and T 135, respectively. Both standards involve firm brushing of samples using a steel wire brush. A brushing pattern was selected such that all areas in each sample received at least two firm brushing strokes at each cycle of testing. After each cycle of durability testing, samples were weighed to calculate the brushed losses and the cumulative percentages of soil-cement loss. Note that for the purposes of this report, soil-cement loss refers to soil-modifier loss in the samples that had either cement or fly ash used as the chemical modifier.
All cement- and fly ash–stabilized laboratory samples and all cement-stabilized field samples tested for wet-dry durability by AASHTO T 135 survived the standard 12 cycles of wetting and drying by accumulating less than 10% soil-cement loss. From the freeze-thaw durability testing by AASHTO T 136, some of the samples had layer separation and significant deterioration at early stages of testing, which prevented the completion of tests with the requirement of further brushing. In such occasions, the results for soil-cement loss were extrapolated by curve fitting the data to provide an estimate of the soil-cement loss after 12 cycles. An estimate for the final corrected moisture content at the end of wet-dry and freeze-thaw durability testing was provided for each tested sample. The final moisture

iv
content was corrected for the water of hydration of cement, which was considered 1/4 of the percent cement in the specimen for cement-stabilized samples and zero for fly ash–stabilized samples.
Considering the investigation of the durability aspects of seven sustainable QB applications, satisfactory wet-dry and freeze-thaw durability test results were observed for cement-stabilized QB2 materials or QB2 blended with coarse-recycled aggregates. Wet-dry durability resulted in lower percentages of soil-cement loss compared to freeze-thaw durability for the majority of laboratory and field samples, indicating that the AASHTO T 136 freeze-thaw durability is a harsher and more destructive test for chemically stabilized QB materials. Both cement-and fly ash–stabilized laboratory samples and all cement-stabilized field samples had satisfactory wet-dry durability. Fly ash–stabilized field samples accumulated high (17.6%–18.6%) soil-cement loss after 12 cycles of wet-dry durability testing, indicating poor performance.
One key finding of the durability tests is that the chemical composition of the QB material can influence the durability of the investigated sustainable QB applications, particularly when long-term durability (i.e. several years of service) is considered. QB2 material with higher percentages of dolomitic fines had more long-term strength gain and better durability than QB3 material, which had higher percentages of calcium limestone fines. The presence of dolomitic fines might have significantly increased the long-term durability of the field samples; which needs to be further investigated. Density and packing were also found to affect the durability of the samples, where samples achieving a density significantly lower than the maximum dry density had poor performance.
Unconfined Compressive Strength (UCS) tests were also conducted concurrently with durability testing to ascertain that both durability and strength requirements were studied together for sustainable QB pavement applications and checked against IDOT requirements and specifications. In addition, the UCS tests served as a check for material mechanical property variability, particularly with stabilizing agents, between the newly molded laboratory samples and the materials that were previously used to construct the test sections for ICT-R27-168, since these material combinations were also tested in the laboratory for UCS prior to using them in constructing field test sections. Possible trends observed between durability and unconfined compressive strength characteristics of different material combinations were somewhat inconclusive. This warrants the need for further and more extensive investigations on the cementation type improvement observed with dolomitic fines and identifying related mechanisms of long-term strength and durability characteristics.

v
TABLE OF CONTENTS
CHAPTER 1: INTRODUCTION ................................................................................................ 1
1.1 BACKGROUND AND MOTIVATION .......................................................................................1
1.2 OBJECTIVE AND SCOPE .......................................................................................................2
1.3 STUDIED QUARRY BY-PRODUCT APPLICATIONS...................................................................2
1.4 REPORT ORGANIZATION .....................................................................................................3
CHAPTER 2: LITERATURE REVIEW ......................................................................................... 5
2.1 INTRODUCTION ..................................................................................................................5
2.2 PAST QB RESEARCH AT ICT ..................................................................................................5
2.3 QUARRY BY-PRODUCT APPLICATIONS IN PAVEMENTS ........................................................9
2.4 DURABILITY OF QB IN PAVEMENT APPLICATIONS .............................................................. 11
CHAPTER 3: SAMPLE PREPARATION AND TESTING ............................................................. 12
3.1 INTRODUCTION ................................................................................................................ 12
3.2 EXTRACTION AND PREPARATION OF FIELD SAMPLES ........................................................ 12
3.3 PREPARATION OF LABORATORY SAMPLES ........................................................................ 15
3.4 CURING OF SAMPLES ........................................................................................................ 17
3.5 TESTING OF WET-DRY DURABILITY SAMPLES ..................................................................... 18
3.6 TESTING OF FREEZE-THAW DURABILITY SAMPLES ............................................................. 21
3.7 TESTING OF UNCONFINED COMPRESSIVE STRENGTH SAMPLES ......................................... 22
CHAPTER 4: RESULTS AND INTERPRETATIONS .................................................................... 24
4.1 INTRODUCTION ................................................................................................................ 24
4.2 RESULTS FOR WET-DRY DURABILITY .................................................................................. 24
4.3 RESULTS FOR FREEZE-THAW DURABILITY .......................................................................... 28
4.4 RESULTS FOR UNCONFINED COMPRESSIVE STRENGTH ...................................................... 32
4.5 INTERPRETATIONS OF DURABILITY RESULTS...................................................................... 34
CHAPTER 5: SUMMARY AND CONCLUSIONS ....................................................................... 37
5.1 SUMMARY OF RESEARCH APPROACH ............................................................................... 37
5.2 FINDINGS, CONCLUSIONS, AND RECOMMENDATIONS ....................................................... 37
5.3 RECOMMENDATONS FOR FUTURE WORK ......................................................................... 39

vi
REFERENCES ....................................................................................................................... 41
APPENDIX A: DETAILED WET-DRY DURABILITY TEST RESULTS ............................................. 44
APPENDIX B: DETAILED FREEZE-THAW DURABILITY TEST RESULTS .................................. 50

vii
LIST OF FIGURES
Figure 2.1. Average UCS for virgin, 2% cement-, and 10% Class C fly ash–treated QB materials.
1 psi = 6.9 kPa. (Source: Tutumluer et al., 2015) ...................................................................................... 6
Figure 2.2. Results for (a) UCS, (b) split tensile strength, and (c) elastic modulus for QB samples
blended with FRAP or virgin aggregates. 1 MPa = 145 psi. (Source: LaHucik et al., 2016a) .................... 7
Figure 2.3. Surface wheel path rut accumulations of test sections with the QB applications studied
in project ICT-R27-168. ............................................................................................................................. 8
Figure 3.1. Extraction of stabilized QB materials from the test sections constructed for ICT-R27-168. ....... 13
Figure 3.2. Saw-cutting procedure for field samples (top) and the final saw-cut samples tested for
durability (bottom). ................................................................................................................................ 14
Figure 3.3. Durability sample size and geometry: size of field-extracted samples (left) and the
lab mold used for preparing laboratory samples (right). ....................................................................... 16
Figure 3.4. Preparation of molded laboratory samples using a split mold. ........................................... 16
Figure 3.5. Moist room curing of the laboratory-molded samples for freeze-thaw and wet-dry
durability testing. .................................................................................................................................... 18
Figure 3.6. Testing of lab and field samples for wet-dry durability at IDOT CBM. ................................. 20
Figure 3.7. Testing of laboratory and field samples for freeze-thaw durability at IDOT CBM. .............. 22
Figure 3.8. Preparation, curing, and testing of unconfined compressive strength samples. ................ 23
Figure 4.1. Estimated soil-cement loss for wet-dry durability testing of lab-molded samples. ............ 25
Figure 4.2. Estimated soil-cement loss for wet-dry durability testing of field-extracted samples. ....... 27
Figure 4.3. Estimated soil-cement loss for freeze-thaw durability testing of lab-molded samples. ..... 30
Figure 4.4. Estimated soil-cement loss for freeze-thaw durability testing of field-extracted samples. .... 30
Figure 4.5. Unconfined compressive strength results of the investigated QB applications. ................. 33
Figure 4.6. Unconfined compressive strength results of cube samples extracted from ICT-R27-168
field test sections (Qamhia et al., 2018). ................................................................................................ 33
Figure 4.7. Average soil-cement loss at the last cycle (12th cycle) for wet-dry durability testing. ........ 36
Figure 4.8. Average soil-cement loss at the last cycle (12th cycle) for freeze-thaw durability testing. ...... 36
Figure A.1. Compilation of wet-dry durability test results for laboratory-molded samples. ................. 44
Figure A.2. Compilation of wet-dry durability test results for field-extracted samples. ....................... 47
Figure B.1. Compilation of freeze-thaw durability test results for laboratory-molded samples. .......... 50
Figure B.2. Compilation of freeze-thaw durability test results for field-extracted samples. ................. 53

viii
LIST OF TABLES
Table 2.1. Descriptions of QB Applications Studied in Project ICT-R27-168 (Flexible Pavement
Applications) ............................................................................................................................................. 9
Table 3.1. Summary of Field Sample Dry and Relative Densities ........................................................... 15
Table 3.2. Material Combinations of Laboratory-molded Samples ....................................................... 17
Table 4.1. Summary of Test Results for Wet-Dry Durability of Laboratory-molded Samples................ 25
Table 4.2. Summary of Test Results for Wet-Dry Durability of Field-extracted Samples ...................... 26
Table 4.3. Summary of Test Results for Freeze-Thaw Durability of Laboratory-molded Samples ........ 29
Table 4.4. Summary of Test Results for Freeze-Thaw Durability of Field-extracted Samples ............... 31
Table 4.5. Chemical Composition of QB2 and QB3 Materials ................................................................ 34
Table A.1. Final Corrected Moisture Content (%) for Wet-Dry Durability Samples ............................... 49
Table B.1. Final Corrected Moisture Content (%) for Freeze-Thaw Durability Samples ........................ 55

1
CHAPTER 1: INTRODUCTION
1.1 BACKGROUND AND MOTIVATION
Quarry by-products (QB) are an industrial by-product of aggregate quarry processes. They are typically less than 1/4 in. (6 mm) in size and consist of coarse, medium, and fine sand particles and a small clay/silt fraction. Quarry by-products are found abundantly at crushed-rock extraction facilities in Illinois, where they are produced during blasting, crushing, washing, and screening operations. Excess QB produced each year exceeds 950,000 tons according to a questionnaire responded to by 20 of the largest quarries in Illinois in the research study ICT-R27-125 (Tutumluer et al., 2015).
Work conducted at the Illinois Center for Transportation (ICT) has evaluated the characteristics of QB materials collected from different quarries across Illinois and studied potential uses of QB in pavement applications. As part of an ICT project to characterize QB materials (R27-125), a detailed laboratory study was conducted to characterize the engineering properties of QB materials produced in the primary, secondary, and tertiary aggregate production stages from four quarries operating in Illinois. Property tests were performed for determining aggregate gradation, particle shape characteristics, and mineralogical analysis of the QB samples. Differences in shape and gradation properties of QB materials produced in each crushing stage were observed (Tutumluer et al., 2015). Because the Unconfined Compressive Strength (UCS) for QB materials was low (less than 11 psi or 76 kPa), Portland cement and Class C fly ash chemical admixture stabilizers were used to improve the strength properties of QB materials. For the chemically stabilized QB samples, a 2% cement or 10% Class C fly ash increased the UCS by 10 to 30 times compared to virgin unstabilized QB samples. Such significant increases observed in the strength of stabilized QB materials have indicated suitability of QB for sustainable pavement applications (Tutumluer et al., 2015; Mwumvaneza et al., 2015).
More recently, a follow-up project was conducted to further investigate the field performance of QB materials in pavement applications. The project ICT-R27-168 evaluated new sustainable applications of QB or QB mixed with marginal (i.e. primary crusher run aggregates), virgin, or recycled aggregate materials in unbound and chemically stabilized pavement layers tested under realistic wheel loads and environmental conditions (Qamhia et al., 2018; Qamhia et al., 2019). Sixteen full-scale test sections were evaluated for performance of QB materials used in base, subbase, and aggregate subgrade applications. QB materials obtained from three different sources in Illinois were utilized for this study. The chemically stabilized QB applications were stabilized with 3% cement or 10% Class C fly ash and were constructed over a subgrade having an Immediate Bearing Value (IBV) of 6%. The unbound applications investigated the use of QB to fill the voids between large aggregate subgrade
rocks commonly used for rockfill applications on top of very soft subgrade soils (IBV ≤ 1%) as well as using dense-graded aggregate subgrade layers with higher QB fines content (up to 15% passing No. 200 sieve) for soft subgrade remediation. The test sections were evaluated for performance using Accelerated Pavement Testing (APT), and other forensic analysis techniques such as Falling Weight Deflectometer (FWD) tests before and after trafficking, Hot-Mix Asphalt (HMA) coring, Dynamic Cone Penetrometer (DCP) profiling of subsurface layers, and trenching, to determine actual thicknesses and contribution of each pavement layer to the measured surface rutting. In general, results from APT and forensic analyses indicated satisfactory results and improved rutting performance for the

2
investigated QB applications. The improved performance was quantified through lower surface rut measurements, lower surface deflection measurements with FWD, and higher layer strength profiles measured with DCP (Qamhia et al., 2018; Qamhia et al., 2019).
Previous QB research conducted at ICT has proven the satisfactory pavement performance and promising usage for abundant quantities of stabilized quarry by-product materials in pavements. Detailed findings on the surface rut profiles are presented in Chapter 2. This is both environmentally friendly and economical to advocate more sustainable pavement construction with QB materials. For the QB applications of the project ICT-R27-168 to be deemed readily implementable, durability aspects, i.e. wet-dry and freeze-thaw durability, need to be thoroughly investigated to establish the performance of chemically stabilized QB pavement layers under variations in climatic conditions, particularly freezing-thawing cycles during winter and wetting-drying conditions. When proper recommendations and mix designs are established for designing QB layers to consider these durability aspects, the use of QB and QB blends with recycled coarse aggregates can be successfully incorporated into IDOT’s standard pavement construction and rehabilitation practices. Therefore, the purpose of this project (ICT-R27-SP38) was to investigate the freeze-thaw and wet-dry durability aspects for various stabilized QB and QB-blend applications using the standard AASHTO T 136 and AASHTO T 135 test procedures, respectively.
1.2 OBJECTIVE AND SCOPE
The main objective of this project was to investigate the freeze-thaw and wet-dry durability performances for quarry by-product materials and mixtures of quarry by-products with recycled aggregates used as base and subbase materials in sustainable pavement applications. The seven QB applications investigated for durability aspects entailed samples of 100% QB and samples of 70% QB blended with 30% coarse Fractionated Reclaimed Asphalt Pavements (FRAP) or Fractionated Recycled Concrete Aggregates (FRCA). Samples were stabilized with 3% cement or 10% fly ash. The samples investigated for durability represent base and subbase QB applications that were previously evaluated for field performance in Accelerated Pavement Testing (APT). Field samples were collected from base and subbase test sections previously built and tested as part of the recent project ICT-R27-168. Further, laboratory test samples were molded and tested for their durability aspects (wet-dry and freeze-thaw) and UCS. The durability tests were conducted at IDOT Central Bureau of Materials (CBM). All material collection, sample preparation, and UCS testing were conducted at the University of Illinois laboratories and testing facilities.
1.3 STUDIED QUARRY BY-PRODUCT APPLICATIONS
In total, seven bound applications of aggregate QB mixtures were evaluated for durability aspects and UCS. These QB applications and mixtures were selected based on successful outcomes of previous studies that provided evaluations of QB materials in laboratory and field testing (Tutumluer et al. 2015; Qamhia et al. 2018; Qamhia et al., 2019). Both field-extracted and laboratory-molded samples with these material combinations were studied for wet-dry and freeze-thaw durability aspects.

3
The investigated material combinations with sustainable QB applications can be broadly divided into the following three categories:
• Stabilized base with recycled coarse aggregate—Blending QB with coarse aggregate fractions of recycled materials FRAP and FRCA and stabilizing the blends with cement or Class C fly ash for base applications. Three applications were investigated under this category, namely: QB-FRAP-cement, QB-FRCA-cement, and QB-FRAP-fly ash mixtures.
• Stabilized base—Using QB as a cement-treated base material. Two applications were investigated under this category entailing two QB materials from different quarries and having different chemical compositions mixed with cement.
• Stabilized subbase in an inverted pavement—Using QB as a cement or fly ash–treated subbase. Two applications were investigated under this category using QB from the same source, namely, QB-cement and QB-fly ash mixtures.
In addition to the material combinations listed above and given the grain size distribution of the FRCA material that had particles up to 1.5 in. (37 mm) in size, a material combination of QB with no FRCA material larger than 3/4 in. (19 mm) was also molded in the laboratory to eliminate any effect of large FRCA particle on durability results. This step was applied to test materials that complied with the gradation requirements of the standard test methods used in wet-dry and freeze-thaw durability in this study.
1.4 REPORT ORGANIZATION
This report consists of five chapters, including this introductory chapter.
Chapter 2, titled “Literature Review,” provides a brief review of the previous studies associated with using QB and recycled materials in pavement applications, particularly literature for past research that evaluated the durability of QB materials and QB blended with recycled aggregates.
Chapter 3, titled “Sample Preparation and Testing,” provides a discussion of material selection and sample preparation and testing. This chapter presents details for the extraction and saw-cutting of the field samples and the molding and curing of laboratory samples for durability and UCS testing. The assumptions made during and after testing as well as sample performance during wet-dry and freeze-thaw durability testing are summarized in detail in this chapter.
Chapter 4, titled “Results and Interpretations,” provides details of sample performance under durability and UCS testing. Results for wet-dry durability by AASHTO T 135 and freeze-thaw durability by AASHTO T 136 are presented and discussed in detail. The durability aspects and UCS characteristics of the freshly molded laboratory samples cured for seven days were compared with those of field-extracted samples that were left to cure for three years. The field-extracted samples were exposed to several cycles of freezing-thawing and wetting-drying over three harsh winters and rainy summers prior to extraction and testing in this project.

4
Chapter 5, titled “Summary and Conclusions,” provides a summary of the test results, the main recommendations, and conclusions from the durability evaluations of QB applications. This chapter also discusses promising implementation projects as the next steps to further study, as well as some recommendations for future research.

5
CHAPTER 2: LITERATURE REVIEW
2.1 INTRODUCTION
The importance of utilizing aggregate quarry by-products (QB) in pavement applications stems from the vast quantities that are produced and remain in excess within many quarries each year. QB stockpiling and disposal is a serious issue facing the aggregate industry, as they accumulate in stockpiles and interfere with quarry operations (Hudson et al., 1997). A report by the Federal Highway Administration estimated the quantity of quarry by-products generated in the United States each year to exceed 175 million US tons (159 million metric tons), little of which is being put into use for pavement applications (Chesner et al., 1998). The same report also estimated that aggregate QB accumulation in the US alone exceeded 4.0 billion US tons (3.6 billion metric tons) from the 3,000 operating quarries. In Illinois, where this research was conducted, the annual production of crushed stone QB was estimated through a survey conducted among aggregate producers in the state and was found to be as high as 950,000 US short tons (855,000 tons) (Tutumluer et al., 2015). Research conducted by Kumar and Hudson (1992) showed that stockpiled fines comprised an average of approximately 12% of the total annual aggregate production. More recently, NCHRP Synthesis 435 (Volume 4) reported that, depending on the type of rock quarried, QB could make up to 25% of the total aggregates produced (Stroup-Gardiner & Wattenberg-Komas, 2013).
Given these massive quantities, and the negative environmental/economic consequences that result from QB accumulation at quarries, the investigation of successful applications of QB as a sustainable and inexpensive construction alternative for pavements has become imperative. For successful implementation of QB applications, comprehensive research needs to be conducted to understand the performance and the economic and sustainable aspects of QB usage, which requires laboratory and field evaluation of these materials. The research project ICT-R27-125, titled “Sustainable Aggregates Production: Green Applications for Aggregate By-Products,” focused earlier on the laboratory characterization of unbound and chemically stabilized QB materials (Tutumluer et al., 2015). The recent project ICT-R27-168, titled, “Field Performance Evaluations of Sustainable Aggregate By-Product Applications,” evaluated the field performance trends of 16 sustainable QB applications with accelerated pavement testing (Qamhia et al., 2018). This ICT-R27-SP38 project intends to evaluate the durability of QB applications under varying seasonal/climatic temperature and moisture variations resulting in freeze-thaw and wet-dry cycles.
2.2 PAST QB RESEARCH AT ICT
Prior to conducting this durability study, several studies were conducted at the Illinois Center of Transportation (ICT) and the Advanced Transportation Research and Engineering Laboratory (ATREL) of the University of Illinois to study QB materials. As part of the project ICT-R27-125, several QB materials were collected from different crushing stages from four quarries in Illinois and were tested for their physical and mechanical properties. Atterberg limits testing was conducted in accordance with the ASTM D4318 method, and all four QB sources were found to have relatively low liquid limits and had essentially nonplastic fines passing the No. 40 (0.42 mm) sieve (Tutumluer et al., 2015). This

6
study also reported that the compressive strength properties of untreated QB could be relatively low and recommended stabilizing QB materials for pavement applications.
Further, Tutumluer et al. (2015) concluded that the harmful clay content of QB materials was generally less than 3% for different sources and crushing stages. The same study reported that QB from primary crushing stages generally comprised higher contents of harmful clay. Direct shear tests were performed in accordance with ASTM D3080 on QB materials selected from different crushing stages in the same quarry. The friction angles obtained for primary, secondary, and tertiary crusher QB samples were rather high around 59 degrees (Tutumluer et al., 2015). The same study conducted UCS tests on 10% Class C fly ash and 2% Portland cement–stabilized QB samples and observed that the chemically stabilized QB specimens exhibited up to 30 times strength improvement when compared with untreated QB materials (Mwumvaneza et al., 2015; Tutumluer et al., 2015). The results of the study are presented in Figure 2.1. Note that Q1–Q3 shown in Figure 2.1 do not correspond, in the same order, to QB1–QB3 naming for the QB sources utilized in the R27-SP38 and R27-168 projects.
Figure 2.1. Average UCS for virgin, 2% cement-, and 10% Class C fly ash–treated QB materials. 1 psi = 6.9 kPa. (Source: Tutumluer et al., 2015)
In a laboratory study conducted by LaHucik et al. (2016a, 2016b), various proportions of cement-treated mixes of QB and Fractionated Reclaimed Asphalt Pavement (FRAP) or virgin coarse aggregates were evaluated. Based on aggregate packing tests conducted with different proportions of QB and FRAP by weight, an optimal blending ratio of 70% QB with 30% FRAP was found to maximize density/minimize void content. LaHucik et al. (2016b) also evaluated mix-design performances through strength tests (compression/split tension) and modulus tests. Higher cement content increased both the strength and elastic modulus properties of all the tested mixes. Mixtures containing virgin aggregates with QB yielded statistically greater elastic moduli than mixtures with FRAP and QB. Fibers were used as additives in some of the mixtures. From statistical analysis, the fibers did not have considerable influence on strength or elastic modulus but did provide residual shear capacity across cracks. The QB and FRAP or QB and virgin aggregate mixtures with 3% to 4%

7
cement content exceeded the strength of typical cement-stabilized base materials reported in the literature. More details about this study including the performed statistical analysis are presented in LaHucik et al. (2016a, 2016b). Test results for UCS, split tensile strength, and resilient modulus are detailed in Figure 2.2. For the naming of samples, the first number (e.g. 2) refers to the percentage of cement by volume; the second letter (R or V) refers to Recycled or Virgin coarse aggregates, respectively; while the third letter (F or N) refers to “Fibers used” or “Not used” during sample preparation.
(a)
(b) (c)
Figure 2.2. Results for (a) UCS, (b) split tensile strength, and (c) elastic modulus for QB samples blended with FRAP or virgin aggregates. 1 MPa = 145 psi. (Source: LaHucik et al., 2016a)
A more recent project, ICT-R27-168, focused on evaluating new sustainable applications of Quarry By-products (QB) or QB mixed with aggregate subgrade (i.e. primary crusher run aggregates) and other virgin or recycled aggregate materials in pavements as unbound or chemically stabilized pavement layers. Sixteen full-scale test sections, including seven test sections with stabilized QB applications, were constructed to evaluate the use of QB in base, subbase, and aggregate subgrade applications. The chemically stabilized test sections utilizing QB were stabilized with 3% cement or 10% Class C fly ash by dry weight and were constructed over a subgrade having an engineered unsoaked Immediate Bearing Value (IBV) of 6% to study their effectiveness in low- to medium-volume flexible pavements.

8
The unbound applications of QB investigated (i) the use of QB to fill the voids between large aggregate subgrade rocks commonly used for rockfill applications on top of soft subgrade soils and (ii) the dense-graded aggregate subgrade layers with higher fines content up to 15% passing No. 200 sieve for soft subgrade remediation. All field test sections were then evaluated for rutting and fatigue performance by applying traffic loading using a super single wheel in Accelerated Pavement Testing (APT) (Qamhia et al., 2018; Qamhia et al., 2019; Qamhia, 2019). Results of surface rutting accumulation from the 12 flexible pavement test sections are presented in Figure 2.3. Note that the seven pavement sections (C2S1–C3S3) with stabilized QB applications (see Figure 2.3) that showed better performance and were tested up to 135,000 cycles have been the subject for investigation for wet-dry and freeze-thaw durability in this project. A detailed description of the materials and layer thicknesses are presented in Table 2.1. Sections C2S1–C3S3 from which durability samples were extracted are indicated in bold in Table 2.1. Three QB materials, i.e. QB1, QB2, and QB3, obtained from three quarries in Illinois were utilized.
Following APT, forensic analysis tests were conducted to further evaluate test section performances. These tests included Falling Weight Deflectometer (FWD) tests before and after trafficking, hot-mix asphalt coring, Dynamic Cone Penetrometer (DCP) profiling of subsurface layers, and trenching to expose the cross sections of the constructed sections. In general, results from the APT and forensic analyses indicated that satisfactory results and improved rutting performance (less than 0.5 in. or 12.5 mm of rutting after 135,000 load repetitions) were obtained from all test sections utilizing QB applications (Qamhia et al., 2018). Therefore, the proposed QB applications were deemed to be readily implementable and can be successfully incorporated into standard pavement construction and rehabilitation practices, given that their durability aspects are better studied and understood. This project focuses mainly on the investigation of the durability aspects of the stabilized QB applications, i.e. C2S1–C3S3, evaluated in the ICT-R27-168 study.
Figure 2.3. Surface wheel path rut accumulations of test sections with the QB applications studied in project ICT-R27-168.

9
Table 2.1. Descriptions of QB Applications Studied in Project ICT-R27-168 (Flexible Pavement Applications)
Section ID
QB Field Application
Description / Material Combination Pavement Cross Section
C1S1 Aggregate Subgrade
Primary Crusher Run (PCR) rocks with 25% QB1 filling the voids; constructed in two lifts
C1S1–C1S4
C1S2 Aggregate Subgrade
(PCR) rocks with 16.7% QB1 filling the voids; constructed in one lift
C1S3 Aggregate Subgrade
Dense-graded CA06 aggregates with 15% plastic fines content (passing No. 200 sieve) with a plasticity index (PI) of 8
C1S4 Aggregate Subgrade
Dense-graded CA06 aggregates with 15% nonplastic (PI=0) fines content
C2S1* Stabilized
Base with FRAP
A blend of 70% QB2 and 30% FRAP, stabilized with 3% Type I cement
C2S1–C2S4, C3S1, and C3S4
C3S2 and C3S3
C2S2* Stabilized
Base with FRCA
A blend of 70% QB2 and 30% FRCA, stabilized with 3% Type I cement
C2S3* Stabilized
Base with FRAP
A blend of 70% QB2 and 30% FRAP, stabilized with 10% Class C fly ash
C2S4* Stabilized Base QB2 stabilized with 3% cement
C3S1* Stabilized Base QB3 stabilized with 3% cement
C3S2* Stabilized Subbase QB2 stabilized with 3% cement
C3S3* Stabilized Subbase QB2 stabilized with 10% Class C fly ash
C3S4 Unbound Aggregate
Base
Conventional base course aggregate material; no chemical stabilization
* Indicates test sections from which samples were extracted for wet-dry and freeze-thaw durability studies
2.3 QUARRY BY-PRODUCT APPLICATIONS IN PAVEMENTS
NCHRP synthesis 435 (volume 4) summarized the different uses of QB in pavement applications from a limited number of research projects and highway applications and evaluated usage of QB and mineral by-products, most of which focused on bound layer applications (Stroup-Gardiner & Wattenberg-Komas, 2013). The following QB applications were listed for bound pavement layers: (1) Portland cement substitution, (2) Portland cement concrete, (3) self-consolidating concrete, (4) hot-mix asphalt, and (4) stabilized base materials. On the other hand, the unbound applications of QB were mostly limited to base and subbase applications. Other possible applications include QB usage in embankments as fill materials, chip seals, and flowable fills.

10
Based on laboratory testing results, some researchers have utilized chemical stabilization and accordingly recommended specific field applications for QB. According to Kalcheff and Machemehl (1980), the stabilization of QB with cement developed relatively high rigidity with a small amount of Portland cement compared with granular soil-cement stabilization. The use of low-cement content has the advantage of decreasing the shrinkage cracking. Kumar and Hudson (1992) examined the unconfined compressive strength, tensile modulus of elasticity, and Poisson’s ratio of cement-treated QB materials. They concluded that stabilizing QB with cement could produce the adequate compressive strength, modulus of elasticity, and tensile strength required for subbase materials. They proposed a base course material additive, flowable fill, under slab granular fill, and cement-stabilized subbase/base layers as possible pavement applications of QB.
Researchers have also investigated the field usage of QB in a stabilized base layer. In a study in Lynn County, Iowa, the use of emulsion-stabilized limestone screening was investigated as a base material (Nelson et al., 1994). Several test sections with base thicknesses of 4 to 6 in. (100 to 150 mm) and asphalt-cement contents of 2.5%, 3.5%, and 4.5% were inspected. The 4-in. (100-mm) thick base did not produce a satisfactory low-cost maintenance roadway, based on periodic crack survey data and structural adequacy assessment using a Road Rater equipment. Thus, the researchers recommended a 6-in. (150-mm) thick emulsion-stabilized QB base with more than 3.5% asphalt-cement, topped with a 2 in. (50 mm) HMA surface, which could provide a low-maintenance roadway (Nelson et al., 1994).
In a study in Arlington, Texas, the use of limestone QB was evaluated as a base material for sections of State Highway 360 (Puppala et al., 2008). A 36-in. (914-mm) thick layer of quarry fines stabilized with 2.3% cement was used as the base overlain by a 4-in. (102-mm) thick HMA and 8-in. (203-mm) thick Continuously Reinforced Concrete Pavement (CRCP) surface. Field monitoring using horizontal inclinometers showed that the sections experienced low permanent deformation during service. Additionally, the International Roughness Index (IRI) values were measured to be within 32–158 in./mile (0.5–2.5 m/km) after 30 months of service, which is lower than the threshold value of 200 in./mile (3.15 m/km), thus indicating good performance (Puppala et al., 2012).
Stabilized QB mixes were also evaluated for applications such as flowable fills, soil modification, and Self-Consolidating Concrete (SCC). According to the results presented in the study by Wood and Marek (1995), using 3% cement, 8% fly ash, and 89% QB resulted in a flowable fill with adequate performance. Naik et al. (2005) examined the use of QB in SCC and reported that the addition of QB minimized the needed quantity of admixtures without reducing the strength of the SCC. Koganti and Chappidi (2012) reported that using up to 40% QB by weight proved to be beneficial in improving the strength of black cotton expansive soil.
Recent laboratory studies have also investigated the use of QB (or quarry fines) for pavement applications. Abdullah et al. (2018) conducted workability tests, flexural strength tests, and compressive strength tests on concrete samples with 100% quarry fines used for sand replacement in concrete. The study concluded that concrete samples with 100% QB as fine aggregates produced more sustainable concrete samples with better durability, compressive strength, and furnishing properties. The same study reported that concrete samples with QB had higher water absorption and workability at lower water/cement ratios. Schankoski et al. (2017) evaluated the rheological

11
properties of fresh cement paste with QB (diabase or gneiss quarry rock powders). They concluded that cement pastes containing QB had lower yield stress and lower viscosity than samples with cement pastes only.
2.4 DURABILITY OF QB IN PAVEMENT APPLICATIONS
Despite the promising results for using chemically stabilized aggregate QB materials in subsurface pavement applications from laboratory and field evaluations, only a few studies were conducted to evaluate the durability aspects of QB under wet-dry and freeze-thaw conditions. Further, most of these studies focused on the durability of QB or quarry dust in concrete applications as a more sustainable replacement of natural sand or fine aggregates in concrete (Ilangovana et al., 2008; Galetakis & Soultana, 2016; Li et al., 2011). A study by Ilangovana et al. (2008) concluded that the durability of concrete specimens prepared with QB as a replacement of natural sand was 10% higher than that of the same concrete with natural sand. Galetakis and Soultana (2016) reported several studies on concrete that concluded the chemical durability of concrete with QB is higher than conventional concrete. Similar conclusions were reported by Li et al. (2011) for the freeze-thaw durability of concrete with limestone QB fines. Further, Amadi (2014) reported a significant enhancement in the wet-dry durability of subgrade soils modified with QB and cement kiln dust. Similarly, Onyejekwe and Ghataora (2015) reported that QB materials stabilized with cement and a polymeric additive benefited from improved wet-dry durability when evaluated by immersion tests.
For the durability of QB as a base/subbase material, Eze-Uzomaka and Agbo (2010) investigated the use of cement-stabilized laterite with quarry fines used as an additive for base course applications. The study defined a durability failure as a loss in UCS exceeding 20% after durability testing. According to the study, only cement contents exceeding 8% could result in a loss of UCS not exceeding 20%, and all samples stabilized with lower cement contents failed to meet durability requirements. Gurbuz (2015) investigated the use of quarry fines to stabilize subgrade soils for subbase applications in pavements. The study concluded that subgrade soils stabilized with marble QB fines have satisfactory durability under freeze-thaw cycles. The samples prepared with marble QB fines exceeding 10% had a cumulative soil-cement loss of 5% or lower after 12 cycles of freeze-thaw testing. Zhang et al. (2019) concluded that stabilized quarry fines can have sufficient durability and strength requirements for use as structural layers in high-volume pavement applications, provided that they are well designed and sufficiently compacted to a proper relative density.

12
CHAPTER 3: SAMPLE PREPARATION AND TESTING
3.1 INTRODUCTION
This chapter presents information on the preparation, curing, and testing of samples for freeze-thaw and wet-dry durability and unconfined compressive strength characteristics. Three sets of samples were prepared as follows: (i) 28 remolded laboratory samples for freeze-thaw and wet-dry durability testing; (ii) 28 field specimens extracted from the base/subbase layers for the chemically stabilized QB sections in Cell 2 and Cell 3 (constructed for ICT-R27-168) for freeze-thaw and wet-dry durability testing; and (iii) 24 remolded laboratory samples for unconfined compressive strength testing. Details of the extraction and/or preparation of samples are presented in the following sections. Further, durability tests conducted at the Illinois DOT Central Bureau of Materials (CBM) with details on sample behavior and failure mode investigation during/after wet-dry and freeze-thaw durability testing are presented in this chapter.
3.2 EXTRACTION AND PREPARATION OF FIELD SAMPLES
Following trenching of the test sections in ICT-R27-168, it was realized that the chemically stabilized QB materials can be recovered in intact pieces that were large enough to extract laboratory samples for durability testing. Ideally, samples for freeze-thaw and wet-dry durability tests required by AASHTO T 136 and AASHTO T 135 standard test procedures, respectively, are cylindrical with dimensions conforming to the size of the standard Proctor mold. Earlier on in project ICT-R27-168, several attempts to extract intact cylindrical cores of the stabilized base/subbase layers from the wheel path by a conventional coring method were not successful as the materials eroded with the presence of water introduced by the coring process. In another attempt, a dry coring technique, using a specially designed dry coring bit, was employed to extract cylinders from the stabilized base and subbase layers. However, the lightly cemented layers eroded under the drilling action, producing fine fragments that clogged the coring bit, creating high friction and preventing the recovery of fully intact cores from the drill bit.
Ultimately, large blocks/chunks of intact stabilized QB base/subbase sections were collected to prepare field samples in the laboratory by saw-cutting. The large blocks were extracted utilizing a mini excavator. Since the test sections were trenched for project ICT-R27-168, and trenches were exposed to environmental conditions that might have eroded or changed the composition of the exposed materials over time, the remaining HMA on top of the test sections was removed. All samples for durability testing were extracted from underneath the removed HMA to ensure the samples prepared for durability testing are representative to the constructed test sections. The extracted materials were stored for further handling and cutting. The procedure for extracting and storing the field materials is outlined in Figure 3.1.

13
Figure 3.1. Extraction of stabilized QB materials from the test sections constructed for ICT-R27-168.
Following the extraction and storage of intact blocks of field samples, the samples were cut into cuboid prisms using a large saw-cutting equipment normally used for cutting hard rocks. A dry saw-cutting procedure was adopted to ensure samples do not disintegrate due to the presence of water (or other liquids such as lubricating oil normally used with this equipment for cutting hard rocks). The samples were shaped into cuboids (prisms) with a square cross section having a 2.8 in. (71 mm) side length and a 4.6 in. (122 mm) height (i.e. L = W = 2.8 in. and H = 4.6 in.). Note that the actual cut sizes were slightly different than the nominal size. The size and shape of the prepared specimens was primarily governed by the size of the chunks recovered from the field, which controls the movement of the blade and its wobbling action depending on the weight of the chunk being cut. The final samples produced by saw-cutting are shown in Figure 3.2. Sample shape and geometry is presented in Figure 3.3, which also shows a size comparison to a standard Proctor sample size. Note that the samples extracted from sections with blends of quarry by-products and recycled coarse aggregates generally had a rougher surface finish than those with QB only. In particular, the samples extracted from C2S3 with QB, FRAP, and fly ash had the roughest (least uniformly cut) surface finishes.

14
Figure 3.2. Saw-cutting procedure for field samples (top) and the final saw-cut samples tested for durability (bottom).
The as-received dry densities and the relative densities of all field-extracted samples are presented in Table 3.1. The dry densities were calculated based on the as-received density and as-received moisture content of each sample, which were measured at IDOT Central Bureau of Materials (CBM). Table 3.1 lists low relative densities of some of the extracted samples compared to the maximum dry densities determined from the laboratory compaction tests using the standard Proctor compactive effort. Specifically, samples extracted from C2S1 with cement-stabilized QB2/FRAP mixes, C2S3 with fly ash–stabilized QB2/FRAP mixes, C3S1 with cement-stabilized QB3, and C3S3 with fly ash–stabilized QB2 had the lowest field dry densities and relative densities. These low densities could result in rather poor wet-dry and freeze-thaw durability trends when compared to those of the same material combinations compacted at higher relative densities.

15
Table 3.1. Summary of Field Sample Dry and Relative Densities
Sample Name
Spec.
Maximum Laboratory Dry Density (MDD)
pcf (kN/m3)
Wet-Dry Durability Samples Freeze-Thaw Durability Samples
As Received Dry Density pcf (kN/m3)
Relative Density (%)
As Received Dry Density pcf (kN/m3)
Relative Density (%)
C2S1 # A
135.0 (21.2) 118.1 (18.6) 87.5 117.9 (18.5) 87.4
# B 115.2 (18.1) 84.7 121.4 (19.1) 89.9
C2S2 # A
128.6 (20.2) 119.0 (18.7) 86.9 116.8 (18.3) 90.8
# B 124.2 (19.5) 90.0 127.2 (20.0) 99.0
C2S3 # A
136.2 (21.4) 111.8 (17.6) 80.4 113.8 (17.9) 83.5
# B 115.0 (18.1) 82.2 114.0 (17.9) 83.7
C2S4 # A
137.5 (21.6) 131.8 (20.7) 93.5 131.4 (20.6) 95.6
# B 132.4 (20.8) 93.3 132.2 (20.8) 96.1
C3S1 # A
129.9 (20.4) 111.9 (17.6) 78.2 108.4 (17.0) 83.5
# B 111.1 (17.4) 77.1 108.5 (17.0) 83.5
C3S2 # A
137.5 (21.6) 131.1 (20.6) 90.4 132.2 (20.8) 96.1
# B 133.4 (20.9) 91.3 127.5 (20.0) 92.7
C3S3 # A
135.6 (21.3) 122.3 (19.2) 83.2 124.1 (19.5) 91.5
# B 124.3 (19.5) 84.0 123.5 (19.4) 91.1
3.3 PREPARATION OF LABORATORY SAMPLES
Seven sets of laboratory samples were molded and prepared in the laboratory for freeze-thaw and wet-dry durability testing. In total, 28 samples were molded with four samples molded for each material combination: two for wet-dry and two for freeze-thaw durability testing. The material combinations are summarized in Table 3.2 along with the Optimum Moisture Content (OMC) and Maximum Dry Density (MDD), data from standard Proctor testing, and the molded wet densities. The OMC and MDD were targeted for the preparation of laboratory samples. The full suite of moisture-density data was presented elsewhere in the final report of project ICT-R27-168 (Qamhia et al., 2018). Note that these molded laboratory samples are replicates of the material combinations that were used to construct the field test sections. Only one set of laboratory samples was prepared for the C2S4 and C3S2 base and subbase applications, respectively, since the same material combinations were used for both applications.
For C2S2, two sets of samples were prepared: one with the full gradation (C2S2_R) and the other with any FRCA material retained on the 3/4 in. (19 mm) sieve removed (C2S2_S). All samples were compacted in a standard Proctor mold (see Figure 3.3) with a 4 in. (102 mm) diameter and 4.6 in. (116 mm) height and were compacted at the standard Proctor compactive effort (energy). To preserve the shape of samples upon demolding, the standard Proctor mold was specially cut into a split mold, which was deemed necessary for keeping such non-cohesive weak samples intact for

16
curing and testing. The split mold setup for preparing the durability samples and one prepared sample with QB2 and cement are shown in Figure 3.4.
Figure 3.3. Durability sample size and geometry: size of field-extracted samples (left) and the lab mold used for preparing laboratory samples (right).
Figure 3.4. Preparation of molded laboratory samples using a split mold.

17
Table 3.2. Material Combinations of Laboratory-molded Samples
Sample Name
Sample Description/Quarry By-Product Durability Cylinders
Optimum Moisture
(%)
Standard Dry Density
pcf (kN/m3)
Calculated Wet Density pcf (kN/m3)
Calculated Wet Weight
Lbs. (g)
C2S1 Blend of 70% QB2 & 30% FRAP; stabilized with 3% Type I cement
8.0 135.0 (21.2) 145.8 (22.9) 4.86 (2206)
C2S2-S
Blend of 70% QB2 & 30% FRCA by weight; stabilized with 3% Type I cement. Plus ¾ in. FRCA material not included in specimen (stripped)
9.8 128.6 (20.2) 141.2 (22.2) 4.71 (2136)
C2S2-R
Blend of 70% QB2 & 30% FRCA by weight; stabilized with 3% Type I cement. Plus ¾ in. FRCA material included in specimen (retained)
9.4* 130.1* (20.4) 142.3 (22.4) 4.75 (2153)
C2S3 Blend of 70% QB2 & 30% FRAP by weight; stabilized with 10% Class C fly ash
7.5 136.2 (21.4) 146.4 (23.0) 4.88 (2215)
C2S4 Blend of QB2 and 3% Type I cement 9.1 137.5 (21.6) 150.0 (21.6) 5.00 (2269)
C3S1 Blend of QB3 and 3% Type I cement 8.4 129.9 (20.4) 140.8 (22.1) 4.70 (2130)
C3S3 Blend of QB2 and 10% Class C fly ash 8.0 135.6 (21.3) 146.4 (23.0) 4.89 (2216)
* Moisture-density relationship for C2S2-R was performed on minus 3/4 in. (19 mm) material per specifications. Standard dry density and optimum moisture values were 128.6 pcf (20.2 kN/m3) at 9.8% moisture content. The values shown in the above table reflect coarse particle adjustment for 5.5% oversize particles (+ 3/4 in. or 19 mm).
3.4 CURING OF SAMPLES
Curing of samples was achieved by letting the laboratory-prepared samples stand in a moist room at ~100% relative humidity and room temperature of 70 ± 3°F (21 ± 2°C) for seven days. All samples were cured unsealed. Note that only the samples prepared in the laboratory for durability and Unconfined Compressive Strength (UCS) testing were cured in the moist room. The samples extracted from the field test sections were not further cured since they were constructed about three years prior to durability testing and were, since then, exposed to varying environmental conditions and possibly several wet-dry and freeze-thaw cycles. Figure 3.5 shows the curing of the 28 laboratory-molded durability samples for wet-dry and freeze-thaw durability testing in a moist room. Similarly, all prepared UCS samples were cured in a similar manner. The preparation, curing, and testing of UCS samples will be detailed later in this chapter.

18
Figure 3.5. Moist room curing of the laboratory-molded samples for freeze-thaw and wet-dry durability testing.
3.5 TESTING OF WET-DRY DURABILITY SAMPLES
Testing of wet-dry durability samples was conducted according to the specifications and requirements of AASHTO T 135 standard “Standard Method of Test for Wetting-and-Drying Test of Compacted Soil-Cement Mixtures.” After each cycle of wetting and drying, measurements of moisture change, volume change, and soil-cement loss by a brushing method were taken. Note that method “A” specifies that 100% of the sample passes the #4 sieve (4.75 mm), which does not apply to all the tested samples. The standard method “B” in the AASHTO T 135 specification was employed to test the wet-dry specimens, which was deemed necessary since many of the samples had recycled coarse FRAP and FRCA large-sized materials. The testing procedure involved wetting of the seven-day cured samples for five hours in potable water at a room temperature of 70 ± 3°F (21 ± 2°C), followed by oven-drying for 42 hours at a temperature of 160 ± 5°F (71 ± 3°C). Weight was recorded after each step. Samples were then tested for wet-dry durability by brushing all areas with two firm strokes using a wire scratch brush and applying a brushing force corresponding to approximately 3 lbf (13 N). The wetting and drying steps were repeated for a total of 12 cycles for each tested specimen, with weight and cement loss measurements taken after each testing cycle.
In total, 14 laboratory-molded samples and 14 field-extracted samples were tested. These samples entail the seven material combinations for lab and field samples, with two replicates tested for each combination (referred to by replicates “A” and “B”). All wet-dry durability testing was conducted at IDOT CBM after molding and curing or extraction and saw-cutting at the University of Illinois. The laboratory-molded samples were tested first, followed by the field-extracted samples.
For the testing of the laboratory-molded samples, the original molded wet weight and molded moisture content were not fully tracked during the molding process. Since these two values are key

19
components in the calculation of soil-cement loss, and since all laboratory samples were compacted at the MDD and OMC, the specimen wet weights were back-calculated using the MDD and OMC values and then used for the calculation of the soil-cement loss. Note that for the purposes of this report, soil-cement loss is referred to soil-modifier loss in samples stabilized with cement or fly ash as the chemical modifier. The starting wet weight of a specimen is commonly lower than its molded wet weight due to material loss during extrusion and handling and water evaporation. Each specimen’s weight was recorded prior to the start of durability testing at IDOT CBM. In most cases, these weights were slightly lower than the back-calculated wet weights. In one instance (C3S1), the “as-received” wet weight was greater than the back-calculated value and was thus assumed to be the molded wet weight.
Similarly, for the field-extracted samples, some assumptions needed to be made for estimating the moisture content at compaction and the “as-received” moisture contents. In order to calculate the “as-received” dry mass/density of each block sample, the initial moisture content needed to be calculated. The as-received moisture content was derived from the initial oven-drying period of the wet-dry durability. This value was adjusted upward to account for the water of hydration for all specimens stabilized with 3% cement. No water of hydration adjustment was applied to samples stabilized with 10% fly ash. For density calculations, the block specimen dimensions were measured, and the mass of the block was recorded. The dry mass/density was calculated by adjusting for the measured as-received moisture content, and the wet mass/density for each specimen was calculated by assuming that the specimens were compacted at a moisture content like the OMC. Note that the calculated dry densities were significantly lower than the MDD for some of the field test sections (e.g. C3S1 with cement-stabilized QB2). The dry densities and relative densities of the field-extracted samples are presented in Table 3.1.
For the determination of the percentage of soil-cement loss of the field and laboratory samples, the corrected oven-dry weight of the samples needed to be calculated. The correction assumed the water of hydration was equal to 1/4 of the percent cement in the specimen for the cement-stabilized samples, and zero for the fly ash stabilized ones. Accordingly, the soil-cement loss (%) was calculated using the following formula from the Portland Cement Association (PCA):
𝑆𝑜𝑖𝑙 𝐶𝑒𝑚𝑒𝑛𝑡 𝑙𝑜𝑠𝑠 (%) =𝐶𝑎𝑙𝑐𝑢𝑙𝑎𝑡𝑒𝑑 𝑑𝑟𝑦 𝑤𝑒𝑖𝑔ℎ𝑡−𝑐𝑜𝑟𝑟𝑒𝑐𝑡𝑒𝑑 𝑜𝑣𝑒𝑛 𝑑𝑟𝑦 𝑤𝑒𝑖𝑔ℎ𝑡
𝑐𝑎𝑙𝑐𝑢𝑙𝑎𝑡𝑒𝑑 𝑑𝑟𝑦 𝑤𝑒𝑖𝑔ℎ𝑡 𝑥 100% (3.1)
Note that the calculation of the percentage of soil-cement loss is intended after the completion of 12 cycles of wet-dry durability. The soil-cement loss, however, can be estimated after the completion of any cycle of durability provided that the specimen remains intact and the moisture content can be reasonably estimated. Further, the final corrected moisture content was computed for each specimen from the final recorded brushed weight and the corresponding corrected oven-dry weight. This includes the water of hydration when cement is used for chemical stabilization.
For the standard testing procedure of wet-dry durability with AASHTO T 135, the standard specifies that each Proctor-sized sample is brushed with eighteen to twenty vertical firm brush strokes using a wire scratch brush, such that each area of the sample along the longitudinal axis is brushed with two firm strokes. An additional four strokes are required on each end of the cylindrical specimen. This

20
procedure was followed closely for all laboratory-molded specimens. For the field specimen, on the other hand, and given the sample geometry and the size of the wire brush, each face of the block sample was brushed with four strokes, which ensured that all areas are brushed with two firm strokes, thus meeting the requirements of the AASHTO T 135 standard. Selected steps of wet-dry durability test illustrating the procedure and the sample conditions at certain cycles indicated are presented in Figure 3.6.
Wetting of lab samples Oven-drying of lab samples Brushing of lab samples
Cycle 1
Cycle 7
Cycle 12
Testing of laboratory-molded samples for wet-dry durability
Testing of field-extracted samples for wet-dry durability
Figure 3.6. Testing of lab and field samples for wet-dry durability at IDOT CBM.

21
3.6 TESTING OF FREEZE-THAW DURABILITY SAMPLES
Testing of freeze-thaw durability samples was conducted according to the specifications and requirements of the AASHTO T 136 standard “Standard Method of Test for Freezing-and-Thawing Tests of Compacted Soil-Cement Mixtures.” Like AASHTO T 135 for wet-dry durability, this standard involves using a brushing method to determine the percentage of soil-cement loss, moisture changes, and volume changes produced after each cycle of freezing and thawing. The standard method “B” was also used. The testing procedure involves the placement of seven-day cured samples in a freezing cabinet in air for 24 hours at a temperature of -10°F (-23°C), followed by thawing in a moist room for 23 hours at 100% relative humidity and a temperature of 73.5 ± 3.5°F (23 ± 2°C). The standard procedure recommends that samples are padded with absorptive materials at the freezing and thawing stage to permit water absorption by capillary action. The sample weights were recorded after each step, and the samples were brushed and tested in the exact same manner as the wet-dry samples, as outlined above. After 12 cycles of testing were completed, the samples were dried to a constant weight at a temperature of 230 ± 0°F (110 ± 5°C).
In total, 14 laboratory-molded samples and 14 field-extracted samples were tested for freeze-thaw durability. Two replicates were tested for each material combination (referred to by replicates “A” and “B”). All freeze-thaw durability testing was conducted at IDOT CBM after preparation (and curing) at the University of Illinois. For the testing of both laboratory-molded samples and field-extracted samples, the same assumptions and calculations that were undertaken for the wet-dry samples also apply for the freeze-thaw samples for the purpose of estimating the initial/molded moisture content and the starting wet weight prior to durability testing. The number of brushing strokes for the field-extracted samples and the laboratory-molded samples was also the same as the wet-dry durability testing. Further, the calculations for the soil-cement loss are like those reported above for wet-dry testing. The same assumptions and corrections for the water of hydration for the stabilizing agents were used. Selected steps of freeze-thaw durability testing illustrating the procedure and the sample conditions at certain test cycles indicated are presented in Figure 3.8.
One issue with the testing of freeze-thaw samples was that the calculation of the soil-cement loss is accurate for specimens that remain reasonably intact and is intended to be computed after the completion of 12 cycles of freezing and thawing as per AASHTO T 136. Errors are introduced into the soil-cement loss calculations for specimens that experience excessive deterioration and/or unaccountable material loss during testing. For samples that did not complete 12 cycles of testing because of excessive sample deterioration, an estimate of soil-cement loss after 12 cycles was accomplished by extrapolating the data from the twelfth cycle by curve fitting the data with a second- or third-order polynomial. The order of the polynomial was chosen such that the experimental data is most accurately fit. For these specimens, the final moisture content was estimated and was derived from both replicates when possible and from specimens with a similar blend of materials. This includes the water of hydration when cement was used as the chemical stabilizer. The results of the freeze-thaw durability testing, including details for samples that did not complete 12 cycles of testing, will be presented in Chapter 4.

22
Freezing of laboratory samples Thawing of laboratory samples (moist room)
Cycle 1 Cycle 7 Cycle 12
Testing of laboratory-molded samples for freeze-thaw durability
Testing of field-extracted samples for freeze-thaw durability
Figure 3.7. Testing of laboratory and field samples for freeze-thaw durability at IDOT CBM.
3.7 TESTING OF UNCONFINED COMPRESSIVE STRENGTH SAMPLES
In addition to preparing samples for durability testing, samples were also prepared to test for the seven-day Unconfined Compressive Strength (UCS). The samples were compacted in a 4 in. (102 mm)

23
diameter and 8 in. (203 mm) tall cylindrical mold in four lifts. The compaction method utilized was as per the recommendations of ASTM C1435/ C1435M “Standard Practice for Molding Roller-Compacted Concrete in Cylinder Molds Using a Vibrating Hammer.” Four cylinders were prepared for each of the six material combinations investigated in the field study (i.e. C2S1–C2S4, C3S1, and C3S3). Note that for the seventh test section (C3S2) the material combination in the subbase was essentially the same as that in the base layer of section C2S4. All samples were compacted at the optimum moisture contents determined from standard Proctor tests. Note that C2S4 and C3S2 studying base and subbase applications of cement-stabilized QB2 material, respectively, essentially have the same material compositions; so, only one set of samples was prepared for both sections. All samples were cured for seven days in a moist room at a room temperature and a relative humidity of ~100%. Prior to testing the samples for UCS, the cylindrical samples were capped at both ends using a sulfur-based capping material. Moisture-cured samples were tested for their seven-day UCS following the procedure outlined in the ASTM 1633 “Standard Test Methods for Compressive Strength of Molded Soil-Cement Cylinders.” A loading rate of 3,500–5,500 lb./minute (15.6–24.5 kN/minute) was used for UCS testing. Figure 3.8 illustrates some of the steps involved in the preparation, curing, capping, and testing of the UCS samples.
Preparation of UCS samples Curing of UCS samples
Capping of UCS samples Testing of UCS samples
Figure 3.8. Preparation, curing, and testing of unconfined compressive strength samples.

24
CHAPTER 4: RESULTS AND INTERPRETATIONS
4.1 INTRODUCTION
This chapter presents the results for wet-dry and freeze-thaw durability for samples molded in the laboratory and samples extracted from the field test sections studying sustainable QB applications. Details for sample preparation and testing, along with any assumptions, were discussed in detail in the previous chapter. First, the results and interpretations for the wet-dry durability testing are given, followed by the results and interpretations for freeze-thaw durability and unconfined compressive strength (UCS) testing. The effect of curing duration, type of stabilizer (cement vs. fly ash), and the chemical composition of the QB materials on the results of durability testing are discussed. The validity of assumptions and their effect on the final durability results are also discussed in this chapter. Finally, the results for UCS are compared with previous results for samples tested right before the construction of the field test sections in 2016 to capture any effects of material variability, particularly cement and Class C fly ash composition, on the durability results.
4.2 RESULTS FOR WET-DRY DURABILITY
Table 4.1 and Figure 4.1 summarize the results of the wet-dry durability testing for the laboratory-prepared specimens. Detailed information about the test results of each sample is given in Table 4.3 in the notes section. All laboratory samples survived the 12 cycles of wet-dry durability testing. IDOT Standard Specifications for Road and Bridge Construction specifies that the loss in weight/mass shall be less than 10% after 12 cycles of wetting and drying (IDOT, 2016). For the laboratory samples, the only sample to exceed 10% soil-cement loss after 12 cycles of testing was C2S2-S #A lab samples. All laboratory-molded samples had similar soil-cement losses after 12 cycles of wet-dry testing, which ranged between 3.5–10%. On average, C3S1 with cement-stabilized QB3 had the lowest soil-cement loss (3.58%), while C2S4 with cement-stabilized QB2 had the highest soil-cement loss (9.83%). It can be concluded that the chemical composition of QB3 provided an advantage for wet-dry durability in the short term. The effect of chemical composition on durability is discussed in detail later in this chapter.
The full suite of wet-dry durability data for lab samples are presented in Appendix A, which also provides measurements of the final corrected moisture content of the samples after 12 cycles of testing. The final moisture content was corrected to account for the water of hydration of cement for all samples stabilized with cement. No correction was applied to fly ash–stabilized specimens due to lack of knowledge and literature on the water of hydration for fly ash. Note that the corrected final moisture content was provided in the appendices for each of the 56 tested wet-dry and freeze-thaw durability samples.

25
Table 4.1. Summary of Test Results for Wet-Dry Durability of Laboratory-molded Samples
Sample Name
Specimen
As Received
Weight
Lbs. (g)
No. of Cycles
Completed
Wet-Dry Soil-Cement Loss (%)
Average
Wet-Dry Soil-Cement Loss (%)
C2S1 # A 4.81 (2181) 12 6.75%
6.02% # B 4.87 (2208) 12 5.28%
C2S2-S+ # A 4.60 (2087) 12 12.03%
9.58% # B 4.72 (2141) 12 7.13%
C2S2-R+ # A 4.72 (2143) 12 7.52%
7.68% # B 4.74 (2151) 12 7.83%
C2S3 # A 4.86 (2206) 12 7.09%
7.24% # B 4.85 (2202) 12 7.38%
C2S4 # A 4.79 (2173) 12 9.66%
9.83% # B 4.76 (2159) 12 10.00%
C3S1 # A 4.78 (2170) 12 3.45%
3.58% # B 4.81 (2184) 12 3.72%
C3S3 # A 4.86 (2204) 12 5.60%
5.40% # B 4.87 (2207) 12 5.21%
+ For C2S2, ‘S’ indicates stripped samples were FRCA particles larger than 3/4 in. (19 mm) were removed; ‘R’ indicates regular gradation, i.e. using the as-received material gradation for the FRCA material
Note: No unusual behavior was observed for any of the tested samples
Figure 4.1. Estimated soil-cement loss for wet-dry durability testing of lab-molded samples.

26
Table 4.2 and Figure 4.2 summarize the results of the wet-dry durability testing for the field-extracted specimens. All samples extracted from the field test sections survived the 12 cycles of wet-dry durability testing. Samples with cement-stabilized QB2 or QB2 blended with FRAP/FRCA had significantly low soil-cement loss and slow rates of deterioration. All samples with QB2, namely C2S1, C2S2, C2S4, and C3S2, had less than 2% soil-cement loss after 12 cycles of wet-dry durability. On the other hand, C3S1 with cement-stabilized QB2 had, on average, significantly higher soil-cement loss when compared to samples with cement-stabilized QB2, i.e. C2S4 and C3S2. This is an indication that mineralogy and chemical composition of QB can affect wet-dry durability. Also, note that samples extracted from C3S1 had low relative densities compared to other cement-stabilized samples. The relative densities were reported in Table 3.1 for all field samples. Nevertheless, all cement-stabilized QB materials or QB blends with FRAP/FRCA pass the IDOT requirement of accumulating less than 10% soil-cement loss after 10 cycles of wetting and drying.
On the other hand, C2S3 and C3S3 samples with fly ash–stabilized QB2/FRAP and fly ash–stabilized QB2, respectively, had significantly higher soil-cement losses and rates of deterioration. Cement proves to be superior to Class C fly ash for long-term durability. Field samples with fly ash had a relatively high soil-cement loss ranging between 17.7% and 19.4%, which is significantly higher than what is permitted by IDOT and what was calculated for laboratory-molded samples stabilized with fly ash. Also note that the fly ash samples extracted from the field had low relative density when compared with most of the cement-stabilized QB samples (see Table 3.1).
Table 4.2. Summary of Test Results for Wet-Dry Durability of Field-extracted Samples
Sample Name
Spec.
As Received
Weight
Lbs. (g)
As Received
Density
pcf (kN/m3)
As Received
Moisture
(%)
No. of Cycles
Completed
Wet-Dry Soil-
Cement Loss (%)
Average
Wet-Dry Soil-
Cement Loss (%)
C2S1 # A 3.07 (1393) 120.3 (18.9) 1.84 12 1.51
1.51 # B 3.12 (1415) 118.5 (18.6) 2.91 12 1.51
C2S2 # A 3.02 (1369) 121.6 (19.1) 2.16 12 1.34
1.02 # B 3.17 (1437) 126.9 (19.9) 2.16 12 0.69
C2S3 # A 3.16 (1432) 112.4 (17.7) 0.56 12 19.09
17.58 # B 2.96 (1342) 115.8 (18.2) 0.68 12 16.07
C2S4 # A 3.16 (1433) 133.5 (21.0) 1.31 12 0.48
0.46 # B 3.08 (1398) 134.6 (21.1) 1.62 12 0.44
C3S1 # A 2.81 (1274) 113.6 (17.9) 1.54 12 4.30
4.50 # B 2.72 (1236) 112.8 (17.7) 1.57 12 4.69
C3S2 # A 3.44 (1562) 133.5 (21.0) 1.85 12 1.45
1.54 # B 3.24 (1469) 136.2 (21.4) 2.13 12 1.63
C3S3 # A 3.01 (1365) 123.0 (19.3) 0.59 12 19.43
18.55 # B 3.21 (1455) 125.0 (19.6) 0.55 12 17.67
Note: No unusual behavior was observed for any of the tested samples.

27
Figure 4.2. Estimated soil-cement loss for wet-dry durability testing of field-extracted samples.
The field test sections for project ICT-R27-168, which studied sustainable field applications of QB, were constructed in the summer of 2016. This means that samples for durability testing, which were extracted in the spring of 2019, were exposed to several cycles of wetting and drying / freezing and thawing in the field prior to the 12 cycles of wet-dry durability testing. This fact might explain the variability in the results of wet-dry durability between the lab and field samples, where the laboratory-molded samples showed superior performance relative to the field sample. The exposure of fly ash–stabilized samples to harsh environmental conditions over three years contributed to the poor performance of the field samples. The opposite trend was observed for the cement-stabilized samples, where the field samples mostly showed better performance when compared to the laboratory-molded samples. In the case of cement-stabilized QB samples, the long-term strength gain might have possibly outweighed the detrimental effects of having the field test sections exposed to harsh environmental conditions for around three years.
Another explanation for the significant variability in performance of the fly ash–stabilized materials between the laboratory and field samples is the composition of the fly ash. The fly ash used in the preparation of the laboratory-molded samples was obtained from the same source (vendor) as the one used in the construction of the field test sections. However, being a by-product material of coal combustion, the properties and composition of the Class C fly ash can vary greatly from batch to batch. More investigation on the differences in the chemical composition of the fly ash material used to prepare both sets of samples might be needed. The results of UCS testing presented later in this chapter were used to partly investigate the cementitious properties of the fly ash used to prepare both sets of samples. Note that fly ash is known to have a short shelf life (Tutumluer et al., 2015), and, thus, a fresh batch of Class C fly ash was obtained to prepare the laboratory samples for durability testing to ensure proper cementitious properties.

28
4.3 RESULTS FOR FREEZE-THAW DURABILITY
Table 4.3 and Figure 4.3 summarize the results of the freeze-thaw durability testing for the laboratory-prepared specimens. Detailed information about the performance of each sample is given in Table 4.3 along with the number of cycles completed before the sample fell apart (for the samples that did not complete 12 cycles of freeze-thaw testing). Note that the freeze-thaw soil-cement loss for each specimen and the average soil-cement loss given in Table 4.3 represent soil-cement losses after 12 cycles of testing. For those samples that deteriorated/fell apart before completing 12 cycles of testing, these reported values were obtained by extrapolating the data from 12 cycles by fitting the data with the best-fit polynomial. Both samples for C2S1, C2S2_R, and C2S3 with cement-stabilized QB2/FRAP, cement-stabilized QB2/FRCA, and fly ash–stabilized QB2/FRAP, respectively, did not complete 12 cycles of testing, mainly due to layer separation.
C2S1 and C2S2_R materials were used to construct the two field test sections that had superior performance trends and low levels of surface rut accumulation in the accelerated pavement study for project ICT-R27-168 (Qamhia et al., 2018; Qamhia et al., 2019). As observed in Table 4.3 and Figure 4.3, the seven days of curing was not sufficient to achieve enough bonding and cementation between the coarse aggregates and the QB materials, which led to rapid deterioration and layer separation upon brushing. Note that freeze-thaw testing is a harsher test when compared to the wet-dry durability testing. It is generally observed that all laboratory-molded samples had significantly higher soil-cement loss in freeze-thaw durability testing when compared to wet-dry testing and that all samples exceeded the 10% soil-cement loss specified by IDOT for durability testing.
Also note that for some sample sets (e.g. C2S3 and C2S4), one sample was eliminated from the average soil-cement loss reported for these materials due to variable performance between the two samples and the observations of sample performance upon testing at IDOT CBM. The eliminated samples were not graphed in Figure 4.3, but the full suite of data, including any extrapolation, are presented in Appendix B. Finally, QB2 samples stabilized with Class C fly ash, namely C2S3 and C3S3, had significantly lower soil-cement loss and lower rate of deterioration when compared to cement-stabilized samples. This can indicate higher freeze-thaw durability of fly ash–stabilized samples at early stages after seven days of curing.
On the other hand, different trends for freeze-thaw durability can be seen for the long-term cured samples extracted from the field test sections, which are given in Figure 4.4 and Table 4.4. All cement-stabilized samples with QB2 or QB2 blended with coarse-recycled aggregates (FRAP or FRCA) survived 12 cycles of testing and accumulated significantly lower soil-cement losses than the QB2 samples stabilized with fly ash and the cement-stabilized QB3 samples. Note that specimen A for C2S2 with cement-stabilized QB2 and FRCA was eliminated from the average soil-cement loss since it had a low dry density (relative dry density of specimen A was 90.8% while that of specimen B was 99.0%). Similarly, sample C3S1 with cement-stabilized QB3 materials extracted from the field test sections had significantly low densities compared to other samples and compared to the MDD value obtained from laboratory Proctor tests. This low density, in addition to the chemical composition of the QB3 material, which had less magnesium oxide content than QB2 material, may explain the poor long-term performance of C3S1. Further investigations on the effects of density and chemical composition on the durability of QB mixes are needed for a better understanding of the performance

29
trends. The freeze-thaw durability results for the field-extracted samples indicate that the type of stabilizer and the chemical composition of the QB material, which constitute 70%–100% of the aggregate materials in the sample, have significant effects on the durability of QB applications, particularly when long-term durability is considered. The full suite of data is presented in Appendix B.
Table 4.3. Summary of Test Results for Freeze-Thaw Durability of Laboratory-molded Samples
Sample Name
Specimen As Received
Weight Lbs. (g)
No. of Cycles
Completed
Freeze-Thaw Soil-
Cement Loss (%)
Average Soil-
Cement Loss (%)
Notes
C2S1
# A 4.96 (2252) 8 62%*
66.5%
Rapid deterioration—cycle #5. Layer separation—cycle #6. Done after cycle #8
# B 4.85 (2199) 9 71%* Rapid deterioration—cycle #5. Done after cycle #9
C2S2-S
# A 4.65 (2111) 11 28%*
22.8%
Rapid deterioration—cycle #8. Falls apart during cycle #12
# B 4.70 (2133) 12 17.58% Rapid deterioration—cycle #10
C2S2-R
# A 4.74 (2149) 6 78%*
79.0%
Rapid deterioration—cycle #4. Layer separated & fell apart after cycle #6
# B 4.70 (2130) 8 80%* Rapid deterioration—cycle #4. Falls apart after cycle #8
C2S3
# A 4.94 (2240) 10 90%* Use
13%**
Layer separation—cycle #6. Rapid deterioration—cycle #6. Falls apart—cycle #10
# B 4.92 (2233) 10 13%* Rapid deterioration—cycle #8. Layers separated & fell apart during cycle #11
C2S4
# A 4.80 (2175) 12 41.25% Use
41.2%***
Rapid deterioration—cycle #8
# B 4.74 (2151) 6 65%* Rapid deterioration—cycle #5. Layers separated & fell apart after cycle #6
C3S1
# A 4.68 (2123) 12 58.22%
50.13%
Rapid deterioration—cycle #6
# B 4.71 (2138) 12 42.04% Rapid deterioration—cycle #8
C3S3
# A 4.81 (2180) 12 13.55
12.86%
Rapid deterioration—cycle #10
# B 4.77 (2163) 12 12.18 Rapid deterioration—cycle #10
* Estimated soil-cement loss extrapolated from 12 cycles. ** Use 13% loss as an average estimate from specimen B (C2S3 blend). Has similar percentage of loss as fly ash blend in C3S3. Specimen A should be disregarded as it quickly deteriorated when layers began to separate. *** Use 41.2% loss as an average from specimen A C2S4 blend. Specimen A completed 12 cycles.

30
Figure 4.3. Estimated soil-cement loss for freeze-thaw durability testing of lab-molded samples.
Figure 4.4. Estimated soil-cement loss for freeze-thaw durability testing of field-extracted samples.

31
Table 4.4. Summary of Test Results for Freeze-Thaw Durability of Field-extracted Samples
Sample Name
Spec.
As Received Weight Lbs. (g)
As- Received Density
pcf (kN/m3)
As Received Moisture
(%)***
No. of Cycles
Completed
Freeze-Thaw Soil-
Cement Loss (%)
Avg. Soil-
Cement Loss (%)
Notes
C2S1
# A 2.9
(1337) 120.1 (18.9)
1.84 12 23.12
19.76
# B 3.0
(1369) 123.6 (19.4)
1.84 12 16.40
C2S2
# A 3.1
(1400) 119.3 (18.7)
2.16 12 33.26 Use
3.57**
# B 3.2
(1444) 130.0 (20.4)
2.16 12 3.57
C2S3
# A 2.9
(1323) 114.5 (18.0)
0.62 3 100 / 10
cycles
100
Rapid deterioration cycle 2. Large crack cycle 3. Falls apart cycle 4
# B 2.9
(1303) 114.7 (18.0)
0.62 3 100 / 8 cycles
Rapid deterioration cycle 2. Lay on side—cycle 3. Falls apart cycle 4
C2S4
# A 2.9
(1333) 133.3 (20,9)
1.46 12 13.01
12.70
# B 3.1
(1409) 134.1 (21.1)
1.46 12 12.38
C3S1
# A 2.7
(1205) 110.1 (17.3)
1.55 7 100 / 9 cycles
100
Rapid deterioration cycle 3. Lay on side—cycle 6. Falls apart cycle 8
# B 2.8
(1291) 110.2 (17.3)
1.55 8 100 / 10
cycles
Rapid deterioration cycle 3. Lay on side—cycle 6. Falls apart cycle 9
C3S2
# A 3.3
(1502) 134.8 (21.2)
1.99 12 5.32
7.13
# B 3.3
(1487) 130.0 (20.4)
1.99 12 8.94
C3S3
# A 3.0
(1362) 124.8 (19.6)
0.57 10 70*
72
Large loss after cycle 4. Lay on side—cycle 9. Terminate after cycle 10
# B 3.0
(1345) 124.2 (19.5)
0.57 10 73* Large loss after cycle 4. Terminate after cycle 10
* Estimated soil-cement loss extrapolated from 12 cycles. ** Use 3.57% loss as an average estimate from specimen B of C2S2 blend. Specimen A has low dry density. *** As-received moisture taken as average from corresponding wet-dry specimens.

32
4.4 RESULTS FOR UNCONFINED COMPRESSIVE STRENGTH
Unconfined Compressive Strength (UCS) tests were carried out at ICT concurrently with durability testing. Both tests were conducted to ascertain that both durability and strength requirements were investigated for QB pavement applications and checked against IDOT requirements and specifications. In addition, UCS tests helped to evaluate effects of possible material variability between the newly molded laboratory samples and the materials that were previously used to construct the test sections for project ICT-R27-168. Note that the same aggregate materials (QB2, QB3, FRAP, and FRCA) were used for the field and laboratory samples, while the cement and fly ash were newly obtained for the laboratory-molded samples to ensure adequate cementing properties and shelf life. Thus, UCS samples might indicate differences in strength properties between the field and lab samples particularly due to the different sources and compositions of cement and Class C fly ash stabilizers. Accordingly, the newly obtained UCS results could be different from the previous results although the same stabilizer type and amount were used for the majority of the material compositions.
Figure 4.5 shows the UCS test results for all material combinations evaluated in the field test sections. In addition, laboratory UCS results conducted prior to the construction of the field test sections in 2016 are also presented in Figure 4.5. The error bars represent one standard deviation from the mean UCS. Based on the mean UCS and standard deviation values, there are no statistical differences in the UCS between the current results and the previous results in ICT-R27-168 for all QB applications except for the C3S3 section having fly ash–stabilized QB2 materials. For C3S3, the newly tested samples have statistically higher UCS, which is on average ~100 psi (690 kPa) higher than the UCS values of the previously tested samples before the construction of the APT test sections (project ICT-R27-168). This higher strength could have possibly contributed to the better performance trends seen during the durability testing of the fly ash–stabilized laboratory samples when compared to those extracted from the field test sections. Results of cement-stabilized test sections indicate that the better durability performance of the field samples can be partially attributed to the long-term strength gain and the cementitious effects of the dolomitic fines, particularly for sections with QB2 materials, which needs to be further investigated by considering a larger dataset by testing materials obtained from additional QB sources.
Note that the average seven-day UCS of all tested samples in the current study ranged between 310 and 430 psi (2,137–2,965 kPa). The IDOT Standard Specifications for Road and Bridge Construction specifies a minimum seven-day compressive strength of 500 psi (3,447 kPa) for chemically treated subsurface materials (IDOT, 2016). However, based on the results of testing cube samples extracted from ICT-R27-168 field test sections, all samples with QB2 or QB2 blended with recycled coarse aggregates and stabilized with cement (i.e. C2S1, C2S2, C2S4, and C3S2) had an average UCS exceeding 600 psi (4137 kPa), which ultimately indicates that they are suitable as base/subbase course materials. The results of field cube UCS are shown in Figure 4.6. These results were also presented in the final report of ICT-R27-168 (Qamhia et al., 2018). Note that both fly ash–stabilized test sections, i.e. C2S3 and C3S3, and the cement-stabilized QB3 material, i.e. C3S1, had significantly lower cube strengths. It is generally agreed that concrete cube strengths are 18–30% higher than cylinders having a 2:1 aspect ratio of height to diameter (Townsend et al., 1977; Kumavat and Patel, 2014; Qamhia et al., 2018).

33
Figure 4.5. Unconfined compressive strength results of the investigated QB applications.
Figure 4.6. Unconfined compressive strength results of cube samples extracted from ICT-R27-168 field test sections (Qamhia et al., 2018).

34
4.5 INTERPRETATIONS OF DURABILITY RESULTS
Figure 4.7 and Figure 4.8 present the soil-cement losses at the end of durability testing, i.e. after 12 cycles, for wet-dry durability and freeze-thaw durability, respectively. The data for the laboratory-molded samples and field-extracted samples are graphed side-by-side for comparing the long- and short-term durability results of each material combination. Note that in both figures laboratory samples for C2S2_S with the 3/4 in. (19 mm) FRCA material removed are not shown since there is not an equivalent field test section constructed with this material. Also note that the laboratory samples for C2S4 and C3S2 with cement-stabilized QB2 material for base and subbase applications, respectively, are essentially the same. Based on these combined durability test results and the results for the UCS tests presented in the previous section, the following observations and interpretations can be made:
• The type, i.e. origin and chemical composition, of the quarry by-product material can have a significant impact on the wet-dry and freeze-thaw durability, particularly when long-term durability is considered. Table 4.5 presents the chemical composition of QB2 and QB3 materials determined by X-Ray Fluorescence (XRF). QB materials with more dolomitic fines, i.e. higher magnesium oxide (MgO) contents, can develop higher strength gain over time and can thus contribute to better long-term durability. This is clearly seen by comparing the durability results for cement-stabilized samples of QB2 and QB3. Since the grain size distributions are quite similar for both QB2 and QB3, the chemical composition is a main factor that can relate to the obvious discrepancies in durability performance trends. QB2 has significantly higher percentages of MgO (33.4–36.7%) compared to the 9.5–11% MgO in QB3, and thus can acquire significantly higher strength gain and improved durability with time. The effect of QB chemical composition on short- and long-term durability needs to be further investigated by considering a larger dataset to investigate any statistical significance of chemical composition on durability.
Table 4.5. Chemical Composition of QB2 and QB3 Materials
QB Material Crushing Stage Composition by Weight (%)
CaO MgO SiO2 Al2O3 Fe2O3 K2O
QB2
Primary 54.7 36.7 6.2 0.8 0.8 0.4
Secondary 48.5 33.4 14.1 1.6 0.9 0.8
Tertiary 50.4 34.2 11.8 1.1 0.9 0.7
Average 51.2 34.8 10.7 1.2 0.9 0.6
QB3
Primary 58.7 11.0 23.2 4.4 1.1 0.8
Secondary 71.4 10.1 14.3 2.0 1.0 0.6
Tertiary 71.4 9.5 14.8 2.2 0.8 0.6
Average 67.2 10.2 17.4 2.9 1.0 0.7
• The compacted density of the samples can also contribute to durability aspects, where samples with higher compacted densities are generally expected to be more durable. This was verified for the field samples extracted from C2S2, where specimen A had significantly lower achieved dry density than specimen B, and had significantly higher soil-cement loss

35
after 12 cycles of testing (see Table 4.4). Similarly, the field-extracted samples from C3S1 with cement-stabilized QB3 materials had a quite low field density of 110 pcf (17.3 kN/m3), which is comparatively lower than the laboratory measured MDD for this material combination (MDD = 129.9 pcf or 20.4 kN/m3). In addition to having lower dolomitic fines content linked to questionable long-term durability, the low density of samples extracted from C3S1 might have also contributed to the poor durability of the field-extracted samples. This was particularly clear for the freeze-thaw durability test, which is known to be a harsher and more damaging test than wet-dry durability. Similar trends were observed for the field-extracted samples from C2S3 and C3S3 with fly ash–stabilized QB2/FRAP and QB2, respectively, which also had low relative densities compared to other field-extracted samples.
• All field-extracted and laboratory-molded samples passed the requirements of IDOT for wet-dry durability testing by accumulating less than 10% average soil-cement loss after 12 cycles of testing, except for the two field sections where fly ash was used as the chemical stabilizer. These two sections are C2S3 and C3S3 with fly ash–stabilized QB2/FRAP blend and fly ash–stabilized QB2, respectively. Comparing the durability test results of the field and laboratory samples, 3% cement stabilization resulted in significantly better wet-dry durability performance (maximum of 9.83% soil-cement loss) than what could be achieved with 10% Class C fly ash (17.6%-18.6% average soil cement loss for field samples with fly ash).
• The field-extracted samples were obtained from test sections that were exposed to harsh environmental conditions for nearly three years, indicating that they have experienced several cycles of freezing and thawing over three harsh winters and multiple cycles of wetting and drying due to moisture content fluctuations. Yet, the cement-stabilized field QB samples showed superior performance compared to the seven-day cured samples that were molded in the laboratory. On the other hand, the fly ash samples showed an opposite trend (see side-by-side comparison of field and lab samples shown in Figure 4.7 and Figure 4.8). It can be inferred that the strength/durability gain in cement-stabilized QB samples outweighs the deterioration due to climatic conditions, while cycles of wetting/drying and freezing/thawing incur more damage in Class C fly ash–stabilized samples that is not improved by long-term strength gain. It can also be inferred that the type and chemical composition of the fines can contribute to the chemical reactions; more cementation was observed with the dolomitic fines (QB2 vs. QB3) over time.

36
Figure 4.7. Average soil-cement loss at the last cycle (12th cycle) for wet-dry durability testing.
Figure 4.8. Average soil-cement loss at the last cycle (12th cycle) for freeze-thaw durability testing.
37
CHAPTER 5: SUMMARY AND CONCLUSIONS
5.1 SUMMARY OF RESEARCH APPROACH
This report presented results from a study conducted at the Illinois Center for Transportation (ICT) and the Illinois Department of Transportation (IDOT) Central Bureau of Materials (CBM) focusing on the freeze-thaw and wet-dry durability behavior of chemically stabilized applications of Quarry By-products (QB) in flexible pavements. The base and subbase applications of QB studied involved 3% cement- or 10% fly ash–stabilized QB materials and QB blends with recycled coarse aggregates, namely Fractionated Reclaimed Asphalt Pavements (FRAP) or Fractionated Reclaimed Concrete Aggregates (FRCA). The QB applications studied for durability were previously evaluated for field performance trends through accelerated pavement testing (APT), which provided a unique opportunity to collect field samples with known performance to check their durability due to varying climatic conditions of freeze-thaw and wet-dry cycles.
In total, 56 samples were tested for the wet-dry and freeze-thaw durability. Half of the samples were newly prepared samples in the laboratory, while the other half was extracted from seven full-scale field test sections studied through APT. Field samples were saw-cut into cuboid prisms having the dimensions of an inscribed cuboid in the standard Proctor mold. Freeze-thaw and wet-dry durability tests were conducted as per AASHTO T 136 and T 135, respectively. Both standards involve firm brushing of samples using a steel wire brush. A brushing pattern was selected for both field and laboratory samples to account for sample geometry and ensure that all areas in each sample receive at least two firm strokes with the wire brush at each cycle of testing. After each cycle of wet-dry and freeze-thaw durability, samples were weighted to calculate the brushed loss, the cumulative brushed loss, and the percentage of soil-cement loss.
All wet-dry durability samples survived the 12 cycles of wetting and drying required by the AASHTO T 135 standard test. For freeze-thaw durability testing by the AASHTO T 136 standard, some of the samples experienced layer separation and significant deterioration that prevented the completion of testing and further brushing of intact samples. In such occasions, the results for soil-cement loss were extrapolated by curve fitting the data to provide an estimate of the soil-cement loss after 12 freezing and thawing cycles. An estimate or a measurement for the final corrected moisture content at the end of wet-dry and freeze-thaw durability testing was provided for each tested sample. The final moisture content was corrected for the water of hydration of cement by assuming a quarter of a percent (0.25%) of the cement content in the specimen, as recommended by the Portland Cement Association (PCA) equation. No correction was applied for fly ash samples due to lack of literature.
5.2 FINDINGS, CONCLUSIONS, AND RECOMMENDATIONS
In light of the investigation of the durability aspects of seven sustainable QB applications and the satisfactory wet-dry and freeze-thaw durability demonstrated for some of the material combinations, particularly for the field samples that were cured over a longer period of time, the following findings, conclusive remarks, and recommendations can be offered:

38
• Wet-dry durability resulted in lower percentages of soil-cement loss compared to freeze-thaw durability for most laboratory-molded and field-extracted samples. The AASHTO T 136 freeze-thaw durability testing procedure was found to be a harsh and destructive test for chemically stabilized QB materials and QB blends with FRAP/FRCA. Some of the material combinations that showed successful field performance under accelerated pavement testing failed to accumulate less than 10% of soil-cement loss after 12 cycles of testing, particularly for freeze-thaw durability testing, which is the standard IDOT procedure to select a cement content for chemically stabilized base and subbase applications.
• All laboratory-molded samples and all cement-stabilized samples extracted from the field had satisfactory wet-dry durability. Fly ash–stabilized samples extracted from the field accumulated significantly higher soil-cement loss after 12 cycles, indicating a poor performance of fly ash. It can be concluded that fly ash–stabilized field sections were less durable and lost strength/durability with exposure to freeze-thaw and wet-dry cycles in the field for around three years.
• Chemical composition of the QB material was found to have a significant effect on the durability of chemically stabilized QB applications, particularly when long-term durability is considered. QB2 material with more dolomitic QB fines, i.e. with higher magnesium oxide contents, had more long-term strength gain and better durability than QB3 material with higher calcium limestone fines. The cement-stabilized QB2 materials or QB2 blended with FRAP/FRCA benefited from higher dolomitic fines content and significantly increased the long-term durability of the field samples. The lower density of the cement-stabilized QB3 samples extracted from the field test section also contributed to the poorer durability performance of chemically stabilized QB3 fines.
• Possible trends observed between durability and unconfined compressive strength characteristics of different material combinations were somewhat inconclusive. This warrants the need for further and more extensive investigations on the cementation type improvement observed with dolomitic fines and related mechanisms of long-term strength and durability characteristics.
Given the satisfactory performance of the cement-stabilized field test sections in project ICT R27-168, and given the results from this durability study, particularly for the field extracted specimens, the following recommendations can be made for the proper implementation of the investigated QB pavement applications:
• QB test sections constructed from QB2 or QB2 blended with FRAP or FRCA and stabilized with cement have the highest potential for implementation. These test sections generally showed superior field performance and satisfactory wet-dry durability. The mix designs can be slightly altered to ensure freeze-thaw durability and sufficient unconfined compressive strengths are obtained. Cement-stabilized QB3 applications shall also be recommended for base and subbase layers, but proper field compaction is required and the mix design, i.e. the percentage of cement, might be slightly increased to ensure that durability aspects are met.

39
• The use of FRAP or FRCA as a coarse aggregate forming the primary skeleton of the QB-FRAP/FRCA-cement mixes had positive effects on load carrying capacity and field performance. At the same time, the use of recycled coarse aggregates did not result in adverse loss of durability. Thus, the use of mix designs of QB and recycled coarse aggregates shall be encouraged as a successful and sustainable implementation alternative.
• The fly ash–stabilized applications of QB needs to be revisited before implementation. An adequate evaluation of the long-term durability aspects and factors contributing to the wet-dry and freeze-thaw durability of these applications were not fully achieved in this study. Based on the current findings, fly ash–stabilized QB applications shall be recommended for short-term improvements such as improved subgrade and subbase applications. Utilizing fly ash–stabilized QB mixes in base course applications requires further investigations of long-term durability and field performance. Note that fly ash–stabilized QB applications had higher material variability and did not perform comparable to the cement-stabilized applications of QB investigated in the field rutting study of the R27-168 project.
• Overall, the lightly stabilized applications of QB investigated in this project and the previous R27-168 project prove that the investigated QB applications are readily implementable. It is advisable that mix designs be checked for both durability and unconfined compressive strength results and a certain low percentage of cement, such as 3% by weight studied herein, adequately meet the strength and durability criteria prescribed in IDOT’s Standard Specifications for Road and Bridge Construction are met.
5.3 RECOMMENDATONS FOR FUTURE WORK
The wet-dry and freeze-thaw durability evaluations of QB and QB blended with recycled coarse aggregates for base and subbase applications studied in this project have shown several potentially successful applications of QB in pavements, especially with the satisfactory field performance trends that were observed for these stabilized base and subbase applications from the previous research project ICT-R27-168. However, certain aspects of this study may require further investigation. The following discussion points summarize the main recommendations for future research:
• There is a likely need to further investigate the effect of QB source on wet-dry and freeze-thaw durability for reassurance. Preliminary results from two QB sources (QB2 and QB3) indicated a significant effect of QB source on durability, despite the results of field evaluation, which indicated no significant differences in surface rut accumulation in test sections constructed with the same two sources in project ICT-R27-168. Given that only few replicate samples were investigated in this durability study and the low field densities of samples extracted from C3S1 with cement-stabilized QB3 material, it is recommended that more samples and more QB sources are tested. Further, it is recommended that the durability study is accompanied with a thorough investigation of the chemical composition of each QB source investigated.

40
• There is a need to further investigate the effect of mix proportions of QB with coarse-recycled aggregates on wet-dry and freeze-thaw durability. This study has investigated the durability of samples with QB mixed with coarse fractions of RAP or RCA at a blending ratio of 70% QB with 30% FRAP or FRCA. Different mix proportions with other blending ratios that may provide better durability need to be studied.
• There is a need to investigate and better evaluate the effect of fly ash source and composition on the fly ash–stabilized mixtures, given that the fly ash used for the laboratory-molded and field-extracted samples might have had different chemical compositions. The durability of fly ash–stabilized layers/samples can vary widely depending on the source properties of fly ash, which was seen in the compared results of the laboratory-molded samples and field-extracted samples. A future research effort on this aspect may help to better isolate such effects due to fly ash source and composition as well as shelf life issues linked to curing duration and will provide a better interpretation of the fly ash–stabilized sample durability results from this study.
• There is a pressing need to study the parent rock type/source and composition of QB fines on durability and field performance. This study has indicated that samples with QB2 having higher percentages of dolomitic fines benefited from higher magnesium oxide content for better long-term wet-dry and freeze-thaw durability. A comprehensive study is needed to investigate the effect of dolomitic aggregate QB composition and properties on the long-term cementation mechanism for the potential advantage of this by-product material, especially in low-volume construction. The study would establish key knowledge on the material behavior of different types and compositions of dolomite aggregates and benefit the state of Illinois by better utilizing large stockpiles of dolomitic quarry by-products available in road construction while achieving low cost, durable, and low-maintenance foundation layers.

41
REFERENCES
Abdullah, J. D., Ali, N., Mohamed, R. N., & Abdullahi, M. M. A. (2018). The effect of quarry dust with cement by-products on properties of concrete. Malaysian Journal of Civil Engineering, 30(3), 415–428. https://doi.org/10.11113/mjce.v30n3.517
Amadi, A. A. (2014). Enhancing durability of quarry fines modified black cotton soil subgrade with cement kiln dust stabilization. Transportation Geotechnics, 1(1), 55–61. https://doi.org/10.1016/j.trgeo.2014.02.002
Chesner, W. H., Collins, R. J., & MacKay, M. (1998). User guidelines for waste and by-product materials in pavement construction (Report No. FHWA-RD-97-148). Washington, DC: FHWA, U.S. Department of Transportation.
Eze-Uzomaka, O. J., & Agbo, D. (2010). Suitability of quarry dust as improvement to cement stabilized-laterite for road bases. Electronic Journal of Geotechnical Engineering, 15, 1053–1066.
Galetakis, M., & Soultana, A. (2016). A review on the utilisation of quarry and ornamental stone industry fine by-products in the construction sector. Construction and Building Materials, 102, 769–781. https://doi.org/10.1016/j.conbuildmat.2015.10.204
Gurbuz, A. (2015). Marble powder to stabilise clayey soils in sub-bases for road construction. Road Materials and Pavement Design, 16(2), 481–492. https://doi.org/10.1080/14680629.2015.1020845
Hudson, W. R., Little, D. N., Razmi, A. M., Anderson, V., & Weissmann, A. J. (1997). An investigation of the status of by-product fines in the United States. University of Texas at Austin, International Center for Aggregates Research.
Ilangovana, R., Mahendrana, N., & Nagamanib, K. (2008). Strength and durability properties of concrete containing quarry rock dust as fine aggregate. ARPN Journal of Engineering and Applied Sciences, 3(5), 20–26.
Illinois Department of Transportation (IDOT). (2016). Standard specifications for road and bridge construction. Springfield, IL: IDOT.
Kalcheff, I., & Machemehl, C., Jr. (1980). Utilization of crushed stone screenings in highway construction. Presented at the 59th Annual Meeting of the Transportation Research Board, Washington, DC.
Koganti, S. P., & Chappidi, H. R. (2012). Effective utilization of quarry dust in flexible pavements as per IRC-37: 2012. ARPN Journal of Engineering and Applied Sciences, 13(5), 1545–1552.
Kumar, D. S., & Hudson, W. (1992). Use of quarry fines for engineering and environmental applications. Special report. Austin, TX: National Stone Association, Center for Transportation Research, The University of Texas–Austin.
Kumavat, H. R., & Patel, V. J. (2014). Factors influencing the strength relationship of concrete cube and standard cylinder. International Journal of Innovative Technology and Exploring Engineering (IJITEE), 3(8), 76–79.
LaHucik, J., Schmidt, S., Tutumluer, E., & Roesler, J. (2016a). Cement-treated bases containing

42
reclaimed asphalt pavement, quarry by-products, and fibers. Transportation Research Record: Journal of the Transportation Research Board, 2580, 10–17. https://doi.org/10.3141/2580-02
LaHucik, J., Schmidt, S., Tutumluer, E., & Roesler, J. (2016b). Characterization of cement treated base course using reclaimed asphalt pavement, aggregate by-products, and macro-synthetic fibers. Proceedings of Geo-Chicago Conference, 523–533. https://doi.org/10.1061/9780784480137.050
Li, B., Zhou, M., Fang, Y., Song, P., & Ke, G. (2011). Self-compacting concrete-filled steel tubes prepared from manufactured sand with a high content of limestone fines. Journal of Wuhan University of Technology-Mater. Sci. Ed., 26(2), 325–328.
Mwumvaneza, V., Hou, W., Tutumluer, E., Al-Qadi, I. L., & Beshears, S. (2015). Characterization and stabilization of quarry byproducts for sustainable pavement applications. Transportation Research Record: Journal of the Transportation Research Board, 2509, 1–9. https://doi.org/10.3141/2509-01
Naik, R., Rudolph, N., Chun, Y., Fethullah, C., & Bruce, W. (2005). Use of fly ash and limestone quarry by-products for developing economical self-compacting concrete. Proceedings of the International Congress on Fly Ash Utilisation, December 4–7.
Nelson, J., Tymkowicz, S., & Callahan, M. (1994). An investigation of emulsion stabilized limestone screenings (Departmental Report No. HR-309). Office of Materials, Highway Division, Iowa Department of Transportation.
Onyejekwe, S., & Ghataora, G. S. (2015). Stabilization of quarry fines using a polymeric additive and portland cement. Journal of Materials in Civil Engineering, 28(1). https://doi.org/10.1061/(ASCE)MT.1943-5533.0001324
Puppala, A., Saride, S., & Williammee, R. (2012). Sustainable reuse of limestone quarry fines and RAP in pavement base/subbase layers. Journal of Materials in Civil Engineering, 24(4), 418–429. https://doi.org/10.1061/(ASCE)MT.1943-5533.0000404
Puppala, A., Saride, S., Sirigiripet, S., Williammee, R., & Dronamraju, V. (2008). Evaluation of cemented quarry fines as a pavement base material. GeoCongress 2008: Geotechnics of Waste Management and Remediation, 312–319. https://doi.org/10.1061/40970(309)39
Qamhia, I., Tutumluer, E., & Ozer, H. (2018). Field performance evaluation of sustainable aggregate byproduct applications (Report No. FHWA-ICT-18-016). Rantoul, IL: Illinois Center for Transportation/Illinois Department of Transportation.
Qamhia, I. I., Tutumluer, E., Ozer, H., Shoup, H., Beshears, S., & Trepanier, J. (2019). Evaluation of chemically stabilized quarry byproduct applications in base and subbase layers through accelerated pavement testing. Transportation Research Record: Journal of the Transportation Research Board, 2673(3), 259–270. https://doi.org/10.1177/0361198118821099
Qamhia, I. (2019). Sustainable pavement applications utilizing quarry by-products and recycled / nontraditional aggregate materials. Doctoral Dissertation, University of Illinois at Urbana-Champaign.
Schankoski, R. A., Pilar, R., Prudêncio, L. R., Jr, & Ferron, R. D. (2017). Evaluation of fresh cement pastes containing quarry by-product powders. Construction and Building Materials, 133, 234–242. https://doi.org/10.1016/j.conbuildmat.2016.12.056

43
Stroup-Gardiner, M., & Wattenberg-Komas, T. (2013). Recycled materials and by-products in highway applications. Volume 4: Mineral and quarry by-products. NCHRP Synthesis of Highway Practice (Project 20-05, Topic 40-01), Transportation Research Board.
Tutumluer, E., Ozer, H., Hou, W., & Mwumvaneza, V. (2015). Sustainable aggregates production: Green applications for aggregate by-products (Report No. FHWA-ICT-15-012). Rantoul, IL: Illinois Center for Transportation and Illinois Department of Transportation.
Townsend, J. M., Jennings, W. C., Haycocks, C., Neall, G. M., III, & Johnson, L. P., III. (1977). A relationship between the ultimate compressive strength of cubes and cylinders for coal specimens. The 18th US Symposium on Rock Mechanics (USRMS), American Rock Mechanics Association, January.
Wood, S. A., & Marek, C. R. (1995). Recovery and utilization of quarry by-products for use in highway construction. International Center for Aggregates Research (ICAR) 3rd Annual Symposium, Vol. 10.
Zhang, Y., Tanttu, L. K., & Borén, M. (2019). Assessment for sustainable use of quarry fines as pavement construction materials: Part II—Stabilization and characterization of quarry fine materials. Materials Journal, 12(15), 2450. https://doi.org/10.3390/ma1215245

44
APPENDIX A: DETAILED WET-DRY DURABILITY TEST RESULTS
This appendix provides detailed results for the wet-dry durability testing. In total, 28 samples (14 laboratory and 14 field samples) were tested for wet-dry durability as per the AASHTO T 135 standard. Detailed results for the soil-cement loss (%) at each of the 12 cycles, and the cumulative brushed loss are provided for each sample. Note that the y-axis scales are different for each sample to better visualize the data. The following appendix consists of two figures and one table:
• Figure A.1 provides a compilation of wet-dry durability results for the seven material combinations for samples molded in the laboratory.
• Figure A.2 provides a compilation of wet-dry durability results for the seven material combinations extracted from the field test sections constructed for ICT-R27-168.
• Table A.1 summarizes the final corrected moisture contents (%) for all laboratory and field wet-dry durability samples.
(a) C2S1_A: QB2 + FRAP + Cement (b) C2S1_B: QB2 + FRAP + Cement
(c) C2S2-S_A: QB2 + FRCA (- ¾ in.) + Cement (d) C2S2-S_B: QB2 + FRCA (- ¾ in.) + Cement
Figure A.1. Compilation of wet-dry durability test results for laboratory-molded samples.

45
(e) C2S2-R_A: QB2 + FRCA + Cement (f) C2S2-R_B: QB2 + FRCA + Cement
(g) C2S3_A: QB2 + FRAP + Fly Ash (h) C2S3_B: QB2 + FRAP + Fly Ash
(i) C2S4_A: QB2 + Cement (j) C2S4_B: QB2 + Cement
Figure A.1 (Cont’d). Compilation of wet-dry durability test results for laboratory-molded samples.

46
(k) C3S1_A: QB3 + Cement (l) C3S1_B: QB3 + Cement
(m) C3S3_A: QB2 + Fly Ash (n) C3S3_B: QB2 + Fly Ash
Figure A.1 (Cont’d). Compilation of wet-dry durability test results for laboratory-molded samples.
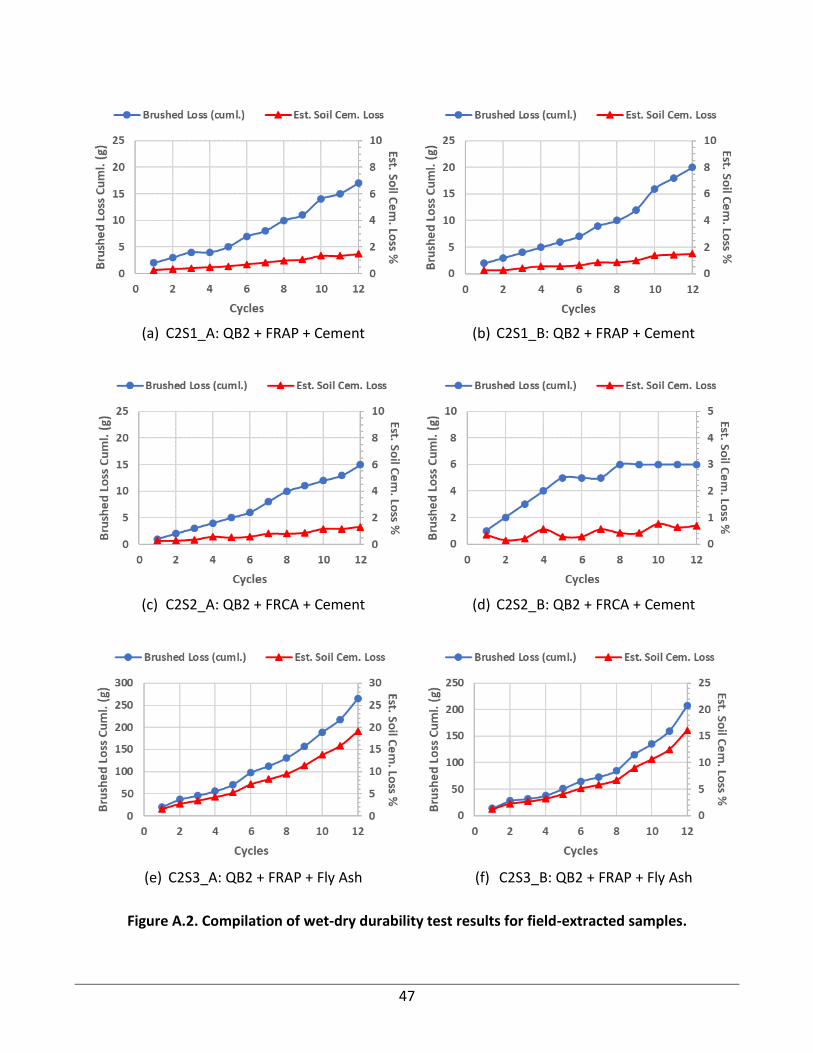
47
(a) C2S1_A: QB2 + FRAP + Cement (b) C2S1_B: QB2 + FRAP + Cement
(c) C2S2_A: QB2 + FRCA + Cement (d) C2S2_B: QB2 + FRCA + Cement
(e) C2S3_A: QB2 + FRAP + Fly Ash (f) C2S3_B: QB2 + FRAP + Fly Ash
Figure A.2. Compilation of wet-dry durability test results for field-extracted samples.

48
(g) C2S4_A: QB2 + Cement (h) C2S4_B: QB2 + Cement
(i) C3S1_A: QB3 + Cement (j) C3S1_B: QB3 + Cement
(k) C3S2_A: QB2 + Cement (l) C3S2_B: QB2 + Cement
Figure A.2 (Cont’d). Compilation of wet-dry durability test results for field-extracted samples.

49
(m) C3S3_A: QB2 + Fly Ash (n) C3S3_B: QB2 + Fly Ash
Figure A.2 (Cont’d). Compilation of wet-dry durability test results for field-extracted samples.
Table A.1. Final Corrected Moisture Content (%) for Wet-Dry Durability Samples
Sample Name Laboratory-Molded Samples Field-Extracted Samples
Specimen A Specimen B Specimen A Specimen B
C2S1 1.15 1.19 0.86 0.87
C2S2_S 1.40 1.66 N/A N/A
C2S2_R (C2S2) * 1.59 1.76 0.98 1.05
C2S3 0.52 0.47 0.16 0.20
C2S4 0.90 0.91 0.84 0.80
C3S1 0.88 0.93 0.83 0.87
C3S2 N/A** N/A** 0.81 0.88
C3S3 0.31 0.36 0.06 0.06
* Laboratory samples for C2S2 are denoted C2S2_R to differentiate from C2S2_S.
** Same material combination as C2S4. Refer to the results for C2S4.

50
APPENDIX B: DETAILED FREEZE-THAW DURABILITY TEST RESULTS
This appendix provides detailed results for the freeze-thaw durability testing. In total, 28 samples (14 laboratory and 14 field samples) were tested for freeze-thaw durability as per the AASHTO T 136 standard. Detailed results for the soil-cement loss (%) at each of the 12 cycles, and the cumulative brushed loss are provided for each sample. Note that the y-axis scales are different for each sample to better visualize the data. The following Appendix consists of two figures and one table:
• Figure B.1 (Cont’d) provides a compilation of freeze-thaw durability results for the seven material combinations for samples molded in the laboratory.
• Figure B.2 provides a compilation of freeze-thaw durability results for the seven material combinations extracted from the field test sections constructed for R27-168.
• Table B.1 summarizes the final corrected moisture contents (%) for all laboratory and field freeze-thaw durability samples.
(a) C2S1_A: QB2 + FRAP + Cement (b) C2S1_B: QB2 + FRAP + Cement
(c) C2S2-S_A: QB2 + FRCA (- ¾ in.) + Cement (d) C2S2-S_B: QB2 + FRCA (- ¾ in.) + Cement
Figure B.1. Compilation of freeze-thaw durability test results for laboratory-molded samples.

51
(e) C2S2-R_A: QB2 + FRCA + Cement (f) C2S2-R_B: QB2 + FRCA + Cement
(g) C2S3_A: QB2 + FRAP + Fly Ash (h) C2S3_B: QB2 + FRAP + Fly Ash
(i) C2S4_A: QB2 + Cement (j) C2S4_B: QB2 + Cement
Figure B.1 (Cont’d). Compilation of freeze-thaw durability test results for laboratory-molded samples.

52
(k) C3S1_A: QB3 + Cement (l) C3S1_B: QB3 + Cement
(m) C3S3_A: QB2 + Fly Ash (n) C3S3_B: QB2 + Fly Ash
Figure B.1 (Cont’d). Compilation of freeze-thaw durability test results for laboratory-molded samples.

53
(a) C2S1_A: QB2 + FRAP + Cement (b) C2S1_B: QB2 + FRAP + Cement
(c) C2S2_A: QB2 + FRCA + Cement (d) C2S2_B: QB2 + FRCA + Cement
(e) C2S3_A: QB2 + FRAP + Fly Ash (f) C2S3_B: QB2 + FRAP + Fly Ash
Figure B.2. Compilation of freeze-thaw durability test results for field-extracted samples.

54
(g) C2S4_A: QB2 + Cement (h) C2S4_B: QB2 + Cement
(i) C3S1_A: QB3 + Cement (j) C3S1_B: QB3 + Cement
(k) C3S2_A: QB2 + Cement (l) C3S2_B: QB2 + Cement
Figure B.2 (Cont’d). Compilation of freeze-thaw durability test results for field-extracted samples.

55
(m) C3S3_A: QB2 + Fly Ash (n) C3S3_B: QB2 + Fly Ash
Figure B.2 (Cont’d). Compilation of freeze-thaw durability test results for field-extracted samples.
Table B.1. Final Corrected Moisture Content (%) for Freeze-Thaw Durability Samples
Sample Name Laboratory-Molded Samples Field-Extracted Samples
Specimen A Specimen B Specimen A Specimen B
C2S1 11.8 11.8 11.6 11.1
C2S2_S 13.6 13.6 N/A N/A
C2S2_R (C2S2) * 13.2 13.2 13.4 9.8
C2S3 8.8 8.8 9.4 9.6
C2S4 11.6 11.6 9.0 9.0
C3S1 11.8 11.4 16.2 15.7
C3S2 N/A** N/A** 7.5 8.0
C3S3 9.3 9.3 9.2 8.8
* Laboratory samples for C2S2 are denoted C2S2_R to differentiate from C2S2_S.
** Same material combination as C2S4. Refer to the results for C2S4.