Embed Size (px)
Citation preview
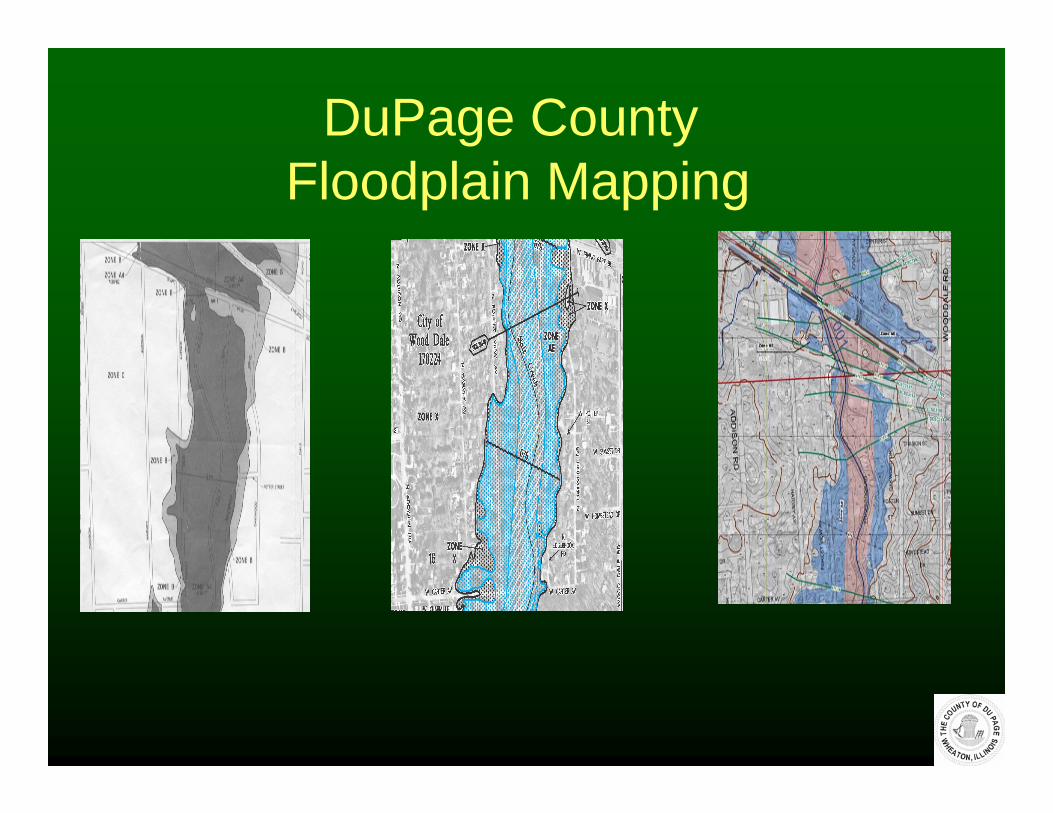
DuPage CountyFloodplain Mapping

General Background
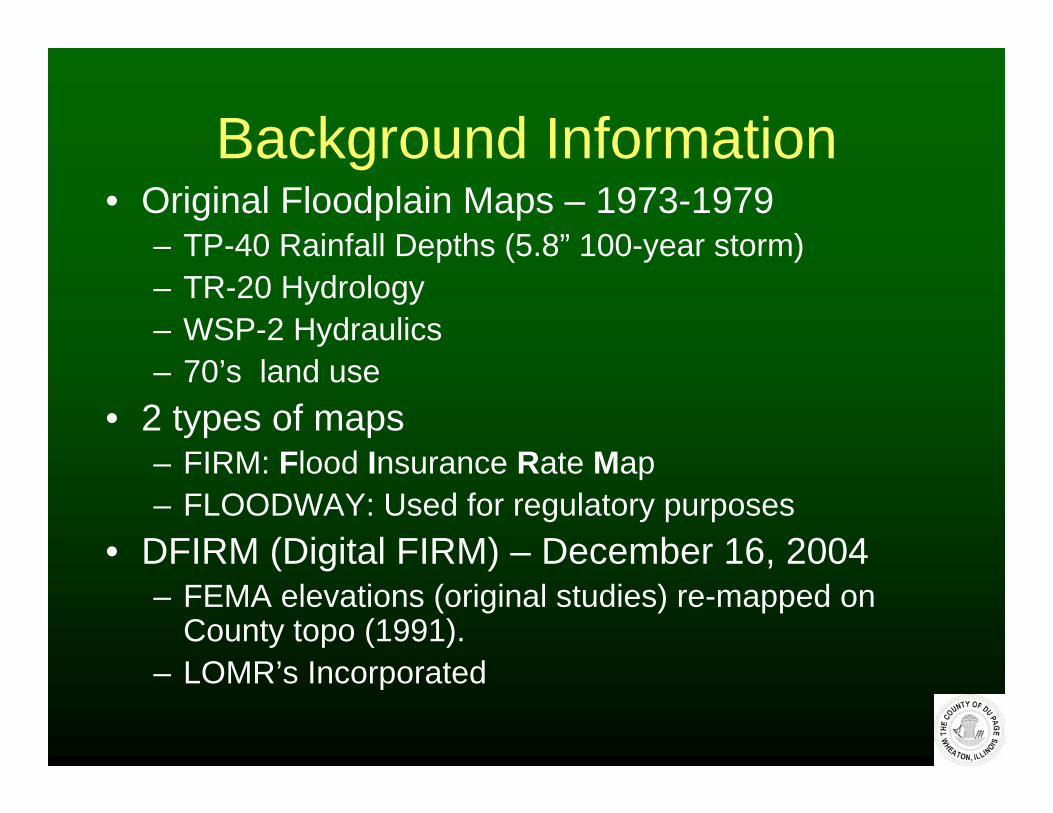
Background Information• Original Floodplain Maps – 1973-1979
– TP-40 Rainfall Depths (5.8” 100-year storm)– TR-20 Hydrology– WSP-2 Hydraulics– 70’s land use
• 2 types of maps– FIRM: Flood Insurance Rate Map– FLOODWAY: Used for regulatory purposes
• DFIRM (Digital FIRM) – December 16, 2004– FEMA elevations (original studies) re-mapped on
County topo (1991).– LOMR’s Incorporated

Background Information Cont’d
• DuPage first County in State to convert to a D-FIRM
• DuPage’s D-FIRM current map in effect for regulatory purposes but not in dual County communities for insurance.
• FEMA currently working with State to produce D-FIRM for Cook, Will and Kane Counties
• FEMA plans to work with State to convert the remainder of State to D-FIRM

Map Revisions

Standard Map Revision• FEMA in the midst of a nation-wide Map
Modernization process• Creating D-FIRM’s and performing
complete watershed restudies• Watershed restudies update to most
current information. For DuPage this would have meant:– Updated topography– Bulletin 70 Rainfall (7.58” 100-yr-storm)– Current land use– HECRAS or similar model

Effects on DuPage County
• Increased Rainfall Produces Increased Runoff*– Salt Creek at North Ave: 8,100 ac-ft– Salt Creek at York Rd: 10,600 ac-ft
*Elmhurst Quarry is Largest Flood Control Facility with 8,300 ac-ft of available storage.

DuPage Map Methodology• Uses historic rainfall data (1949-1993)• HSPF hydrology• FEQ hydraulics• PVSTATS statistical analysis• FEQUTL floodway• GIS plotted floodplain limits• Future land use• Models calibrated to actual stream gage records
and/or high water marks

Benefits of DuPage Method
• Actual vs. hypothetical storms.• Uses future land use so maps will change
less in the future.• Allows for conveyance only floodways.

Salt Creek
A Case Study

Calibration ProcessSalt Creek
• Historical Storms simulated and compared at USGS Gage Locations– Algonquin Road in Rolling Meadows– Busse Woods Dam in Elk Grove Village– St. Charles Road in Elmhurst– Wolf Road in Westchester

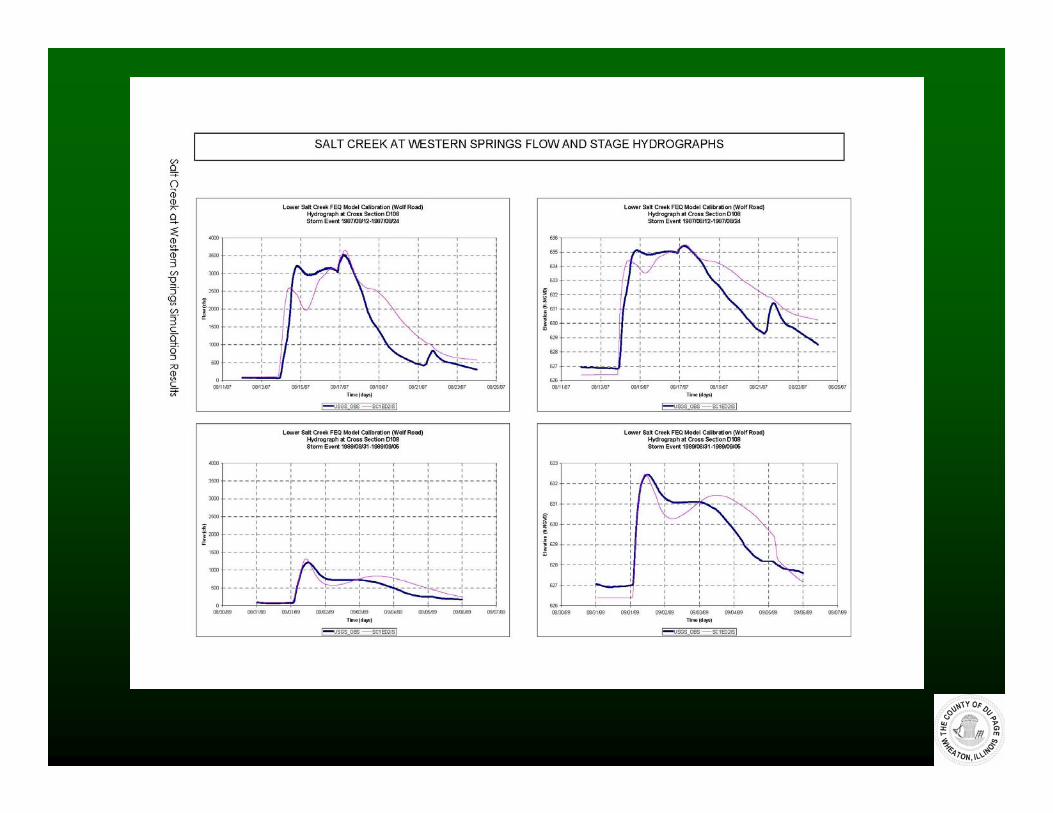

Salt Creek Calibration Findings
• Land use in the Upper Salt Creek Watershed was approximately 20% more impervious than original IDNR computations
• Simulation of individual storm events produced close agreement with USGS gage data

Floodplain Map Results
2.1’646.4644.3York Road1.9’656.0654.1Ginger Creek1.7’658.9657.0Harger Road
-0.6’661.9662.5Roosevelt Road0.7’663.9663.2Sugar Creek
-0.8’667.3668.1St. Charles Road-0.5672.0672.5North Ave-0.2’675.1675.3Lake Street-0.7’679.4680.1Irving Park Road1.8’683.6681.8Thorndale Ave
Location(All at the Upstream Face)
FEMA Elevation
PVSTATS Results
Difference

Floodplain Observations
• Upper Portion of Salt Creek – Floodplain Elevations rise above current mapped levels
• Salt Creek Downstream of Quarry –Floodplain decreases
• Salt Creek Downstream of Sugar Creek –Floodplain increases as you proceed downstream
Floodplain Observations (Cont)
• Tributaries downstream contribute large volumes of floodwaters to Salt Creek– Sugar Creek– Oak Brook Tributary– Ginger Creek– Bronswood Tributary
• More apparent during the August 1972 storm event

August 1972 Event Removed
646.2646.4644.3York Road655.8656.0654.1Ginger Creek658.8658.9657.0Harger Road661.8661.9662.5Roosevelt Road663.8663.9663.2Sugar Creek667.4667.3668.1St. Charles Road672.2672.0672.5North Ave
PVSTATSResults w/o 1972 event
PVSTATSResults w/ 1972 event
FEMA Elevation
Location(All at the Upstream Face)

Additional Floodplain Analysis
• Log-Pearson Type III (LP-III) analysis used rather than the PVSTATS analysis
• LP-III Analysis is used throughout the nation on gauged watersheds to determine the 100-year peak flow rate

PVSTATS and LP-III
646.5646.4644.3York Road655.8656.0654.1Ginger Creek658.8658.9657.0Harger Road661.9661.9662.5Roosevelt Road663.6663.9663.2Sugar Creek667.5667.3668.1St. Charles Road669.9672.0672.5North Ave
LP-III Elevation
PVSTATSElevation
FEMA Elevation
Location(All at the Upstream Face)

Discussion Reminders
• Original Flood Insurance Study based on rainfall standards that are now out of date:– TP-40 Rainfall – 5.8” was the 100-year standard– Current 100-year rainfall standard – 7.58”
• Upper Salt Creek is now 20% more impervious than in the original modeling
• Original FIS assumed uniform rainfall across watershed – newer studies account for variability in the rainfall.
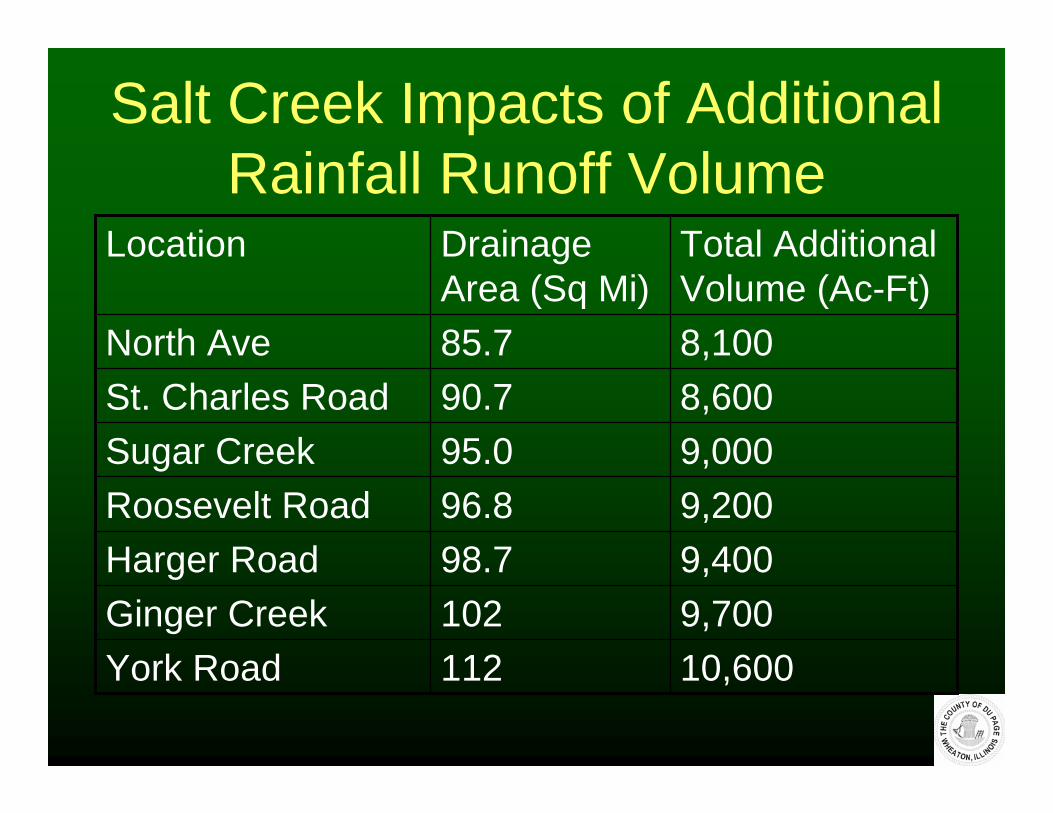
Salt Creek Impacts of Additional Rainfall Runoff Volume
10,600112York Road9,700102Ginger Creek9,40098.7Harger Road9,20096.8Roosevelt Road9,00095.0Sugar Creek8,60090.7St. Charles Road8,10085.7North Ave
Total Additional Volume (Ac-Ft)
Drainage Area (Sq Mi)
Location

Common Sense Floodplain Discussion
• Existing Salt Creek FEMA elevations are to considerably (1’-3’) low. Existing 100-Year FEMA floodplain elevations are exceeded multiple times during the 40-year period of record at Salt Creek Watershed locations.
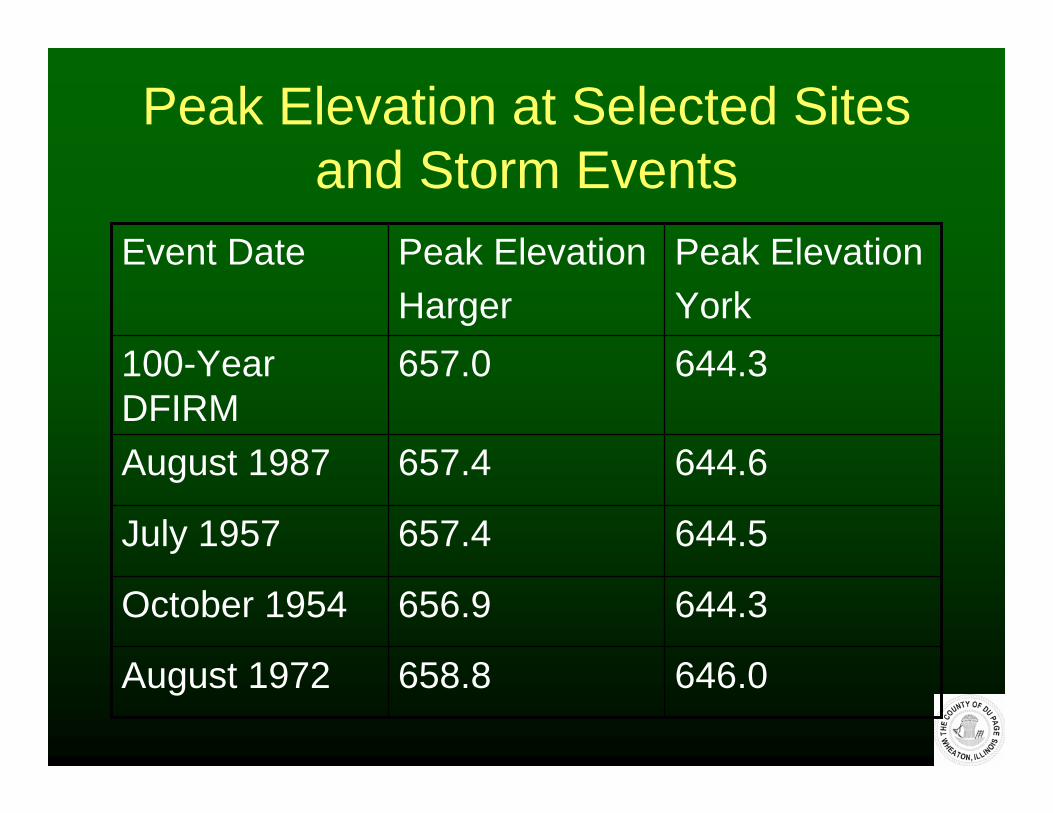
Peak Elevation at Selected Sites and Storm Events
646.0658.8August 1972
644.3656.9October 1954
644.5657.4July 1957
644.6657.4August 1987
644.3657.0100-Year DFIRM
Peak ElevationYork
Peak ElevationHarger
Event Date

Effectiveness of Flood Control Projects
• Simulation completed removing all of the County’s flood control projects– Wood Dale – Itasca Reservoir– Addison Dam and Pump Station– Louis Reservoir– Elmhurst Quarry
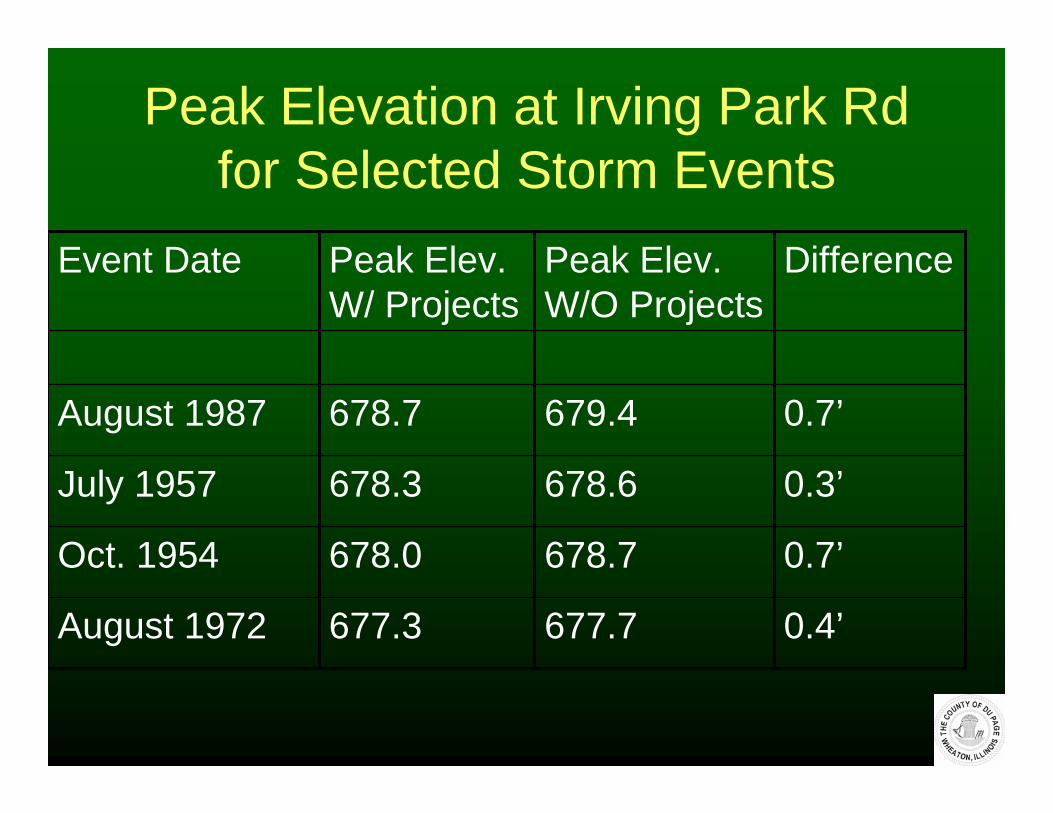
Peak Elevation at Irving Park Rd for Selected Storm Events
August 1972
Oct. 1954
July 1957
August 1987
Event Date
677.3
678.0
678.3
678.7
Peak Elev. W/ Projects
677.7
678.7
678.6
679.4
Peak Elev. W/O Projects
0.4’
0.7’
0.3’
0.7’
Difference

Peak Elevation at Lake St. for Selected Storm Events
August 1972
Oct. 1954
July 1957
August 1987
Event Date
672.4
673.3
673.2
674.2
Peak Elev. W/ Projects
672.8
674.1
673.9
674.8
Peak Elev. W/O Projects
0.4’
0.8’
0.7’
0.6’
Difference
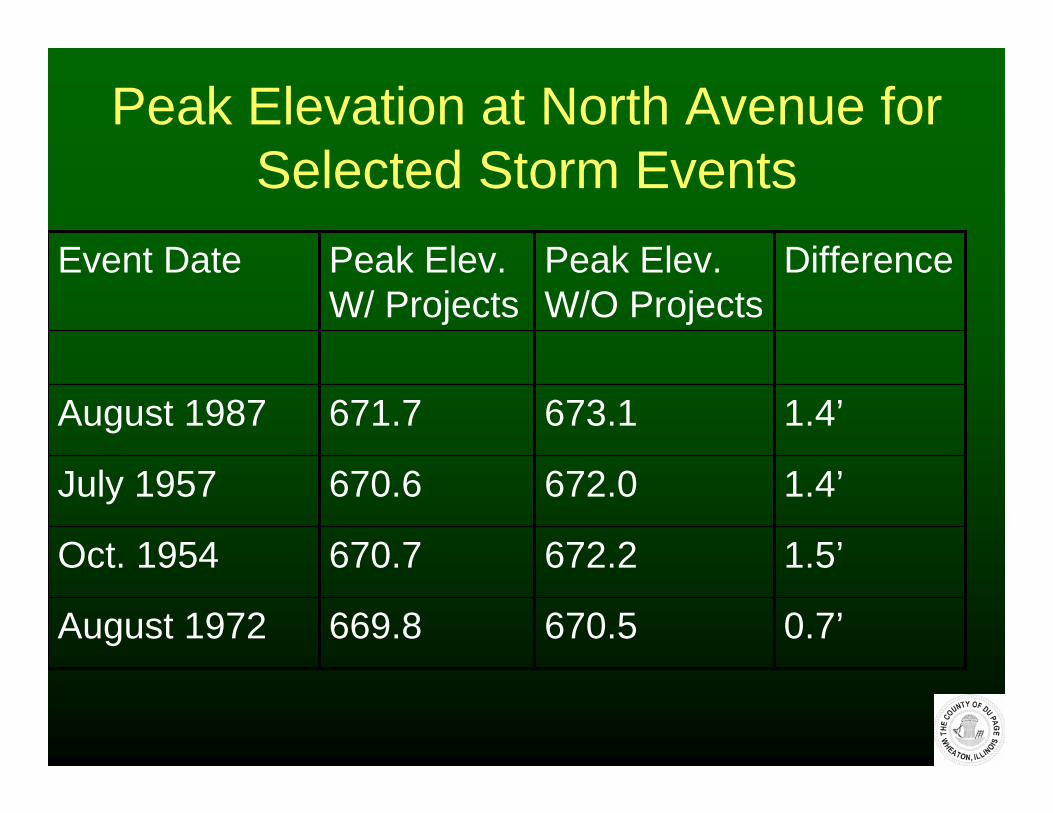
Peak Elevation at North Avenue for Selected Storm Events
August 1972
Oct. 1954
July 1957
August 1987
Event Date
669.8
670.7
670.6
671.7
Peak Elev. W/ Projects
670.5
672.2
672.0
673.1
Peak Elev. W/O Projects
0.7’
1.5’
1.4’
1.4’
Difference

Peak Elevation at Harger Rd for Selected Storm Events
August 1972
Oct. 1954
July 1957
August 1987
Event Date
658.8
656.9
657.4
657.4
Peak Elev. W/ Projects
658.9
657.3
657.4
658.3
Peak Elev. W/O Projects
0.1’
0.4’
0.0’
0.9’
Difference
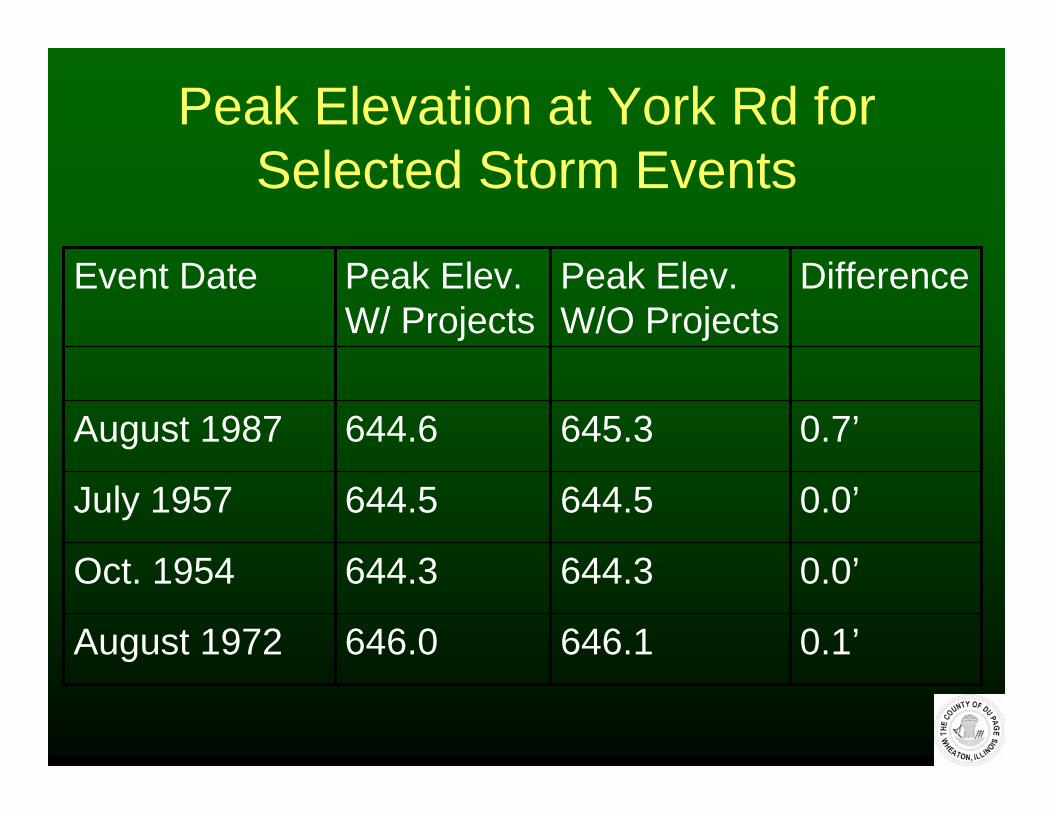
Peak Elevation at York Rd for Selected Storm Events
August 1972
Oct. 1954
July 1957
August 1987
Event Date
646.0
644.3
644.5
644.6
Peak Elev. W/ Projects
646.1
644.3
644.5
645.3
Peak Elev. W/O Projects
0.1’
0.0’
0.0’
0.7’
Difference

Q & A
Please see accompanying Questions and Answers document for additional discussion on the proposed Salt Creek Floodplain Map.