Embed Size (px)
Citation preview
Dungeness Bay and
Dungeness River Watershed
Fecal Coliform Bacteria
Total Maximum Daily Load
Water Quality
Effectiveness Monitoring Report
May 2010
Publication No. 10-03-032

Publication and Contact Information This report is available on the Department of Ecology’s website at www.ecy.wa.gov/biblio/1003032.html. Data for this project are available at Ecology’s Environmental Information Management (EIM) website www.ecy.wa.gov/eim/index.htm. Search User Study ID, CBRO0001.
Activity Tracker Code (Environmental Assessment Program) for this study is 08-016. For more information contact: Scott Collyard Environmental Assessment Program Phone: 360-407-6455 Publications Coordinator Environmental Assessment Program P.O. Box 47600 Olympia, WA 98504-7600 Phone: 360-407-6764 Washington State Department of Ecology - www.ecy.wa.gov/
o Headquarters, Olympia 360-407-6000 o Northwest Regional Office, Bellevue 425-649-7000 o Southwest Regional Office, Olympia 360-407-6300 o Central Regional Office, Yakima 509-575-2490 o Eastern Regional Office, Spokane 509-329-3400
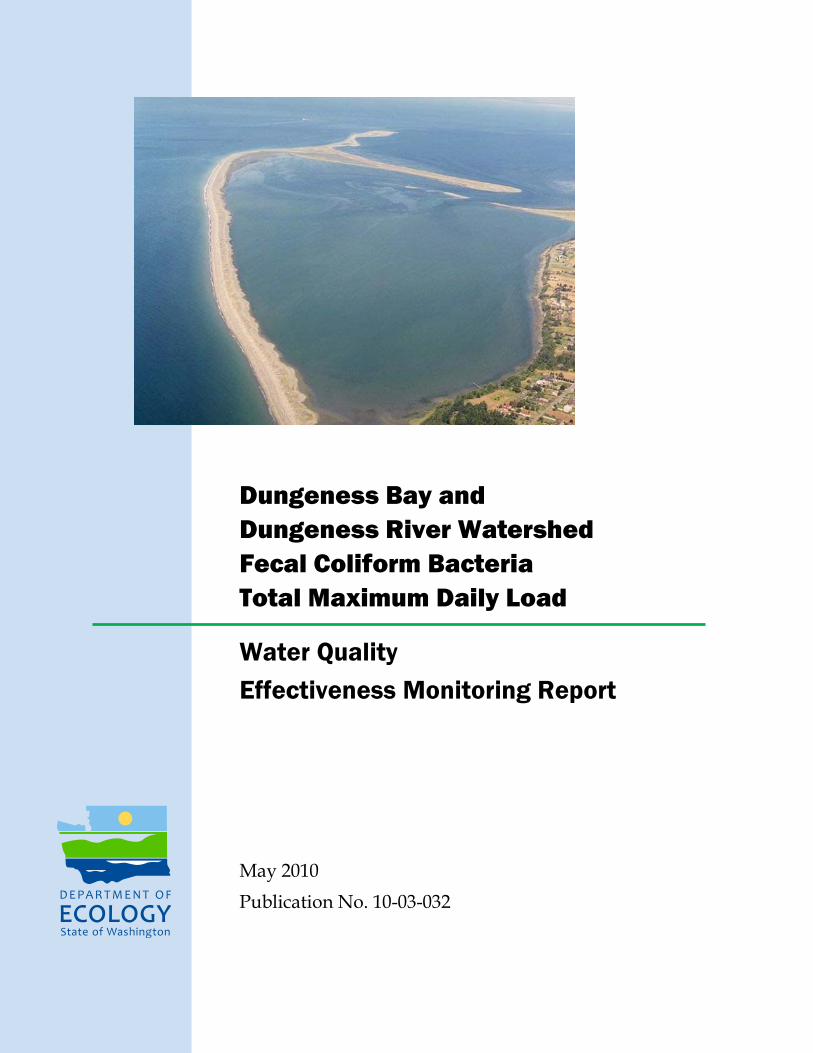
Cover photo: Washington State Department of Ecology, Shoreline Dungeness Bay Arial Photos, 1994.
Any use of product or firm names in this publication is for descriptive purposes only and does not imply endorsement by the author or the Department of Ecology.
To ask about the availability of this document in a format for the visually impaired,
call 360-407-6764. Persons with hearing loss can call 711 for Washington Relay Service.
Persons with a speech disability can call 877-833-6341.

Dungeness Bay and Dungeness River Watershed
Fecal Coliform Bacteria
Total Maximum Daily Load
Water Quality
Effectiveness Monitoring Report
by The Cadmus Group, Inc.
Prepared for the Environmental Assessment Program
Washington State Department of Ecology Olympia, Washington 98504-7710
Waterbody Numbers: WA-18-1010 WA-18-1012 WA-18-1300

Page 2
This page is purposely left blank
Page 3
Table of Contents
Page
List of Figures and Tables....................................................................................................5
Abstract ................................................................................................................................7
Acknowledgements ..............................................................................................................8
What is a Total Maximum Daily Load (TMDL)? ...............................................................9 Federal Clean Water Act requirements ..........................................................................9 TMDL process overview ...............................................................................................9 Elements required in a TMDL .......................................................................................9 Water Quality Assessment / Categories 1-5 ................................................................10
TMDL analyses: Loading capacity ..............................................................................10
Background ........................................................................................................................11 What is effectiveness monitoring? ...............................................................................11 Study area.....................................................................................................................11 Pollutants addressed by this TMDL .............................................................................15 Watershed implementation or restoration activities ....................................................19
Water Quality Standards and Beneficial Uses ...................................................................21 FC bacteria ...................................................................................................................21 Dissolved oxygen .........................................................................................................23 Water quality impairments ...........................................................................................24
Goals and Objectives .........................................................................................................27 Project goals .................................................................................................................27
Study objectives ...........................................................................................................27
Methods..............................................................................................................................28 Field and laboratory .....................................................................................................28 Data analysis ................................................................................................................28
TMDL Summary ................................................................................................................31
Results and Discussion ......................................................................................................33
Dungeness Bay.............................................................................................................33 Dungeness Bay tributaries ...........................................................................................36 Matriotti Creek FC loads .............................................................................................39
Dissolved oxygen in Cassalery, Cooper, and Meadowbrook Creeks ..........................40 Connection between trends and TMDL implementation .............................................40
Comparison of findings with other studies ..................................................................41
National Measures SP-12 and WQ-10 Evaluation.............................................................44
Conclusions ........................................................................................................................45
Recommendations ..............................................................................................................46
References ..........................................................................................................................49
Page 4
Appendices .........................................................................................................................53
Appendix A. Glossary and Acronyms ........................................................................55 Appendix B. Implementation Activities .....................................................................59 Appendix C. Supplementary Tables and Figures .......................................................85
Page 5
List of Figures and Tables
Page
Figures
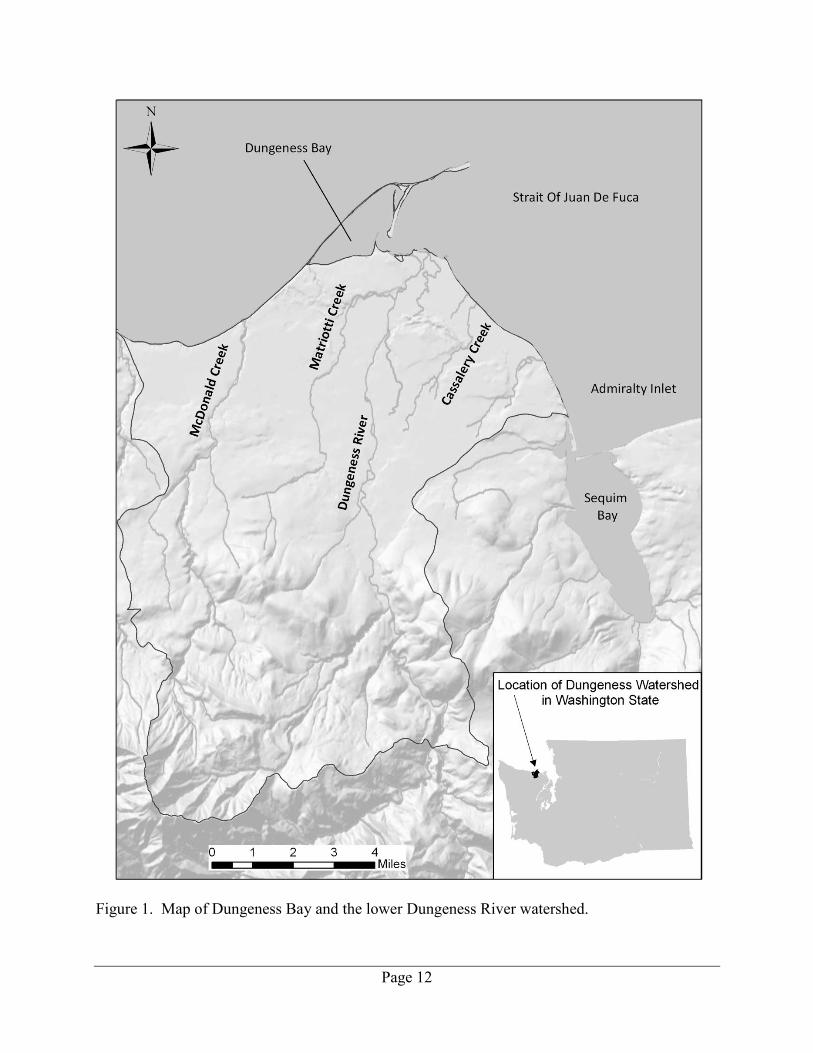
Figure 1. Map of Dungeness Bay and the lower Dungeness River watershed. ................12
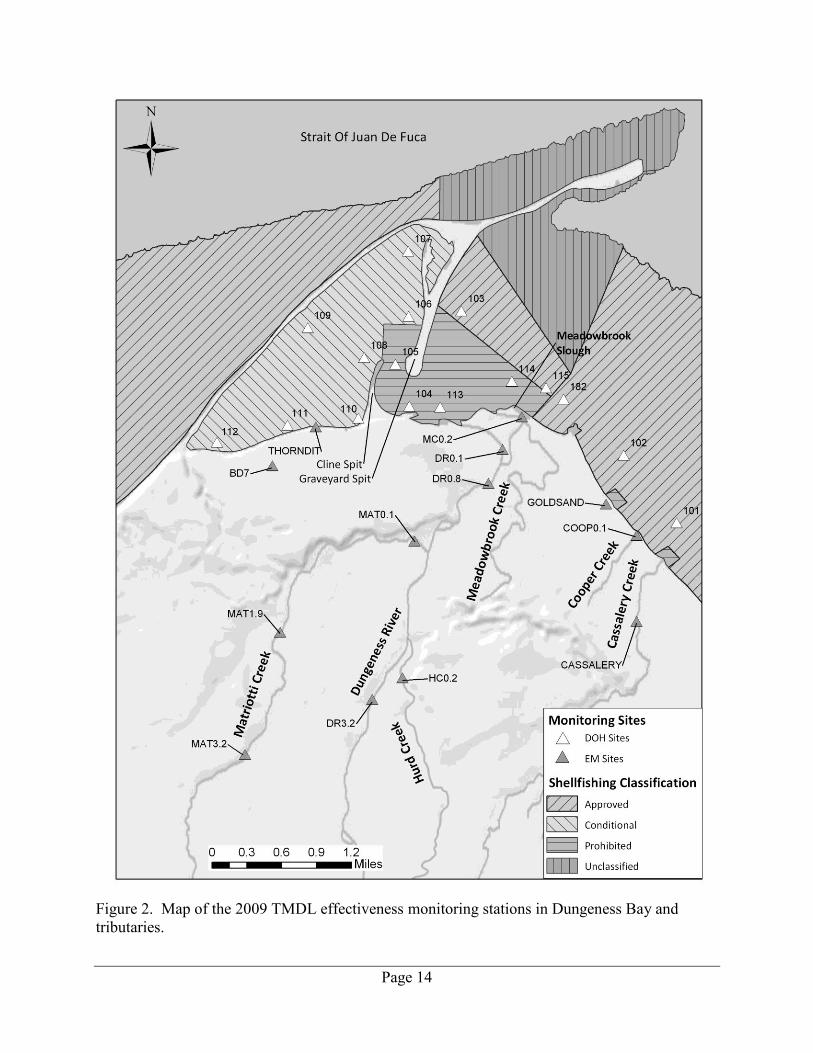
Figure 2. Map of the 2009 TMDL effectiveness monitoring stations in Dungeness Bay and tributaries. ............................................................................................14
Figure 3. Comparison of FC summary statistics from the last 30 samples (2006-2009 for Dungeness stations, 2004-2009 for Jamestown stations) to DOH criteria. .33
Figure 4. Comparison of critical period FC summary statistics from 2005-2009 to DOH criteria. .....................................................................................................34
Figure 5. Trend in geometric mean FC concentrations over time for pooled data from all marine sample stations from 1999-2009. .....................................................35
Figure 6. Comparison of annual FC data in Dungeness Bay tributaries from the 2008-2009 Effectiveness Monitoring Study to Washington State Water Quality Standards. .............................................................................................36
Figure 7. Comparison of annual FC data in Dungeness Bay tributaries from the 2008-2009 Effectiveness Monitoring Study to targets established by the 2004 TMDL Study.............................................................................................37
Figure 8. Trends in geometric mean FC concentrations over time for pooled data from the seven consistently sampled stations from 1999-2009. ........................38
Figure 9. Trends in geometric mean FC concentrations from 1999-2009 for two sites on Matriotti Creek. ............................................................................................39
Figure 10. Dissolved oxygen measurements from 2008-2009 at Cassalery, Cooper, and Meadowbrook Creeks. .............................................................................40
Tables
Table 1. Dungeness River watershed FC data in EIM. .....................................................18
Table 2. Dungeness Bay and Dungeness River watershed TMDL monitoring stations and target limits. ................................................................................................22
Table 3. Study area waterbodies with impairments addressed by this report. ..................24
Table 4. Study area waterbodies with impairments not addressed by this report. ............25
Table 5. FC loads. .............................................................................................................39

Page 6
This page is purposely left blank
Page 7
Abstract
The Washington State Department of Ecology conducted Total Maximum Daily Load (TMDL) studies for the Dungeness River watershed in 2002 and for Dungeness Bay in 2004. These studies found that fecal coliform bacteria (FC) concentrations did not meet water quality standards at several monitoring locations. The studies attributed the pollution to nonpoint sources including failing septic systems, stormwater runoff, and waste from livestock, pets, and wildlife. Restoration activities, including piping of irrigation ditches, pasture management, manure storage, investigation and repair of on-site septic systems, and outreach and education efforts with area residents, have been implemented to reduce FC loading to the bay. The goal of this project is to evaluate the effectiveness of these implementation efforts. The results of this study provide strong evidence that FC concentrations have decreased in Matriotti Creek, and to a lesser degree in the Dungeness River between 1999 and 2009. Despite these improvements, nine out of 13 Dungeness Bay tributary stations (including Cassalery Creek, a new station) did not meet water quality standards and TMDL targets during the 2008-09 effectiveness monitoring study. Cassalery, Cooper, and Meadowbrook Creeks were also found to be in violation of their dissolved oxygen criterion. There is moderately strong evidence that FC concentrations have decreased in Dungeness Bay between 1999 and 2009. All but two of the sampling stations in the bay are meeting annual standards set by the Washington Department State of Health (DOH). However, all the stations in the inner bay are not meeting DOH standards during the November to February period. All stations in the Jamestown harvesting area are meeting DOH standards.
Page 8
Acknowledgements
The Washington State Department of Ecology (Ecology) would like to thank the following people for their contribution to this study:
Laura Blake and Matthew Diebel, Cadmus Group Inc., for performing the data analysis and writing the final report.
The following local landowners who granted Ecology access to the study sampling locations: Shawn and Gerry Hankins, Lloyd Beebe, and Al Moore.
Lori DeLorm, Jamestown S’Klallam Tribe, and Liz Maier, Clallam County, for assistance with project design and data collection.
The Dungeness Clean Water Workgroup members for local knowledge and assistance with updating the Dungeness Clean Water Strategy and Implementation Plan.
The following members of the Dungeness Clean Water Workgroup for review of the project design and final report: Hansi Hals and Shawn Hines, Jamestown S’Klallam Tribe; Joe Holtrop, Clallam Conservation District; Dana Woodruff, Battelle; Liz Maier and Ann Soule, Clallam County Environmental Health Services.
Jill Gable and Jayne Carlin, U.S. Environmental Protection Agency, for additional funding and guidance with the final report.
Washington State Department of Ecology staff: o Chad Brown and Scott Collyard served as effectiveness monitoring project managers.
o Betsy Dickes assisted with data collection and report review.
o Lydia Wagner, TMDL implementation coordinator, provided report review.
o Markus Von Prause, Trevor Swanson, and Becca Conklin assisted with data collection.
o Debby Sargeant provided guidance with the project design and final report.
o George Onwumere reviewed the draft report
o Joan LeTourneau and Cindy Cook formatted and edited the final report.
o Nancy Rosenbower and Nancy Jenson at Manchester Environmental Laboratory provided analytical support.
Page 9
What is a Total Maximum Daily Load (TMDL)?
Federal Clean Water Act requirements The Clean Water Act established a process to identify and clean up polluted waters in the United States. Under the Clean Water Act, every state has its own water quality standards designed to protect, restore, and preserve water quality. Water quality standards consist of designated uses for protection, such as cold water biota and drinking water supply, and criteria, usually numeric criteria, to achieve those uses. Every two years, states are required to prepare a list of waterbodies – lakes, rivers, streams, or marine waters – that do not meet water quality standards. This list is called the 303(d) list or Water Quality Assessment. To develop the list for Washington, the Washington State Department of Ecology (Ecology) compiles its own water quality data along with data submitted by local, state, and federal governments, tribes, industries, and citizen monitoring groups. All data are reviewed to ensure that they were collected using appropriate scientific methods before they are used to develop the 303(d) list.
TMDL process overview The Clean Water Act requires that a TMDL be developed for each of the waterbodies on the 303(d) list. A TMDL identifies how much pollution needs to be reduced or eliminated to achieve attainment with water quality standards. The local community then works with Ecology to develop a strategy to control the pollution and a monitoring plan to assess the effectiveness of the water quality improvement activities.
Elements required in a TMDL The goal of a TMDL is to ensure the impaired water will attain water quality standards. A TMDL includes a written, quantitative assessment of water quality problems and of the pollutant sources that cause the problem. The TMDL determines the amount of a given pollutant that can be discharged to the waterbody and still meet standards (the loading capacity) and allocates that load among the various sources. If the pollutant comes from a discrete (point) source such as a municipal or industrial facility’s discharge pipe, that facility’s share of the loading capacity is called a wasteload allocation. If it comes from a set of diffuse (nonpoint) sources such as general urban, residential, or farm runoff, the cumulative share is called a load allocation. The TMDL must also consider seasonal variations and include a margin of safety that takes into account any lack of knowledge about the causes of the water quality problem or its loading capacity. A reserve capacity for future loads from growth pressures is sometimes included as well. The sum of the wasteload and load allocations, the margin of safety, and any reserve capacity must be equal to or less than the loading capacity.
Page 10
Water Quality Assessment / Categories 1-5 The 303(d) list identifies polluted waters in Washington. The Water Quality Assessment is a list that tells a more complete story about the condition of Washington’s surface waters. This list divides waterbodies into five categories:
Category 1 – Meets tested standards for clean water. Category 2 – Waters of concern. Category 3 – Lack of sufficient data. Category 4 – Polluted waters that do not require a TMDL because the problems are being
solved in one of three ways: o 4a – Has an approved TMDL and it is being implemented. o 4b – Has a pollution control plan in place that should solve the problem. o 4c – Is impaired by a non-pollutant such as low water flow, dams, culverts.
Category 5 – Polluted waters that require a TMDL – the 303(d) list. TMDL analyses: Loading capacity Identification of the contaminant loading capacity for a waterbody is an important step in developing a TMDL. The U.S. Environmental Protection Agency (EPA) defines the loading capacity as “the greatest amount of loading that a waterbody can receive without violating water quality standards” (EPA, 2001). The loading capacity provides a reference for calculating the amount of pollution reduction needed to bring a waterbody into compliance with standards. The portion of the receiving water’s loading capacity assigned to a particular source is a load or wasteload allocation. By definition, a TMDL is the sum of the allocations, which must not exceed the loading capacity.

Page 11
Background
What is effectiveness monitoring? An effectiveness monitoring evaluation determines if the interim restoration targets and water quality standards have been met. This is an essential component of any restoration or implementation activity since it measures to what extent the work performed or recommended has attained the watershed restoration objectives or goals. The benefits of an effectiveness evaluation include:
More efficient allocation of funding. Optimization in planning/decision-making. Watershed recovery status: how much restoration has been achieved and how much more
effort is required? Feedback to help refine restoration treatment design and implementation.
The effectiveness evaluation addresses four fundamental questions with respect to restoration or implementation activity:
1. Is the restoration or implementation work achieving the desired objectives or goals (significant improvement)?
2. How can restoration or implementation techniques be improved?
3. Is the improvement sustainable?
4. How can the cost-effectiveness of the work be improved?
Study area The study area for this effectiveness monitoring evaluation consists of Dungeness Bay and the Dungeness River watershed. Dungeness Bay is located in Clallam County near Sequim, Washington, on the northeast coast of the Olympic Peninsula (Figure 1). The outer edge of Dungeness Bay is defined by Dungeness Spit, extending in a narrow five-and-a-half-mile curve into the Straits of Juan de Fuca. Dungeness Bay is nearly divided by Graveyard Spit (which extends south from Dungeness Spit) and Cline Spit (which extends north from the mainland). A relatively narrow opening between these two spits allows tidal waters to flow between inner Dungeness Bay and outer Dungeness Bay (Streeter and Hempleman, 2004). The bay has traditionally been rich in littleneck clams. Native people have harvested shellfish here throughout tribal memory. In recent times, the bay has been a profitable source of commercially farmed oysters and popular for recreational harvest. Commercial shellfish harvest is a source of jobs and income to the community. Recreational harvest is popular with residents and tourists, and contributes to the image of the bay as a beautiful and pristine area (Streeter and Hempleman, 2004).
Page 12
Figure 1. Map of Dungeness Bay and the lower Dungeness River watershed.
Page 13
Land uses in the lower Dungeness valley include commercial, residential, and agricultural. Sequim has become increasingly urbanized in recent decades, and residential land use is becoming more predominant (Hempleman and Sargeant, 2002). The city of Sequim is on a sewer system while residential and commercial businesses in the rural area use on-site sewer treatment systems. The climate in this region of the Olympic Peninsula is drier because it lies in the rain shadow of the Olympic Mountains. Precipitation varies from 15 inches near Sequim to 80 inches in the headwaters of the Dungeness River. Due to the low rainfall, the lower Dungeness valley contains an extensive irrigation system to support agricultural crops. Tributaries to Dungeness Bay The Dungeness River flows north into the outer Dungeness Bay just east of the opening between Graveyard and Cline Spits (Figure 2). The river is 32 miles long and drains 172,517 acres of land. The upper two-thirds of the watershed are within national forest and national park areas. The river contributes the highest volume of freshwater to the bay. Matriotti and Hurd Creeks are tributaries of the Dungeness River. Matriotti Creek is 9.3 miles long and flows into the Dungeness River on the left bank at river mile (RM) 1.9. Hurd Creek is approximately one mile long and flows into the Dungeness River on the right bank at RM 2.7. In addition to the Dungeness River, other Dungeness Bay tributaries include Meadowbrook Creek, Golden Sands Slough, Cooper Creek, and Cassalery Creek. Meadowbrook Creek flows north into the bay 0.4 miles east of the Dungeness River mouth. Meadowbrook Slough is approximately 0.5 miles long and flows into Meadowbrook Creek just before the creek enters the bay. Golden Sands Slough discharges into outer Dungeness Bay southeast of Meadowbrook Creek. This slough is a series of constructed channels in an estuarine wetland area. Water in the slough tends to be saline and stagnant (Sargeant, 2002). Cooper Creek discharges into Dungeness Bay just southeast of Golden Sands Slough. The creek is fed by wetlands, and the upland area is undeveloped. The lower portion of the stream channel has been straightened, and the mouth is controlled by a tide gate. Cassalery Creek is approximately 4.2 miles long and discharges to Dungeness Bay southeast of Cooper Creek. Prior to implementation of the TMDL cleanup plan, seven irrigation ditches drained to inner Dungeness Bay west of Cline Spit. These ditches have since been fully or partially piped, and irrigation discharge to Dungeness Bay is restricted. Three irrigation tailwater discharges to Matriotti Creek and two to Mudd Creek were eliminated shortly after the initial TMDL FC data collection. One other tailwater ditch to Lotzgesell Creek was eliminated in 2008. All six of these tailwater ditches were piped mainly due to the high levels of FC they delivered to the streams (Dougherty, 2008). Another ditch that was a tributary to the Dungeness River (left bank at RM 1.0) has been piped and capped. This ditch drains to the river only on rare occasions when the pipeline needs to be flushed (Holtrop, 2008).
Page 14
Figure 2. Map of the 2009 TMDL effectiveness monitoring stations in Dungeness Bay and tributaries.
Page 15
Most of the ditches still convey stormwater from county roads, but irrigation water is conveyed through buried pipelines that are capped on the ends and thus no longer discharge tailwater. Only one irrigation ditch located near the base of Dungeness Spit remains open (Station BD7). The road-side ditches will continue to act as stormwater conveyance and may be used for occasional irrigation discharge under the control of the Cline Irrigation District to flush out the pipelines (Dougherty, 2008). See Appendix B for more information on ditch-related restoration efforts.
Pollutants addressed by this TMDL Initial impairment determination Concerns about bacterial contamination in Dungeness Bay were first noted in 1993. This was based on the presence of livestock in or near the water and the discharge of irrigation return flows from ditches into the bay. Fecal coliform (FC) concentrations in Matriotti Creek, a tributary to Dungeness River, first did not meet (exceeded) water quality standards in 1991. Matriotti Creek was placed on Washington’s 303(d) list of impaired waters in 1996 (Ecology, 2008). Dungeness Bay continued to meet water quality standards through 1996. In 1997, the Washington State Department of Health (DOH) reported increasing levels of FC bacteria in Dungeness Bay near the mouth of the Dungeness River (DOH, 1998). Bacteria levels continued to increase in later monitoring activities with higher levels of bacteria occurring in inner Dungeness Bay. As a result, DOH closed 300 acres in 2000 near the mouth of the Dungeness River to shellfish harvest: sites 104, 105, and 113 (Figure 2). In 2001, 100 more acres were added to the closure area in the vicinity of site 108. In 2003, DOH changed the classification of inner Dungeness Bay to "conditionally approved" for shellfish harvest from February through October with closure during November through January (Sargeant, 2004a). The three sites near the mouth remain closed to shellfish harvest year round, and an additional site (114) was added to the year-round closure. Total Maximum Daily Load (TMDL) studies TMDL studies were conducted for both the lower Dungeness River watershed (Sargeant, 2002) and Dungeness Bay (Sargeant, 2004b). The main objective for both studies was to recommend sufficient targets and load reductions for FC bacteria. This was done by estimating pollutant loads and concentrations for tributaries to the bay, modeling an acceptable loading capacity, and recommending load allocations. The load reductions needed in upstream tributaries to meet the marine FC criterion at the Dungeness River are more stringent than the criteria in the following waterbodies: Dungeness River (mouth to RM 0.3), Matriotti Creek, Hurd Creek, Meadowbrook Creek, Meadowbrook Slough, Golden Sands Slough, and Cooper Creek. There are no permitted point source discharges in the study area. The TMDL studies attributed FC pollution to nonpoint sources, including on-site septic systems, pet and livestock waste, stormwater runoff, and wildlife. The Dungeness River and Matriotti Creek Fecal Coliform Bacteria Total Maximum Daily Load
Page 16
Study (Sargeant, 2002) measured FC concentrations in several freshwater tributaries to Dungeness Bay from 1999-2000. The purpose of the study was to determine the freshwater sources contributing high FC levels to the bay. Elevated FC levels were found in several freshwater tributaries flowing into the bay (Sargeant, 2002). The study area included the lower Dungeness River, Hurd Creek, Matriotti Creek, Meadowbrook Creek, and Meadowbrook Slough. The results of the study set target reductions for FC concentrations in these and other tributaries to the bay. Rensel Associates conducted bacteria sampling in Dungeness Bay and ditches discharging into Dungeness Bay from October 2001 to 2002. A circulation and bathymetry study was also conducted and resulted in a final technical report in April 2003 (Rensel, 2003). The Rensel study was summarized and used as the basis for the Dungeness Bay Fecal Coliform Bacteria Total
Maximum Daily Load Study (Sargeant, 2004a). The TMDL addressed FC bacteria in inner and outer Dungeness Bay, irrigation ditches to the inner Dungeness Bay, and the Dungeness River. The study found that the critical period for inner Dungeness Bay is November through February, and the critical period for the outer Dungeness Bay near the mouth of Dungeness River is March through July. Target reductions for FC concentrations were set for the Dungeness River and irrigation ditches discharging to inner Dungeness Bay. Post-TMDL data collection and analysis DOH monitors 13 marine sampling sites in the inner and outer Dungeness Bay (Figure 2). A recent analysis of DOH data found evidence of a reduction in FC pollution from 2003-2007 (DOH, 2008a). This trend in pollutant reduction was found in 12 of 13 sites in the Dungeness shellfish growing area. Site 111 was the only site that did not show a significant reduction in FC concentration. Although the general trend for all sites indicates a significant decline in marine FC concentrations since 2005, the 90th percentile criterion is still exceeded at some sites. At the request of the Jamestown S’Klallam Tribe in 2008, DOH reclassified 725 acres of previously unclassified intertidal waters for commercial shellfish harvest. The reclassified Jamestown growing area is located southeast of the Dungeness River estuary along the shoreline and includes the DOH sampling sites 182, 102, 101, 100, and 99 (Figure 2). In December 2008, DOH approved this area for commercial shellfish harvest with the exception of two areas near the mouths of Golden Sands Slough and Cassalery Creek (DOH, 2008b). DOH shoreline surveys conducted in 2007 and 2008 found elevated FC levels in both waterbodies. Further evaluation in Golden Sands Slough found problems with on-site septic system and direct-sewage discharge to the slough. As a result, DOH prohibited commercial shellfish harvest at a 140-meter radius and 121-meter radius around the mouths of Golden Sands Slough and Cassalery Creek, respectively. Clallam County and the Jamestown S’Klallam Tribe continued FC sampling at many of the freshwater TMDL target sites from 2001 to 2004. These data, and data collected by Ecology’s ambient monitoring program, were compared to the initial TMDL FC data collected in 1999 and 2000. The results of this analysis were presented in the Dungeness River and Matriotti Creek
Post-Total Maximum Daily Load Data Review (Sargeant, 2004b).
Page 17
The purpose of the 2004 post-TMDL analysis was to determine whether FC bacteria levels were improving in the tributaries to the bay and if the cleanup actions implemented had been effective. The analysis found significant improvement in some areas and seasons. The 2001- 2004 data showed that further reductions are necessary even though the trend during certain critical seasons was showing a decrease in FC concentrations. The Matriotti Creek sites showed the greatest decline and may have contributed to a slight decline in FC concentrations in the Dungeness River. Meadowbrook Creek showed a slight increase in FC concentrations (Sargeant, 2004a).
Further FC data collection in the Dungeness River watershed Clallam County received a Centennial Clean Water Fund grant from Ecology in 2005. The Jamestown S’Klallam Tribe received an EPA Targeted Watershed Grant (TWG) in 2005. Portions of both grant funds were allotted to perform FC monitoring in the Dungeness watershed (Streeter, 2005). Clallam County and the Tribe combined efforts to monitor 58 sites in the Dungeness watershed for FC. Some of these sites were selected to fill gaps in ambient water quality information. Many of the TMDL study sites were also monitored to continue evaluating the effectiveness of TMDL implementation. Twenty-two of these sites were sampled monthly from September 2005 to August 2008. Irrigation ditches included in the Dungeness Bay TMDL study were also sampled when water was flowing at the site (DeLorm, 2008). Seven of 12 TMDL target sites were monitored consistently between 1999 and 2009. An analysis of trends in monthly FC samples at these sites is included in this report. DOH continues to conduct monthly sampling in Dungeness Bay to monitor FC pollution in shellfish growing areas as part of the National Shellfish Sanitation Program (DOH, 2008a). Thirteen DOH sites in the inner and outer Dungeness Bay area are sampled monthly (Figure 2). Analyses of these data are used in this report to determine whether marine surface water quality standards are being met annually; during wet and dry seasons; and to evaluate FC concentration trends since the Dungeness Bay TMDL study. DOH performed a shoreline survey of the Jamestown shellfish growing area which is located along the shore, southeast of the Dungeness Bay growing area (DOH, 2008b). The Jamestown shellfish growing area includes six DOH sampling sites (Figure 2). DOH sampled four tributaries for FC as part of this survey, including three TMDL target sites: Meadowbrook Creek, Golden Sands Slough, and Cooper Creek. Cassalery Creek was also sampled during this survey. FC data collected in the Dungeness River watershed can be found in Ecology’s Environmental Information Management (EIM) system (www.ecy.wa.gov/eim/). Table 1 includes a summary of the FC data found in EIM for this watershed, including the studies discussed in this plan. DOH data can be found in their annual reports (DOH, 2007).
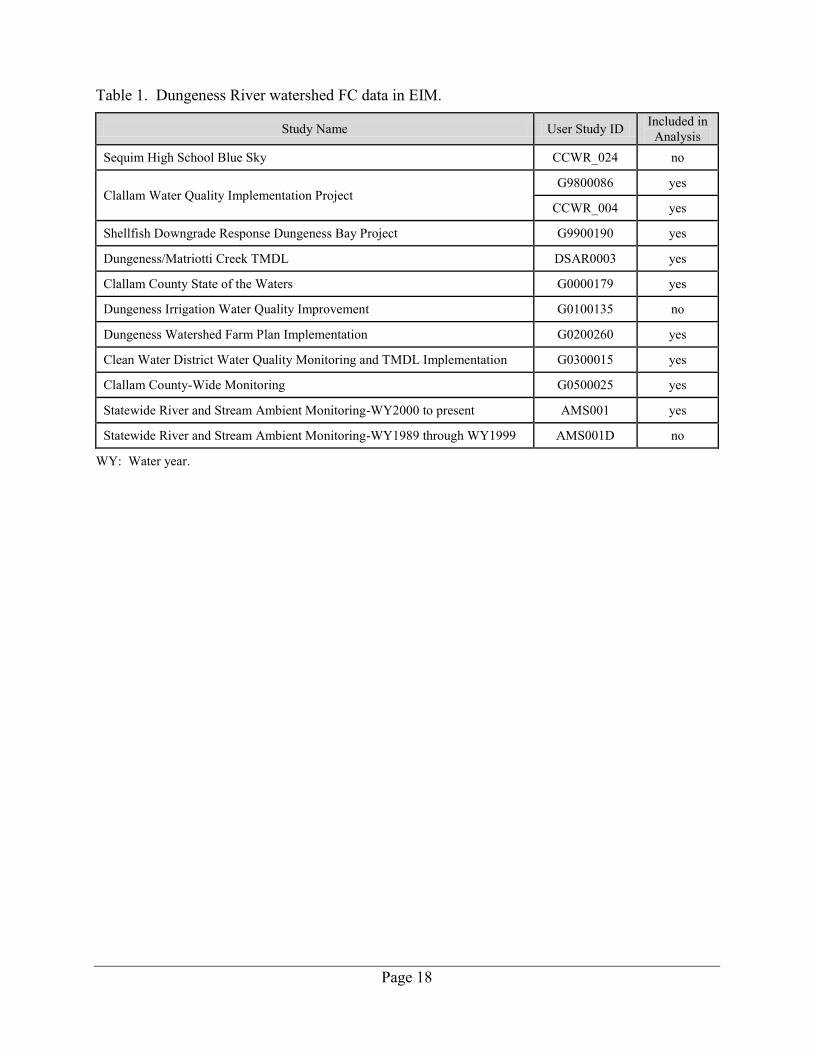
Page 18
Table 1. Dungeness River watershed FC data in EIM.
Study Name User Study ID Included in Analysis
Sequim High School Blue Sky CCWR_024 no
Clallam Water Quality Implementation Project G9800086 yes
CCWR_004 yes
Shellfish Downgrade Response Dungeness Bay Project G9900190 yes
Dungeness/Matriotti Creek TMDL DSAR0003 yes
Clallam County State of the Waters G0000179 yes
Dungeness Irrigation Water Quality Improvement G0100135 no
Dungeness Watershed Farm Plan Implementation G0200260 yes
Clean Water District Water Quality Monitoring and TMDL Implementation G0300015 yes
Clallam County-Wide Monitoring G0500025 yes
Statewide River and Stream Ambient Monitoring-WY2000 to present AMS001 yes
Statewide River and Stream Ambient Monitoring-WY1989 through WY1999 AMS001D no
WY: Water year.

Page 19
Watershed implementation or restoration activities Dungeness Bay and lower Dungeness River watershed cleanup implementation
Ecology prepared two reports:
1. Water Cleanup Plan for Bacteria in the Lower Dungeness Watershed Total Maximum Daily
Load (TMDL) Submittal Report (Hempleman and Sargeant, 2002).
2. Water Cleanup plan for Bacteria in Dungeness Bay TMDL Submittal Report (Hempleman and Sargeant, 2004).
These reports outlined implementation strategies and cleanup actions needed to meet FC targets and load reductions described in the Dungeness TMDL studies. The reports also outline further research and monitoring to assist the adaptive management of cleanup actions. Both TMDL reports were submitted to EPA and approved. The Dungeness Clean Water Workgroup is comprised of citizens and agency representatives who are involved in water quality issues in the area. Ecology staff worked with this organization to develop:
1. Clean Water Strategy for Addressing Bacteria Pollution in Dungeness Bay and Watershed.
2. Water Cleanup Implementation Plan (Streeter and Hempleman, 2004).
These two documents summarized the information provided in the TMDL submittal reports. The implementation plan also described activities recommended to help reduce bacteria levels, the responsibility and authority of the public entities, funding sources and needs, and a proposed cleanup schedule. The Dungeness Clean Water Workgroup meets quarterly and continues to monitor the progress of cleanup activities in the watershed. The workgroup periodically reviews the status of past, ongoing, and planned implementation projects in the Dungeness watershed. Progress on TMDL implementation actions through 2009 is presented in Appendix B. For each action, the objective, priority, status, lead agency, cost, and funding source are noted.

Page 20
This page is purposely left blank

Page 21
Water Quality Standards and Beneficial Uses
FC bacteria Bacteria criteria are set to protect people who work and play in and on the water from waterborne illnesses. In Washington, Ecology’s surface water quality standards use FC as an indicator of bacterial contamination. FC in water indicates the presence of waste from humans and other warm-blooded animals. Waste from warm-blooded animals is more likely to contain pathogens that will cause illness in humans than waste from cold-blooded animals. Animals managed by humans are of particular risk because they are exposed to both human- and animal-derived pathogens. FC criteria are set at levels that are shown to cause low rates of serious intestinal illness (gastroenteritis) in people. Once the concentration of FC in the water reaches the numeric criterion, the state does not allow human activities that will increase the concentration above that criterion. If the criterion is exceeded, the state requires that human activities are conducted in a manner that will bring bacterial concentrations back into compliance with the standards. Because the relative effects of bacteria from human and animal sources are not well understood, no human sources are allowed when natural levels of bacteria from wildlife exceed the criteria. Fresh waters Primary Contact criteria are intended for waters where a person would have direct contact with water to the point of complete submergence including, but not limited to, skin-diving, swimming, and waterskiing. Primary Contact use is designated to any waters where human exposure is likely to include exposure of the eyes, ears, nose, and throat. “Fecal coliform organism levels must not exceed a geometric mean value of 100 colonies/100 mL, with not more than 10% of all samples (or any single sample when less than ten sample points exist) obtained for calculating the geometric mean value exceeding 200/colonies mL” [WAC 173-201A-200(2)(b)] (Ecology, 2006). The Primary Contact criteria apply to seven of the freshwater stations evaluated in this study (Table 2). Extraordinary Primary Contact criteria are intended for waters capable of providing extraordinary protection against waterborne disease or that serve as tributaries to extraordinary quality shellfish harvesting areas. To protect these uses, “Fecal coliform organism levels must not exceed a geometric mean value of 50 colonies/100 mL, with not more than 10% of all samples (or any single sample when less than ten sample points exist) obtained for calculating the geometric mean value exceeding 100/colonies mL” [WAC 173-201A-200(2)(b)] (Ecology, 2006). The Extraordinary Primary Contact criteria apply to six of the freshwater stations evaluated in this study (Table 2).
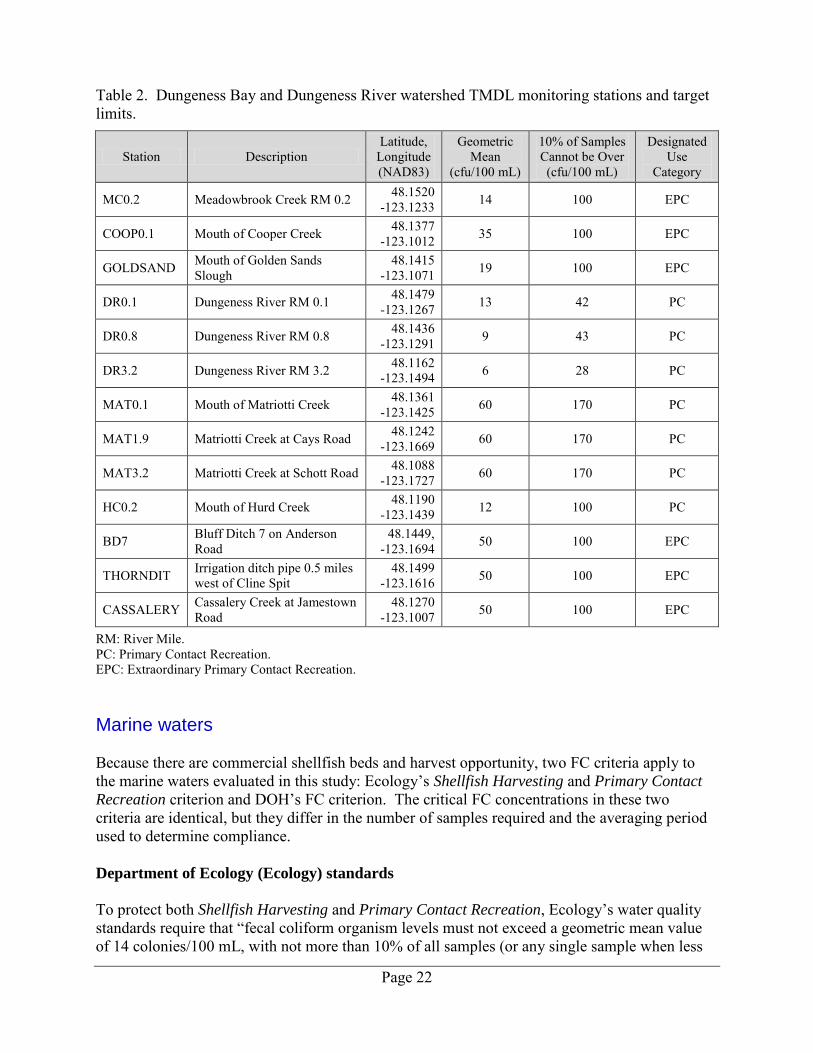
Page 22
Table 2. Dungeness Bay and Dungeness River watershed TMDL monitoring stations and target limits.
Station Description Latitude,
Longitude (NAD83)
Geometric Mean
(cfu/100 mL)
10% of Samples Cannot be Over (cfu/100 mL)
Designated Use
Category
MC0.2 Meadowbrook Creek RM 0.2 48.1520 -123.1233 14 100 EPC
COOP0.1 Mouth of Cooper Creek 48.1377 -123.1012 35 100 EPC
GOLDSAND Mouth of Golden Sands Slough
48.1415 -123.1071 19 100 EPC
DR0.1 Dungeness River RM 0.1 48.1479 -123.1267 13 42 PC
DR0.8 Dungeness River RM 0.8 48.1436 -123.1291 9 43 PC
DR3.2 Dungeness River RM 3.2 48.1162 -123.1494 6 28 PC
MAT0.1 Mouth of Matriotti Creek 48.1361 -123.1425 60 170 PC
MAT1.9 Matriotti Creek at Cays Road 48.1242 -123.1669 60 170 PC
MAT3.2 Matriotti Creek at Schott Road 48.1088 -123.1727 60 170 PC
HC0.2 Mouth of Hurd Creek 48.1190 -123.1439 12 100 PC
BD7 Bluff Ditch 7 on Anderson Road
48.1449, -123.1694 50 100 EPC
THORNDIT Irrigation ditch pipe 0.5 miles west of Cline Spit
48.1499 -123.1616 50 100 EPC
CASSALERY Cassalery Creek at Jamestown Road
48.1270 -123.1007 50 100 EPC
RM: River Mile. PC: Primary Contact Recreation. EPC: Extraordinary Primary Contact Recreation. Marine waters Because there are commercial shellfish beds and harvest opportunity, two FC criteria apply to the marine waters evaluated in this study: Ecology’s Shellfish Harvesting and Primary Contact
Recreation criterion and DOH’s FC criterion. The critical FC concentrations in these two criteria are identical, but they differ in the number of samples required and the averaging period used to determine compliance. Department of Ecology (Ecology) standards
To protect both Shellfish Harvesting and Primary Contact Recreation, Ecology’s water quality standards require that “fecal coliform organism levels must not exceed a geometric mean value of 14 colonies/100 mL, with not more than 10% of all samples (or any single sample when less
Page 23
than ten sample points exist) obtained for calculating the geometric mean value exceeding 43 colonies/100 mL” [WAC 173-201A-210(3)(b)] (Ecology, 2006). When averaging bacteria sample data for comparison to the geometric mean criterion, it is preferable to average by season and to include five or more data collection events within each period. Averaging of data collected beyond a 30-day period, or beyond a specific discharge event under investigation, is not permitted when such averaging would skew the data set so as to mask noncompliance periods. The period of averaging should not exceed 12 months and should have sample collection dates well distributed throughout the reporting period. Department of Health (DOH) standards
The DOH Shellfish Protection Program, under the authority of RCW 43.70.185, monitors marine water quality for commercial shellfish harvesting. DOH classifies shellfish growing areas based on their sanitary conditions under the direction of the U.S. Food and Drug Administration (FDA). DOH classification methods are derived from the National Shellfish Sanitation Program (NSSP) Guide for the Control of Molluscan Shellfish (DOH, 2007). The bacteriological quality of marine water samples collected from an approved growing area must satisfy both parts of the following standard.
The concentration of FC bacteria, the indicator organisms, cannot exceed a geometric mean of 14 organisms per 100 milliliters (mL).
The estimated 90th percentile cannot exceed 43 organisms per 100 mL if sampling under the systematic random scheme.
A minimum of 30 samples, taken over a period of up to five years, is used for these calculations. When calculating the standards for Conditionally Approved growing areas, DOH removes data collected under certain conditions such as storm events.
Dissolved oxygen The health of fish and other aquatic species depends on maintaining an adequate supply of oxygen dissolved in the water. Oxygen levels affect growth rates, swimming ability, susceptibility to disease, and the relative ability to endure other environmental stressors and pollutants. While direct mortality due to inadequate oxygen can occur, Ecology designed the criteria to maintain conditions that support healthy populations of fish and other aquatic life. Oxygen levels can fluctuate over the day and night in response to changes in climatic conditions as well as the respiratory requirements of aquatic plants and algae. Since the health of aquatic species is tied predominantly to the pattern of daily minimum oxygen concentrations, the criterion is based on the lowest one-day minimum oxygen concentrations that occur in a waterbody. In the Washington State surface water quality standards, freshwater aquatic life use categories are described using key species (salmonids versus warm-water) and life-stage conditions (spawning versus rearing). Minimum concentrations of dissolved oxygen are used as criteria to
Page 24
protect different categories of aquatic communities [WAC 173-201A-200]. (Ecology, 2006) For the Dungeness watershed, the following designated aquatic life use(s) and criterion are to be protected in freshwaters: “Core summer salmonids habitat” where the lowest one-day minimum oxygen level must not fall below 9.5 mg/L more than once every 10 years on average.
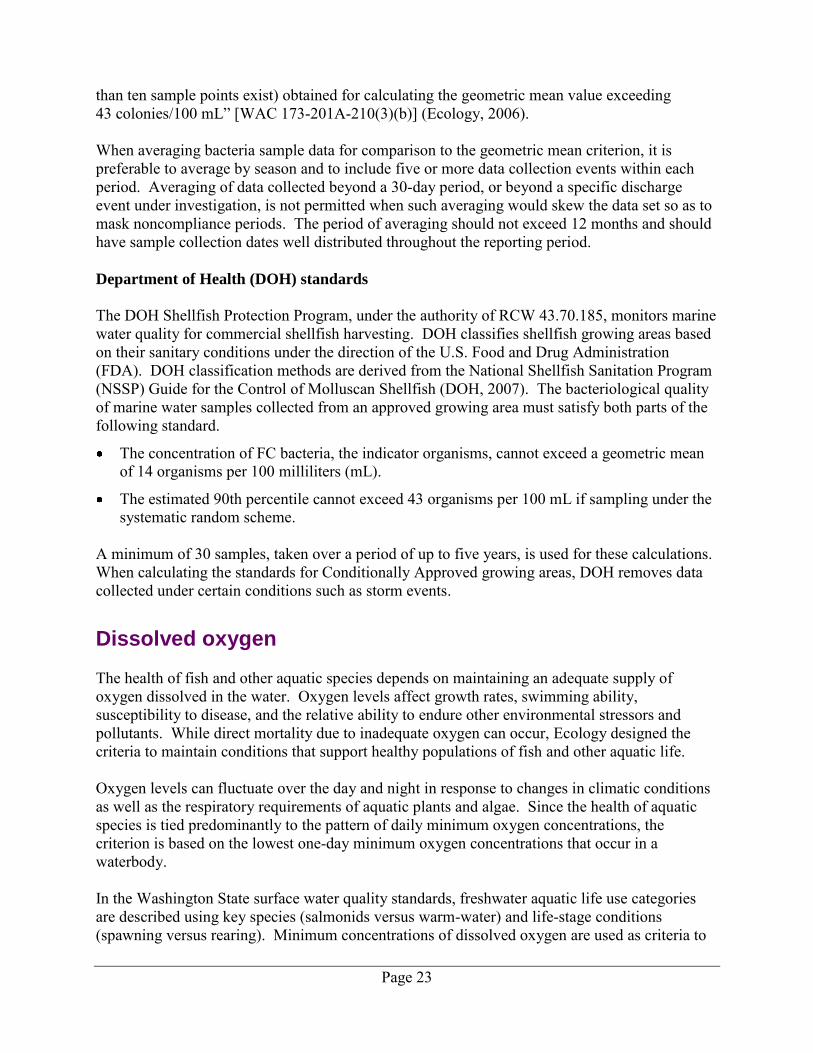
Water quality impairments Water quality impairments are documented in Washington’s Water Quality Assessment (WQA) Mapping Tool. (See www.ecy.wa.gov/programs/wq/303d/index.html for the most recent WQA information). This report addresses FC and dissolved oxygen impairments (Table 3) in three subwatersheds defined by the United States Geological Survey (USGS) Hydrologic Unit Code (HUC). These listings are based on Washington’s 2008 WQA approved by EPA.
Lower Dungeness River (HUC 171100200307)
Cassalery Creek-Frontal Strait of Juan De Fuca (HUC 171100200204)
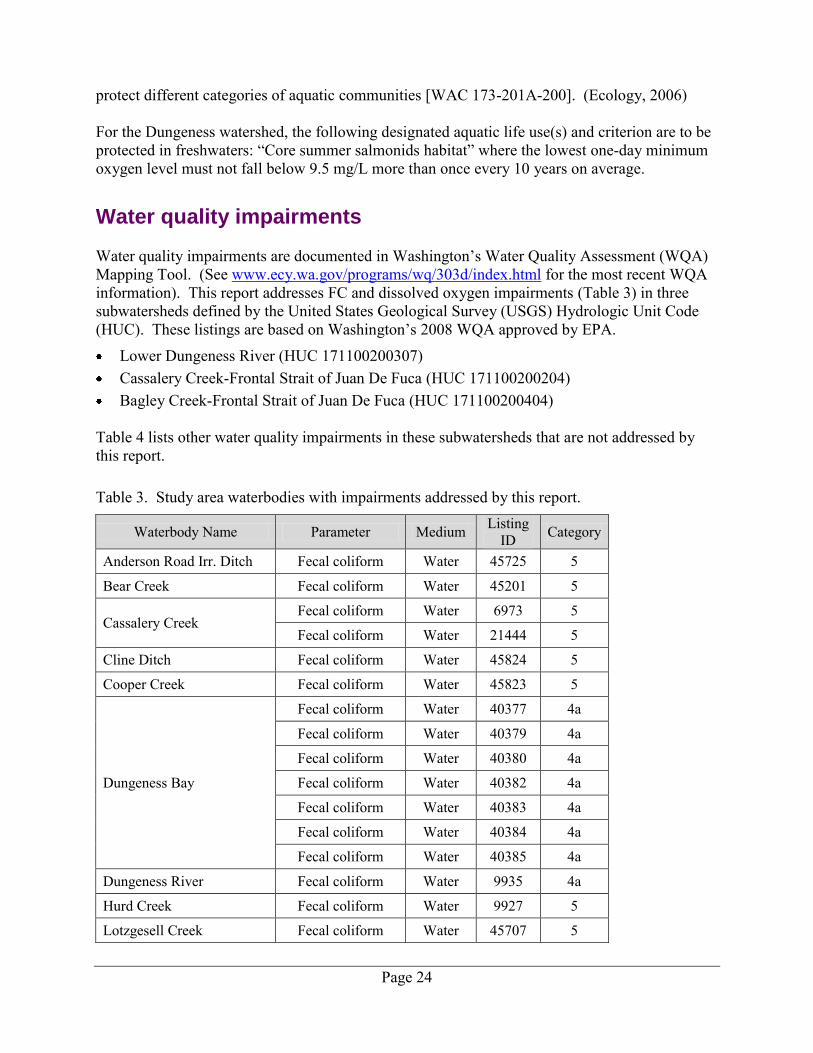
Bagley Creek-Frontal Strait of Juan De Fuca (HUC 171100200404) Table 4 lists other water quality impairments in these subwatersheds that are not addressed by this report.
Table 3. Study area waterbodies with impairments addressed by this report.
Waterbody Name Parameter Medium Listing ID Category
Anderson Road Irr. Ditch Fecal coliform Water 45725 5
Bear Creek Fecal coliform Water 45201 5
Cassalery Creek Fecal coliform Water 6973 5
Fecal coliform Water 21444 5
Cline Ditch Fecal coliform Water 45824 5
Cooper Creek Fecal coliform Water 45823 5
Dungeness Bay
Fecal coliform Water 40377 4a
Fecal coliform Water 40379 4a
Fecal coliform Water 40380 4a
Fecal coliform Water 40382 4a
Fecal coliform Water 40383 4a
Fecal coliform Water 40384 4a
Fecal coliform Water 40385 4a
Dungeness River Fecal coliform Water 9935 4a
Hurd Creek Fecal coliform Water 9927 5
Lotzgesell Creek Fecal coliform Water 45707 5
Page 25
Waterbody Name Parameter Medium Listing ID Category
Matriotti Creek
Fecal coliform Water 46401 5
Fecal coliform Water 6969 4a
Fecal coliform Water 9913 4a
Fecal coliform Water 9914 4a
Fecal coliform Water 9916 4a
Fecal coliform Water 9918 4a
Fecal coliform Water 9920 4a
Matriotti Ditch Fecal coliform Water 45149 5
Meadowbrook Creek
Fecal coliform Water 9924 5
Fecal coliform Water 9925 5
Fecal coliform Water 45718 5
Fecal coliform Water 46387 5
Fecal coliform Water 46416 5
Fecal coliform Water 9923 4a
Meadowbrook Slough Fecal coliform Water 9929 4a
Mudd Creek Fecal coliform Water 45709 5 Unnamed Ditch (Tributary to Meadowbrook Creek)
Fecal coliform Water 46566 5
Cassalery Creek Dissolved Oxygen Water 42819 5
Cooper Creek Dissolved Oxygen Water 48099 5
Meadowbrook Creek
Dissolved Oxygen Water 47775 5
Dissolved Oxygen Water 47776 5
Dissolved Oxygen Water 47778 5
Dissolved Oxygen Water 47781 5
Table 4. Study area waterbodies with impairments not addressed by this report.
Waterbody Name Parameter Medium Listing ID Category
Cassalery Creek Bioassessment Other 42817 5
Bioassessment Other 42818 5
Cline Ditch Dissolved Oxygen Water 47844 5
Meadowbrook Creek pH Water 51010 5
Meadowbrook Slough pH Water 51003 5

Page 26
This page is purposely left blank
Page 27
Goals and Objectives
Project goals Goals for this project include: 1. Conduct an evaluation of the effectiveness of the overall implementation efforts in meeting
FC target concentrations set by the TMDLs for Dungeness Bay, the Dungeness River, and tributaries.
2. Assess the status of FC concentrations and determine if Washington State surface water quality standards for FC are being met in Dungeness Bay and all tributaries to the bay included in the TMDL studies.
3. Evaluate waters in the Dungeness Bay vicinity that have shown signs of other impairment (Ecology’s 2008 Water Quality Assessment lists three streams in the study area as impaired due to low dissolved oxygen concentration).
Study objectives Specific project objectives include:
Determine if FC annual and seasonal targets set by the 2002 (Sargeant, 2002) and 2004 (Sargeant, 2004b) TMDL studies and described in the 2004 Detailed Implementation Plan (Streeter and Hempleman, 2004) have been met.
Review and analyze historic FC loading data at two sites on Matriotti Creek to determine water quality trends.
Review dissolved oxygen data for the three specified streams and evaluate against Washington’s surface water quality criteria.
Determine whether Dungeness Bay and the Lower Dungeness River watershed meet the National Water Program Guidance Measure SP-12 (described in detail on page 38 of this report) and if so, recommend which option (Option 1, 2a or 2b) to use for reporting water quality improvements.
Provide recommendations for further monitoring and future water cleanup efforts.
Page 28
Methods
The effectiveness of efforts to reduce bacterial contamination was assessed through water quality monitoring and statistical analysis. To supplement previously collected data, FC concentrations were measured monthly for one year at 13 stream sites (Figure 2). These data were used to assess compliance with water quality standards and attainment of TMDL targets. In addition, DOH monitoring data from marine waters were used to evaluate trends in FC concentrations over time in bay waters. For selected sites, bacterial loads were estimated by pairing concentration data with measured discharge. Dissolved oxygen concentrations were also evaluated for three streams that were suspected of not meeting standards. The following methods were used for these analyses. Field and laboratory
FC data from 1999 to 2009 were compiled from a variety of sources for this analysis (Table 1). Ecology sampled the freshwater tributaries to the bay from 1999 to 2000 for the Dungeness
River and Matriotti Creek Fecal Coliform Bacteria Total Maximum Daily Load Study (Sargeant, 2002). Clallam County, the Jamestown S’Klallam Tribe, and Ecology’s ambient monitoring program continued FC sampling at many of the freshwater TMDL target sites from 2001-2008. Ecology collected data specifically for this effectiveness monitoring study from 2008-2009. Samples from 2008-2009 were collected and analyzed according to the Quality Assurance Project Plan: Dungeness Bay and Lower Dungeness River Watershed Fecal Coliform Bacteria
Total Maximum Daily Load Effectiveness Monitoring (Ecology, 2009). Ecology uses the membrane filtration (MF) method for FC analysis. The majority of the post-TMDL FC samples were analyzed by the Clallam County Laboratory using the MF method. Occasional samples were analyzed by the DOH laboratory using most probable number (MPN) analysis for FC. Measurements from field duplicates were arithmetically averaged prior to further analysis. Data analysis
Status of FC in Dungeness Bay and tributaries
Geometric means and estimated 90th percentiles of FC concentrations were calculated for each site to assess compliance with water quality standards and attainment of TMDL targets. The geometric mean is calculated by back-transforming the mean of log-transformed concentration values. The 90th percentile, as used here, is calculated as the 90th percentile of a lognormal distribution, whose mean and standard deviation are estimated from the log-transformed data. For tributary sites, these statistics were based on samples collected between November 2008 and October 2009. For marine sites, these statistics were based on the last 30 samples from each site, which for most sites means about three years of data. Seasonal statistics were also calculated for marine sites to assess compliance with standards during critical periods identified in the TMDL study (Sargeant, 2004a). The critical period for inner bay sites is November to February and the critical period for outer bay sites is March to October (Sargeant, 2004a). The critical period for
Page 29
tributaries to the bay is the irrigation season from April 15 to September 15. Analysis of the marine data was based on the tributary critical period to determine effectiveness of implementation strategies in the watershed. All summary statistics were calculated with Microsoft Excel® 2007 software. Trends over time in FC in Dungeness Bay Multiple linear regression (MLR) was used to test for temporal trends in FC concentrations. MLR allows the influence of additional variables that may influence FC concentrations such as water temperature to be factored out, making it easier to detect a change over time if it actually occurred. To satisfy the assumptions of MLR, FC concentrations were first log-transformed and called log(FC). The initial set of potential predictor variables for MLR analysis included date, season, water temperature, tide status, salinity, and flow rate from the Dungeness River. Season and tide status were removed from this variable list because they are correlated with temperature and salinity, respectively. A stepwise variable selection process was used to identify significant predictors from the remaining variables. Regressions were run for each station individually, for all stations grouped together, and for inner and outer bay station groups. In the grouped station regressions, the mean log(FC) at each sample station was subtracted from all individual samples at that station to factor out differences among stations. All regressions were run with Minitab software, version 13.30.
Trends over time in FC in Dungeness Bay tributaries MLR was also used to test for temporal trends in log-transformed FC concentrations at tributary sampling stations. Potential predictor variables included year, year2 (to represent non-linear trends1), season (irrigation–April 15 to September 15, or non-irrigation), and rainfall (the cumulative rainfall depth at Sequim for a period spanning two days before the sampling through the day of the sampling). A stepwise variable selection process was used to identify significant predictors. Individual and grouped regressions were run for all sites where samples were collected throughout the 1999-2009 period (DR0.1, DR0.8, DR3.2, MAT0.1, MAT1.9, MAT3.2, and MC0.2). As with the bay analysis, in the grouped station regression, the mean log(FC) at each sample station was subtracted from all individual samples at that station to factor out differences among stations.
1 Evidence for non-linear trends can be evaluated in regression analysis by including a squared version of the time variable. In this case, this approach treats log fecal coliform concentrations as quadratic function of time. The additional variable is warranted if a visual examination of the time series suggests a non-linear trend (see Appendix C, Figure C-5 for an example).
Page 30
FC loads in Matriotti Creek FC concentration and discharge data for the Matriotti Creek sites were analyzed to evaluate whether FC loads have been reduced through the TMDL implementation. FC loads were calculated for each sample event as the product of the sample concentration (cfu/100 mL) and the measured discharge (cfs). Loads for the specified time periods were calculated as the arithmetic mean of all samples. Dissolved oxygen in Cassalery, Cooper, and Meadowbrook Creeks Dissolved oxygen data were compared to Washington’s surface water quality standards for three sites in the lower Dungeness sub-watershed: Cassalery Creek, Cooper Creek, and Meadowbrook Creek. Extraordinary Aquatic Life criteria (WAC 173-201A-200) apply to these waters. The criteria require that “concentrations of dissolved oxygen are not to fall below 9.5 mg/L at a probability frequency of more than once every ten years on average.” When replicate samples were taken on the same day, the arithmetic mean value was calculated.
Page 31
TMDL Summary
The Dungeness River and Matriotti Creek Fecal Coliform Bacteria Total Maximum Daily Load
Study (Sargeant, 2002) was based on sampling in the freshwater tributaries to the Dungeness Bay from 1999 to 2000. The purpose of the study was to determine the freshwater sources contributing high FC levels to the bay. Elevated FC levels were found in several freshwater tributaries flowing into the bay (Sargeant, 2002). The study area included the lower Dungeness River, Hurd Creek, Matriotti Creek, Meadowbrook Creek, and Meadowbrook Slough. Target reductions for FC concentrations were set in these and other tributaries to the bay (Table 2). The Dungeness Bay Fecal Coliform Bacteria Total Maximum Daily Load Study (Sargeant, 2004a) was based on sampling in Dungeness Bay and ditches discharging into Dungeness Bay from October 2001 to 2002. The TMDL addressed FC in inner and outer Dungeness Bay, irrigation ditches to the inner Dungeness Bay, and the Dungeness River. The study found that the critical period for inner Dungeness Bay is November through February, and the critical period for the outer Dungeness Bay near the mouth of Dungeness River is March to October. Target reductions for FC concentrations were set for the Dungeness River and irrigation ditches discharging to inner Dungeness Bay (Table 2). Both TMDL studies attributed FC pollution to nonpoint sources, including on-site septic systems, pet and livestock waste, stormwater runoff, and wildlife. There are no permitted point source discharges in the study area, so there is no wasteload allocation. Efforts to reduce FC pollution have focused on piping of irrigation ditches, pasture management, manure storage, investigation and repair of on-site septic systems, and outreach and education efforts with area residents (Streeter and Hempleman, 2004).

Page 32
This page is purposely left blank
Page 33
Results and Discussion
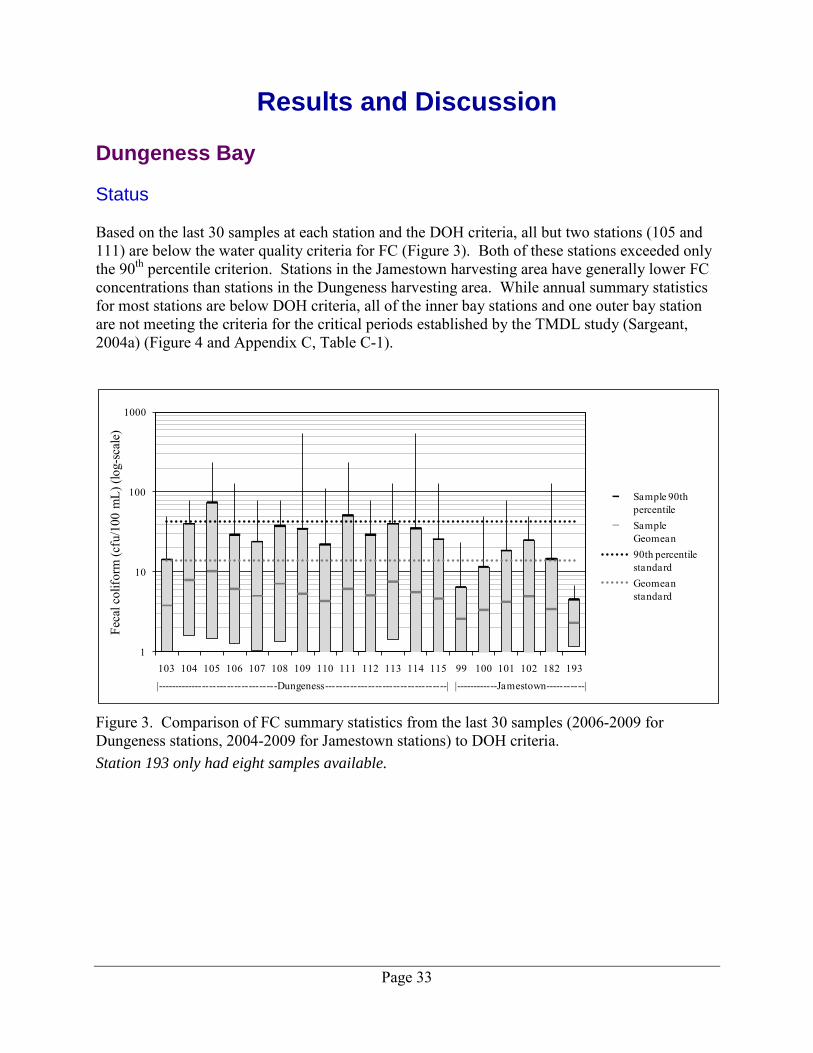
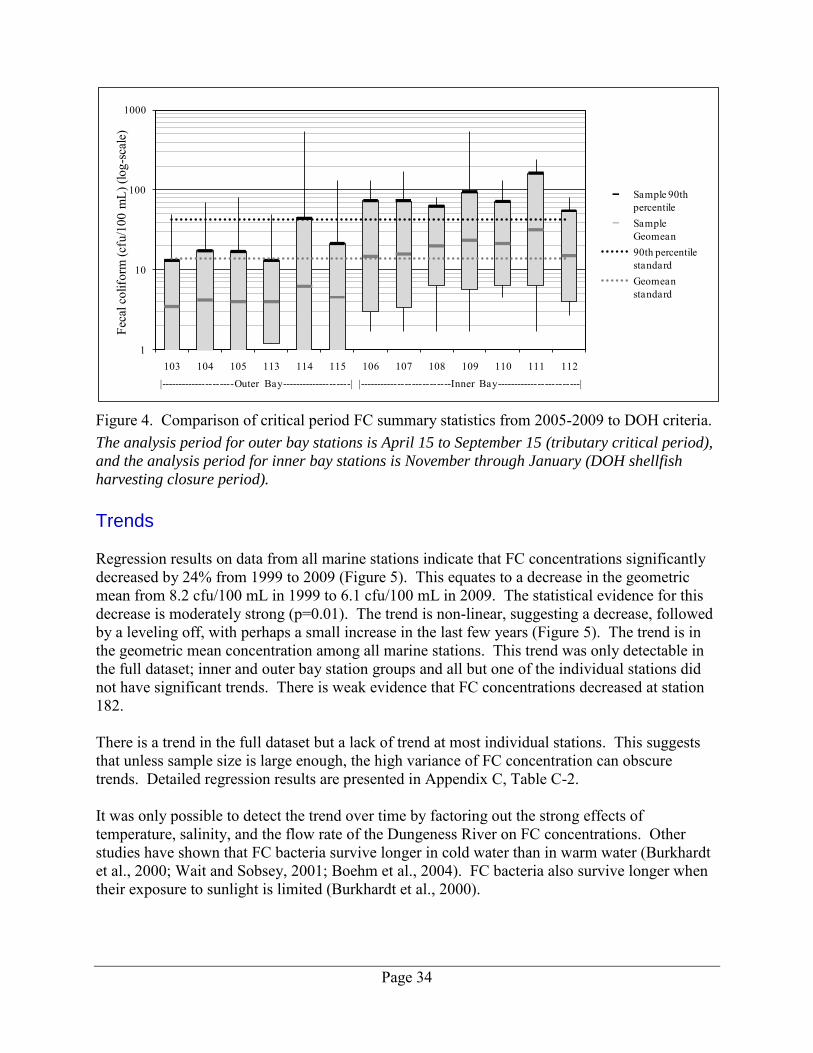
Dungeness Bay Status Based on the last 30 samples at each station and the DOH criteria, all but two stations (105 and 111) are below the water quality criteria for FC (Figure 3). Both of these stations exceeded only the 90th percentile criterion. Stations in the Jamestown harvesting area have generally lower FC concentrations than stations in the Dungeness harvesting area. While annual summary statistics for most stations are below DOH criteria, all of the inner bay stations and one outer bay station are not meeting the criteria for the critical periods established by the TMDL study (Sargeant, 2004a) (Figure 4 and Appendix C, Table C-1).
Figure 3. Comparison of FC summary statistics from the last 30 samples (2006-2009 for Dungeness stations, 2004-2009 for Jamestown stations) to DOH criteria. Station 193 only had eight samples available.
1
10
100
1000
103 104 105 106 107 108 109 110 111 112 113 114 115 99 100 101 102 182 193
Feca
l col
iform
(cfu
/100
mL)
(log
-sca
le)
|----------------------------------Dungeness----------------------------------| |------------Jamestown-----------|
Sample 90th percentileSample Geomean90th percentile standardGeomean standard
Page 34
Figure 4. Comparison of critical period FC summary statistics from 2005-2009 to DOH criteria. The analysis period for outer bay stations is April 15 to September 15 (tributary critical period),
and the analysis period for inner bay stations is November through January (DOH shellfish
harvesting closure period).
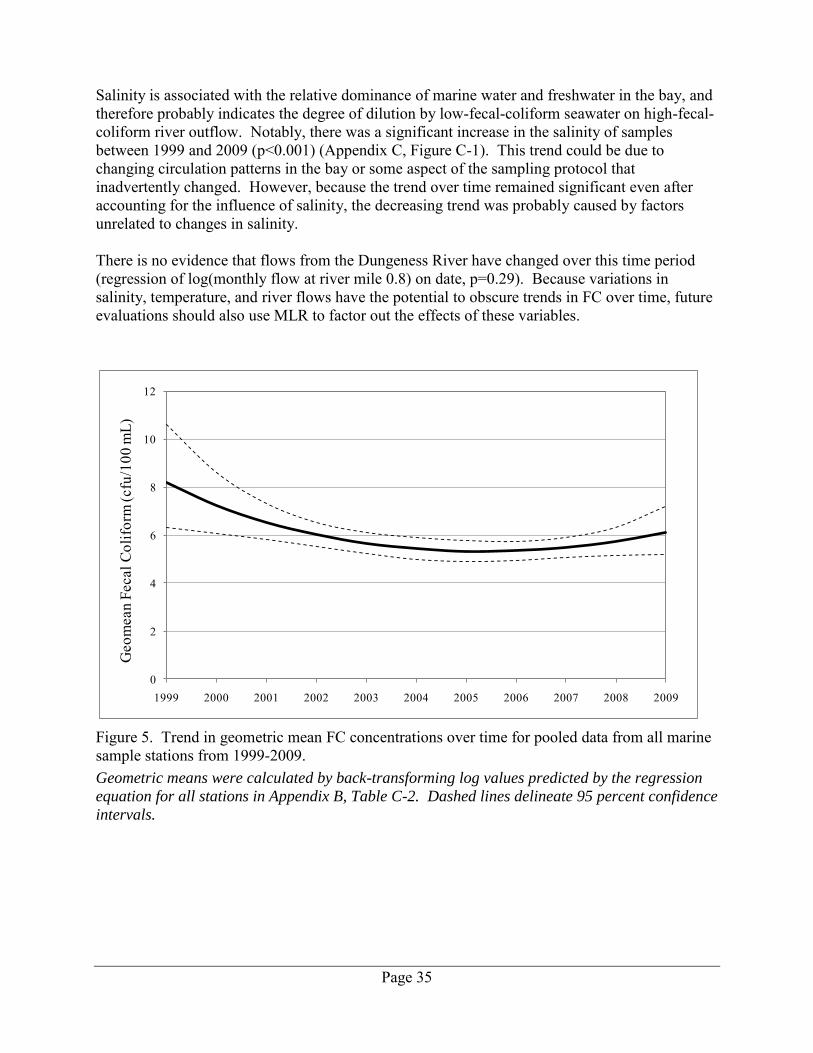
Trends Regression results on data from all marine stations indicate that FC concentrations significantly decreased by 24% from 1999 to 2009 (Figure 5). This equates to a decrease in the geometric mean from 8.2 cfu/100 mL in 1999 to 6.1 cfu/100 mL in 2009. The statistical evidence for this decrease is moderately strong (p=0.01). The trend is non-linear, suggesting a decrease, followed by a leveling off, with perhaps a small increase in the last few years (Figure 5). The trend is in the geometric mean concentration among all marine stations. This trend was only detectable in the full dataset; inner and outer bay station groups and all but one of the individual stations did not have significant trends. There is weak evidence that FC concentrations decreased at station 182. There is a trend in the full dataset but a lack of trend at most individual stations. This suggests that unless sample size is large enough, the high variance of FC concentration can obscure trends. Detailed regression results are presented in Appendix C, Table C-2. It was only possible to detect the trend over time by factoring out the strong effects of temperature, salinity, and the flow rate of the Dungeness River on FC concentrations. Other studies have shown that FC bacteria survive longer in cold water than in warm water (Burkhardt et al., 2000; Wait and Sobsey, 2001; Boehm et al., 2004). FC bacteria also survive longer when their exposure to sunlight is limited (Burkhardt et al., 2000).
1
10
100
1000
103 104 105 113 114 115 106 107 108 109 110 111 112
Feca
l col
iform
(cfu
/100
mL)
(log
-sca
le)
|---------------------Outer Bay--------------------| |--------------------------Inner Bay------------------------|
Sample 90th percentileSample Geomean90th percentile standardGeomean standard
Page 35
Salinity is associated with the relative dominance of marine water and freshwater in the bay, and therefore probably indicates the degree of dilution by low-fecal-coliform seawater on high-fecal- coliform river outflow. Notably, there was a significant increase in the salinity of samples between 1999 and 2009 (p<0.001) (Appendix C, Figure C-1). This trend could be due to changing circulation patterns in the bay or some aspect of the sampling protocol that inadvertently changed. However, because the trend over time remained significant even after accounting for the influence of salinity, the decreasing trend was probably caused by factors unrelated to changes in salinity. There is no evidence that flows from the Dungeness River have changed over this time period (regression of log(monthly flow at river mile 0.8) on date, p=0.29). Because variations in salinity, temperature, and river flows have the potential to obscure trends in FC over time, future evaluations should also use MLR to factor out the effects of these variables.
Figure 5. Trend in geometric mean FC concentrations over time for pooled data from all marine sample stations from 1999-2009. Geometric means were calculated by back-transforming log values predicted by the regression
equation for all stations in Appendix B, Table C-2. Dashed lines delineate 95 percent confidence
intervals.
0
2
4
6
8
10
12
1999 2000 2001 2002 2003 2004 2005 2006 2007 2008 2009
Geo
mea
n Fe
cal C
olifo
rm (c
fu/1
00 m
L)
Page 36
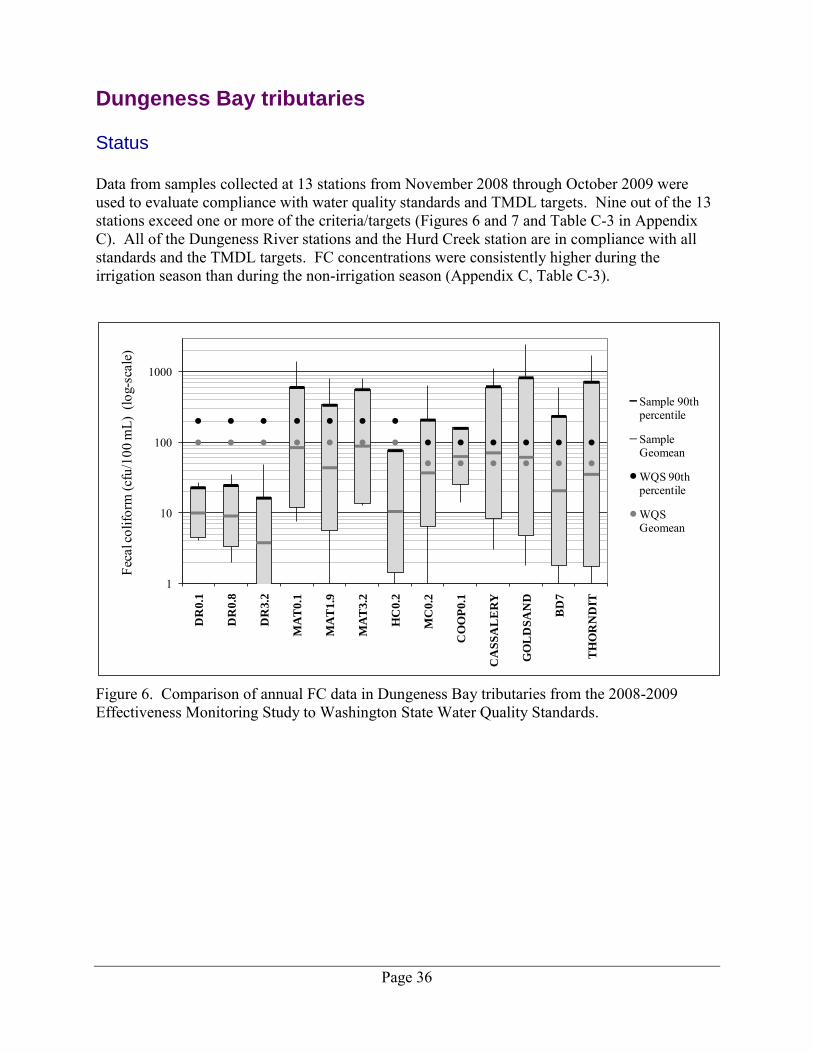
Dungeness Bay tributaries Status Data from samples collected at 13 stations from November 2008 through October 2009 were used to evaluate compliance with water quality standards and TMDL targets. Nine out of the 13 stations exceed one or more of the criteria/targets (Figures 6 and 7 and Table C-3 in Appendix C). All of the Dungeness River stations and the Hurd Creek station are in compliance with all standards and the TMDL targets. FC concentrations were consistently higher during the irrigation season than during the non-irrigation season (Appendix C, Table C-3).
Figure 6. Comparison of annual FC data in Dungeness Bay tributaries from the 2008-2009 Effectiveness Monitoring Study to Washington State Water Quality Standards.
1
10
100
1000
DR
0.1
DR
0.8
DR
3.2
MA
T0
.1
MA
T1
.9
MA
T3
.2
HC
0.2
MC
0.2
CO
OP
0.1
CA
SS
AL
ER
Y
GO
LD
SA
ND
BD
7
TH
OR
ND
IT
Feca
l col
iform
(cfu
/100
mL)
(lo
g-sc
ale)
Sample 90th percentile
Sample Geomean
WQS 90th percentile
WQS Geomean
Page 37
Figure 7. Comparison of annual FC data in Dungeness Bay tributaries from the 2008-2009 Effectiveness Monitoring Study to targets established by the 2004 TMDL Study. Trends Time series plots of FC concentration data on the seven consistently sampled tributary stations are presented in Appendix C (Figures C-2 through C-8). Regression results on pooled data from these stations indicate that FC concentrations significantly decreased from 1999 to 2009. As with the Dungeness Bay trend, the best model includes the squared term for year, which indicates a non-linear trend (Figure 8; Appendix C, Table C-4). The amount of rainfall just prior to the sampling also significantly influenced FC concentrations. Specifically, the rainfall term was significant in the multiple regression model, and higher FC concentrations were associated with higher amounts of rainfall. However, because the temporal trend remained significant even after accounting for the influence of rainfall events, it was probably caused by factors that are unrelated to patterns of rainfall over the study period.2 (The total annual rainfall is presented in Appendix C, Figure C-9.)
2 When several variables are sequentially added to a multiple regression model, the addition of one variable may negate the significance of another variable. This results from correlation among the predictor variables and can make it difficult to determine which variable is most directly influencing the response variable. However, when two or more variables are significant in the same model, it can generally be assumed that they have independent effects on the response variable.
1
10
100
1000
DR
0.1
DR
0.8
DR
3.2
MA
T0
.1
MA
T1
.9
MA
T3
.2
HC
0.2
MC
0.2
CO
OP
0.1
CA
SS
AL
ER
Y
GO
LD
SA
ND
BD
7
TH
OR
ND
IT
Feca
l col
iform
(cfu
/100
mL)
(lo
g-sc
ale)
Sample 90th percentile
Sample Geomean
TMDL 90th percentile
TMDL Geomean
Page 38
There was also a strong seasonal pattern, with higher FC concentrations occurring during the irrigation season. When data from the two seasons were evaluated separately, most of the overall trend appears to be in data collected during the irrigation season (Figure 8). In addition, the irrigation season trend shows the most pronounced increase in recent years of all the trends. Based on regressions for individual stations, significant year-round decreases in FC concentrations only occurred at two sites on Matriotti Creek: MAT0.1 and MAT1.9 (Figure 9). However, there is weaker evidence for decreasing trends during the irrigation season only at one other site: DR3.2. See Appendix C, Table C-4 for trend analysis on all freshwater stations. As with the all-station analysis, the shape of the trends in all the individual models was non-linear, suggesting a rapid decrease, followed by a leveling off, with perhaps a small increase in the last few years (Figure 9).
Figure 8. Trends in geometric mean FC concentrations over time for pooled data from the seven consistently sampled stations from 1999-2009.
Geometric means were calculated by back-transforming log values predicted by the regression
equation for all stations in Appendix B, Table C-4. Dashed lines delineate 95 percent confidence
intervals.
0
20
40
60
80
100
120
1999 2000 2001 2002 2003 2004 2005 2006 2007 2008 2009
Geo
mea
n Fe
cal C
olifo
rm (c
fu/1
00 m
L)
Irrigation
Annual
Non-irrigation
Page 39
Figure 9. Trends in geometric mean FC concentrations from 1999-2009 for two sites on Matriotti Creek. Geometric means were calculated by back-transforming log values predicted by the regression
equation for MAT0.1 and MAT1.9 in Appendix B, Table C-4. Dashed lines delineate 95 percent
confidence intervals.
Matriotti Creek FC loads Based on a comparison of 2008 to 2009 data and 1999 to 2000 data, FC loads at the mouth of Matriotti Creek (station MAT0.1) have been reduced by 67% from their pre-TMDL levels, but have not reached the TMDL target of a 78% reduction (Table 5). One sample at MAT0.1 during the non-irrigation period had a FC concentration of 1400 cfu/100 mL, which is unusually high for this season. Without this sample, the relative loads between the seasons are similar to the pattern at the other sites and at MAT0.1 in 1999 to 2000.
Table 5. FC loads (cfu/100 mL x cfs).
Station Non-irrigation Season
Irrigation Season Annual
CASSALERY (2008-09) 182 437 284 MAT3.2 (2008-09) 101 262 161 MAT1.9 (2008-09) 78 132 100 MAT0.1 (2008-09) 2005 1807 1944 Target for MAT0.1 -- -- 1267
MAT0.1 (1999-2000) 4223 8268 5972
0
100
200
300
400
500
1999 2000 2001 2002 2003 2004 2005 2006 2007 2008 2009
Geo
mea
n Fe
cal C
olifo
rm (c
fu/1
00 m
L)
MAT0.1
MAT1.9
Page 40
Dissolved oxygen in Cassalery, Cooper, and Meadowbrook Creeks
Cassalery, Cooper, and Meadowbrook Creeks had 2, 11, and 10 samples, respectively, below the dissolved oxygen criterion (9.5 mg/L) during a one-year period (Figure 10). Thus, all three creeks are in violation of the Extraordinary Aquatic Life criteria (WAC 173-201A-200).
Figure 10. Dissolved oxygen measurements from 2008-2009 at Cassalery, Cooper, and Meadowbrook Creeks.
Connection between trends and TMDL implementation Progress has been made in addressing potential FC loading from all categories of potential sources identified in the TMDL study, including septic systems, irrigation ditches, stormwater, livestock, and pet waste. Based on the record and status of implementation activities outlined in Appendix B, the most progress has been made in the areas of septic systems and irrigation ditches. The reductions in FC concentrations found in this study occurred primarily during the irrigation season, which suggests that capping or improving management of irrigation ditches has been the most effective implementation activity. A decrease in FC concentrations during the wet season was only documented at one station at the mouth of Matriotti Creek. This may be because less progress has been made on reducing stormwater runoff, which is most relevant during the wet season. These interpretations are based only on these seasonal correlations and are not definitive conclusions about the effectiveness of any specific implementation activities.
5
6
7
8
9
10
11
12
13
11/1/08 1/1/09 3/3/09 5/3/09 7/3/09 9/2/09
Dis
solv
ed O
xyge
n (m
g/L)
CassaleryCooperMeadowbrookDO Criteria
Page 41
The non-linear trends in FC concentrations over time suggest that initial implementation activities were most effective, and that concentrations have leveled off and perhaps increased in the last couple years (Figures 5, 8, and 9). This trend may be the result of combining two opposing forces: an initially strong decrease from TMDL implementation and a weaker but continuing increase from population growth in the region (Woodruff et al., 2009). If so, it means that efforts to reduce FC loading will need to continue if the gains that have been made so far are to be sustained.
Comparison of findings with other studies Three other studies have evaluated trends in FC concentrations over time in Dungeness Bay and its tributaries. The following is a summary of the comparison of trend-related findings of these other studies to the findings of the present 2008-09 effectiveness monitoring study: Dungeness River and Matriotti Creek Post-Total Maximum Daily Load Data Review
(Sargeant, 2004b)
Sargeant used a seasonal Kendall trend test to evaluate trends in FC concentrations in the Dungeness River, Matriotti Creek, and Meadowbrook Creek for the period 1999 to 2004. For the Dungeness River, Sargeant found no significant trends at any stations during that timeframe, while this study found a significant (p=0.045) decreasing trend at station DR0.8 during the irrigation season only. For Matriotti Creek, Sargeant found significant decreasing trends at four out of six stations, and this 2008-09 study found significant decreasing trends at two out of three stations. While the locations of some of the stations differed between the studies, both studies found the most pronounced trends close to the mouth of the creek. In both studies, no trends in FC concentrations were detected in Meadowbrook Creek. As a whole, the findings of this study agree with Sargeant’s findings. One difference is that this study found evidence for non-linear trends (indicating a possible recent increase in FC concentrations). Sargeant’s study was conducted before this trend could have been detected, but it is worth noting that the Kendall trend test does not allow non-linear trends to be distinguished from linear trends.
Fecal Coliform Pollution in Dungeness Bay through 2007: Status and Trends Summary
(DOH, 2008a)
DOH used Spearman rank correlation to evaluate trends in FC concentrations at Dungeness Bay sampling stations between 2003 and 2007, and found significant decreases at 12 of 13 stations. Using regression, the present 2008-09 study found a significant trend over time for all stations combined, but no significant trends for the individual stations. Notably, the shape of the non-linear trend found in this study indicates that little to no change was occurring between 2003 and 2007 (Figure 5).
Page 42
The multiple linear regression analysis used in this study controls for additional variables that influence FC concentrations, such as water temperature and salinity, before looking for a trend over time. Spearman rank correlation cannot evaluate the influence of multiple variables simultaneously. Thus, the trends at individual stations found by the DOH study may have actually been the unintended result of a trend in salinity, temperature, or both. This study found a significant increase in the salinity of samples between 1999 and 2009 (p<0.001). Effectiveness Monitoring of Fecal Coliform Bacteria and Nutrients in the Dungeness
Watershed, Washington (Woodruff et al., 2009)
This study was conducted by Battelle for the Jamestown S’Klallam Tribe as part of their EPA Targeted Watershed Grant. The Battelle study used a similar statistical approach (MLR is a specific type of generalized linear model) as the present 2008-09 study to evaluate trends in FC concentrations across Dungeness Bay and its tributaries. However, for the tributary sites, the Battelle study found no significant trend over time in FC concentrations, whereas the present study found a significant decrease. There are several differences between the two studies that may have contributed to this disagreement. These differences fall into two general categories: data and model. Data: The Battelle study used a dataset with approximately twice as many individual
samples, collected from nearly eight times as many sampling stations as the present study. In some cases, the numbers of samples collected in each year from the stations that were common between the two studies are different. In addition, the present study contained one more year of data than the Battelle study. These differences in the datasets could feasibly account for the differences in the overall findings of the two studies. In particular, the dataset analyzed in the present study is more balanced than the dataset in the Battelle Study because the number and timeframe of samples were more consistent among years. A more balanced dataset is more compatible with a model that provides more degrees of freedom for evaluating trends over time (see below).
Model: The Battelle study evaluated trends over time with linear regression on the least squares means of log FC concentrations in each year. This approach is appropriate with a large, unbalanced dataset, but it requires discarding most of the degrees of freedom provided by the individual samples. In contrast, MLR requires a more balanced dataset, but also retains most of the degrees of freedom in the dataset. MLR is therefore more likely to be able to identify trends that would otherwise be masked by the high variance of FC concentrations. The definition of model factors, or treatments, also differs somewhat between the two studies. Specifically, station (or reach) and tributary are separate factors in the Battelle models, but are combined into a single factor in the present study. In addition, the statistical significance of the trend over time in the present study is strengthened by modeling its non-linear shape, where the Battelle models only evaluated linear trends. Further, Battelle’s models for individual tributaries include month (12 levels), where the present study only distinguishes between wet and dry seasons (two levels). In analysis of variance, the more levels that are included in a model, the fewer degrees of freedom remain to evaluate the influence of each factor.
Page 43
Battelle’s evaluation of FC concentrations in Dungeness Bay found no significant linear trend over the last 10 years, whereas the present study found a significant decrease. The amount of change in FC concentrations found in this study (24%) is relatively minor compared with the variance of the samples. The trend was not significant without first accounting for temperature, salinity, and flow from the Dungeness River; these variables were not used in the Battelle study. In addition, the evidence for a linear trend in the present study was weak; only the non-linear trend was significant. The Battelle study did not evaluate for non-linear trends.
Page 44
National Measures SP-12 and WQ-10 Evaluation
The Government Performance and Results Act requires that EPA develop a five-year strategic plan every three years. The current plan calls for the improvement of water quality in 250 watersheds using the watershed approach (Measure SP-12) and the full or partial restoration of 250 primarily nonpoint source (NPS) impaired water bodies nationwide (Measure WQ-10). The strategic plan refers to these targets as National Water Program Guidance Measures. Measure SP-12 is a “demonstration” measure, used to document water quality improvements that result from application of the watershed approach; the intent is not to inventory all instances where success has occurred or is underway in a state. Measure WQ-10 is the main long-term environmental results measure for the NPS program and requires that a designated use be restored or that one or more pollutants causing impairment of a designated use meet applicable criteria. For a watershed to be counted under SP-12, states can use one of three options for demonstrating water quality improvement: Option 1: States may demonstrate improvement as the removal of one or more of the
impairment causes identified in 2002 for at least 40 percent of the impaired water bodies or impaired miles or acres.
Option 2a: States may use valid scientific information and statistical procedures to demonstrate that significant improvement has occurred with a 90 percent or greater level of confidence, where improvement is defined as a significant watershed-wide improvement in one or more water quality parameters associated with the impairments.
Option 2b: States can use a “multiple lines of evidence approach” to demonstrate watershed improvement. A “multiple lines of evidence approach” means that the cumulative weight of several lines of evidence is used to assess whether a watershed-wide improvement has occurred.
As part of this effectiveness evaluation, the Dungeness River watershed and Dungeness Bay were evaluated against requirements for Measures SP-12 and WQ-10. Based on the results of the data analysis, both the Dungeness River watershed and Dungeness Bay can be counted under Measure SP-12 using Option 2a. Specifically, there is valid scientific information and statistical evidence (greater than 90 percent confidence, based on multiple linear regression analysis) that FC concentrations have decreased by 32% in bay tributaries and 24% in the bay between 1999 and 2009. These reductions resulted in the Dungeness River meeting water quality standards for FC. Consequently, the Dungeness River can be counted for Measure WQ-10.
Page 45
Conclusions
There is evidence that fecal coliform (FC) concentrations have decreased in Matriotti Creek, and to a lesser degree in the Dungeness River, between 1999 and 2009. Most of the decrease occurred early in this period, and the data suggest a slight increase in recent years from the lowest levels that occurred around 2005. FC loads at the mouth of Matriotti Creek, which are more relevant to the health of the bay than concentrations, were reduced by 67 percent since 1999. Despite these improvements, nine out of 13 Dungeness Bay tributary stations (including Cassalery Creek, a new station) did not meet water quality criteria and TMDL targets during the 2008 to 2009 sampling period. Cassalery, Cooper, and Meadowbrook Creeks were also found to be in violation of their dissolved oxygen criterion. The Dungeness River and Hurd Creek were in compliance with FC standards and met TMDL targets for FC. There is moderately strong evidence that FC concentrations have decreased in Dungeness Bay between 1999 and 2009. All but two of the sampling stations in the bay are meeting annual standards set by the State Department of Health (DOH). However, all the stations in the inner bay did not meet DOH standards during November through February. All stations in the Jamestown harvesting area were meeting DOH standards at the time of 2008-2009 sampling. As a whole, there is strong evidence that TMDL implementation actions have decreased FC concentrations and loads in parts of the Dungeness Bay watershed. Nevertheless, several tributary stations and some bay stations are still not meeting safe FC levels. Efforts to reduce FC loading from septic systems, stormwater, and pet and livestock waste should continue in areas that are not meeting water quality standards.
Page 46
Recommendations
Based on the results of this 2008-09 effectiveness monitoring study, further implementation, monitoring, and analysis may be warranted. Recommendations are organized by questions that remain from this study. It is assumed that DOH will continue to monitor their (bay) stations; therefore, this is not included as a recommendation. 1. Will the decreasing trend in fecal coliform (FC) levels observed from 1999 to 2009 be
sustained in the future?
Continue monthly monitoring of FC at at least two stations (DR0.1 and MAT0.1) in the watershed. If funding allows more stations, selecting them in the following order will minimize redundancy: MC0.2, MAT3.2, DR3.2, MAT1.9, DR0.8.
Use the statistical methods described in this report to analyze trends with newly collected data.
Continue to monitor the flow of the Dungeness River at RM 0.8. Data from this station are needed to control for the effects of variability in river flow on FC concentrations in the bay.
2. Are there potential FC sources that have not been detected through monitoring?
Conduct a survey of all major stormwater outfalls and stormwater ditches along roadways in the watershed during dry weather. If discharge is present, sample for FC and investigate illicit connections.
Collect samples from stormwater outfalls and road side ditches during storm events in the watershed and measure their FC concentrations. If elevated concentrations are observed, follow up with upstream source tracking monitoring.
3. High FC concentrations in the bay occur during the winter, a period when tributary concentrations have not significantly decreased. What are the priority management measures that could reduce FC loading in the winter?
Improve stormwater management by eliminating unnecessary new impervious surfaces and retaining and infiltrating runoff.
Improve livestock and pet waste management, particularly during the winter.
4. What needs to be done to bring FC concentrations in Dungeness Bay tributaries in compliance with water quality standards?
Continue to implement management actions identified as high priority in Appendix B.
Create a spatial database of implementation activities to help identify which practices have the greatest effect on water quality. Implementation activities could be assigned to subwatersheds draining to each tributary stream. The intensity of implementation activities in a subwatershed could be used to track potential water quality improvements.

Page 47
Develop and implement a comprehensive action plan to reduce FC loading and increase dissolved oxygen concentrations in Meadowbrook, Cooper, and Cassalery Creeks.
Every three years, conduct a year-long monitoring study where the following sites are sampled monthly for FC: DR0.1, MAT0.1, MC0.2, GOLDSAND, COOP0.1, CASSALERY, THORNDIT, and BD7. The purpose of this recurring assessment would be to evaluate compliance with water quality standards and TMDL targets.
Continue aggressive source tracking monitoring and quickly follow up with corrective measures. Work with state or county authorities for regulatory action if needed.
Review and assess the status of implementation efforts included in individual conservation plans (fencing, riparian vegetation, and other similar work). Prioritize initial efforts in areas where livestock continue to have direct access to streams in the watershed.

Page 48
This page is purposely left blank
Page 49
References
Boehm, A.B., D.B. Lluch-Cota, K.A. Davis, C.D. Winant, and S.G. Monismith, 2004. Covariation of coastal water temperature and microbial pollution at interannual to tidal periods. Geophysical Research Letters 31. Burkhardt, W., K.R. Calci, W.D. Watkins, S.R. Rippey, and S.J. Chirtel, 2000. Inactivation of indicator microorganisms in estuarine waters. Water Research 34: 2207-2214. DeLorm, L., 2008. Personal communication. Natural Resources Technician, Jamestown S’Klallam Tribe, Sequim, WA. DOH, 1998. Annual Growing Area Review, Dungeness Bay-Clallam County. Washington State Department of Health, Office of Food Safety and Shellfish Programs, Olympia, WA. DOH, 2007. Annual Inventory of Commercial & Recreational Shellfish Areas 2007. Washington State Department of Health. www.doh.wa.gov/ehp/sf/Pubs/ai-map.pdf. DOH, 2008a. Fecal Coliform Pollution in Dungeness Bay through 2007: Status and Trends Summary. Washington State Department of Health, Office of Shellfish and Water Protection, Olympia, WA. DOH, 2008b. Sanitary Survey of Jamestown, December 2008. Washington State Department of Health, Office of Shellfish and Water Protection, Olympia, WA. Dougherty, G., 2008. Personal communication. Conservation Planner, Clallam Conservation District, Port Angeles, WA. Ecology, 2006. Water Quality Standards for Surface Waters of the State of Washington. Washington State Department of Ecology, Olympia, WA. Publication No. 06-10-091. www.ecy.wa.gov/biblio/0610091.html. Ecology, 2008. 2008 Washington State Water Quality Assessment. Washington State Department of Ecology, Olympia, WA. www.ecy.wa.gov/programs/wq/303d/index.html. Ecology, 2009. Quality Assurance Project Plan: Dungeness Bay and Lower Dungeness River Watershed Fecal Coliform Bacteria Total Maximum Daily Load Effectiveness Monitoring. Washington State Department of Ecology, Olympia, WA. www.ecy.wa.gov/biblio/0903104.html. EPA, 2001. Overview of Current Total Maximum Daily Load - TMDL - Program and Regulations. U.S. Environmental Protection Agency. www.epa.gov/owow/tmdl/intro.html.
Page 50
Hempleman, C. and D. Sargeant, 2002. Water Cleanup Plan for Bacteria in the Lower Dungeness Watershed, Total Maximum Daily Load (TMDL) Submittal Report. Southwest Regional Office, Washington State Department of Ecology, Olympia, WA. Publication No. 02-10-015. www.ecy.wa.gov/biblio/0210015.html. Hempleman, C. and D. Sargeant, 2004. Water Cleanup Plan for Bacteria in Dungeness Bay, Total Maximum Daily Load (TMDL) Submittal Report. Southwest Regional Office, Washington State Department of Ecology, Olympia, WA. Publication No. 04-10-026. www.ecy.wa.gov/biblio/0410026.html. Holtrop, J., 2008. Personal communication. District Manger, Clallam Conservation District, Port Angeles, WA. Rensel, J., 2003. Dungeness Bay Bathymetry, Circulation and Fecal Coliform Studies. Phase 2. Prepared by Rensel Associates Aquatic Science Consultants, Arlington, Washington for the Jamestown S'Klallam Tribe and the U.S. Environmental Protection Agency, Seattle, WA. L. Muench, Project Officer. (Bathymetry results supersede prior report.) www.jamestowntribe.org/jstweb_2007/programs/nrs/2-DungenessBayCircStudy.pdf. Sargeant, D., 2002. Dungeness River and Matriotti Creek Fecal Coliform Bacteria Total Maximum Daily Load Study. Washington State Department of Ecology, Olympia, WA. Publication No. 02-03-014. www.ecy.wa.gov/biblio/0203014.html. Sargeant, D., 2004a. Dungeness Bay Fecal Coliform Bacteria Total Maximum Daily Load Study. Washington State Department of Ecology, Olympia, WA. Publication No. 04-03-012. www.ecy.wa.gov/biblio/0403012.html. Sargeant, D., 2004b. Dungeness River and Matriotti Creek Post-Total Maximum Daily Load Data Review. Washington State Department of Ecology, Olympia, WA. Publication No. 04-03-053. www.ecy.wa.gov/biblio/0403053.html. Streeter, V., 2005. Quality Assurance Project Plan: Bacterial/Nutrient/Flow Effectiveness Monitoring in the Clean Water District. Environmental Health Division, Health and Human Services, Clallam County, Port Angeles, WA. Streeter V. and C. Hempleman, 2004. Clean Water Strategy for Addressing Bacteria Pollution in Dungeness Bay and Watershed and Water Cleanup Detailed Implementation Plan. Southwest Regional Office, Washington State Department of Ecology, Olympia, WA. Publication No. 04-10-059. www.ecy.wa.gov/biblio/0410059.html. WAC 173-201A. Water Quality Standards for Surface Waters in the State of Washington. Washington State Department of Ecology, Olympia, WA. www.ecy.wa.gov/laws-rules/ecywac.html. Wait, D.A., and M.D. Sobsey, 2001. Comparative survival of enteric viruses and bacteria in Atlantic Ocean seawater. Water Science and Technology 43: 139-142.
Page 51
Woodruff, D.L., V.I. Cullinan, and J.M. Brandenberger, 2009. Effectiveness Monitoring of Fecal Coliform Bacteria and Nutrients in the Dungeness Watershed, Washington. Prepared by Battelle Memorial Institute, Pacific Northwest Division, for the Jamestown S’Klallam Tribe. Publication No. PNWD-4054-3. www.jamestowntribe.org/jstweb_2007/programs/nrs/FINAL_EM_RPT(Oct_09)v_2.pdf.

Page 52
This page is purposely left blank

Page 53
Appendices

Page 54
This page is purposely left blank
Page 55
Appendix A. Glossary and Acronyms
Glossary
303(d) List: Section 303(d) of the federal Clean Water Act requires Washington State periodically to prepare a list of all surface waters in the state for which beneficial uses of the water – such as for drinking, recreation, aquatic habitat, and industrial use – are impaired by pollutants. These are water quality limited waterbodies (ocean waters, estuaries, lakes, and streams) that fall short of state surface water quality standards, and are not expected to improve within the next two years.
90th percentile: A statistical number obtained from a distribution of a data set, above which 10% of the data exists and below which 90% of the data exists.
Best management practices: Physical, structural, or operational practices that, when used singularly or in combination, prevent or reduce pollutant discharges.
Clean Water Act: Federal Act passed in 1972 that contains provisions to restore and maintain the quality of the nation’s waters. Section 303(d) of the Clean Water Act establishes the TMDL program.
Designated uses: Those uses specified in Chapter 173-201A of Washington Administrative Code (Water Quality Standards for Surface Waters of the State of Washington) for each waterbody or segment, regardless of whether or not the uses are currently attained.
Effectiveness monitoring: Monitoring to determine whether the recommended Detailed
Implementation Plan, after a significant portion of the recommendations or prescriptions have been implemented, is adequate in meeting (1) the goals and objectives for the TMDL project or (2) other desired outcomes over long temporal scales.
Exceeds criteria: Does not meet criteria.
Extraordinary primary contact: Waters providing extraordinary protection against waterborne disease or that serve as tributaries to extraordinary quality shellfish harvesting areas.
Fecal coliform (FC): That portion of the coliform group of bacteria which is present in intestinal tracts and feces of warm-blooded animals as detected by the product of acid or gas from lactose in a suitable culture medium within 24 hours at 44.5 + or - 0.2 degrees Celsius. FC are “indicator” organisms that suggest the possible presence of disease-causing organisms. Concentrations are measured in colony forming units per 100 milliliters of water (cfu/100mL).
Geometric mean: A mathematical expression of the central tendency (an average) of multiple sample values. A geometric mean, unlike an arithmetic mean, tends to dampen the effect of very high or low values, which might bias the mean if a straight average (arithmetic mean) were calculated. This is helpful when analyzing bacteria concentrations, because levels may vary anywhere from 10 to 10,000 fold over a given period. The calculation is performed by either: (1)
Page 56
taking the nth root of a product of n factors, or (2) taking the antilogarithm of the arithmetic mean of the logarithms of the individual values.
Irrigation season: In this study, the irrigation season is April 15 through September 15.
Load allocation: The portion of a receiving water’s loading capacity attributed to one or more of its existing or future sources of nonpoint pollution or to natural background sources.
Loading capacity: The greatest amount of a substance that a waterbody can receive and still meet water quality standards.
Margin of safety: Required component of TMDLs that accounts for uncertainty about the relationship between pollutant loads and quality of the receiving waterbody.
Nonpoint source: Pollution that enters any waters of the state from any dispersed land-based or water-based activities. This includes, but is not limited to, atmospheric deposition, surface water runoff from agricultural lands, urban areas, or forest lands, subsurface or underground sources, or discharges from boats or marine vessels not otherwise regulated under the National Pollutant Discharge Elimination System (NPDES) Program. Generally, any unconfined and diffuse source of contamination. Legally, any source of water pollution that does not meet the legal definition of “point source” in section 502(14) of the Clean Water Act.
Pathogen: Disease-causing microorganisms such as bacteria, protozoa, viruses.
Point source: Sources of pollution that discharge at a specific location from pipes, outfalls, and conveyance channels to a surface water. Examples of point source discharges include municipal wastewater treatment plants, municipal stormwater systems, industrial waste treatment facilities, and construction sites that clear more than five acres of land.
Pollution: Such contamination, or other alteration of the physical, chemical, or biological properties, of any waters of the state. This includes change in temperature, taste, color, turbidity, or odor of the waters. It also includes discharge of any liquid, gaseous, solid, radioactive, or other substance into any waters of the state. This definition assumes that these changes will, or are likely to, create a nuisance or render such waters harmful, detrimental, or injurious to (1) public health, safety, or welfare, or (2) domestic, commercial, industrial, agricultural, recreational, or other legitimate beneficial uses, or (3) livestock, wild animals, birds, fish, or other aquatic life.
Primary contact recreation: Activities where a person would have direct contact with water to the point of complete submergence including, but not limited to, skin diving, swimming, and water skiing.
Salmonid: Any fish that belong to the family Salmonidae. Basically, any species of salmon, trout, or char. www.fws.gov/le/ImpExp/FactSheetSalmonids.htm
Stormwater: The portion of precipitation that does not naturally percolate into the ground or evaporate but instead runs off roads, pavement, and roofs during rainfall or snow melt.
Page 57
Stormwater can also come from hard or saturated grass surfaces such as lawns, pastures, playfields, and from gravel roads and parking lots.
Total Maximum Daily Load (TMDL): A distribution of a substance in a waterbody designed to protect it from exceeding water quality standards. A TMDL is equal to the sum of all of the following: (1) individual wasteload allocations for point sources, (2) the load allocations for nonpoint sources, (3) the contribution of natural sources, and (4) a Margin of Safety to allow for uncertainty in the wasteload determination. A reserve for future growth is also generally provided.
Wasteload allocation: The portion of a receiving water’s loading capacity allocated to existing or future point sources of pollution. Wasteload allocation constitutes one type of water quality-based effluent limitation.
Watershed: A drainage area or basin in which all land and water areas drain or flow toward a central collector such as a stream, river, or lake at a lower elevation.
Water year: October 1 through September 30. For example, WY07 is October 1, 2006 through September 30, 2007.
Acronyms and Abbreviations Following are acronyms and abbreviations used frequently in this report.
cfs Cubic feet per second DOH Washington State Department of Health Ecology Washington State Department of Ecology EPA U.S. Environmental Protection Agency FC Fecal coliform bacteria MLR Multiple linear regression NSSP National Shellfish Sanitation Program RCW Revised Code of Washington RM River mile TMDL Total Maximum Daily Load (water cleanup plan) TWG Targeted Watershed Grant WAC Washington Administrative Code WQS Water Quality Standards WRIA Water Resources Inventory Area

Page 58
This page is purposely left blank
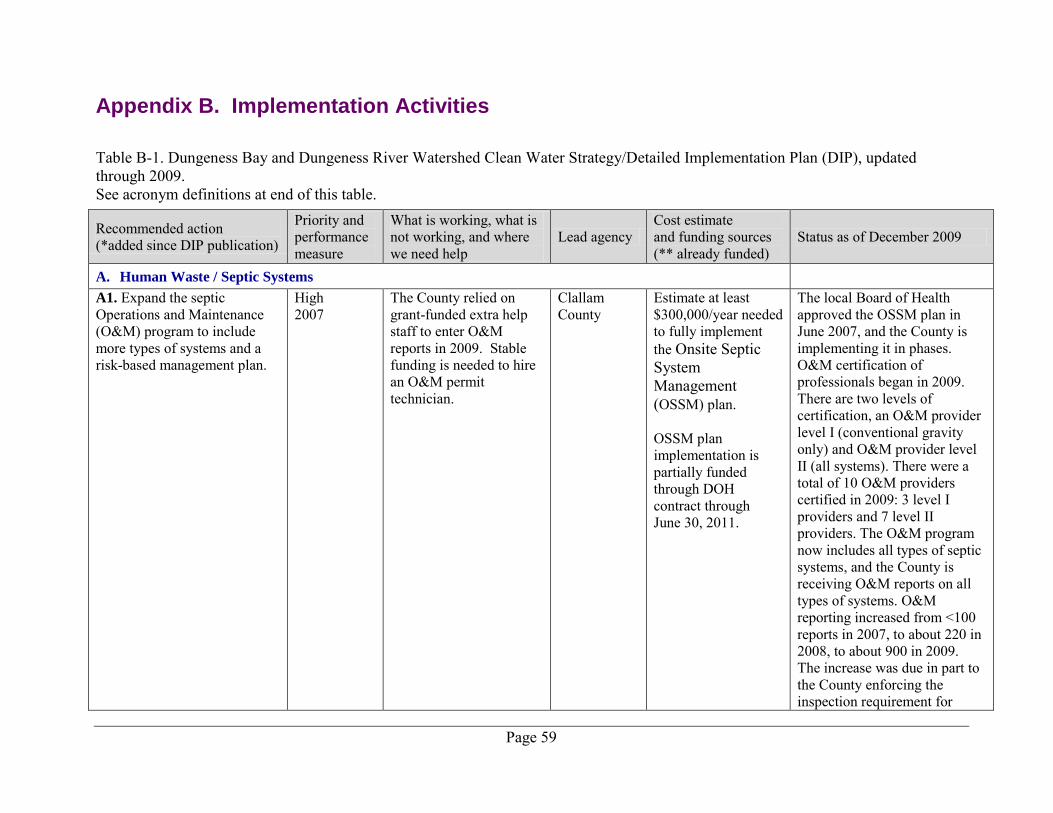
Page 59
Appendix B. Implementation Activities Table B-1. Dungeness Bay and Dungeness River Watershed Clean Water Strategy/Detailed Implementation Plan (DIP), updated through 2009. See acronym definitions at end of this table.
Recommended action (*added since DIP publication)
Priority and performance measure
What is working, what is not working, and where we need help
Lead agency Cost estimate and funding sources (** already funded)
Status as of December 2009
A. Human Waste / Septic Systems
A1. Expand the septic Operations and Maintenance (O&M) program to include more types of systems and a risk-based management plan.
High 2007
The County relied on grant-funded extra help staff to enter O&M reports in 2009. Stable funding is needed to hire an O&M permit technician.
Clallam County
Estimate at least $300,000/year needed to fully implement the Onsite Septic System Management (OSSM) plan. OSSM plan implementation is partially funded through DOH contract through June 30, 2011.
The local Board of Health approved the OSSM plan in June 2007, and the County is implementing it in phases. O&M certification of professionals began in 2009. There are two levels of certification, an O&M provider level I (conventional gravity only) and O&M provider level II (all systems). There were a total of 10 O&M providers certified in 2009: 3 level I providers and 7 level II providers. The O&M program now includes all types of septic systems, and the County is receiving O&M reports on all types of systems. O&M reporting increased from <100 reports in 2007, to about 220 in 2008, to about 900 in 2009. The increase was due in part to the County enforcing the inspection requirement for
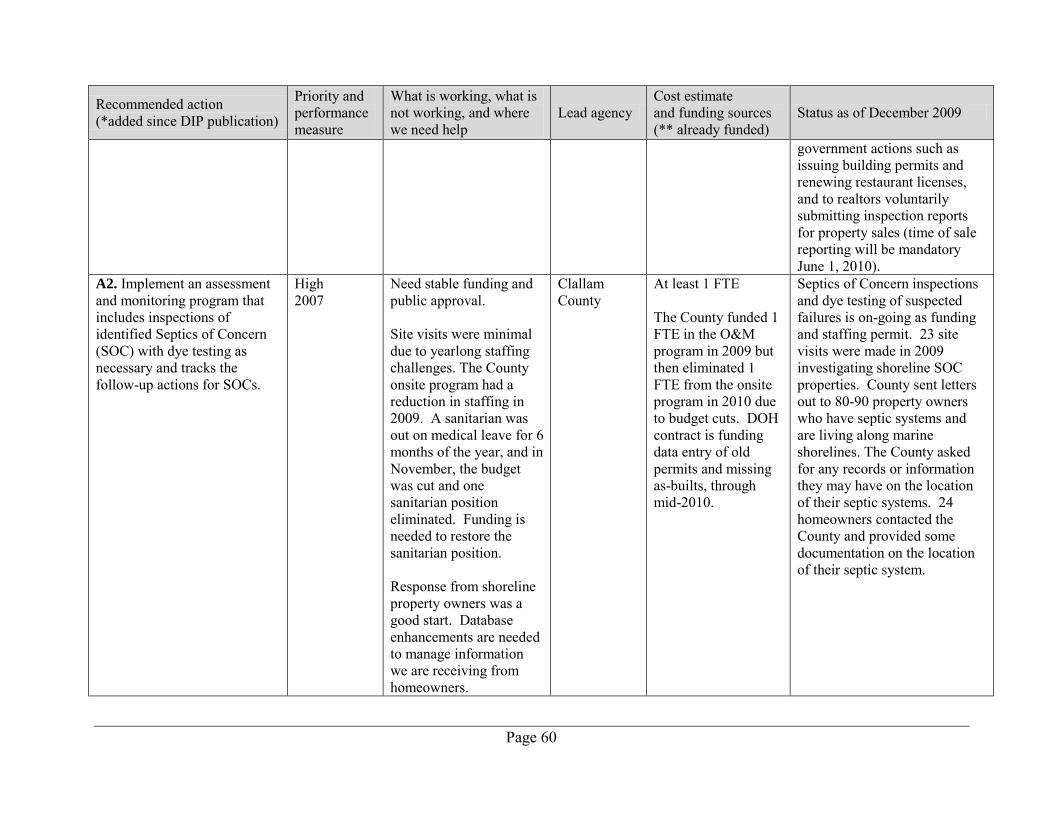
Page 60
Recommended action (*added since DIP publication)
Priority and performance measure
What is working, what is not working, and where we need help
Lead agency Cost estimate and funding sources (** already funded)
Status as of December 2009
government actions such as issuing building permits and renewing restaurant licenses, and to realtors voluntarily submitting inspection reports for property sales (time of sale reporting will be mandatory June 1, 2010).
A2. Implement an assessment and monitoring program that includes inspections of identified Septics of Concern (SOC) with dye testing as necessary and tracks the follow-up actions for SOCs.
High 2007
Need stable funding and public approval. Site visits were minimal due to yearlong staffing challenges. The County onsite program had a reduction in staffing in 2009. A sanitarian was out on medical leave for 6 months of the year, and in November, the budget was cut and one sanitarian position eliminated. Funding is needed to restore the sanitarian position. Response from shoreline property owners was a good start. Database enhancements are needed to manage information we are receiving from homeowners.
Clallam County
At least 1 FTE The County funded 1 FTE in the O&M program in 2009 but then eliminated 1 FTE from the onsite program in 2010 due to budget cuts. DOH contract is funding data entry of old permits and missing as-builts, through mid-2010.
Septics of Concern inspections and dye testing of suspected failures is on-going as funding and staffing permit. 23 site visits were made in 2009 investigating shoreline SOC properties. County sent letters out to 80-90 property owners who have septic systems and are living along marine shorelines. The County asked for any records or information they may have on the location of their septic systems. 24 homeowners contacted the County and provided some documentation on the location of their septic system.
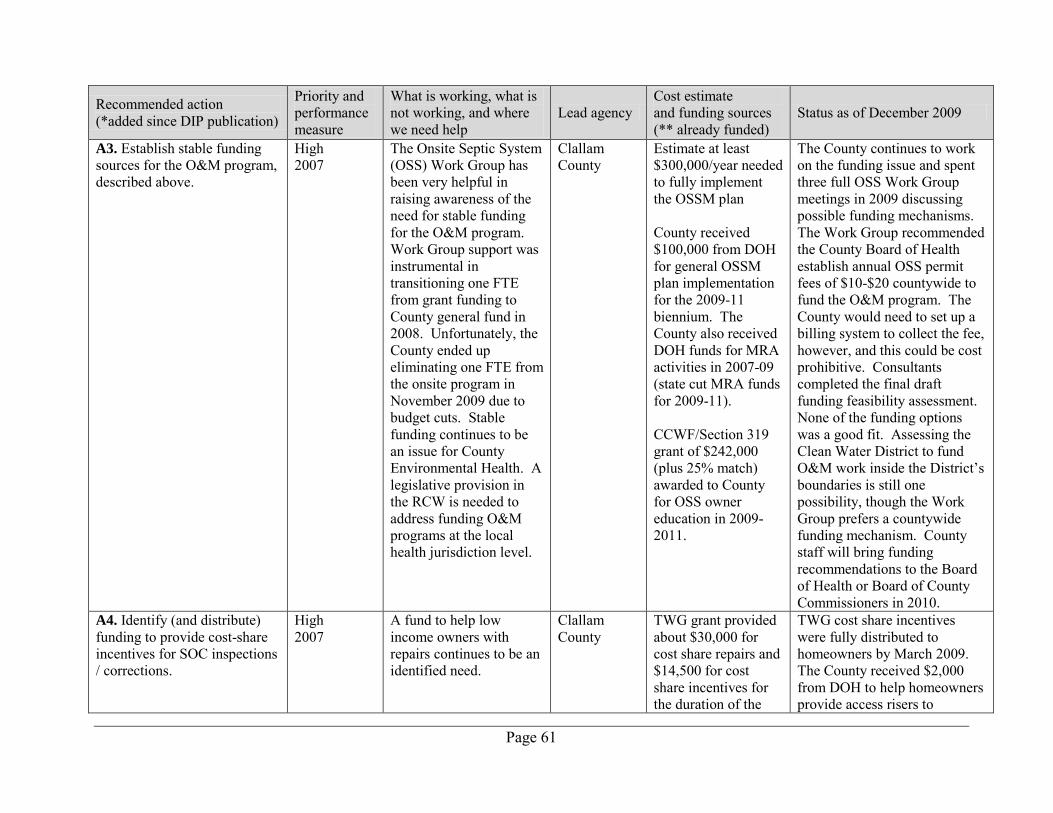
Page 61
Recommended action (*added since DIP publication)
Priority and performance measure
What is working, what is not working, and where we need help
Lead agency Cost estimate and funding sources (** already funded)
Status as of December 2009
A3. Establish stable funding sources for the O&M program, described above.
High 2007
The Onsite Septic System (OSS) Work Group has been very helpful in raising awareness of the need for stable funding for the O&M program. Work Group support was instrumental in transitioning one FTE from grant funding to County general fund in 2008. Unfortunately, the County ended up eliminating one FTE from the onsite program in November 2009 due to budget cuts. Stable funding continues to be an issue for County Environmental Health. A legislative provision in the RCW is needed to address funding O&M programs at the local health jurisdiction level.
Clallam County
Estimate at least $300,000/year needed to fully implement the OSSM plan County received $100,000 from DOH for general OSSM plan implementation for the 2009-11 biennium. The County also received DOH funds for MRA activities in 2007-09 (state cut MRA funds for 2009-11). CCWF/Section 319 grant of $242,000 (plus 25% match) awarded to County for OSS owner education in 2009-2011.
The County continues to work on the funding issue and spent three full OSS Work Group meetings in 2009 discussing possible funding mechanisms. The Work Group recommended the County Board of Health establish annual OSS permit fees of $10-$20 countywide to fund the O&M program. The County would need to set up a billing system to collect the fee, however, and this could be cost prohibitive. Consultants completed the final draft funding feasibility assessment. None of the funding options was a good fit. Assessing the Clean Water District to fund O&M work inside the District’s boundaries is still one possibility, though the Work Group prefers a countywide funding mechanism. County staff will bring funding recommendations to the Board of Health or Board of County Commissioners in 2010.
A4. Identify (and distribute) funding to provide cost-share incentives for SOC inspections / corrections.
High 2007
A fund to help low income owners with repairs continues to be an identified need.
Clallam County
TWG grant provided about $30,000 for cost share repairs and $14,500 for cost share incentives for the duration of the
TWG cost share incentives were fully distributed to homeowners by March 2009. The County received $2,000 from DOH to help homeowners provide access risers to
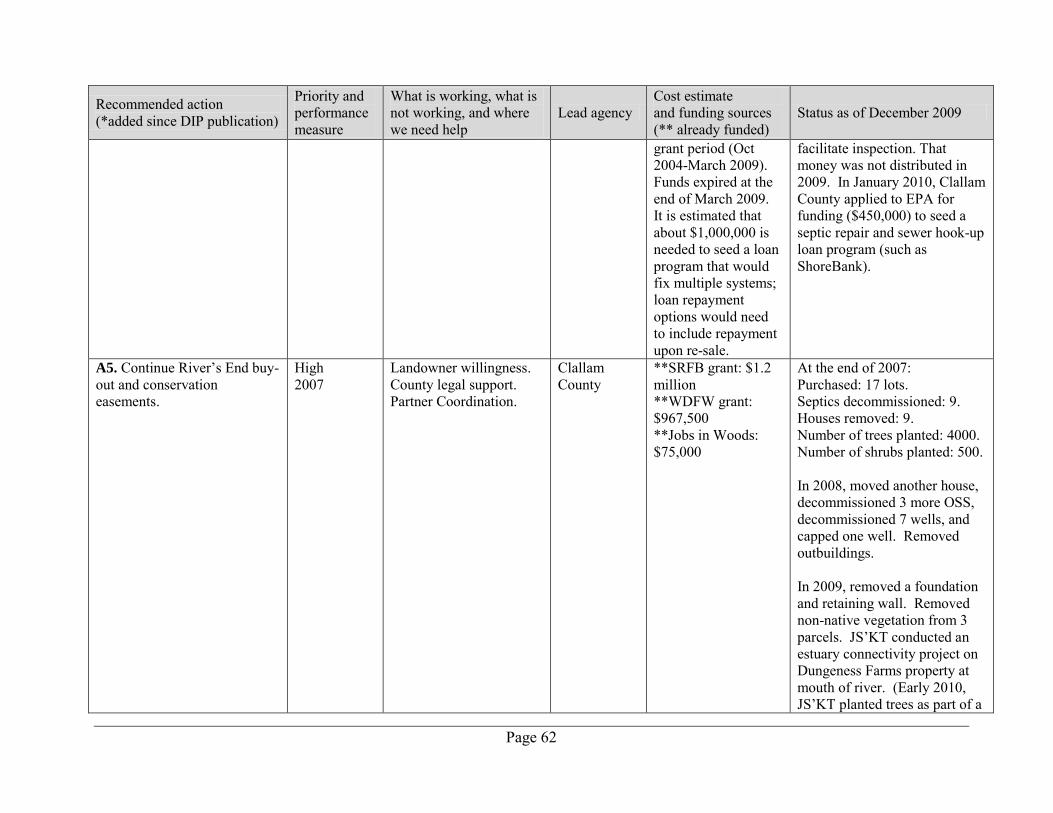
Page 62
Recommended action (*added since DIP publication)
Priority and performance measure
What is working, what is not working, and where we need help
Lead agency Cost estimate and funding sources (** already funded)
Status as of December 2009
grant period (Oct 2004-March 2009). Funds expired at the end of March 2009. It is estimated that about $1,000,000 is needed to seed a loan program that would fix multiple systems; loan repayment options would need to include repayment upon re-sale.
facilitate inspection. That money was not distributed in 2009. In January 2010, Clallam County applied to EPA for funding ($450,000) to seed a septic repair and sewer hook-up loan program (such as ShoreBank).
A5. Continue River’s End buy-out and conservation easements.
High 2007
Landowner willingness. County legal support. Partner Coordination.
Clallam County
**SRFB grant: $1.2 million **WDFW grant: $967,500 **Jobs in Woods: $75,000
At the end of 2007: Purchased: 17 lots. Septics decommissioned: 9. Houses removed: 9. Number of trees planted: 4000. Number of shrubs planted: 500. In 2008, moved another house, decommissioned 3 more OSS, decommissioned 7 wells, and capped one well. Removed outbuildings. In 2009, removed a foundation and retaining wall. Removed non-native vegetation from 3 parcels. JS’KT conducted an estuary connectivity project on Dungeness Farms property at mouth of river. (Early 2010, JS’KT planted trees as part of a
Page 63
Recommended action (*added since DIP publication)
Priority and performance measure
What is working, what is not working, and where we need help
Lead agency Cost estimate and funding sources (** already funded)
Status as of December 2009
restoration project on the large WDFW parcel.) Acquisition and decommissioning project considered complete unless willing sellers identified before funds run out.
A6. Convert on-site to sewer or community systems where appropriate (3 Crab/Golden Sands area, Carlsborg): 1) Carlsborg UGA Sewer and Water Reuse.
Medium 2009
Need public approval, faster review and feedback from all approving agencies, and infrastructure funding.
City of Sequim, Clallam County Clallam County (partnering with PUD)
**a) Clallam County received a $35,000 grant from CTED, Clallam County provided an additional $35,000, and Clallam County PUD provided $72,000 for the Carlsborg UGA. **b) Clallam County received a $75,000 grant from CTED. Clallam County is continuing its partnership with PUD. The PUD received funding from Ecology’s Reclaimed Water Fund of $74,500 for their share of the
a) Clallam County and Clallam County PUD jointly hired a consultant for a feasibility study for sewering the Carlsborg UGA. Carlsborg Sewer Feasibility Study started in September 2006 and was completed in August 2007. b) CTED grant assisted implementation of the recommendations in the 2007 Carlsborg Sewer Feasibility Study. Funds were used for evaluating and developing zoning alternatives for the Carlsborg UGA, based on sewer service and reclaimed water. The grant partially funded a pre-draft combined facilities/general sewer plan. A
Page 64
Recommended action (*added since DIP publication)
Priority and performance measure
What is working, what is not working, and where we need help
Lead agency Cost estimate and funding sources (** already funded)
Status as of December 2009
2) Three Crab/Golden Sands area assessment.
Feasibility study needed re: cluster septic or community sewer alternatives.
Clallam County (or a sewer utility)
facilities/general sewer plan. **c) Clallam County providing $220,000 in 2009 and 2010 to pay for hydrogeologic, biologic, and cultural resource assessments and NEPA/SEPA needed to complete the pre-draft facilities plan. Need ~$15,000,000 for construction. $100,000 for feasibility study (need grant).
consultant was hired, and the pre-draft facilities plan was completed in April 2009. c) Completion of facilities plan requires hydrogeologic, biologic, and cultural resource assessments and NEPA/SEPA. Completion anticipated by June 2010. Conservation District completed Three Crabs Area Assessment in spring 2009. In December 2009, Clallam County applied for CCWF grant ($105,000) for outreach, education, and feasibility study.
A7. Outreach and Education Septic 101 (basic septic maintenance class) & individual owner education.
High 2007
Since the beginning of Septics 101 in 2000, 106 workshops have been held, reaching over 2,800 owners. The classes in 2009 continued to be a huge success, and interest increased due to an
Clallam County
**$500 per Septics 101 class funded through mid 2010 Funded by DOH, funds for OSSM plan implementation and the County’s new
Monthly Septic 101 workshops are ongoing. Septic 101 total attendance for 2009 was 277, with an average of 25 people per class (11 classes held). Interest in Septic 101 increased significantly in the summer when we introduced it as a
Page 65
Recommended action (*added since DIP publication)
Priority and performance measure
What is working, what is not working, and where we need help
Lead agency Cost estimate and funding sources (** already funded)
Status as of December 2009
increase in outreach to the community. In 2009, the county used grant funding to send out a quarterly newsletter about septic systems maintenance and new inspection regulations. It is the “Septics Edition” of the Clean Water Herald and is being sent countywide to septic system owners. The first newsletter sent in September 2009 introduced the new regulations to septic system owners and had a big impact. The County was overwhelmed with callers wanting to know about the regulations and how to become certified to perform their own inspections. There were over 400 phone calls and at least 200 voice mails to return. The main phone line was the number given in the newsletter and that tied up our phones for several days. Lesson learned was to assign an unused number
CCWF/Section 319 grant for homeowner education ($242,000 plus 25% match for OSS inspection training pilot project, Septics 101 workshops, and newsletter).
requirement for homeowner training. Average attendance for the class went from 10 pp for each class through the end of June, to an average of 34 pp per class by the end of December. The increase in attendance is directly related to the increased awareness of new regulations and interest in the homeowner DIY inspection training. JS’KT: Developed and distributed a market-based septic brochure to homeowners. The brochure includes an estimated cost comparison between sewer and septic systems and other important septic system information.
Page 66
Recommended action (*added since DIP publication)
Priority and performance measure
What is working, what is not working, and where we need help
Lead agency Cost estimate and funding sources (** already funded)
Status as of December 2009
for Septic 101 registration, not the main phone line! Due to the overwhelming response, the county added 5 more classes in early 2010 to try to fill the demand. There are some people expressing frustration with the new regulations at the Septic 101 workshop but once the class is finished, many people are appreciative and more understanding of why the requirement is in place. JS’KT: The JS’KT brochure seemed to generate homeowner interest in obtaining further information from the County. Emphasis on money saved in the prevention of septic failures and the need for septic replacement by way of routine septic inspection and maintenance was one of the key messages.
Page 67
Recommended action (*added since DIP publication)
Priority and performance measure
What is working, what is not working, and where we need help
Lead agency Cost estimate and funding sources (** already funded)
Status as of December 2009
B. Stormwater
Other actions related to stormwater are listed in regulatory/policy and monitoring/research sections.
B1. Signs on street drains and ditches about pollution effects.
Low 2012
School volunteers? These only last about a year, so a regular commitment is needed from teachers, and classroom instruction should be included.
Not determined
Cost for paint and gloves
B2. Provide treatment for ditch tailwaters.
High 2007
Constructed wetlands / biofiltration appear to be the best option.
Clallam Conservation District (CCD; partnering with Clallam County)
Estimate for Marine Drive: Has been estimated at $80,000 for wetland construction, design /engineering and land purchase – but actual cost is unknown. County received Local Government Stormwater Grant from Ecology to partially fund the biofiltration project, but the grant is no longer available for this project.
Six ditches were identified in the TMDL as conveying problematic stormwater straight to the bay. Five of those have been piped, eliminating the tailwater. However, ditches continue to convey stormwater in the winter. County was to partner with the Conservation District on a biofiltration swale in the Marine Drive/Cline Spit area. The Conservation District designed a biofiltration swale for one ditch that continues to convey stormwater. However, the landowner would not grant an easement for Clallam County to maintain and repair the bioretention swale as needed so the project was ended. Monies from the Local Gov’t Grant were used for Certified Erosion and Sediment Control Lead (CESCL) training
Page 68
Recommended action (*added since DIP publication)
Priority and performance measure
What is working, what is not working, and where we need help
Lead agency Cost estimate and funding sources (** already funded)
Status as of December 2009
of County employees. B3. Continue piping of irrigation ditches, using CCD’s prioritization of ditches based on bacterial monitoring.
High 2007
Almost finished piping feasible ditches.
CCD Existing funds will address all but one of the high-priority ditches that can be piped.
The Clallam-Cline piping project, which resulted in the elimination of several irrigation tailwater ditch discharges to Dungeness Bay, is complete except for one short but expensive lateral along West Anderson Road. Funding is insufficient to complete this lateral. Portions of the Dungeness Irrigation District main canal, which discharges tailwater into Meadowbrook Creek, were piped in early spring 2009, addressing some known pollutant sources but not eliminating tailwater discharges.
B4. Outreach to Ditch Residents 1. Revise, print and distribute
brochure: “Living on an Irrigation Ditch.”
2. Webpage for Water Users Assoc.
Medium 2009
Need staff and funding. Sequim-Dungeness Water Users Association
1. $6,000 2. $8,000
B5. Develop/implement a Sub-Basin Stormwater Management Plan for the Marine Drive and Three Crabs area that includes recommendations for capital facilities, retrofits, standards for new development, and
High 2007
Need funding (for Marine Dr. can use Clallam Conservation District’s analysis of stormwater and ditches as basis for the monitoring plan)
CCD Clallam County
**Development: $25,000 - $75,000 Implementation costs can’t be figured until after development of the sub-basin plan.
CCD received a grant to assess options and develop a plan for Three Crabs area. The Three Crabs Area Assessment was completed in the spring of 2009.
Page 69
Recommended action (*added since DIP publication)
Priority and performance measure
What is working, what is not working, and where we need help
Lead agency Cost estimate and funding sources (** already funded)
Status as of December 2009
basic BMPs based on soil characteristics, topography, and development patterns. *B6. Develop a Small Project Stormwater Management Manual.
Not in the original DIP.
Need staff time, public approval, and technical assistance.
Clallam County and CCD
**Funding primarily through CCD and EPA grant. Clallam County also providing some funding.
CCD completed a draft Small Project Stormwater Management Manual in summer 2007. The objective is to provide stormwater BMPs and site plans that can be used by homeowners without having to hire an engineer. County and CCD discussed the manual at the Clallam County Planning Commission and the Clallam County Permit Advisory Board in 2008. County is currently reviewing manual. It will also be reviewed as part of the Comprehensive Stormwater Management Plan for the County. Landowner workshops anticipated for 2010 or 2011 as part of the EPA grant.
B7. Investigate BMPs for stormwater management specific to local conditions; compile them in a publication.
High 2007
Need funding CCD/Clallam County/ JS’KT
Cost not determined. Possibly Conservation Assessment Fee or grant funding.
Obtained consultation from PSAT LID Local Regulation Assistance Project in 2006. CCD completed a draft stormwater manual in summer 2007 for rural residential stormwater management. The manual includes stormwater BMPs designed for local conditions. CCD is working
Page 70
Recommended action (*added since DIP publication)
Priority and performance measure
What is working, what is not working, and where we need help
Lead agency Cost estimate and funding sources (** already funded)
Status as of December 2009
with County to investigate ways to permit and encourage LID. CCD completed a demonstration project with Sequim School District on alternative stormwater management. JS’KT created a rain garden (BMPs) in Sequim Bay Watershed to reduce stormwater runoff and pollution (2007). County in partnership with JS’KT will evaluate some BMPs for stormwater quality as part of the EPA West Coast Estuaries Initiative Grant for Collaborative Stormwater Management for Sequim– Dungeness Watershed.
B8. Consider comprehensive stormwater planning for sub-areas within the Clean Water District.
Low 2012
Need funding and staff time.
Clallam County/ JS’KT/CCD
The County estimates spending ~$75,000 on convening a stakeholder workgroup and developing a comprehensive stormwater management strategy.
Developing a countywide comprehensive stormwater strategy is a work element of an EPA West Coast Estuaries Initiative Grant to Clallam County (2008-2011). Basin planning is intended as needed.
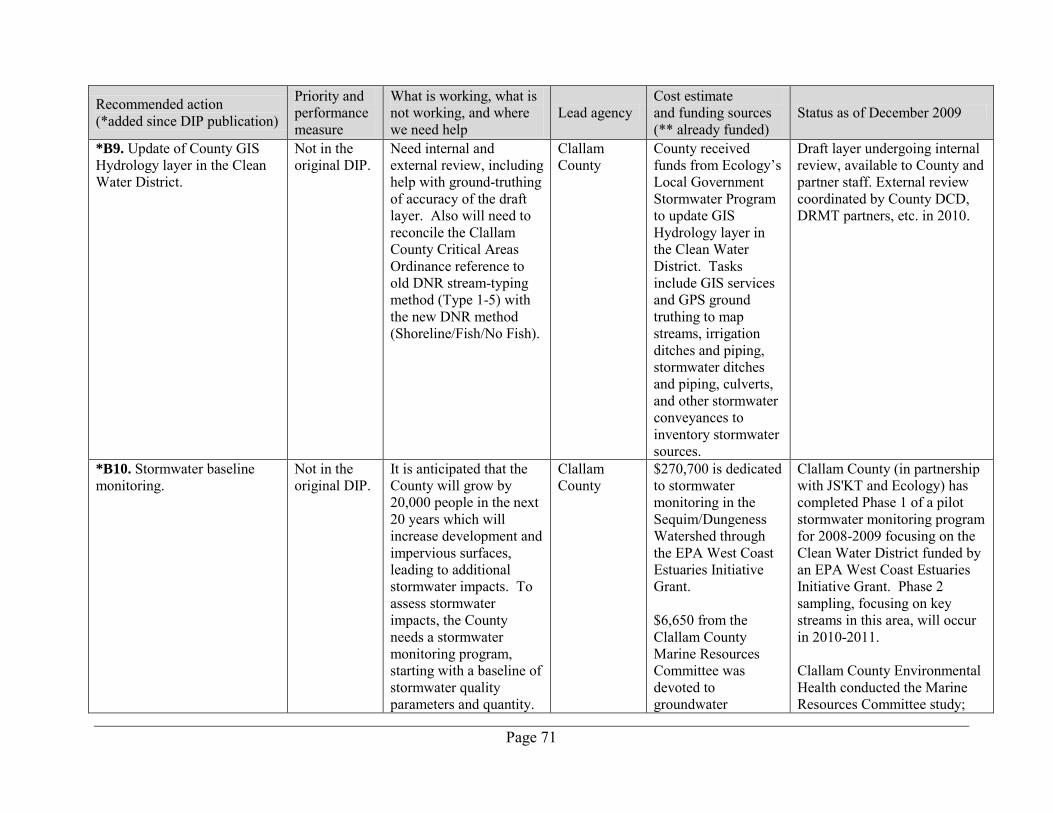
Page 71
Recommended action (*added since DIP publication)
Priority and performance measure
What is working, what is not working, and where we need help
Lead agency Cost estimate and funding sources (** already funded)
Status as of December 2009
*B9. Update of County GIS Hydrology layer in the Clean Water District.
Not in the original DIP.
Need internal and external review, including help with ground-truthing of accuracy of the draft layer. Also will need to reconcile the Clallam County Critical Areas Ordinance reference to old DNR stream-typing method (Type 1-5) with the new DNR method (Shoreline/Fish/No Fish).
Clallam County
County received funds from Ecology’s Local Government Stormwater Program to update GIS Hydrology layer in the Clean Water District. Tasks include GIS services and GPS ground truthing to map streams, irrigation ditches and piping, stormwater ditches and piping, culverts, and other stormwater conveyances to inventory stormwater sources.
Draft layer undergoing internal review, available to County and partner staff. External review coordinated by County DCD, DRMT partners, etc. in 2010.
*B10. Stormwater baseline monitoring.
Not in the original DIP.
It is anticipated that the County will grow by 20,000 people in the next 20 years which will increase development and impervious surfaces, leading to additional stormwater impacts. To assess stormwater impacts, the County needs a stormwater monitoring program, starting with a baseline of stormwater quality parameters and quantity.
Clallam County
$270,700 is dedicated to stormwater monitoring in the Sequim/Dungeness Watershed through the EPA West Coast Estuaries Initiative Grant. $6,650 from the Clallam County Marine Resources Committee was devoted to groundwater
Clallam County (in partnership with JS'KT and Ecology) has completed Phase 1 of a pilot stormwater monitoring program for 2008-2009 focusing on the Clean Water District funded by an EPA West Coast Estuaries Initiative Grant. Phase 2 sampling, focusing on key streams in this area, will occur in 2010-2011. Clallam County Environmental Health conducted the Marine Resources Committee study;
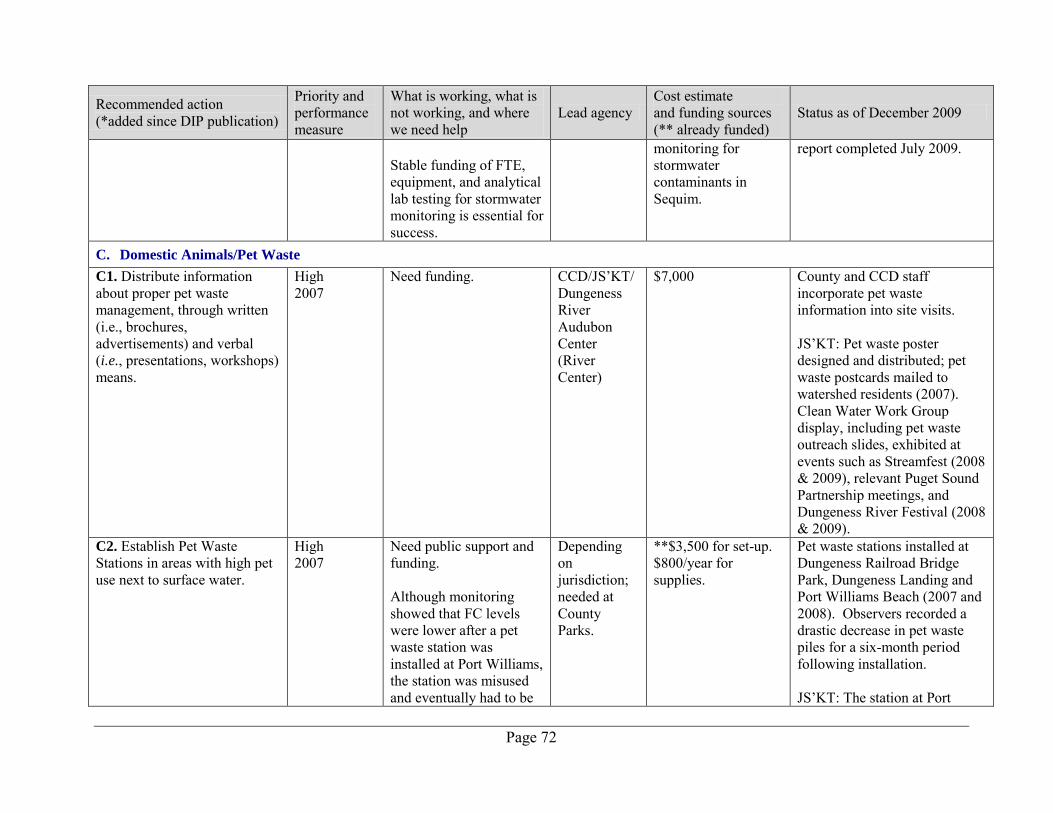
Page 72
Recommended action (*added since DIP publication)
Priority and performance measure
What is working, what is not working, and where we need help
Lead agency Cost estimate and funding sources (** already funded)
Status as of December 2009
Stable funding of FTE, equipment, and analytical lab testing for stormwater monitoring is essential for success.
monitoring for stormwater contaminants in Sequim.
report completed July 2009.
C. Domestic Animals/Pet Waste
C1. Distribute information about proper pet waste management, through written (i.e., brochures, advertisements) and verbal (i.e., presentations, workshops) means.
High 2007
Need funding. CCD/JS’KT/ Dungeness River Audubon Center (River Center)
$7,000 County and CCD staff incorporate pet waste information into site visits. JS’KT: Pet waste poster designed and distributed; pet waste postcards mailed to watershed residents (2007). Clean Water Work Group display, including pet waste outreach slides, exhibited at events such as Streamfest (2008 & 2009), relevant Puget Sound Partnership meetings, and Dungeness River Festival (2008 & 2009).
C2. Establish Pet Waste Stations in areas with high pet use next to surface water.
High 2007
Need public support and funding. Although monitoring showed that FC levels were lower after a pet waste station was installed at Port Williams, the station was misused and eventually had to be
Depending on jurisdiction; needed at County Parks.
**$3,500 for set-up. $800/year for supplies.
Pet waste stations installed at Dungeness Railroad Bridge Park, Dungeness Landing and Port Williams Beach (2007 and 2008). Observers recorded a drastic decrease in pet waste piles for a six-month period following installation. JS’KT: The station at Port
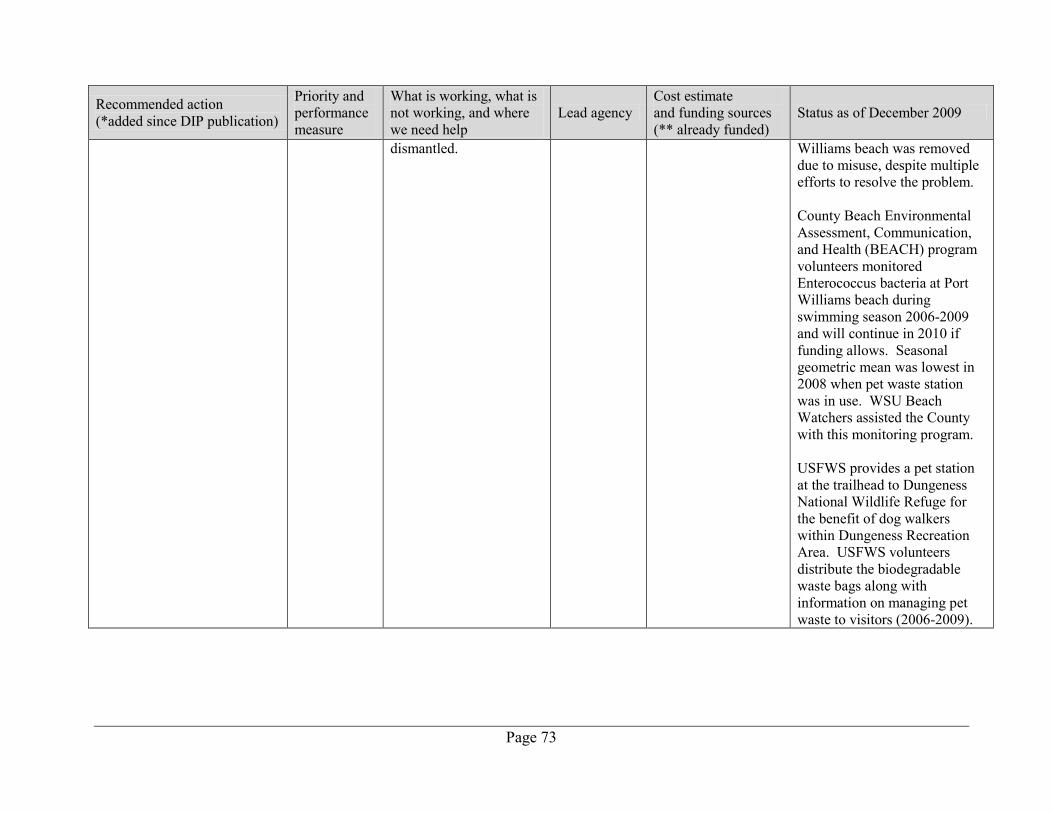
Page 73
Recommended action (*added since DIP publication)
Priority and performance measure
What is working, what is not working, and where we need help
Lead agency Cost estimate and funding sources (** already funded)
Status as of December 2009
dismantled. Williams beach was removed due to misuse, despite multiple efforts to resolve the problem. County Beach Environmental Assessment, Communication, and Health (BEACH) program volunteers monitored Enterococcus bacteria at Port Williams beach during swimming season 2006-2009 and will continue in 2010 if funding allows. Seasonal geometric mean was lowest in 2008 when pet waste station was in use. WSU Beach Watchers assisted the County with this monitoring program. USFWS provides a pet station at the trailhead to Dungeness National Wildlife Refuge for the benefit of dog walkers within Dungeness Recreation Area. USFWS volunteers distribute the biodegradable waste bags along with information on managing pet waste to visitors (2006-2009).
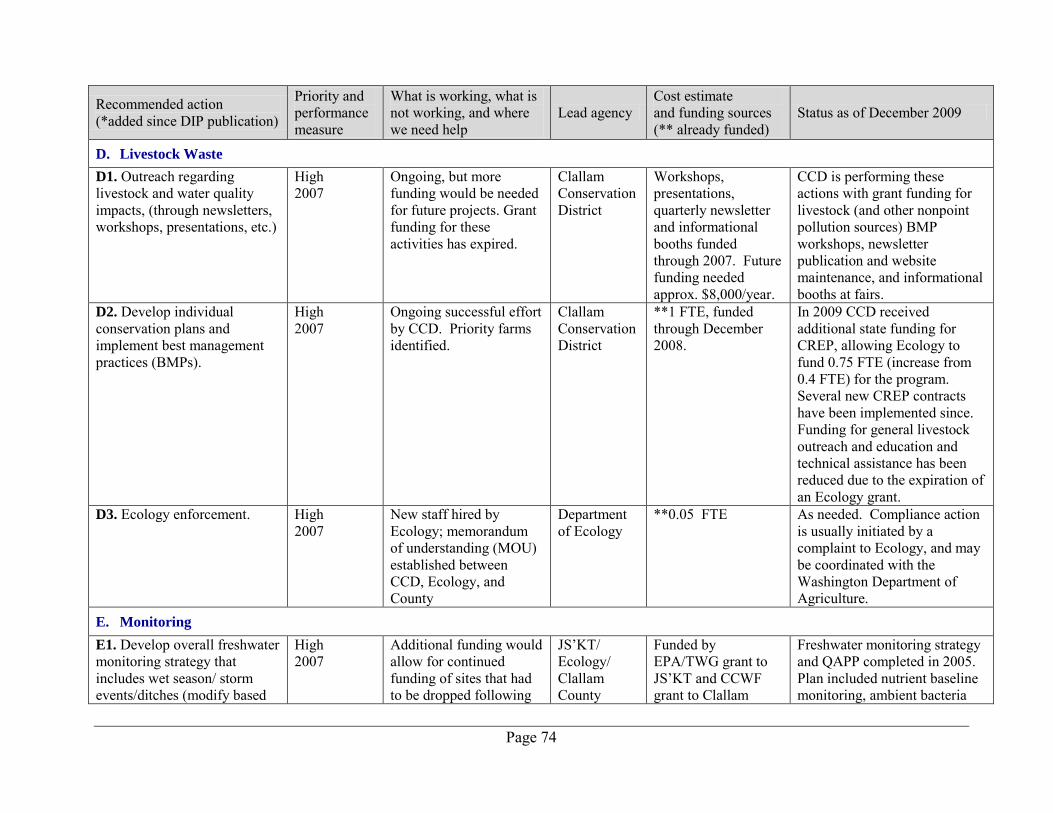
Page 74
Recommended action (*added since DIP publication)
Priority and performance measure
What is working, what is not working, and where we need help
Lead agency Cost estimate and funding sources (** already funded)
Status as of December 2009
D. Livestock Waste
D1. Outreach regarding livestock and water quality impacts, (through newsletters, workshops, presentations, etc.)
High 2007
Ongoing, but more funding would be needed for future projects. Grant funding for these activities has expired.
Clallam Conservation District
Workshops, presentations, quarterly newsletter and informational booths funded through 2007. Future funding needed approx. $8,000/year.
CCD is performing these actions with grant funding for livestock (and other nonpoint pollution sources) BMP workshops, newsletter publication and website maintenance, and informational booths at fairs.
D2. Develop individual conservation plans and implement best management practices (BMPs).
High 2007
Ongoing successful effort by CCD. Priority farms identified.
Clallam Conservation District
**1 FTE, funded through December 2008.
In 2009 CCD received additional state funding for CREP, allowing Ecology to fund 0.75 FTE (increase from 0.4 FTE) for the program. Several new CREP contracts have been implemented since. Funding for general livestock outreach and education and technical assistance has been reduced due to the expiration of an Ecology grant.
D3. Ecology enforcement. High 2007
New staff hired by Ecology; memorandum of understanding (MOU) established between CCD, Ecology, and County
Department of Ecology
**0.05 FTE As needed. Compliance action is usually initiated by a complaint to Ecology, and may be coordinated with the Washington Department of Agriculture.
E. Monitoring
E1. Develop overall freshwater monitoring strategy that includes wet season/ storm events/ditches (modify based
High 2007
Additional funding would allow for continued funding of sites that had to be dropped following
JS’KT/ Ecology/ Clallam County
Funded by EPA/TWG grant to JS’KT and CCWF grant to Clallam
Freshwater monitoring strategy and QAPP completed in 2005. Plan included nutrient baseline monitoring, ambient bacteria
Page 75
Recommended action (*added since DIP publication)
Priority and performance measure
What is working, what is not working, and where we need help
Lead agency Cost estimate and funding sources (** already funded)
Status as of December 2009
on research) and continues source identification as well as initiates effectiveness monitoring. *Stormwater baseline monitoring. *TMDL effectiveness monitoring study.
the EPA/TWG grant. County and JS’KT partner Department of Ecology
County ~$270,700 as discussed under stormwater monitoring through funding from the EPA West Coast Estuaries Initiative Grant. **Ecology funded
monitoring, and BMP effectiveness monitoring. Bacteria and nutrient monitoring program implemented Aug. 2005-Jan. 2008 with limited sampling through Aug. 2008. JS’KT: Following the EPA/ TWG project (September 2009), water quality partners decided to continue long-term sampling at specific sites on a quarterly basis. Additional spot sampling will be performed in response to suspected FC sources (2009). Sampling of stormwater in streams and ditches has been performed as part of the County’s EPA West Coast Estuaries Initiative Grant. Ecology effectiveness monitoring QAPP finalized Feb. 2009. The study design includes sample collection to address data gaps and analysis of existing data.
Page 76
Recommended action (*added since DIP publication)
Priority and performance measure
What is working, what is not working, and where we need help
Lead agency Cost estimate and funding sources (** already funded)
Status as of December 2009
E2. Implement freshwater quality monitoring and BMP effectiveness monitoring. *TMDL effectiveness monitoring study.
High 2007
According to the Effectiveness Monitoring Report (Battelle, 2009), the effectiveness of BMPs (specifically ditch piping and septic repairs) was difficult to evaluate given the complexities involved (including stormwater ditches, proximity of monitoring sites, etc.)
Clallam County/ JS’KT/CCD Department of Ecology
**$30,000/year funded by Ecology Grant and EPA Grant **Ecology funded
JS’KT: TWG Effectiveness Monitoring Study completed in September 2009. Implementing recommendation to modify monitoring strategy to include both a long-term monitoring dataset as well as spot monitoring for evaluative purposes (2009). Ecology completed one-year TMDL effectiveness monitoring in fall 2009.
E3. Continue marine monitoring in Dungeness Bay.
High 2007
Ongoing DOH/JS’KT **$700/per trip, covers travel, boat, and DOH staff time
Ongoing
E4. Perform data analysis of Dungeness area freshwater monitoring on a semi-annual or annual basis. *TMDL effectiveness monitoring study
High 2007
With additional funding, further analyses of the extensive data could be conducted.
JS’KT/ Ecology/ Clallam County (partnering with Battelle) Department of Ecology
**EPA grant **Ecology funded
JS’KT: TWG Effectiveness Monitoring Study completed September 2009. Study analyzes 10-11 years of data. Currently implementing study report recommendation to modify monitoring strategy to include both a long-term monitoring dataset as well as spot monitoring for evaluative purposes (2009). Ecology’s TMDL effectiveness monitoring report anticipated spring 2010.
Page 77
Recommended action (*added since DIP publication)
Priority and performance measure
What is working, what is not working, and where we need help
Lead agency Cost estimate and funding sources (** already funded)
Status as of December 2009
E5. Continue Streamkeeper monitoring of bacteria and baseline monitoring of streams.
Medium 2009
Better direction from the data end-users at the end of 2009 has improved this component by targeting critical sites and parameters.
Clallam County (and JS’KT partner)
Bacterial testing funded by WDFW grant through June 2009, then by County General Funds. Funding is uncertain beyond 2010, and funds are not sufficient to perform nutrient testing. $50,000 Conservation Assessment Fee could potentially be used if approved by County Commissioners.
Quarterly monitoring continued in 2009 per advisors’ recommendations, including simultaneous fecal/flow/water chemistry monitoring on Johnson and Bell Creeks. Long-term monitoring project beginning in 2010 will track fecals/flows/water chemistry in major watersheds contributing to Dungeness and Sequim Bays.
F. Research
F1. Conduct Microbial Source Tracking study in both freshwater and marine water.
High 2007
See MST Final Report: http://dungenessrivercenter.org/documents/FinalMicrobialSourceTracking_000.pdf
JS’KT/ Clallam County
**$150,000 needed for freshwater (140,000 received through EPA Grant) $150,000 received from Ecology for additional freshwater/ marine water.
JS’KT: MST Phase I (using ribotyping methodology) and Phase II (using Bacteroides
target-specific polymerase chain reaction methodology) study report, including recommendations, completed by Battelle in September 2009. Studies looked at freshwater and marine water. Battelle: Recommendation for additional MST samples taken from inner bay seeps during summer and/or high FC events.
Page 78
Recommended action (*added since DIP publication)
Priority and performance measure
What is working, what is not working, and where we need help
Lead agency Cost estimate and funding sources (** already funded)
Status as of December 2009
F2. Conduct further bay research (including basic ecological studies, nutrients and FC assessments, and wildlife usage).
Medium 2009
Need funding. Biologist position at Dungeness National Wildlife Refuge was vacant in 2008. USFWS filled the position in 2009.
US Fish & Wildlife Service; JS’KT
$200,000+ needed USFWS completed a hydrographic survey in 2007 to determine Dungeness National Wildlife Refuge's boundaries. This survey is available to assist in determining Dungeness Bay's sedimentation patterns over time. The condition of pilings was also evaluated. The Refuge has conducted wildlife surveys for many years, including mid-winter waterfowl surveys and brant counts. The Refuge participates in an early detection program for invasive green crabs. No green crabs found in 2009. Clallam Marine Resources Committee is conducting an eelgrass survey of Dungeness Bay (see recommended action under Regulatory and Policy).
F3. Conduct analysis of impervious surfaces using fieldwork/LIDAR/aerial photos/remote sensing.
Medium 2009
Funding available in 2009, but staff were not, and Ecology’s offer of partnership in 2009 has been delayed.
Clallam County/ JS’KT (with Ecology partnership)
$100,000 ~$25,000 allocated from EPA West Coast Estuaries Initiative Grant to evaluate the relationship between current land use/land cover and stormwater
County under the EPA West Coast Estuaries Initiative Grant intends to evaluate the relationship between current land use/land cover and impacts in the Sequim/Dungeness Watershed, in partnership with Ecology, in 2010.
Page 79
Recommended action (*added since DIP publication)
Priority and performance measure
What is working, what is not working, and where we need help
Lead agency Cost estimate and funding sources (** already funded)
Status as of December 2009
impacts in the Sequim/Dungeness Watershed. (Additional funding needed to cover the rest of the County.)
F4. Conduct GIS analysis to map fecal and nutrient spatial and temporal trends.
Medium 2009
See final report: http://dungenessrivercenter.org/documents/FinalMonitoringEffectivenessStudy_000.pdf Battelle: Spatial trends were analyzed using statistical tools on each tributary and reach location. Further work is needed using GIS tools.
CCD/JS’KT $10,000 for CCD $10,000 for JS’KT Battelle: estimate $30,000 to $50,000 needed to follow up on TWG work - preparation of maps with a look at buffers, land-use, hydrology, and impervious surfaces as a start for more comprehensive modeling.
JS’KT: Freshwater and marine water FC and nutrient trends were analyzed in the TWG Effectiveness Monitoring report completed September 2009. Statistical analyses looked at overall trends, in addition to creek, reach location, and timing. Battelle: recommendation for modification of future monitoring locations to allow GIS modeling approach and research to understand mechanisms causing observed data trends.
F5. Conduct comprehensive water quality studies to determine feasible remediation measures in the Meadowbrook/ Cooper sub-basins and other targeted sub-basins.
High 2007
Need funding CCD $120,000 needed for Meadowbrook/ Cooper sub-basin.
CCD received a grant to develop a comprehensive action plan for Meadowbrook, Cooper, Cassalery area. Water quality data collected through TWG monitoring was used in the assessment (completed spring 2009).

Page 80
Recommended action (*added since DIP publication)
Priority and performance measure
What is working, what is not working, and where we need help
Lead agency Cost estimate and funding sources (** already funded)
Status as of December 2009
G. Regulatory and Policy
G1. Approve and implement a comprehensive stormwater ordinance OR request stormwater sensitive area.
High 2007
Clallam County
Funding obtained from the EPA West Coast Estuaries Initiative grant for ~$72,000 to hire a consultant to provide additional resources and develop a Clearing and Grading Ordinance and Stormwater Ordinance.
Consultant hired in December 2009 with ordinances anticipated for adoption in late 2010 and 2011.
G2. Provide maps and information on sensitive areas (shellfish beds, ESA listed critical area) to county decision-makers.
Medium 2009
Information needs to be shared with the Shoreline Master Program update.
Clallam County/ Marine Resources Committee
$45,000 spent on first effort in 2008; $49,000 budget for second effort in 2009. Program came in under budget in 2009. Extra funds will be used to further analyze the video taken during the mapping effort.
Forage fish spawning areas and eelgrass areas from Freshwater bay to Dungeness Spit have been mapped. Forage fish beach seines have been conducted. Eelgrass in Dungeness Bay mapped in 2009.
G3. Provide information on low impact approaches to stormwater management in the permitting information packet.
Medium 2009
Funding/political will Clallam County
$5,000 CCD completed a draft Small Project Stormwater Management Manual in summer 2007. County is currently reviewing the manual.
G4. Conduct a comprehensive review of ordinances and make changes to encourage low impact development, and also
Medium 2009
Need staff time Clallam County/CCD/ JS’KT
$3,000 - $5,000 for staff time per partner. Clearing and Grading
Obtained consultation from PSAT LID Local Regulation Assistance Project in 2006.
Page 81
Recommended action (*added since DIP publication)
Priority and performance measure
What is working, what is not working, and where we need help
Lead agency Cost estimate and funding sources (** already funded)
Status as of December 2009
look for disincentives in the county’s permits and associated fees.
and Stormwater Ordinances to be funded by EPA West Coast Estuaries Initiative Grant.
LID will be incorporated into the Clearing and Grading and Stormwater Ordinances to be developed in 2010 and 2011.
H. General Outreach
H1. Public workshops. High 2007
Need funding and staff time, 5 per year.
River Center CCD/Clallam County/ JS’KT
For each workshop: $100-150 for room rental; $500-750 for display ads; $300 supplies; $25,000 for staff time (County, JS’KT, CCD, Ecology, River Center).
Clallam County Marine Resources Committee and Puget Sound Action Team sponsored two Marine and Estuarine Shoreline Landowner Workshops spring ’07. River Center, CCD, Clallam County, and JS’KT all contributed. In 2009 CCD conducted 15 natural landscaping workshops attended by a total of 340 watershed residents. JS’KT: Clean Water Work Group discussed organizing public workshop in 2010 to provide outreach related to completed projects. Catering workshops for specific focus groups was also discussed.
H2. Clean Water Herald or newspaper alternative.
Medium 2009
The County’s Clean Water Herald “Septics Edition” has been a huge success so far. We have reached almost 17,000 households with a septic system and have gotten
Clallam County
For newsletter: $6,000/issue. For newspaper ad: $1197 for black/white; add +$190 for full color. Need $2000 for
JS’KT: In summer 2006, produced two full-page color ads describing water quality projects and statuses. These appeared in both Sequim Gazette and Peninsula Daily News. Article on water quality
Page 82
Recommended action (*added since DIP publication)
Priority and performance measure
What is working, what is not working, and where we need help
Lead agency Cost estimate and funding sources (** already funded)
Status as of December 2009
an overwhelming response (see the Septics 101 section). Lessons learned and still learning are: Never give out the
main phone line in this type of mailing because people really do read their mail!
Have a plan in line to handle the phone calls.
Have plenty of classes scheduled in advance if possible
County addressing is never perfect; be prepared to handle problems with the addressing database.
art/editing per issue. **County’s new CCWF/Section 319 grant (2009-2011) includes funding for quarterly newsletters about OSS maintenance and water quality information
projects appeared in Living on the Peninsula Magazine. Produced two additional color-news advertisements in February and July 2009 providing updates and outcomes on TWG projects. Ads appeared in both Peninsula Daily News and Sequim Gazette. Clallam County produced a Clean Water Herald “Septic System” newsletter as part of a CCWF/Section 319 grant. The newsletter is mailed out on a quarterly basis to property owners on a septic system. Two newsletters were mailed out in 2009: one in September and one in December.
H3. Sequim 7th grade field trip. High 2007 JS’KT staff time is currently funded by EPA/ GAP grant.
River Center $12,000 Field trips through 2009 will be funded by a NOAA grant.
Partners including JS’KT and County completed programs through 2009. Future field trips will be contingent upon funding.
H4. Presentations to local community groups.
Medium 2009
Need staff time Variety Variable JS’KT: TWG project updates were provided at DRMT and Clean Water Work Group meetings. A final site visit was provided to Clean Water Work Group and EPA in September (2009).
Page 83
Recommended action (*added since DIP publication)
Priority and performance measure
What is working, what is not working, and where we need help
Lead agency Cost estimate and funding sources (** already funded)
Status as of December 2009
H5. Booths, fairs, and festivals.
Medium 2009
Need funding for supplies and staff time.
Variety $5,000 Ongoing participation by Clean Water Work Group JS’KT: The Clean Water Work Group display was updated and exhibited at Streamfest and Riverfest (2009). County Environmental Health hosted a booth at the County Fair with septics and water quality outreach information.
H6. Permanent displays at River Center.
Medium 2009
River Center $10,000 JS’KT: The Clean Water Work Group display was updated and exhibited at the River Center and other appropriate events. The River Center produced a fact sheet about the TWG MST and Mycoremediation projects, for distribution by the River Center and at appropriate events (2009).
See the next page for definitions of acronyms used in this table.
Page 84
BMP: Best Management Practice CCD: Clallam Conservation District CCWF:CCWF: Centennial Clean Water Funds CREP: Conservation Reserve Enhancement Program CTED: Washington Dept. of Community, Trade and Economic Development DCD: Department of Community Development DIP: Detailed Implementation Plan DIY: Do It yourself DNR: Washington State Dept. of Natural Resources DOE: Washington State Dept. of Ecology DOH: Washington State Dept. of Health DRMT: Dungeness River Management Team EPA: U.S. Environmental Protection Agency ESA: Endangered Species Act FTE: Full-Time Equivalent GAP: General Assistance Program GIS: Geographic Information System GPS: Global Positioning System JS’KT: Jamestown S’Klallam Tribe LID: Low Impact Development LIDAR: Light Detection and Ranging MRA: Marine Recovery Area MST: Microbial Source Tracking NEPA: National Environmental Policy Act NOAA: National Oceanic and Atmospheric Admin. O&M: Operations and Maintenance OSS: Onsite Septic System OSSM: Onsite Septic System Management PSAT: Puget Sound Action Team PUD: Clallam County Public Utility District QAPP: Quality Assurance Project Plan River Center: Dungeness River Audubon Center SOC: Septic of Concern SEPA: State Environmental Policy Act SRFB: Salmon Recovery Funding Board TMDL: Total Maximum Daily Load TWG: Targeted Watershed Grant UGA: Urban Growth Area USFWS: U.S. Fish and Wildlife Service WSDOT: Washington State Dept. of Transportation WDFW: Washington Dept. of Fish and Wildlife
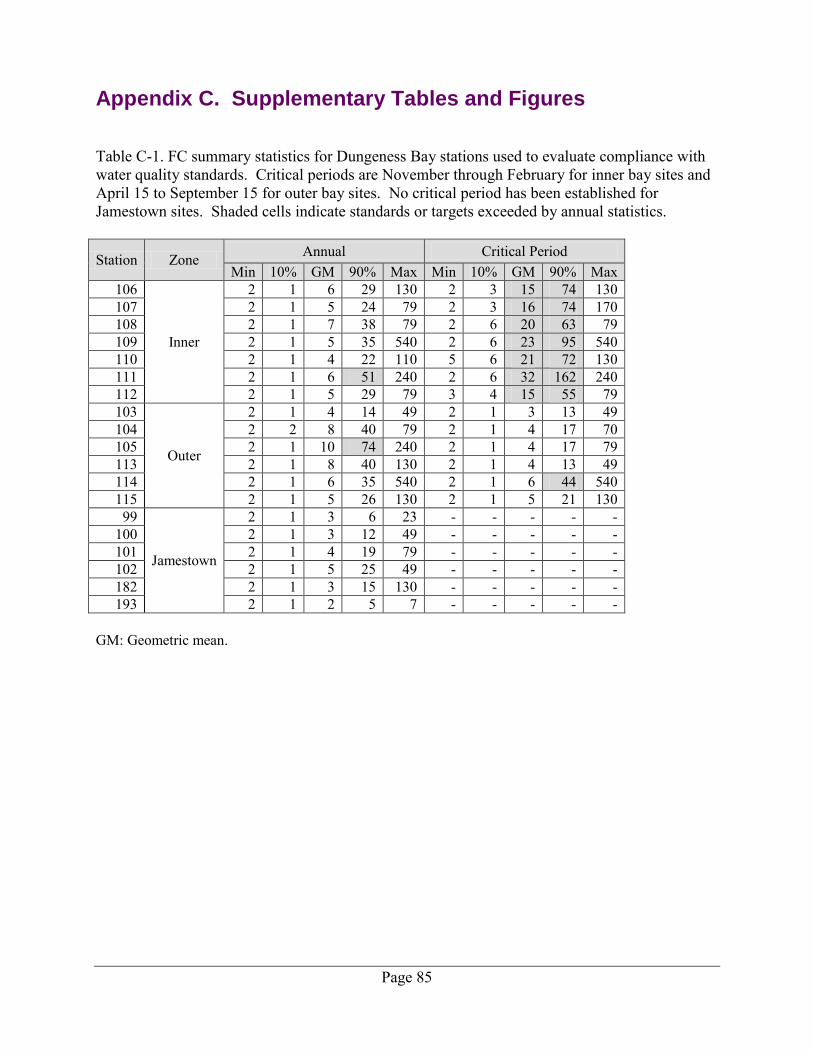
Page 85
Appendix C. Supplementary Tables and Figures Table C-1. FC summary statistics for Dungeness Bay stations used to evaluate compliance with water quality standards. Critical periods are November through February for inner bay sites and April 15 to September 15 for outer bay sites. No critical period has been established for Jamestown sites. Shaded cells indicate standards or targets exceeded by annual statistics.
Station Zone Annual Critical Period Min 10% GM 90% Max Min 10% GM 90% Max
106
Inner
2 1 6 29 130 2 3 15 74 130 107 2 1 5 24 79 2 3 16 74 170 108 2 1 7 38 79 2 6 20 63 79 109 2 1 5 35 540 2 6 23 95 540 110 2 1 4 22 110 5 6 21 72 130 111 2 1 6 51 240 2 6 32 162 240 112 2 1 5 29 79 3 4 15 55 79 103
Outer
2 1 4 14 49 2 1 3 13 49 104 2 2 8 40 79 2 1 4 17 70 105 2 1 10 74 240 2 1 4 17 79 113 2 1 8 40 130 2 1 4 13 49 114 2 1 6 35 540 2 1 6 44 540 115 2 1 5 26 130 2 1 5 21 130 99
Jamestown
2 1 3 6 23 - - - - - 100 2 1 3 12 49 - - - - - 101 2 1 4 19 79 - - - - - 102 2 1 5 25 49 - - - - - 182 2 1 3 15 130 - - - - - 193 2 1 2 5 7 - - - - -
GM: Geometric mean.
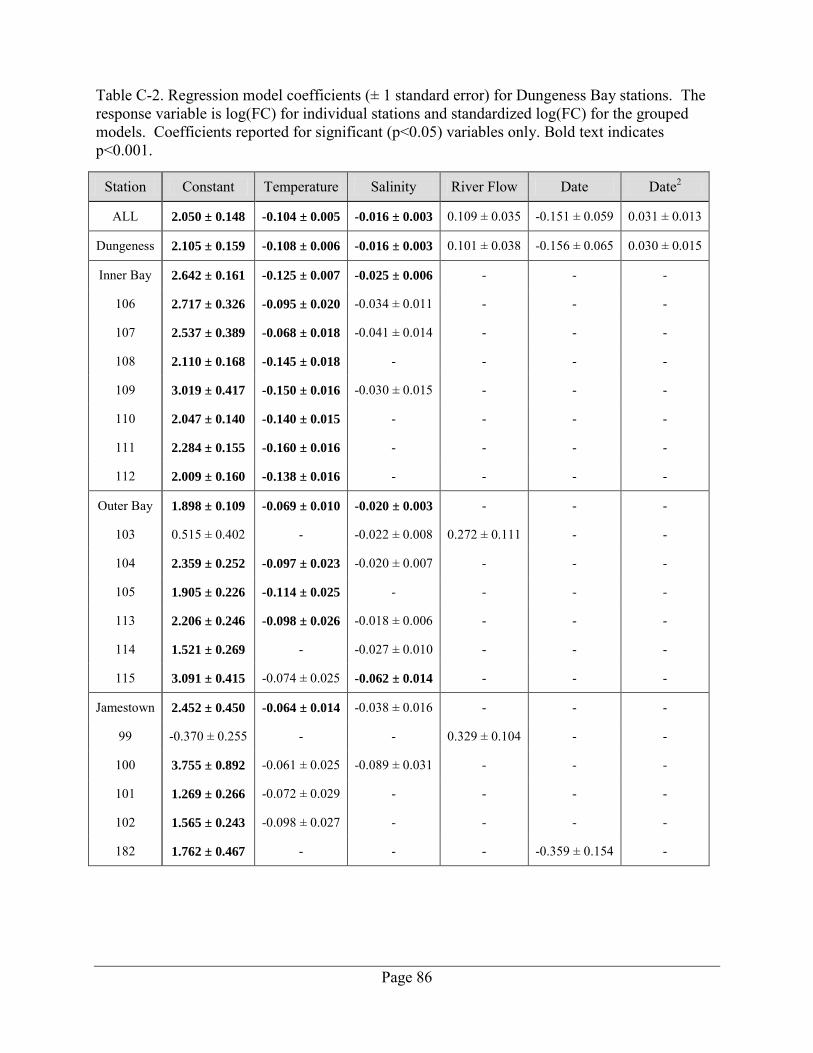
Page 86
Table C-2. Regression model coefficients (± 1 standard error) for Dungeness Bay stations. The response variable is log(FC) for individual stations and standardized log(FC) for the grouped models. Coefficients reported for significant (p<0.05) variables only. Bold text indicates p<0.001.
Station Constant Temperature Salinity River Flow Date Date2
ALL 2.050 ± 0.148 -0.104 ± 0.005 -0.016 ± 0.003 0.109 ± 0.035 -0.151 ± 0.059 0.031 ± 0.013
Dungeness 2.105 ± 0.159 -0.108 ± 0.006 -0.016 ± 0.003 0.101 ± 0.038 -0.156 ± 0.065 0.030 ± 0.015
Inner Bay 2.642 ± 0.161 -0.125 ± 0.007 -0.025 ± 0.006 - - -
106 2.717 ± 0.326 -0.095 ± 0.020 -0.034 ± 0.011 - - -
107 2.537 ± 0.389 -0.068 ± 0.018 -0.041 ± 0.014 - - -
108 2.110 ± 0.168 -0.145 ± 0.018 - - - -
109 3.019 ± 0.417 -0.150 ± 0.016 -0.030 ± 0.015 - - -
110 2.047 ± 0.140 -0.140 ± 0.015 - - - -
111 2.284 ± 0.155 -0.160 ± 0.016 - - - -
112 2.009 ± 0.160 -0.138 ± 0.016 - - - -
Outer Bay 1.898 ± 0.109 -0.069 ± 0.010 -0.020 ± 0.003 - - -
103 0.515 ± 0.402 - -0.022 ± 0.008 0.272 ± 0.111 - -
104 2.359 ± 0.252 -0.097 ± 0.023 -0.020 ± 0.007 - - -
105 1.905 ± 0.226 -0.114 ± 0.025 - - - -
113 2.206 ± 0.246 -0.098 ± 0.026 -0.018 ± 0.006 - - -
114 1.521 ± 0.269 - -0.027 ± 0.010 - - -
115 3.091 ± 0.415 -0.074 ± 0.025 -0.062 ± 0.014 - - -
Jamestown 2.452 ± 0.450 -0.064 ± 0.014 -0.038 ± 0.016 - - -
99 -0.370 ± 0.255 - - 0.329 ± 0.104 - -
100 3.755 ± 0.892 -0.061 ± 0.025 -0.089 ± 0.031 - - -
101 1.269 ± 0.266 -0.072 ± 0.029 - - - -
102 1.565 ± 0.243 -0.098 ± 0.027 - - - -
182 1.762 ± 0.467 - - - -0.359 ± 0.154 -
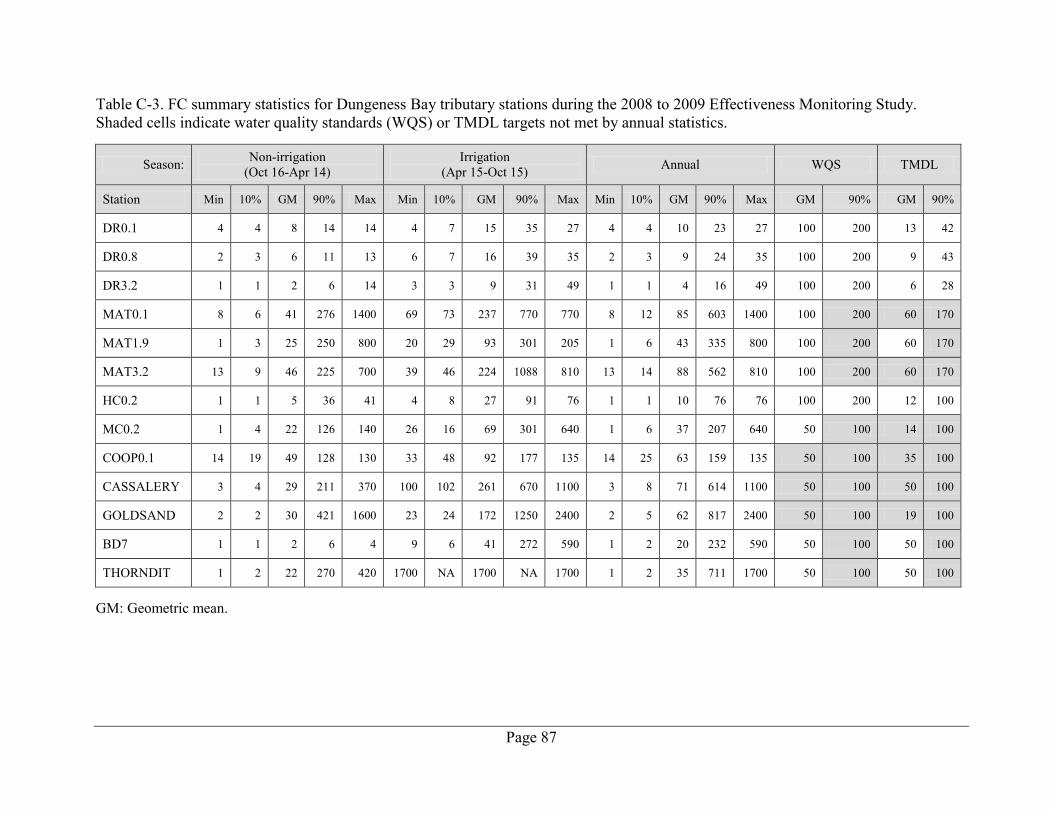
Page 87
Table C-3. FC summary statistics for Dungeness Bay tributary stations during the 2008 to 2009 Effectiveness Monitoring Study. Shaded cells indicate water quality standards (WQS) or TMDL targets not met by annual statistics.
Season: Non-irrigation (Oct 16-Apr 14)
Irrigation (Apr 15-Oct 15) Annual WQS TMDL
Station Min 10% GM 90% Max Min 10% GM 90% Max Min 10% GM 90% Max GM 90% GM 90%
DR0.1 4 4 8 14 14 4 7 15 35 27 4 4 10 23 27 100 200 13 42
DR0.8 2 3 6 11 13 6 7 16 39 35 2 3 9 24 35 100 200 9 43
DR3.2 1 1 2 6 14 3 3 9 31 49 1 1 4 16 49 100 200 6 28
MAT0.1 8 6 41 276 1400 69 73 237 770 770 8 12 85 603 1400 100 200 60 170
MAT1.9 1 3 25 250 800 20 29 93 301 205 1 6 43 335 800 100 200 60 170
MAT3.2 13 9 46 225 700 39 46 224 1088 810 13 14 88 562 810 100 200 60 170
HC0.2 1 1 5 36 41 4 8 27 91 76 1 1 10 76 76 100 200 12 100
MC0.2 1 4 22 126 140 26 16 69 301 640 1 6 37 207 640 50 100 14 100
COOP0.1 14 19 49 128 130 33 48 92 177 135 14 25 63 159 135 50 100 35 100
CASSALERY 3 4 29 211 370 100 102 261 670 1100 3 8 71 614 1100 50 100 50 100
GOLDSAND 2 2 30 421 1600 23 24 172 1250 2400 2 5 62 817 2400 50 100 19 100
BD7 1 1 2 6 4 9 6 41 272 590 1 2 20 232 590 50 100 50 100
THORNDIT 1 2 22 270 420 1700 NA 1700 NA 1700 1 2 35 711 1700 50 100 50 100
GM: Geometric mean.
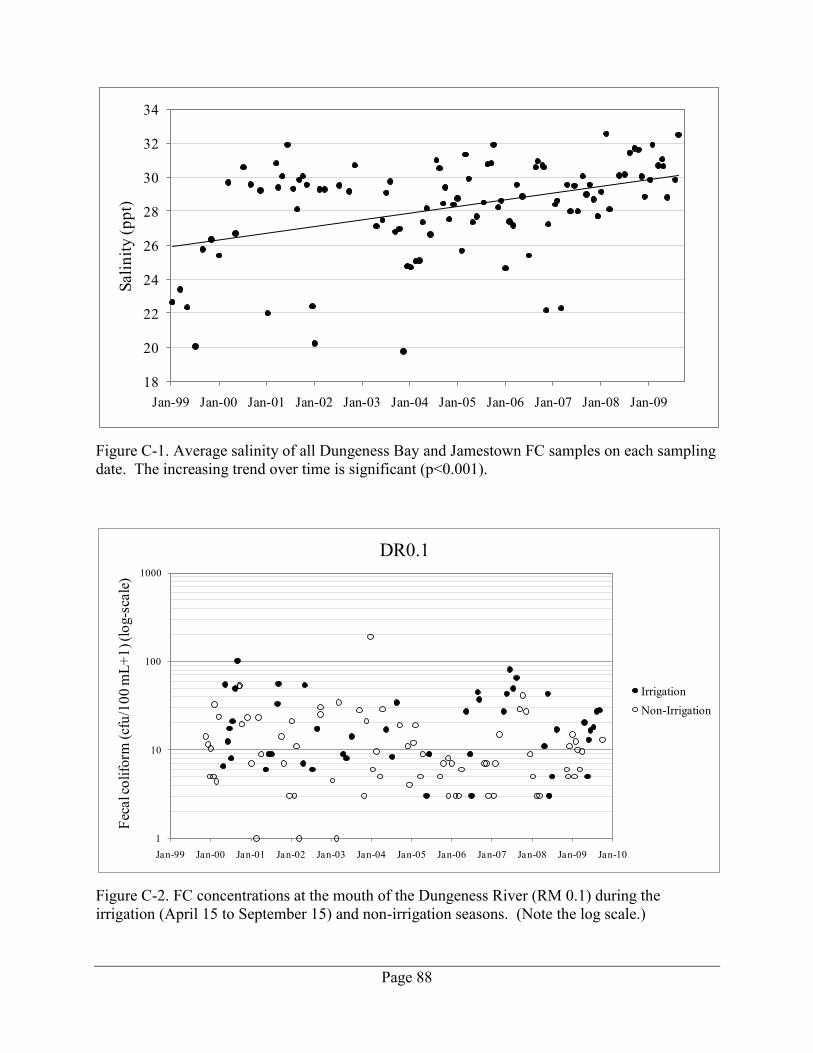
Page 88
Figure C-1. Average salinity of all Dungeness Bay and Jamestown FC samples on each sampling date. The increasing trend over time is significant (p<0.001).
Figure C-2. FC concentrations at the mouth of the Dungeness River (RM 0.1) during the irrigation (April 15 to September 15) and non-irrigation seasons. (Note the log scale.)
18
20
22
24
26
28
30
32
34
Jan-99 Jan-00 Jan-01 Jan-02 Jan-03 Jan-04 Jan-05 Jan-06 Jan-07 Jan-08 Jan-09
Salin
ity (p
pt)
1
10
100
1000
Jan-99 Jan-00 Jan-01 Jan-02 Jan-03 Jan-04 Jan-05 Jan-06 Jan-07 Jan-08 Jan-09 Jan-10
Feca
l col
iform
(cfu
/100
mL+
1) (l
og-s
cale
)
DR0.1
IrrigationNon-Irrigation
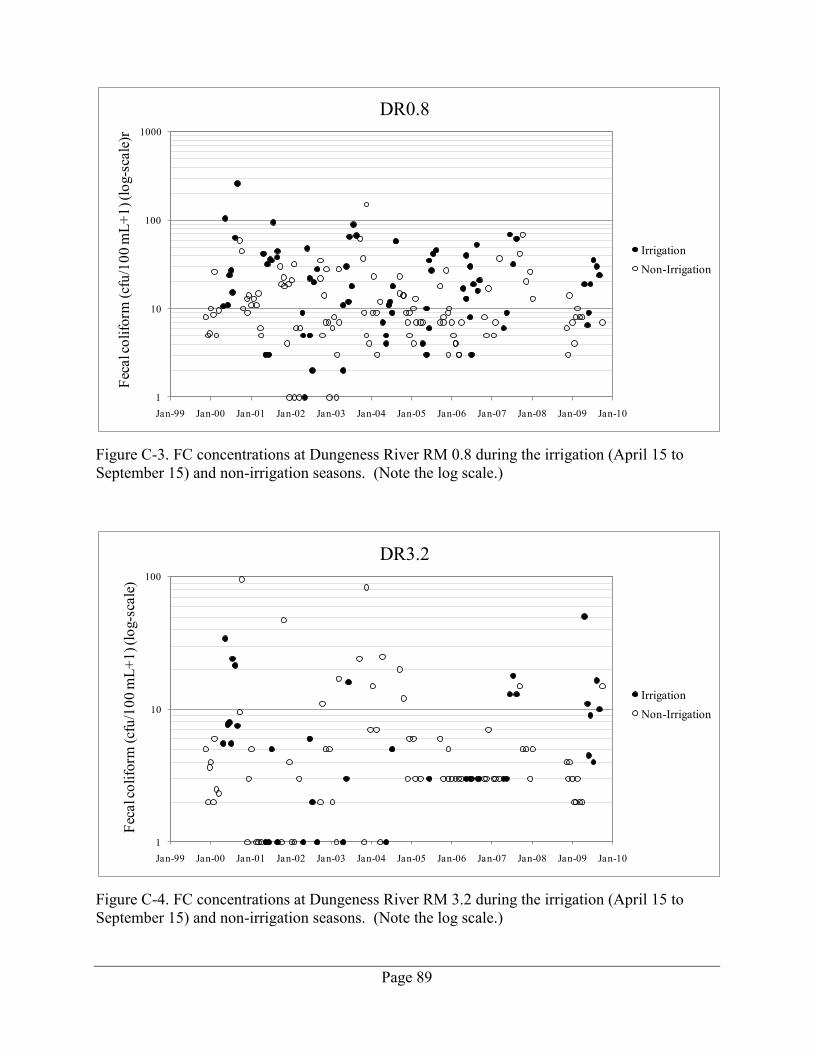
Page 89
Figure C-3. FC concentrations at Dungeness River RM 0.8 during the irrigation (April 15 to September 15) and non-irrigation seasons. (Note the log scale.)
Figure C-4. FC concentrations at Dungeness River RM 3.2 during the irrigation (April 15 to September 15) and non-irrigation seasons. (Note the log scale.)
1
10
100
1000
Jan-99 Jan-00 Jan-01 Jan-02 Jan-03 Jan-04 Jan-05 Jan-06 Jan-07 Jan-08 Jan-09 Jan-10
Feca
l col
iform
(cfu
/100
mL+
1) (l
og-s
cale
)rDR0.8
IrrigationNon-Irrigation
1
10
100
Jan-99 Jan-00 Jan-01 Jan-02 Jan-03 Jan-04 Jan-05 Jan-06 Jan-07 Jan-08 Jan-09 Jan-10
Feca
l col
iform
(cfu
/100
mL+
1) (l
og-s
cale
)
DR3.2
IrrigationNon-Irrigation
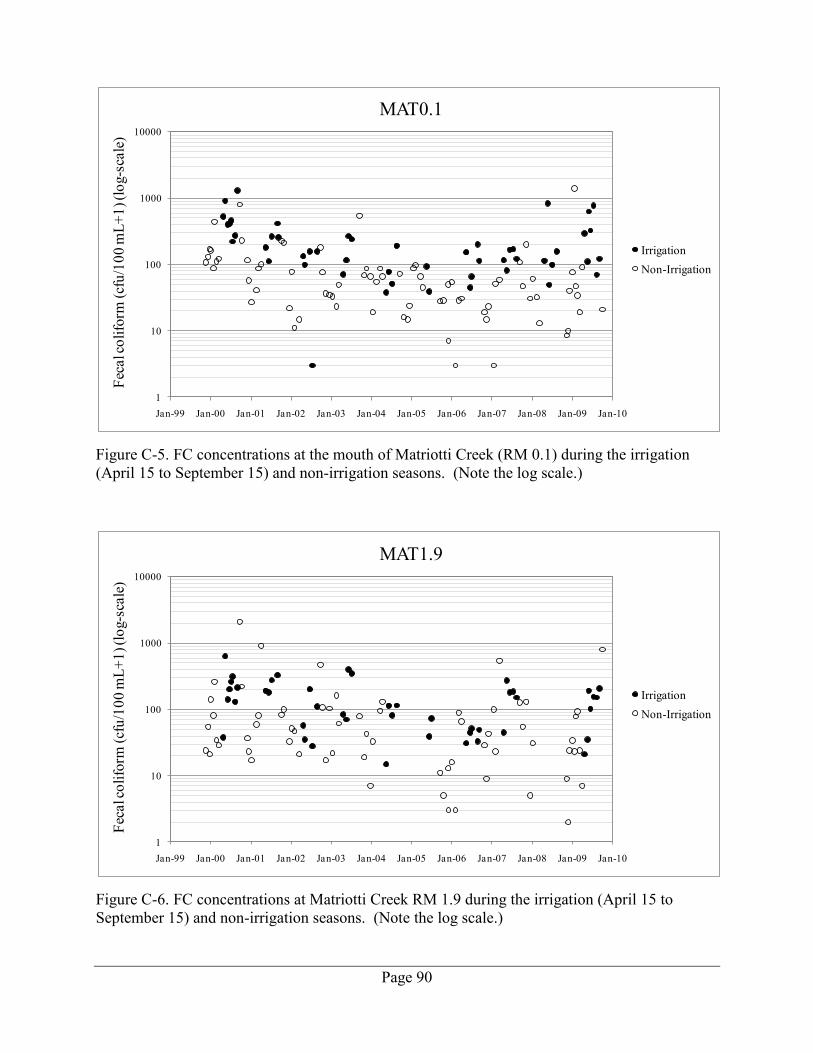
Page 90
Figure C-5. FC concentrations at the mouth of Matriotti Creek (RM 0.1) during the irrigation (April 15 to September 15) and non-irrigation seasons. (Note the log scale.)
Figure C-6. FC concentrations at Matriotti Creek RM 1.9 during the irrigation (April 15 to September 15) and non-irrigation seasons. (Note the log scale.)
1
10
100
1000
10000
Jan-99 Jan-00 Jan-01 Jan-02 Jan-03 Jan-04 Jan-05 Jan-06 Jan-07 Jan-08 Jan-09 Jan-10
Feca
l col
iform
(cfu
/100
mL+
1) (l
og-s
cale
)MAT0.1
IrrigationNon-Irrigation
1
10
100
1000
10000
Jan-99 Jan-00 Jan-01 Jan-02 Jan-03 Jan-04 Jan-05 Jan-06 Jan-07 Jan-08 Jan-09 Jan-10
Feca
l col
iform
(cfu
/100
mL+
1) (l
og-s
cale
)
MAT1.9
IrrigationNon-Irrigation
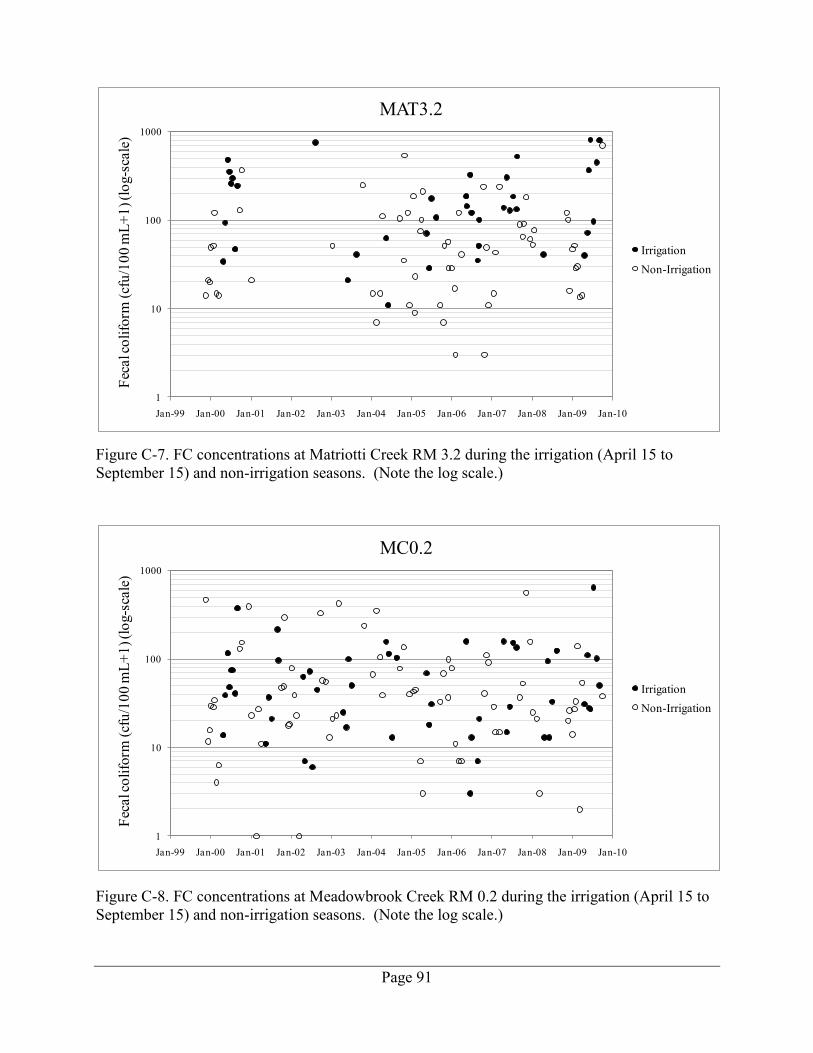
Page 91
Figure C-7. FC concentrations at Matriotti Creek RM 3.2 during the irrigation (April 15 to September 15) and non-irrigation seasons. (Note the log scale.)
Figure C-8. FC concentrations at Meadowbrook Creek RM 0.2 during the irrigation (April 15 to September 15) and non-irrigation seasons. (Note the log scale.)
1
10
100
1000
Jan-99 Jan-00 Jan-01 Jan-02 Jan-03 Jan-04 Jan-05 Jan-06 Jan-07 Jan-08 Jan-09 Jan-10
Feca
l col
iform
(cfu
/100
mL+
1) (l
og-s
cale
)MAT3.2
IrrigationNon-Irrigation
1
10
100
1000
Jan-99 Jan-00 Jan-01 Jan-02 Jan-03 Jan-04 Jan-05 Jan-06 Jan-07 Jan-08 Jan-09 Jan-10
Feca
l col
iform
(cfu
/100
mL+
1) (l
og-s
cale
)
MC0.2
IrrigationNon-Irrigation
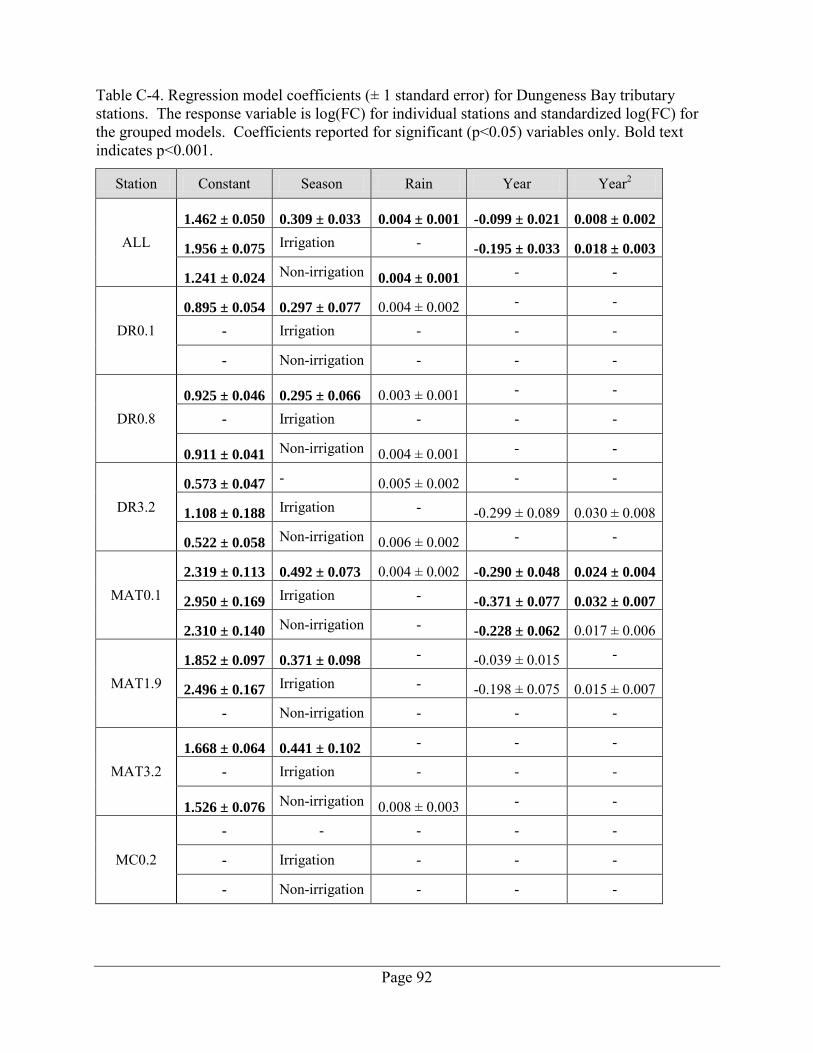
Page 92
Table C-4. Regression model coefficients (± 1 standard error) for Dungeness Bay tributary stations. The response variable is log(FC) for individual stations and standardized log(FC) for the grouped models. Coefficients reported for significant (p<0.05) variables only. Bold text indicates p<0.001.
Station Constant Season Rain Year Year2
ALL 1.462 ± 0.050 0.309 ± 0.033 0.004 ± 0.001 -0.099 ± 0.021 0.008 ± 0.002
1.956 ± 0.075 Irrigation - -0.195 ± 0.033 0.018 ± 0.003
1.241 ± 0.024 Non-irrigation 0.004 ± 0.001 - -
DR0.1 0.895 ± 0.054 0.297 ± 0.077 0.004 ± 0.002 - -
- Irrigation - - -
- Non-irrigation - - -
DR0.8 0.925 ± 0.046 0.295 ± 0.066 0.003 ± 0.001 - -
- Irrigation - - -
0.911 ± 0.041 Non-irrigation 0.004 ± 0.001 - -
DR3.2 0.573 ± 0.047 - 0.005 ± 0.002 - -
1.108 ± 0.188 Irrigation - -0.299 ± 0.089 0.030 ± 0.008
0.522 ± 0.058 Non-irrigation 0.006 ± 0.002 - -
MAT0.1 2.319 ± 0.113 0.492 ± 0.073 0.004 ± 0.002 -0.290 ± 0.048 0.024 ± 0.004
2.950 ± 0.169 Irrigation - -0.371 ± 0.077 0.032 ± 0.007
2.310 ± 0.140 Non-irrigation - -0.228 ± 0.062 0.017 ± 0.006
MAT1.9 1.852 ± 0.097 0.371 ± 0.098 - -0.039 ± 0.015 -
2.496 ± 0.167 Irrigation - -0.198 ± 0.075 0.015 ± 0.007 - Non-irrigation - - -
MAT3.2 1.668 ± 0.064 0.441 ± 0.102 - - -
- Irrigation - - -
1.526 ± 0.076 Non-irrigation 0.008 ± 0.003 - -
MC0.2
- - - - -
- Irrigation - - -
- Non-irrigation - - -
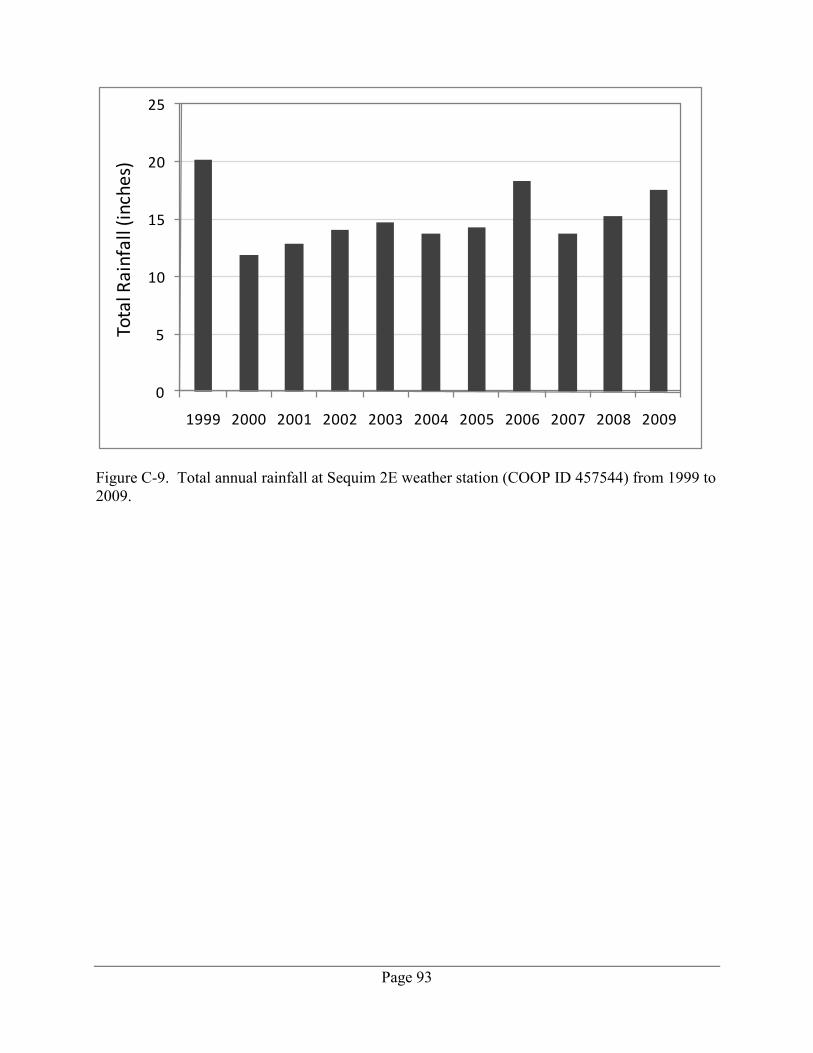
Page 93
Figure C-9. Total annual rainfall at Sequim 2E weather station (COOP ID 457544) from 1999 to 2009.
0
5
10
15
20
25
1999 2000 2001 2002 2003 2004 2005 2006 2007 2008 2009
Tota
l Rai
nfa
ll (
inch
es)