Embed Size (px)
Citation preview

02-Dec-2019 Page 1 Research - KIS Vietnam Bloomberg: KISV <GO>
SECTOR OUTLOOK 2020
02-Dec-2019
Sector STEEL/MATERIALS
Rating NEUTRAL
Table of contents
1. Profit margin to hit a rock bottom
2. Long steel segment: Dung Quat to change the game
3. And flat steel market as well
4. Risk factors
5. Stock coverage
6. Stock pick: HPG
Stock Picks
HPG: Overweight (VND28k/ 26%)
2018 2019F 2020F
PER (x) 7.7 9.1 7.8
PBR (x) 0.9 1.0 0.9
EV/EBITDA (x) 5.2 6.2 4.3
DY (%) 0% 0% 4%
EPS (VND) 2,965 2,533 2,957
BPS (VND) 14,667 17,199 19,156
1st phase of Dung Quat to boost long
steel segment. The outstanding margin
is a key driver for long-term survival.
Hoa Phat will deeply penetrate in flat
steel segment with galvanized steel
sheet factory and the 2nd phase of Dung
Quat project.
Profitability to improve thanks to more
favorable input price.
Dung Quat in the spotlight
Investment points:
Profit margin to hit a rock bottom. Most of producers posted a poor
performance in 2019 due to oversupply situation and opposite wild fluctuation of
steel prices, in which iron ore price increased sharply but scrap and finished steel
price slightly decreased. We see two positive points preventing margin from
plunging further in 2020 are (1) production cut from China thanks to the final year
of “Blue Sky” plan (2) more stable iron ore supply to lower input cost for BOF
producers
Dung Quat to change the game of local long steel market. The first phase of
Dung Quat doubles the long steel capacity of Hoa Phat (HSX: HPG) to 4.35mn
metric tons per year. Hoa Phat will fight for market share as Dung Quat complex
comes into operation. We estimate that Hoa Phat will provide 3.88mn metric tons
in 2020, resulting in 35% of total market share, compared to 25% in 2019. The
short-term oversupply may hurt the profit margin of all local players
And flat steel one as well. We estimate that severe export deterioration will
keep worsening the domestic oversupply markedly. As Hoa Phat officially
launches Hung Yen factory to enter galvanized steel sheet market and the
second phase of Dung Quat complex to produce HRC in 2020, a stronger
reshaping in this market is worth to watch closely.
Risk factors:
Tariff for HRC: In our point of view, we see efforts from the government to
develop domestic steel industry in general and HRC segment in particular.
Therefore, a new kind of tariff like safeguard one may be brought to the table,
which will reshape the domestic steel market faster and more significantly.
Recommendation:
We believe that steel industry has a strong growth potential thanks to the
inevitable industrialization and urbanization of Vietnam in the long term.
However, the operation of Dung Quat and Formosa Ha Tinh factories will reshape
the domestic market significantly in the short term. Local competition will be
tougher which result in narrowing profitability despite of lower input risk.
Therefore, we have a NEUTRAL outlook for steel industry in 2020.
Stock pick: HPG
Mr. Vinh Chu
Real estate - Associate
(+84 28) 3914 8585 - Ext: 1462

SECTOR OUTLOOK 2020 – STEEL/MATERIALS Dung Quat in the spotlight
02-Dec-2019 Page 2 Research - KIS Vietnam Bloomberg: KISV <GO>
1. Profit margin to hit a rock bottom
Steel industry experienced a poor performance in 2019 due to an excess supply and
the wild fluctuation of input material price. Specifically, we estimate that gross margin
of 16 Asian largest steel producers dropped to 9.6% in 3Q2019, which are the lowest
points since 2016. It is noted that in the last 10 years, the corresponding margin
recorded two bottoms at 6.6% and 7.1% in 1Q2012 and 4Q2015, respectively.
Similarly, Vietnam steel producers also suffered a narrowing gross margin.
Despite the uncertainty of the next trough, we see two positive points preventing 2020
margin from plunging further that are production cut from China and more stable iron
ore supply.
Fig 01. 16 Asian largest steel producers’ performance Fig 02. Vietnam steel producers’ performance
Source: Bloomberg, KIS Source: Fiinpro, KIS
1.1. Chinese to cut production more aggressively
Excess supply has overshadowed the global steel market in the recent years. In
9M2019, we notice a steel consumption slowdown in developed markets, with a
decrease of 3.8% YoY in Europe and 0.9% YoY in Japan. In the U.S., while
consumption only increased by 0.4% YoY, production increased by 3.5% YoY.
Regarding to China (which accounts for 50% of the global steel production), strong
Chinese steel production resulted in large inventories in 1Q19 and 3Q19, surpassing
2015 peak. However, after peaking at 12.1% YoY in Nov 2018, production growth rate
has experienced a gradual fall to 9% YoY in the months of 1H2019 and only 6% YoY
in Oct.
-5%
0%
5%
10%
15%
20%
-
500,000
1,000,000
1,500,000
2,000,000
2,500,000
VN
Dbn
Net revenue Gross margin Net margin
0%
5%
10%
15%
20%
0
10,000
20,000
30,000
40,000
50,000
60,000
70,000
1Q
15
2Q
15
3Q
15
4Q
15
1Q
16
2Q
16
3Q
16
4Q
16
1Q
17
2Q
17
3Q
17
4Q
17
1Q
18
2Q
18
3Q
18
4Q
18
1Q
19
2Q
19
3Q
19
VN
Dbn
Net revenue Gross margin Net margin

SECTOR OUTLOOK 2020 – STEEL/MATERIALS Dung Quat in the spotlight
02-Dec-2019 Page 3 Research - KIS Vietnam Bloomberg: KISV <GO>
Back to 2013, China introduced environmental protection policies in a 5-year plan.
During 2017, as the final year of the plan, production growth saw a remarkable
slowdown. However, because the plan is considered as unsuccessful in reaching
environmental objectives, Chinese government announced an extended 3-year plan
called “Blue Sky” in 2018. As 2020 is the final year of the extended plan, we expect to
see a similar pattern like 2017 as China is more aggressive with the environmental
targets.
Fig 03. China production Fig 04. China rebar, wire rod, HRC and CRC inventory
Source: NBS, KIS Source: SteelHome, Bloomberg, KIS
1.2. Stable iron ore supply to lower input cost of BOF producers
Another factor contributing to the poor performance of 2019 is the opposite movement
of steel scrap price and iron ore one amid the global downtrend of output price. While
EAF producers (which account for 30% of total crude steel in 2018) enjoyed the
decrease of 13.7% YoY of scrap price, their BOF peers had to suffer the surge of iron
ore because of the accident shortage of supply. The unexpected operation
suspension of Vale in Brazil and Cyclone Veronica in Australia made iron ore price
increased by 70% YoY to more than USD120 per ton (Bloomberg ticker: IOECAU62).
However, as Vale, Rio Tinto, BHP and Fortescue is getting back to normal, their iron
ore production is improving and dropped only -5.8% YoY in 3Q2019 from the -10.6%
of 2Q2019, making iron ore price correct to USD85 per ton at the end of Oct. Vale has
also updated its iron ore production guidance for 1Q2020 at around 70-75 million tons,
equivalent to 96%-103% of its 1Q2019 production, showing a full recovery. Therefore,
we expect a more stable iron supply to lower input cost for BOF producers in 2020
-15%
-10%
-5%
0%
5%
10%
15%
-
20
40
60
80
100
mn m
etr
ic tons
Crude steel volume 2019 growth rate
2018 growth rate 2017 growth rate
2016 growth rate 2015 growth rate
5.0
7.0
9.0
11.0
13.0
15.0
17.0
19.0
Jan Feb Mar Apr May Jun Jul Aug Sep Oct Nov Dec
mn m
etr
ic tons
2015 2016 2017 2018 2019
Normal level
SECTOR OUTLOOK 2020 – STEEL/MATERIALS Dung Quat in the spotlight
02-Dec-2019 Page 4 Research - KIS Vietnam Bloomberg: KISV <GO>
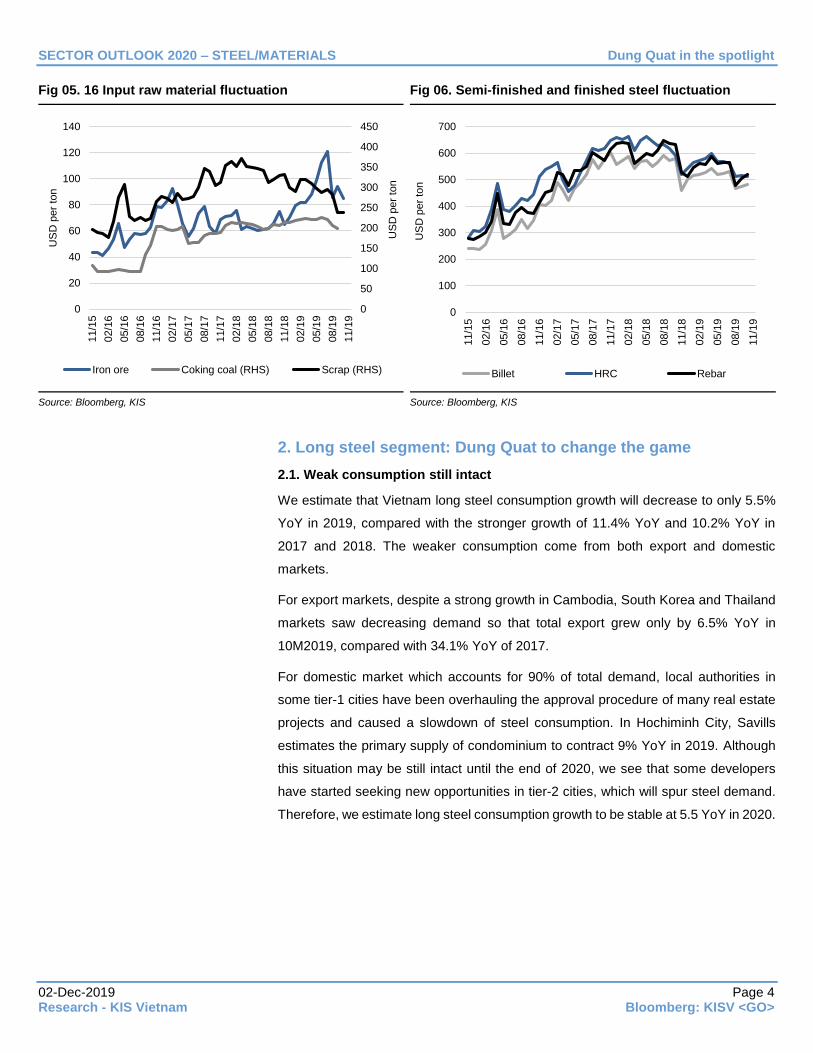
Fig 05. 16 Input raw material fluctuation Fig 06. Semi-finished and finished steel fluctuation
Source: Bloomberg, KIS Source: Bloomberg, KIS
2. Long steel segment: Dung Quat to change the game
2.1. Weak consumption still intact
We estimate that Vietnam long steel consumption growth will decrease to only 5.5%
YoY in 2019, compared with the stronger growth of 11.4% YoY and 10.2% YoY in
2017 and 2018. The weaker consumption come from both export and domestic
markets.
For export markets, despite a strong growth in Cambodia, South Korea and Thailand
markets saw decreasing demand so that total export grew only by 6.5% YoY in
10M2019, compared with 34.1% YoY of 2017.
For domestic market which accounts for 90% of total demand, local authorities in
some tier-1 cities have been overhauling the approval procedure of many real estate
projects and caused a slowdown of steel consumption. In Hochiminh City, Savills
estimates the primary supply of condominium to contract 9% YoY in 2019. Although
this situation may be still intact until the end of 2020, we see that some developers
have started seeking new opportunities in tier-2 cities, which will spur steel demand.
Therefore, we estimate long steel consumption growth to be stable at 5.5 YoY in 2020.
0
50
100
150
200
250
300
350
400
450
0
20
40
60
80
100
120
140
11/1
5
02/1
6
05/1
6
08/1
6
11/1
6
02/1
7
05/1
7
08/1
7
11/1
7
02/1
8
05/1
8
08/1
8
11/1
8
02/1
9
05/1
9
08/1
9
11/1
9
US
D p
er
ton
US
D p
er
ton
Iron ore Coking coal (RHS) Scrap (RHS)
0
100
200
300
400
500
600
700
11/1
5
02/1
6
05/1
6
08/1
6
11/1
6
02/1
7
05/1
7
08/1
7
11/1
7
02/1
8
05/1
8
08/1
8
11/1
8
02/1
9
05/1
9
08/1
9
11/1
9
US
D p
er
ton
Billet HRC Rebar

SECTOR OUTLOOK 2020 – STEEL/MATERIALS Dung Quat in the spotlight
02-Dec-2019 Page 5 Research - KIS Vietnam Bloomberg: KISV <GO>
Fig 07. HCMC condominium market Fig 08. Hanoi condominium market
Source: Savills, KIS Source: Savills, KIS
2.2. Dung Quat - Hoa Phat fights for market share
The first phase of Dung Quat steel factory, which is scheduled to operate fully from
the beginning of 2020, doubling the long steel capacity of Hoa Phat (HSX: HPG) to
4.35mn metric tons per year. Given the current week market, the added capacity is
equivalent to 18% of total market consumption, causing a short-term oversupply.
Therefore, there will be a short-term fight for market share, which hurts the profitability
of local producers. Year to date, steel price of Hoa Phat dropped 10.8%, faster than
other local peers like Pomina and VinaKyoei. We estimate that Hoa Phat will provide
3.88mn metric tons in 2020, up +1.13mn metric tons YoY, resulting in 35% of total
market share from the current 25%.
Fig 09. Vietnam long steel market share of key players Fig 10. Steel price of key players
Source: VSA, KIS Source: VSA, Fiinpro, KIS
-
10,000
20,000
30,000
40,000
50,000
60,000
70,000
80,000
2018 2019F 2020F 2021F 2022F
Units
Primary supply Handover
-
10,000
20,000
30,000
40,000
50,000
60,000
2018 2019F 2020F 2021F 2022F
Units
Primary supply Handover
25.0%
8.3%
8.2%
11.5%7.2%
6.3%
33.5%
Hoa Phat
Pomina
Posco
Vinakyoei
TIS
Formosa
Others
11
11.5
12
12.5
13
13.5
14
VN
Dm
n p
er
ton
Hoa Phat Vinakyoei Pomina Posco

SECTOR OUTLOOK 2020 – STEEL/MATERIALS Dung Quat in the spotlight
02-Dec-2019 Page 6 Research - KIS Vietnam Bloomberg: KISV <GO>
2.3. Safeguard tariff to be extended
Vietnam is imposing the safeguard tariff on imported billet and long steel from Mar
2016 to Mar 2020. Thanks to price disadvantage compared to local steel players,
2016, 2017, 2018 and even 10M2019 witnessed the remarkable decline of Chinese
steel import.
After receiving requests from Hoa Phat and Vinasteel – 2 of 4 applicants in the
previous safeguard tariff investigation, MoIT issued Decision 2605/QD-BCT to
investigate whether to extend or not the current safeguard tariff on 22 Aug 2019. In
the context of globally rising protectionism and the fact that MoIT aggressively
promoted activities to protect local producers in 2019, there is a high probability that
this tariff policy will be extended after Mar 2020.
In the worst scenario, if the safeguard tariff is removed, we estimate that pressure
from Chinese steel import will not be as high as before 2016. The abovementioned
Chinese inventories contraction and narrowing price spread between Chinese and
Vietnamese steel will not encourage Chinese players to dump their products to
Vietnam.
Fig 11. Current safeguard tariff on long steel Fig 12. China and Vietnam rebar price spread
Source: MoIT, KIS Source: Bloomberg, VSA, Fiinpro, KIS
3. And flat steel market as well
3.1. Tougher export markets put pressure on domestic one
Because 2018 was the year of rising protectionism, tougher export was our main
investment idea for our 2019 steel outlook. In fact, export was extremely damaged,
leading to high pressure on local producers in Vietnam. Specifically, total flat steel
export contracted by -19.6% YoY in 10M2019, compared with the growth of 9.8% YoY
and 33.0% YoY in 2018 and 2017, respectively.
23.3%
21.3%
19.3%17.3%
0.0%
15.4%13.9%
12.4%10.9%
Mar-16 Mar-17 Mar-18 Mar-19 Mar-20 Mar-21
Billet Long steel product
-4.0
-3.0
-2.0
-1.0
0.0
1.0
2.0
3.0
-
2.0
4.0
6.0
8.0
10.0
12.0
14.0
16.0
VN
Dm
n p
er
ton
VN
Dm
n p
er
ton
Price spread (RHS) Vietnam rebar China rebar

SECTOR OUTLOOK 2020 – STEEL/MATERIALS Dung Quat in the spotlight
02-Dec-2019 Page 7 Research - KIS Vietnam Bloomberg: KISV <GO>
Fig 13. Flat steel consumption breakdown Fig 14. The main export markets of Vietnam steel sheet
Source: VSA, Fiinpro, KIS Source: VN Customs, KIS
Severe export deterioration has worsened overall consumption markedly. Specifically,
although the domestic consumption rose by 4.9% YoY in 10M2019, total flat steel
consumption decreased by -3.3% YoY. Hoa Sen Group (HSX: HSG) and Nam Kim
Group (HSX: NKG) saw their 3Q2019 revenue tumbling the lowest level in the past 3
years. Together with the 10% YoY decrease of HRC price, they also experienced the
worst profitability in the last 5 years. In the context of global protectionism, we keep a
negative view for the export markets of Vietnam, thus putting more pressure on
domestic market in 2020.
Fig 15. Domestic consumption quarterly, YoY growth Fig 16. Performance of HSG and NKG
Source: VSA, Fiinpro, KIS Source: KIS
3.2. Different strategies to survive
To deal with this dark period, local producers have implemented different strategies.
Hoa Sen Group (HSX: HSG) has restructured the operation and management of their
distribution channel to reduce G&A expenses and interest expenses and shifted
-30%
-20%
-10%
0%
10%
20%
30%
40%
-
1
2
3
4
5
6
7
2016 2017 2018 10M2018 10M2019
mill
ion m
etr
ic tons
Export market Domestic pipe steel
Domestic steel sheet Consumption growth rate
Export growth rate
-
200
400
600
800
1,000
1,200
2016 2017 2018 2019F
US
Dm
n
The U.S Indonesia Malaysia Cambodia
-30%
-20%
-10%
0%
10%
20%
30%
40%
50%
60%
Steel pipe Steel sheet Total flat steel
-5%
0%
5%
10%
15%
20%
-
2,000
4,000
6,000
8,000
10,000
12,000
14,000
16,000
VN
Dbn
Net revenue Gross margin Net margin

SECTOR OUTLOOK 2020 – STEEL/MATERIALS Dung Quat in the spotlight
02-Dec-2019 Page 8 Research - KIS Vietnam Bloomberg: KISV <GO>
attention to profit target from market share. We see that market share of Hoa Sen
Group in coated steel and pipe steel segments decreased to 29.5% and 15.6% in
10M2019 from 33.3% and 17.2% in 2018. BoD said that they would maintain their
market share above 30% in the coming years.
On the contrary, despite current steel pipe market stagnation, Hoa Phat Group
boosted its market share to 31.0% in 10M2019 from 27.5% of 2018.
Meanwhile, for Nam Kim Group (HSX: NKG), after old BoD was replaced by the
representatives of SMC (HXS: SMC) in the AGM on 29 Jun 2019, the company started
selling inefficient projects to reduce debt, quitting pipe steel market in July and paid
more attention on steel sheet segment. However, in November, the company
approved a plan to invest a new 150k-tons-p.a pipe steel factory in Quang Nam
province to expand horizontally to the Central of Vietnam.
For Dong A Group (non-listed), they kept pushing sales volume and gain coated steel
market share to 17.8% YoY in 10M2019 from 16.5% YoY in 2018.
Fig 17. Vietnam pipe steel market share, 2018 Fig 18. Vietnam pipe steel market share, 10M2019
Source: VSA, Fiinpro, KIS Source: VSA, Fiinpro, KIS
Fig 19. Vietnam coated steel market share, 2018 Fig 20. Vietnam coated steel market share, 10M2019
Source: VSA, Fiinpro, KIS Source: VSA, Fiinpro, KIS
27.5%
17.2%
6.6%8.4%
40.3%HPG
HSG
NKG
Minh Ngoc
Others
31.2%
15.6%4.2%
9.4%
39.6%
HPG
HSG
NKG
Minh Ngoc
Others
33.3%
15.3%16.5%
34.9% HSG
NKG
Dong A
Others
29.5%
15.7%
17.8%
37.0%
HSG
NKG
Dong A
Others

SECTOR OUTLOOK 2020 – STEEL/MATERIALS Dung Quat in the spotlight
02-Dec-2019 Page 9 Research - KIS Vietnam Bloomberg: KISV <GO>
3.3. Strong new entrant
In 2020, Hoa Phat will start participating in the steel sheet market by putting a
galvanized steel sheet factory in Hung Yen province into operation, worsening the
current oversupply situation. The design capacity of this factory is 400,000 metric tons,
equivalent 10% of galvanized steel sheet market consumption. Hoa Phat may pursue
market share target instead of profit target for Hung Yen steel sheet project by the
same way they planned for Dung Quat long steel project. The direct competitor of Hoa
Phat is Hoa Sen Group, one of the few coil producers that have factories in the North.
The key advantage of Hoa Phat will appear only when the second phase of Dung
Quat project is completed in 2H2020, capable of 2mn metric tons of HRC per year
and complete the full value chain of its flat steel segment.
4. Risk factors
Tax for HRC
In Sept 2019, Ministry of Finance (MoF) proposed a plan of rising the Most-favored
Nation (MFN) tariff on imported hot rolled steel coil (HRC) from 0% to 5% to increase
the government revenue, improve trade balance and protect domestic steel industry.
However, after collecting opinions from local steel players that insufficient HRC
domestic supply will hurt local players rather than protect and HRC imported from
China will keep increasing, MoF has canceled the plan.
In our point of view, we see efforts from the government to develop domestic steel
industry in general and HRC segment in particular. Therefore, a new kind of tariff like
safeguard tariff may be brought to the table, which will reshape the domestic steel
market faster and more significantly.

SECTOR OUTLOOK 2020 – STEEL/MATERIALS Dung Quat in the spotlight
02-Dec-2019 Page 10 Research - KIS Vietnam Bloomberg: KISV <GO>
5. Stock coverage
Recommendation & TP Earnings & Valuation
Company Sales
(VNDbn)
EBIT
(VNDbn)
NPAT
(VNDbn)
EPS
(VND)
BPS
(VND)
PER
(x)
PBR
(x)
ROE
(%)
EV/EBITDA
(x)
DY
(%)
HPG Recommendation BUY 2016 33,283 7,856 6,606 1,799 5,856 12.7 0.6 38.6% 5.2 1.6%
(HOSE) Target Price (VND) 28,000 2017 46,162 9,622 8,015 2,689 11,694 8.5 0.8 30.8% 4.1 0.0%
Price (VND) 22,950 2018 55,836 10,550 8,601 2,965 14,667 7.7 0.9 23.6% 5.2 0.0%
Market cap (VNDbn) 63,367 2019E 62,617 9,896 7,466 2,533 17,199 9.0 1.0 16.9% 6.1 0.0%
2020E 76,062 12,735 8,901 2,957 19,156 7.7 0.9 17.7% 4.2 4.4%
HSG Recommendation NEUTRAL 2017 26,149 2,104 1,332 2,925 14,771 2.8 0.6 28.6% 5.3 10.1%
(HOSE) Target Price (VND) 8,100 2018 34,441 1,266 409 937 13,381 8.7 0.6 7.9% 7.6 5.6%
Price (VND) 7,850 2019U 28,035 970 361 828 12,913 9.8 0.6 6.8% 6.0 0.0%
Market cap (VNDbn) 3,322 2020E 26,341 1,270 468 1,072 13,485 7.6 0.6 8.4% 4.8 6.1%
2021E 27,326 1,128 359 808 13,293 10.1 0.6 6.3% 4.9 12.3%
NKG Recommendation NON RATED 2016 8,936 796 518 2,845 23,888 2.5 0.3 46.7% 5.7 0.0%
(HOSE) Target Price (VND) 2017 12,619 1,024 708 3,887 22,619 1.8 0.3 31.3% 5.8 10.2%
Price (VND) 6,100 2018 14,812 390 57 293 16,325 23.9 0.4 1.9% 7.1 0.0%
Market cap (VNDbn) 1,110 2019E 12,013 132 195 998 17,323 7.0 0.4 6.4% 7.3 0.0%
2020E 11,464 226 303 1,550 18,873 4.5 0.4 9.2% 5.1 0.0%
Source: Company data, KIS
Data as of 2 Dec 2019
6. Stock pick: HPG

SECTOR OUTLOOK 2020 – STEEL/MATERIALS Dung Quat in the spotlight
02-Dec-2019 Page 11 Research - KIS Vietnam Bloomberg: KISV <GO>
Stock Pick HPG
Rating OVERWEIGHT
Market price (VND) 22,950
1-Y target price (VND) 28,000
1-Y price return (%) 22.0%
1-Y dividend yield (%) 4.4%
1-Y total return (%) 26.4%
Stock performance (%)
YTD 1T 3T 12T
Absolute -4% 5% 3% -10%
Relative -13% 10% 5% -16%
Source: Bloomberg, relate to VNIndex
Stock Statistics 02-Dec-19
52-week range (VND) 20.6k-27.2k
Shares o/s (m) 2,761
Mkt cap (VND bn.) 63,367
Mkt cap ($m) 2,734
Foreign % owned 37.7%
Est. free float (mn. shares) 1,439.5
3m avg. daily vol. (shares) 4,765,818
VND/USD 23,173
Index: VN-Index/HNX 959/101
Source: Bloomberg, KIS
Ownership 02-Dec-19
Chairman & affiliates 32.4%
Dragon Capital 5.0%
Vinacapital 4.9%
CEO Tran Tuan Duong 2.7%
Source: Bloomberg, KIS
Dung Quat, of course!
Investment points:
1st phase of Dung Quat project to boost long steel segment. The 1st phase
of Dung Quat will operate fully from the beginning of FY2020, doubling the long
steel capacity to 4.35mn metric tons per year. We estimate that Hoa Phat will
boost its market share to 35% in 2020 from 25% in 2019. However, short-term
fight for market share will likely hurt profitability. We see outstanding financial
performance is a key driver for long-term survival.
Hoa Phat will deeply penetrate in flat steel market by a galvanized steel
sheet factory in Hung Yen. The finish of the 2nd phase of Dung Quat project,
which is capable of 2mn metric tons of HRC, will complete the full value chain
of Hoa Phat in both long steel and flat steel segments. Dung Quat will help Hoa
Phat become a top player in South East Asia
Profitability to improve thanks to more favorable price trend of input iron
ore as global production is back to normal in early 2020.
In 2020, we estimate that the revenue and profit of Hoa Phat will reach
VND76,062bn and VND8,901bn, up 21.5% YoY and 19.2% YoY. EPS will be
VND3.0k
Risk:
Operating risk of the 2nd phase of Dung Quat project: Because HRC is a
totally new product of Hoa Phat, initial operation incident, if any, will make a test
run longer than the plan of 3 months.
Recommendation:
We expect the success of Dung Quat project to make Hoa Phat become a
regional giant in the foreseeable future. Using PER of 10x, we evaluate the
HPG share at VND28,000 by the end of 2020. Including VND1,000 cash
dividend per share, total expected return is 26.4%. Recommend
OVERWEIGHT
0
5,000
10,000
15,000
20,000
25,000
0
5
10
15
20
25
30
'000 shares
'000VND
Price - Volume

SECTOR OUTLOOK 2020 – STEEL/MATERIALS Dung Quat in the spotlight
02-Dec-2019 Page 12 Research - KIS Vietnam Bloomberg: KISV <GO>
FINANCIALS MODEL
Unit: VNDbn. 2016 2017 2018 2019E 2020E
Net Revenue 33,283 46,162 55,836 62,617 76,062
Sales growth (%) 21% 39% 21% 12% 21%
Steel 28,855 39,738 46,424 50,631 62,516
Agriculture 1,464 2,895 4,596 7,213 8,645
Real estate 533 760 1,672 1,602 1,602
Other 2,629 2,768 3,144 3,171 3,298
COGS 24,533 35,536 44,166 51,231 61,517
Gross margin (%) 26% 23% 21% 18.2% 19.1%
SG&A 895 1,004 1,121 1,490 1,810
EBITDA 9,499 11,595 12,810 12,744 17,631
EBITDA margin (%) 28% 25% 22.9% 20.4% 23.2%
Depr’n & Amort’n 1,643 1,974 2,260 2,848 4,895
Operating profit 7,856 9,622 10,550 9,896 12,735
Operating margin (%) 24% 21% 19% 16% 17%
Net interest expense 142 371 376 843 2,699
As % of avg. net debt 6% -5651% 4% 4% 10%
Interest cover (x) 55.5 25.9 28.0 11.7 4.7
Other profit/loss -13 38 -103 -41 -
Tax 1,096 1,274 1,471 1,545 1,135
Effective tax rate (%) 14% 14% 15% 14% 11%
Net profit 6,606 8,015 8,601 7,466 8,901
Net margin (%) 20% 18% 15% 12% 12%
Minorities 4 8 28 28 28
Net attributable profit
6,602 8,007 8,573 7,439 8,874
Number of shares (m) 843 1,517 2,124 2,761 2,761
EPS (VND,bonus-adjusted)
1,799 2,689 2,965 2,533 2,957
EPS growth (%) 83% 50% 10% -15% 17%
DPS (VND) 375 - - - 1,000
Payout ratio (%) 21% - - - 34%
EBITDA = Net revenue – (COGs -Depr’n&Amort’n)– SG&A expenses
EBIT = EBITDA – Depr’n&Amort’n
Net interest expenses = interest expenses – interest income
Other profit/loss consists of other financial income/expenses, profit share from JVs/associates and other income/loss.
Payout ratio = Dividend paid / Net attributable profit.
BS & CF ITEMS (VNDbn)
2016 2017 2018 2019E 2020E
Increase in WC 1,419 5,214 -5,447 5,549 2,436
Capex 3,445 8,882 27,659 16,463 4,895
Other cash flow items -202 -1,452 7,946 - -
Free cash flow 3,619 -2,624 -19,298 -11,697 6,465
Share issues - 5,057 11 - -
Dividends paid 1,102 - - - 2,761
Increase in net debt -2,517 -2,430 19,287 11,697 -3,704
Net debt, end of year 1,208 -1,221 18,066 29,763 26,058
Enterprise value 49,739 47,314 66,618 78,342 74,665
Total equity 19,850 32,398 40,623 47,643 53,073
Minority interests 106 111 127 155 182
Shareholder’s equity 19,745 32,287 40,496 47,489 52,891
BVPS (VND, bonus-adjusted)
5,856 11,694 14,667 17,199 19,156
Net debt / equity (%) 6% -4% 44% 62% 49%
Net debt / EBITDA (x) 0.13 -0.11 1.41 2.34 1.48
Total assets 33,227 53,022 78,223 97,386 99,823
Net debt = debts – cash & equivalent
Key ratio & Valuation
2016 2017 2018 2019E 2020E
ROE (%) (excl minority interest)
38.6% 30.8% 23.6% 16.9% 17.7%
ROA (%) 19.9% 15.1% 11.0% 7.7% 8.9%
ROIC (%) 34.2% 31.8% 19.8% 12.0% 14.1%
WACC (%) 14.4% 15.0% 11.5% 10.3% 12.6%
PER (x) 12.7 8.5 7.7 9.0 7.7
PBR (x) 0.6 0.8 0.9 1.0 0.9
PSR (x) 1.5 1.0 0.9 0.8 0.6
EV/EBITDA (x) 5.2 4.1 5.2 6.1 4.2
EV/Sales (x) 1.5 1.0 1.2 1.3 1.0
Dividend yield (%) (bonus-adjusted)
1.6% - - - 4.4%

SECTOR OUTLOOK 2020 – STEEL/MATERIALS Dung Quat in the spotlight
02-Dec-2019 Page 13 Research - KIS Vietnam Bloomberg: KISV <GO>
Contacts
HCM City Head Office
Level 3, Maritime Bank Tower
180-192 Nguyen Cong Tru St., District 1, HCM City
Tel: (+84 28) 3914 8585
Fax: (+84 28) 3821 6898
Hanoi Branch
Level 6, CTM Tower
299 Cau Giay, Cau Giay District, Hanoi
Tel: (+84 24) 3974 4448
Fax: (+84 24) 3974 4501
Pham Ngoc Thach Transaction Office
Level 3, 62A Pham Ngoc Thach, District 3, HCM City
Tel: (+84 28) 7108 1188
Fax: (+84 28) 3820 9229
Ba Trieu Transaction Office
Level 6, 74 Ba Trieu, Hoan Kiem District, Hanoi
Tel: (+84 24) 7106 3555
Fax: (+84 24) 3632 0809
Lang Ha Transaction Office
Level 5, TDL Tower, 22 Lang Ha, Dong Da District, Hanoi
Tel (+84 24) 7108 1188
Fax: (+84 24) 3244 4150
Research Department
Mr. Hoang Huy
Head of Research
(+84 28) 3914 8585 (x1450)
Institutional Brokerage
Ms. Uyen Lam
Head of Institutional Brokerage
(+84 28) 3914 8585 (x1444)

SECTOR OUTLOOK 2020 – STEEL/MATERIALS Dung Quat in the spotlight
02-Dec-2019 Page 14 Research - KIS Vietnam Bloomberg: KISV <GO>
Recommendation System
OVERWEIGHT: where we believe prospective 12 months VND total return (including dividends) will be 15% or more.
NEUTRAL: where we believe it will be -5% to 15%.
UNDERWEIGHT: where we believe it will be -5% or less.
Disclaimer
This report has been issued by the KIS VN Securities Corporation (KIS) with the instructional contributions of KIS VN
Securities Corporation whose employees are specified in the publication. This report is for information of its institutional and
professional customers.
This report is and should not be construed as an offer to sell or a solicitation of an offer to purchase or subscribe for any
investment. No consideration has been given to the particular investment objectives, financial situation or particular needs of
any recipient. Investors are advised make their own financial decisions based on their independent financial advisors as they
believe necessary and based on their particular circumstances such as their financial situation, investment objectives and other
considerations.
In preparing this report, we have relied upon and assumed the accuracy and completeness of all information available from
public and other sources which we believe to be reliable, but which we have not independently verified. KIS makes no express
or implied guarantee, representation or warranty and accepts no responsibility or liability as to the accuracy or completeness
of such information.
Opinions, estimates, and projections expressed are current opinions of the authors as of the original publication date appearing
on this report only and the information, including the opinions contained herein, and are subject to change without notice.
KIS and its affiliates may from time to time perform investment banking or other services for, or solicit investment banking or
other business from, companies mentioned herein. Further, KIS and its affiliates, and/or their officers, directors and employees
involved in the preparation or issuance of this report may, from time to time, have long or short positions in, and buy or sell, the
securities, or derivatives (including options) thereof, of companies mentioned herein, or related securities or derivatives in a
manner that may be consistent or inconsistent with this report and opinions expressed therein. As a result, investors should
be aware that KIS and its affiliates and/or their officers, directors and employees may have a conflict of interest that could affect
this report.
This report shall not be copied, reproduced, distributed (in whole or in part) or disclosed by recipients to any other person
without the express permission of KIS in writing.