Embed Size (px)
Citation preview
Appendix A : TR-1 Form
2017 County CertificationNorth Carolina Department of Revenue
Valuation and Property Tax Levies
For The Fiscal Year Ending June 30, 2018
County of:(click on field and scroll down to select county)
Due Date: February 1, 2018
BLOOM
TR-1-17
http://www.dornc.com/downloads/property.html

Appendix A : TR-1 Form
2017 County CertificationNorth Carolina Department of Revenue
Valuation and Property Tax Levies
For The Fiscal Year Ending June 30, 2018
Due Date: February 1, 2018
Certification
I certify that, to the best of my knowledge, this report is accurate and complete.
Name
Title
Telephone
Date
Name
Title
Telephone
FAX
You can also contact us at:
Should you have questions regarding the preparation of your report email us at
Sharon Phelan 919-814-1144
Tahmina Islam 919-814-1136
This form is also available at:
http://www.dornc.com/downloads/property.html
Steve Dallas
Accountant
(919) 251-4951
Person to contact for additional information
Burke Breathed
Tax Administrator
(919) 251-4911
Person authorizing form
County of: BLOOM
TR-1-17
http://www.dornc.com/downloads/property.html
Appendix A : TR-1 Form
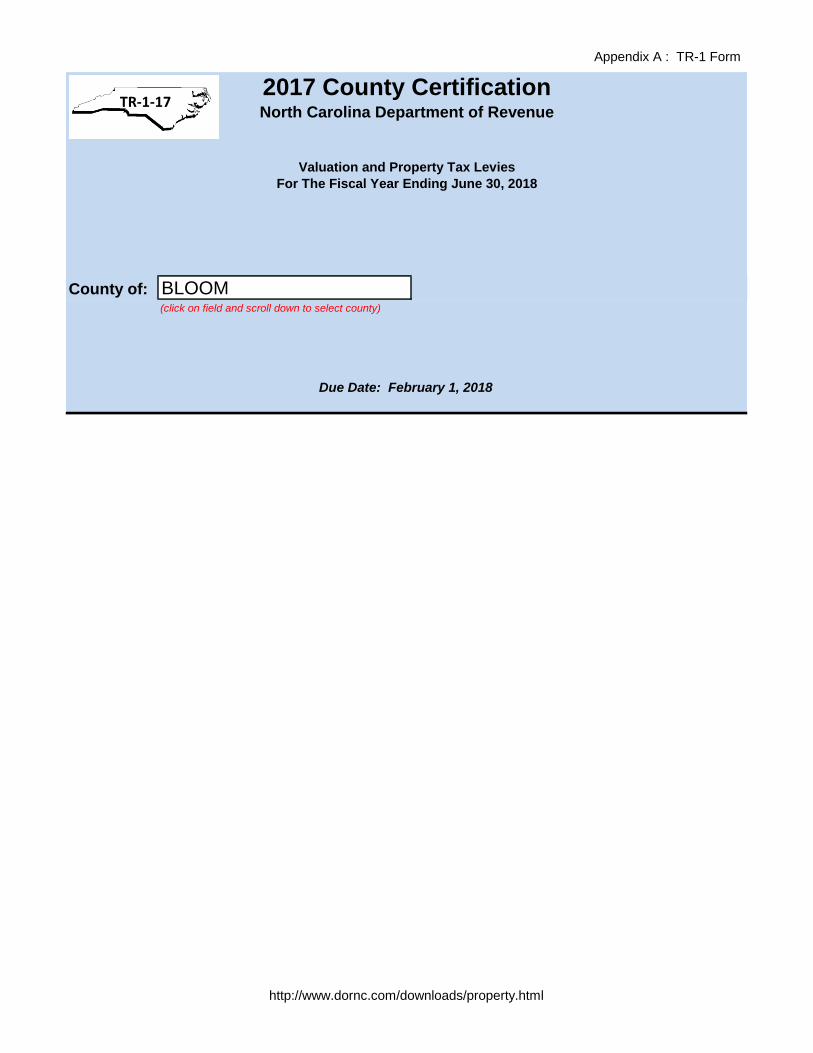
County of: BLOOM
Part I.
A. Property Valuation for Fiscal Year 2017-2018
(Assessed Valuation as of January 1, 2017. Omit cents.)
Assessed Value of Taxable Real Property
1. Assessed value of residential real property……………………………………………………………….. 1. + 20,631,912,422
2. Assessed value of commercial real property………………………………………………………………………..2. + 6,008,798,150
3. Assessed value of industrial real property…………………………………………………………………. 3. + 327,161,800
4. Assessed value of taxable real property not included in items 1-3……………………………………. 4. +
5. Add lines 1-4………………………………………………………………………………………………………….5. = 26,967,872,372
6. All real property exclusions, exemptions, and deferments………………………………………………………………6. - 1,258,923,921
7. Total Taxable Valuation of Real Property (Subtract line 6 from line 5)………………………………………………………..7. = 25,708,948,451
Additional required information (present-use value and deferments should be included in lines 1-7 as well):
Property classified for taxation at present-use value (G.S. 105-277.4)
8. Full assessed value of present-use value property……………………………………………………………………………………8. + 983,855,500
9. Value deferred……………………………………………………………………………………………………………….9. - 698,203,265
10. Present-use parcel value subject to taxation for 2017 (Subtract line 9 from line 8)…………………………10. = 285,652,235
Assessed Value of Taxable Personal Property (Excluding classified registered motor vehicles)
11. Business personal property (including machinery, equipment, furniture and fixtures)………………………………..11. + 1,759,805,559
12. Non-business personal property (including manufactured mobile homes and vehicles not
classified as registered motor vehicles)……………………………………………………………………………………..12. + 127,008,289
13. All other taxable personal property not included in items 11 or 12 ………………………………………………13. +
14. Add lines 11-13…………………………………………………………………………………………………………14. = 1,886,813,848
15. All personal property exclusions, exemptions, and deferments………………………………………………………………………………………………….15. - 1,558,064
16. Total Taxable Value of Personal Property (Subtract line 15 from line 14)………………………………..16. = 1,885,255,784
Assessed Value of Public Service Companies (Assessed by the Property Tax Section of the Department of Revenue)
17. Total Assessed Valuation of Public Service Companies…………………………………………………………………………. 17. + 585,448,380
18. Grand Total Valuation of All Taxable Property as of January 1, 2017 excluding
classified registered motor vehicles reported in section F (Add lines 7, 16, and 17)…………………………………………………………………………………………18. = 28,179,652,615
TR-1-17 Page 2
http://www.dornc.com/downloads/property.html
Appendix A : TR-1 Form
County of: BLOOM
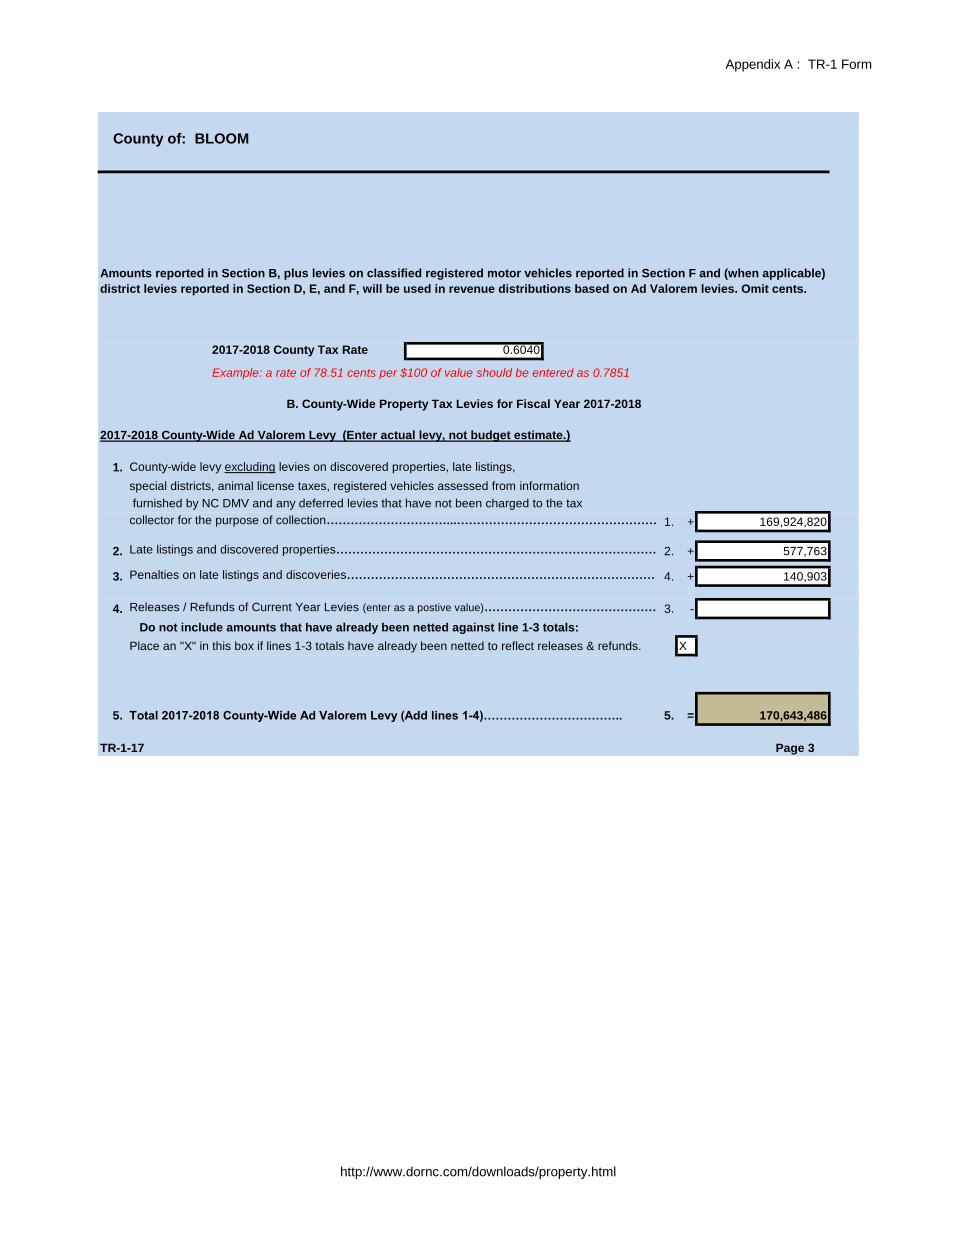
Amounts reported in Section B, plus levies on classified registered motor vehicles reported in Section F and (when applicable)
district levies reported in Section D, E, and F, will be used in revenue distributions based on Ad Valorem levies. Omit cents.
2017-2018 County Tax Rate 0.6040
Example: a rate of 78.51 cents per $100 of value should be entered as 0.7851
2017-2018 County-Wide Ad Valorem Levy (Enter actual levy, not budget estimate.)
1. County-wide levy excluding levies on discovered properties, late listings,
special districts, animal license taxes, registered vehicles assessed from information
furnished by NC DMV and any deferred levies that have not been charged to the tax
collector for the purpose of collection…………………………...…………………………………………………………1. + 169,924,820
2. Late listings and discovered properties…………………………………………………………………………..2. + 577,763
3. Penalties on late listings and discoveries…………………………………………………………………….4. + 140,903
4. Releases / Refunds of Current Year Levies (enter as a postive value)…………………………………………………………………….3. -
Do not include amounts that have already been netted against line 1-3 totals:
Place an "X" in this box if lines 1-3 totals have already been netted to reflect releases & refunds. X
5. Total 2017-2018 County-Wide Ad Valorem Levy (Add lines 1-4)…………………………….. 5. = 170,643,486
TR-1-17
B. County-Wide Property Tax Levies for Fiscal Year 2017-2018
Page 3
http://www.dornc.com/downloads/property.html
Appendix A : TR-1 Form
County of: BLOOM
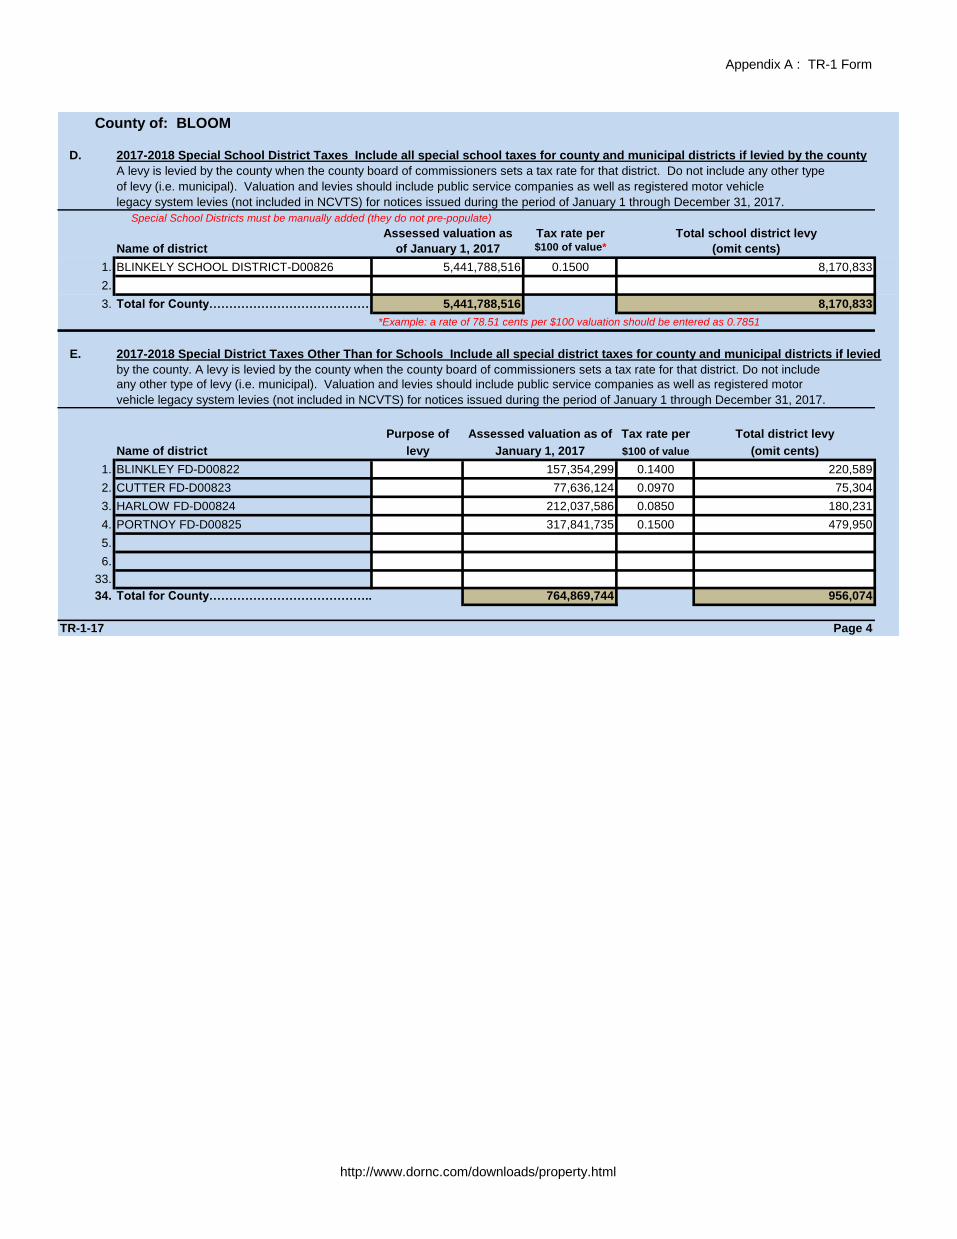
D. 2017-2018 Special School District Taxes Include all special school taxes for county and municipal districts if levied by the county
A levy is levied by the county when the county board of commissioners sets a tax rate for that district. Do not include any other type
of levy (i.e. municipal). Valuation and levies should include public service companies as well as registered motor vehicle
legacy system levies (not included in NCVTS) for notices issued during the period of January 1 through December 31, 2017.
Special School Districts must be manually added (they do not pre-populate)
Assessed valuation as Tax rate per
Name of district of January 1, 2017 $100 of value*
1. BLINKELY SCHOOL DISTRICT-D00826 0.1500
2.
3. Total for County…………………………………………
*Example: a rate of 78.51 cents per $100 valuation should be entered as 0.7851
E. 2017-2018 Special District Taxes Other Than for Schools Include all special district taxes for county and municipal districts if levied
by the county. A levy is levied by the county when the county board of commissioners sets a tax rate for that district. Do not include
any other type of levy (i.e. municipal). Valuation and levies should include public service companies as well as registered motor
vehicle legacy system levies (not included in NCVTS) for notices issued during the period of January 1 through December 31, 2017.
Purpose of Assessed valuation as of Tax rate per Total district levy
Name of district levy January 1, 2017 $100 of value (omit cents)
1. BLINKLEY FD-D00822 0.1400 220,589
2. CUTTER FD-D00823 0.0970 75,304
3. HARLOW FD-D00824 0.0850 180,231
4. PORTNOY FD-D00825 0.1500 479,950
5.
6.
33.
34. Total for County………………………………….. 956,074
TR-1-17 Page 4
Total school district levy
(omit cents)
5,441,788,516
5,441,788,516
8,170,833
8,170,833
157,354,299
77,636,124
212,037,586
317,841,735
764,869,744
http://www.dornc.com/downloads/property.html
Appendix A : TR-1 Form
County of: BLOOM
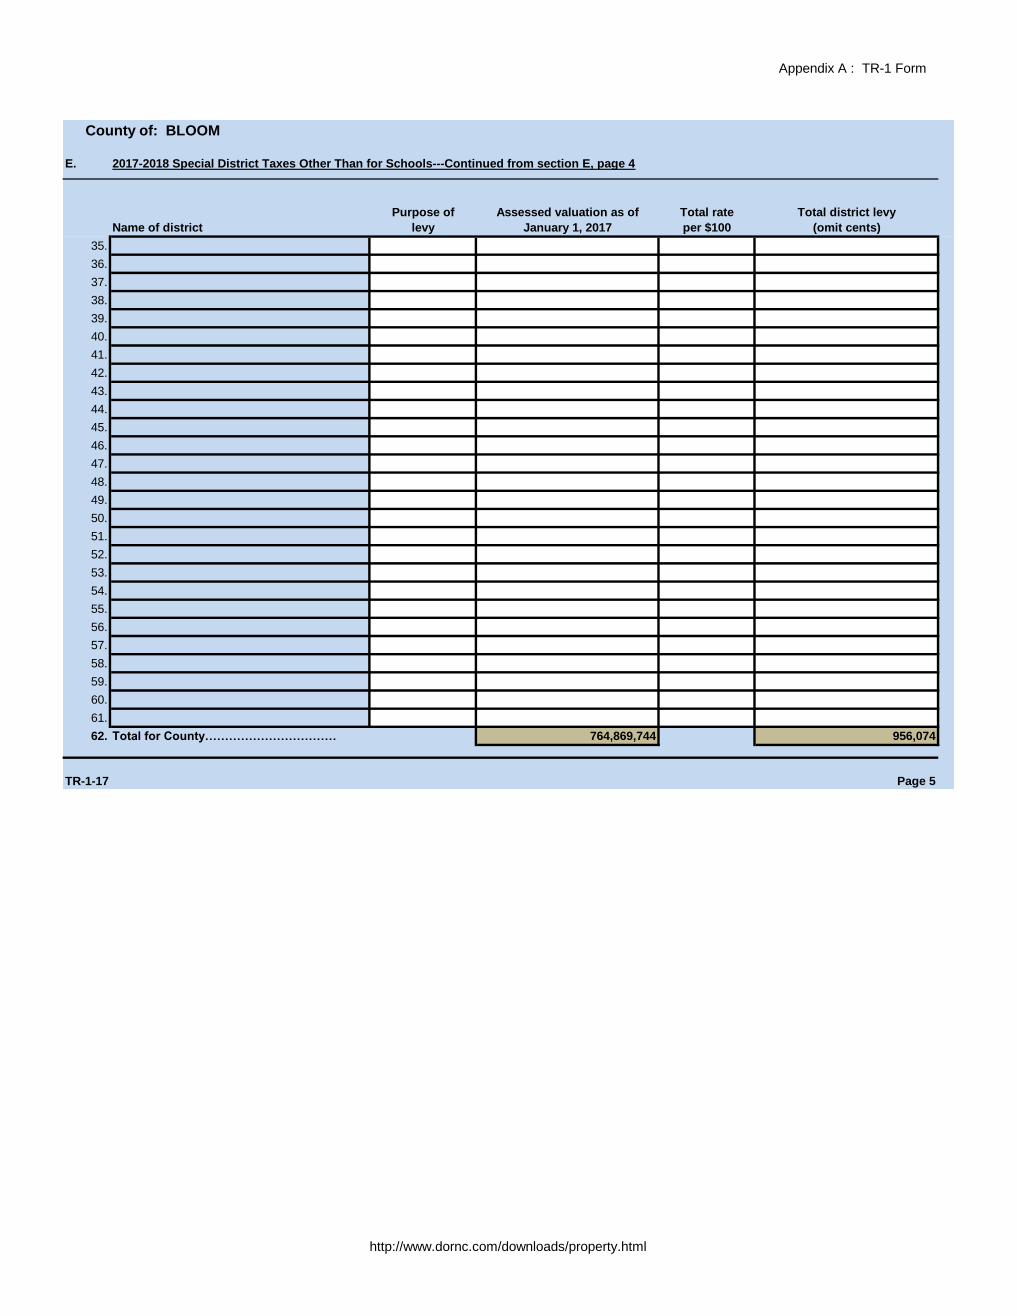
E. 2017-2018 Special District Taxes Other Than for Schools---Continued from section E, page 4
Purpose of Assessed valuation as of Total rate Total district levy
Name of district levy January 1, 2017 per $100 (omit cents)
35.
36.
37.
38.
39.
40.
41.
42.
43.
44.
45.
46.
47.
48.
49.
50.
51.
52.
53.
54.
55.
56.
57.
58.
59.
60.
61.
62. Total for County…………………………… 956,074
TR-1-17 Page 5
764,869,744
http://www.dornc.com/downloads/property.html
Appendix A : TR-1 Form
County of: BLOOM
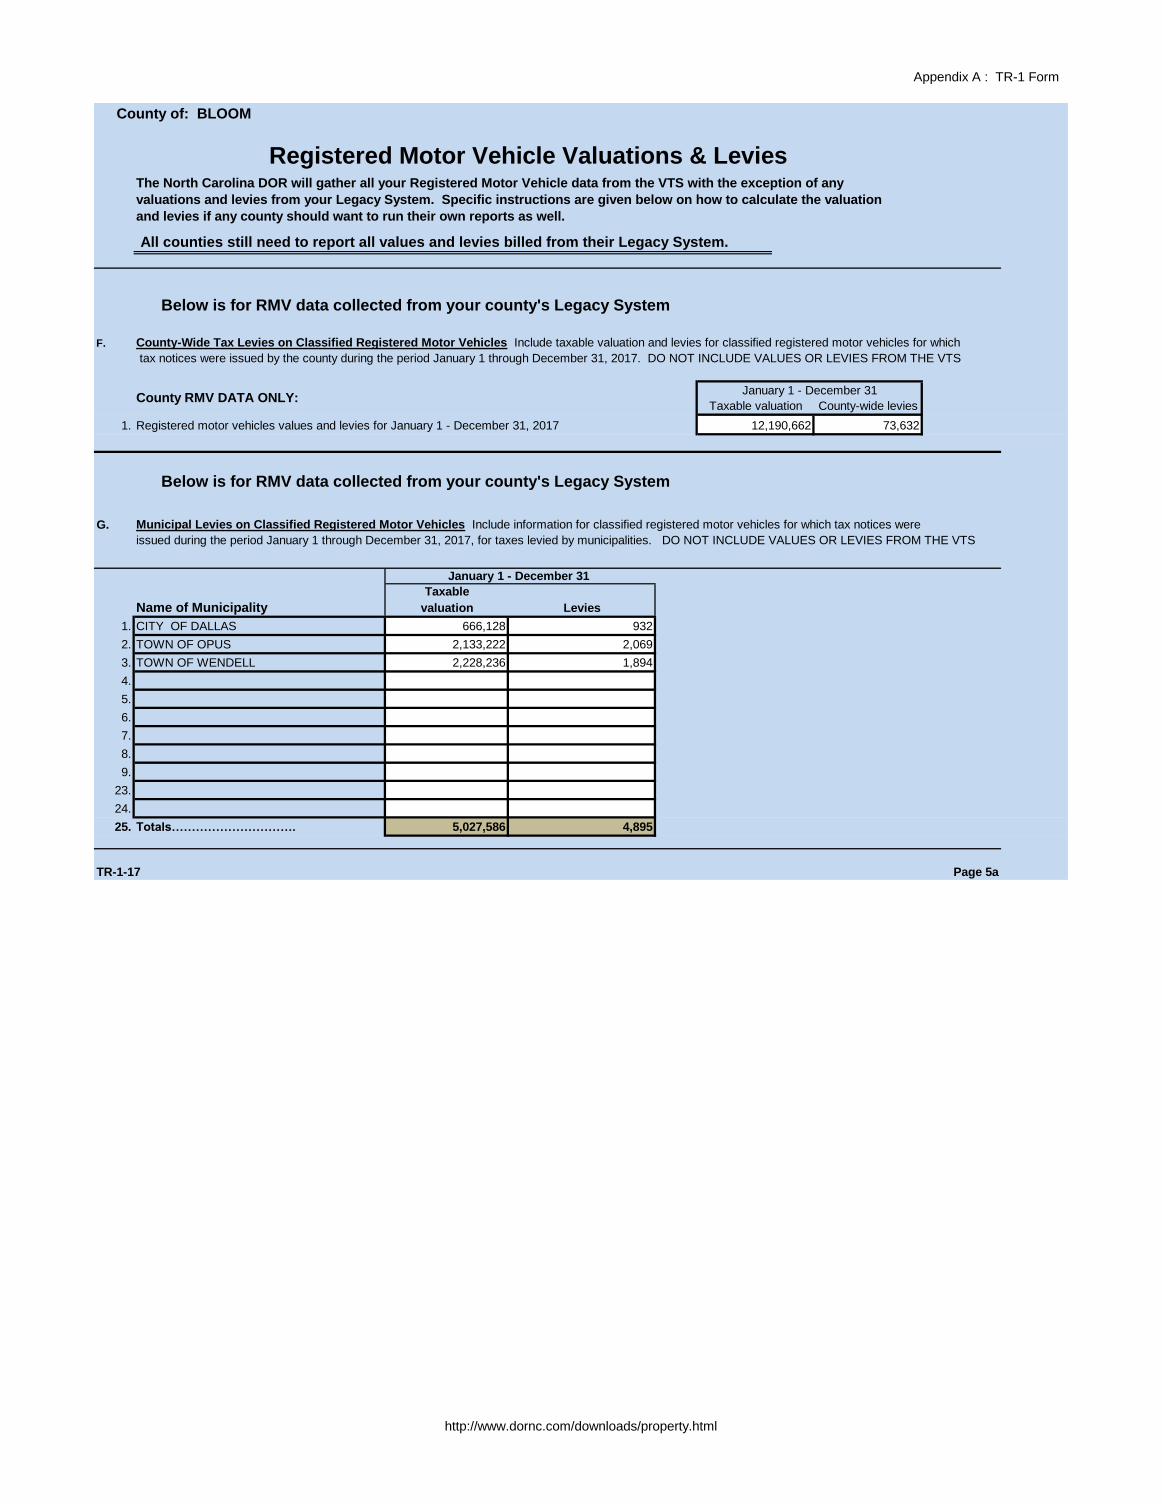
The North Carolina DOR will gather all your Registered Motor Vehicle data from the VTS with the exception of any
valuations and levies from your Legacy System. Specific instructions are given below on how to calculate the valuation
and levies if any county should want to run their own reports as well.
All counties still need to report all values and levies billed from their Legacy System.
F. County-Wide Tax Levies on Classified Registered Motor Vehicles Include taxable valuation and levies for classified registered motor vehicles for which
tax notices were issued by the county during the period January 1 through December 31, 2017. DO NOT INCLUDE VALUES OR LEVIES FROM THE VTS
Taxable valuation County-wide levies
1. Registered motor vehicles values and levies for January 1 - December 31, 2017 73,632
G. Municipal Levies on Classified Registered Motor Vehicles Include information for classified registered motor vehicles for which tax notices were
issued during the period January 1 through December 31, 2017, for taxes levied by municipalities. DO NOT INCLUDE VALUES OR LEVIES FROM THE VTS
January 1 - December 31
Taxable
Name of Municipality valuation Levies
1. CITY OF DALLAS 666,128 932
2. TOWN OF OPUS 2,133,222 2,069
3. TOWN OF WENDELL 2,228,236 1,894
4.
5.
6.
7.
8.
9.
23.
24.
25. Totals…………………………. 5,027,586 4,895
TR-1-17 Page 5a
Below is for RMV data collected from your county's Legacy System
Registered Motor Vehicle Valuations & Levies
January 1 - December 31County RMV DATA ONLY:
12,190,662
Below is for RMV data collected from your county's Legacy System
http://www.dornc.com/downloads/property.html
Appendix A : TR-1 Form
County of: BLOOM
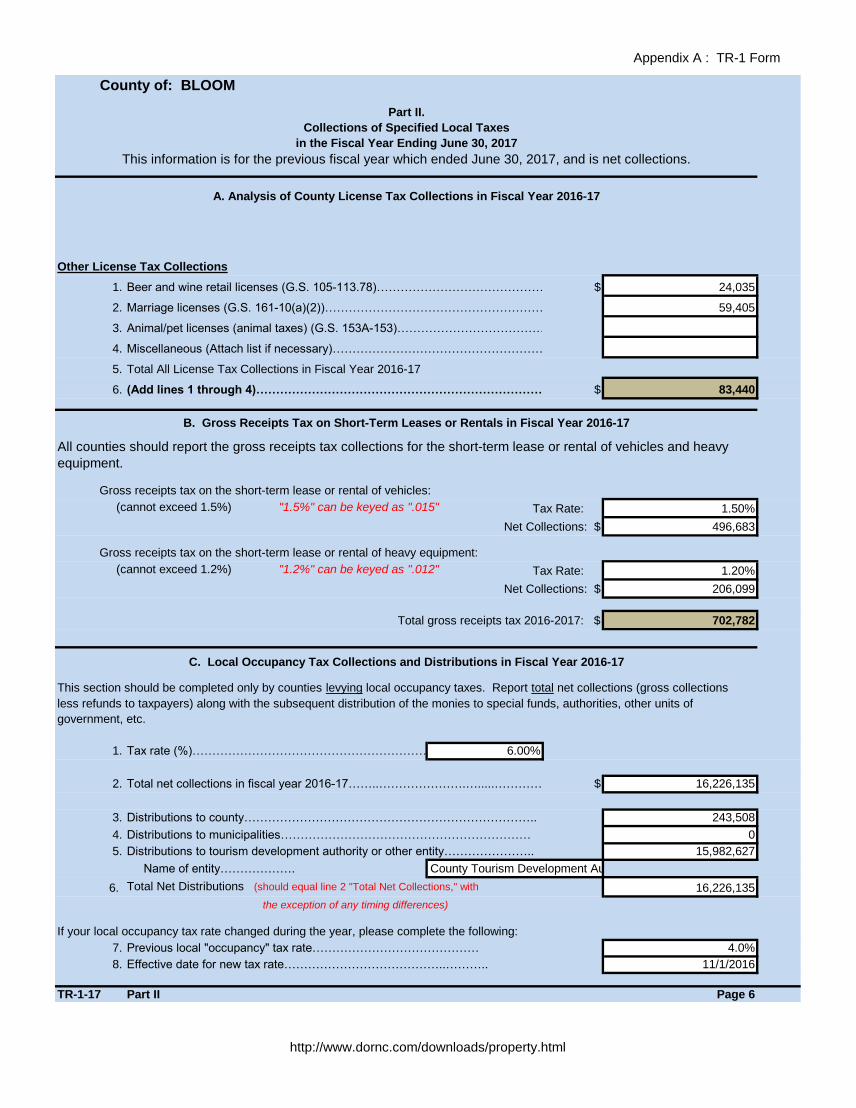
Part II.
Collections of Specified Local Taxes
in the Fiscal Year Ending June 30, 2017
A. Analysis of County License Tax Collections in Fiscal Year 2016-17
Other License Tax Collections
1. Beer and wine retail licenses (G.S. 105-113.78)…………………………………………… $ 24,035
2. Marriage licenses (G.S. 161-10(a)(2))…………………………………………………………….. 59,405
3. Animal/pet licenses (animal taxes) (G.S. 153A-153)……………………………………………
4. Miscellaneous (Attach list if necessary)………………………………………………………..
5. Total All License Tax Collections in Fiscal Year 2016-17
6. (Add lines 1 through 4)……………………………………………………………………. $ 83,440
All counties should report the gross receipts tax collections for the short-term lease or rental of vehicles and heavy
equipment.
Gross receipts tax on the short-term lease or rental of vehicles:
(cannot exceed 1.5%) "1.5%" can be keyed as ".015" Tax Rate: 1.50%
Net Collections: $ 496,683
Gross receipts tax on the short-term lease or rental of heavy equipment:
(cannot exceed 1.2%) "1.2%" can be keyed as ".012" Tax Rate: 1.20%
Net Collections: $ 206,099
Total gross receipts tax 2016-2017: $ 702,782
This section should be completed only by counties levying local occupancy taxes. Report total net collections (gross collections
less refunds to taxpayers) along with the subsequent distribution of the monies to special funds, authorities, other units of
government, etc.
1. Tax rate (%)…………………………………………………………………………………………6.00%
2. Total net collections in fiscal year 2016-17……..………………….….....………… $ 16,226,135
3. Distributions to county……………………………………………………………….. 243,508
4. Distributions to municipalities……………………………………………………… 0
5. Distributions to tourism development authority or other entity………………….. 15,982,627
Name of entity……………….
6. Total Net Distributions (should equal line 2 "Total Net Collections," with 16,226,135
the exception of any timing differences)
If your local occupancy tax rate changed during the year, please complete the following:
7. Previous local "occupancy" tax rate…………………………………… 4.0%
8. Effective date for new tax rate…………………………………..……….. 11/1/2016
TR-1-17 Part II Page 6
C. Local Occupancy Tax Collections and Distributions in Fiscal Year 2016-17
Bloom County Tourism Development Authority
This information is for the previous fiscal year which ended June 30, 2017, and is net collections.
B. Gross Receipts Tax on Short-Term Leases or Rentals in Fiscal Year 2016-17
http://www.dornc.com/downloads/property.html
Appendix A : TR-1 Form
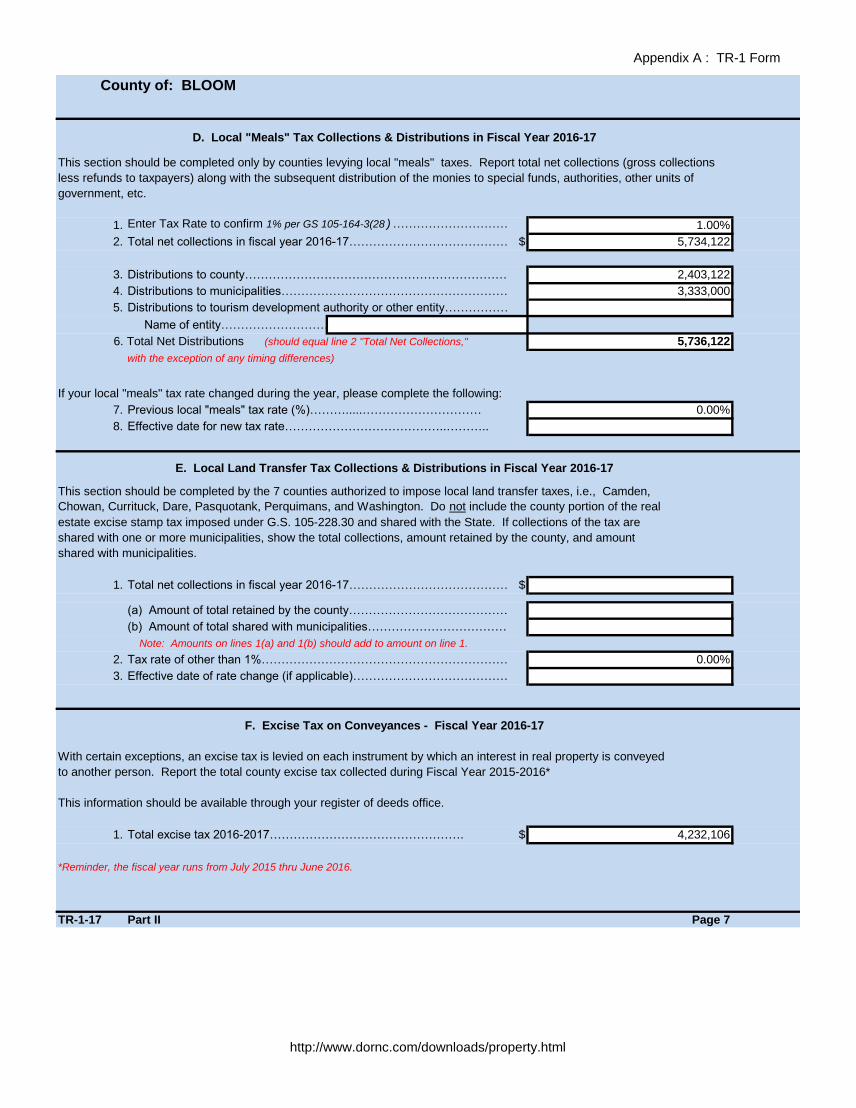
County of: BLOOM
D. Local "Meals" Tax Collections & Distributions in Fiscal Year 2016-17
This section should be completed only by counties levying local "meals" taxes. Report total net collections (gross collections
less refunds to taxpayers) along with the subsequent distribution of the monies to special funds, authorities, other units of
government, etc.
1. Enter Tax Rate to confirm 1% per GS 105-164-3(28 ) …………………………………………………………………………………………….. 1.00%
2. Total net collections in fiscal year 2016-17………………………………………………………$ 5,734,122
3. Distributions to county……………………………………………………………………………………. 2,403,122
4. Distributions to municipalities…………………………………………………………………………………………. 3,333,000
5. Distributions to tourism development authority or other entity…………………………………………..
Name of entity………………………………………………………………..
6. Total Net Distributions (should equal line 2 "Total Net Collections," 5,736,122
with the exception of any timing differences)
If your local "meals" tax rate changed during the year, please complete the following:
7. Previous local "meals" tax rate (%)……….....………………………… 0.00%
8. Effective date for new tax rate…………………………………..………..
E. Local Land Transfer Tax Collections & Distributions in Fiscal Year 2016-17
This section should be completed by the 7 counties authorized to impose local land transfer taxes, i.e., Camden,
Chowan, Currituck, Dare, Pasquotank, Perquimans, and Washington. Do not include the county portion of the real
estate excise stamp tax imposed under G.S. 105-228.30 and shared with the State. If collections of the tax are
shared with one or more municipalities, show the total collections, amount retained by the county, and amount
shared with municipalities.
1. Total net collections in fiscal year 2016-17………………………………………….$
(a) Amount of total retained by the county…………………………………………………….
(b) Amount of total shared with municipalities…………………………………………….
Note: Amounts on lines 1(a) and 1(b) should add to amount on line 1.
2. Tax rate of other than 1%…………………………………………………………………………… 0.00%
3. Effective date of rate change (if applicable)………………………………………………………….
F. Excise Tax on Conveyances - Fiscal Year 2016-17
With certain exceptions, an excise tax is levied on each instrument by which an interest in real property is conveyed
to another person. Report the total county excise tax collected during Fiscal Year 2015-2016*
This information should be available through your register of deeds office.
1. Total excise tax 2016-2017…………………………………………. $ 4,232,106
*Reminder, the fiscal year runs from July 2015 thru June 2016.
TR-1-17 Part II Page 7
http://www.dornc.com/downloads/property.html
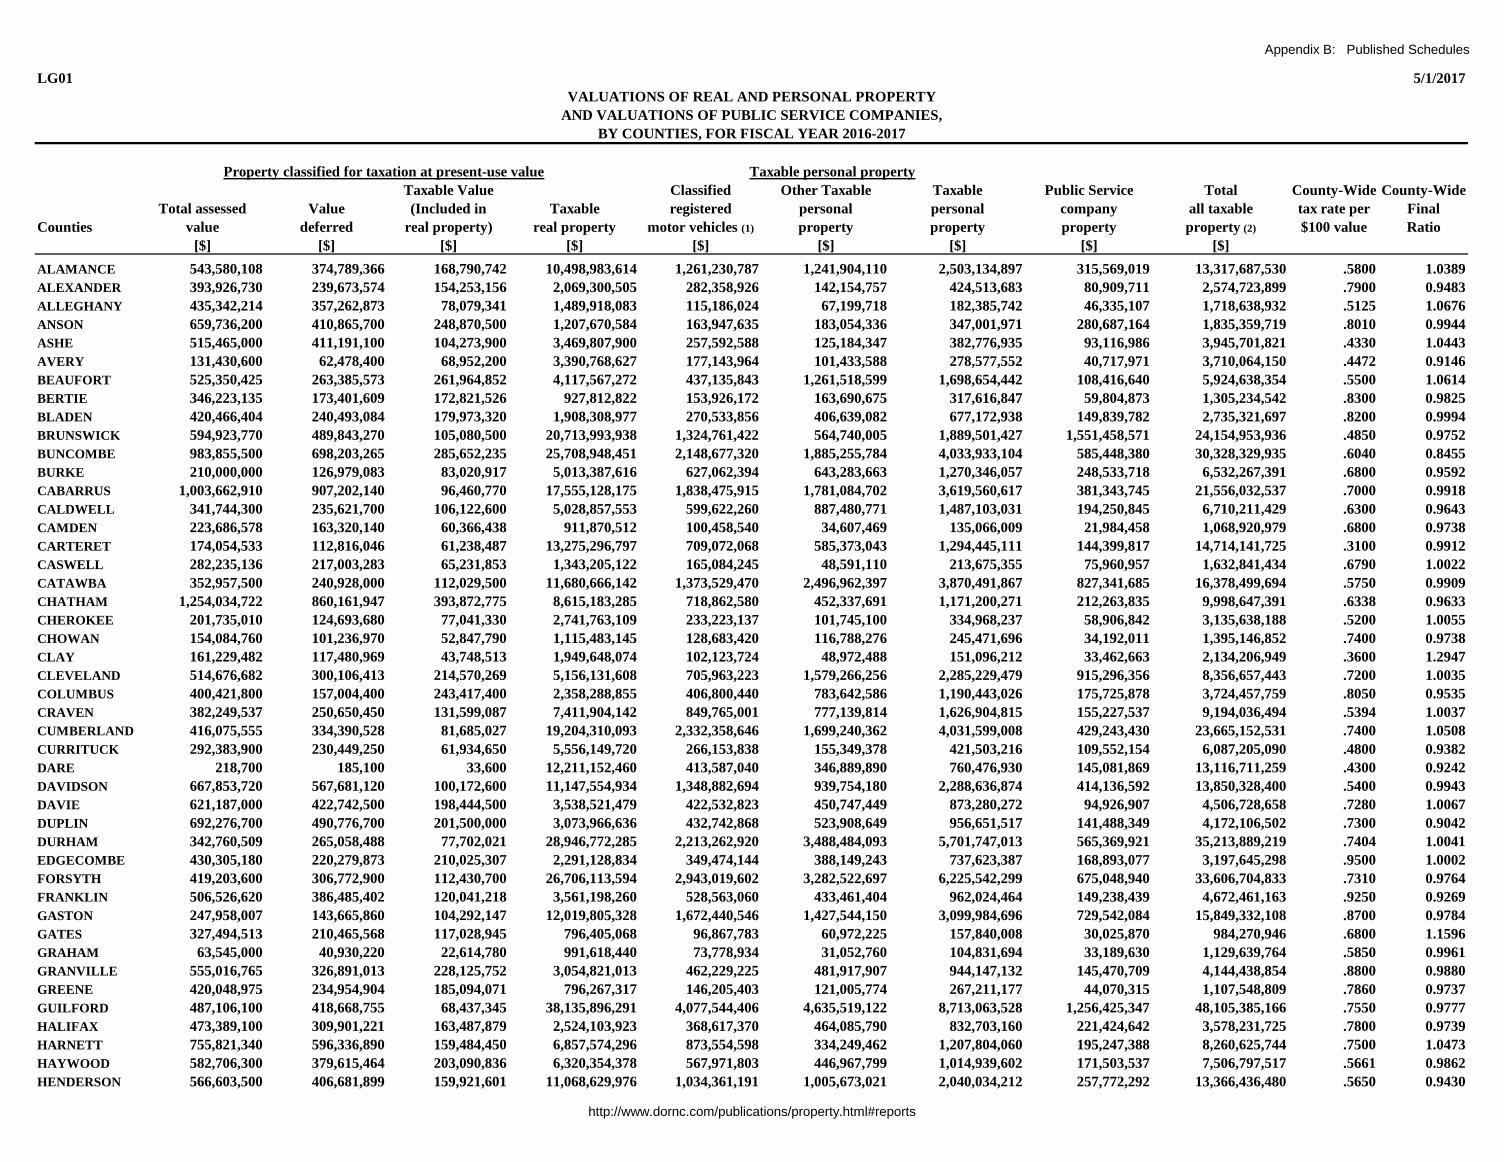
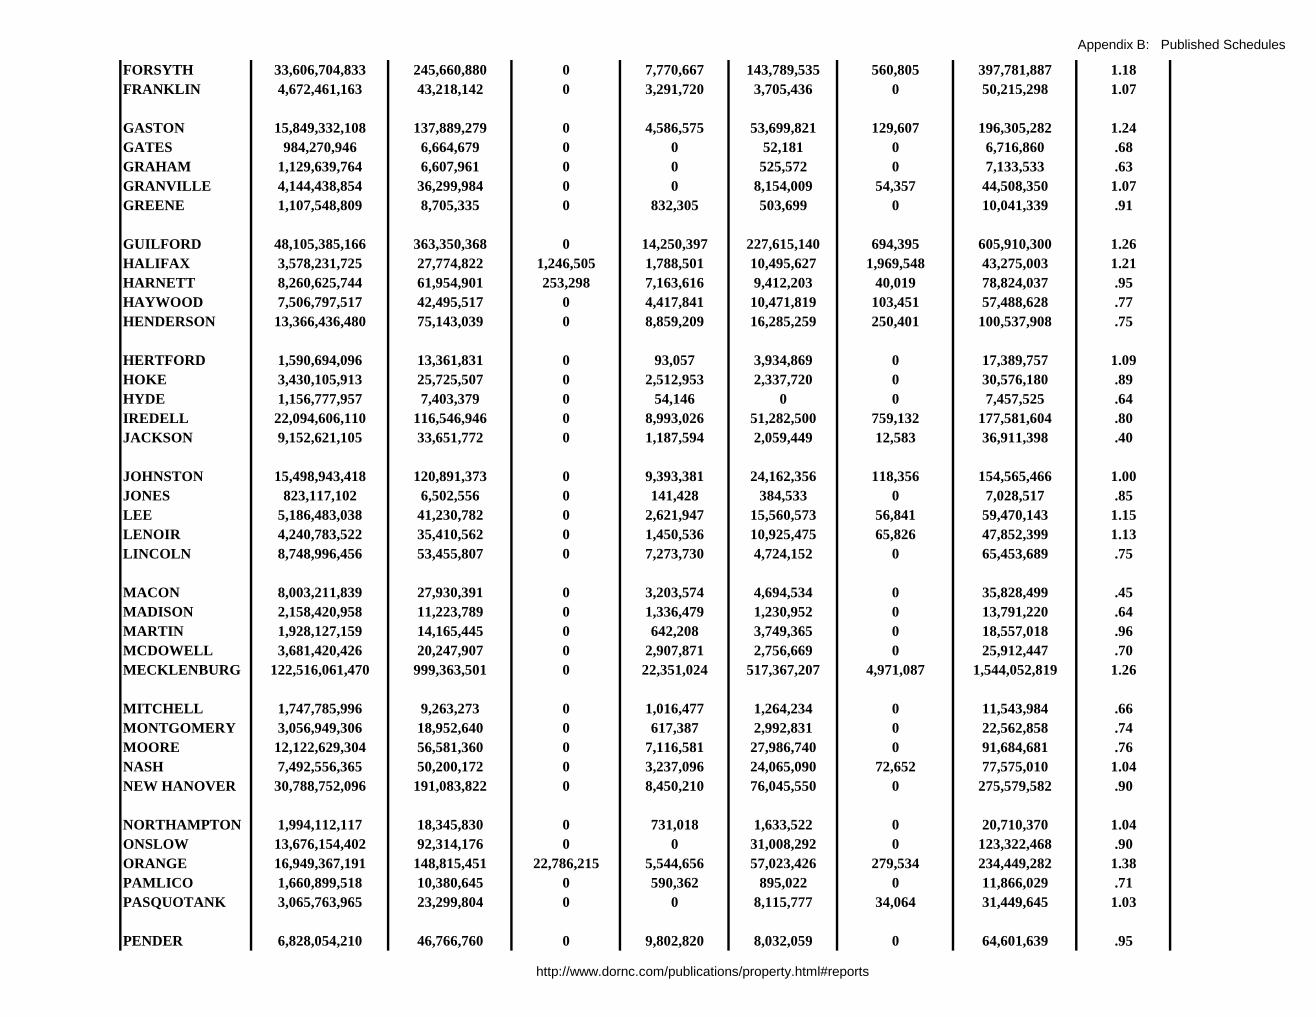
Appendix B: Published Schedules
LG01 5/1/2017
Taxable Value Classified Other Taxable Taxable Public Service Total County-Wide County-Wide
Total assessed Value (Included in Taxable registered personal personal company all taxable tax rate per Final
Counties value deferred real property) real property motor vehicles (1) property property property property (2) $100 value Ratio
[$] [$] [$] [$] [$] [$] [$] [$] [$]
ALAMANCE 543,580,108 374,789,366 168,790,742 10,498,983,614 1,261,230,787 1,241,904,110 2,503,134,897 315,569,019 13,317,687,530 .5800 1.0389
ALEXANDER 393,926,730 239,673,574 154,253,156 2,069,300,505 282,358,926 142,154,757 424,513,683 80,909,711 2,574,723,899 .7900 0.9483
ALLEGHANY 435,342,214 357,262,873 78,079,341 1,489,918,083 115,186,024 67,199,718 182,385,742 46,335,107 1,718,638,932 .5125 1.0676
ANSON 659,736,200 410,865,700 248,870,500 1,207,670,584 163,947,635 183,054,336 347,001,971 280,687,164 1,835,359,719 .8010 0.9944
ASHE 515,465,000 411,191,100 104,273,900 3,469,807,900 257,592,588 125,184,347 382,776,935 93,116,986 3,945,701,821 .4330 1.0443
AVERY 131,430,600 62,478,400 68,952,200 3,390,768,627 177,143,964 101,433,588 278,577,552 40,717,971 3,710,064,150 .4472 0.9146
BEAUFORT 525,350,425 263,385,573 261,964,852 4,117,567,272 437,135,843 1,261,518,599 1,698,654,442 108,416,640 5,924,638,354 .5500 1.0614
BERTIE 346,223,135 173,401,609 172,821,526 927,812,822 153,926,172 163,690,675 317,616,847 59,804,873 1,305,234,542 .8300 0.9825
BLADEN 420,466,404 240,493,084 179,973,320 1,908,308,977 270,533,856 406,639,082 677,172,938 149,839,782 2,735,321,697 .8200 0.9994
BRUNSWICK 594,923,770 489,843,270 105,080,500 20,713,993,938 1,324,761,422 564,740,005 1,889,501,427 1,551,458,571 24,154,953,936 .4850 0.9752
BUNCOMBE 983,855,500 698,203,265 285,652,235 25,708,948,451 2,148,677,320 1,885,255,784 4,033,933,104 585,448,380 30,328,329,935 .6040 0.8455
BURKE 210,000,000 126,979,083 83,020,917 5,013,387,616 627,062,394 643,283,663 1,270,346,057 248,533,718 6,532,267,391 .6800 0.9592
CABARRUS 1,003,662,910 907,202,140 96,460,770 17,555,128,175 1,838,475,915 1,781,084,702 3,619,560,617 381,343,745 21,556,032,537 .7000 0.9918
CALDWELL 341,744,300 235,621,700 106,122,600 5,028,857,553 599,622,260 887,480,771 1,487,103,031 194,250,845 6,710,211,429 .6300 0.9643
CAMDEN 223,686,578 163,320,140 60,366,438 911,870,512 100,458,540 34,607,469 135,066,009 21,984,458 1,068,920,979 .6800 0.9738
CARTERET 174,054,533 112,816,046 61,238,487 13,275,296,797 709,072,068 585,373,043 1,294,445,111 144,399,817 14,714,141,725 .3100 0.9912
CASWELL 282,235,136 217,003,283 65,231,853 1,343,205,122 165,084,245 48,591,110 213,675,355 75,960,957 1,632,841,434 .6790 1.0022
CATAWBA 352,957,500 240,928,000 112,029,500 11,680,666,142 1,373,529,470 2,496,962,397 3,870,491,867 827,341,685 16,378,499,694 .5750 0.9909
CHATHAM 1,254,034,722 860,161,947 393,872,775 8,615,183,285 718,862,580 452,337,691 1,171,200,271 212,263,835 9,998,647,391 .6338 0.9633
CHEROKEE 201,735,010 124,693,680 77,041,330 2,741,763,109 233,223,137 101,745,100 334,968,237 58,906,842 3,135,638,188 .5200 1.0055
CHOWAN 154,084,760 101,236,970 52,847,790 1,115,483,145 128,683,420 116,788,276 245,471,696 34,192,011 1,395,146,852 .7400 0.9738
CLAY 161,229,482 117,480,969 43,748,513 1,949,648,074 102,123,724 48,972,488 151,096,212 33,462,663 2,134,206,949 .3600 1.2947
CLEVELAND 514,676,682 300,106,413 214,570,269 5,156,131,608 705,963,223 1,579,266,256 2,285,229,479 915,296,356 8,356,657,443 .7200 1.0035
COLUMBUS 400,421,800 157,004,400 243,417,400 2,358,288,855 406,800,440 783,642,586 1,190,443,026 175,725,878 3,724,457,759 .8050 0.9535
CRAVEN 382,249,537 250,650,450 131,599,087 7,411,904,142 849,765,001 777,139,814 1,626,904,815 155,227,537 9,194,036,494 .5394 1.0037
CUMBERLAND 416,075,555 334,390,528 81,685,027 19,204,310,093 2,332,358,646 1,699,240,362 4,031,599,008 429,243,430 23,665,152,531 .7400 1.0508
CURRITUCK 292,383,900 230,449,250 61,934,650 5,556,149,720 266,153,838 155,349,378 421,503,216 109,552,154 6,087,205,090 .4800 0.9382
DARE 218,700 185,100 33,600 12,211,152,460 413,587,040 346,889,890 760,476,930 145,081,869 13,116,711,259 .4300 0.9242
DAVIDSON 667,853,720 567,681,120 100,172,600 11,147,554,934 1,348,882,694 939,754,180 2,288,636,874 414,136,592 13,850,328,400 .5400 0.9943
DAVIE 621,187,000 422,742,500 198,444,500 3,538,521,479 422,532,823 450,747,449 873,280,272 94,926,907 4,506,728,658 .7280 1.0067
DUPLIN 692,276,700 490,776,700 201,500,000 3,073,966,636 432,742,868 523,908,649 956,651,517 141,488,349 4,172,106,502 .7300 0.9042
DURHAM 342,760,509 265,058,488 77,702,021 28,946,772,285 2,213,262,920 3,488,484,093 5,701,747,013 565,369,921 35,213,889,219 .7404 1.0041
EDGECOMBE 430,305,180 220,279,873 210,025,307 2,291,128,834 349,474,144 388,149,243 737,623,387 168,893,077 3,197,645,298 .9500 1.0002
FORSYTH 419,203,600 306,772,900 112,430,700 26,706,113,594 2,943,019,602 3,282,522,697 6,225,542,299 675,048,940 33,606,704,833 .7310 0.9764
FRANKLIN 506,526,620 386,485,402 120,041,218 3,561,198,260 528,563,060 433,461,404 962,024,464 149,238,439 4,672,461,163 .9250 0.9269
GASTON 247,958,007 143,665,860 104,292,147 12,019,805,328 1,672,440,546 1,427,544,150 3,099,984,696 729,542,084 15,849,332,108 .8700 0.9784
GATES 327,494,513 210,465,568 117,028,945 796,405,068 96,867,783 60,972,225 157,840,008 30,025,870 984,270,946 .6800 1.1596
GRAHAM 63,545,000 40,930,220 22,614,780 991,618,440 73,778,934 31,052,760 104,831,694 33,189,630 1,129,639,764 .5850 0.9961
GRANVILLE 555,016,765 326,891,013 228,125,752 3,054,821,013 462,229,225 481,917,907 944,147,132 145,470,709 4,144,438,854 .8800 0.9880
GREENE 420,048,975 234,954,904 185,094,071 796,267,317 146,205,403 121,005,774 267,211,177 44,070,315 1,107,548,809 .7860 0.9737
GUILFORD 487,106,100 418,668,755 68,437,345 38,135,896,291 4,077,544,406 4,635,519,122 8,713,063,528 1,256,425,347 48,105,385,166 .7550 0.9777
HALIFAX 473,389,100 309,901,221 163,487,879 2,524,103,923 368,617,370 464,085,790 832,703,160 221,424,642 3,578,231,725 .7800 0.9739
HARNETT 755,821,340 596,336,890 159,484,450 6,857,574,296 873,554,598 334,249,462 1,207,804,060 195,247,388 8,260,625,744 .7500 1.0473
HAYWOOD 582,706,300 379,615,464 203,090,836 6,320,354,378 567,971,803 446,967,799 1,014,939,602 171,503,537 7,506,797,517 .5661 0.9862
HENDERSON 566,603,500 406,681,899 159,921,601 11,068,629,976 1,034,361,191 1,005,673,021 2,040,034,212 257,772,292 13,366,436,480 .5650 0.9430
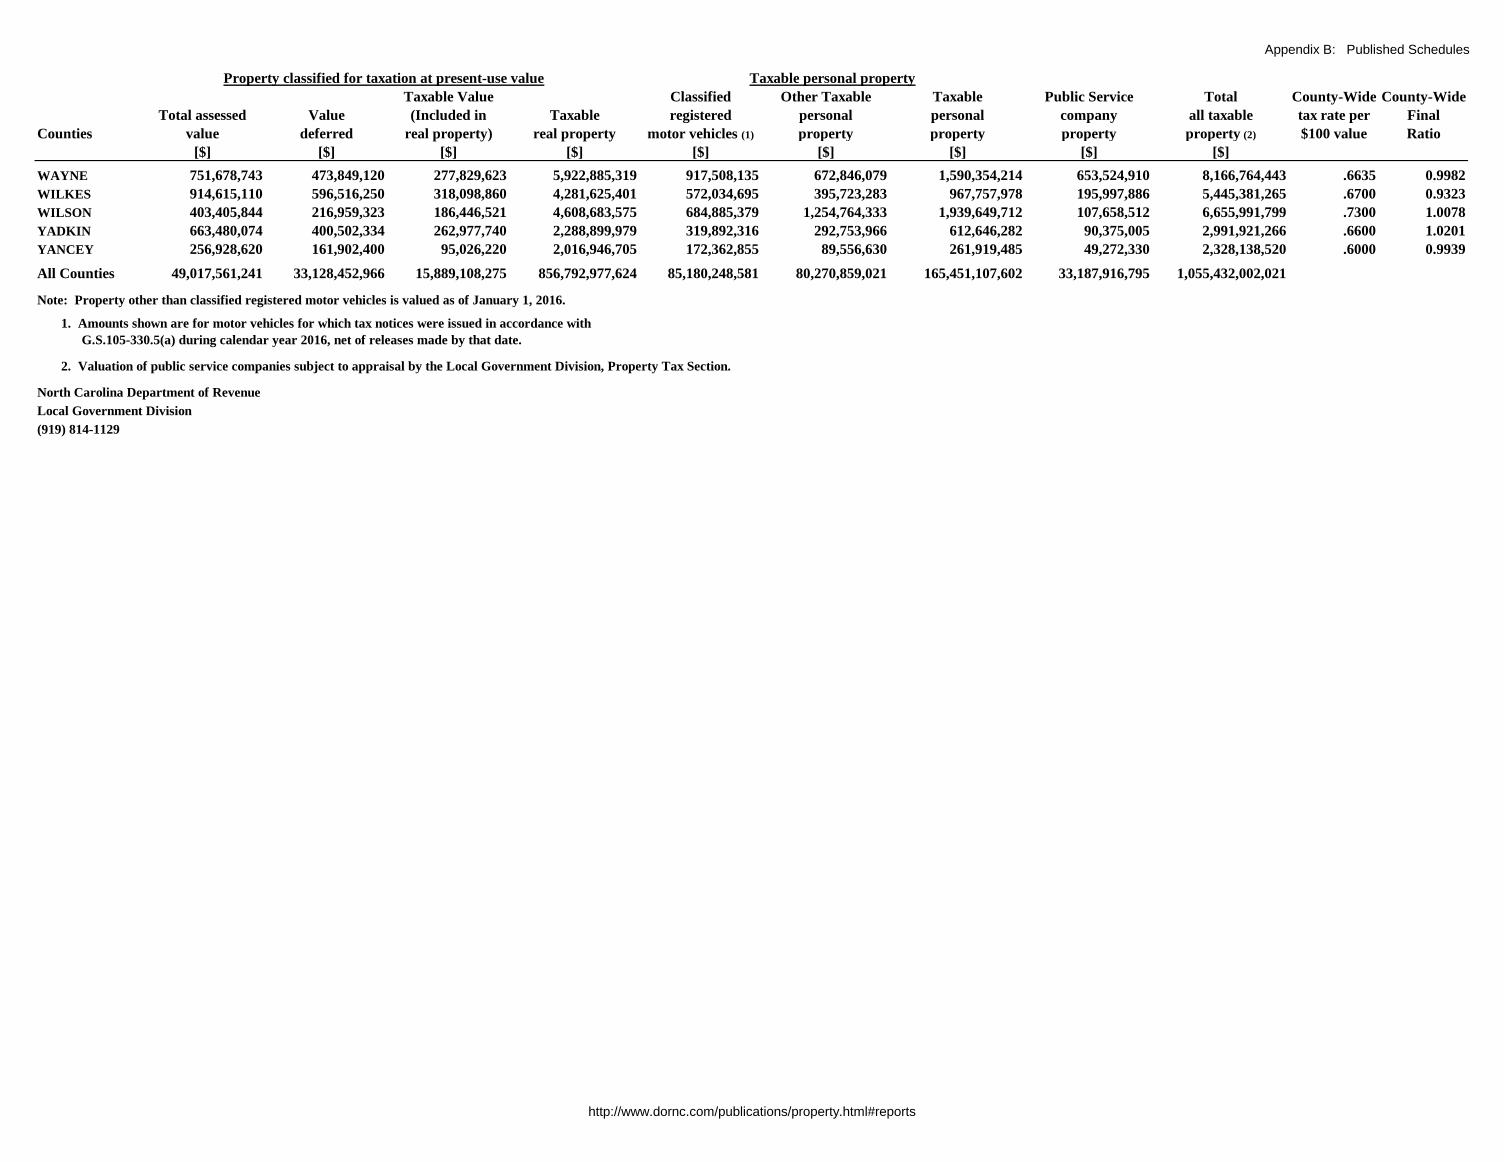
VALUATIONS OF REAL AND PERSONAL PROPERTY
AND VALUATIONS OF PUBLIC SERVICE COMPANIES,
BY COUNTIES, FOR FISCAL YEAR 2016-2017
Property classified for taxation at present-use value Taxable personal property
http://www.dornc.com/publications/property.html#reports
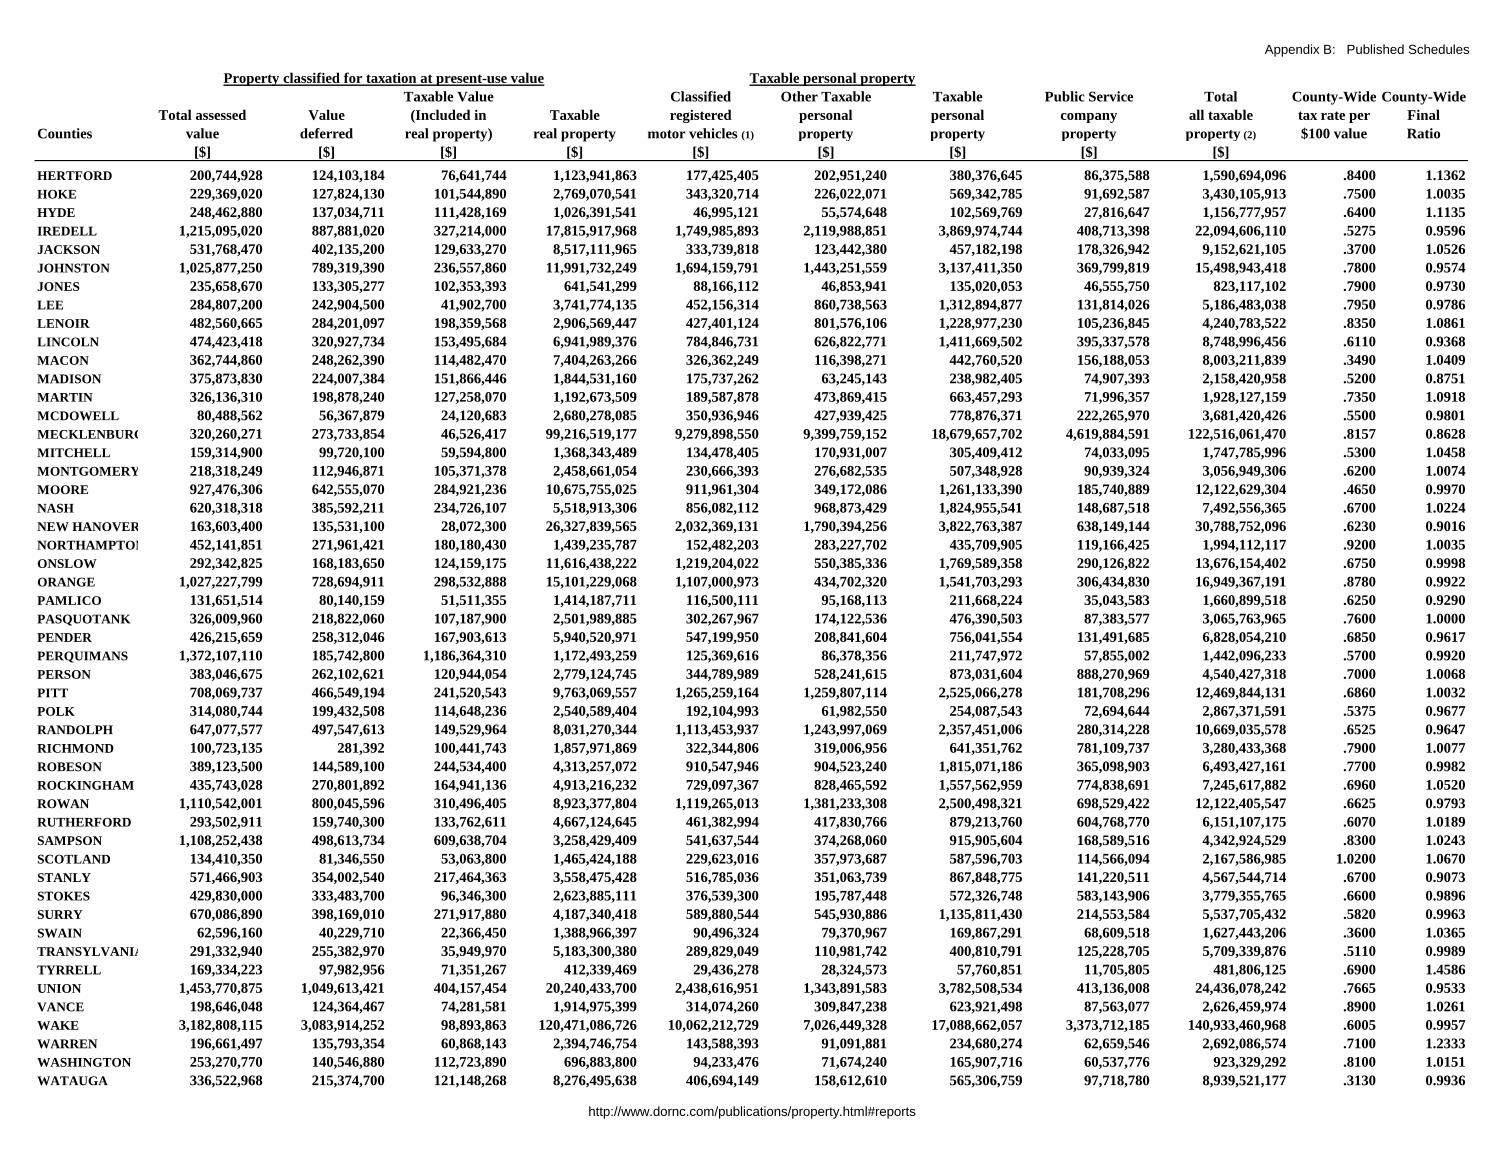
Appendix B: Published Schedules
Taxable Value Classified Other Taxable Taxable Public Service Total County-Wide County-Wide
Total assessed Value (Included in Taxable registered personal personal company all taxable tax rate per Final
Counties value deferred real property) real property motor vehicles (1) property property property property (2) $100 value Ratio
[$] [$] [$] [$] [$] [$] [$] [$] [$]
Property classified for taxation at present-use value Taxable personal property
HERTFORD 200,744,928 124,103,184 76,641,744 1,123,941,863 177,425,405 202,951,240 380,376,645 86,375,588 1,590,694,096 .8400 1.1362
HOKE 229,369,020 127,824,130 101,544,890 2,769,070,541 343,320,714 226,022,071 569,342,785 91,692,587 3,430,105,913 .7500 1.0035
HYDE 248,462,880 137,034,711 111,428,169 1,026,391,541 46,995,121 55,574,648 102,569,769 27,816,647 1,156,777,957 .6400 1.1135
IREDELL 1,215,095,020 887,881,020 327,214,000 17,815,917,968 1,749,985,893 2,119,988,851 3,869,974,744 408,713,398 22,094,606,110 .5275 0.9596
JACKSON 531,768,470 402,135,200 129,633,270 8,517,111,965 333,739,818 123,442,380 457,182,198 178,326,942 9,152,621,105 .3700 1.0526
JOHNSTON 1,025,877,250 789,319,390 236,557,860 11,991,732,249 1,694,159,791 1,443,251,559 3,137,411,350 369,799,819 15,498,943,418 .7800 0.9574
JONES 235,658,670 133,305,277 102,353,393 641,541,299 88,166,112 46,853,941 135,020,053 46,555,750 823,117,102 .7900 0.9730
LEE 284,807,200 242,904,500 41,902,700 3,741,774,135 452,156,314 860,738,563 1,312,894,877 131,814,026 5,186,483,038 .7950 0.9786
LENOIR 482,560,665 284,201,097 198,359,568 2,906,569,447 427,401,124 801,576,106 1,228,977,230 105,236,845 4,240,783,522 .8350 1.0861
LINCOLN 474,423,418 320,927,734 153,495,684 6,941,989,376 784,846,731 626,822,771 1,411,669,502 395,337,578 8,748,996,456 .6110 0.9368
MACON 362,744,860 248,262,390 114,482,470 7,404,263,266 326,362,249 116,398,271 442,760,520 156,188,053 8,003,211,839 .3490 1.0409
MADISON 375,873,830 224,007,384 151,866,446 1,844,531,160 175,737,262 63,245,143 238,982,405 74,907,393 2,158,420,958 .5200 0.8751
MARTIN 326,136,310 198,878,240 127,258,070 1,192,673,509 189,587,878 473,869,415 663,457,293 71,996,357 1,928,127,159 .7350 1.0918
MCDOWELL 80,488,562 56,367,879 24,120,683 2,680,278,085 350,936,946 427,939,425 778,876,371 222,265,970 3,681,420,426 .5500 0.9801
MECKLENBURG 320,260,271 273,733,854 46,526,417 99,216,519,177 9,279,898,550 9,399,759,152 18,679,657,702 4,619,884,591 122,516,061,470 .8157 0.8628
MITCHELL 159,314,900 99,720,100 59,594,800 1,368,343,489 134,478,405 170,931,007 305,409,412 74,033,095 1,747,785,996 .5300 1.0458
MONTGOMERY 218,318,249 112,946,871 105,371,378 2,458,661,054 230,666,393 276,682,535 507,348,928 90,939,324 3,056,949,306 .6200 1.0074
MOORE 927,476,306 642,555,070 284,921,236 10,675,755,025 911,961,304 349,172,086 1,261,133,390 185,740,889 12,122,629,304 .4650 0.9970
NASH 620,318,318 385,592,211 234,726,107 5,518,913,306 856,082,112 968,873,429 1,824,955,541 148,687,518 7,492,556,365 .6700 1.0224
NEW HANOVER 163,603,400 135,531,100 28,072,300 26,327,839,565 2,032,369,131 1,790,394,256 3,822,763,387 638,149,144 30,788,752,096 .6230 0.9016
NORTHAMPTON 452,141,851 271,961,421 180,180,430 1,439,235,787 152,482,203 283,227,702 435,709,905 119,166,425 1,994,112,117 .9200 1.0035
ONSLOW 292,342,825 168,183,650 124,159,175 11,616,438,222 1,219,204,022 550,385,336 1,769,589,358 290,126,822 13,676,154,402 .6750 0.9998
ORANGE 1,027,227,799 728,694,911 298,532,888 15,101,229,068 1,107,000,973 434,702,320 1,541,703,293 306,434,830 16,949,367,191 .8780 0.9922
PAMLICO 131,651,514 80,140,159 51,511,355 1,414,187,711 116,500,111 95,168,113 211,668,224 35,043,583 1,660,899,518 .6250 0.9290
PASQUOTANK 326,009,960 218,822,060 107,187,900 2,501,989,885 302,267,967 174,122,536 476,390,503 87,383,577 3,065,763,965 .7600 1.0000
PENDER 426,215,659 258,312,046 167,903,613 5,940,520,971 547,199,950 208,841,604 756,041,554 131,491,685 6,828,054,210 .6850 0.9617
PERQUIMANS 1,372,107,110 185,742,800 1,186,364,310 1,172,493,259 125,369,616 86,378,356 211,747,972 57,855,002 1,442,096,233 .5700 0.9920
PERSON 383,046,675 262,102,621 120,944,054 2,779,124,745 344,789,989 528,241,615 873,031,604 888,270,969 4,540,427,318 .7000 1.0068
PITT 708,069,737 466,549,194 241,520,543 9,763,069,557 1,265,259,164 1,259,807,114 2,525,066,278 181,708,296 12,469,844,131 .6860 1.0032
POLK 314,080,744 199,432,508 114,648,236 2,540,589,404 192,104,993 61,982,550 254,087,543 72,694,644 2,867,371,591 .5375 0.9677
RANDOLPH 647,077,577 497,547,613 149,529,964 8,031,270,344 1,113,453,937 1,243,997,069 2,357,451,006 280,314,228 10,669,035,578 .6525 0.9647
RICHMOND 100,723,135 281,392 100,441,743 1,857,971,869 322,344,806 319,006,956 641,351,762 781,109,737 3,280,433,368 .7900 1.0077
ROBESON 389,123,500 144,589,100 244,534,400 4,313,257,072 910,547,946 904,523,240 1,815,071,186 365,098,903 6,493,427,161 .7700 0.9982
ROCKINGHAM 435,743,028 270,801,892 164,941,136 4,913,216,232 729,097,367 828,465,592 1,557,562,959 774,838,691 7,245,617,882 .6960 1.0520
ROWAN 1,110,542,001 800,045,596 310,496,405 8,923,377,804 1,119,265,013 1,381,233,308 2,500,498,321 698,529,422 12,122,405,547 .6625 0.9793
RUTHERFORD 293,502,911 159,740,300 133,762,611 4,667,124,645 461,382,994 417,830,766 879,213,760 604,768,770 6,151,107,175 .6070 1.0189
SAMPSON 1,108,252,438 498,613,734 609,638,704 3,258,429,409 541,637,544 374,268,060 915,905,604 168,589,516 4,342,924,529 .8300 1.0243
SCOTLAND 134,410,350 81,346,550 53,063,800 1,465,424,188 229,623,016 357,973,687 587,596,703 114,566,094 2,167,586,985 1.0200 1.0670
STANLY 571,466,903 354,002,540 217,464,363 3,558,475,428 516,785,036 351,063,739 867,848,775 141,220,511 4,567,544,714 .6700 0.9073
STOKES 429,830,000 333,483,700 96,346,300 2,623,885,111 376,539,300 195,787,448 572,326,748 583,143,906 3,779,355,765 .6600 0.9896
SURRY 670,086,890 398,169,010 271,917,880 4,187,340,418 589,880,544 545,930,886 1,135,811,430 214,553,584 5,537,705,432 .5820 0.9963
SWAIN 62,596,160 40,229,710 22,366,450 1,388,966,397 90,496,324 79,370,967 169,867,291 68,609,518 1,627,443,206 .3600 1.0365
TRANSYLVANIA 291,332,940 255,382,970 35,949,970 5,183,300,380 289,829,049 110,981,742 400,810,791 125,228,705 5,709,339,876 .5110 0.9989
TYRRELL 169,334,223 97,982,956 71,351,267 412,339,469 29,436,278 28,324,573 57,760,851 11,705,805 481,806,125 .6900 1.4586
UNION 1,453,770,875 1,049,613,421 404,157,454 20,240,433,700 2,438,616,951 1,343,891,583 3,782,508,534 413,136,008 24,436,078,242 .7665 0.9533
VANCE 198,646,048 124,364,467 74,281,581 1,914,975,399 314,074,260 309,847,238 623,921,498 87,563,077 2,626,459,974 .8900 1.0261
WAKE 3,182,808,115 3,083,914,252 98,893,863 120,471,086,726 10,062,212,729 7,026,449,328 17,088,662,057 3,373,712,185 140,933,460,968 .6005 0.9957
WARREN 196,661,497 135,793,354 60,868,143 2,394,746,754 143,588,393 91,091,881 234,680,274 62,659,546 2,692,086,574 .7100 1.2333
WASHINGTON 253,270,770 140,546,880 112,723,890 696,883,800 94,233,476 71,674,240 165,907,716 60,537,776 923,329,292 .8100 1.0151
WATAUGA 336,522,968 215,374,700 121,148,268 8,276,495,638 406,694,149 158,612,610 565,306,759 97,718,780 8,939,521,177 .3130 0.9936
http://www.dornc.com/publications/property.html#reports
Appendix B: Published Schedules
Taxable Value Classified Other Taxable Taxable Public Service Total County-Wide County-Wide
Total assessed Value (Included in Taxable registered personal personal company all taxable tax rate per Final
Counties value deferred real property) real property motor vehicles (1) property property property property (2) $100 value Ratio
[$] [$] [$] [$] [$] [$] [$] [$] [$]
Property classified for taxation at present-use value Taxable personal property
WAYNE 751,678,743 473,849,120 277,829,623 5,922,885,319 917,508,135 672,846,079 1,590,354,214 653,524,910 8,166,764,443 .6635 0.9982
WILKES 914,615,110 596,516,250 318,098,860 4,281,625,401 572,034,695 395,723,283 967,757,978 195,997,886 5,445,381,265 .6700 0.9323
WILSON 403,405,844 216,959,323 186,446,521 4,608,683,575 684,885,379 1,254,764,333 1,939,649,712 107,658,512 6,655,991,799 .7300 1.0078
YADKIN 663,480,074 400,502,334 262,977,740 2,288,899,979 319,892,316 292,753,966 612,646,282 90,375,005 2,991,921,266 .6600 1.0201
YANCEY 256,928,620 161,902,400 95,026,220 2,016,946,705 172,362,855 89,556,630 261,919,485 49,272,330 2,328,138,520 .6000 0.9939
All Counties 49,017,561,241 33,128,452,966 15,889,108,275 856,792,977,624 85,180,248,581 80,270,859,021 165,451,107,602 33,187,916,795 1,055,432,002,021
Note: Property other than classified registered motor vehicles is valued as of January 1, 2016.
1. Amounts shown are for motor vehicles for which tax notices were issued in accordance with
G.S.105-330.5(a) during calendar year 2016, net of releases made by that date.
2. Valuation of public service companies subject to appraisal by the Local Government Division, Property Tax Section.
North Carolina Department of Revenue
Local Government Division
(919) 814-1129
http://www.dornc.com/publications/property.html#reports
Appendix B: Published Schedules
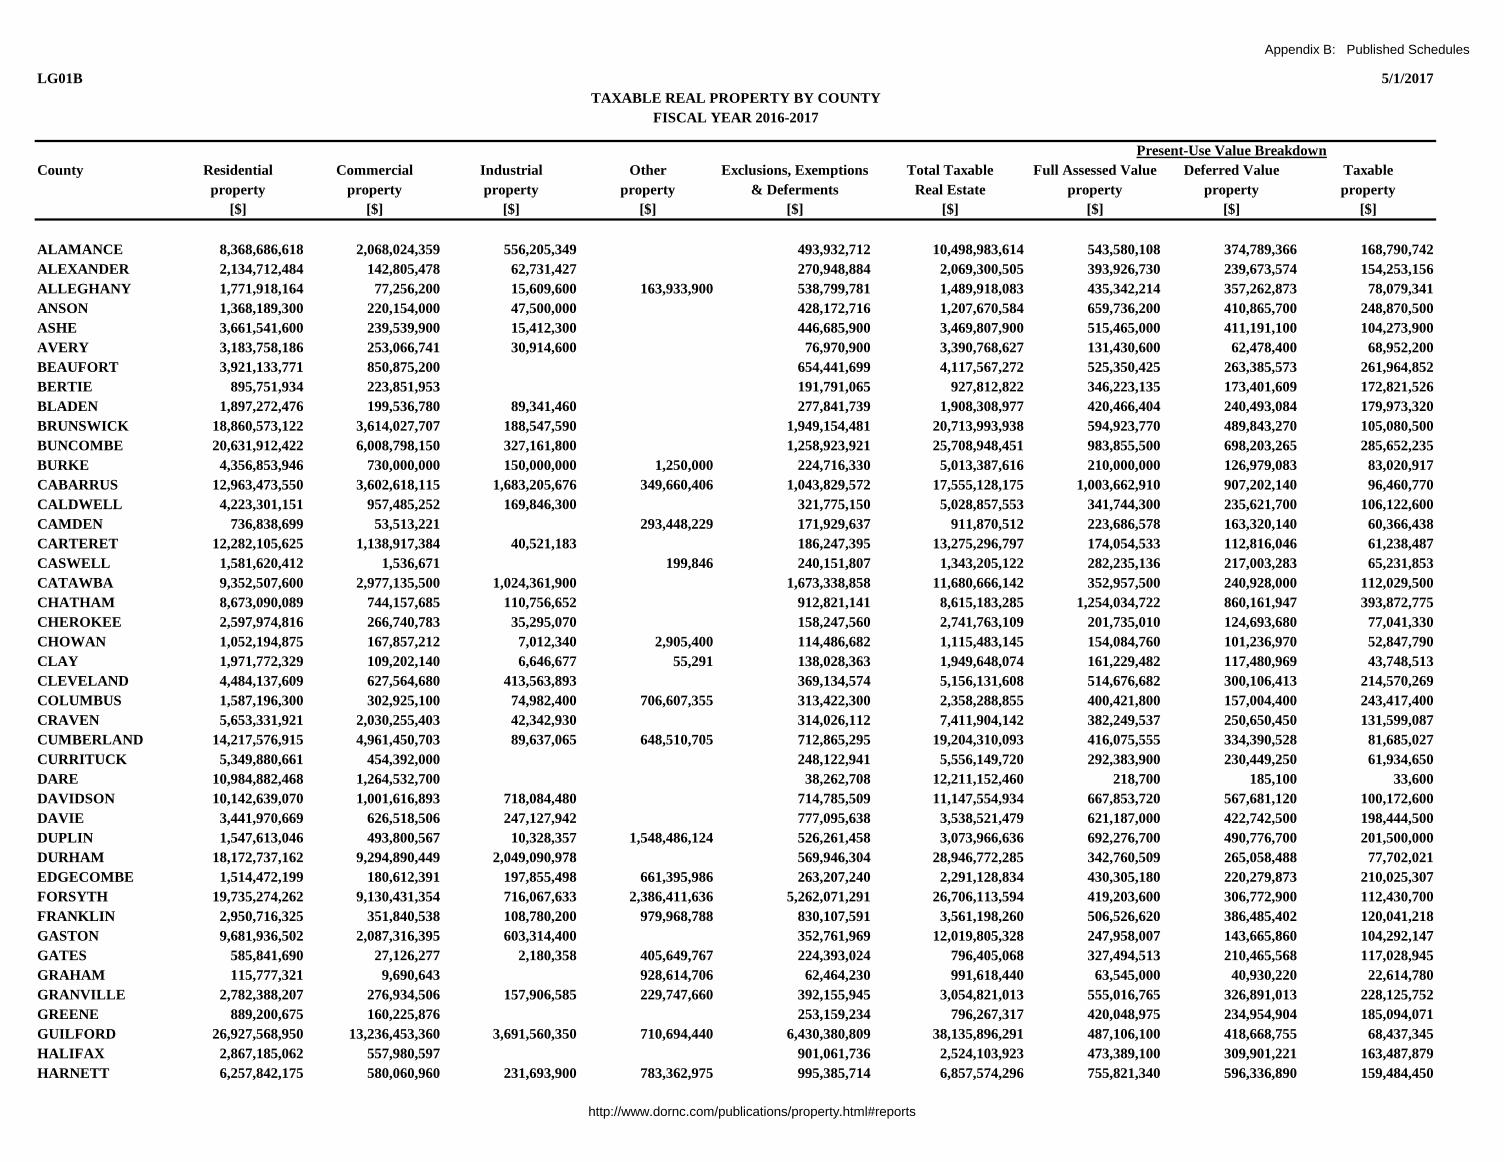
LG01B 5/1/2017
County Residential Commercial Industrial Other Exclusions, Exemptions Total Taxable Full Assessed Value Deferred Value Taxable
property property property property & Deferments Real Estate property property property
[$] [$] [$] [$] [$] [$] [$] [$] [$]
ALAMANCE 8,368,686,618 2,068,024,359 556,205,349 493,932,712 10,498,983,614 543,580,108 374,789,366 168,790,742
ALEXANDER 2,134,712,484 142,805,478 62,731,427 270,948,884 2,069,300,505 393,926,730 239,673,574 154,253,156
ALLEGHANY 1,771,918,164 77,256,200 15,609,600 163,933,900 538,799,781 1,489,918,083 435,342,214 357,262,873 78,079,341
ANSON 1,368,189,300 220,154,000 47,500,000 428,172,716 1,207,670,584 659,736,200 410,865,700 248,870,500
ASHE 3,661,541,600 239,539,900 15,412,300 446,685,900 3,469,807,900 515,465,000 411,191,100 104,273,900
AVERY 3,183,758,186 253,066,741 30,914,600 76,970,900 3,390,768,627 131,430,600 62,478,400 68,952,200
BEAUFORT 3,921,133,771 850,875,200 654,441,699 4,117,567,272 525,350,425 263,385,573 261,964,852
BERTIE 895,751,934 223,851,953 191,791,065 927,812,822 346,223,135 173,401,609 172,821,526
BLADEN 1,897,272,476 199,536,780 89,341,460 277,841,739 1,908,308,977 420,466,404 240,493,084 179,973,320
BRUNSWICK 18,860,573,122 3,614,027,707 188,547,590 1,949,154,481 20,713,993,938 594,923,770 489,843,270 105,080,500
BUNCOMBE 20,631,912,422 6,008,798,150 327,161,800 1,258,923,921 25,708,948,451 983,855,500 698,203,265 285,652,235
BURKE 4,356,853,946 730,000,000 150,000,000 1,250,000 224,716,330 5,013,387,616 210,000,000 126,979,083 83,020,917
CABARRUS 12,963,473,550 3,602,618,115 1,683,205,676 349,660,406 1,043,829,572 17,555,128,175 1,003,662,910 907,202,140 96,460,770
CALDWELL 4,223,301,151 957,485,252 169,846,300 321,775,150 5,028,857,553 341,744,300 235,621,700 106,122,600
CAMDEN 736,838,699 53,513,221 293,448,229 171,929,637 911,870,512 223,686,578 163,320,140 60,366,438
CARTERET 12,282,105,625 1,138,917,384 40,521,183 186,247,395 13,275,296,797 174,054,533 112,816,046 61,238,487
CASWELL 1,581,620,412 1,536,671 199,846 240,151,807 1,343,205,122 282,235,136 217,003,283 65,231,853
CATAWBA 9,352,507,600 2,977,135,500 1,024,361,900 1,673,338,858 11,680,666,142 352,957,500 240,928,000 112,029,500
CHATHAM 8,673,090,089 744,157,685 110,756,652 912,821,141 8,615,183,285 1,254,034,722 860,161,947 393,872,775
CHEROKEE 2,597,974,816 266,740,783 35,295,070 158,247,560 2,741,763,109 201,735,010 124,693,680 77,041,330
CHOWAN 1,052,194,875 167,857,212 7,012,340 2,905,400 114,486,682 1,115,483,145 154,084,760 101,236,970 52,847,790
CLAY 1,971,772,329 109,202,140 6,646,677 55,291 138,028,363 1,949,648,074 161,229,482 117,480,969 43,748,513
CLEVELAND 4,484,137,609 627,564,680 413,563,893 369,134,574 5,156,131,608 514,676,682 300,106,413 214,570,269
COLUMBUS 1,587,196,300 302,925,100 74,982,400 706,607,355 313,422,300 2,358,288,855 400,421,800 157,004,400 243,417,400
CRAVEN 5,653,331,921 2,030,255,403 42,342,930 314,026,112 7,411,904,142 382,249,537 250,650,450 131,599,087
CUMBERLAND 14,217,576,915 4,961,450,703 89,637,065 648,510,705 712,865,295 19,204,310,093 416,075,555 334,390,528 81,685,027
CURRITUCK 5,349,880,661 454,392,000 248,122,941 5,556,149,720 292,383,900 230,449,250 61,934,650
DARE 10,984,882,468 1,264,532,700 38,262,708 12,211,152,460 218,700 185,100 33,600
DAVIDSON 10,142,639,070 1,001,616,893 718,084,480 714,785,509 11,147,554,934 667,853,720 567,681,120 100,172,600
DAVIE 3,441,970,669 626,518,506 247,127,942 777,095,638 3,538,521,479 621,187,000 422,742,500 198,444,500
DUPLIN 1,547,613,046 493,800,567 10,328,357 1,548,486,124 526,261,458 3,073,966,636 692,276,700 490,776,700 201,500,000
DURHAM 18,172,737,162 9,294,890,449 2,049,090,978 569,946,304 28,946,772,285 342,760,509 265,058,488 77,702,021
EDGECOMBE 1,514,472,199 180,612,391 197,855,498 661,395,986 263,207,240 2,291,128,834 430,305,180 220,279,873 210,025,307
FORSYTH 19,735,274,262 9,130,431,354 716,067,633 2,386,411,636 5,262,071,291 26,706,113,594 419,203,600 306,772,900 112,430,700
FRANKLIN 2,950,716,325 351,840,538 108,780,200 979,968,788 830,107,591 3,561,198,260 506,526,620 386,485,402 120,041,218
GASTON 9,681,936,502 2,087,316,395 603,314,400 352,761,969 12,019,805,328 247,958,007 143,665,860 104,292,147
GATES 585,841,690 27,126,277 2,180,358 405,649,767 224,393,024 796,405,068 327,494,513 210,465,568 117,028,945
GRAHAM 115,777,321 9,690,643 928,614,706 62,464,230 991,618,440 63,545,000 40,930,220 22,614,780
GRANVILLE 2,782,388,207 276,934,506 157,906,585 229,747,660 392,155,945 3,054,821,013 555,016,765 326,891,013 228,125,752
GREENE 889,200,675 160,225,876 253,159,234 796,267,317 420,048,975 234,954,904 185,094,071
GUILFORD 26,927,568,950 13,236,453,360 3,691,560,350 710,694,440 6,430,380,809 38,135,896,291 487,106,100 418,668,755 68,437,345
HALIFAX 2,867,185,062 557,980,597 901,061,736 2,524,103,923 473,389,100 309,901,221 163,487,879
HARNETT 6,257,842,175 580,060,960 231,693,900 783,362,975 995,385,714 6,857,574,296 755,821,340 596,336,890 159,484,450
TAXABLE REAL PROPERTY BY COUNTY
FISCAL YEAR 2016-2017
Present-Use Value Breakdown
http://www.dornc.com/publications/property.html#reports
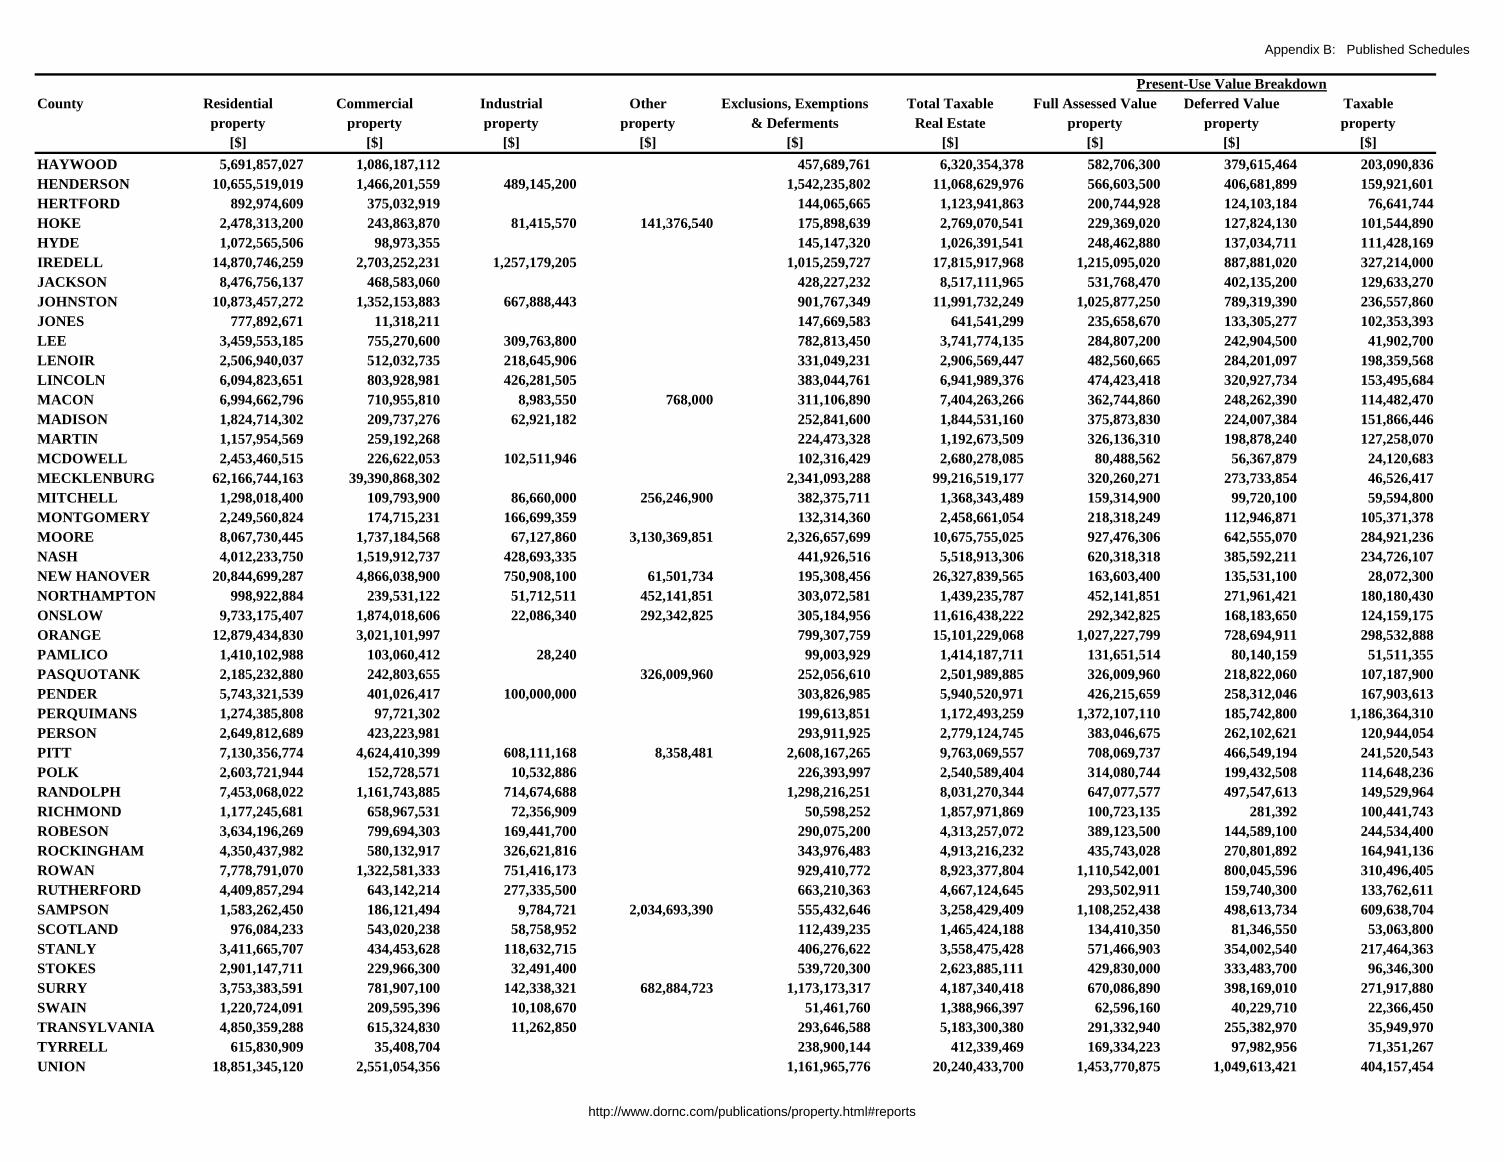
Appendix B: Published Schedules
County Residential Commercial Industrial Other Exclusions, Exemptions Total Taxable Full Assessed Value Deferred Value Taxable
property property property property & Deferments Real Estate property property property
[$] [$] [$] [$] [$] [$] [$] [$] [$]
Present-Use Value Breakdown
HAYWOOD 5,691,857,027 1,086,187,112 457,689,761 6,320,354,378 582,706,300 379,615,464 203,090,836
HENDERSON 10,655,519,019 1,466,201,559 489,145,200 1,542,235,802 11,068,629,976 566,603,500 406,681,899 159,921,601
HERTFORD 892,974,609 375,032,919 144,065,665 1,123,941,863 200,744,928 124,103,184 76,641,744
HOKE 2,478,313,200 243,863,870 81,415,570 141,376,540 175,898,639 2,769,070,541 229,369,020 127,824,130 101,544,890
HYDE 1,072,565,506 98,973,355 145,147,320 1,026,391,541 248,462,880 137,034,711 111,428,169
IREDELL 14,870,746,259 2,703,252,231 1,257,179,205 1,015,259,727 17,815,917,968 1,215,095,020 887,881,020 327,214,000
JACKSON 8,476,756,137 468,583,060 428,227,232 8,517,111,965 531,768,470 402,135,200 129,633,270
JOHNSTON 10,873,457,272 1,352,153,883 667,888,443 901,767,349 11,991,732,249 1,025,877,250 789,319,390 236,557,860
JONES 777,892,671 11,318,211 147,669,583 641,541,299 235,658,670 133,305,277 102,353,393
LEE 3,459,553,185 755,270,600 309,763,800 782,813,450 3,741,774,135 284,807,200 242,904,500 41,902,700
LENOIR 2,506,940,037 512,032,735 218,645,906 331,049,231 2,906,569,447 482,560,665 284,201,097 198,359,568
LINCOLN 6,094,823,651 803,928,981 426,281,505 383,044,761 6,941,989,376 474,423,418 320,927,734 153,495,684
MACON 6,994,662,796 710,955,810 8,983,550 768,000 311,106,890 7,404,263,266 362,744,860 248,262,390 114,482,470
MADISON 1,824,714,302 209,737,276 62,921,182 252,841,600 1,844,531,160 375,873,830 224,007,384 151,866,446
MARTIN 1,157,954,569 259,192,268 224,473,328 1,192,673,509 326,136,310 198,878,240 127,258,070
MCDOWELL 2,453,460,515 226,622,053 102,511,946 102,316,429 2,680,278,085 80,488,562 56,367,879 24,120,683
MECKLENBURG 62,166,744,163 39,390,868,302 2,341,093,288 99,216,519,177 320,260,271 273,733,854 46,526,417
MITCHELL 1,298,018,400 109,793,900 86,660,000 256,246,900 382,375,711 1,368,343,489 159,314,900 99,720,100 59,594,800
MONTGOMERY 2,249,560,824 174,715,231 166,699,359 132,314,360 2,458,661,054 218,318,249 112,946,871 105,371,378
MOORE 8,067,730,445 1,737,184,568 67,127,860 3,130,369,851 2,326,657,699 10,675,755,025 927,476,306 642,555,070 284,921,236
NASH 4,012,233,750 1,519,912,737 428,693,335 441,926,516 5,518,913,306 620,318,318 385,592,211 234,726,107
NEW HANOVER 20,844,699,287 4,866,038,900 750,908,100 61,501,734 195,308,456 26,327,839,565 163,603,400 135,531,100 28,072,300
NORTHAMPTON 998,922,884 239,531,122 51,712,511 452,141,851 303,072,581 1,439,235,787 452,141,851 271,961,421 180,180,430
ONSLOW 9,733,175,407 1,874,018,606 22,086,340 292,342,825 305,184,956 11,616,438,222 292,342,825 168,183,650 124,159,175
ORANGE 12,879,434,830 3,021,101,997 799,307,759 15,101,229,068 1,027,227,799 728,694,911 298,532,888
PAMLICO 1,410,102,988 103,060,412 28,240 99,003,929 1,414,187,711 131,651,514 80,140,159 51,511,355
PASQUOTANK 2,185,232,880 242,803,655 326,009,960 252,056,610 2,501,989,885 326,009,960 218,822,060 107,187,900
PENDER 5,743,321,539 401,026,417 100,000,000 303,826,985 5,940,520,971 426,215,659 258,312,046 167,903,613
PERQUIMANS 1,274,385,808 97,721,302 199,613,851 1,172,493,259 1,372,107,110 185,742,800 1,186,364,310
PERSON 2,649,812,689 423,223,981 293,911,925 2,779,124,745 383,046,675 262,102,621 120,944,054
PITT 7,130,356,774 4,624,410,399 608,111,168 8,358,481 2,608,167,265 9,763,069,557 708,069,737 466,549,194 241,520,543
POLK 2,603,721,944 152,728,571 10,532,886 226,393,997 2,540,589,404 314,080,744 199,432,508 114,648,236
RANDOLPH 7,453,068,022 1,161,743,885 714,674,688 1,298,216,251 8,031,270,344 647,077,577 497,547,613 149,529,964
RICHMOND 1,177,245,681 658,967,531 72,356,909 50,598,252 1,857,971,869 100,723,135 281,392 100,441,743
ROBESON 3,634,196,269 799,694,303 169,441,700 290,075,200 4,313,257,072 389,123,500 144,589,100 244,534,400
ROCKINGHAM 4,350,437,982 580,132,917 326,621,816 343,976,483 4,913,216,232 435,743,028 270,801,892 164,941,136
ROWAN 7,778,791,070 1,322,581,333 751,416,173 929,410,772 8,923,377,804 1,110,542,001 800,045,596 310,496,405
RUTHERFORD 4,409,857,294 643,142,214 277,335,500 663,210,363 4,667,124,645 293,502,911 159,740,300 133,762,611
SAMPSON 1,583,262,450 186,121,494 9,784,721 2,034,693,390 555,432,646 3,258,429,409 1,108,252,438 498,613,734 609,638,704
SCOTLAND 976,084,233 543,020,238 58,758,952 112,439,235 1,465,424,188 134,410,350 81,346,550 53,063,800
STANLY 3,411,665,707 434,453,628 118,632,715 406,276,622 3,558,475,428 571,466,903 354,002,540 217,464,363
STOKES 2,901,147,711 229,966,300 32,491,400 539,720,300 2,623,885,111 429,830,000 333,483,700 96,346,300
SURRY 3,753,383,591 781,907,100 142,338,321 682,884,723 1,173,173,317 4,187,340,418 670,086,890 398,169,010 271,917,880
SWAIN 1,220,724,091 209,595,396 10,108,670 51,461,760 1,388,966,397 62,596,160 40,229,710 22,366,450
TRANSYLVANIA 4,850,359,288 615,324,830 11,262,850 293,646,588 5,183,300,380 291,332,940 255,382,970 35,949,970
TYRRELL 615,830,909 35,408,704 238,900,144 412,339,469 169,334,223 97,982,956 71,351,267
UNION 18,851,345,120 2,551,054,356 1,161,965,776 20,240,433,700 1,453,770,875 1,049,613,421 404,157,454
http://www.dornc.com/publications/property.html#reports
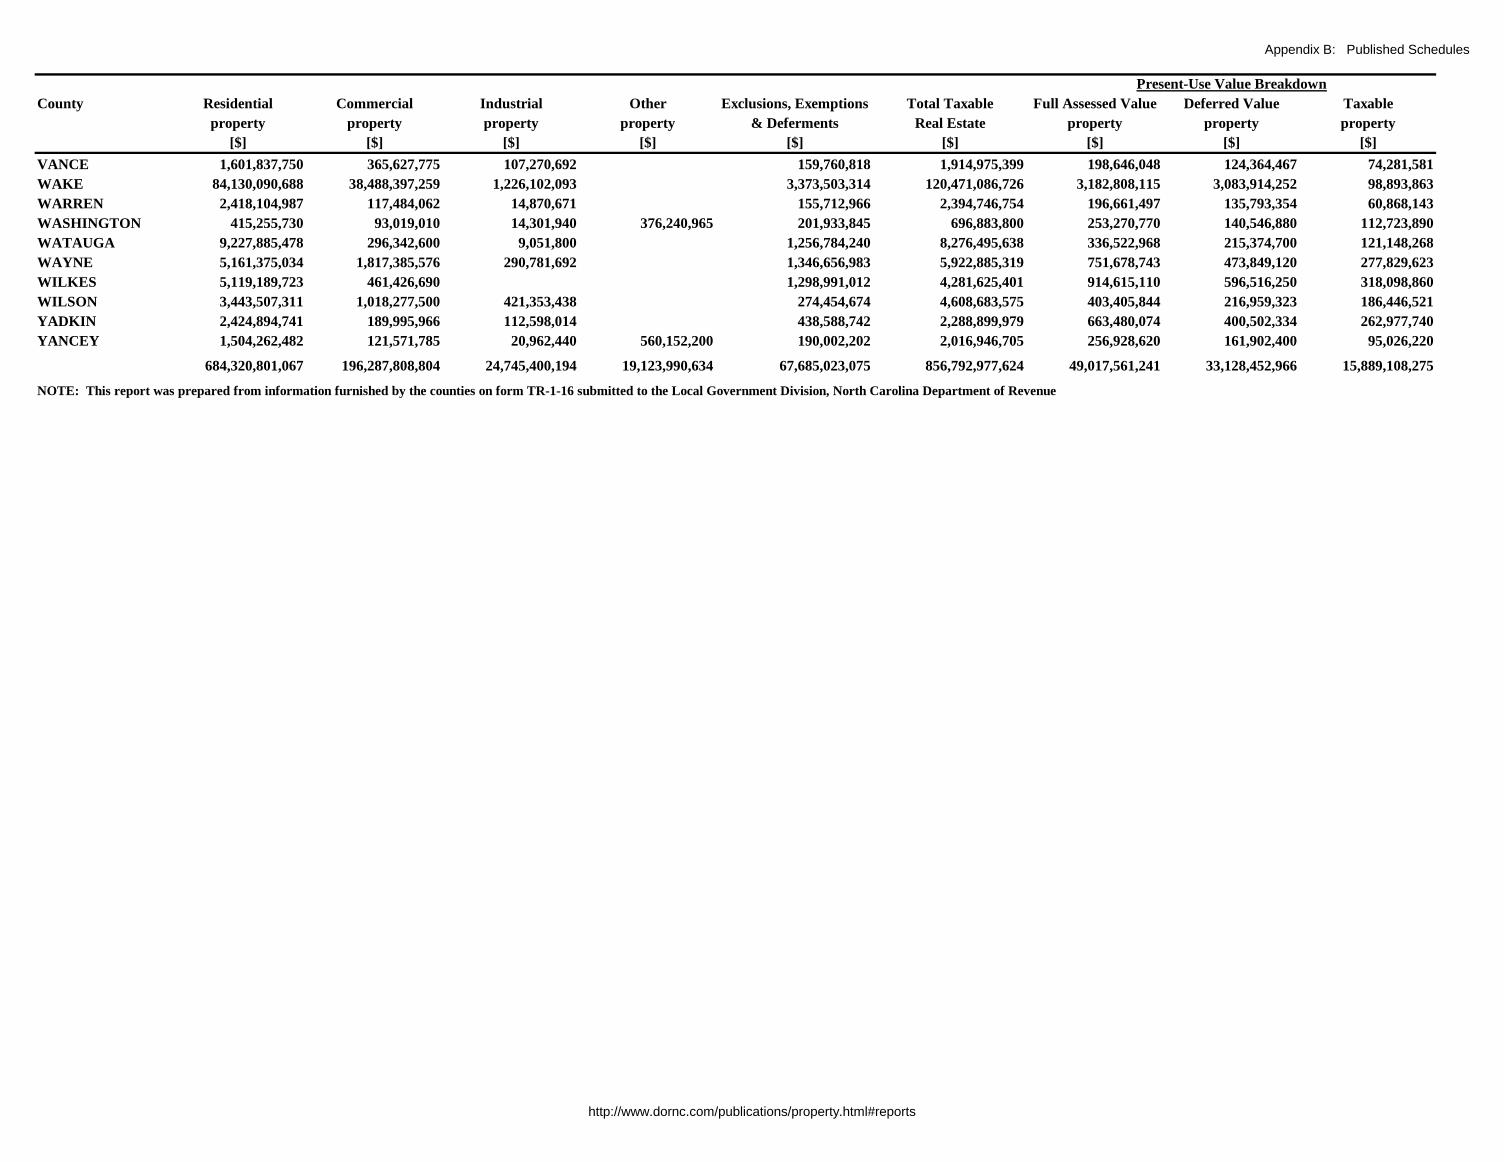
Appendix B: Published Schedules
County Residential Commercial Industrial Other Exclusions, Exemptions Total Taxable Full Assessed Value Deferred Value Taxable
property property property property & Deferments Real Estate property property property
[$] [$] [$] [$] [$] [$] [$] [$] [$]
Present-Use Value Breakdown
VANCE 1,601,837,750 365,627,775 107,270,692 159,760,818 1,914,975,399 198,646,048 124,364,467 74,281,581
WAKE 84,130,090,688 38,488,397,259 1,226,102,093 3,373,503,314 120,471,086,726 3,182,808,115 3,083,914,252 98,893,863
WARREN 2,418,104,987 117,484,062 14,870,671 155,712,966 2,394,746,754 196,661,497 135,793,354 60,868,143
WASHINGTON 415,255,730 93,019,010 14,301,940 376,240,965 201,933,845 696,883,800 253,270,770 140,546,880 112,723,890
WATAUGA 9,227,885,478 296,342,600 9,051,800 1,256,784,240 8,276,495,638 336,522,968 215,374,700 121,148,268
WAYNE 5,161,375,034 1,817,385,576 290,781,692 1,346,656,983 5,922,885,319 751,678,743 473,849,120 277,829,623
WILKES 5,119,189,723 461,426,690 1,298,991,012 4,281,625,401 914,615,110 596,516,250 318,098,860
WILSON 3,443,507,311 1,018,277,500 421,353,438 274,454,674 4,608,683,575 403,405,844 216,959,323 186,446,521
YADKIN 2,424,894,741 189,995,966 112,598,014 438,588,742 2,288,899,979 663,480,074 400,502,334 262,977,740
YANCEY 1,504,262,482 121,571,785 20,962,440 560,152,200 190,002,202 2,016,946,705 256,928,620 161,902,400 95,026,220
684,320,801,067 196,287,808,804 24,745,400,194 19,123,990,634 67,685,023,075 856,792,977,624 49,017,561,241 33,128,452,966 15,889,108,275
NOTE: This report was prepared from information furnished by the counties on form TR-1-16 submitted to the Local Government Division, North Carolina Department of Revenue
http://www.dornc.com/publications/property.html#reports

Appendix B: Published Schedules
LG04 6/21/2017
County Municipal Total Property
School special City or special tax levies Percent total
Assessed County-wide district district town district for all levy is of
valuation levies levies levies levies levies jurisdictions valuation
Counties [$] [$] [$] [$] [$] [$] [$]
ALAMANCE 13,317,687,530 77,239,576 0 5,051,944 44,778,211 126,244 127,195,975 .96
ALEXANDER 2,574,723,899 20,339,071 0 1,031,762 621,534 0 21,992,367 .85
ALLEGHANY 1,718,638,932 8,807,936 0 0 524,903 0 9,332,839 .54
ANSON 1,835,359,719 14,701,032 0 1,129,699 2,300,142 0 18,130,873 .99
ASHE 3,945,701,821 17,084,736 0 1,436,609 1,747,144 0 20,268,489 .51
AVERY 3,710,064,150 16,591,731 0 0 3,578,175 0 20,169,906 .54
BEAUFORT 5,924,638,354 32,521,444 0 2,861,701 5,872,000 0 41,255,145 .70
BERTIE 1,305,234,542 10,844,863 0 0 761,342 0 11,606,205 .89
BLADEN 2,735,321,697 22,428,819 0 1,175,332 3,485,775 37,504 27,127,430 .99
BRUNSWICK 24,154,953,936 117,148,742 0 2,706,990 35,528,727 371,231 155,755,690 .64
BUNCOMBE 30,328,329,935 183,183,106 8,607,690 17,423,291 68,358,879 0 277,572,966 .92
BURKE 6,532,267,391 44,419,419 0 3,631,822 12,695,331 122,806 60,869,378 .93
CABARRUS 21,556,032,537 150,892,249 0 3,907,378 79,361,580 2,756,278 236,917,485 1.10
CALDWELL 6,710,211,429 42,145,751 0 3,966,527 17,349,880 33,547 63,495,705 .95
CAMDEN 1,068,920,979 7,268,409 0 106,133 64,380 0 7,438,922 .70
CARTERET 14,714,141,725 45,563,654 0 6,057,422 21,323,558 726,099 73,670,733 .50
CASWELL 1,632,841,434 11,086,997 0 20,601 370,805 0 11,478,403 .70
CATAWBA 16,378,499,694 94,173,473 0 6,562,874 45,471,910 0 146,208,257 .89
CHATHAM 9,998,647,391 63,310,874 0 8,813,952 6,232,593 0 78,357,419 .78
CHEROKEE 3,135,638,188 16,305,319 0 1,929,422 1,534,663 0 19,769,404 .63
CHOWAN 1,395,146,852 10,309,921 0 509,571 1,799,334 0 12,618,826 .90
CLAY 2,134,206,949 7,683,145 0 491,233 99,043 0 8,273,421 .39
CLEVELAND 8,356,657,443 59,109,032 1,059,107 3,099,048 15,112,190 152,401 78,531,778 .94
COLUMBUS 3,724,457,759 29,980,553 0 2,508,033 5,069,804 0 37,558,390 1.01
CRAVEN 9,194,036,494 49,150,420 0 2,352,335 21,426,884 196,615 73,126,254 .80
CUMBERLAND 23,665,152,531 175,122,151 0 11,935,418 81,205,127 196,935 268,459,631 1.13
CURRITUCK 6,087,205,090 29,218,584 0 1,549,749 0 0 30,768,333 .51
DARE 13,116,711,259 56,401,877 0 7,980,195 27,361,661 2,031,405 93,775,138 .71
DAVIDSON 13,850,328,400 74,791,779 1,537,371 8,765,398 23,673,445 1,532,449 110,300,442 .80
DAVIE 4,506,728,658 32,806,330 0 1,764,669 3,532,108 0 38,103,107 .85
DUPLIN 4,172,106,502 30,456,399 0 754,116 4,348,669 0 35,559,184 .85
DURHAM 35,213,889,219 261,576,069 0 9,012,968 159,724,316 651,547 430,964,900 1.22
EDGECOMBE 3,197,645,298 30,376,541 0 1,621,711 8,590,930 0 40,589,182 1.27
TOTAL PROPERTY TAXES LEVIED BY ALL LOCAL JURISDICTIONS BY COUNTY FOR FISCAL YEAR 2016-2017
http://www.dornc.com/publications/property.html#reports
Appendix B: Published Schedules
FORSYTH 33,606,704,833 245,660,880 0 7,770,667 143,789,535 560,805 397,781,887 1.18
FRANKLIN 4,672,461,163 43,218,142 0 3,291,720 3,705,436 0 50,215,298 1.07
GASTON 15,849,332,108 137,889,279 0 4,586,575 53,699,821 129,607 196,305,282 1.24
GATES 984,270,946 6,664,679 0 0 52,181 0 6,716,860 .68
GRAHAM 1,129,639,764 6,607,961 0 0 525,572 0 7,133,533 .63
GRANVILLE 4,144,438,854 36,299,984 0 0 8,154,009 54,357 44,508,350 1.07
GREENE 1,107,548,809 8,705,335 0 832,305 503,699 0 10,041,339 .91
GUILFORD 48,105,385,166 363,350,368 0 14,250,397 227,615,140 694,395 605,910,300 1.26
HALIFAX 3,578,231,725 27,774,822 1,246,505 1,788,501 10,495,627 1,969,548 43,275,003 1.21
HARNETT 8,260,625,744 61,954,901 253,298 7,163,616 9,412,203 40,019 78,824,037 .95
HAYWOOD 7,506,797,517 42,495,517 0 4,417,841 10,471,819 103,451 57,488,628 .77
HENDERSON 13,366,436,480 75,143,039 0 8,859,209 16,285,259 250,401 100,537,908 .75
HERTFORD 1,590,694,096 13,361,831 0 93,057 3,934,869 0 17,389,757 1.09
HOKE 3,430,105,913 25,725,507 0 2,512,953 2,337,720 0 30,576,180 .89
HYDE 1,156,777,957 7,403,379 0 54,146 0 0 7,457,525 .64
IREDELL 22,094,606,110 116,546,946 0 8,993,026 51,282,500 759,132 177,581,604 .80
JACKSON 9,152,621,105 33,651,772 0 1,187,594 2,059,449 12,583 36,911,398 .40
JOHNSTON 15,498,943,418 120,891,373 0 9,393,381 24,162,356 118,356 154,565,466 1.00
JONES 823,117,102 6,502,556 0 141,428 384,533 0 7,028,517 .85
LEE 5,186,483,038 41,230,782 0 2,621,947 15,560,573 56,841 59,470,143 1.15
LENOIR 4,240,783,522 35,410,562 0 1,450,536 10,925,475 65,826 47,852,399 1.13
LINCOLN 8,748,996,456 53,455,807 0 7,273,730 4,724,152 0 65,453,689 .75
MACON 8,003,211,839 27,930,391 0 3,203,574 4,694,534 0 35,828,499 .45
MADISON 2,158,420,958 11,223,789 0 1,336,479 1,230,952 0 13,791,220 .64
MARTIN 1,928,127,159 14,165,445 0 642,208 3,749,365 0 18,557,018 .96
MCDOWELL 3,681,420,426 20,247,907 0 2,907,871 2,756,669 0 25,912,447 .70
MECKLENBURG 122,516,061,470 999,363,501 0 22,351,024 517,367,207 4,971,087 1,544,052,819 1.26
MITCHELL 1,747,785,996 9,263,273 0 1,016,477 1,264,234 0 11,543,984 .66
MONTGOMERY 3,056,949,306 18,952,640 0 617,387 2,992,831 0 22,562,858 .74
MOORE 12,122,629,304 56,581,360 0 7,116,581 27,986,740 0 91,684,681 .76
NASH 7,492,556,365 50,200,172 0 3,237,096 24,065,090 72,652 77,575,010 1.04
NEW HANOVER 30,788,752,096 191,083,822 0 8,450,210 76,045,550 0 275,579,582 .90
NORTHAMPTON 1,994,112,117 18,345,830 0 731,018 1,633,522 0 20,710,370 1.04
ONSLOW 13,676,154,402 92,314,176 0 0 31,008,292 0 123,322,468 .90
ORANGE 16,949,367,191 148,815,451 22,786,215 5,544,656 57,023,426 279,534 234,449,282 1.38
PAMLICO 1,660,899,518 10,380,645 0 590,362 895,022 0 11,866,029 .71
PASQUOTANK 3,065,763,965 23,299,804 0 0 8,115,777 34,064 31,449,645 1.03
PENDER 6,828,054,210 46,766,760 0 9,802,820 8,032,059 0 64,601,639 .95
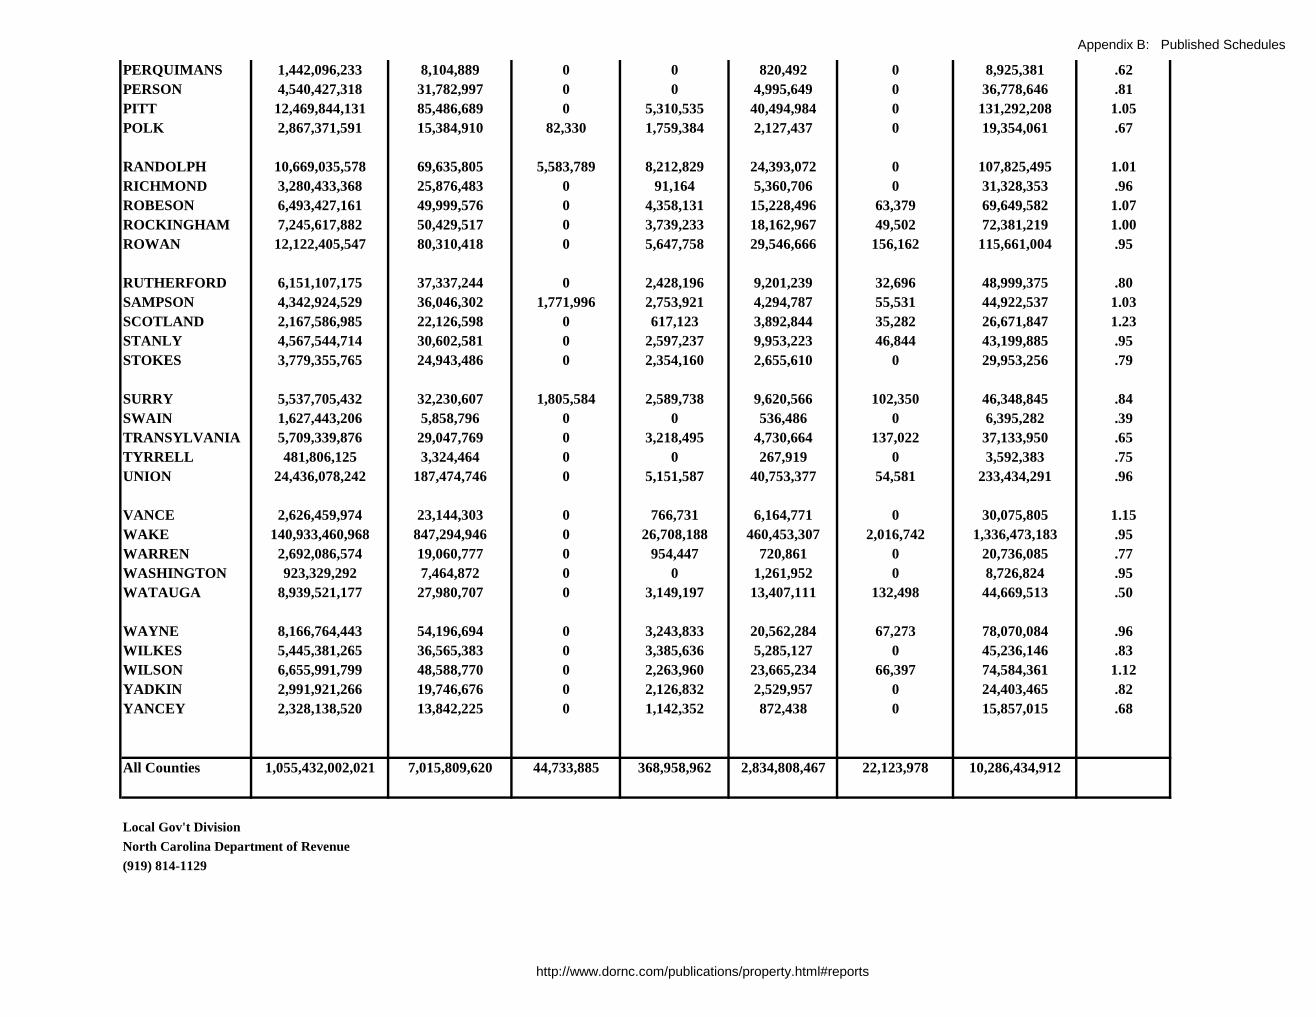
http://www.dornc.com/publications/property.html#reports
Appendix B: Published Schedules
PERQUIMANS 1,442,096,233 8,104,889 0 0 820,492 0 8,925,381 .62
PERSON 4,540,427,318 31,782,997 0 0 4,995,649 0 36,778,646 .81
PITT 12,469,844,131 85,486,689 0 5,310,535 40,494,984 0 131,292,208 1.05
POLK 2,867,371,591 15,384,910 82,330 1,759,384 2,127,437 0 19,354,061 .67
RANDOLPH 10,669,035,578 69,635,805 5,583,789 8,212,829 24,393,072 0 107,825,495 1.01
RICHMOND 3,280,433,368 25,876,483 0 91,164 5,360,706 0 31,328,353 .96
ROBESON 6,493,427,161 49,999,576 0 4,358,131 15,228,496 63,379 69,649,582 1.07
ROCKINGHAM 7,245,617,882 50,429,517 0 3,739,233 18,162,967 49,502 72,381,219 1.00
ROWAN 12,122,405,547 80,310,418 0 5,647,758 29,546,666 156,162 115,661,004 .95
RUTHERFORD 6,151,107,175 37,337,244 0 2,428,196 9,201,239 32,696 48,999,375 .80
SAMPSON 4,342,924,529 36,046,302 1,771,996 2,753,921 4,294,787 55,531 44,922,537 1.03
SCOTLAND 2,167,586,985 22,126,598 0 617,123 3,892,844 35,282 26,671,847 1.23
STANLY 4,567,544,714 30,602,581 0 2,597,237 9,953,223 46,844 43,199,885 .95
STOKES 3,779,355,765 24,943,486 0 2,354,160 2,655,610 0 29,953,256 .79
SURRY 5,537,705,432 32,230,607 1,805,584 2,589,738 9,620,566 102,350 46,348,845 .84
SWAIN 1,627,443,206 5,858,796 0 0 536,486 0 6,395,282 .39
TRANSYLVANIA 5,709,339,876 29,047,769 0 3,218,495 4,730,664 137,022 37,133,950 .65
TYRRELL 481,806,125 3,324,464 0 0 267,919 0 3,592,383 .75
UNION 24,436,078,242 187,474,746 0 5,151,587 40,753,377 54,581 233,434,291 .96
VANCE 2,626,459,974 23,144,303 0 766,731 6,164,771 0 30,075,805 1.15
WAKE 140,933,460,968 847,294,946 0 26,708,188 460,453,307 2,016,742 1,336,473,183 .95
WARREN 2,692,086,574 19,060,777 0 954,447 720,861 0 20,736,085 .77
WASHINGTON 923,329,292 7,464,872 0 0 1,261,952 0 8,726,824 .95
WATAUGA 8,939,521,177 27,980,707 0 3,149,197 13,407,111 132,498 44,669,513 .50
WAYNE 8,166,764,443 54,196,694 0 3,243,833 20,562,284 67,273 78,070,084 .96
WILKES 5,445,381,265 36,565,383 0 3,385,636 5,285,127 0 45,236,146 .83
WILSON 6,655,991,799 48,588,770 0 2,263,960 23,665,234 66,397 74,584,361 1.12
YADKIN 2,991,921,266 19,746,676 0 2,126,832 2,529,957 0 24,403,465 .82
YANCEY 2,328,138,520 13,842,225 0 1,142,352 872,438 0 15,857,015 .68
All Counties 1,055,432,002,021 7,015,809,620 44,733,885 368,958,962 2,834,808,467 22,123,978 10,286,434,912
Local Gov't Division
North Carolina Department of Revenue
(919) 814-1129
http://www.dornc.com/publications/property.html#reports
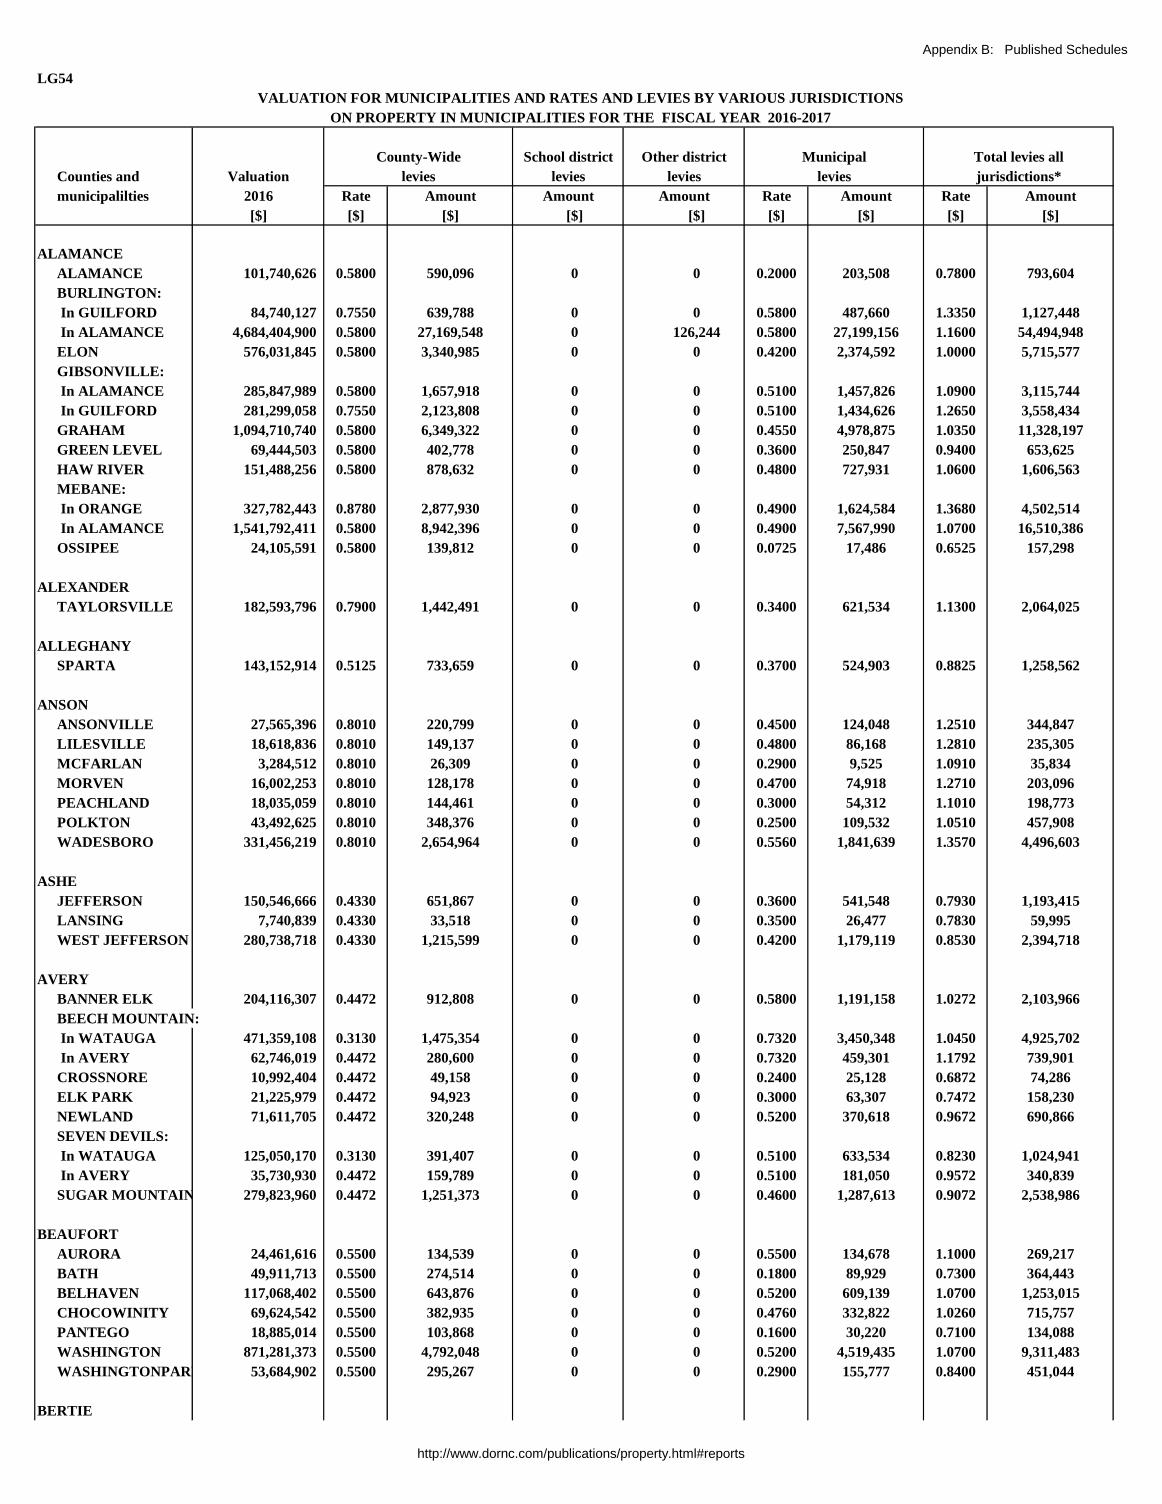
Appendix B: Published Schedules
LG54
Counties and Valuation
municipalilties 2016 Rate Amount Rate Amount Rate Amount
[$] [$] [$] [$] [$] [$] [$] [$] [$]
ALAMANCE
ALAMANCE 101,740,626 0.5800 590,096 0 0 0.2000 203,508 0.7800 793,604
BURLINGTON:
In GUILFORD 84,740,127 0.7550 639,788 0 0 0.5800 487,660 1.3350 1,127,448
In ALAMANCE 4,684,404,900 0.5800 27,169,548 0 126,244 0.5800 27,199,156 1.1600 54,494,948
ELON 576,031,845 0.5800 3,340,985 0 0 0.4200 2,374,592 1.0000 5,715,577
GIBSONVILLE:
In ALAMANCE 285,847,989 0.5800 1,657,918 0 0 0.5100 1,457,826 1.0900 3,115,744
In GUILFORD 281,299,058 0.7550 2,123,808 0 0 0.5100 1,434,626 1.2650 3,558,434
GRAHAM 1,094,710,740 0.5800 6,349,322 0 0 0.4550 4,978,875 1.0350 11,328,197
GREEN LEVEL 69,444,503 0.5800 402,778 0 0 0.3600 250,847 0.9400 653,625
HAW RIVER 151,488,256 0.5800 878,632 0 0 0.4800 727,931 1.0600 1,606,563
MEBANE:
In ORANGE 327,782,443 0.8780 2,877,930 0 0 0.4900 1,624,584 1.3680 4,502,514
In ALAMANCE 1,541,792,411 0.5800 8,942,396 0 0 0.4900 7,567,990 1.0700 16,510,386
OSSIPEE 24,105,591 0.5800 139,812 0 0 0.0725 17,486 0.6525 157,298
ALEXANDER
TAYLORSVILLE 182,593,796 0.7900 1,442,491 0 0 0.3400 621,534 1.1300 2,064,025
ALLEGHANY
SPARTA 143,152,914 0.5125 733,659 0 0 0.3700 524,903 0.8825 1,258,562
ANSON
ANSONVILLE 27,565,396 0.8010 220,799 0 0 0.4500 124,048 1.2510 344,847
LILESVILLE 18,618,836 0.8010 149,137 0 0 0.4800 86,168 1.2810 235,305
MCFARLAN 3,284,512 0.8010 26,309 0 0 0.2900 9,525 1.0910 35,834
MORVEN 16,002,253 0.8010 128,178 0 0 0.4700 74,918 1.2710 203,096
PEACHLAND 18,035,059 0.8010 144,461 0 0 0.3000 54,312 1.1010 198,773
POLKTON 43,492,625 0.8010 348,376 0 0 0.2500 109,532 1.0510 457,908
WADESBORO 331,456,219 0.8010 2,654,964 0 0 0.5560 1,841,639 1.3570 4,496,603
ASHE
JEFFERSON 150,546,666 0.4330 651,867 0 0 0.3600 541,548 0.7930 1,193,415
LANSING 7,740,839 0.4330 33,518 0 0 0.3500 26,477 0.7830 59,995
WEST JEFFERSON 280,738,718 0.4330 1,215,599 0 0 0.4200 1,179,119 0.8530 2,394,718
AVERY
BANNER ELK 204,116,307 0.4472 912,808 0 0 0.5800 1,191,158 1.0272 2,103,966
BEECH MOUNTAIN:
In WATAUGA 471,359,108 0.3130 1,475,354 0 0 0.7320 3,450,348 1.0450 4,925,702
In AVERY 62,746,019 0.4472 280,600 0 0 0.7320 459,301 1.1792 739,901
CROSSNORE 10,992,404 0.4472 49,158 0 0 0.2400 25,128 0.6872 74,286
ELK PARK 21,225,979 0.4472 94,923 0 0 0.3000 63,307 0.7472 158,230
NEWLAND 71,611,705 0.4472 320,248 0 0 0.5200 370,618 0.9672 690,866
SEVEN DEVILS:
In WATAUGA 125,050,170 0.3130 391,407 0 0 0.5100 633,534 0.8230 1,024,941
In AVERY 35,730,930 0.4472 159,789 0 0 0.5100 181,050 0.9572 340,839
SUGAR MOUNTAIN 279,823,960 0.4472 1,251,373 0 0 0.4600 1,287,613 0.9072 2,538,986
BEAUFORT
AURORA 24,461,616 0.5500 134,539 0 0 0.5500 134,678 1.1000 269,217
BATH 49,911,713 0.5500 274,514 0 0 0.1800 89,929 0.7300 364,443
BELHAVEN 117,068,402 0.5500 643,876 0 0 0.5200 609,139 1.0700 1,253,015
CHOCOWINITY 69,624,542 0.5500 382,935 0 0 0.4760 332,822 1.0260 715,757
PANTEGO 18,885,014 0.5500 103,868 0 0 0.1600 30,220 0.7100 134,088
WASHINGTON 871,281,373 0.5500 4,792,048 0 0 0.5200 4,519,435 1.0700 9,311,483
WASHINGTONPARK 53,684,902 0.5500 295,267 0 0 0.2900 155,777 0.8400 451,044
BERTIE
VALUATION FOR MUNICIPALITIES AND RATES AND LEVIES BY VARIOUS JURISDICTIONS
ON PROPERTY IN MUNICIPALITIES FOR THE FISCAL YEAR 2016-2017
County-Wide School district Other district Municipal Total levies all
levies levies levies levies jurisdictions*
Amount Amount
http://www.dornc.com/publications/property.html#reports
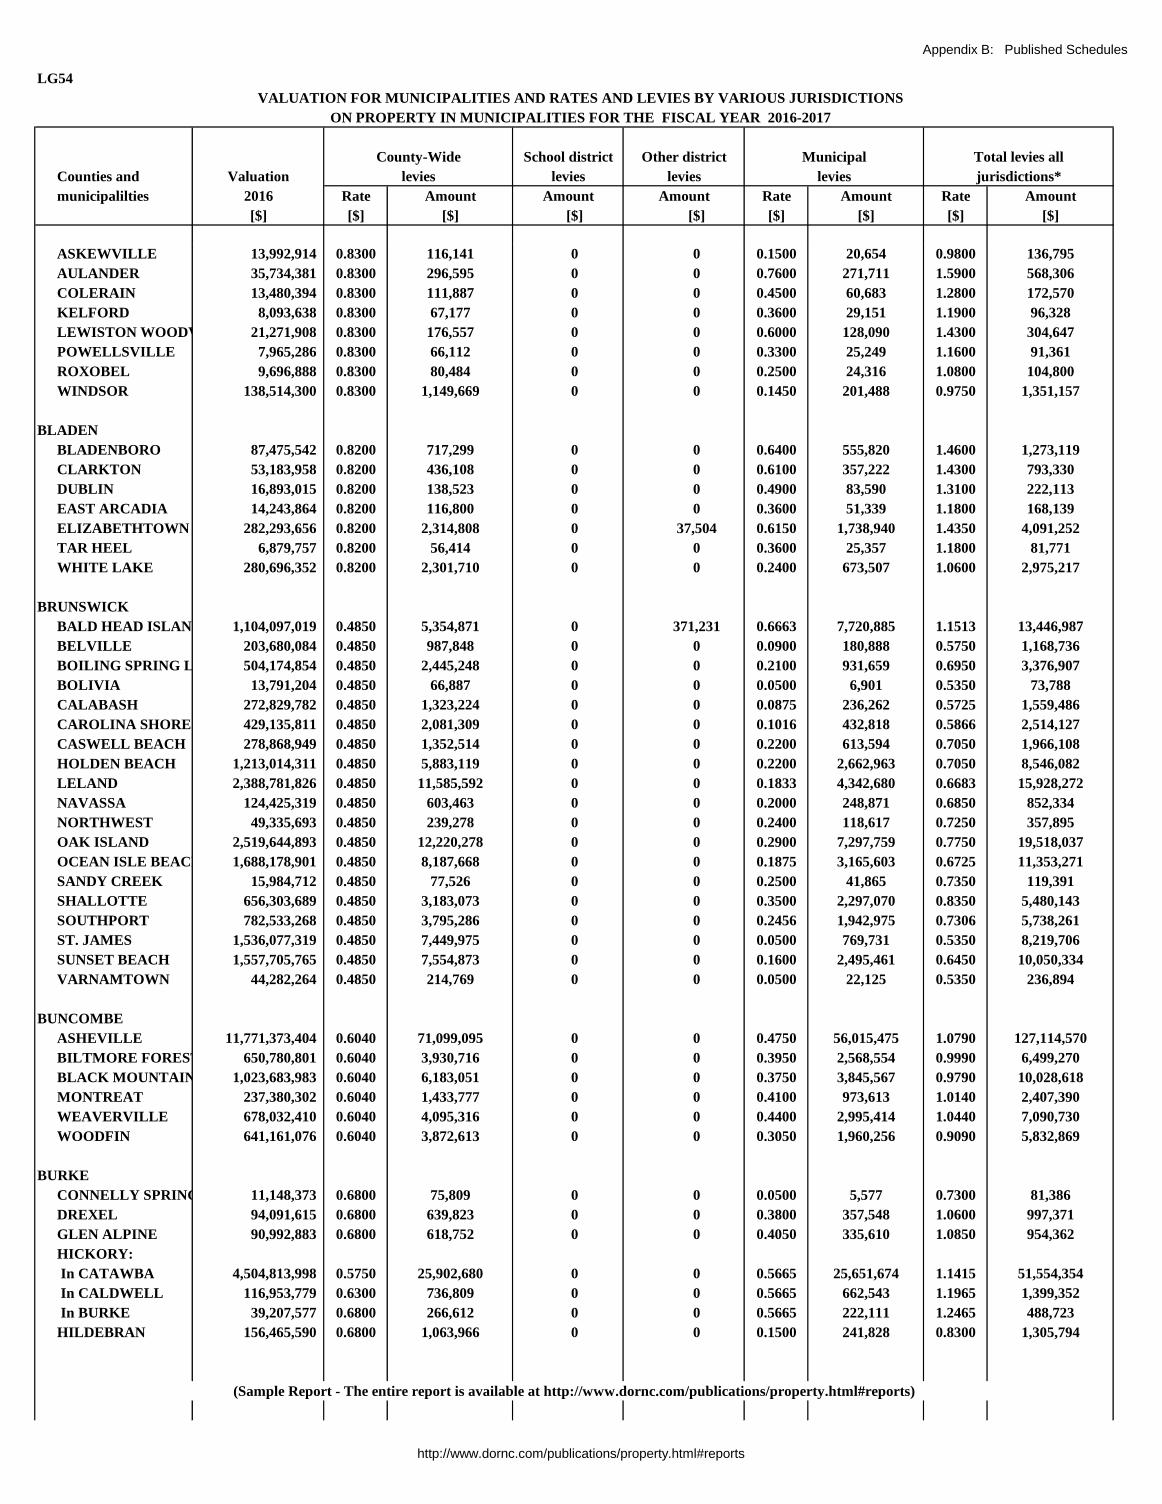
Appendix B: Published Schedules
LG54
Counties and Valuation
municipalilties 2016 Rate Amount Rate Amount Rate Amount
[$] [$] [$] [$] [$] [$] [$] [$] [$]
VALUATION FOR MUNICIPALITIES AND RATES AND LEVIES BY VARIOUS JURISDICTIONS
ON PROPERTY IN MUNICIPALITIES FOR THE FISCAL YEAR 2016-2017
County-Wide School district Other district Municipal Total levies all
levies levies levies levies jurisdictions*
Amount Amount
ASKEWVILLE 13,992,914 0.8300 116,141 0 0 0.1500 20,654 0.9800 136,795
AULANDER 35,734,381 0.8300 296,595 0 0 0.7600 271,711 1.5900 568,306
COLERAIN 13,480,394 0.8300 111,887 0 0 0.4500 60,683 1.2800 172,570
KELFORD 8,093,638 0.8300 67,177 0 0 0.3600 29,151 1.1900 96,328
LEWISTON WOODVILLE 21,271,908 0.8300 176,557 0 0 0.6000 128,090 1.4300 304,647
POWELLSVILLE 7,965,286 0.8300 66,112 0 0 0.3300 25,249 1.1600 91,361
ROXOBEL 9,696,888 0.8300 80,484 0 0 0.2500 24,316 1.0800 104,800
WINDSOR 138,514,300 0.8300 1,149,669 0 0 0.1450 201,488 0.9750 1,351,157
BLADEN
BLADENBORO 87,475,542 0.8200 717,299 0 0 0.6400 555,820 1.4600 1,273,119
CLARKTON 53,183,958 0.8200 436,108 0 0 0.6100 357,222 1.4300 793,330
DUBLIN 16,893,015 0.8200 138,523 0 0 0.4900 83,590 1.3100 222,113
EAST ARCADIA 14,243,864 0.8200 116,800 0 0 0.3600 51,339 1.1800 168,139
ELIZABETHTOWN 282,293,656 0.8200 2,314,808 0 37,504 0.6150 1,738,940 1.4350 4,091,252
TAR HEEL 6,879,757 0.8200 56,414 0 0 0.3600 25,357 1.1800 81,771
WHITE LAKE 280,696,352 0.8200 2,301,710 0 0 0.2400 673,507 1.0600 2,975,217
BRUNSWICK
BALD HEAD ISLAND 1,104,097,019 0.4850 5,354,871 0 371,231 0.6663 7,720,885 1.1513 13,446,987
BELVILLE 203,680,084 0.4850 987,848 0 0 0.0900 180,888 0.5750 1,168,736
BOILING SPRING LAKES 504,174,854 0.4850 2,445,248 0 0 0.2100 931,659 0.6950 3,376,907
BOLIVIA 13,791,204 0.4850 66,887 0 0 0.0500 6,901 0.5350 73,788
CALABASH 272,829,782 0.4850 1,323,224 0 0 0.0875 236,262 0.5725 1,559,486
CAROLINA SHORES 429,135,811 0.4850 2,081,309 0 0 0.1016 432,818 0.5866 2,514,127
CASWELL BEACH 278,868,949 0.4850 1,352,514 0 0 0.2200 613,594 0.7050 1,966,108
HOLDEN BEACH 1,213,014,311 0.4850 5,883,119 0 0 0.2200 2,662,963 0.7050 8,546,082
LELAND 2,388,781,826 0.4850 11,585,592 0 0 0.1833 4,342,680 0.6683 15,928,272
NAVASSA 124,425,319 0.4850 603,463 0 0 0.2000 248,871 0.6850 852,334
NORTHWEST 49,335,693 0.4850 239,278 0 0 0.2400 118,617 0.7250 357,895
OAK ISLAND 2,519,644,893 0.4850 12,220,278 0 0 0.2900 7,297,759 0.7750 19,518,037
OCEAN ISLE BEACH 1,688,178,901 0.4850 8,187,668 0 0 0.1875 3,165,603 0.6725 11,353,271
SANDY CREEK 15,984,712 0.4850 77,526 0 0 0.2500 41,865 0.7350 119,391
SHALLOTTE 656,303,689 0.4850 3,183,073 0 0 0.3500 2,297,070 0.8350 5,480,143
SOUTHPORT 782,533,268 0.4850 3,795,286 0 0 0.2456 1,942,975 0.7306 5,738,261
ST. JAMES 1,536,077,319 0.4850 7,449,975 0 0 0.0500 769,731 0.5350 8,219,706
SUNSET BEACH 1,557,705,765 0.4850 7,554,873 0 0 0.1600 2,495,461 0.6450 10,050,334
VARNAMTOWN 44,282,264 0.4850 214,769 0 0 0.0500 22,125 0.5350 236,894
BUNCOMBE
ASHEVILLE 11,771,373,404 0.6040 71,099,095 0 0 0.4750 56,015,475 1.0790 127,114,570
BILTMORE FOREST 650,780,801 0.6040 3,930,716 0 0 0.3950 2,568,554 0.9990 6,499,270
BLACK MOUNTAIN 1,023,683,983 0.6040 6,183,051 0 0 0.3750 3,845,567 0.9790 10,028,618
MONTREAT 237,380,302 0.6040 1,433,777 0 0 0.4100 973,613 1.0140 2,407,390
WEAVERVILLE 678,032,410 0.6040 4,095,316 0 0 0.4400 2,995,414 1.0440 7,090,730
WOODFIN 641,161,076 0.6040 3,872,613 0 0 0.3050 1,960,256 0.9090 5,832,869
BURKE
CONNELLY SPRINGS 11,148,373 0.6800 75,809 0 0 0.0500 5,577 0.7300 81,386
DREXEL 94,091,615 0.6800 639,823 0 0 0.3800 357,548 1.0600 997,371
GLEN ALPINE 90,992,883 0.6800 618,752 0 0 0.4050 335,610 1.0850 954,362
HICKORY:
In CATAWBA 4,504,813,998 0.5750 25,902,680 0 0 0.5665 25,651,674 1.1415 51,554,354
In CALDWELL 116,953,779 0.6300 736,809 0 0 0.5665 662,543 1.1965 1,399,352
In BURKE 39,207,577 0.6800 266,612 0 0 0.5665 222,111 1.2465 488,723
HILDEBRAN 156,465,590 0.6800 1,063,966 0 0 0.1500 241,828 0.8300 1,305,794
(Sample Report - The entire report is available at http://www.dornc.com/publications/property.html#reports)
http://www.dornc.com/publications/property.html#reports
Appendix B: Published Schedules
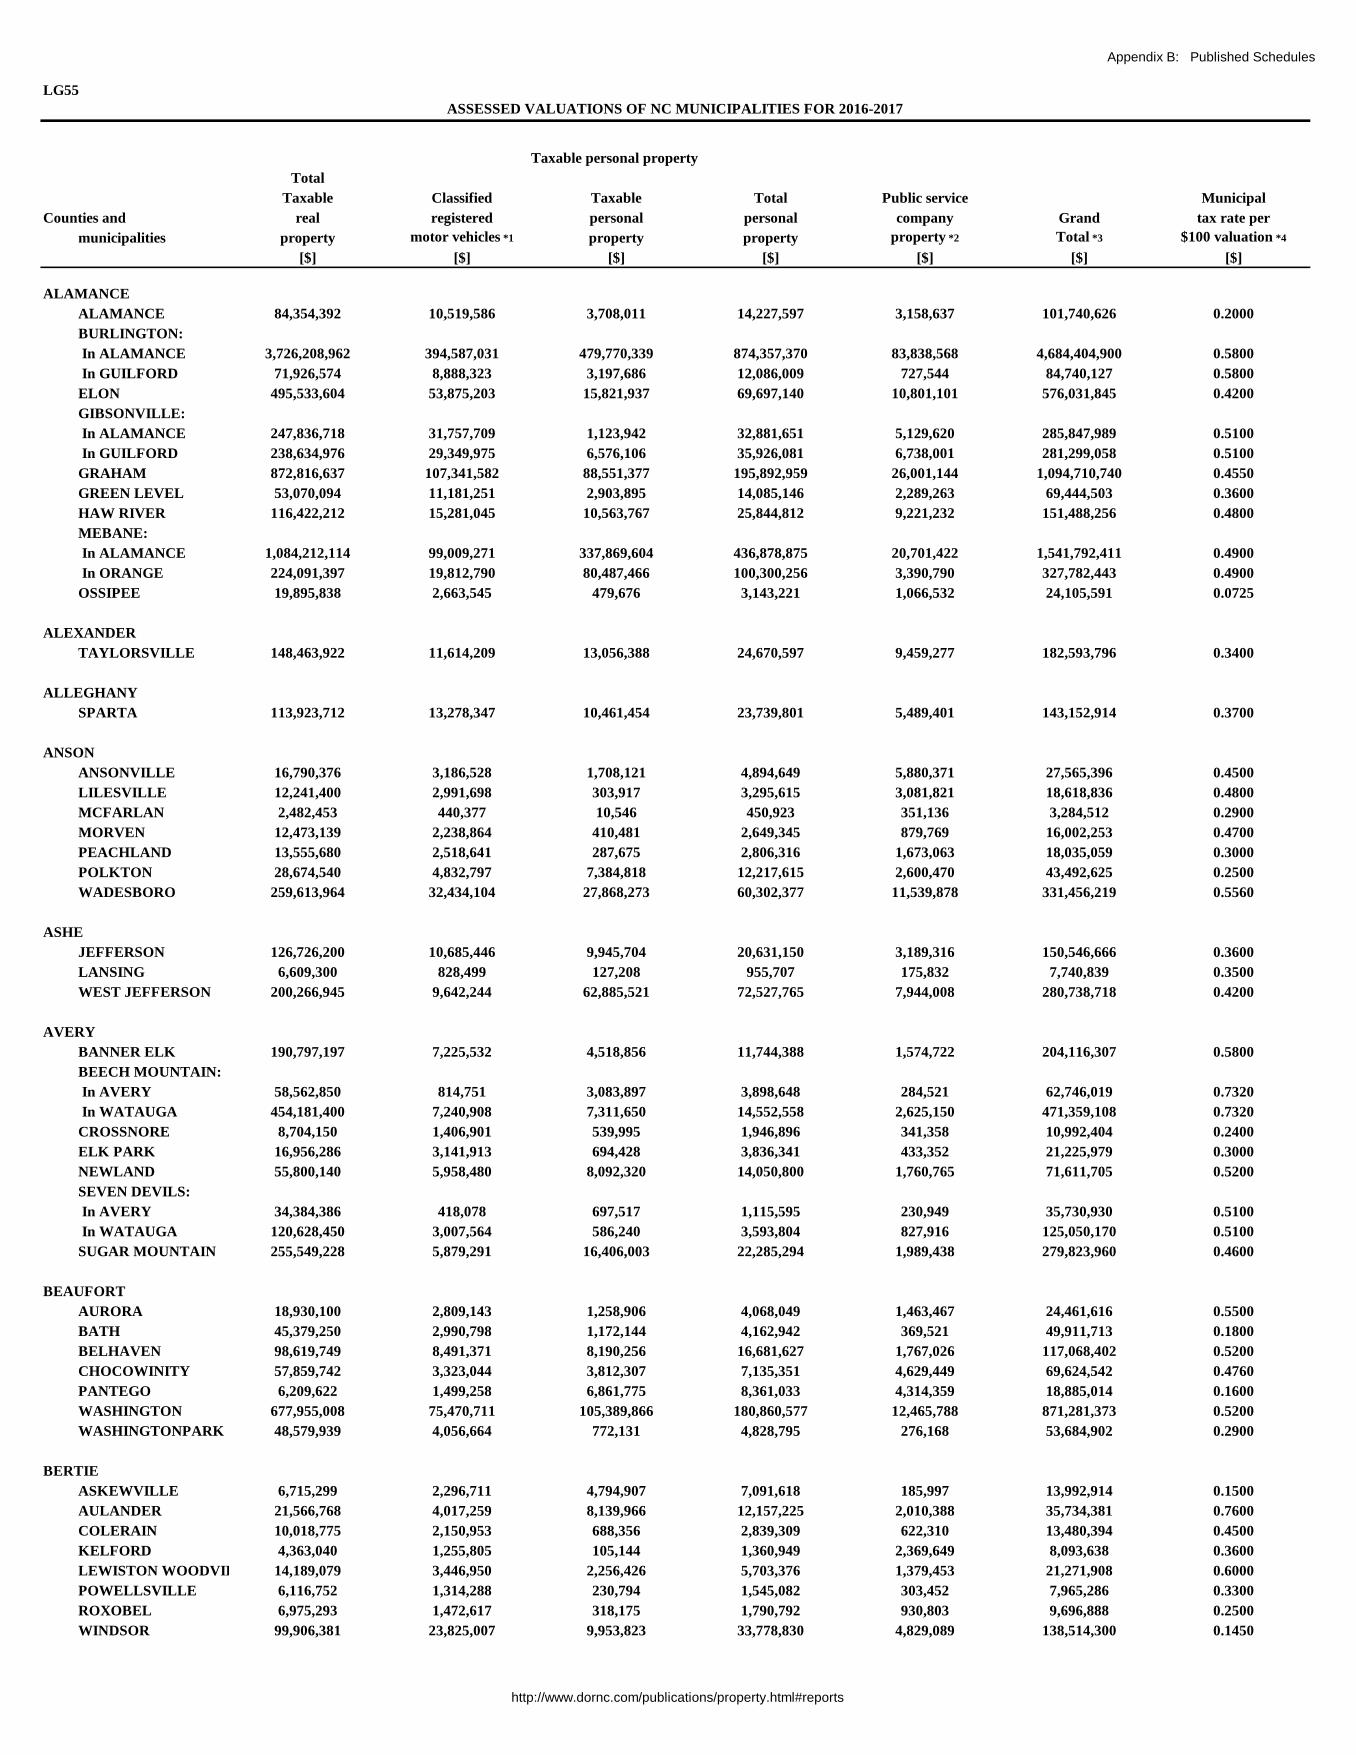
LG55
Total
Taxable Classified Taxable Total Public service Municipal
Counties and real registered personal personal company Grand tax rate per
municipalities property motor vehicles *1 property property property *2 Total *3 $100 valuation *4
[$] [$] [$] [$] [$] [$] [$]
ALAMANCE
ALAMANCE 84,354,392 10,519,586 3,708,011 14,227,597 3,158,637 101,740,626 0.2000
BURLINGTON:
In ALAMANCE 3,726,208,962 394,587,031 479,770,339 874,357,370 83,838,568 4,684,404,900 0.5800
In GUILFORD 71,926,574 8,888,323 3,197,686 12,086,009 727,544 84,740,127 0.5800
ELON 495,533,604 53,875,203 15,821,937 69,697,140 10,801,101 576,031,845 0.4200
GIBSONVILLE:
In ALAMANCE 247,836,718 31,757,709 1,123,942 32,881,651 5,129,620 285,847,989 0.5100
In GUILFORD 238,634,976 29,349,975 6,576,106 35,926,081 6,738,001 281,299,058 0.5100
GRAHAM 872,816,637 107,341,582 88,551,377 195,892,959 26,001,144 1,094,710,740 0.4550
GREEN LEVEL 53,070,094 11,181,251 2,903,895 14,085,146 2,289,263 69,444,503 0.3600
HAW RIVER 116,422,212 15,281,045 10,563,767 25,844,812 9,221,232 151,488,256 0.4800
MEBANE:
In ALAMANCE 1,084,212,114 99,009,271 337,869,604 436,878,875 20,701,422 1,541,792,411 0.4900
In ORANGE 224,091,397 19,812,790 80,487,466 100,300,256 3,390,790 327,782,443 0.4900
OSSIPEE 19,895,838 2,663,545 479,676 3,143,221 1,066,532 24,105,591 0.0725
ALEXANDER
TAYLORSVILLE 148,463,922 11,614,209 13,056,388 24,670,597 9,459,277 182,593,796 0.3400
ALLEGHANY
SPARTA 113,923,712 13,278,347 10,461,454 23,739,801 5,489,401 143,152,914 0.3700
ANSON
ANSONVILLE 16,790,376 3,186,528 1,708,121 4,894,649 5,880,371 27,565,396 0.4500
LILESVILLE 12,241,400 2,991,698 303,917 3,295,615 3,081,821 18,618,836 0.4800
MCFARLAN 2,482,453 440,377 10,546 450,923 351,136 3,284,512 0.2900
MORVEN 12,473,139 2,238,864 410,481 2,649,345 879,769 16,002,253 0.4700
PEACHLAND 13,555,680 2,518,641 287,675 2,806,316 1,673,063 18,035,059 0.3000
POLKTON 28,674,540 4,832,797 7,384,818 12,217,615 2,600,470 43,492,625 0.2500
WADESBORO 259,613,964 32,434,104 27,868,273 60,302,377 11,539,878 331,456,219 0.5560
ASHE
JEFFERSON 126,726,200 10,685,446 9,945,704 20,631,150 3,189,316 150,546,666 0.3600
LANSING 6,609,300 828,499 127,208 955,707 175,832 7,740,839 0.3500
WEST JEFFERSON 200,266,945 9,642,244 62,885,521 72,527,765 7,944,008 280,738,718 0.4200
AVERY
BANNER ELK 190,797,197 7,225,532 4,518,856 11,744,388 1,574,722 204,116,307 0.5800
BEECH MOUNTAIN:
In AVERY 58,562,850 814,751 3,083,897 3,898,648 284,521 62,746,019 0.7320
In WATAUGA 454,181,400 7,240,908 7,311,650 14,552,558 2,625,150 471,359,108 0.7320
CROSSNORE 8,704,150 1,406,901 539,995 1,946,896 341,358 10,992,404 0.2400
ELK PARK 16,956,286 3,141,913 694,428 3,836,341 433,352 21,225,979 0.3000
NEWLAND 55,800,140 5,958,480 8,092,320 14,050,800 1,760,765 71,611,705 0.5200
SEVEN DEVILS:
In AVERY 34,384,386 418,078 697,517 1,115,595 230,949 35,730,930 0.5100
In WATAUGA 120,628,450 3,007,564 586,240 3,593,804 827,916 125,050,170 0.5100
SUGAR MOUNTAIN 255,549,228 5,879,291 16,406,003 22,285,294 1,989,438 279,823,960 0.4600
BEAUFORT
AURORA 18,930,100 2,809,143 1,258,906 4,068,049 1,463,467 24,461,616 0.5500
BATH 45,379,250 2,990,798 1,172,144 4,162,942 369,521 49,911,713 0.1800
BELHAVEN 98,619,749 8,491,371 8,190,256 16,681,627 1,767,026 117,068,402 0.5200
CHOCOWINITY 57,859,742 3,323,044 3,812,307 7,135,351 4,629,449 69,624,542 0.4760
PANTEGO 6,209,622 1,499,258 6,861,775 8,361,033 4,314,359 18,885,014 0.1600
WASHINGTON 677,955,008 75,470,711 105,389,866 180,860,577 12,465,788 871,281,373 0.5200
WASHINGTONPARK 48,579,939 4,056,664 772,131 4,828,795 276,168 53,684,902 0.2900
BERTIE
ASKEWVILLE 6,715,299 2,296,711 4,794,907 7,091,618 185,997 13,992,914 0.1500
AULANDER 21,566,768 4,017,259 8,139,966 12,157,225 2,010,388 35,734,381 0.7600
COLERAIN 10,018,775 2,150,953 688,356 2,839,309 622,310 13,480,394 0.4500
KELFORD 4,363,040 1,255,805 105,144 1,360,949 2,369,649 8,093,638 0.3600
LEWISTON WOODVILLE 14,189,079 3,446,950 2,256,426 5,703,376 1,379,453 21,271,908 0.6000
POWELLSVILLE 6,116,752 1,314,288 230,794 1,545,082 303,452 7,965,286 0.3300
ROXOBEL 6,975,293 1,472,617 318,175 1,790,792 930,803 9,696,888 0.2500
WINDSOR 99,906,381 23,825,007 9,953,823 33,778,830 4,829,089 138,514,300 0.1450
ASSESSED VALUATIONS OF NC MUNICIPALITIES FOR 2016-2017
Taxable personal property
http://www.dornc.com/publications/property.html#reports
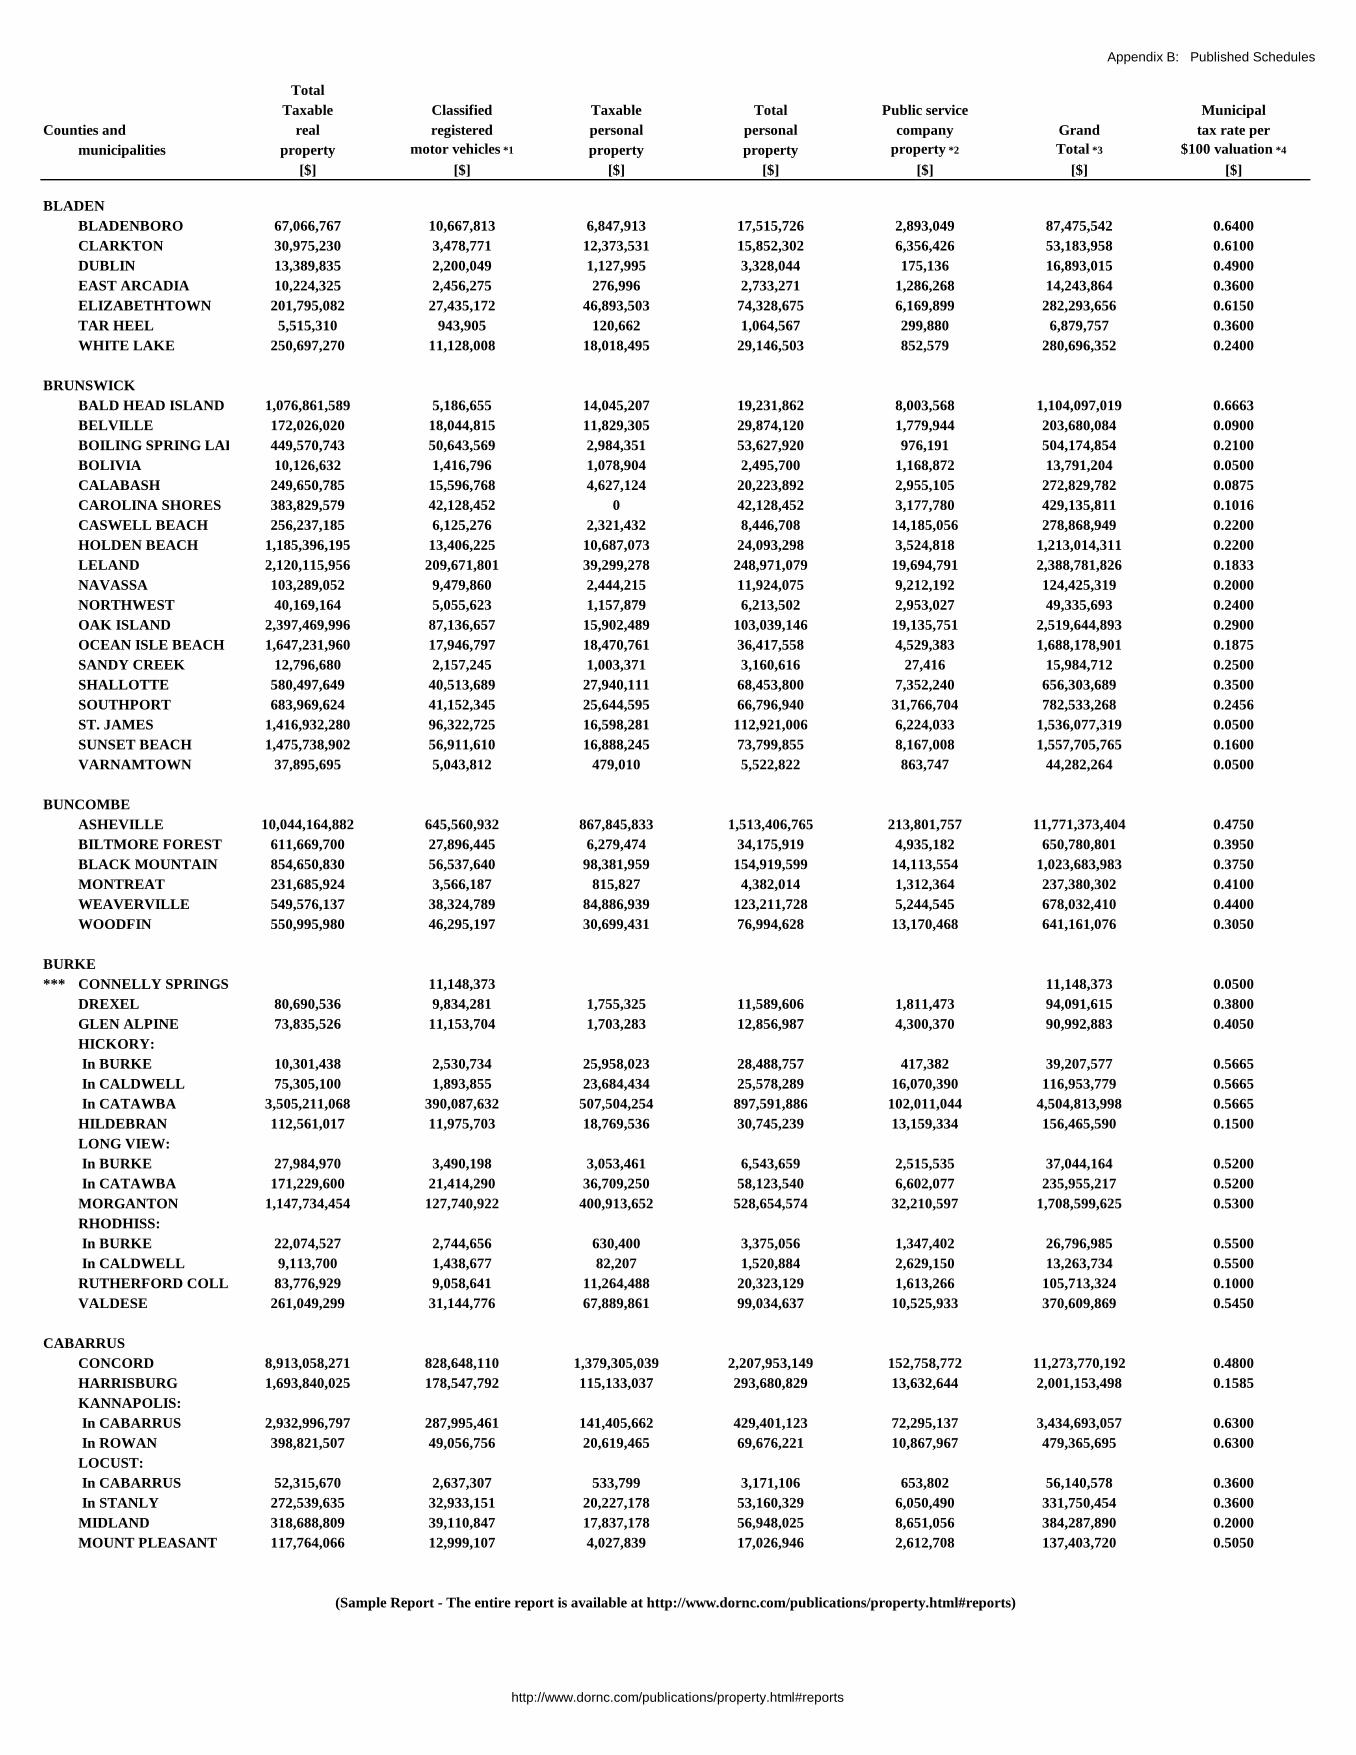
Appendix B: Published Schedules
Total
Taxable Classified Taxable Total Public service Municipal
Counties and real registered personal personal company Grand tax rate per
municipalities property motor vehicles *1 property property property *2 Total *3 $100 valuation *4
[$] [$] [$] [$] [$] [$] [$]
BLADEN
BLADENBORO 67,066,767 10,667,813 6,847,913 17,515,726 2,893,049 87,475,542 0.6400
CLARKTON 30,975,230 3,478,771 12,373,531 15,852,302 6,356,426 53,183,958 0.6100
DUBLIN 13,389,835 2,200,049 1,127,995 3,328,044 175,136 16,893,015 0.4900
EAST ARCADIA 10,224,325 2,456,275 276,996 2,733,271 1,286,268 14,243,864 0.3600
ELIZABETHTOWN 201,795,082 27,435,172 46,893,503 74,328,675 6,169,899 282,293,656 0.6150
TAR HEEL 5,515,310 943,905 120,662 1,064,567 299,880 6,879,757 0.3600
WHITE LAKE 250,697,270 11,128,008 18,018,495 29,146,503 852,579 280,696,352 0.2400
BRUNSWICK
BALD HEAD ISLAND 1,076,861,589 5,186,655 14,045,207 19,231,862 8,003,568 1,104,097,019 0.6663
BELVILLE 172,026,020 18,044,815 11,829,305 29,874,120 1,779,944 203,680,084 0.0900
BOILING SPRING LAKES 449,570,743 50,643,569 2,984,351 53,627,920 976,191 504,174,854 0.2100
BOLIVIA 10,126,632 1,416,796 1,078,904 2,495,700 1,168,872 13,791,204 0.0500
CALABASH 249,650,785 15,596,768 4,627,124 20,223,892 2,955,105 272,829,782 0.0875
CAROLINA SHORES 383,829,579 42,128,452 0 42,128,452 3,177,780 429,135,811 0.1016
CASWELL BEACH 256,237,185 6,125,276 2,321,432 8,446,708 14,185,056 278,868,949 0.2200
HOLDEN BEACH 1,185,396,195 13,406,225 10,687,073 24,093,298 3,524,818 1,213,014,311 0.2200
LELAND 2,120,115,956 209,671,801 39,299,278 248,971,079 19,694,791 2,388,781,826 0.1833
NAVASSA 103,289,052 9,479,860 2,444,215 11,924,075 9,212,192 124,425,319 0.2000
NORTHWEST 40,169,164 5,055,623 1,157,879 6,213,502 2,953,027 49,335,693 0.2400
OAK ISLAND 2,397,469,996 87,136,657 15,902,489 103,039,146 19,135,751 2,519,644,893 0.2900
OCEAN ISLE BEACH 1,647,231,960 17,946,797 18,470,761 36,417,558 4,529,383 1,688,178,901 0.1875
SANDY CREEK 12,796,680 2,157,245 1,003,371 3,160,616 27,416 15,984,712 0.2500
SHALLOTTE 580,497,649 40,513,689 27,940,111 68,453,800 7,352,240 656,303,689 0.3500
SOUTHPORT 683,969,624 41,152,345 25,644,595 66,796,940 31,766,704 782,533,268 0.2456
ST. JAMES 1,416,932,280 96,322,725 16,598,281 112,921,006 6,224,033 1,536,077,319 0.0500
SUNSET BEACH 1,475,738,902 56,911,610 16,888,245 73,799,855 8,167,008 1,557,705,765 0.1600
VARNAMTOWN 37,895,695 5,043,812 479,010 5,522,822 863,747 44,282,264 0.0500
BUNCOMBE
ASHEVILLE 10,044,164,882 645,560,932 867,845,833 1,513,406,765 213,801,757 11,771,373,404 0.4750
BILTMORE FOREST 611,669,700 27,896,445 6,279,474 34,175,919 4,935,182 650,780,801 0.3950
BLACK MOUNTAIN 854,650,830 56,537,640 98,381,959 154,919,599 14,113,554 1,023,683,983 0.3750
MONTREAT 231,685,924 3,566,187 815,827 4,382,014 1,312,364 237,380,302 0.4100
WEAVERVILLE 549,576,137 38,324,789 84,886,939 123,211,728 5,244,545 678,032,410 0.4400
WOODFIN 550,995,980 46,295,197 30,699,431 76,994,628 13,170,468 641,161,076 0.3050
BURKE
*** CONNELLY SPRINGS 11,148,373 11,148,373 0.0500
DREXEL 80,690,536 9,834,281 1,755,325 11,589,606 1,811,473 94,091,615 0.3800
GLEN ALPINE 73,835,526 11,153,704 1,703,283 12,856,987 4,300,370 90,992,883 0.4050
HICKORY:
In BURKE 10,301,438 2,530,734 25,958,023 28,488,757 417,382 39,207,577 0.5665
In CALDWELL 75,305,100 1,893,855 23,684,434 25,578,289 16,070,390 116,953,779 0.5665
In CATAWBA 3,505,211,068 390,087,632 507,504,254 897,591,886 102,011,044 4,504,813,998 0.5665
HILDEBRAN 112,561,017 11,975,703 18,769,536 30,745,239 13,159,334 156,465,590 0.1500
LONG VIEW:
In BURKE 27,984,970 3,490,198 3,053,461 6,543,659 2,515,535 37,044,164 0.5200
In CATAWBA 171,229,600 21,414,290 36,709,250 58,123,540 6,602,077 235,955,217 0.5200
MORGANTON 1,147,734,454 127,740,922 400,913,652 528,654,574 32,210,597 1,708,599,625 0.5300
RHODHISS:
In BURKE 22,074,527 2,744,656 630,400 3,375,056 1,347,402 26,796,985 0.5500
In CALDWELL 9,113,700 1,438,677 82,207 1,520,884 2,629,150 13,263,734 0.5500
RUTHERFORD COLLEGE 83,776,929 9,058,641 11,264,488 20,323,129 1,613,266 105,713,324 0.1000
VALDESE 261,049,299 31,144,776 67,889,861 99,034,637 10,525,933 370,609,869 0.5450
CABARRUS
CONCORD 8,913,058,271 828,648,110 1,379,305,039 2,207,953,149 152,758,772 11,273,770,192 0.4800
HARRISBURG 1,693,840,025 178,547,792 115,133,037 293,680,829 13,632,644 2,001,153,498 0.1585
KANNAPOLIS:
In CABARRUS 2,932,996,797 287,995,461 141,405,662 429,401,123 72,295,137 3,434,693,057 0.6300
In ROWAN 398,821,507 49,056,756 20,619,465 69,676,221 10,867,967 479,365,695 0.6300
LOCUST:
In CABARRUS 52,315,670 2,637,307 533,799 3,171,106 653,802 56,140,578 0.3600
In STANLY 272,539,635 32,933,151 20,227,178 53,160,329 6,050,490 331,750,454 0.3600
MIDLAND 318,688,809 39,110,847 17,837,178 56,948,025 8,651,056 384,287,890 0.2000
MOUNT PLEASANT 117,764,066 12,999,107 4,027,839 17,026,946 2,612,708 137,403,720 0.5050
(Sample Report - The entire report is available at http://www.dornc.com/publications/property.html#reports)
http://www.dornc.com/publications/property.html#reports
Appendix B: Published Schedules
Year Next Year Next
Tax of latest scheduled Tax of latest scheduled
Counties Rate revaluation revaluation Counties Rate revaluation revaluation
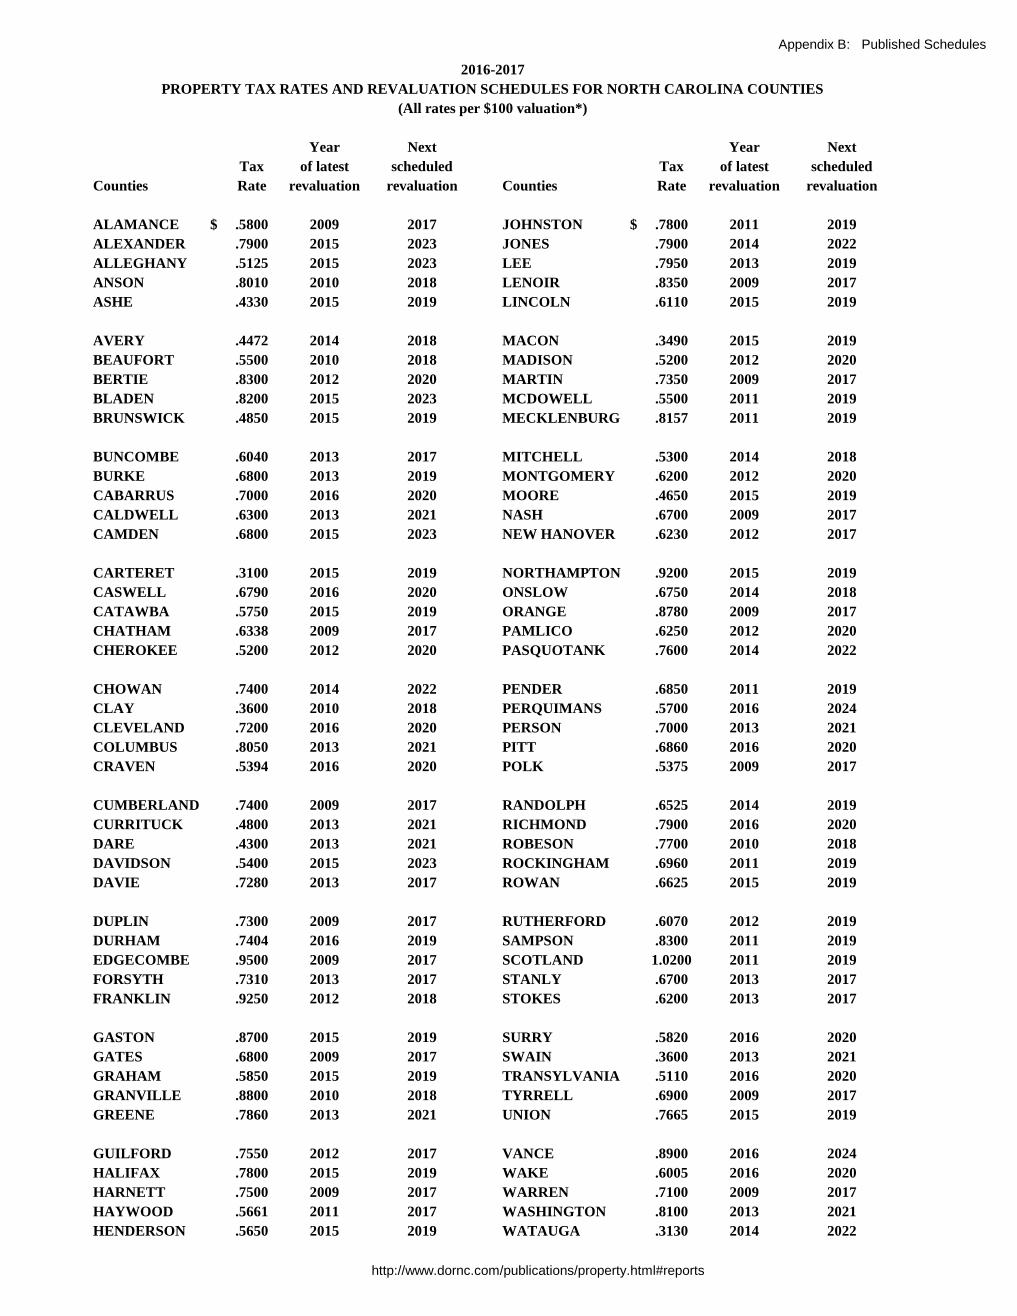
ALAMANCE $ .5800 2009 2017 JOHNSTON $ .7800 2011 2019
ALEXANDER .7900 2015 2023 JONES .7900 2014 2022
ALLEGHANY .5125 2015 2023 LEE .7950 2013 2019
ANSON .8010 2010 2018 LENOIR .8350 2009 2017
ASHE .4330 2015 2019 LINCOLN .6110 2015 2019
AVERY .4472 2014 2018 MACON .3490 2015 2019
BEAUFORT .5500 2010 2018 MADISON .5200 2012 2020
BERTIE .8300 2012 2020 MARTIN .7350 2009 2017
BLADEN .8200 2015 2023 MCDOWELL .5500 2011 2019
BRUNSWICK .4850 2015 2019 MECKLENBURG .8157 2011 2019
BUNCOMBE .6040 2013 2017 MITCHELL .5300 2014 2018
BURKE .6800 2013 2019 MONTGOMERY .6200 2012 2020
CABARRUS .7000 2016 2020 MOORE .4650 2015 2019
CALDWELL .6300 2013 2021 NASH .6700 2009 2017
CAMDEN .6800 2015 2023 NEW HANOVER .6230 2012 2017
CARTERET .3100 2015 2019 NORTHAMPTON .9200 2015 2019
CASWELL .6790 2016 2020 ONSLOW .6750 2014 2018
CATAWBA .5750 2015 2019 ORANGE .8780 2009 2017
CHATHAM .6338 2009 2017 PAMLICO .6250 2012 2020
CHEROKEE .5200 2012 2020 PASQUOTANK .7600 2014 2022
CHOWAN .7400 2014 2022 PENDER .6850 2011 2019
CLAY .3600 2010 2018 PERQUIMANS .5700 2016 2024
CLEVELAND .7200 2016 2020 PERSON .7000 2013 2021
COLUMBUS .8050 2013 2021 PITT .6860 2016 2020
CRAVEN .5394 2016 2020 POLK .5375 2009 2017
CUMBERLAND .7400 2009 2017 RANDOLPH .6525 2014 2019
CURRITUCK .4800 2013 2021 RICHMOND .7900 2016 2020
DARE .4300 2013 2021 ROBESON .7700 2010 2018
DAVIDSON .5400 2015 2023 ROCKINGHAM .6960 2011 2019
DAVIE .7280 2013 2017 ROWAN .6625 2015 2019
DUPLIN .7300 2009 2017 RUTHERFORD .6070 2012 2019
DURHAM .7404 2016 2019 SAMPSON .8300 2011 2019
EDGECOMBE .9500 2009 2017 SCOTLAND 1.0200 2011 2019
FORSYTH .7310 2013 2017 STANLY .6700 2013 2017
FRANKLIN .9250 2012 2018 STOKES .6200 2013 2017
GASTON .8700 2015 2019 SURRY .5820 2016 2020
GATES .6800 2009 2017 SWAIN .3600 2013 2021
GRAHAM .5850 2015 2019 TRANSYLVANIA .5110 2016 2020
GRANVILLE .8800 2010 2018 TYRRELL .6900 2009 2017
GREENE .7860 2013 2021 UNION .7665 2015 2019
GUILFORD .7550 2012 2017 VANCE .8900 2016 2024
HALIFAX .7800 2015 2019 WAKE .6005 2016 2020
HARNETT .7500 2009 2017 WARREN .7100 2009 2017
HAYWOOD .5661 2011 2017 WASHINGTON .8100 2013 2021
HENDERSON .5650 2015 2019 WATAUGA .3130 2014 2022
2016-2017
PROPERTY TAX RATES AND REVALUATION SCHEDULES FOR NORTH CAROLINA COUNTIES
(All rates per $100 valuation*)
http://www.dornc.com/publications/property.html#reports
Appendix B: Published Schedules
Year Next Year Next
Tax of latest scheduled Tax of latest scheduled
Counties Rate revaluation revaluation Counties Rate revaluation revaluation
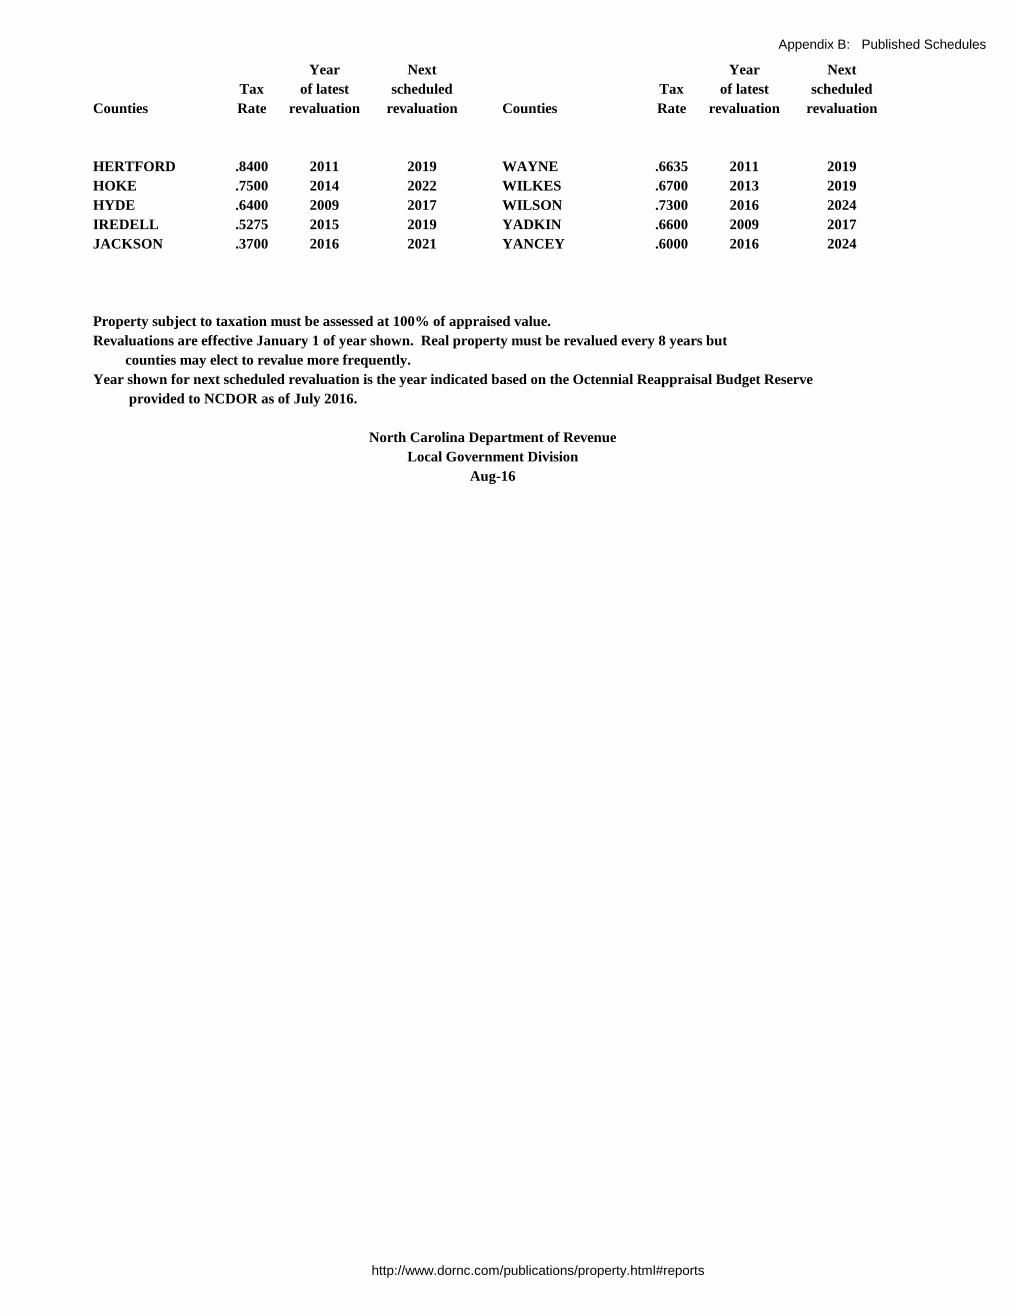
HERTFORD .8400 2011 2019 WAYNE .6635 2011 2019
HOKE .7500 2014 2022 WILKES .6700 2013 2019
HYDE .6400 2009 2017 WILSON .7300 2016 2024
IREDELL .5275 2015 2019 YADKIN .6600 2009 2017
JACKSON .3700 2016 2021 YANCEY .6000 2016 2024
Property subject to taxation must be assessed at 100% of appraised value.
Revaluations are effective January 1 of year shown. Real property must be revalued every 8 years but
counties may elect to revalue more frequently.
Year shown for next scheduled revaluation is the year indicated based on the Octennial Reappraisal Budget Reserve
provided to NCDOR as of July 2016.
Aug-16
North Carolina Department of Revenue
Local Government Division
http://www.dornc.com/publications/property.html#reports

Appendix B: Published Schedules
Next
County 2016-17 2015-16 2014-15 2013-14 2012-13 Latest scheduled
[$] [$] [$] [$] [$] revaluation revaluation
Alamance .5800 .5800 .5300 .5400 .5200 2009 2017
Alexander .7900 .7900 .6650 .6050 .6050 2015 2023
Alleghany .5125 .5125 .4700 .4700 .4700 2015 2023
Anson .8010 .8010 .7670 .7670 .7670 2010 2018
Ashe .4330 .4330 .4000 .4000 .4000 2015 2019
Avery .4472 .4472 .5210 .4050 .4050 2014 2018
Beaufort .5500 .5300 .5300 .5300 .5300 2010 2018
Bertie .8300 .8400 .8400 .8400 .7800 2012 2020
Bladen .8200 .8200 .7400 .7400 .7400 2015 2023
Brunswick .4850 .4850 .4425 .4425 .4425 2015 2019
Buncombe .6040 .6040 .6040 .5690 .5250 2013 2017
Burke .6800 .6800 .6800 .6800 .5200 2013 2019
Cabarrus .7000 .7000 .7000 .7000 .7000 2016 2020
Caldwell .6300 .6000 .6000 .6000 .6299 2013 2021
Camden .6800 .6800 .5900 .5900 .5900 2015 2023
Carteret .3100 .3000 .3000 .2900 .2900 2015 2019
Caswell .6790 .6790 .6790 .6590 .6590 2016 2020
Catawba .5750 .5750 .5300 .5300 .5300 2015 2019
Chatham .6338 .6219 .6219 .6219 .6219 2009 2017
Cherokee .5200 .5200 .5200 .5200 .5200 2012 2020
Chowan .7400 .7250 .7000 .6850 .6850 2014 2022
Clay .3600 .3600 .3600 .3600 .3600 2010 2018
Cleveland .7200 .7200 .7200 .7200 .7200 2016 2020
Columbus .8050 .8050 .8050 .8050 .8150 2013 2021
Craven .5394 .4675 .4675 .4675 .4700 2016 2020
Cumberland .7400 .7400 .7400 .7400 .7400 2009 2017
Currituck .4800 .4800 .4800 .4850 .3200 2013 2021
Dare .4300 .4300 .4300 .4300 .2800 2013 2021
Davidson .5400 .5400 .5400 .5400 .5400 2015 2023
Davie .7280 .7280 .6600 .6600 .6200 2013 2017
Duplin .7300 .7300 .7300 .7200 .7100 2009 2017
Durham .7404 .7931 .7931 .7744 .7444 2016 2019
Edgecombe .9500 .9500 .8950 .8600 .8600 2009 2017
Forsyth .7310 .7310 .7168 .7168 .6740 2013 2017
Franklin .9250 .9250 .8725 .8725 .8725 2012 2018
Gaston .8700 .8700 .8700 .8700 .8350 2015 2019
Gates .6800 .6400 .6400 .6400 .6400 2009 2017
Graham .5850 .5850 .4600 .4600 .4400 2015 2019
Granville .8800 .8300 .8300 .8300 .7950 2010 2018
Greene .7860 .7860 .7860 .7860 .7560 2013 2021
Guilford .7550 .7600 .7700 .7700 .7804 2012 2017
Halifax .7800 .7300 .6800 .6800 .6800 2015 2019
Harnett .7500 .7500 .7500 .7250 .7250 2009 2017
Haywood .5661 .5661 .5413 .5413 .5413 2011 2017
Henderson .5650 .5136 .5136 .5136 .5136 2015 2019
2016
NORTH CAROLINA COUNTY PROPERTY TAX RATES
FOR THE LAST FIVE YEARS
(All rates per $100 valuation*)
http://www.dornc.com/publications/property.html#reports
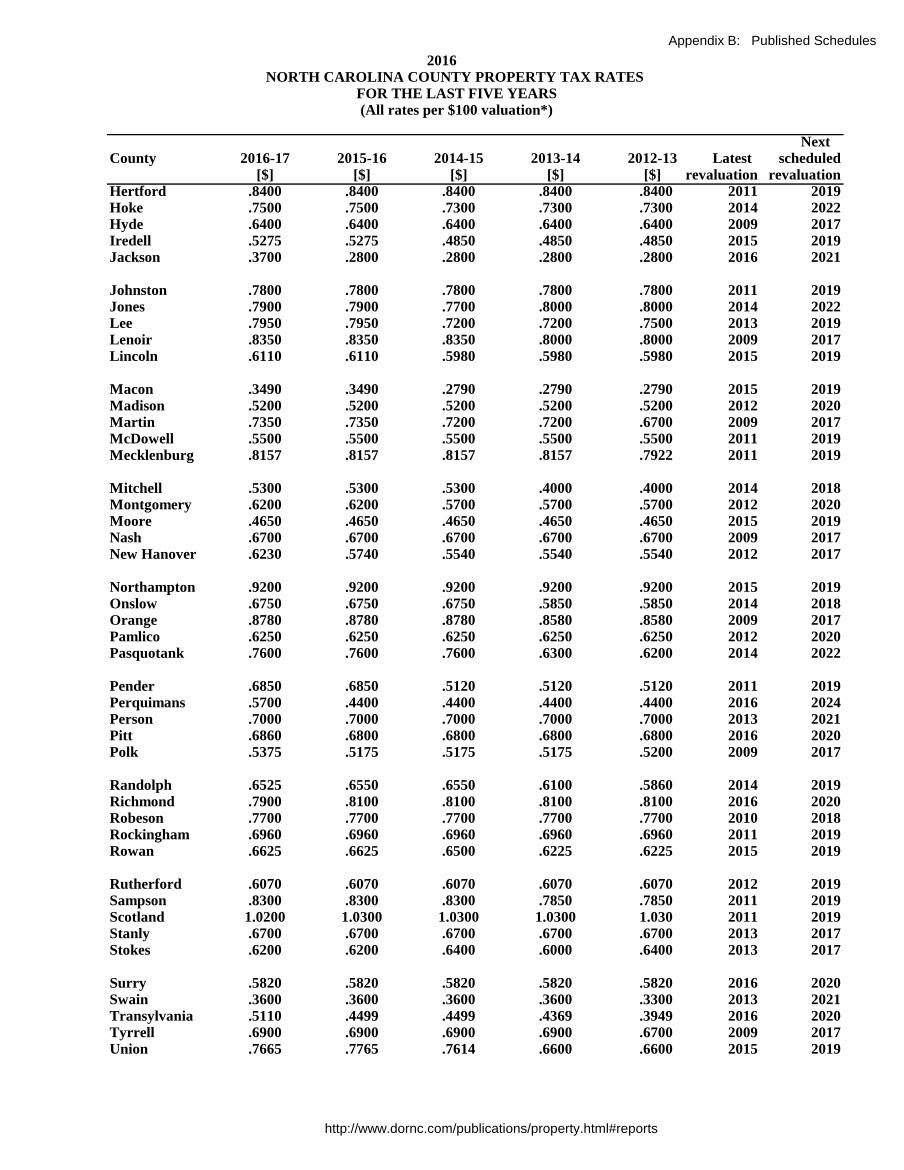
Appendix B: Published Schedules
Next
County 2016-17 2015-16 2014-15 2013-14 2012-13 Latest scheduled
[$] [$] [$] [$] [$] revaluation revaluation
2016
NORTH CAROLINA COUNTY PROPERTY TAX RATES
FOR THE LAST FIVE YEARS
(All rates per $100 valuation*)
Hertford .8400 .8400 .8400 .8400 .8400 2011 2019
Hoke .7500 .7500 .7300 .7300 .7300 2014 2022
Hyde .6400 .6400 .6400 .6400 .6400 2009 2017
Iredell .5275 .5275 .4850 .4850 .4850 2015 2019
Jackson .3700 .2800 .2800 .2800 .2800 2016 2021
Johnston .7800 .7800 .7800 .7800 .7800 2011 2019
Jones .7900 .7900 .7700 .8000 .8000 2014 2022
Lee .7950 .7950 .7200 .7200 .7500 2013 2019
Lenoir .8350 .8350 .8350 .8000 .8000 2009 2017
Lincoln .6110 .6110 .5980 .5980 .5980 2015 2019
Macon .3490 .3490 .2790 .2790 .2790 2015 2019
Madison .5200 .5200 .5200 .5200 .5200 2012 2020
Martin .7350 .7350 .7200 .7200 .6700 2009 2017
McDowell .5500 .5500 .5500 .5500 .5500 2011 2019
Mecklenburg .8157 .8157 .8157 .8157 .7922 2011 2019
Mitchell .5300 .5300 .5300 .4000 .4000 2014 2018
Montgomery .6200 .6200 .5700 .5700 .5700 2012 2020
Moore .4650 .4650 .4650 .4650 .4650 2015 2019
Nash .6700 .6700 .6700 .6700 .6700 2009 2017
New Hanover .6230 .5740 .5540 .5540 .5540 2012 2017
Northampton .9200 .9200 .9200 .9200 .9200 2015 2019
Onslow .6750 .6750 .6750 .5850 .5850 2014 2018
Orange .8780 .8780 .8780 .8580 .8580 2009 2017
Pamlico .6250 .6250 .6250 .6250 .6250 2012 2020
Pasquotank .7600 .7600 .7600 .6300 .6200 2014 2022
Pender .6850 .6850 .5120 .5120 .5120 2011 2019
Perquimans .5700 .4400 .4400 .4400 .4400 2016 2024
Person .7000 .7000 .7000 .7000 .7000 2013 2021
Pitt .6860 .6800 .6800 .6800 .6800 2016 2020
Polk .5375 .5175 .5175 .5175 .5200 2009 2017
Randolph .6525 .6550 .6550 .6100 .5860 2014 2019
Richmond .7900 .8100 .8100 .8100 .8100 2016 2020
Robeson .7700 .7700 .7700 .7700 .7700 2010 2018
Rockingham .6960 .6960 .6960 .6960 .6960 2011 2019
Rowan .6625 .6625 .6500 .6225 .6225 2015 2019
Rutherford .6070 .6070 .6070 .6070 .6070 2012 2019
Sampson .8300 .8300 .8300 .7850 .7850 2011 2019
Scotland 1.0200 1.0300 1.0300 1.0300 1.030 2011 2019
Stanly .6700 .6700 .6700 .6700 .6700 2013 2017
Stokes .6200 .6200 .6400 .6000 .6400 2013 2017
Surry .5820 .5820 .5820 .5820 .5820 2016 2020
Swain .3600 .3600 .3600 .3600 .3300 2013 2021
Transylvania .5110 .4499 .4499 .4369 .3949 2016 2020
Tyrrell .6900 .6900 .6900 .6900 .6700 2009 2017
Union .7665 .7765 .7614 .6600 .6600 2015 2019
http://www.dornc.com/publications/property.html#reports
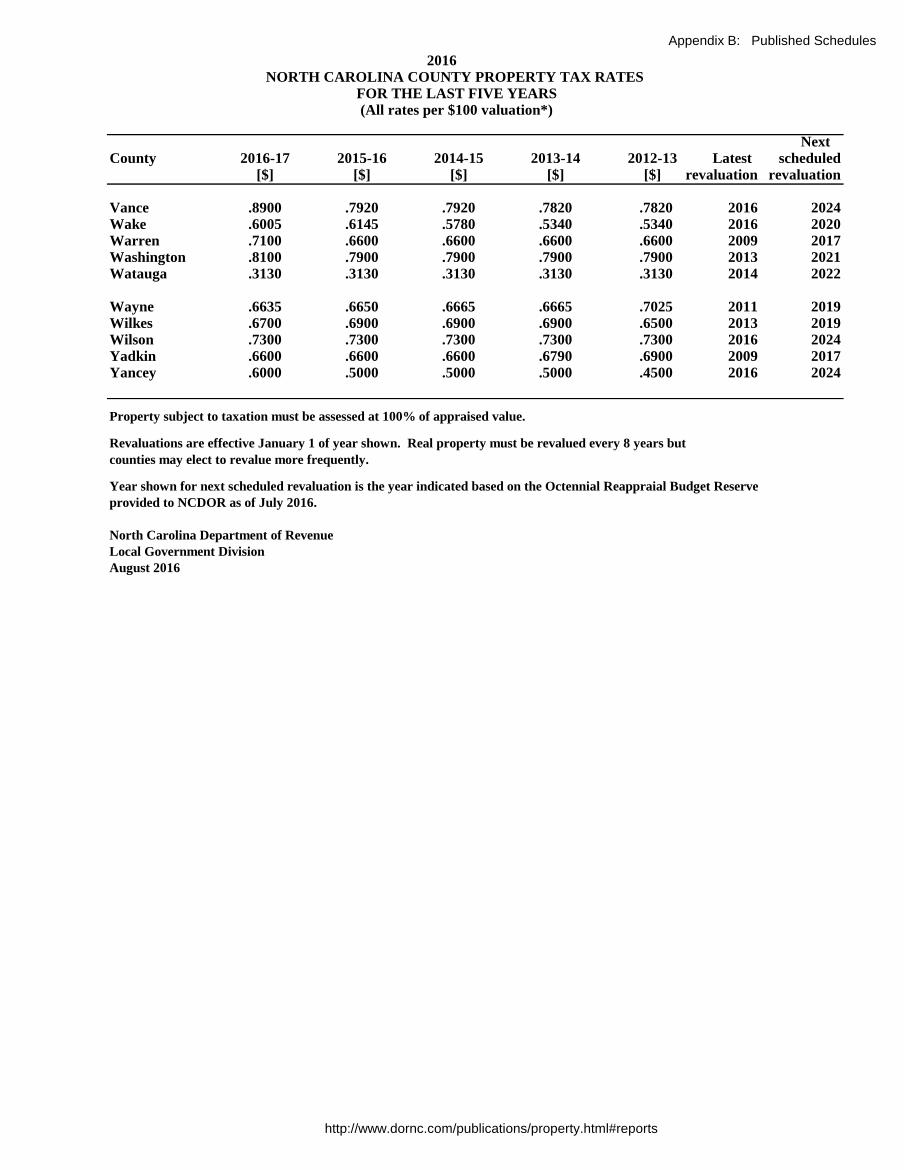
Appendix B: Published Schedules
Next
County 2016-17 2015-16 2014-15 2013-14 2012-13 Latest scheduled
[$] [$] [$] [$] [$] revaluation revaluation
2016
NORTH CAROLINA COUNTY PROPERTY TAX RATES
FOR THE LAST FIVE YEARS
(All rates per $100 valuation*)
Vance .8900 .7920 .7920 .7820 .7820 2016 2024
Wake .6005 .6145 .5780 .5340 .5340 2016 2020
Warren .7100 .6600 .6600 .6600 .6600 2009 2017
Washington .8100 .7900 .7900 .7900 .7900 2013 2021
Watauga .3130 .3130 .3130 .3130 .3130 2014 2022
Wayne .6635 .6650 .6665 .6665 .7025 2011 2019
Wilkes .6700 .6900 .6900 .6900 .6500 2013 2019
Wilson .7300 .7300 .7300 .7300 .7300 2016 2024
Yadkin .6600 .6600 .6600 .6790 .6900 2009 2017
Yancey .6000 .5000 .5000 .5000 .4500 2016 2024
Property subject to taxation must be assessed at 100% of appraised value.
Revaluations are effective January 1 of year shown. Real property must be revalued every 8 years but
counties may elect to revalue more frequently.
Year shown for next scheduled revaluation is the year indicated based on the Octennial Reappraial Budget Reserve
provided to NCDOR as of July 2016.
North Carolina Department of Revenue
Local Government Division
August 2016
http://www.dornc.com/publications/property.html#reports
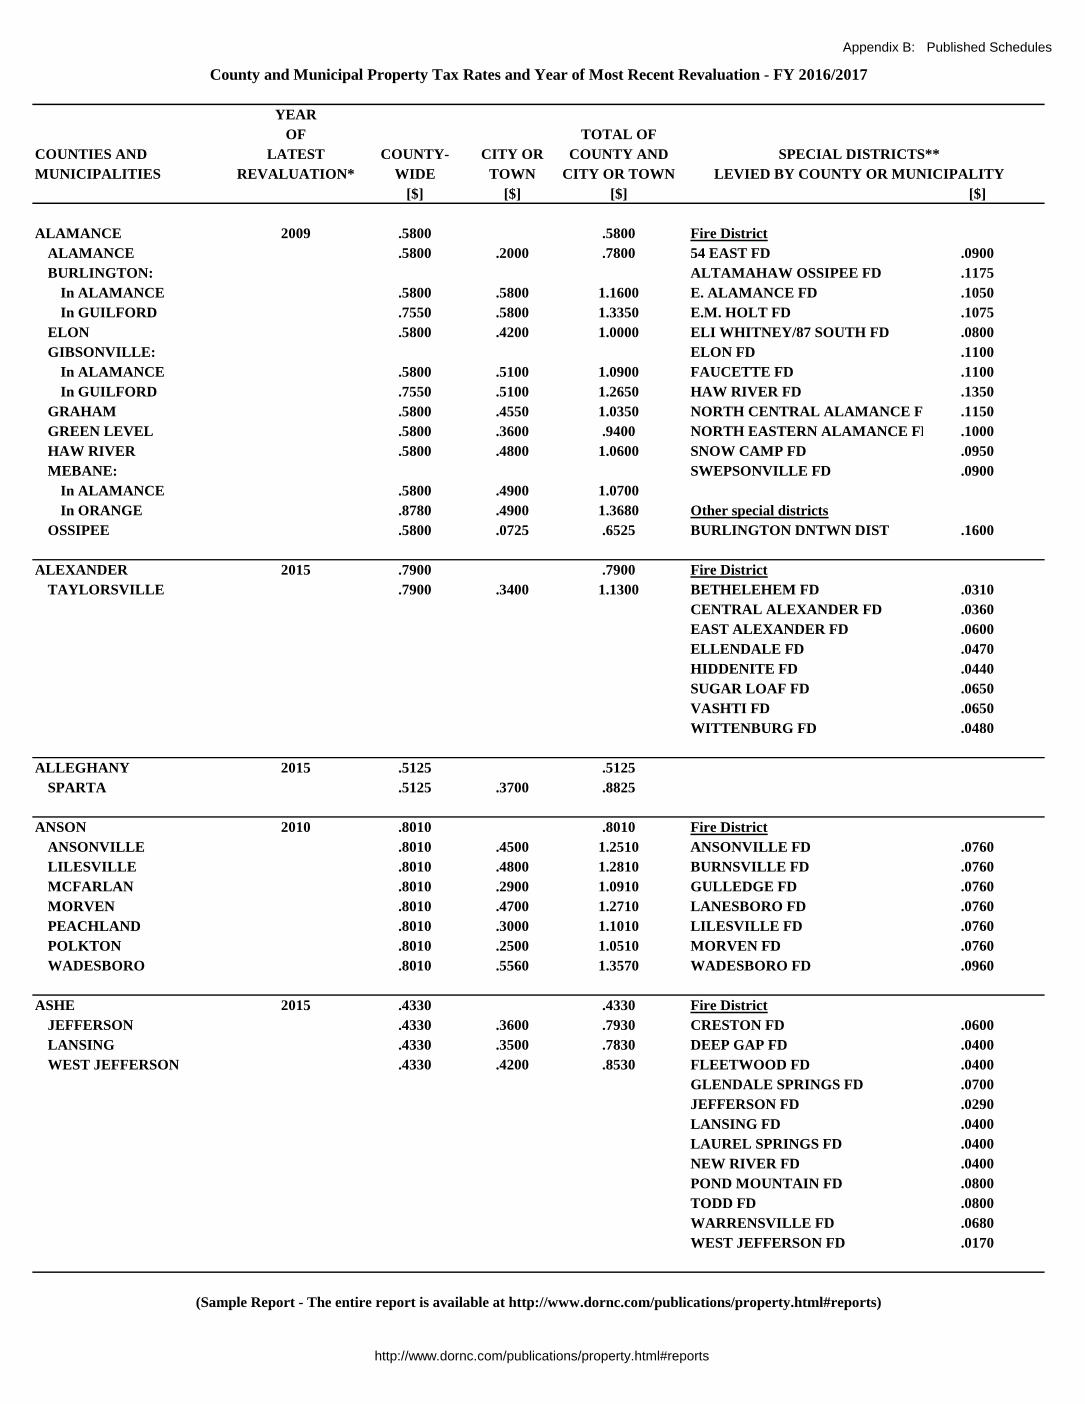
Appendix B: Published Schedules
YEAR
OF TOTAL OF
COUNTIES AND LATEST COUNTY- CITY OR COUNTY AND
MUNICIPALITIES REVALUATION* WIDE TOWN CITY OR TOWN
[$] [$] [$] [$]
ALAMANCE 2009 .5800 .5800 Fire District
ALAMANCE .5800 .2000 .7800 54 EAST FD .0900
BURLINGTON: ALTAMAHAW OSSIPEE FD .1175
In ALAMANCE .5800 .5800 1.1600 E. ALAMANCE FD .1050
In GUILFORD .7550 .5800 1.3350 E.M. HOLT FD .1075
ELON .5800 .4200 1.0000 ELI WHITNEY/87 SOUTH FD .0800
GIBSONVILLE: ELON FD .1100
In ALAMANCE .5800 .5100 1.0900 FAUCETTE FD .1100
In GUILFORD .7550 .5100 1.2650 HAW RIVER FD .1350
GRAHAM .5800 .4550 1.0350 NORTH CENTRAL ALAMANCE FD .1150
GREEN LEVEL .5800 .3600 .9400 NORTH EASTERN ALAMANCE FD .1000
HAW RIVER .5800 .4800 1.0600 SNOW CAMP FD .0950
MEBANE: SWEPSONVILLE FD .0900
In ALAMANCE .5800 .4900 1.0700
In ORANGE .8780 .4900 1.3680 Other special districts
OSSIPEE .5800 .0725 .6525 BURLINGTON DNTWN DIST .1600
ALEXANDER 2015 .7900 .7900 Fire District
TAYLORSVILLE .7900 .3400 1.1300 BETHELEHEM FD .0310
CENTRAL ALEXANDER FD .0360
EAST ALEXANDER FD .0600
ELLENDALE FD .0470
HIDDENITE FD .0440
SUGAR LOAF FD .0650
VASHTI FD .0650
WITTENBURG FD .0480
ALLEGHANY 2015 .5125 .5125
SPARTA .5125 .3700 .8825
ANSON 2010 .8010 .8010 Fire District
ANSONVILLE .8010 .4500 1.2510 ANSONVILLE FD .0760
LILESVILLE .8010 .4800 1.2810 BURNSVILLE FD .0760
MCFARLAN .8010 .2900 1.0910 GULLEDGE FD .0760
MORVEN .8010 .4700 1.2710 LANESBORO FD .0760
PEACHLAND .8010 .3000 1.1010 LILESVILLE FD .0760
POLKTON .8010 .2500 1.0510 MORVEN FD .0760
WADESBORO .8010 .5560 1.3570 WADESBORO FD .0960
ASHE 2015 .4330 .4330 Fire District
JEFFERSON .4330 .3600 .7930 CRESTON FD .0600
LANSING .4330 .3500 .7830 DEEP GAP FD .0400
WEST JEFFERSON .4330 .4200 .8530 FLEETWOOD FD .0400
GLENDALE SPRINGS FD .0700
JEFFERSON FD .0290
LANSING FD .0400
LAUREL SPRINGS FD .0400
NEW RIVER FD .0400
POND MOUNTAIN FD .0800
TODD FD .0800
WARRENSVILLE FD .0680
WEST JEFFERSON FD .0170
County and Municipal Property Tax Rates and Year of Most Recent Revaluation - FY 2016/2017
SPECIAL DISTRICTS**
LEVIED BY COUNTY OR MUNICIPALITY
(Sample Report - The entire report is available at http://www.dornc.com/publications/property.html#reports)
http://www.dornc.com/publications/property.html#reports
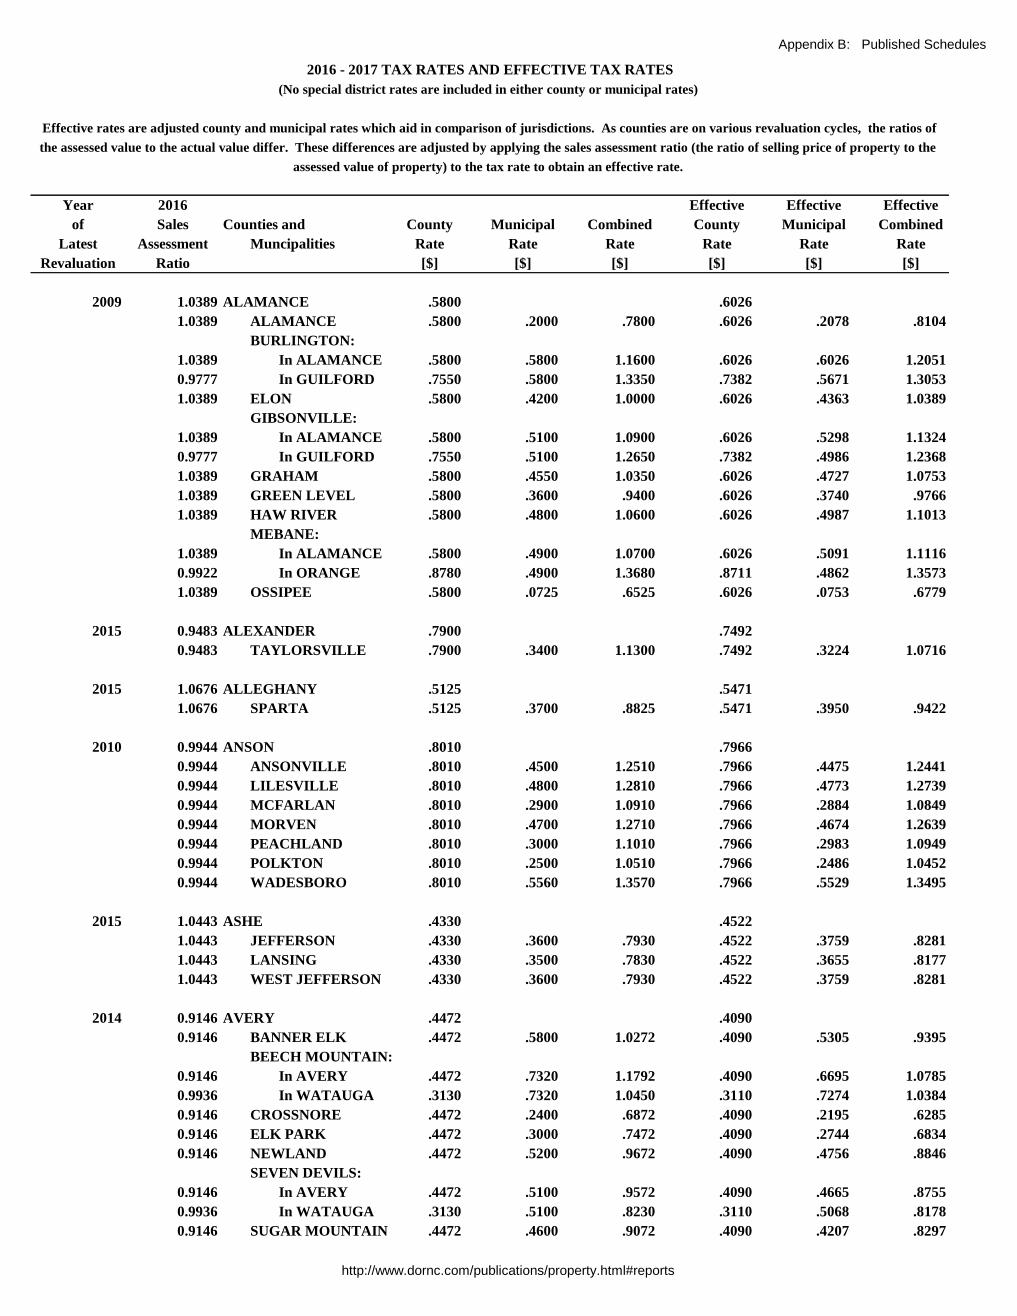
Appendix B: Published Schedules
Year 2016 Effective Effective Effective
of Sales Counties and County Municipal Combined County Municipal Combined
Latest Assessment Muncipalities Rate Rate Rate Rate Rate Rate
Revaluation Ratio [$] [$] [$] [$] [$] [$]
2009 1.0389 ALAMANCE .5800 .6026
1.0389 ALAMANCE .5800 .2000 .7800 .6026 .2078 .8104
BURLINGTON:
1.0389 In ALAMANCE .5800 .5800 1.1600 .6026 .6026 1.2051
0.9777 In GUILFORD .7550 .5800 1.3350 .7382 .5671 1.3053
1.0389 ELON .5800 .4200 1.0000 .6026 .4363 1.0389
GIBSONVILLE:
1.0389 In ALAMANCE .5800 .5100 1.0900 .6026 .5298 1.1324
0.9777 In GUILFORD .7550 .5100 1.2650 .7382 .4986 1.2368
1.0389 GRAHAM .5800 .4550 1.0350 .6026 .4727 1.0753
1.0389 GREEN LEVEL .5800 .3600 .9400 .6026 .3740 .9766
1.0389 HAW RIVER .5800 .4800 1.0600 .6026 .4987 1.1013
MEBANE:
1.0389 In ALAMANCE .5800 .4900 1.0700 .6026 .5091 1.1116
0.9922 In ORANGE .8780 .4900 1.3680 .8711 .4862 1.3573
1.0389 OSSIPEE .5800 .0725 .6525 .6026 .0753 .6779
2015 0.9483 ALEXANDER .7900 .7492
0.9483 TAYLORSVILLE .7900 .3400 1.1300 .7492 .3224 1.0716
2015 1.0676 ALLEGHANY .5125 .5471
1.0676 SPARTA .5125 .3700 .8825 .5471 .3950 .9422
2010 0.9944 ANSON .8010 .7966
0.9944 ANSONVILLE .8010 .4500 1.2510 .7966 .4475 1.2441
0.9944 LILESVILLE .8010 .4800 1.2810 .7966 .4773 1.2739
0.9944 MCFARLAN .8010 .2900 1.0910 .7966 .2884 1.0849
0.9944 MORVEN .8010 .4700 1.2710 .7966 .4674 1.2639
0.9944 PEACHLAND .8010 .3000 1.1010 .7966 .2983 1.0949
0.9944 POLKTON .8010 .2500 1.0510 .7966 .2486 1.0452
0.9944 WADESBORO .8010 .5560 1.3570 .7966 .5529 1.3495
2015 1.0443 ASHE .4330 .4522
1.0443 JEFFERSON .4330 .3600 .7930 .4522 .3759 .8281
1.0443 LANSING .4330 .3500 .7830 .4522 .3655 .8177
1.0443 WEST JEFFERSON .4330 .3600 .7930 .4522 .3759 .8281
2014 0.9146 AVERY .4472 .4090
0.9146 BANNER ELK .4472 .5800 1.0272 .4090 .5305 .9395
BEECH MOUNTAIN:
0.9146 In AVERY .4472 .7320 1.1792 .4090 .6695 1.0785
0.9936 In WATAUGA .3130 .7320 1.0450 .3110 .7274 1.0384
0.9146 CROSSNORE .4472 .2400 .6872 .4090 .2195 .6285
0.9146 ELK PARK .4472 .3000 .7472 .4090 .2744 .6834
0.9146 NEWLAND .4472 .5200 .9672 .4090 .4756 .8846
SEVEN DEVILS:
0.9146 In AVERY .4472 .5100 .9572 .4090 .4665 .8755
0.9936 In WATAUGA .3130 .5100 .8230 .3110 .5068 .8178
0.9146 SUGAR MOUNTAIN .4472 .4600 .9072 .4090 .4207 .8297
2016 - 2017 TAX RATES AND EFFECTIVE TAX RATES
(No special district rates are included in either county or municipal rates)
Effective rates are adjusted county and municipal rates which aid in comparison of jurisdictions. As counties are on various revaluation cycles, the ratios of
the assessed value to the actual value differ. These differences are adjusted by applying the sales assessment ratio (the ratio of selling price of property to the
assessed value of property) to the tax rate to obtain an effective rate.
http://www.dornc.com/publications/property.html#reports
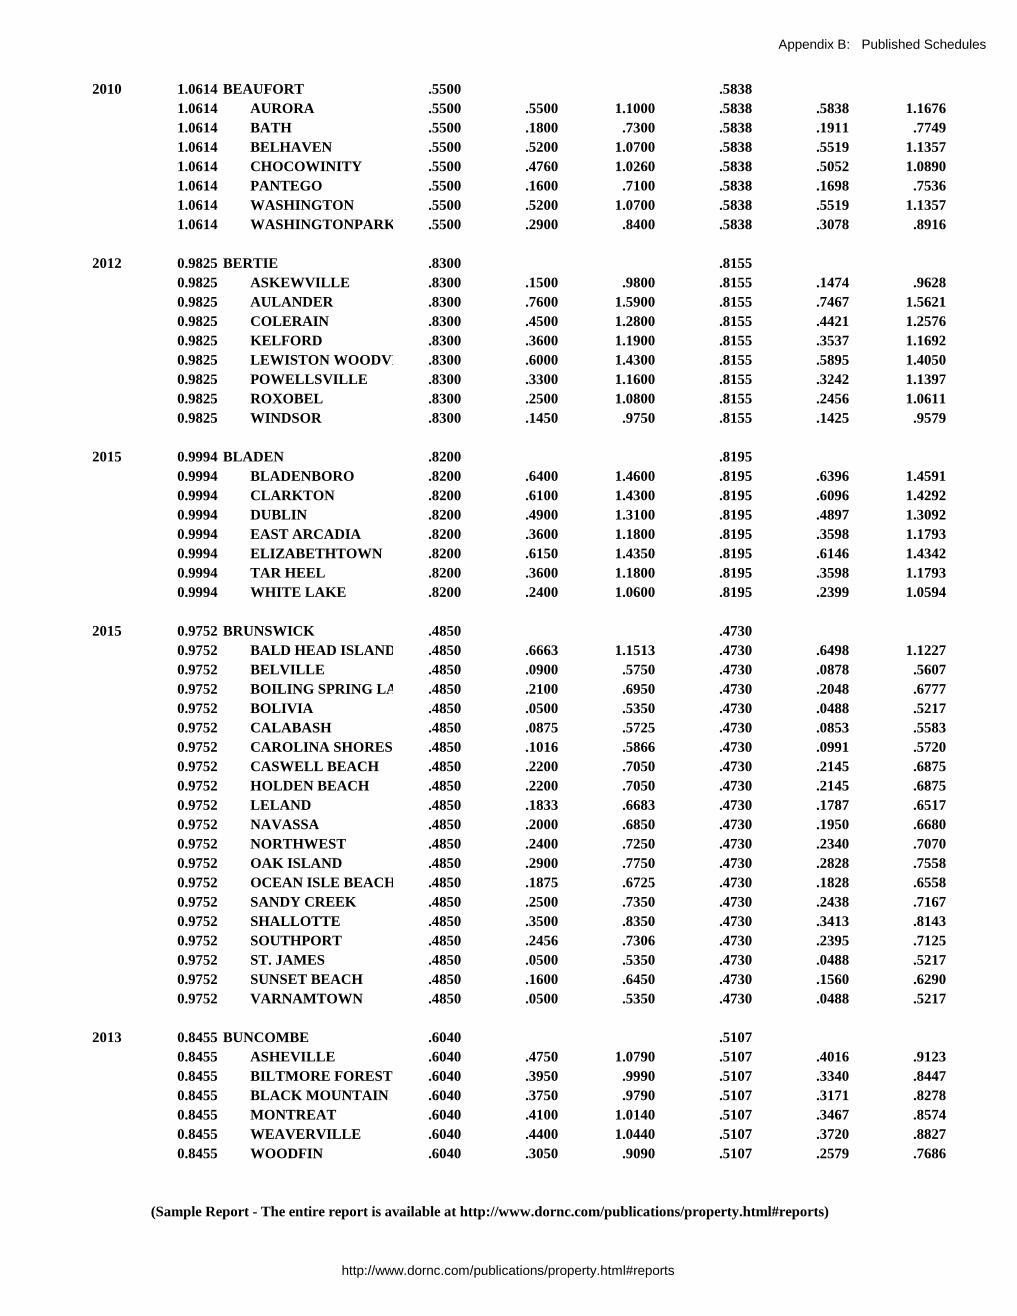
Appendix B: Published Schedules
2010 1.0614 BEAUFORT .5500 .5838
1.0614 AURORA .5500 .5500 1.1000 .5838 .5838 1.1676
1.0614 BATH .5500 .1800 .7300 .5838 .1911 .7749
1.0614 BELHAVEN .5500 .5200 1.0700 .5838 .5519 1.1357
1.0614 CHOCOWINITY .5500 .4760 1.0260 .5838 .5052 1.0890
1.0614 PANTEGO .5500 .1600 .7100 .5838 .1698 .7536
1.0614 WASHINGTON .5500 .5200 1.0700 .5838 .5519 1.1357
1.0614 WASHINGTONPARK .5500 .2900 .8400 .5838 .3078 .8916
2012 0.9825 BERTIE .8300 .8155
0.9825 ASKEWVILLE .8300 .1500 .9800 .8155 .1474 .9628
0.9825 AULANDER .8300 .7600 1.5900 .8155 .7467 1.5621
0.9825 COLERAIN .8300 .4500 1.2800 .8155 .4421 1.2576
0.9825 KELFORD .8300 .3600 1.1900 .8155 .3537 1.1692
0.9825 LEWISTON WOODVILLE.8300 .6000 1.4300 .8155 .5895 1.4050
0.9825 POWELLSVILLE .8300 .3300 1.1600 .8155 .3242 1.1397
0.9825 ROXOBEL .8300 .2500 1.0800 .8155 .2456 1.0611
0.9825 WINDSOR .8300 .1450 .9750 .8155 .1425 .9579
2015 0.9994 BLADEN .8200 .8195
0.9994 BLADENBORO .8200 .6400 1.4600 .8195 .6396 1.4591
0.9994 CLARKTON .8200 .6100 1.4300 .8195 .6096 1.4292
0.9994 DUBLIN .8200 .4900 1.3100 .8195 .4897 1.3092
0.9994 EAST ARCADIA .8200 .3600 1.1800 .8195 .3598 1.1793
0.9994 ELIZABETHTOWN .8200 .6150 1.4350 .8195 .6146 1.4342
0.9994 TAR HEEL .8200 .3600 1.1800 .8195 .3598 1.1793
0.9994 WHITE LAKE .8200 .2400 1.0600 .8195 .2399 1.0594
2015 0.9752 BRUNSWICK .4850 .4730
0.9752 BALD HEAD ISLAND .4850 .6663 1.1513 .4730 .6498 1.1227
0.9752 BELVILLE .4850 .0900 .5750 .4730 .0878 .5607
0.9752 BOILING SPRING LAKES .4850 .2100 .6950 .4730 .2048 .6777
0.9752 BOLIVIA .4850 .0500 .5350 .4730 .0488 .5217
0.9752 CALABASH .4850 .0875 .5725 .4730 .0853 .5583
0.9752 CAROLINA SHORES .4850 .1016 .5866 .4730 .0991 .5720
0.9752 CASWELL BEACH .4850 .2200 .7050 .4730 .2145 .6875
0.9752 HOLDEN BEACH .4850 .2200 .7050 .4730 .2145 .6875
0.9752 LELAND .4850 .1833 .6683 .4730 .1787 .6517
0.9752 NAVASSA .4850 .2000 .6850 .4730 .1950 .6680
0.9752 NORTHWEST .4850 .2400 .7250 .4730 .2340 .7070
0.9752 OAK ISLAND .4850 .2900 .7750 .4730 .2828 .7558
0.9752 OCEAN ISLE BEACH .4850 .1875 .6725 .4730 .1828 .6558
0.9752 SANDY CREEK .4850 .2500 .7350 .4730 .2438 .7167
0.9752 SHALLOTTE .4850 .3500 .8350 .4730 .3413 .8143
0.9752 SOUTHPORT .4850 .2456 .7306 .4730 .2395 .7125
0.9752 ST. JAMES .4850 .0500 .5350 .4730 .0488 .5217
0.9752 SUNSET BEACH .4850 .1600 .6450 .4730 .1560 .6290
0.9752 VARNAMTOWN .4850 .0500 .5350 .4730 .0488 .5217
2013 0.8455 BUNCOMBE .6040 .5107
0.8455 ASHEVILLE .6040 .4750 1.0790 .5107 .4016 .9123
0.8455 BILTMORE FOREST .6040 .3950 .9990 .5107 .3340 .8447
0.8455 BLACK MOUNTAIN .6040 .3750 .9790 .5107 .3171 .8278
0.8455 MONTREAT .6040 .4100 1.0140 .5107 .3467 .8574
0.8455 WEAVERVILLE .6040 .4400 1.0440 .5107 .3720 .8827
0.8455 WOODFIN .6040 .3050 .9090 .5107 .2579 .7686
(Sample Report - The entire report is available at http://www.dornc.com/publications/property.html#reports)
http://www.dornc.com/publications/property.html#reports

Airline Bus Motor Freight Power EMC Solar Farm Gas Pipeline Railroad Landline Wireless Tower Grand Total
companies companies companies companies companies companies companies companies companies companies companies companies County
Counties Total Value Total Value Total Value Total Value Total Value Total Value Total Value Total Value Total Value Total Value Total Value Total Value Valuation
ALAMANCE 7,853 654,174 595,630 171,620,915 14,275,572 0 48,969,344 14,406,882 10,269,333 38,791,241 21,385,343 4,187,460 325,163,747
ALEXANDER 0 539 0 46,309,734 19,087,808 715,224 1,186,585 0 4,156,194 6,401,793 6,862,461 1,678,040 86,398,378
ALLEGHANY 0 1,104 0 1,575,111 37,223,096 0 0 0 0 380,933 6,387,204 967,068 46,534,516
ANSON 0 16,185 3,552,412 59,954,277 140,033,313 0 46,989,451 6,368 19,677,859 9,437,794 4,739,618 982,991 285,390,268
ASHE 0 0 0 0 86,012,121 0 2,230,436 0 0 1,140,578 8,306,736 1,777,105 99,466,976
AVERY 0 0 0 3,735,683 24,078,105 0 2,802,181 0 0 4,433,617 6,567,603 668,259 42,285,448
BEAUFORT 0 19,672 1,288,707 27,073,352 31,570,480 8,808,831 7,579,549 0 12,978,672 9,877,615 8,152,812 2,832,152 110,181,842
BERTIE 0 38,098 0 15,715,700 15,028,835 10,675,621 3,986,483 0 4,576,620 4,770,720 2,207,662 1,624,652 58,624,391
BLADEN 0 6,782 0 36,918,983 50,575,259 0 41,733,541 0 15,794,612 3,946,601 7,216,289 2,951,602 159,143,669
BRUNSWICK 0 28,226 7,903,202 1,383,829,147 193,244,749 0 33,645,480 0 8,564,525 12,960,106 20,667,263 4,303,966 1,665,146,664
BUNCOMBE 11,399,844 575,283 9,847,119 368,489,564 17,933,415 0 63,906,525 0 30,446,613 64,822,188 42,662,851 3,551,692 613,635,094
BURKE 0 467,716 2,094,982 143,554,162 38,205,520 0 28,121,676 0 16,482,759 16,957,783 12,534,886 1,950,796 260,370,280
CABARRUS 848,571 247,641 32,831,678 124,403,070 24,071,965 0 110,787,513 12,488,555 16,899,575 49,619,286 30,598,047 4,678,319 407,474,220
CALDWELL 0 11,315 25,178,528 82,044,148 57,997,263 0 14,479,800 0 72,500 16,544,832 17,643,399 1,616,086 215,587,871
CAMDEN 0 4,787 0 6,945,373 9,867,725 0 389,669 0 2,036,710 2,256,379 1,284,065 264,829 23,049,537
CARTERET 4,318 44,299 0 52,530,301 51,014,676 0 1,854,487 0 8,492,403 18,571,536 12,157,792 1,243,650 145,913,462
CASWELL 0 56,089 13,052,161 40,126,774 12,432,610 0 3,029,576 1,177,633 6,127,047 6,237,046 2,235,618 561,819 85,036,373
CATAWBA 75,199 1,020,249 64,173,258 631,118,928 13,575,250 0 58,023,434 1,373,798 16,541,265 29,771,489 27,791,269 2,667,270 846,131,409
CHATHAM 0 43,130 0 106,720,445 20,081,269 0 27,353,686 13,091,423 8,451,542 19,960,949 10,979,893 1,874,601 208,556,938
CHEROKEE 0 0 0 24,824,839 20,782,829 1,907,805 0 0 1,323,442 6,625,256 4,022,352 1,200,127 60,686,650
CHOWAN 144,854 4,963 473,415 19,239,357 5,387,316 0 1,999,849 0 1,941,644 3,185,914 1,217,978 279,984 33,875,274
CLAY 0 0 0 4,159,621 23,203,137 0 0 0 0 2,664,647 2,127,995 658,055 32,813,455
CLEVELAND 0 59,607 16,428,655 613,202,393 19,186,158 743,038 12,867,798 20,704,108 22,060,387 117,206,237 10,831,623 3,573,330 836,863,334
COLUMBUS 0 0 0 65,985,964 61,838,891 0 12,500,858 0 10,461,150 22,977,286 7,703,676 2,275,222 183,743,047
CRAVEN 7,769,702 122,859 2,022,595 60,455,571 15,162,749 0 22,100,543 0 14,117,241 21,750,829 15,175,371 3,388,160 162,065,620
CUMBERLAND 7,353,162 204,324 29,096,514 96,472,972 82,510,009 0 66,613,264 1,240,510 35,378,770 66,929,170 46,618,400 6,868,751 439,285,846
CURRITUCK 2,618 0 0 81,353,819 505,881 6,757,633 1,060,849 0 5,893,766 6,902,963 8,295,908 1,202,159 111,975,596
DARE 985,884 39,353 288,073 109,689,370 12,830,071 0 361,659 0 0 13,177,962 12,314,325 1,165,409 150,852,106
DAVIDSON 0 319,728 11,929,481 106,844,865 78,865,968 0 6,514,931 57,007,712 49,461,598 77,240,200 22,016,646 4,285,359 414,486,488
DAVIE 0 202,321 322,062 51,469,614 26,926,084 0 4,717,362 912,399 3,638,218 4,182,511 6,453,590 1,779,490 100,603,651
DUPLIN 0 218,745 215,201 54,020,588 52,994,206 0 10,166,042 0 5,551,520 9,658,572 8,644,197 2,601,675 144,070,746
DURHAM 0 1,115,627 11,081,714 270,518,124 15,977,201 0 84,404,711 0 13,740,844 123,186,572 49,146,374 6,366,190 575,537,357
EDGECOMBE 0 94,561 0 33,951,436 29,930,108 29,193,685 13,702,479 0 21,228,728 36,097,601 6,529,975 1,994,674 172,723,247
FORSYTH 127,798 718,362 38,754,756 365,772,609 8,395,915 0 85,576,841 5,869,233 28,230,445 100,691,406 51,834,609 9,691,504 695,663,478
FRANKLIN 0 680,579 0 60,961,523 31,228,348 0 12,735,526 0 2,014,456 17,513,588 7,832,373 2,068,685 135,035,078
GASTON 0 430,698 9,532,388 481,667,780 38,295,168 0 99,935,487 43,794,452 30,780,262 52,477,740 24,357,636 5,056,466 786,328,077
GATES 0 23,382 0 10,235,807 7,881,659 2,041,767 5,288,781 0 0 3,481,653 1,869,435 981,869 31,804,353
GRAHAM 0 0 0 31,425,141 0 0 0 0 0 2,093,188 903,875 69,373 34,491,577
GRANVILLE 0 436,381 4,396,384 54,051,654 27,058,164 0 27,932,792 0 7,594,632 10,746,254 6,330,317 1,272,401 139,818,979
GREENE 0 30,059 0 8,160,551 19,412,450 0 10,958,713 0 840,337 3,287,576 2,600,574 1,019,433 46,309,693
GUILFORD 47,768,387 1,786,257 120,114,739 465,613,598 2,818,533 0 145,655,194 163,358,352 49,376,997 214,427,721 95,588,340 12,394,075 1,318,902,193
HALIFAX 0 224,115 114,547 128,734,431 28,269,302 14,200,773 14,159,064 0 21,975,246 13,503,425 8,398,124 2,244,214 231,823,241
HARNETT 0 97,069 0 75,742,123 62,423,604 0 9,353,951 1,216,877 13,521,461 21,015,531 14,803,814 3,063,219 201,237,649
HAYWOOD 0 412,031 0 85,849,319 54,072,045 0 5,452,626 0 3,445,630 15,567,574 12,229,769 1,333,552 178,362,546
HENDERSON 0 96,737 11,331,179 163,027,291 0 0 50,568,633 0 5,239,949 21,805,726 16,956,935 2,126,479 271,152,929
HERTFORD 0 28,033 0 43,877,344 19,955,332 6,980,322 6,479,719 730,316 8,281,118 5,717,712 2,726,988 923,702 95,700,586
HOKE 0 11,690 370,443 27,032,695 40,416,493 0 23,030,617 0 3,132,689 7,710,365 6,100,370 1,629,544 109,434,906
TOTAL VALUATION OF PROPERTY OF PUBLIC SERVICE COMPANIES
BY COUNTIES AND BY TYPE OF COMPANIES FOR: 2017
Transportation Companies Power Companies Gas / Pipeline Companies Railroad Property Telephone Companies
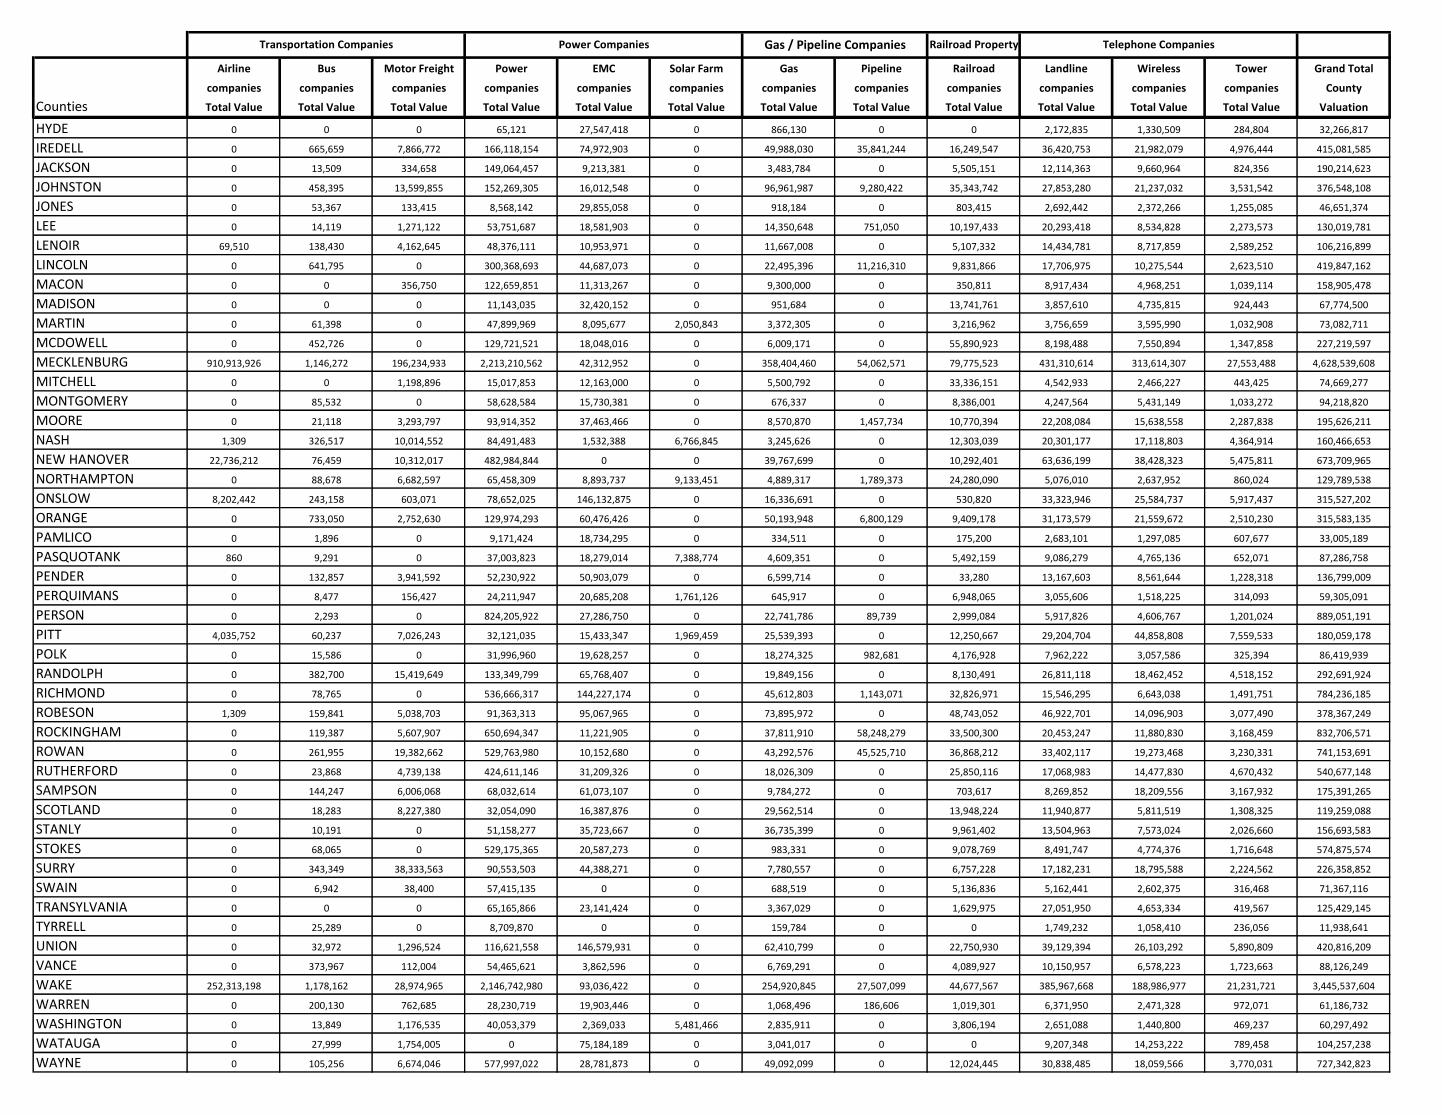
Airline Bus Motor Freight Power EMC Solar Farm Gas Pipeline Railroad Landline Wireless Tower Grand Total
companies companies companies companies companies companies companies companies companies companies companies companies County
Counties Total Value Total Value Total Value Total Value Total Value Total Value Total Value Total Value Total Value Total Value Total Value Total Value Valuation
Transportation Companies Power Companies Gas / Pipeline Companies Railroad Property Telephone Companies
HYDE 0 0 0 65,121 27,547,418 0 866,130 0 0 2,172,835 1,330,509 284,804 32,266,817
IREDELL 0 665,659 7,866,772 166,118,154 74,972,903 0 49,988,030 35,841,244 16,249,547 36,420,753 21,982,079 4,976,444 415,081,585
JACKSON 0 13,509 334,658 149,064,457 9,213,381 0 3,483,784 0 5,505,151 12,114,363 9,660,964 824,356 190,214,623
JOHNSTON 0 458,395 13,599,855 152,269,305 16,012,548 0 96,961,987 9,280,422 35,343,742 27,853,280 21,237,032 3,531,542 376,548,108
JONES 0 53,367 133,415 8,568,142 29,855,058 0 918,184 0 803,415 2,692,442 2,372,266 1,255,085 46,651,374
LEE 0 14,119 1,271,122 53,751,687 18,581,903 0 14,350,648 751,050 10,197,433 20,293,418 8,534,828 2,273,573 130,019,781
LENOIR 69,510 138,430 4,162,645 48,376,111 10,953,971 0 11,667,008 0 5,107,332 14,434,781 8,717,859 2,589,252 106,216,899
LINCOLN 0 641,795 0 300,368,693 44,687,073 0 22,495,396 11,216,310 9,831,866 17,706,975 10,275,544 2,623,510 419,847,162
MACON 0 0 356,750 122,659,851 11,313,267 0 9,300,000 0 350,811 8,917,434 4,968,251 1,039,114 158,905,478
MADISON 0 0 0 11,143,035 32,420,152 0 951,684 0 13,741,761 3,857,610 4,735,815 924,443 67,774,500
MARTIN 0 61,398 0 47,899,969 8,095,677 2,050,843 3,372,305 0 3,216,962 3,756,659 3,595,990 1,032,908 73,082,711
MCDOWELL 0 452,726 0 129,721,521 18,048,016 0 6,009,171 0 55,890,923 8,198,488 7,550,894 1,347,858 227,219,597
MECKLENBURG 910,913,926 1,146,272 196,234,933 2,213,210,562 42,312,952 0 358,404,460 54,062,571 79,775,523 431,310,614 313,614,307 27,553,488 4,628,539,608
MITCHELL 0 0 1,198,896 15,017,853 12,163,000 0 5,500,792 0 33,336,151 4,542,933 2,466,227 443,425 74,669,277
MONTGOMERY 0 85,532 0 58,628,584 15,730,381 0 676,337 0 8,386,001 4,247,564 5,431,149 1,033,272 94,218,820
MOORE 0 21,118 3,293,797 93,914,352 37,463,466 0 8,570,870 1,457,734 10,770,394 22,208,084 15,638,558 2,287,838 195,626,211
NASH 1,309 326,517 10,014,552 84,491,483 1,532,388 6,766,845 3,245,626 0 12,303,039 20,301,177 17,118,803 4,364,914 160,466,653
NEW HANOVER 22,736,212 76,459 10,312,017 482,984,844 0 0 39,767,699 0 10,292,401 63,636,199 38,428,323 5,475,811 673,709,965
NORTHAMPTON 0 88,678 6,682,597 65,458,309 8,893,737 9,133,451 4,889,317 1,789,373 24,280,090 5,076,010 2,637,952 860,024 129,789,538
ONSLOW 8,202,442 243,158 603,071 78,652,025 146,132,875 0 16,336,691 0 530,820 33,323,946 25,584,737 5,917,437 315,527,202
ORANGE 0 733,050 2,752,630 129,974,293 60,476,426 0 50,193,948 6,800,129 9,409,178 31,173,579 21,559,672 2,510,230 315,583,135
PAMLICO 0 1,896 0 9,171,424 18,734,295 0 334,511 0 175,200 2,683,101 1,297,085 607,677 33,005,189
PASQUOTANK 860 9,291 0 37,003,823 18,279,014 7,388,774 4,609,351 0 5,492,159 9,086,279 4,765,136 652,071 87,286,758
PENDER 0 132,857 3,941,592 52,230,922 50,903,079 0 6,599,714 0 33,280 13,167,603 8,561,644 1,228,318 136,799,009
PERQUIMANS 0 8,477 156,427 24,211,947 20,685,208 1,761,126 645,917 0 6,948,065 3,055,606 1,518,225 314,093 59,305,091
PERSON 0 2,293 0 824,205,922 27,286,750 0 22,741,786 89,739 2,999,084 5,917,826 4,606,767 1,201,024 889,051,191
PITT 4,035,752 60,237 7,026,243 32,121,035 15,433,347 1,969,459 25,539,393 0 12,250,667 29,204,704 44,858,808 7,559,533 180,059,178
POLK 0 15,586 0 31,996,960 19,628,257 0 18,274,325 982,681 4,176,928 7,962,222 3,057,586 325,394 86,419,939
RANDOLPH 0 382,700 15,419,649 133,349,799 65,768,407 0 19,849,156 0 8,130,491 26,811,118 18,462,452 4,518,152 292,691,924
RICHMOND 0 78,765 0 536,666,317 144,227,174 0 45,612,803 1,143,071 32,826,971 15,546,295 6,643,038 1,491,751 784,236,185
ROBESON 1,309 159,841 5,038,703 91,363,313 95,067,965 0 73,895,972 0 48,743,052 46,922,701 14,096,903 3,077,490 378,367,249
ROCKINGHAM 0 119,387 5,607,907 650,694,347 11,221,905 0 37,811,910 58,248,279 33,500,300 20,453,247 11,880,830 3,168,459 832,706,571
ROWAN 0 261,955 19,382,662 529,763,980 10,152,680 0 43,292,576 45,525,710 36,868,212 33,402,117 19,273,468 3,230,331 741,153,691
RUTHERFORD 0 23,868 4,739,138 424,611,146 31,209,326 0 18,026,309 0 25,850,116 17,068,983 14,477,830 4,670,432 540,677,148
SAMPSON 0 144,247 6,006,068 68,032,614 61,073,107 0 9,784,272 0 703,617 8,269,852 18,209,556 3,167,932 175,391,265
SCOTLAND 0 18,283 8,227,380 32,054,090 16,387,876 0 29,562,514 0 13,948,224 11,940,877 5,811,519 1,308,325 119,259,088
STANLY 0 10,191 0 51,158,277 35,723,667 0 36,735,399 0 9,961,402 13,504,963 7,573,024 2,026,660 156,693,583
STOKES 0 68,065 0 529,175,365 20,587,273 0 983,331 0 9,078,769 8,491,747 4,774,376 1,716,648 574,875,574
SURRY 0 343,349 38,333,563 90,553,503 44,388,271 0 7,780,557 0 6,757,228 17,182,231 18,795,588 2,224,562 226,358,852
SWAIN 0 6,942 38,400 57,415,135 0 0 688,519 0 5,136,836 5,162,441 2,602,375 316,468 71,367,116
TRANSYLVANIA 0 0 0 65,165,866 23,141,424 0 3,367,029 0 1,629,975 27,051,950 4,653,334 419,567 125,429,145
TYRRELL 0 25,289 0 8,709,870 0 0 159,784 0 0 1,749,232 1,058,410 236,056 11,938,641
UNION 0 32,972 1,296,524 116,621,558 146,579,931 0 62,410,799 0 22,750,930 39,129,394 26,103,292 5,890,809 420,816,209
VANCE 0 373,967 112,004 54,465,621 3,862,596 0 6,769,291 0 4,089,927 10,150,957 6,578,223 1,723,663 88,126,249
WAKE 252,313,198 1,178,162 28,974,965 2,146,742,980 93,036,422 0 254,920,845 27,507,099 44,677,567 385,967,668 188,986,977 21,231,721 3,445,537,604
WARREN 0 200,130 762,685 28,230,719 19,903,446 0 1,068,496 186,606 1,019,301 6,371,950 2,471,328 972,071 61,186,732
WASHINGTON 0 13,849 1,176,535 40,053,379 2,369,033 5,481,466 2,835,911 0 3,806,194 2,651,088 1,440,800 469,237 60,297,492
WATAUGA 0 27,999 1,754,005 0 75,184,189 0 3,041,017 0 0 9,207,348 14,253,222 789,458 104,257,238
WAYNE 0 105,256 6,674,046 577,997,022 28,781,873 0 49,092,099 0 12,024,445 30,838,485 18,059,566 3,770,031 727,342,823
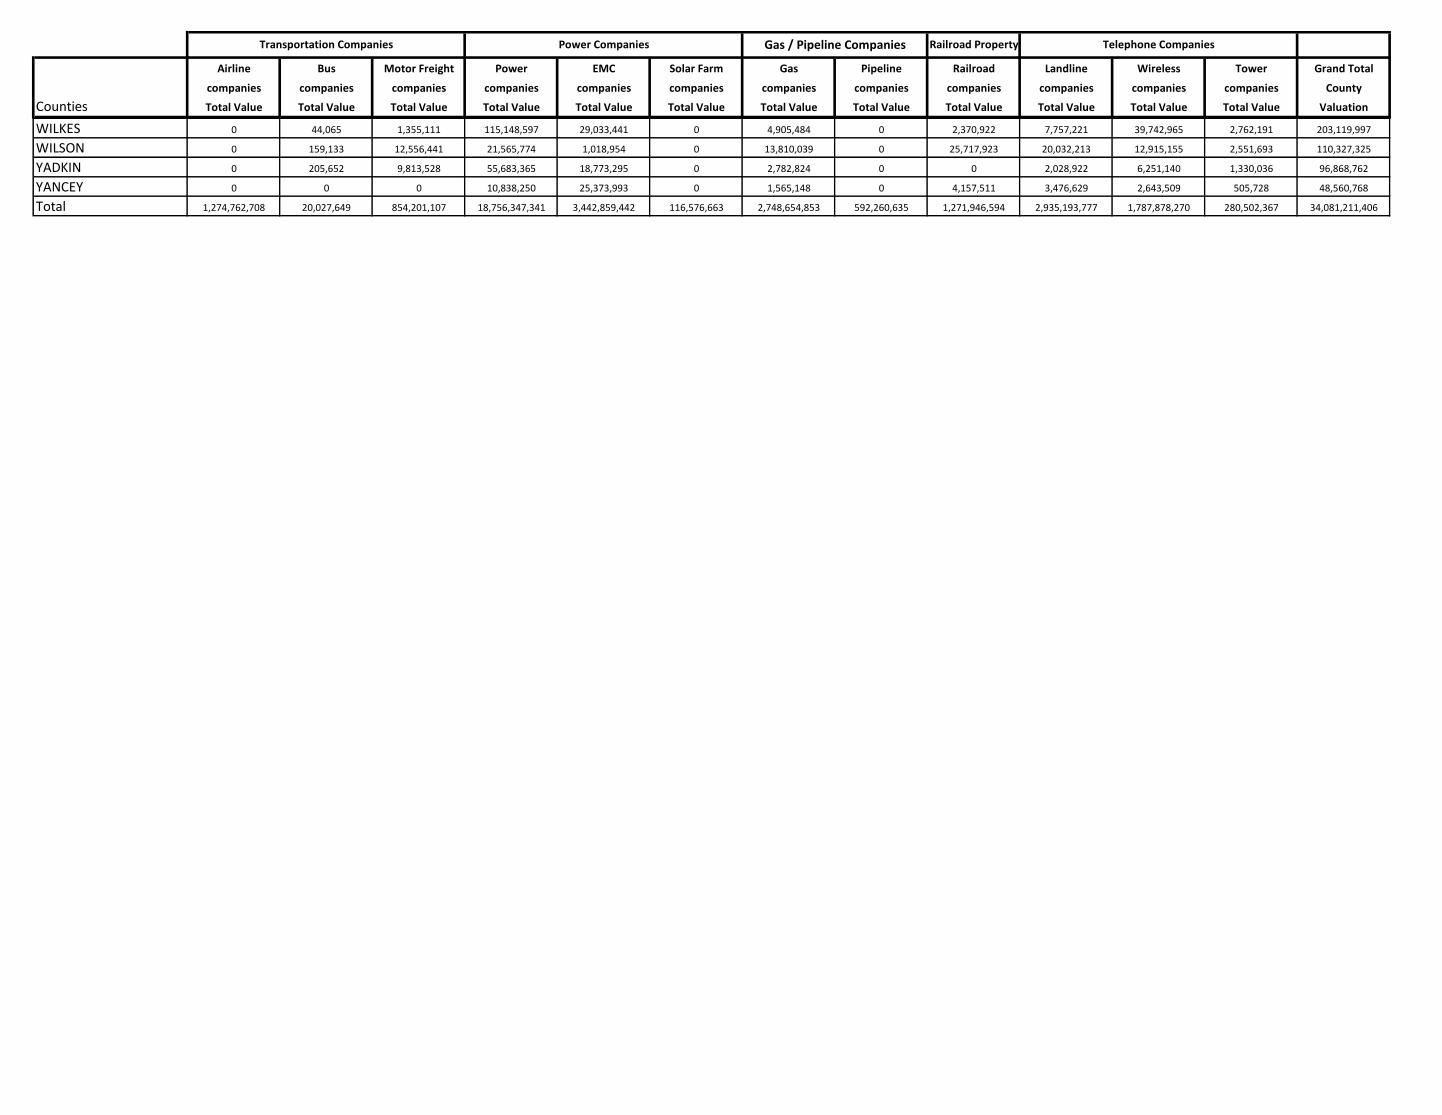
Airline Bus Motor Freight Power EMC Solar Farm Gas Pipeline Railroad Landline Wireless Tower Grand Total
companies companies companies companies companies companies companies companies companies companies companies companies County
Counties Total Value Total Value Total Value Total Value Total Value Total Value Total Value Total Value Total Value Total Value Total Value Total Value Valuation
Transportation Companies Power Companies Gas / Pipeline Companies Railroad Property Telephone Companies
WILKES 0 44,065 1,355,111 115,148,597 29,033,441 0 4,905,484 0 2,370,922 7,757,221 39,742,965 2,762,191 203,119,997
WILSON 0 159,133 12,556,441 21,565,774 1,018,954 0 13,810,039 0 25,717,923 20,032,213 12,915,155 2,551,693 110,327,325
YADKIN 0 205,652 9,813,528 55,683,365 18,773,295 0 2,782,824 0 0 2,028,922 6,251,140 1,330,036 96,868,762
YANCEY 0 0 0 10,838,250 25,373,993 0 1,565,148 0 4,157,511 3,476,629 2,643,509 505,728 48,560,768
Total 1,274,762,708 20,027,649 854,201,107 18,756,347,341 3,442,859,442 116,576,663 2,748,654,853 592,260,635 1,271,946,594 2,935,193,777 1,787,878,270 280,502,367 34,081,211,406