Embed Size (px)
Citation preview

Evaluation of Impact Damage Resistance of Two Types of Commercial Housing Siding
Duane M. Revilock, M.Sc., Aerospace Engineer Charles R. Ruggeri, M.Sc., Aerospace Engineer
J. Michael Pereira, Ph.D., Aerospace Research Engineer
National Aeronautics and Space Administration Glenn Research Center
Ballistic Impact Laboratory
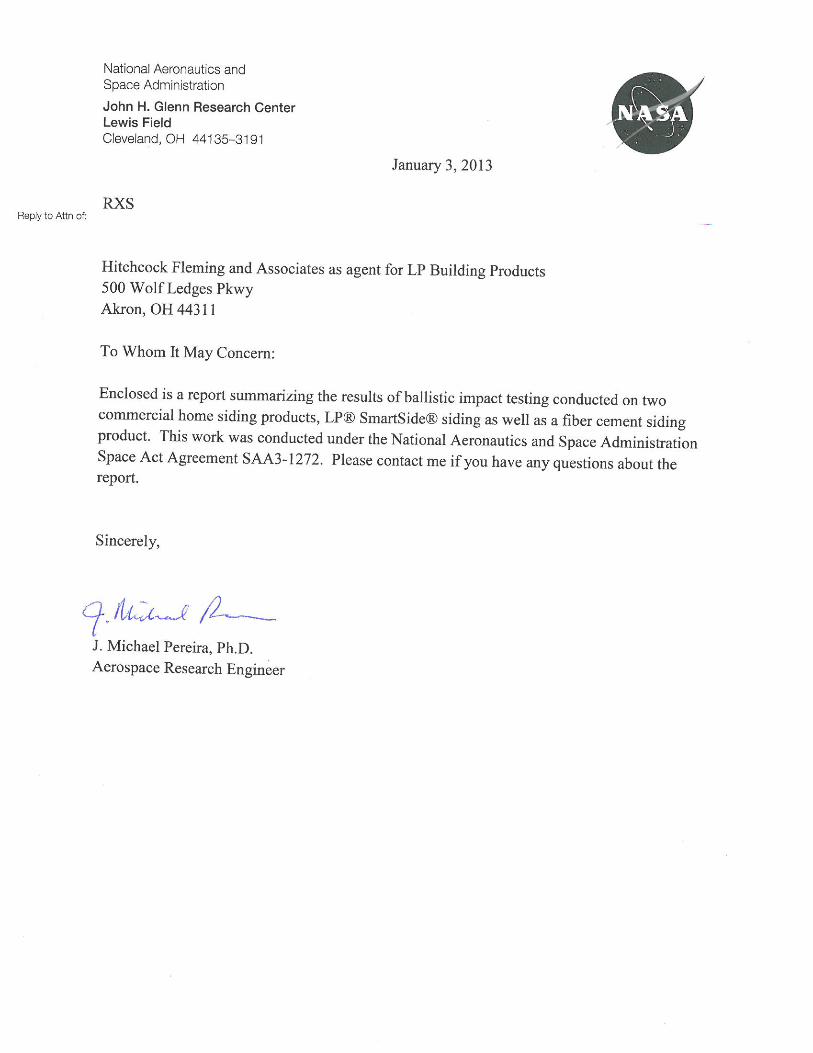
Dec. 21, 2012 Introduction Under Reimbursable Space Act Agreement 1272 between Hitchcock, Fleming and Assoc., Inc. (HFA) and the National Aeronautics and Space Administration Glenn Research Center, the impact damage resistance of two commercial housing siding products was evaluated by impacting the siding with a number of items that could be considered potential impact threats. These include golf balls and baseballs, which could accidentally hit the side of a house, as well as marbles and rocks which could be thrown from a lawnmower. The two products that were evaluated were an engineered wood siding product and a fiber cement siding product. The damage resistance was evaluated by shooting the four types of projectiles at the siding products, mounted in a typical installation configuration, using a single stage light gas gun. High speed digital cameras recorded the velocity of the projectile at impact and provided video for qualitative assessment of the impact event. Methods The two types of siding material were LP® SmartSide® engineered wood siding, designated LP, and a fiber cement siding product, designated FC. Test specimens were made up by mounting the siding on 0.5 inch thick by 18 inch by 18 inch OSB backing and attaching the backing to two 18 inch long pine wall studs as shown in figure 1. Three sections of siding were used for each test specimen, as can be seen in the figure, and the impact location was in the center of the middle section of siding. The four types of projectiles are shown in figure 2. These projectiles were smooth river rocks, golf balls, small marbles and baseballs. The rocks, golf balls and marbles were accelerated with a helium filled gas gun connected to a vacuum chamber, shown in figure 3. The gun barrel had a length of 12 feet and a bore of 2.0 inches. The pressure vessel was made up of sections as shown in figure 4, with a total volume of 681 in3. The projectile was carried down the gun barrel in a cylindrical polycarbonate sabot shown in figure 5. The gun barrel protruded into the vacuum chamber which held the fixture for the specimens. The sabot was stopped at the end of the gun barrel by a stopper plate with a through-hole large enough to allow the projectile to pass through. This stopper system was designed such that the bottom of the sabot, including the o-

rings, remained in the gun barrel and formed a seal which prevented the gas pressure behind the sabot from affecting the pressure in the vacuum chamber. The baseballs used a similar configuration, but the gun barrel had a bore of 3.0 inches and no sabot or stopper plate was used. Single projectiles were used for the rock, baseball and golf ball projectiles. For the marbles, seven projectiles were shot at once.
Figure 1. Test specimen made up of three sections of siding fastened to OSB backing plate and wall studs on 16 inch centers (wall studs not visible in photo).

Figure 2. Projectiles used in impact tests
Figure 3. Large vacuum gun (shown with 3 inch diameter gun barrel)

Figure 4. Pressure vessel
Figure 5. Typical polycarbonate sabots used for impact testing in the 2” bore gun. Sabot in center shows typical post-test geometry.

Two cameras were located at the side of the vacuum chamber looking through viewing ports. A third camera was aimed at the front of the specimen from beside the gun barrel. One side camera was used to measure the speed of the projectile. It was aimed in a direction perpendicular to the direction of projectile travel and was calibrated so that a given number of pixels corresponded to a known distance. This camera recorded images at 2500 frames/sec. The second side camera was oriented to view any damage that occurred on the edge of the specimen. This camera recorded images at 1700 frames/sec. The front camera viewed the impact and any visible damage on the front of the specimen. This recorded images at either 5400 or 6000 frames/sec depending on the test. Results A total of 40 impact tests were conducted, but a significant number were to calibrate the gas gun for the velocity range used for this study, which is lower than the gun was designed for. The pertinent tests are summarized in table 1. To help quantify the differences in impact damage resistance, damage in the two siding materials in tests involving the same projectile and similar impact conditions was further quantified by conducting high resolution laser scans of the impacted surface. The scans give a quantitative measure of the surface topography compared to a datum located near the front surface plane. For the river rock projectile, tests LVG712 and LVG714 were compared. The impact velocities were 110.5 mph for the FC siding sample and 107.7 mph for the LP siding sample. Figure 6 shows the surface topography after impact. The scale on the right shows the deformation measured in mm from the datum.

Figure 6. Surface topology from FC (left) and LP (right) panels from tests LVG712 and LVG714
The FC sample sustained a relatively deep dent on the front of the panel with a depth of 4 to 5 mm. The LP panel sustained a small dent with a depth of approximately 1 mm. For the golf ball projectile the surface scans from tests LVG719 and LVG718 were compared. The impact velocities were 49.4 mph for the EC siding sample and 63.8 mph for the LP siding sample. Figure 7 shows the surface topology after impact. There was essentially no damage in the LP siding sample, but the FC siding sample sustained a hole and significant spalling on the back side despite a lower impact velocity.
Figure 7. Surface topology from FC (left) and LP (right) panels from tests LVG719 and LVG718 For the marble projectiles surface scans from tests LVG720 and LVG723 were compared. The impact velocities were 120.8 mph for the FC siding sample and 114.5 mph for the LP siding sample. Figure 8 shows the surface topology after impact. There was significant front and backside damage to the FC sample. The LP sample had slight front side damage with some cracking of the paint. No significant structural damage was evident in the LP sample.

Figure 8. Surface topology from FC (left) and LP (right) panels from tests LVG720 and LVG723 For the baseball projectile, surface scans were not conducted due to the extensive damage to the FC siding samples. Tests LVG733 and LVG731 were compared visually. The impact velocities were 72.8 mph for the FC siding sample and 77.7 mph for the LP siding sample. Photographs of the impacted panels are shown in figures 9 and 10. The FC siding sample sustained a large hole and backside spalling. There was no visual evidence of damage in the LP siding sample.
Figure 9. Posttest front (left) and rear (right) photos of FC panel impacted by a baseball in test LVG733

Figure 10. Posttest front (left) and rear (right) photos of LP panel impacted by a baseball in test LVG731
For all four projectiles the FC siding samples sustained more damage under similar impact conditions. Summary Impact tests were conducted on two commercial siding products, an engineered wood product and a fiber cement product, to evaluate the damage resistance to impacts by four items that could potentially hit the side of a building. The projectiles were a baseball, golf ball, river rock and marbles. The projectiles were impacted at speeds within the range of expected impact speeds. The siding products were supported in a configuration representative of a normal installation. Under similar conditions, with all four projectiles more damage was sustained by the fiber cement siding product than the engineered wood siding product.

Test Number Projectile
Siding Type
Projectile Mass (gm)
Projectile Velocity (mph)
Projectile KE (J) Comments
LVG709 River Rock LP 15.3 158.4 38.4 Dent on front, backside damage. Same panel as LVG708.
LVG710 River Rock FC 15.19 85.3 11.0 Dent on front, fractured and deformed surface on back
LVG711 River Rock FC 15.19 91.8 12.8 Dent on front, fractured and deformed surface on back
LVG712 River Rock FC 15.19 110.5 18.5 Dent on front, fractured and deformed surface on back
LVG713 River Rock LP 15.19 128.5 25.1 Dent on front, slight outward deformation on back
LVG714 River Rock LP 15.19 107.7 17.6 Small dent on front
LVG715 Golf Ball LP 44.75 88.7 35.2 Dent on front, paint cracked. Minor delamination on back LVG716 Golf Ball LP 44.71 36 5.8 Projectile missed impact point. No visible damage. LVG717 Golf Ball LP 44.71 40.3 7.3 No visible damage. Same panel as LVG716 LVG718 Golf Ball LP 44.7 63.8 18.2 No visible damage LVG719 Golf Ball FC 44.82 49.4 10.9 Dent on front. Through hole and spalling on back side LVG720 Marbles* FC 18.56 120.8 27.1 Multiple dents on front. Back side fractured LVG721 Marbles* LP 18.58 95.3 16.9 Barely visible damage on front LVG722 Marbles* LP 18.58 113.8 24.0 Barely visible damage on front LVG723 Marbles* LP 18.5 114.5 24.2 Small barely visible dents on front LVG724 Marbles* LP 18.5 110.9 22.7 Small barely visible dents on front LVG727 Baseball LP 142.86 102.6 150.3 Slight dent on front with paint crack. Crack on back LVG728 Baseball LP 140.53 54.1 41.1 No visible damage LVG729 Baseball LP 140.53 53.3 39.9 No visible damage LVG730 Baseball LP 142.94 86.1 105.9 Cracks in paint and slight indentation on front. Slight damage on back LVG731 Baseball LP 142.94 77.7 86.2 No visible damage LVG732 Baseball FC 142.94 86.9 107.8 Large hole. Corners cracked at fasteners LVG733 Baseball FC 142.89 72.8 75.7 Large hole. Crack at one fastener LVG734 Baseball FC 142.86 51.9 38.4 Small crack front and back side LVG735 Baseball FC 142.87 113.5 183.9 Large hole. Failure in OSB backing.

* Seven marbles were shot at one time. Given mass is the sum of the masses of the seven marbles.
Table 1. Impact Test Summary