Embed Size (px)
Citation preview
Dual values for biodiversity conservationin agricultural landscapes
Tadashi Miyashita & Masaru Tsutsui(University of Tokyo)
OutlineStaffMembersContactThesis
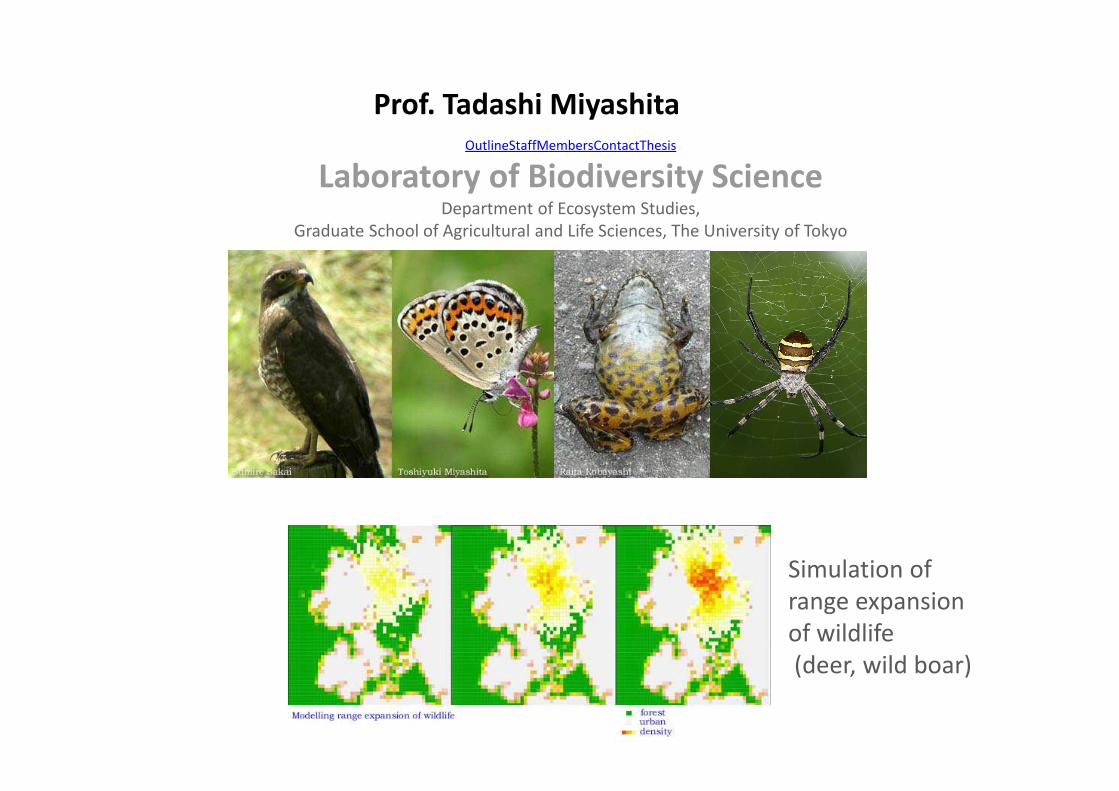
Laboratory of Biodiversity ScienceDepartment of Ecosystem Studies,
Graduate School of Agricultural and Life Sciences, The University of Tokyo
Simulation of range expansionof wildlife(deer, wild boar)
Prof. Tadashi Miyashita
https://www.google.co.jp/search?q=トキ写真&rlz
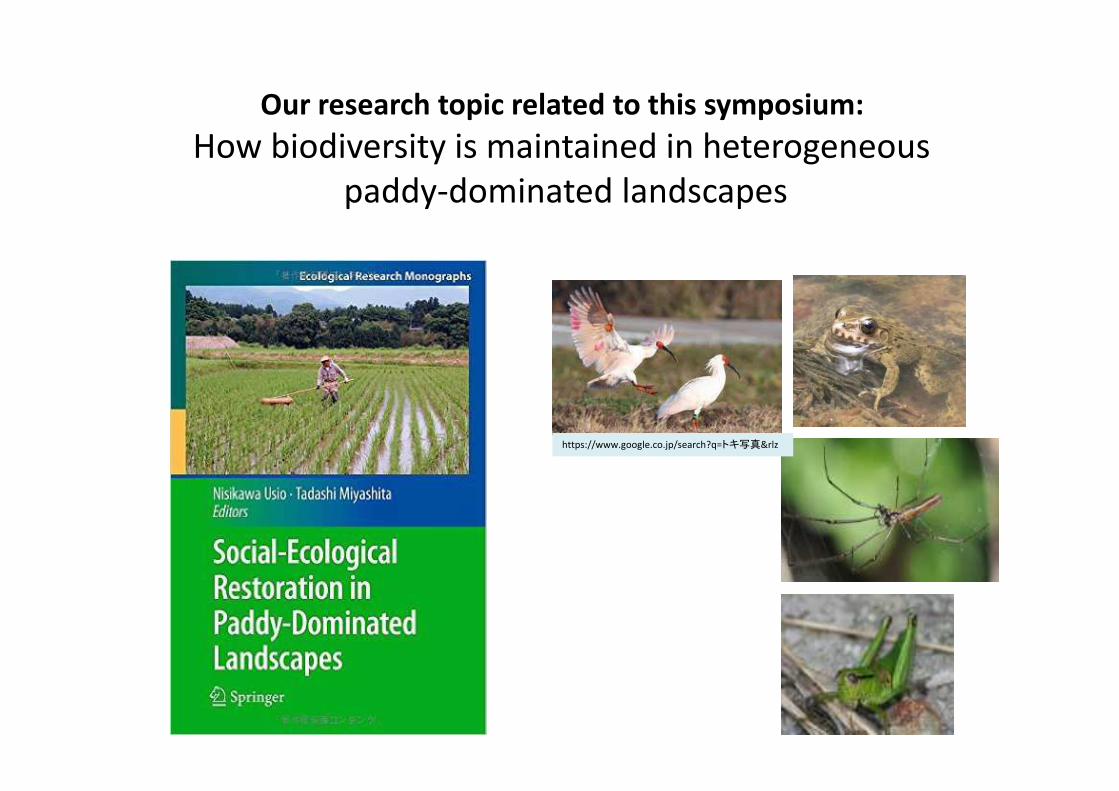
Our research topic related to this symposium:
How biodiversity is maintained in heterogeneous paddy-dominated landscapes
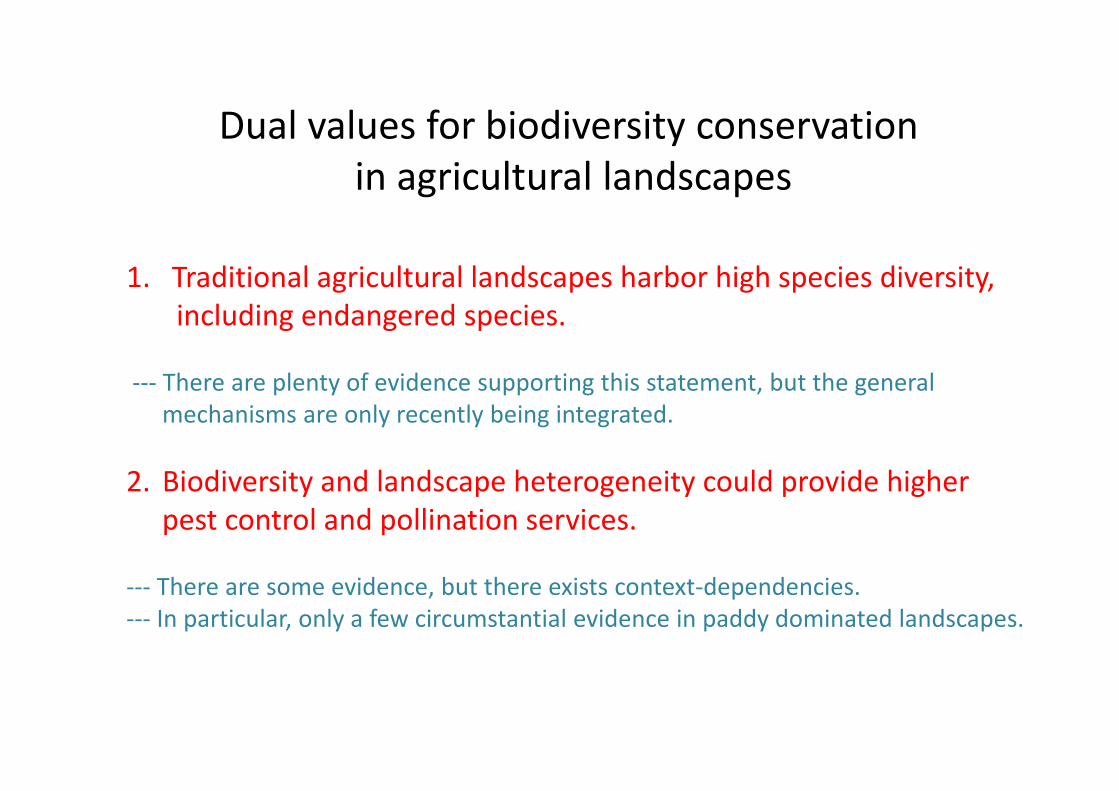
Dual values for biodiversity conservationin agricultural landscapes
1. Traditional agricultural landscapes harbor high species diversity, including endangered species.
--- There are plenty of evidence supporting this statement, but the general mechanisms are only recently being integrated.
2. Biodiversity and landscape heterogeneity could provide higherpest control and pollination services.
--- There are some evidence, but there exists context-dependencies.--- In particular, only a few circumstantial evidence in paddy dominated landscapes.
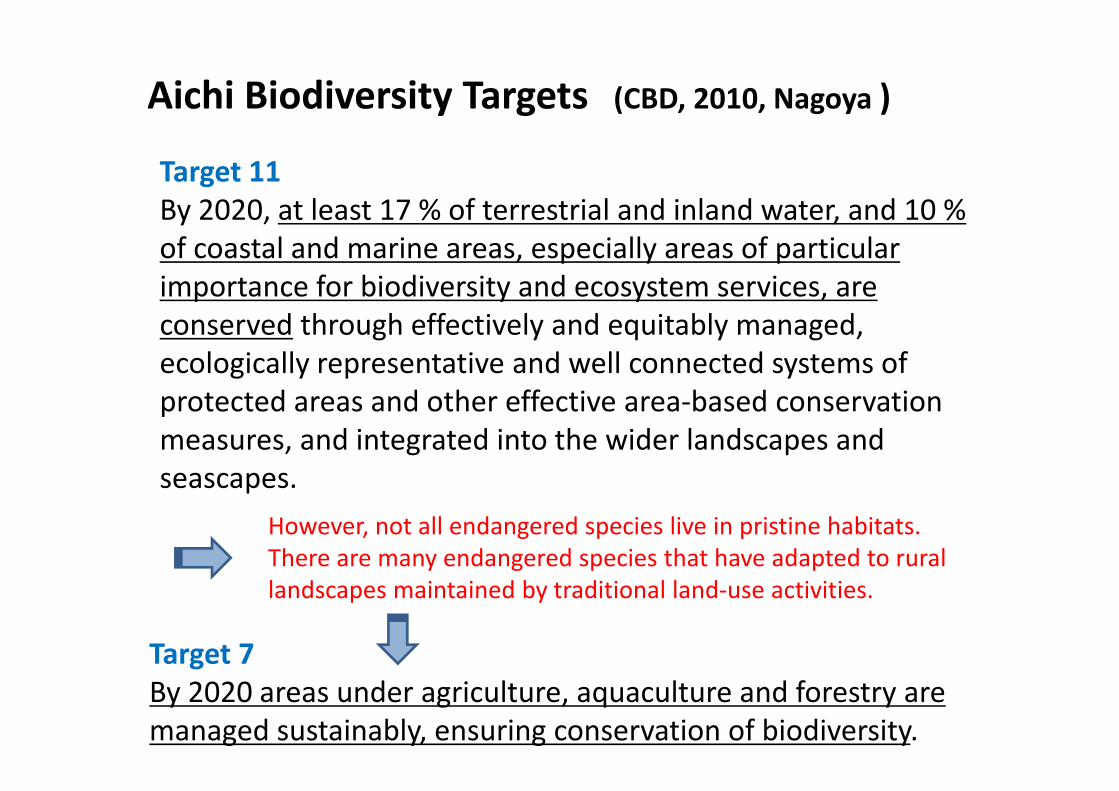
Target 11
By 2020, at least 17 % of terrestrial and inland water, and 10 % of coastal and marine areas, especially areas of particular importance for biodiversity and ecosystem services, are conserved through effectively and equitably managed, ecologically representative and well connected systems of protected areas and other effective area-based conservation measures, and integrated into the wider landscapes and seascapes.
Aichi Biodiversity Targets (CBD, 2010, Nagoya )
However, not all endangered species live in pristine habitats.There are many endangered species that have adapted to rural landscapes maintained by traditional land-use activities.
Target 7
By 2020 areas under agriculture, aquaculture and forestry are managed sustainably, ensuring conservation of biodiversity.
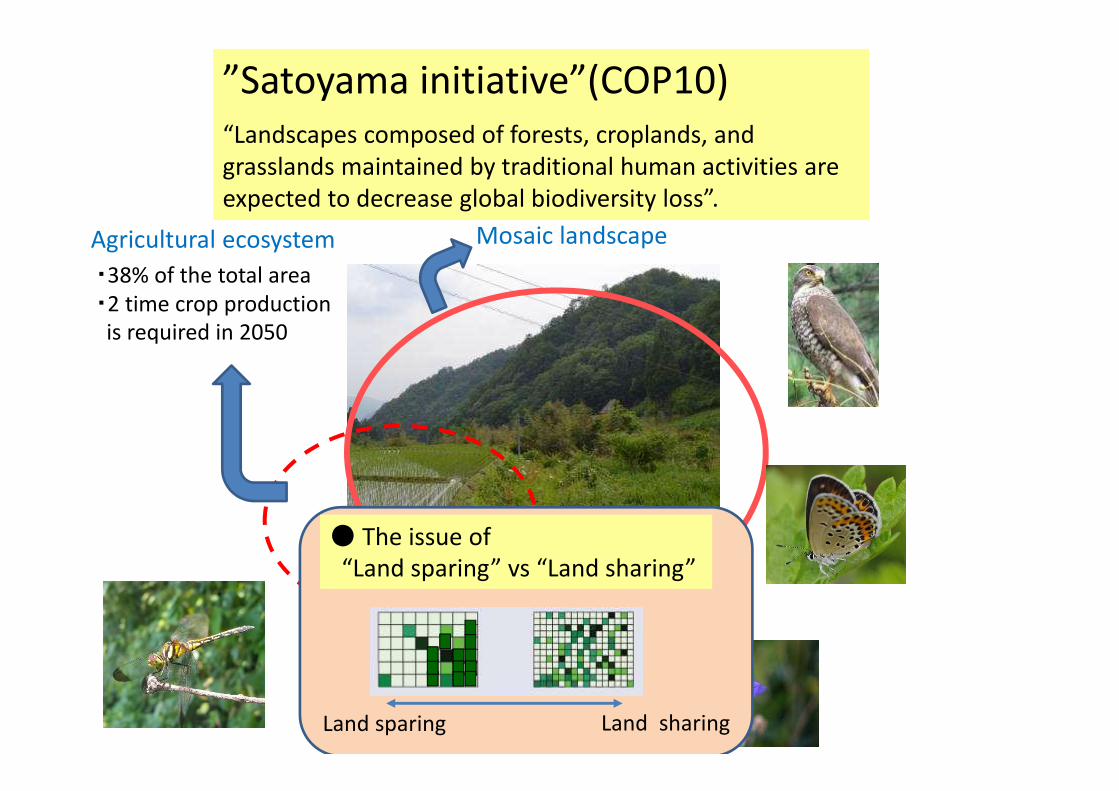
Agricultural ecosystem
Composite ecosystemsMosaic landscape
”Satoyama initiative”(COP10)“Landscapes composed of forests, croplands, and grasslands maintained by traditional human activities are expected to decrease global biodiversity loss”.
・38% of the total area・2 time crop production
is required in 2050
● The issue of “Land sparing” vs “Land sharing”
Land sparing Land sharing
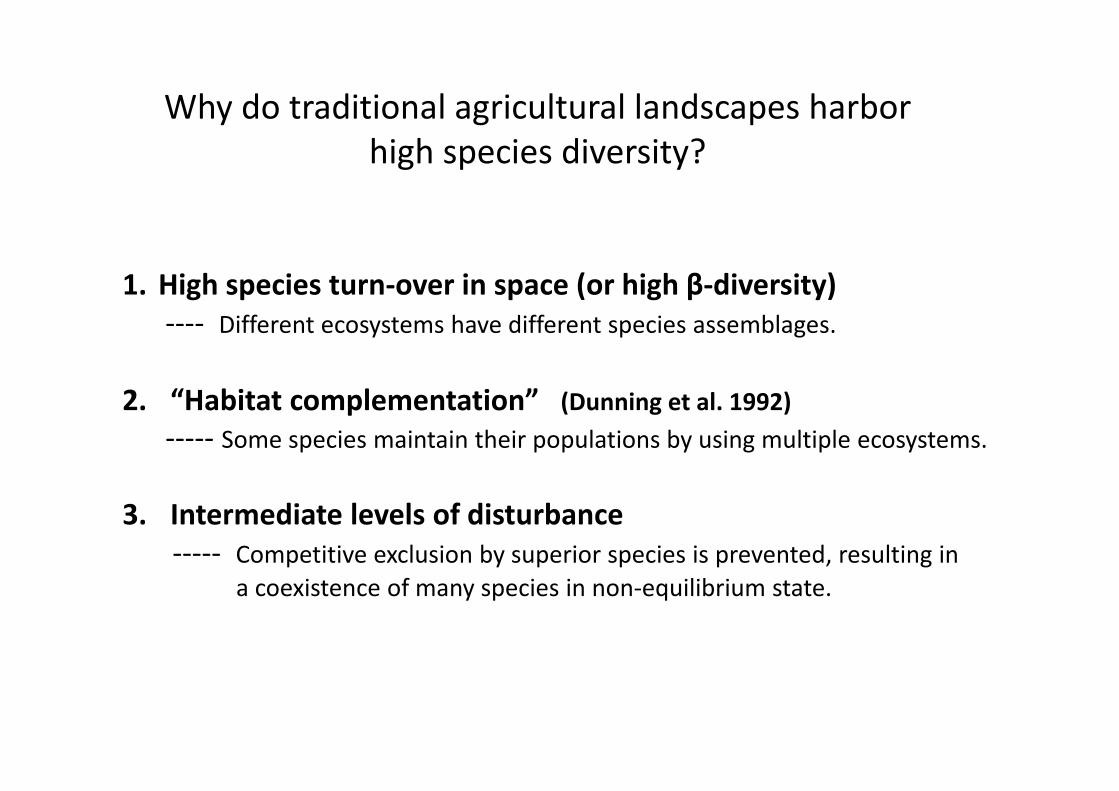
Why do traditional agricultural landscapes harborhigh species diversity?
1. High species turn-over in space (or high β-diversity)
---- Different ecosystems have different species assemblages.
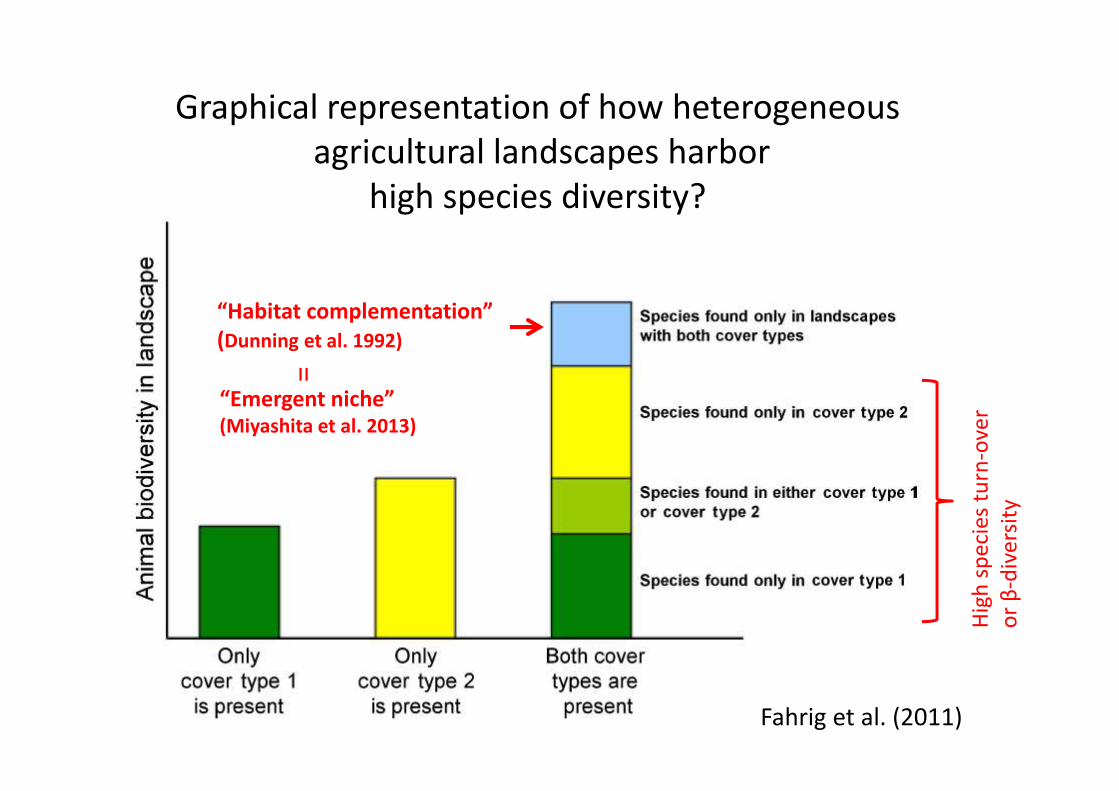
2. “Habitat complementation” (Dunning et al. 1992)
----- Some species maintain their populations by using multiple ecosystems.
3. Intermediate levels of disturbance
----- Competitive exclusion by superior species is prevented, resulting in
a coexistence of many species in non-equilibrium state.
“Habitat complementation”
(Dunning et al. 1992)
Graphical representation of how heterogeneousagricultural landscapes harbor
high species diversity?
Hig
h s
pec
ies
turn
-ove
r o
r β
-div
ersi
ty
“Emergent niche”
(Miyashita et al. 2013)
=
Fahrig et al. (2011)
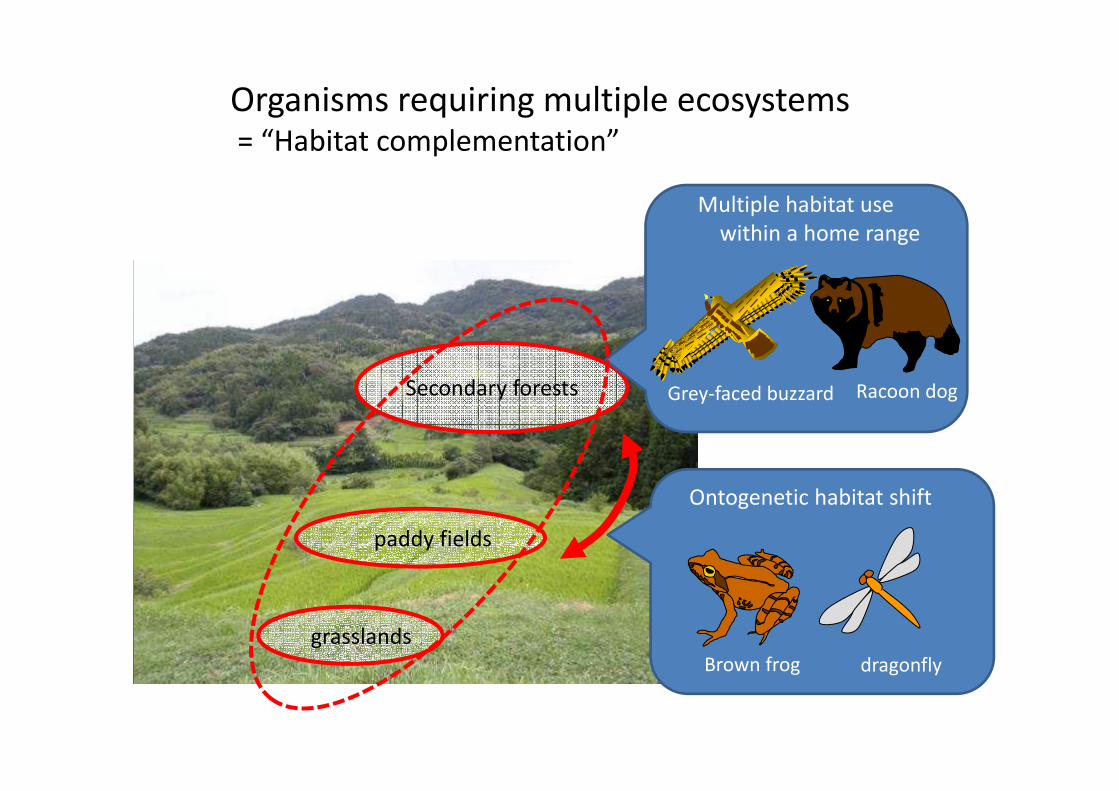
paddy fields
Secondary forests
grasslands
Grey-faced buzzard Racoon dog
Ontogenetic habitat shift
Brown frog dragonfly
Multiple habitat use within a home range
Organisms requiring multiple ecosystems = “Habitat complementation”
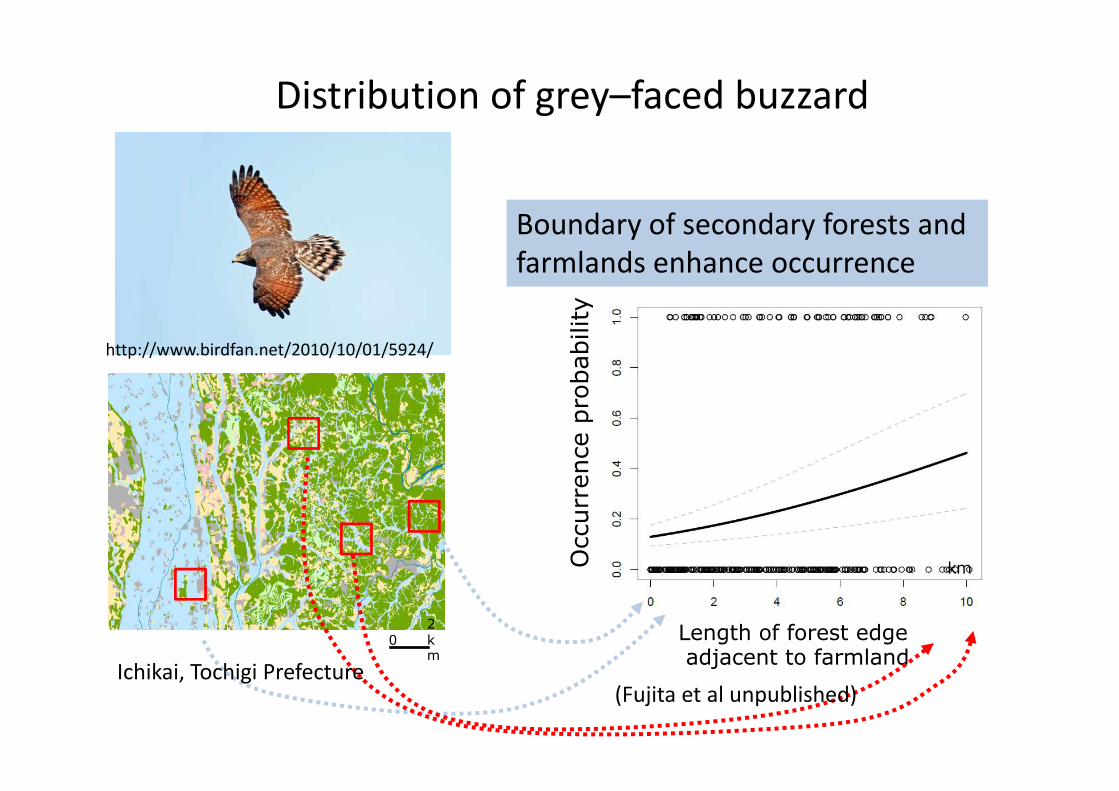
Occurr
ence p
robability
Length of forest edgeadjacent to farmland
km
2km
0
http://www.birdfan.net/2010/10/01/5924/
Distribution of grey–faced buzzard
Boundary of secondary forests and farmlands enhance occurrence
(Fujita et al unpublished)Ichikai, Tochigi Prefecture
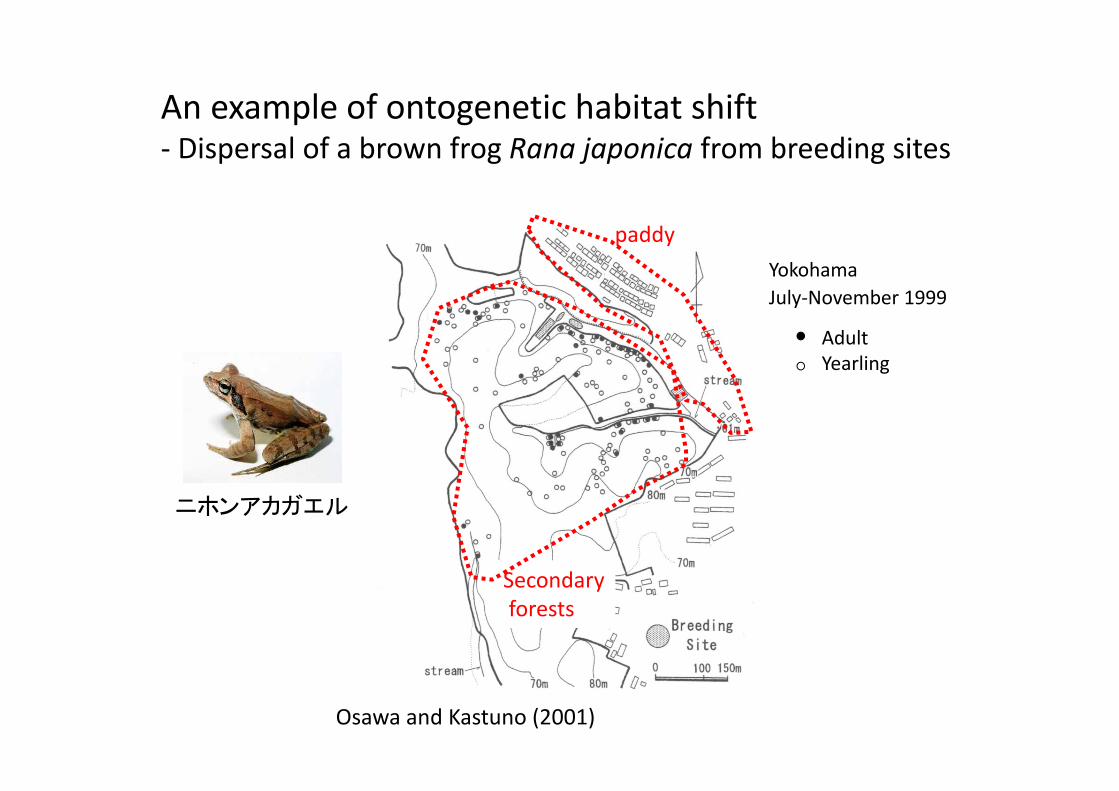
An example of ontogenetic habitat shift- Dispersal of a brown frog Rana japonica from breeding sites
July-November 1999
Osawa and Kastuno (2001)
AdultYearling
Yokohama
ニホンアカガエル
paddy
Secondaryforests
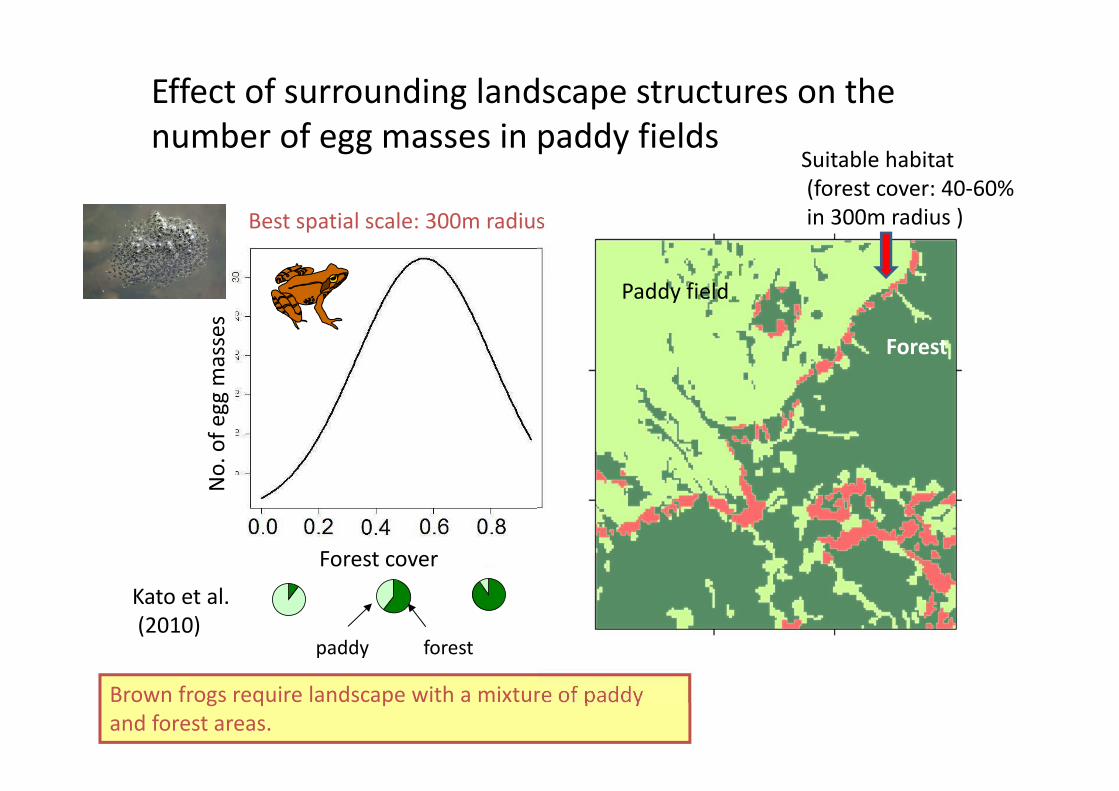
Forest cover
No
. of
egg
mas
ses
Effect of surrounding landscape structures on the number of egg masses in paddy fields
Best spatial scale: 300m radius
Brown frogs require landscape with a mixture of paddy and forest areas.
forestpaddy
Kato et al.(2010)
Forest cover
Forest
Paddy field
Suitable habitat(forest cover: 40-60%in 300m radius )
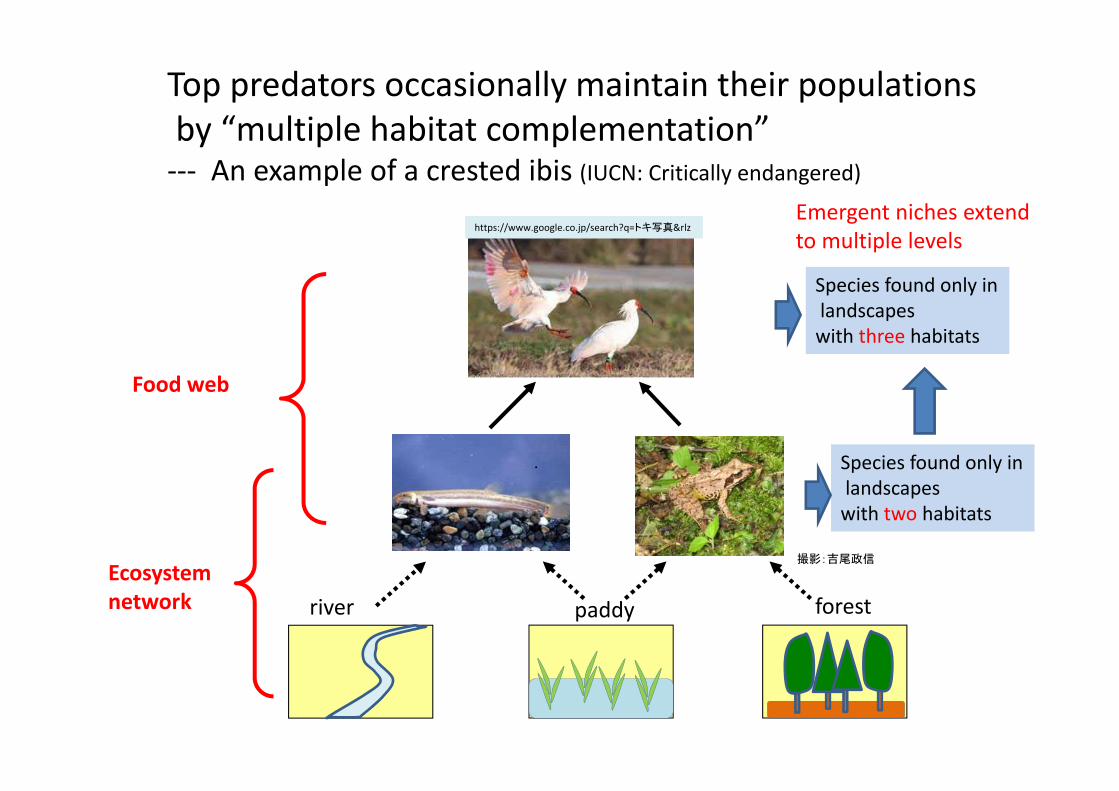
Ecosystem
network
Food web
Top predators occasionally maintain their populationsby “multiple habitat complementation”
--- An example of a crested ibis (IUCN: Critically endangered)
https://www.google.co.jp/search?q=トキ写真&rlz
river paddy forest
撮影:吉尾政信
Species found only inlandscapeswith three habitats
Species found only inlandscapeswith two habitats
Emergent niches extend to multiple levels
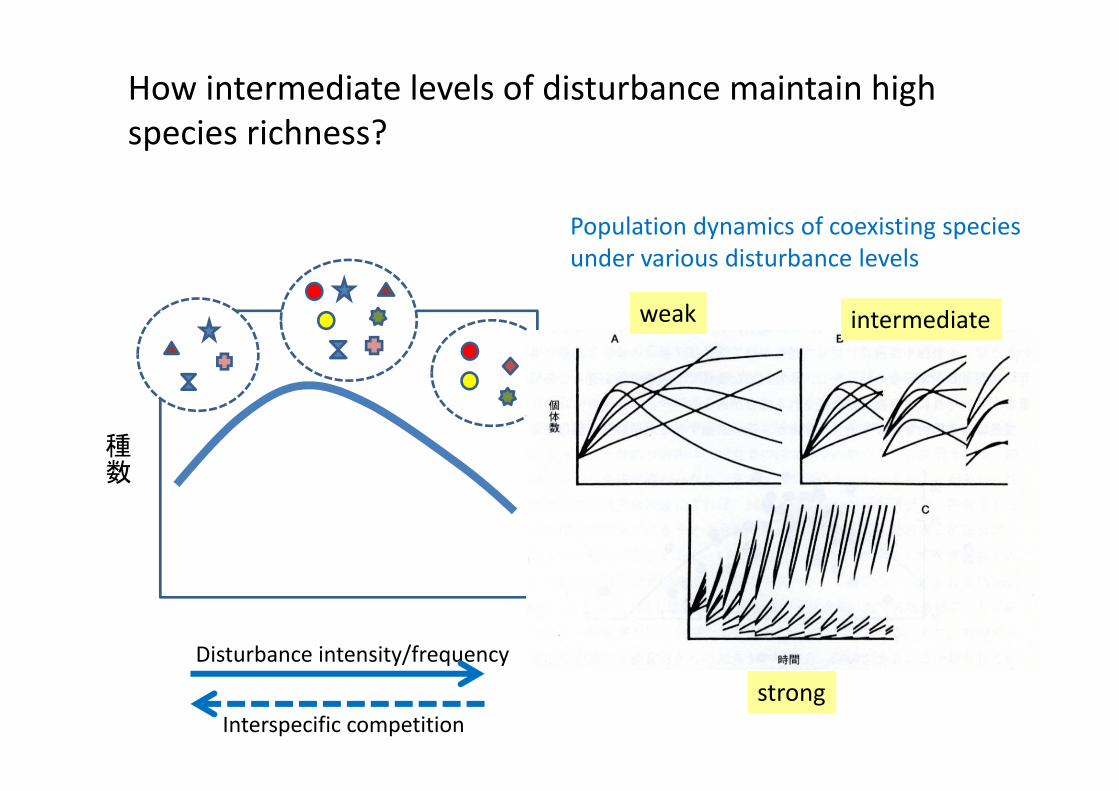
種数
Disturbance intensity/frequency
Interspecific competition
How intermediate levels of disturbance maintain high species richness?
weak intermediate
strong
Population dynamics of coexisting species under various disturbance levels
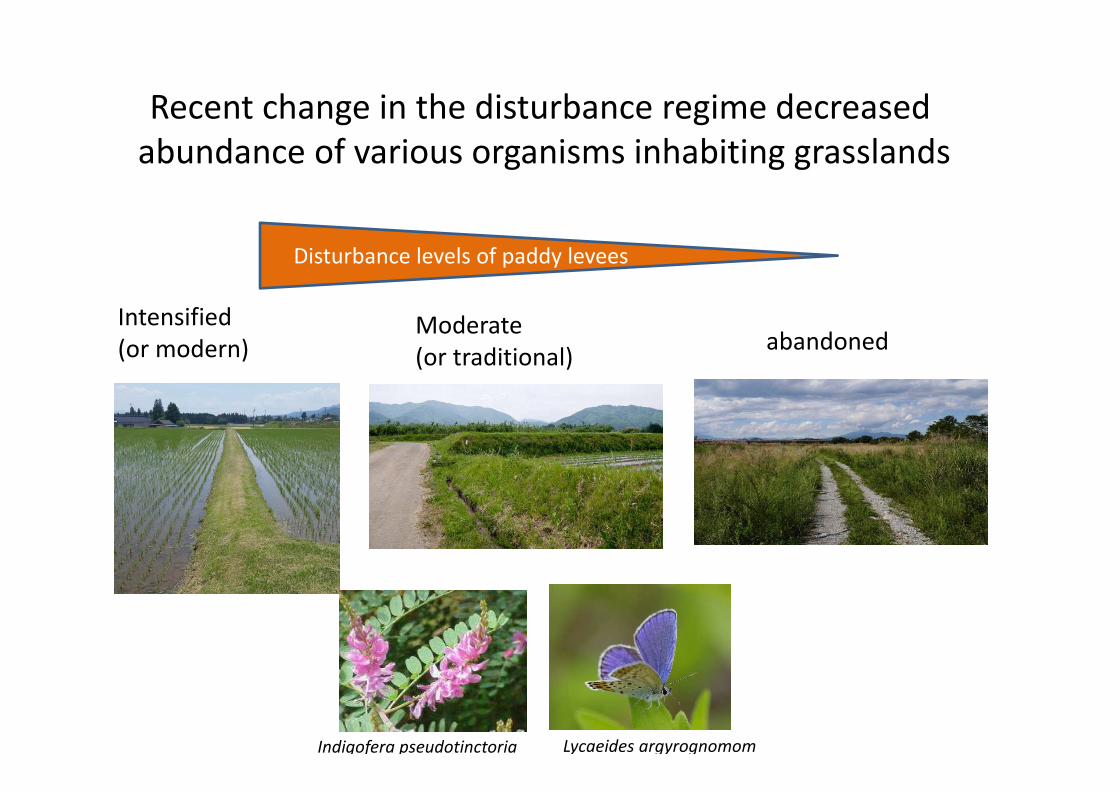
Recent change in the disturbance regime decreased abundance of various organisms inhabiting grasslands
abandonedIntensified (or modern)
Moderate (or traditional)
Disturbance levels of paddy levees
Lycaeides argyrognomomIndigofera pseudotinctoria
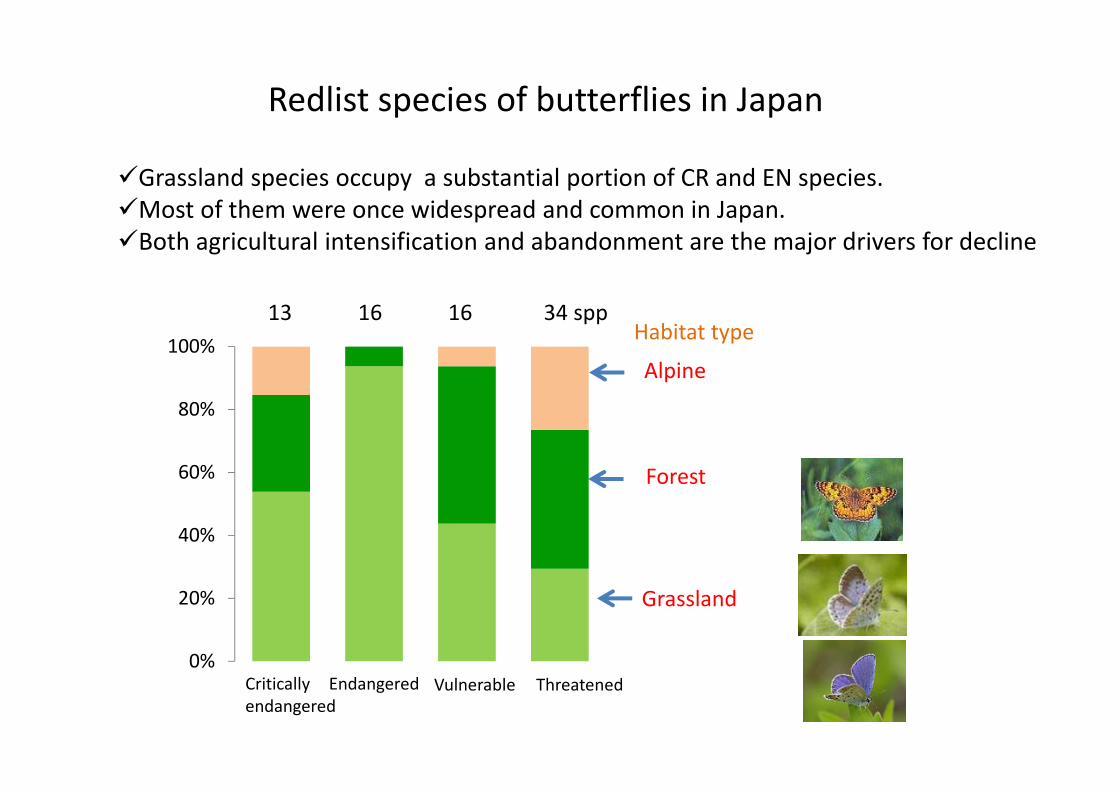
Redlist species of butterflies in Japan
Grassland
Forest
Alpine
13 16 16 34 sppHabitat type
�Grassland species occupy a substantial portion of CR and EN species. �Most of them were once widespread and common in Japan.�Both agricultural intensification and abandonment are the major drivers for decline
0%
20%
40%
60%
80%
100%
Critically endangered
Endangered Vulnerable Threatened
https://www.google.co.jp/search?q=トキ写真&rlz
https://ja-jp.facebook.com/kounotoribunkakan
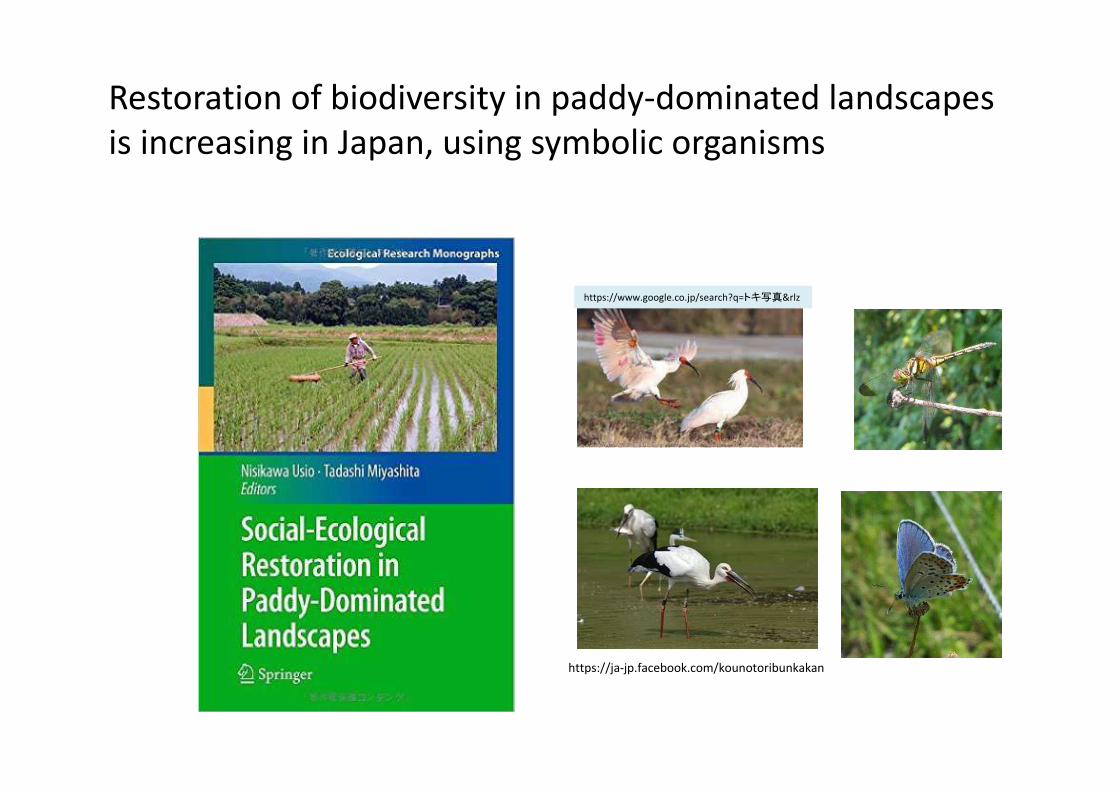
Restoration of biodiversity in paddy-dominated landscapesis increasing in Japan, using symbolic organisms
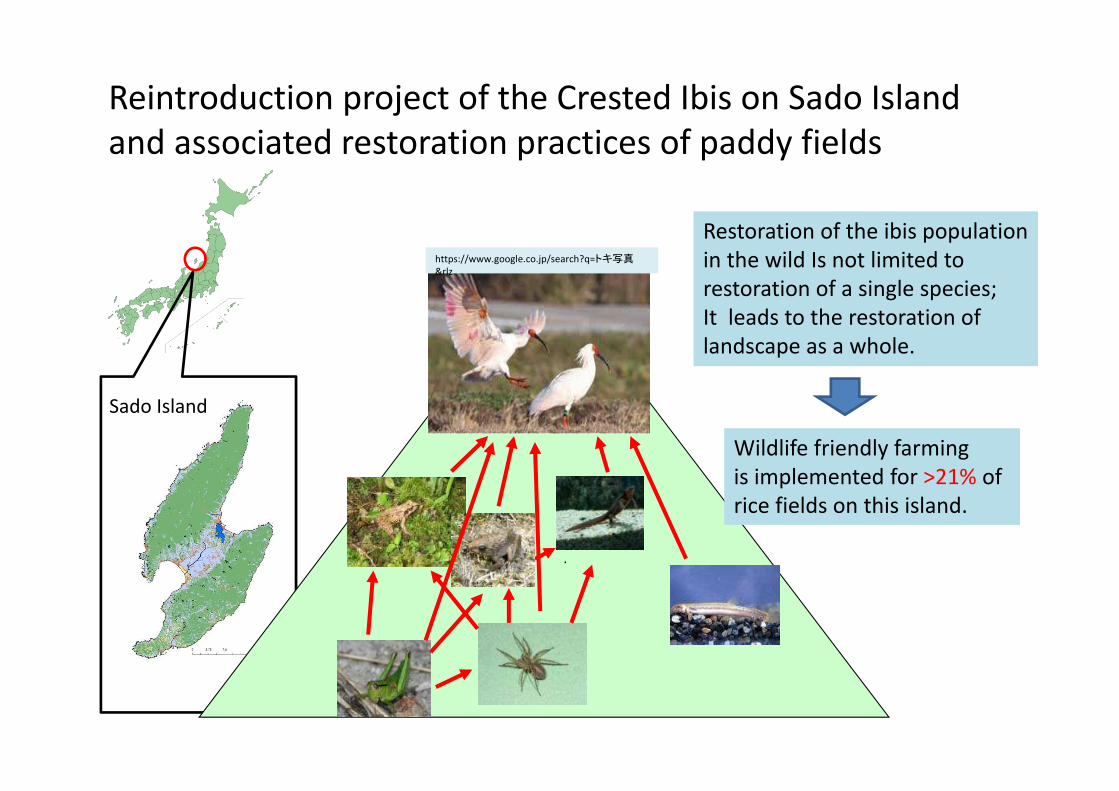
Reintroduction project of the Crested Ibis on Sado Islandand associated restoration practices of paddy fieldsus
Sado Island
https://www.google.co.jp/search?q=トキ写真&rlz
Restoration of the ibis population in the wild Is not limited to restoration of a single species;It leads to the restoration of landscape as a whole.
Wildlife friendly farmingis implemented for >21% of rice fields on this island.
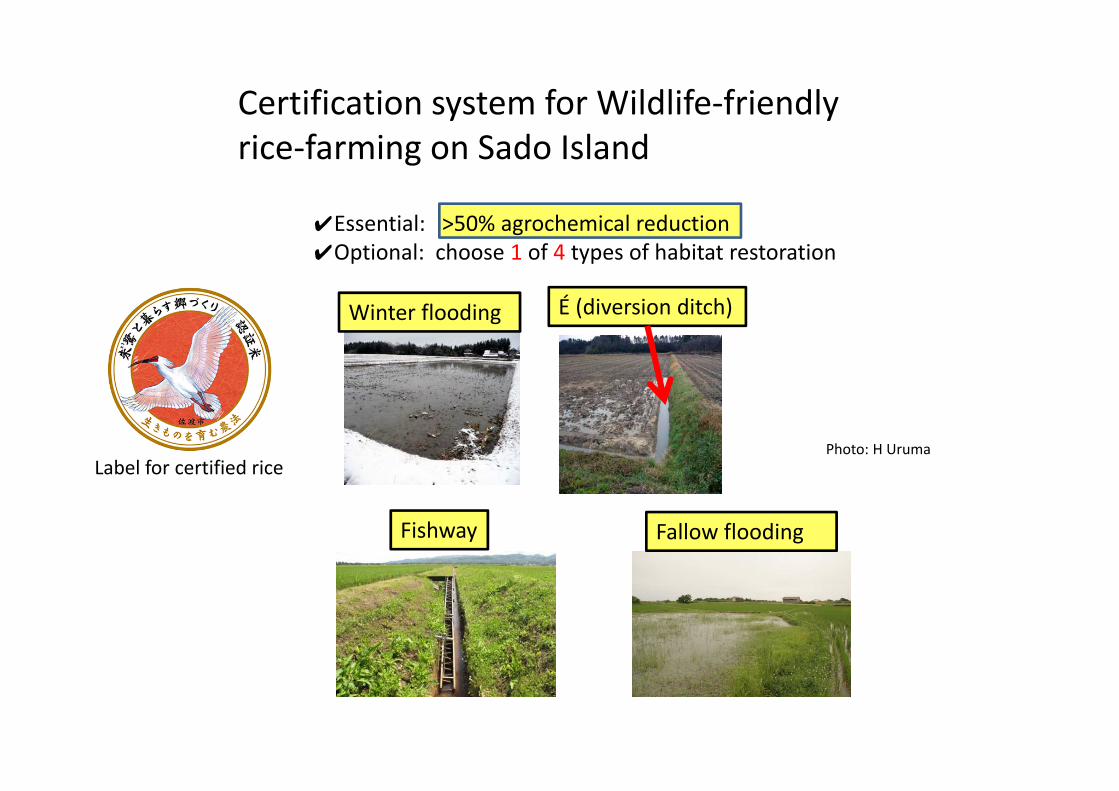
É (diversion ditch)Winter flooding
Label for certified rice
Certification system for Wildlife-friendly rice-farming on Sado Island
Fishway
✔Essential: >50% agrochemical reduction✔Optional: choose 1 of 4 types of habitat restoration
Photo: H Uruma
Fallow flooding
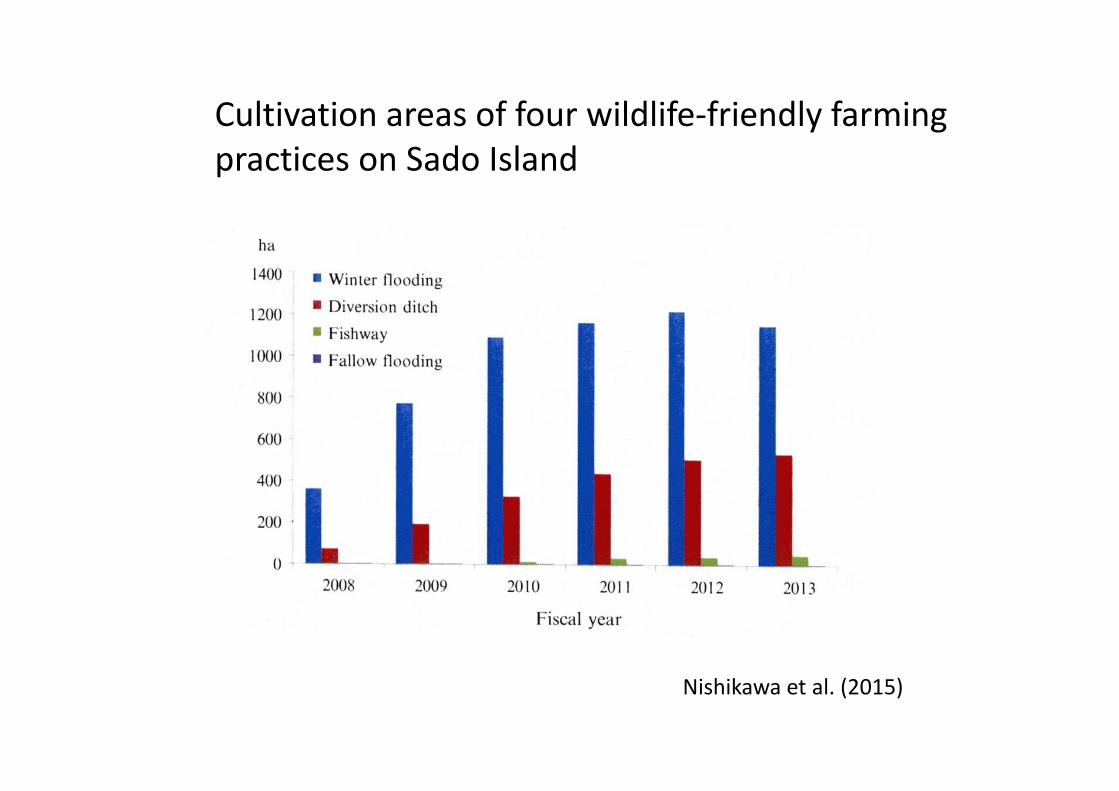
Nishikawa et al. (2015)
Cultivation areas of four wildlife-friendly farmingpractices on Sado Island
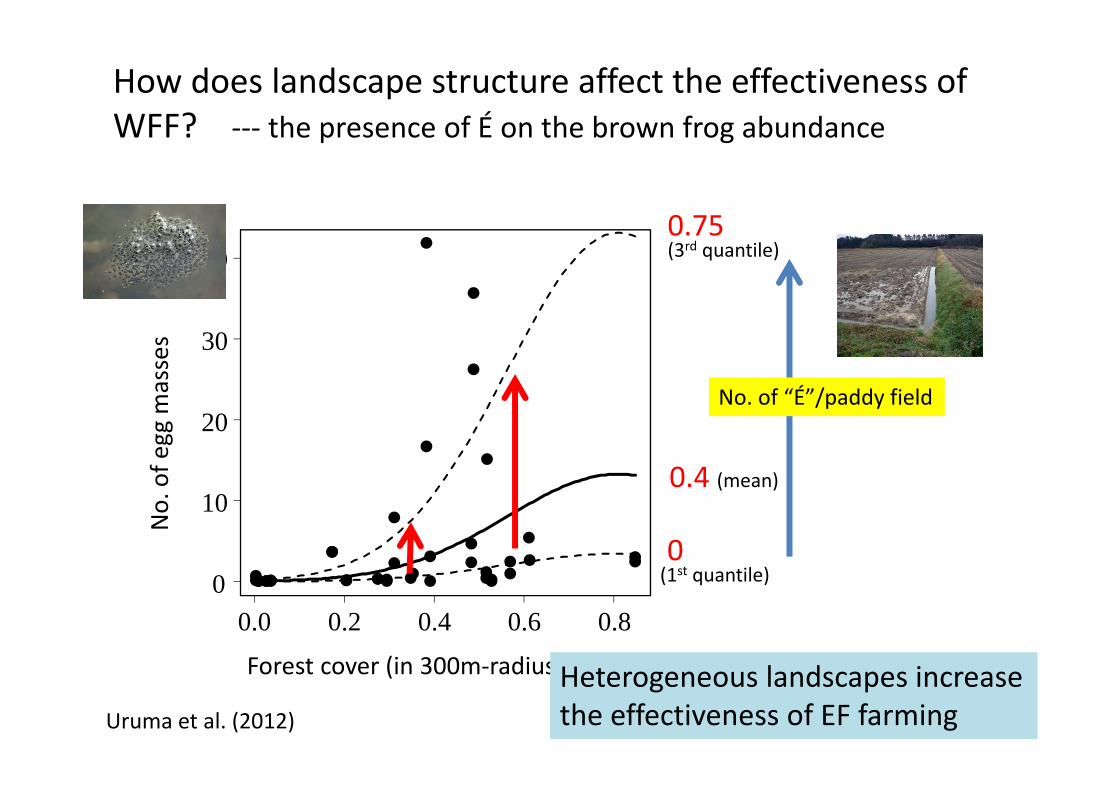
0.4
0
10
20
30
40
0.20.0 0.6 0.8
Forest cover (in 300m-radius)
No
. of
egg
mas
ses
0(1st quantile)
0.4 (mean)
0.75(3rd quantile)
Heterogeneous landscapes increasethe effectiveness of EF farmingUruma et al. (2012)
No. of “É”/paddy field
How does landscape structure affect the effectiveness of WFF? --- the presence of É on the brown frog abundance
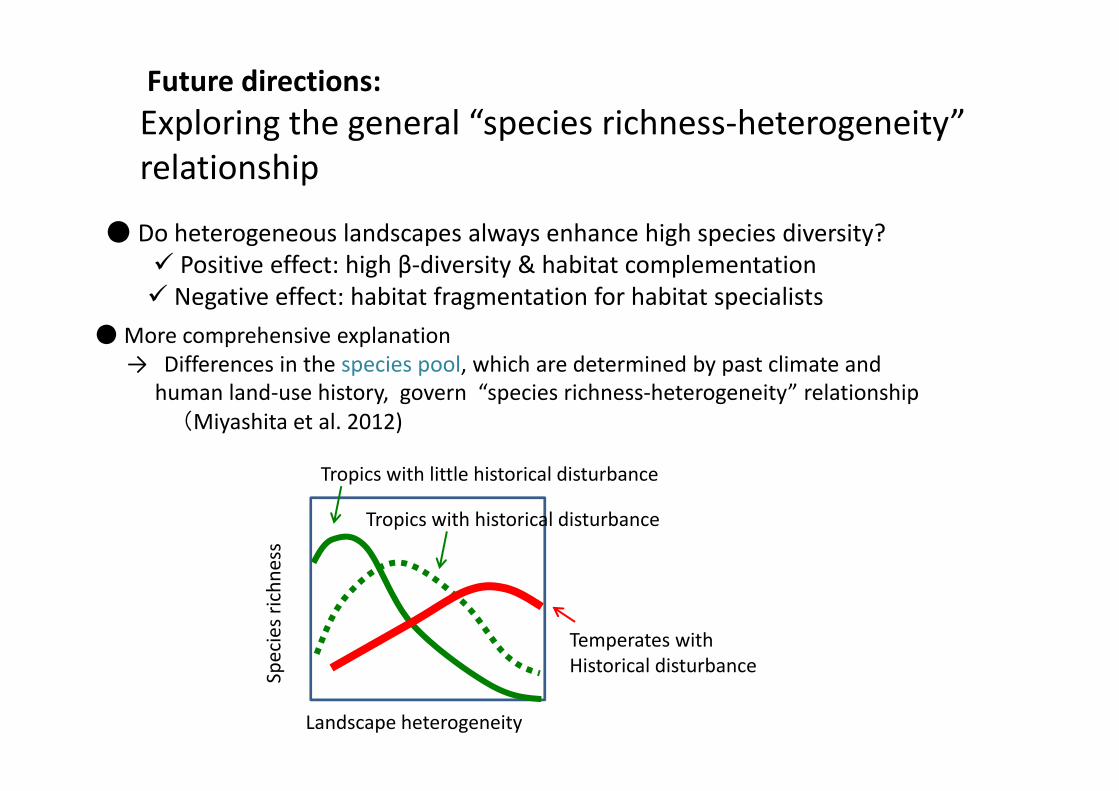
● Do heterogeneous landscapes always enhance high species diversity?� Positive effect: high β-diversity & habitat complementation� Negative effect: habitat fragmentation for habitat specialists
●More comprehensive explanation→ Differences in the species pool, which are determined by past climate and
human land-use history, govern “species richness-heterogeneity” relationship (Miyashita et al. 2012)
Tropics with little historical disturbance
Landscape heterogeneity
Spec
ies
rich
nes
s
Future directions:
Exploring the general “species richness-heterogeneity” relationship
Tropics with historical disturbance
Temperates with Historical disturbance
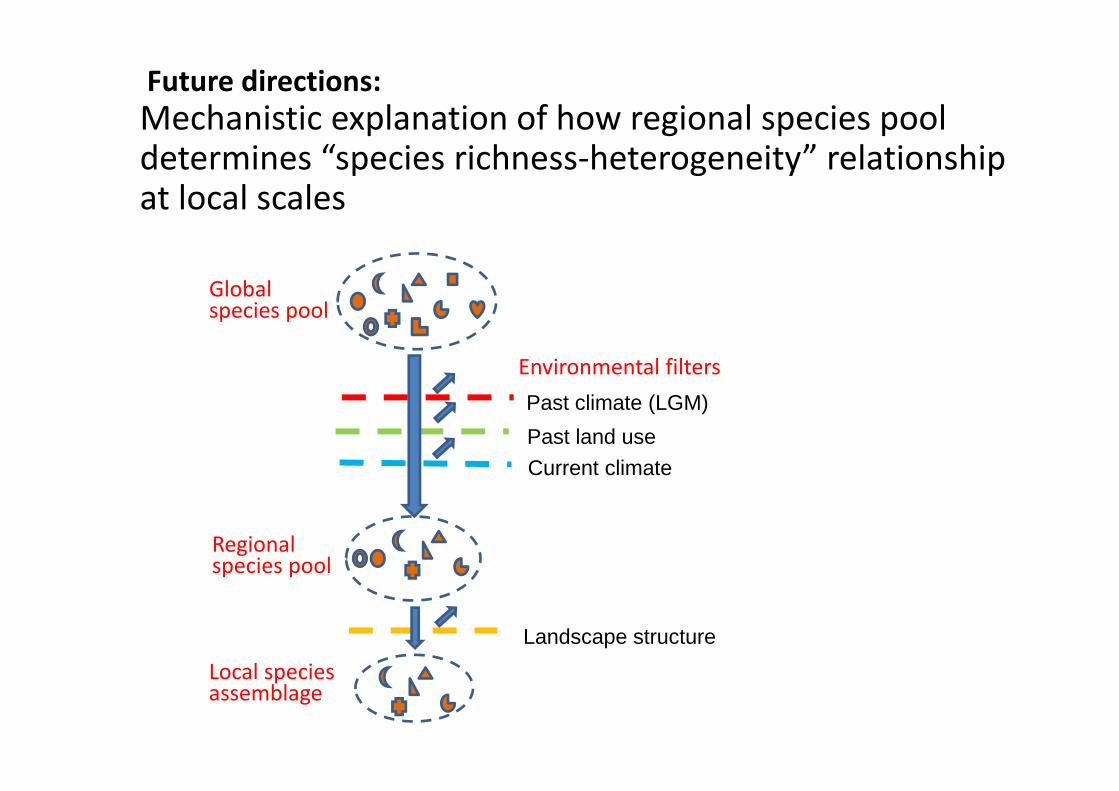
Past climate (LGM)
Past land use
Current climate
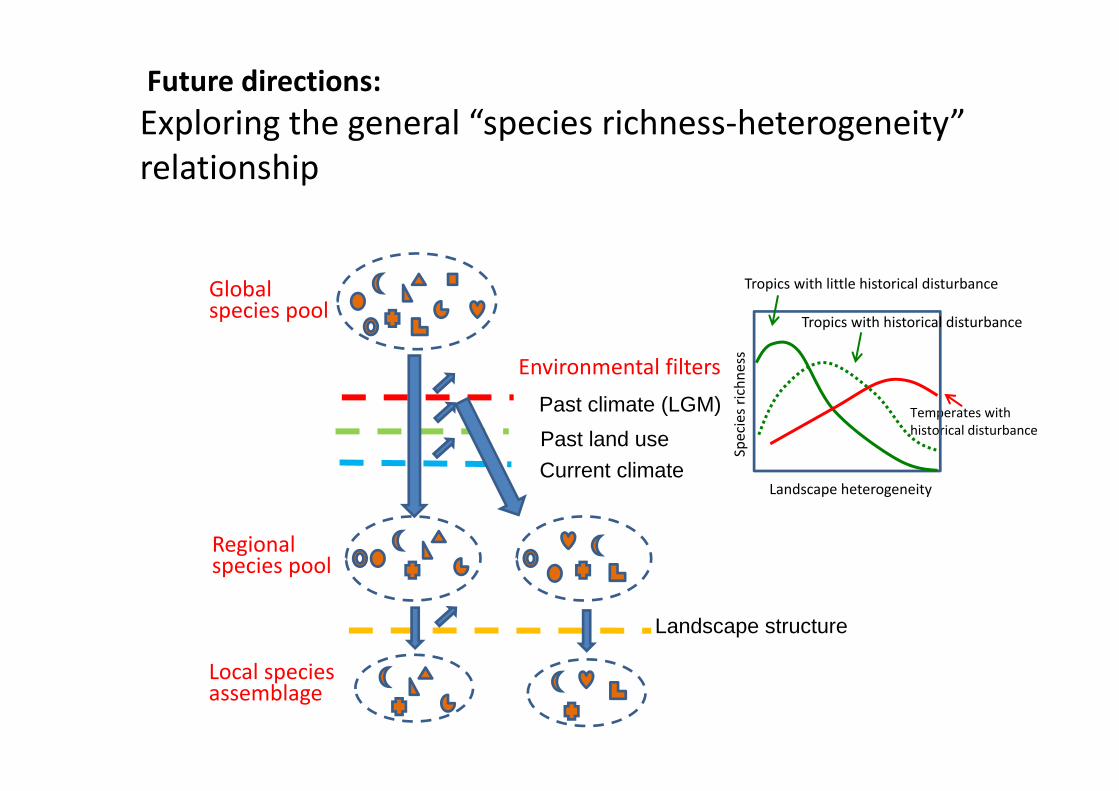
Landscape structure
Environmental filters
Global species pool
Regionalspecies pool
Local species assemblage
Future directions:
Mechanistic explanation of how regional species pool determines “species richness-heterogeneity” relationshipat local scales
Landscape structure
Environmental filters
Global species pool
Regionalspecies pool
Local species assemblage
Future directions:
Exploring the general “species richness-heterogeneity” relationship
Past climate (LGM)
Past land use
Current climate
Spec
ies
rich
nes
s
Temperates with historical disturbance
Tropics with little historical disturbance
Landscape heterogeneity
Tropics with historical disturbance
2.Biodiversity and landscape heterogeneity could provide higher pest control and pollination services.
(UNEP Report)
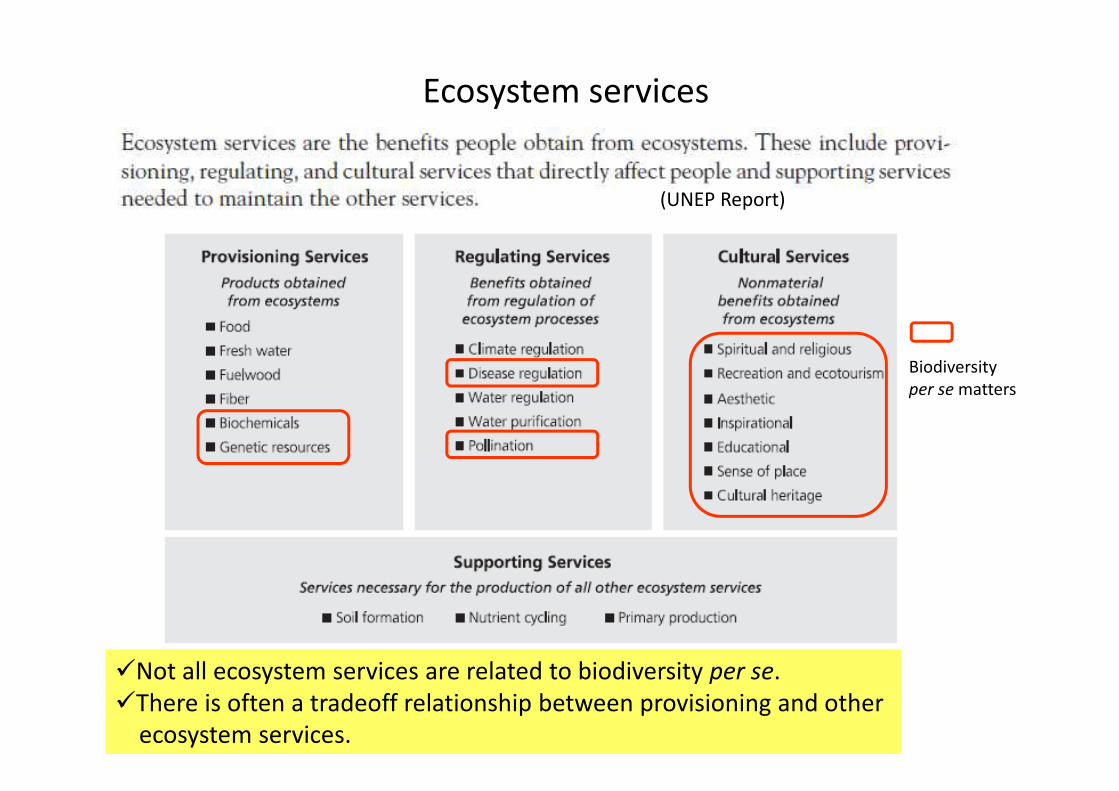
Ecosystem services
�Not all ecosystem services are related to biodiversity per se.�There is often a tradeoff relationship between provisioning and other
ecosystem services.
Biodiversity per se matters
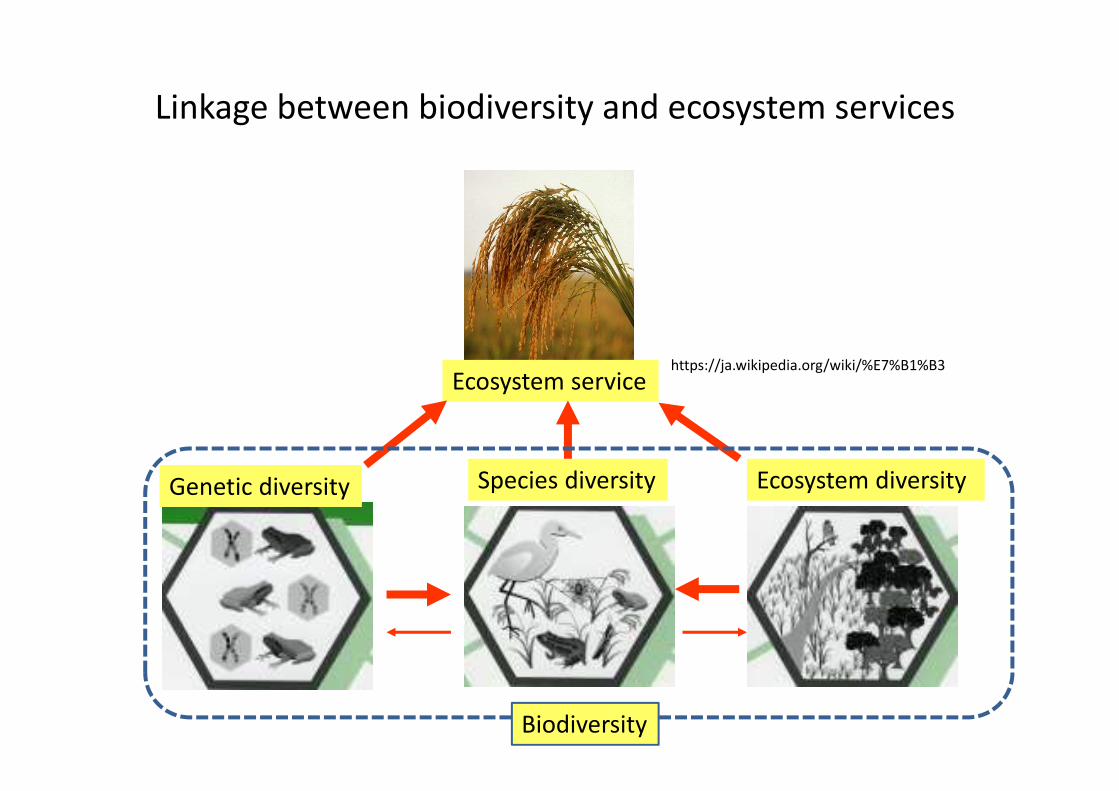
Linkage between biodiversity and ecosystem services
https://ja.wikipedia.org/wiki/%E7%B1%B3Ecosystem service
Genetic diversity Species diversity Ecosystem diversity
Biodiversity
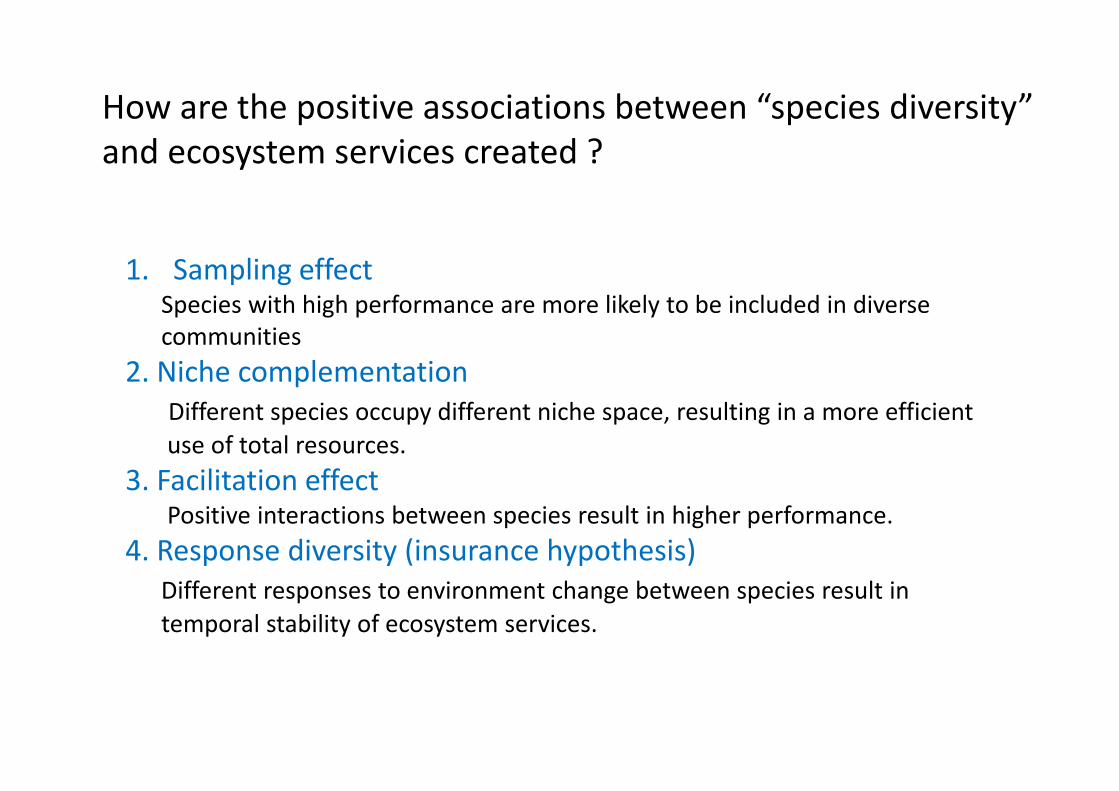
How are the positive associations between “species diversity” and ecosystem services created ?
1. Sampling effectSpecies with high performance are more likely to be included in diverse communities
2. Niche complementationDifferent species occupy different niche space, resulting in a more efficient
use of total resources.
3. Facilitation effectPositive interactions between species result in higher performance.
4. Response diversity (insurance hypothesis)Different responses to environment change between species result in
temporal stability of ecosystem services.
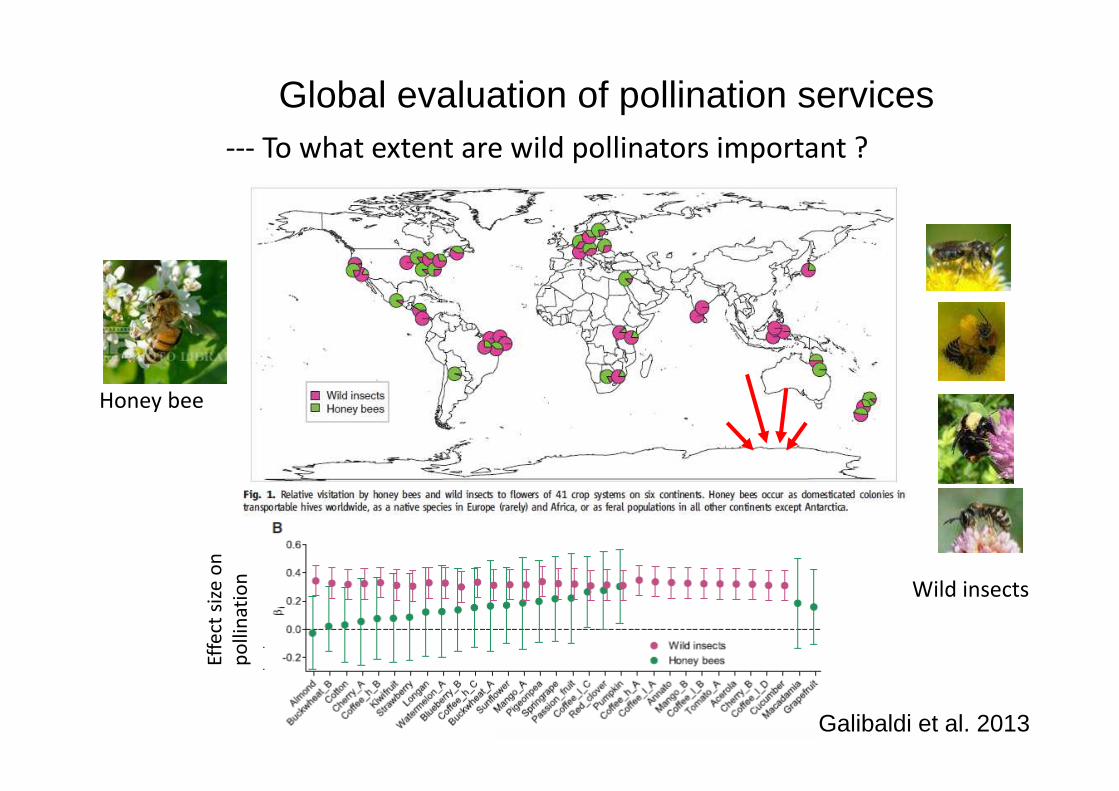
Galibaldi et al. 2013
Global evaluation of pollination services --- To what extent are wild pollinators important ?
Effe
ct s
ize
on
p
olli
nat
ion
Honey bee
Wild insects
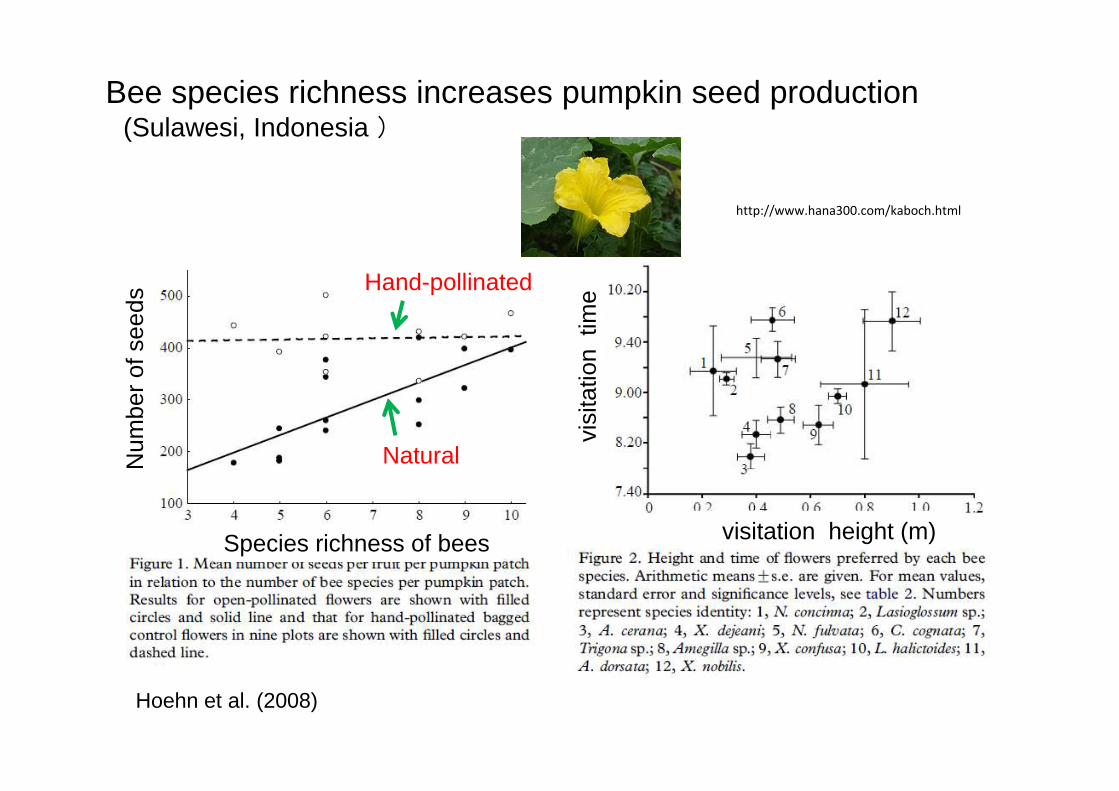
Hoehn et al. (2008)
Bee species richness increases pumpkin seed production (Sulawesi, Indonesia )
Num
ber
of s
eeds
Species richness of bees
Hand-pollinated
Natural
visitation height (m)
visi
tatio
n ti
me
http://www.hana300.com/kaboch.html
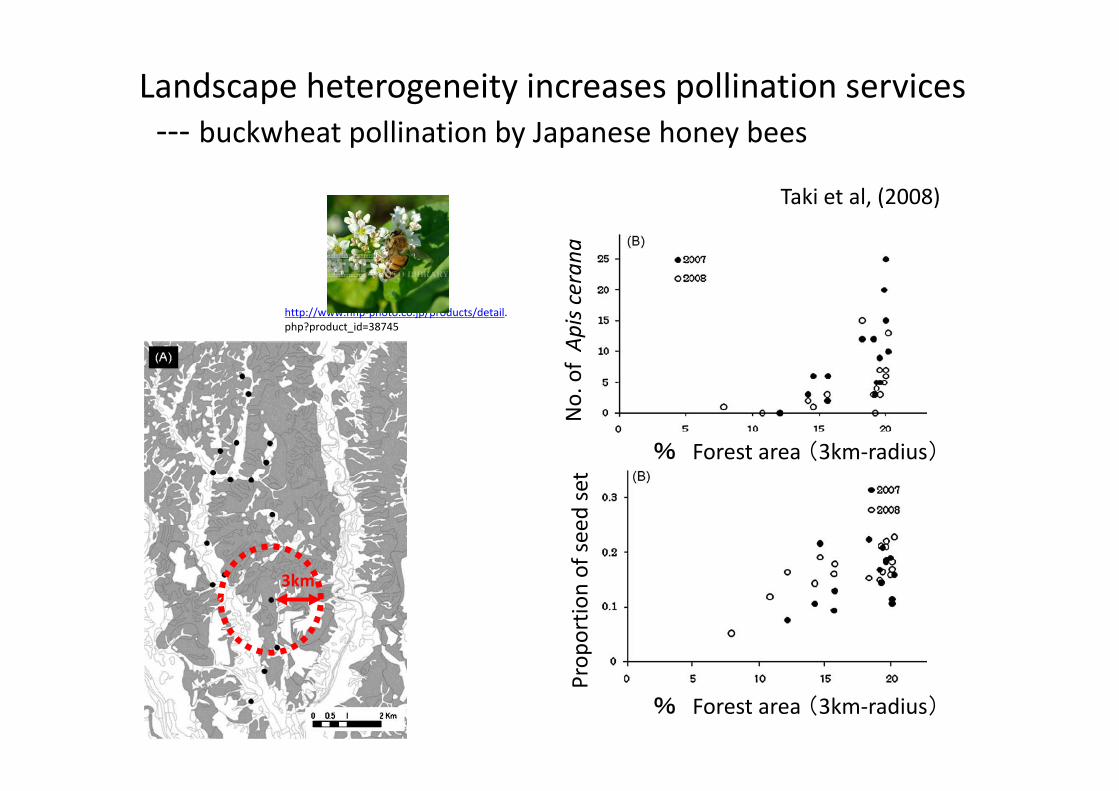
http://www.nnp-photo.co.jp/products/detail.php?product_id=38745
Landscape heterogeneity increases pollination services--- buckwheat pollination by Japanese honey bees
3km
% Forest area (3km-radius)
Pro
po
rtio
n o
f se
ed s
etN
o. o
f A
pis
cera
na
Taki et al, (2008)
% Forest area (3km-radius)
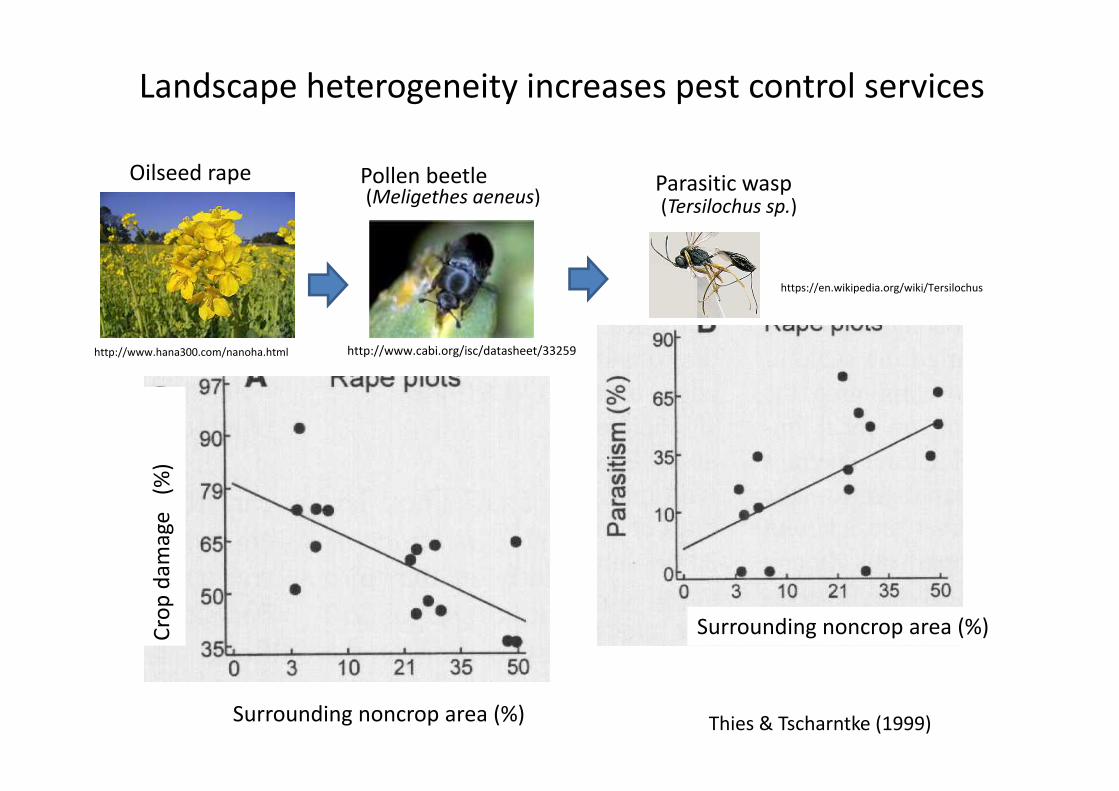
http://www.cabi.org/isc/datasheet/33259
https://en.wikipedia.org/wiki/Tersilochus
Pollen beetle(Meligethes aeneus)
Parasitic wasp(Tersilochus sp.)
Thies & Tscharntke (1999)
http://www.hana300.com/nanoha.html
Oilseed rape
Landscape heterogeneity increases pest control services
Surrounding noncrop area (%)
Cro
p d
amag
e (
%)
Surrounding noncrop area (%)
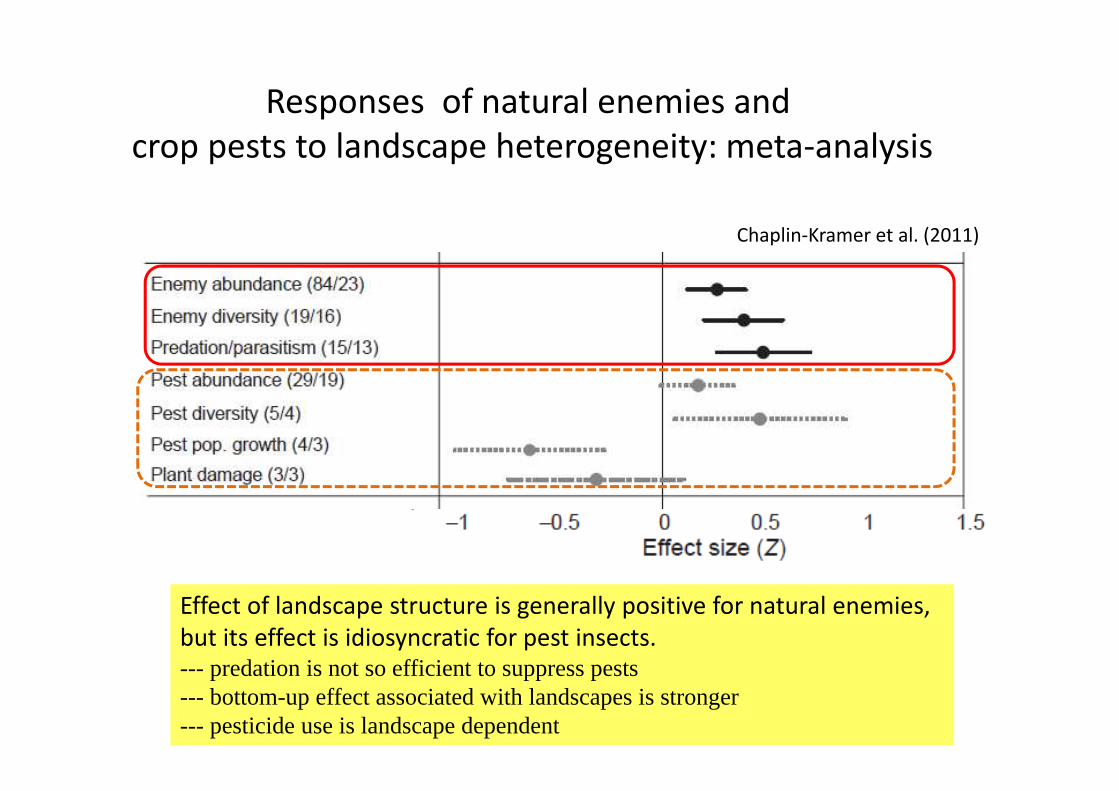
Chaplin-Kramer et al. (2011)
Responses of natural enemies and crop pests to landscape heterogeneity: meta-analysis
Effect of landscape structure is generally positive for natural enemies, but its effect is idiosyncratic for pest insects.--- predation is not so efficient to suppress pests--- bottom-up effect associated with landscapes is stronger--- pesticide use is landscape dependent
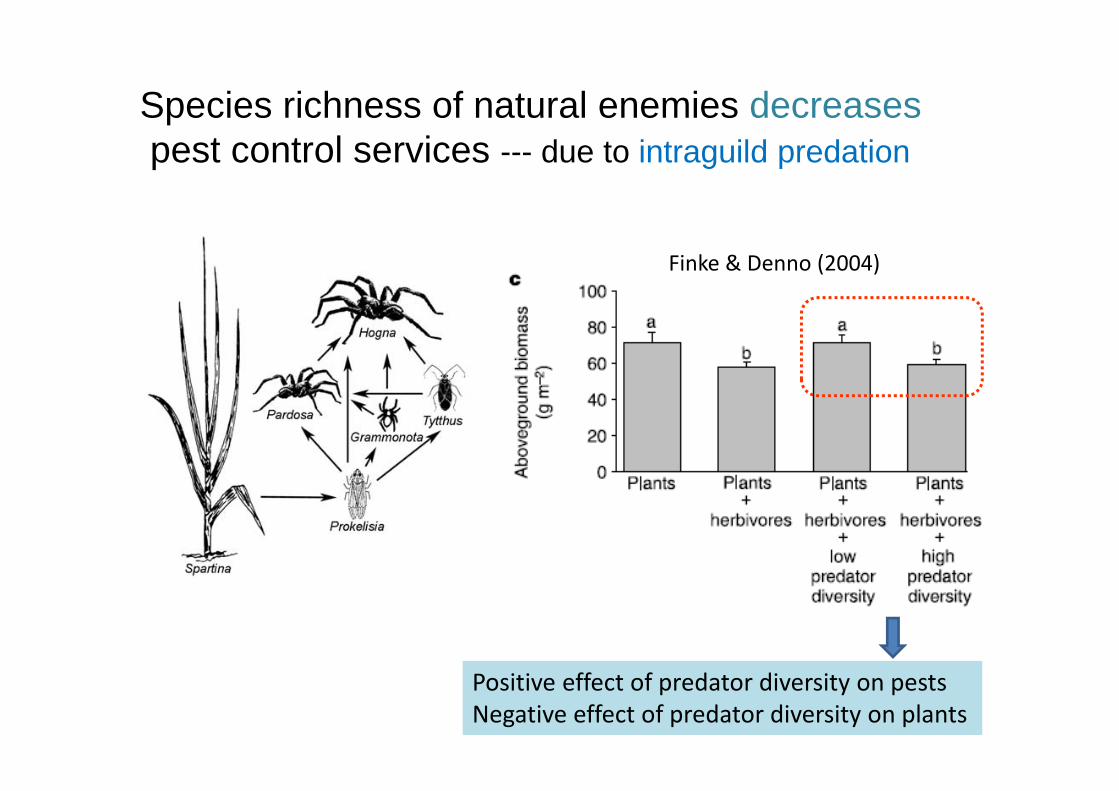
Finke & Denno (2004)
Species richness of natural enemies decreasespest control services --- due to intraguild predation
Positive effect of predator diversity on pestsNegative effect of predator diversity on plants
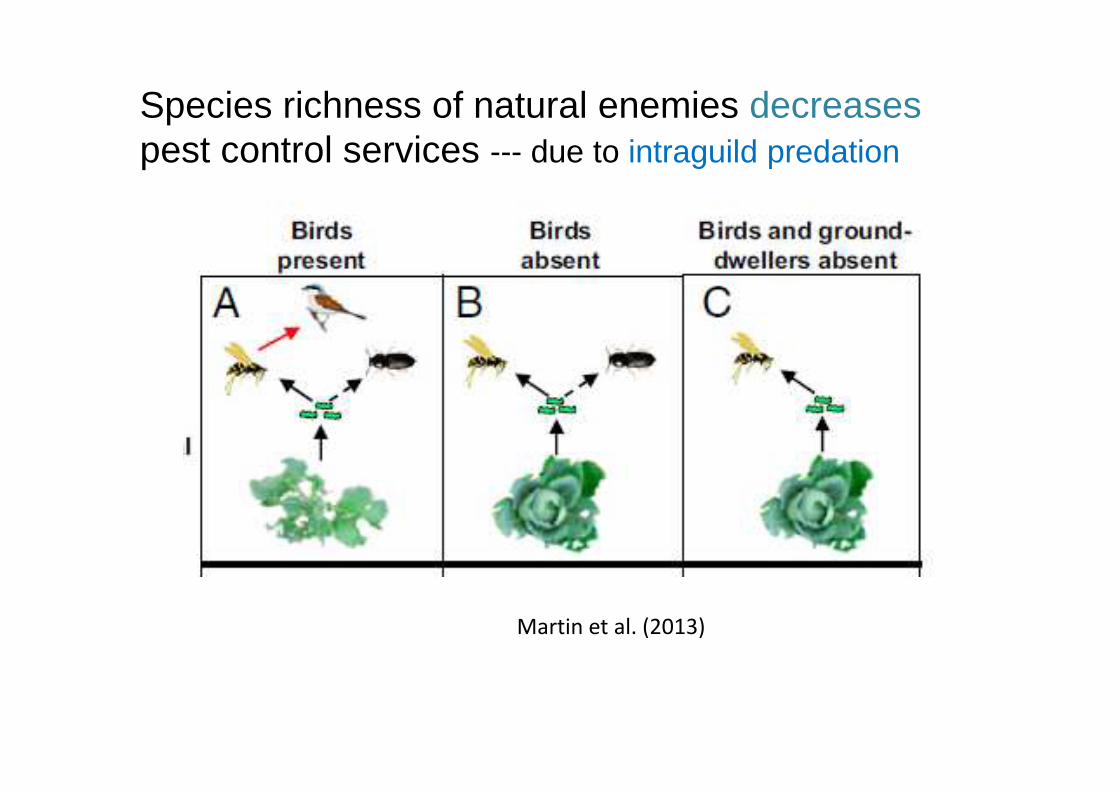
Martin et al. (2013)
Species richness of natural enemies decreasespest control services --- due to intraguild predation
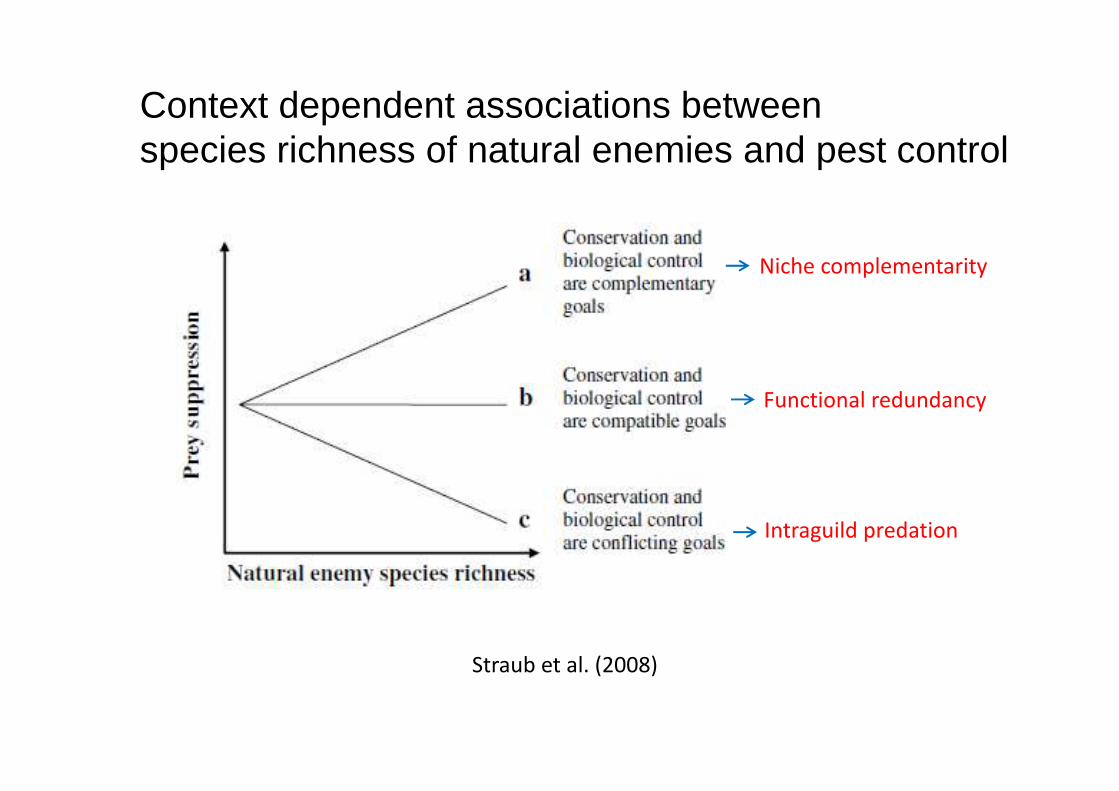
Straub et al. (2008)
Context dependent associations betweenspecies richness of natural enemies and pest control
Niche complementarity
Functional redundancy
Intraguild predation
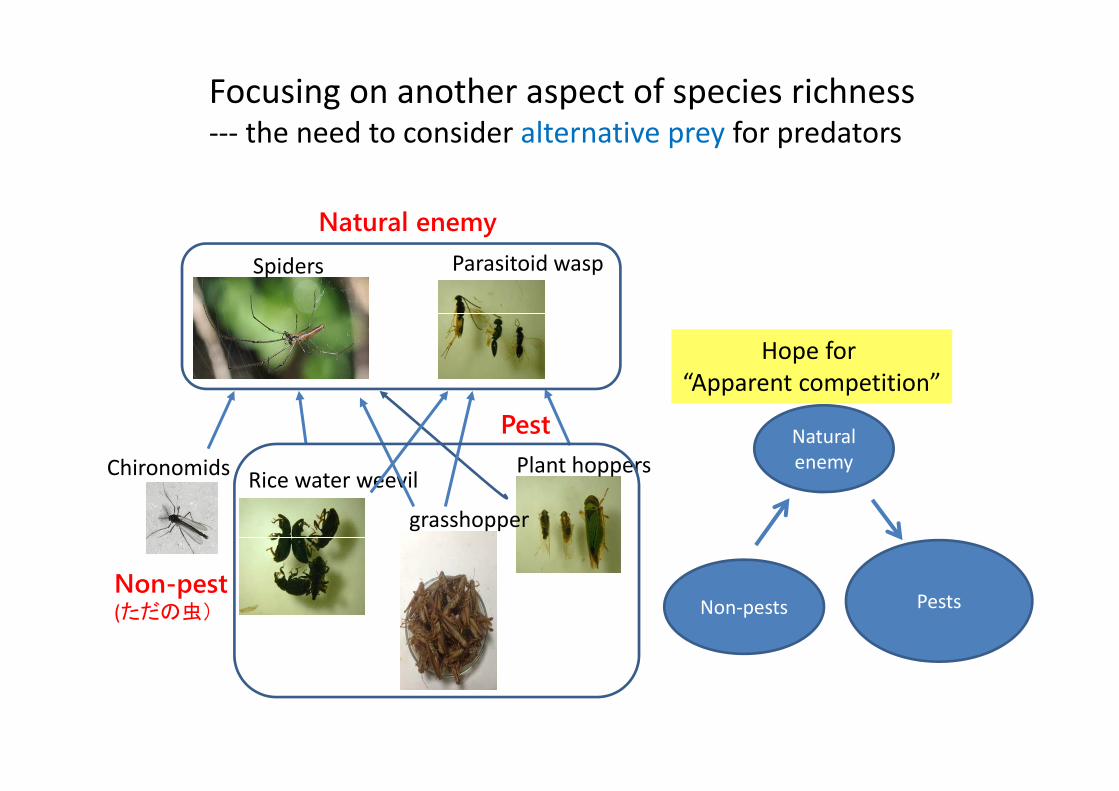
Parasitoid wasp
Plant hoppersRice water weevil
grasshopper
Chironomids
Spiders
Natural enemy
Pest
Non-pest(ただの虫)
Focusing on another aspect of species richness --- the need to consider alternative prey for predators
Hope for “Apparent competition”
PestsNon-pests
Natural enemy
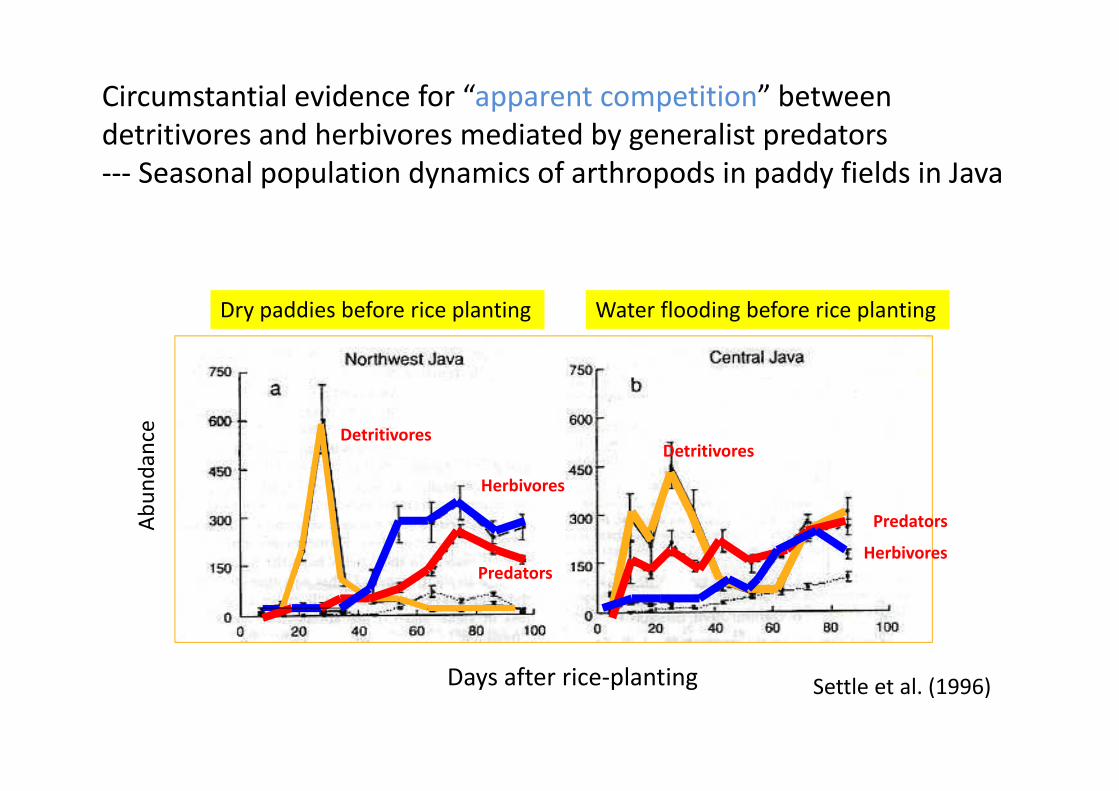
Circumstantial evidence for “apparent competition” between detritivores and herbivores mediated by generalist predators--- Seasonal population dynamics of arthropods in paddy fields in Java
Settle et al. (1996)
Water flooding before rice plantingDry paddies before rice planting
Detritivores
Predators
Herbivores
Detritivores
Herbivores
Predators
Days after rice-planting
Ab
un
dan
ce
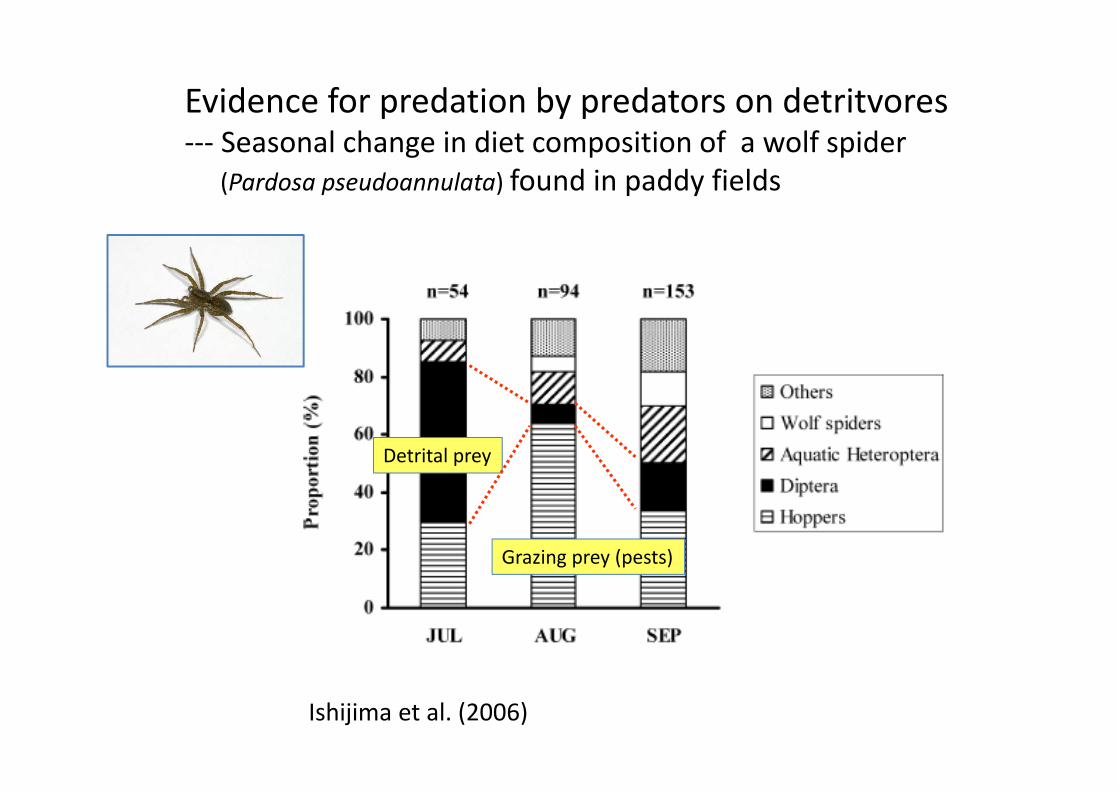
Ishijima et al. (2006)
Evidence for predation by predators on detritvores--- Seasonal change in diet composition of a wolf spider
(Pardosa pseudoannulata) found in paddy fields
Detrital prey
Grazing prey (pests)
Ishijima et al. (2006)
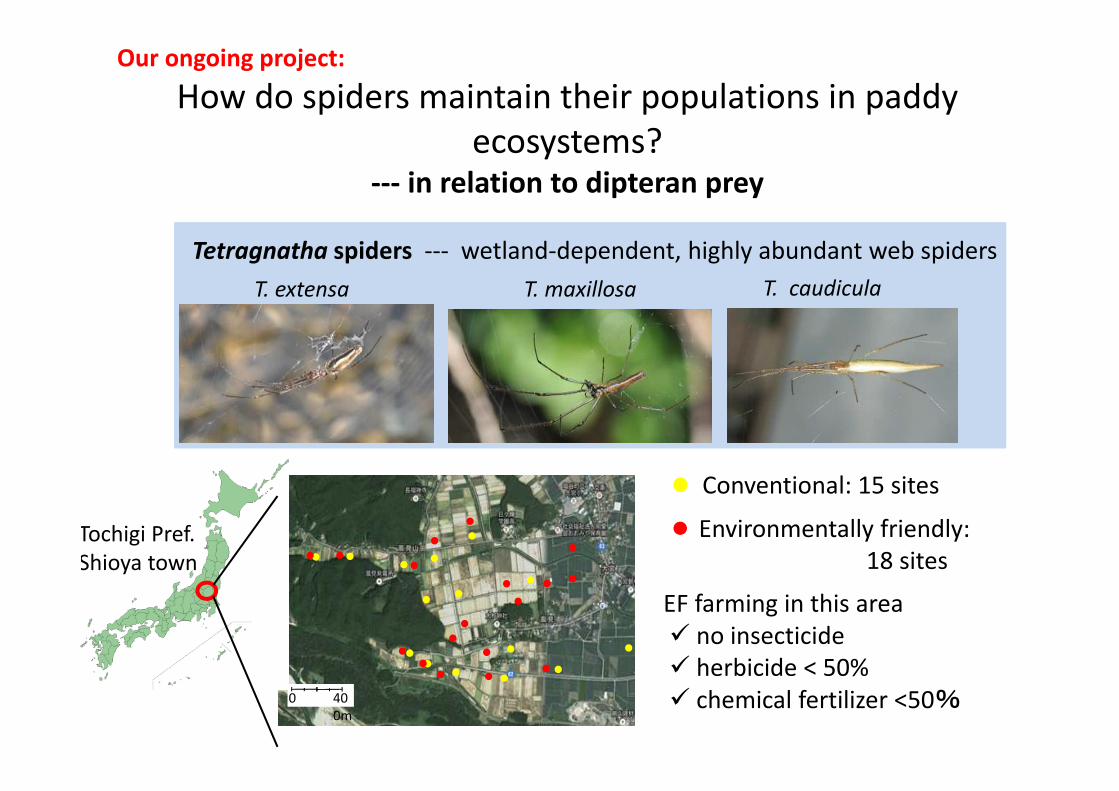
Our ongoing project:
How do spiders maintain their populations in paddy ecosystems?
--- in relation to dipteran prey
Environmentally friendly:18 sites
Conventional: 15 sites
0 400m
EF farming in this area� no insecticide� herbicide < 50%� chemical fertilizer <50%
Tochigi Pref.Shioya town
T. maxillosa T. caudiculaT. extensa
Tetragnatha spiders --- wetland-dependent, highly abundant web spiders
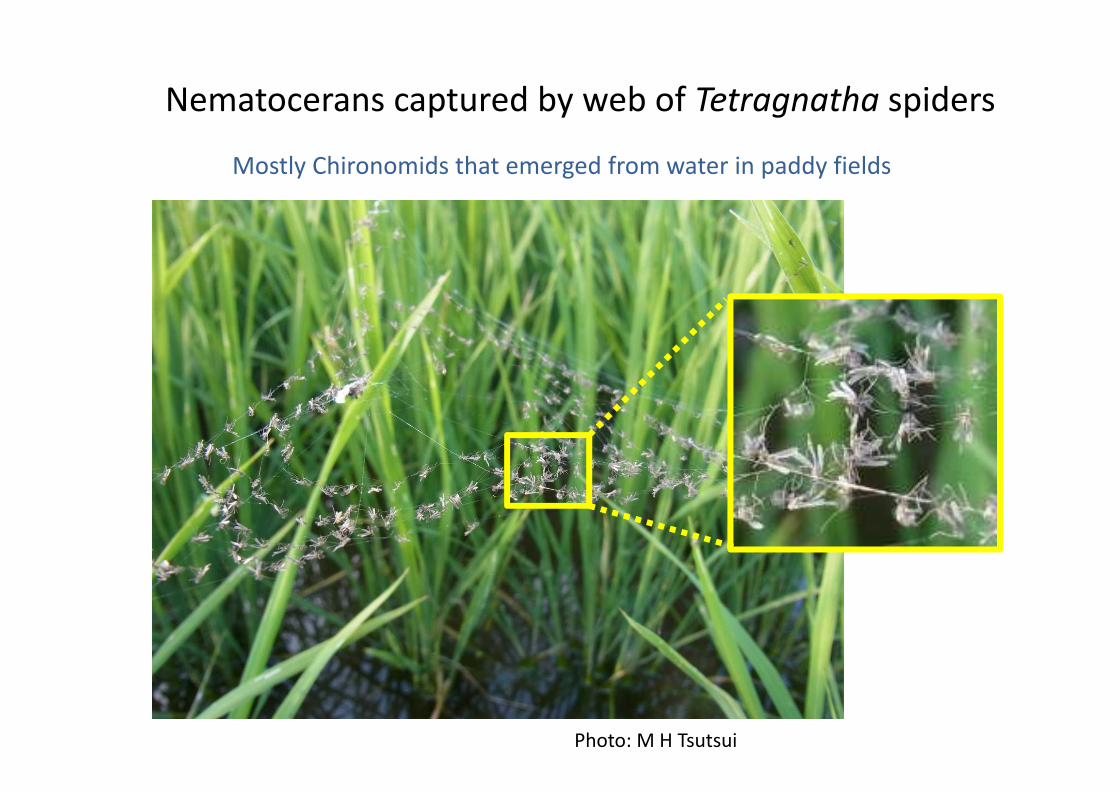
Nematocerans captured by web of Tetragnatha spiders
Mostly Chironomids that emerged from water in paddy fields
Photo: M H Tsutsui
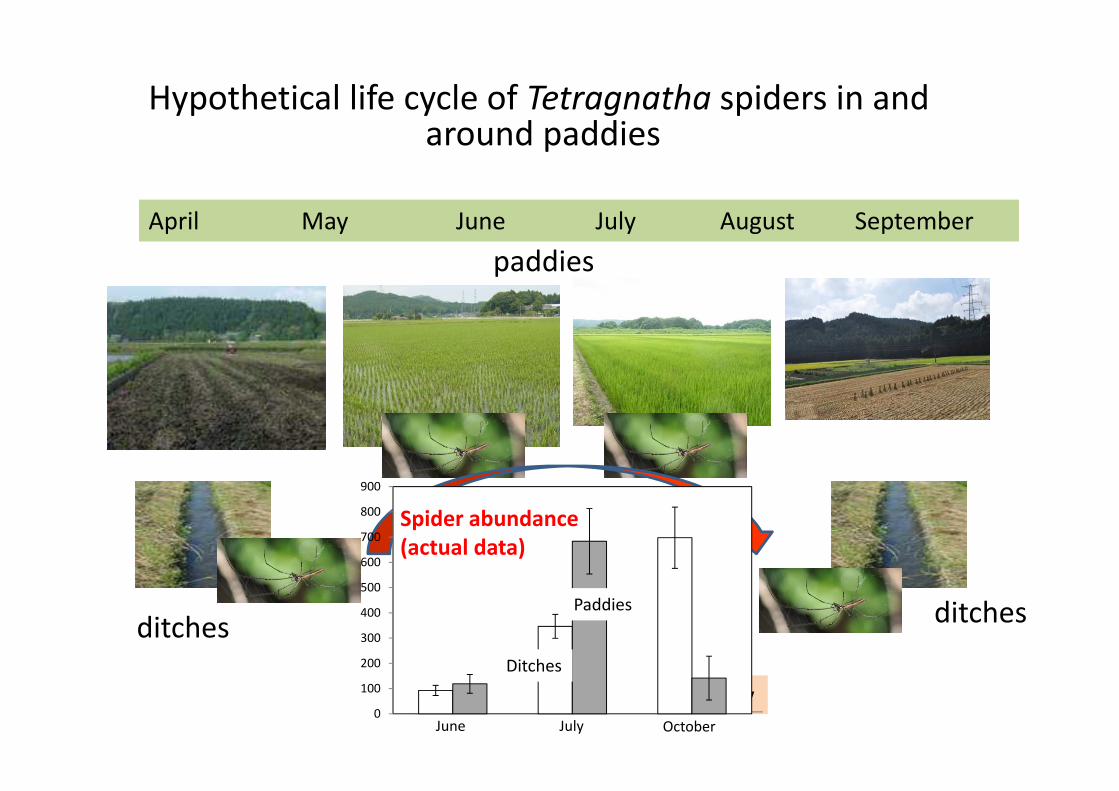
Hypothetical life cycle of Tetragnatha spiders in andaround paddies
ditches ditches
paddies
April May June July August September
Population growth phase
Emergence of huge amount of prey
Ditches
June July October0
100
200
300
400
500
600
700
800
900
Ditches
Paddies
Spider abundance
(actual data)
50 100 150 200 250
-0.4
-0.2
0.0
0.2
0.4
0.6
Rat
io o
f sp
ider
ab
un
dan
ce
(Ju
ly/
Jun
e)
50 100 150 200 250
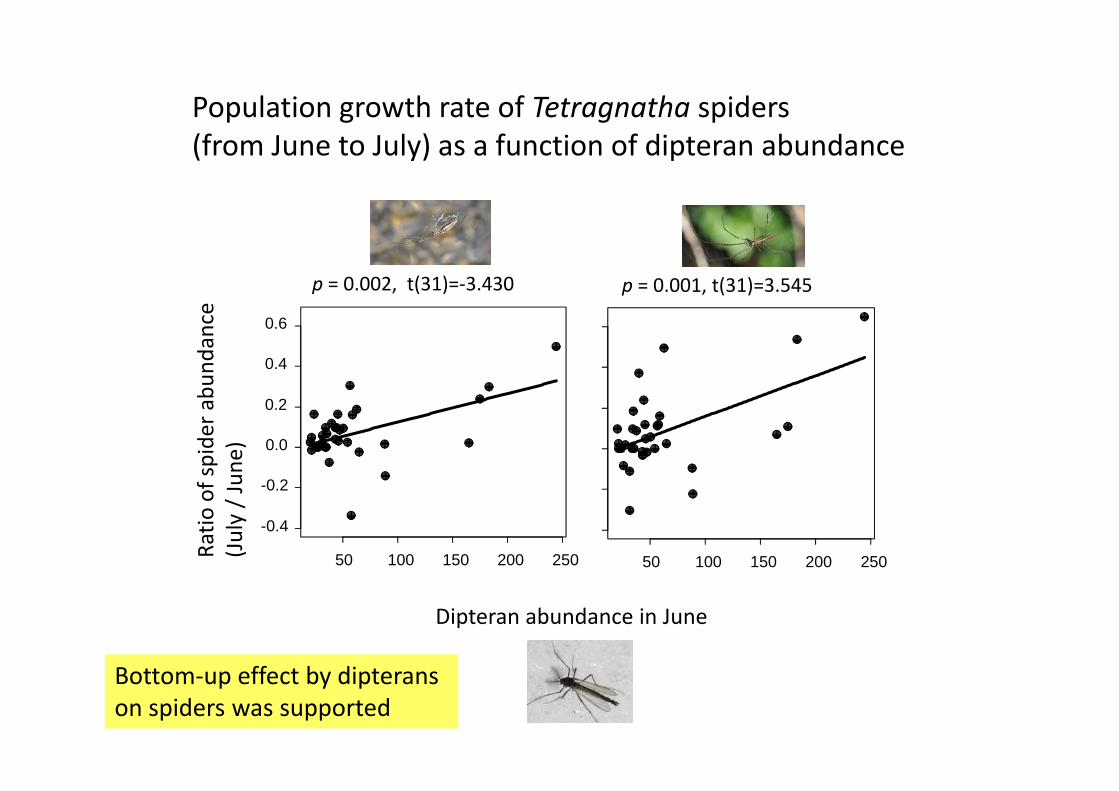
p = 0.001, t(31)=3.545p = 0.002, t(31)=-3.430
Population growth rate of Tetragnatha spiders(from June to July) as a function of dipteran abundance
Dipteran abundance in June
Bottom-up effect by dipterans on spiders was supported
Dip
tera
n a
bu
nd
ance
/10
sw
eep
s
June
0.1
1
10
100
1000
10000
MS
MS2
TY
BY
NK
B
July August
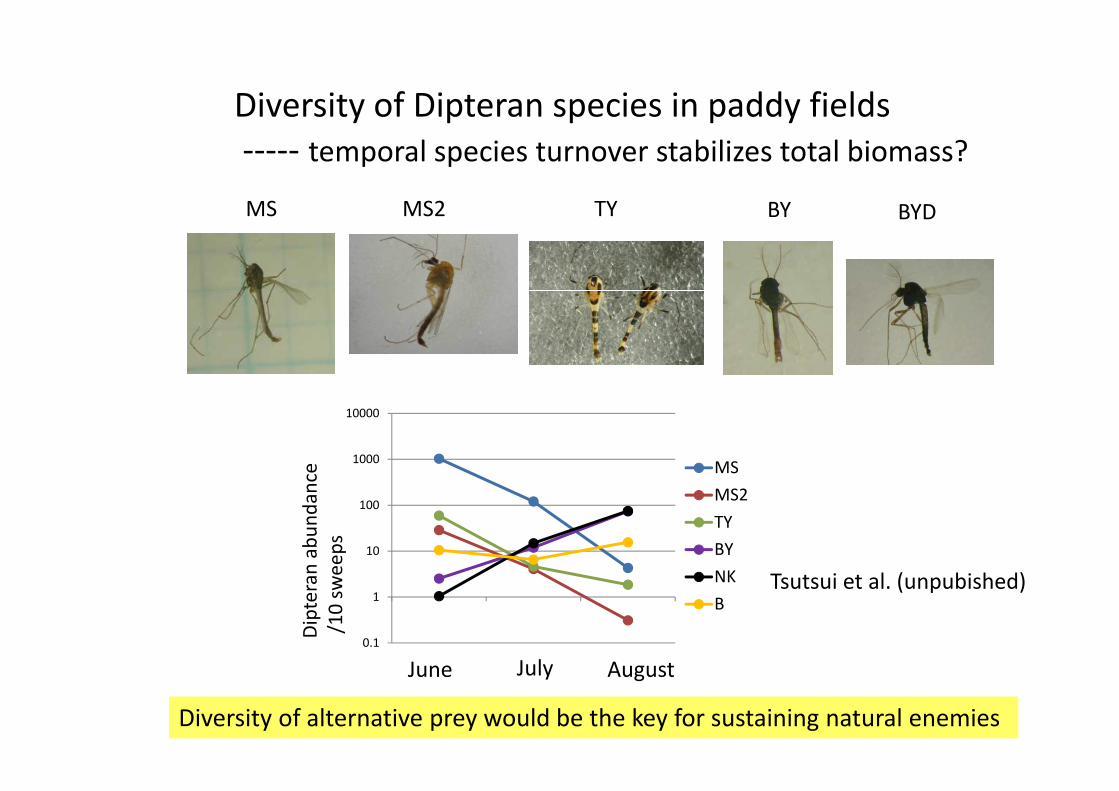
MS MS2 TY BY BYD
Diversity of Dipteran species in paddy fields----- temporal species turnover stabilizes total biomass?
Tsutsui et al. (unpubished)
Diversity of alternative prey would be the key for sustaining natural enemies
MS MS2 TY BY BYD
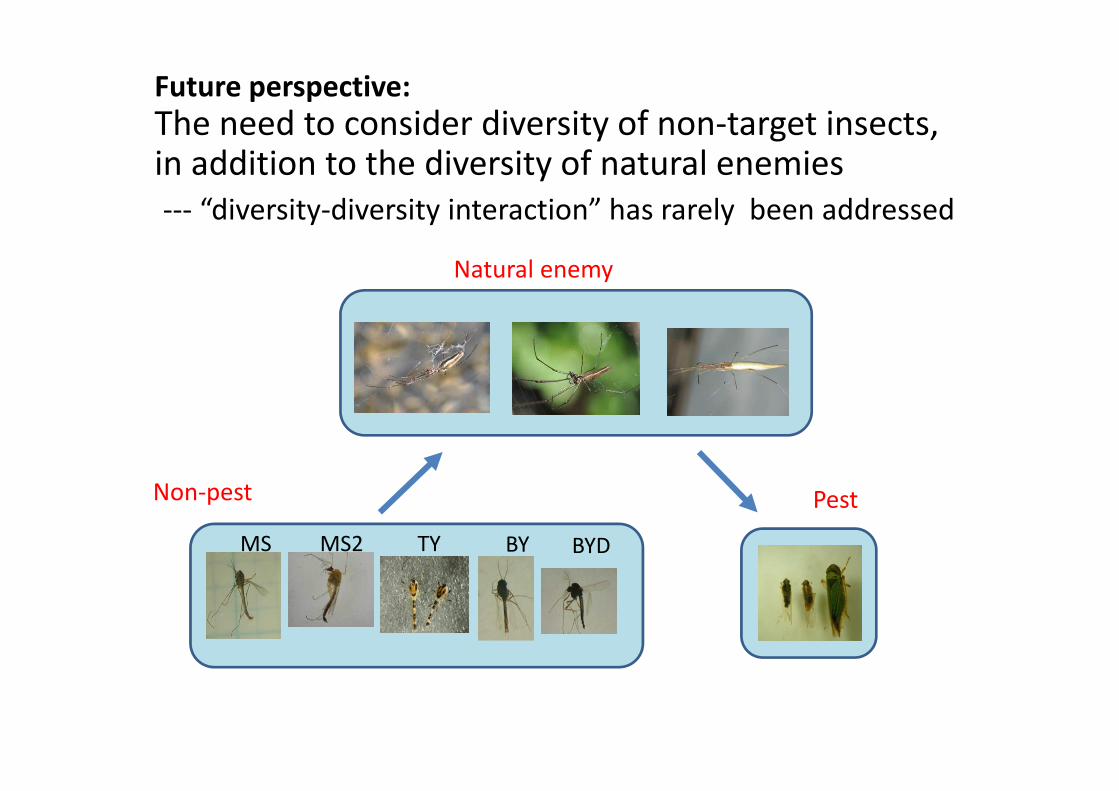
Future perspective:
The need to consider diversity of non-target insects,in addition to the diversity of natural enemies--- “diversity-diversity interaction” has rarely been addressed
Natural enemy
Non-pest Pest