Embed Size (px)
Citation preview
Dual-Stage Boosting Systems: Modeling of Configurations, Matching
and Boost Control Options
by
Byungchan Lee
A dissertation submitted in partial fulfillment of the requirements for the degree of
Doctor of Philosophy (Mechanical Engineering)
in The University of Michigan 2009
Doctoral Committee:
Professor Dionissios N. Assanis, Co-Chair Assistant Professor Dohoy Jung, Co-Chair Research Professor Zoran S. Filipi Assistant Professor Matthias Ihme

© Byungchan Lee
All right reserved 2009
ii
ACKNOWLEDGEMENTS
I would like to acknowledge the technical and financial support of the
Automotive Research Center (ARC) by the National Automotive Center (NAC)
located within the US Army Tank-Automotive Research, Development and
Engineering Center (TARDEC) in Warren, Michigan. The ARC is a U.S. Army
Center of Excellence for Automotive Research at the University of Michigan,
currently in partnership with 6 other Universities.
iii
TABLE OF CONTENTS
ACKNOWLEDGEMENTS ................................................................................................ ii
LIST OF TABLES ............................................................................................................. vi
LIST OF FIGURES .......................................................................................................... vii
LIST OF ABBREVIATIONS ............................................................................................. x
CHAPTER 1. Introduction.................................................................................................. 1
1.1. Overview .................................................................................................................... 1
1.2. Literature Review on Air Charging Systems ............................................................. 6
1.2.1. Positive displacement supercharger ..................................................................... 6
1.2.2. Centrifugal compressor as a supercharger ........................................................... 8
1.2.3. Electrically driven supercharger .......................................................................... 9
1.2.4. Single-stage turbocharging .................................................................................. 9
1.2.5. Dual-stage turbocharging ................................................................................... 11
1.3. Motivation and objectives ........................................................................................ 13
CHAPTER 2. SIMULATION OF TURBOCHARGED DIESEL ENGINE .................... 16
2.1. Introduction .............................................................................................................. 16
2.2. Description of the simulation model ........................................................................ 17
2.2.1. Air filter model ...................................................................................................19
2.2.2. Turbocharger model ............................................................................................20
2.2.3. Intake/Exhaust manifold model ..........................................................................21
2.2.4. In-cylinder process ..............................................................................................23
2.2.5. Valve flow ...........................................................................................................25
iv
2.2.6. Fuel injection control ..........................................................................................26
2.2.7. Vehicle system model .........................................................................................27
2.3. Engine Model Calibration ...................................................................................29
CHAPTER 3. DUAL-STAGE TURBOCHARGER MATCHING .................................. 32
3.1. Matching procedure ................................................................................................. 32
3.2. Turbomachinery scaling ........................................................................................... 44
CHAPTER 4. BOOST CONTROL OPTIONS ................................................................ 46
4.1. Introduction .............................................................................................................. 46
4.1.1. Dual-stage turbocharger with wastegate .............................................................47
4.1.2. Dual-stage turbocharger with bypass valve ........................................................48
4.1.3. Early Intake Valve Closure (EIVC) cycle ..........................................................49
4.2. Simulation results..................................................................................................... 57
4.2.1. The effect of the ratio of each stage pressure ratios ............................................57
4.2.2. Fuel injection rate and timing .............................................................................60
4.2.3. Steady state results ..............................................................................................63
4.2.4. Transient results ..................................................................................................67
4.3. Summary .................................................................................................................. 70
CHAPTER 5. HYBRID DUAL-STAGE BOOSTING SYSTEMS ................................. 72
5.1. Introduction .............................................................................................................. 72
5.2. Hybrid dual-stage boosting systems ........................................................................ 74
5.2.1. Hybrid dual-stage boosting system with screw type supercharger .....................74
5.2.2. Hybrid dual-stage boosting system with electrically driven supercharger .........76
5.2.3. Hybrid dual-stage boosting system with variable geometry turbine ..................77
5.3. Fuel injection rate and timing .................................................................................. 78
5.4. Steady state simulation results ................................................................................. 81

v
5.5. Transient simulation results ..................................................................................... 84
5.6. Fuel economy ........................................................................................................... 87
5.7. Summary .................................................................................................................. 94
CHAPTER 6. Summary and conclusion .......................................................................... 95
APPENDIX ....................................................................................................................... 98
BIBLIOGRAPHY ........................................................................................................... 100
vi
LIST OF TABLES
Table 1. Engine Specification ........................................................................................... 19
Table 2. Vehicle Specification .......................................................................................... 28
Table 3. Engine Specification ........................................................................................... 29
Table 4. Data used for Engine Calibration ........................................................................ 30
Table 5. Fuel-air equivalence ratio when the electric compressor is turned off ............... 88
vii
LIST OF FIGURES
Figure 1. Diesel Engine System Model ............................................................................ 17
Figure 2. Intake/Exhaust manifold model ......................................................................... 21
Figure 3. Heat transfer in intake/exhaust manifold ........................................................... 22
Figure 4. Valve effective flow area ................................................................................... 26
Figure 5. Vehicle system model ........................................................................................ 27
Figure 6. Pressure traces ................................................................................................... 31
Figure 7. Dual-Stage turbocharger configuration ............................................................. 33
Figure 9. Dual-stage turbocharger with wastegate ........................................................... 48
Figure 10. Dual-stage turbocharger with bypass valve ..................................................... 49
Figure 11. EIVC vs. LIVC ................................................................................................ 50
Figure 12. Cylinder temperature ....................................................................................... 51
Figure 13. Peak cylinder temperature and pressure .......................................................... 53
Figure 14. BSFC with varying intake valve closing timing.............................................. 55
Figure 15. Dual-stage turbocharging system without bypass valve utilizing EIVC ......... 56
Figure 16. Effect of ratios of each stage pressure ratios on compressor performance ..... 59
Figure 17. Effect of ratios of each stage pressure ratios on brake torque and BSFC ....... 59
viii
Figure 18. Cylinder pressure at 2000 rpm full load condition .......................................... 60
Figure 19. Peak cylinder pressure and equivalence ratio .................................................. 61
Figure 20. Fuel-air equivalence ratios under full load acceleration .................................. 61
Figure 21. Fuel injection rate and timing for wastegate configuration ............................. 62
Figure 22. Fuel injection rate and timing for bypass valve configuration ........................ 62
Figure 23. Fuel injection rate and timing for bypass valve configuration ........................ 62
Figure 24. Operating points of wastegate configuration ................................................... 63
Figure 25. Operating points of bypass valve configuration .............................................. 64
Figure 26. Operating points of EIVC cycle engine........................................................... 64
Figure 27. Steady-state full load boosting characteristics ................................................ 65
Figure 28. Torque and BSFC ............................................................................................ 66
Figure 29. Vehicle launch performance (0 to 60 mph full load acceleration) .................. 68
Figure 30. Vehicle passing performance (30 to 50 mph full load acceleration) ............... 68
Figure 31. Transient boosting characteristics under full load acceleration ...................... 69
Figure 32. Intake manifold pressure under full load acceleration .................................... 69
Figure 33. Torque from downsized engine with dual-stage turbocharger compared to
torque from baseline V8 engine ......................................................................... 72
Figure 34. Hybrid dual-stage boosting system with mechanically driven screw type
supercharger ....................................................................................................... 75
Figure 35. Hybrid dual-stage boosting system with electrically driven supercharger ...... 76
Figure 36. Dual-stage turbocharger with VGT at the high pressure stage ........................ 77
Figure 37. Peak cylinder pressure and equivalence ratio under steady-state full load
condition ............................................................................................................ 79
ix
Figure 38. Fuel-air equivalence ratios under full load acceleration .................................. 79
Figure 39. Fuel injection rate and timing for SC+TC configuration ................................ 80
Figure 40. Fuel injection rate and timing for VGT+TC configuration ............................. 80
Figure 41. Fuel injection rate and timing for EC+TC configuration ................................ 80
Figure 42. Fuel injection rate and timing for baseline V8 engine .................................... 81
Figure 43. Brake torque and BSFC under steady-state full load condition ...................... 81
Figure 44. Steady-state full load boosting characteristics ................................................ 82
Figure 45. Vehicle launch performance (0 to 60 mph full load acceleration) .................. 85
Figure 46. Vehicle passing performance (30 to 50 mph full load acceleration) ............... 85
Figure 47. Transient boosting characteristics under full load acceleration ...................... 86
Figure 48. Intake manifold pressure under full load acceleration .................................... 86
Figure 49. U.S. FTP-72 cycle ........................................................................................... 87
Figure 50. Fuel economy through FTP-72 cycle .............................................................. 88
Figure 51. Engine visiting points during FTP-72 drivng cycle simulation ....................... 90
Figure 52. Visiting points on compressor map ................................................................ 93
x
LIST OF ABBREVIATIONS
BDC : bottom dead center BSFC : brake specific fuel consumption EIVC : early intake valve closure LIVC : late intake valve closure MBT : maximum brake torque TDC : top dead center VGT : variable geometry turbine VNT : variable nozzle turbine
eN : engine speed
dV : engine displacement volume T : temperature p : pressure η : compressor/turbine efficiency γ : heat capacity ratio ε : intercooler effectiveness W& : power m& : mass flow rate
corrm& : corrected mass flow rate
pc : constant pressure specific heat
mechη : turbocharger mechanical efficiency
volη : volumetric efficiency ρ : density A/F : air-fuel ratio R : gas constant D : diameter of turbomachinery
01T : inlet stagnation temperature 01p : inlet stagnation pressure
02T : outlet stagnation temperature 02p : outlet stagnation pressure
µ : dynamic viscosity Subscripts and Superscripts amb : ambient LPC : low pressure compressor LPT : low pressure turbine HPC : high pressure compressor HPT : high pressure turbine a : air f : fuel
xi
t : total 1-2 : from state 1 to 2
21−X : average value of X from state 1 to 2
1
CHAPTER 1. INTRODUCTION
1.1. Overview
For millions of years, the changes in the climate have been driven by forces of
nature, but in recent years, the average temperature of the Earth has been rising faster
than ever before. The consensus in science is that much of that change has been driven by
the significant increase of greenhouse gases in the atmosphere. These greenhouses gases
are known to increase the average temperature of the atmosphere by trapping the heat
radiated from the surface of the Earth. Scientists are now certain that human activities are
changing the composition of the atmosphere, and that increasing the concentration of
greenhouse gases will change the global climate at a rate that is unparalleled for the last
many millions of years.
According to EPA, human activities have increased the concentration of CO2, one
of the direct greenhouse gases, by 36% globally since the Industrial Revolution,
principally due to the combustion of fossil fuels. In 2006, CO2 contributed 84.8% of the
total greenhouse gases in the United States. The total CO2 emission has increased by 18%
from 1990 to 2006. The sources of CO2 vary by region, but most researchers cite
transportation for about 33%. Electric power generation in the US produces about another
third, while heating our homes, manufacturing, agriculture and clearing forests account
for the rest.
2
Due to current concern over global warming and the connection between fuel
consumption and emissions of the greenhouse gases such as CO2, improving the fuel
economy of internal combustion engines for automotive applications has a higher priority
this decade than at any time since the Oil Crisis in the 1970s. The seriousness of the issue
is gaining ground, and the sense of urgency is growing around the need to address the
issue in an effective way.
Various new or improved power train technologies are being exploited to reduce
CO2 emission by improving vehicle fuel economy. Among many technical innovations
and improvements in power train technologies, engine downsizing (reduction in
displacement volume and/or the number of cylinders) is one of the most effective
methods to reduce fuel consumption, i.e. CO2 emission [1-10]. Engine downsizing, the
use of a smaller capacity engine operating at higher specific engine loads, is achieved by
running with high levels of pressure boosting at full load using a supercharger or
turbocharger.
In fact, most technical advances in automotive engineering can be viewed as
means to allow engine downsizing as they improve the specific output of the engine. For
example, in the past, one of the main limitations to maximum power for small Diesel
engines was the ability to provide enough fuel in a limited injection period. Modern high
pressure injection systems, such as common rail, have solved this problem significantly,
allowing further downsizing of the engine.
Cantore et al. [2] have shown that the downsized 1.8 l Diesel engine with two-
stage boosting system can achieve up to 24% of fuel economy improvement over the
baseline 2.5 l turbocharged Diesel engine while meeting or exceeding the performance
3
targets of the baseline engine. Guzzella et al. [4] have concluded in their study that the
downsized engine not only improves the fuel economy but also improves drivability of
the vehicle by reducing overall vehicle weight as the smaller engine requires smaller and
lighter engine subcomponents in the vehicle. The reduction in overall vehicle weight also
contributes to even more improvement in fuel economy. Engine downsizing and
subsequent downsizing of other related components are also advantageous in packaging,
and frees up more space in the engine compartment for other features such as vehicle
safety enhancement and allows better aerodynamic design of the vehicle.
Hybrid power train technologies are also emerging as a highly practical and
efficient way to reduce fuel consumption [11-22]. In passenger cars, the application of
hybrid systems seems to be beneficial in terms of CO2 and fuel consumption reduction, at
least as long as the vehicle is operated predominantly at part load conditions. Toussaint
[11] has shown 19 to 31% improvement in fuel economy with a parallel hybrid electric
vehicle consisting of a downsized engine and electric motor. The use of hybrid
powertrain is also proven to be advantageous with city buses (21% improvement over
Diesel engine counterpart [12], and up to 75% in [13]) in their very transient driving
conditions.
However, in heavy duty applications, especially for long haul operation, the use
of hybridization seems to be less attractive at least according to actual common
understanding. Katrasnik [14] has shown that the improvement in the fuel economy of
hybrid powertrains increases with decreasing test cycle average load and the powertrains
incorporating internal combustion engines with smaller swept volume provide more fuel
economy improvements for decreasing test cycle average load. The study concludes that
4
the hybrid powertrains perform best for the test cycles with lower average load, i.e. light
duty application, whereas heavy duty application requires powertrains with low
hybridization factor resulting in smaller benefits in the fuel consumption. Takada et al.
[15] conducted an experiment on fuel economy improvement with a medium duty hybrid
truck in real traffic conditions, and concluded that the hybrid truck did not show
improvement in fuel economy in high way trip even though fuel economy improvement
of 20% was observed for the urban trip where there were many traffic stops. Considering
that the improvement in fuel economy of the hybrid powertrain also comes from the
engine downsizing, even though part of the improvement is the result of advanced power
management and regenerative braking, engine downsizing is a more fundamental method
to reduce fuel consumption.
Engine downsizing by increasing the air available for fuel combustion with
turbocharger improves the thermal efficiency of the engine and reduces the fuel
consumption through a number of mechanisms, including:
• Reducing pumping losses as less volume is swept on each engine revolution.
• Using the compressor (powered by waste exhaust enthalpy) to force the piston
down under boosted conditions to further reduce pumping losses, and to
produce useful work during induction.
• An improvement in mechanical efficiency due to reduction in friction.
• Improved in-cylinder turbulence (tumble and swirl patterns) due to higher
intake pressures and gas velocities which promote faster burning rates and
hence improved combustion.
• Reduced fuel consumption at idle and part load conditions.
5
• Reduced overall heat losses due to exhaust heat recovery and reduced surface
areas for heat transfer.
However, when the displacement of the engine is reduced substantially, its
dependence on boosting system increases as the engine torque under naturally aspirated
operation is lower and it needs high boost pressure to produce enough torque for
acceleration. Although very effective, some characteristics of the turbocharged engines
remain unsatisfactory and matching an engine to a turbocharger to achieve efficient
turbocharger operation over a wide range of engine speed is a difficult and often a
compromising process. For example, at low engine speed, turbocharged engine produces
less torque than naturally aspirated engine with comparable power as the available
exhaust energy is simply not enough to supply sufficient power to the compressor at low
speed. In addition, transient response of the turbocharged engine is much slower than that
of the naturally aspirated engine since the centrifugal compressor needs to reach
substantial rotational speed to produce usable boost [23-24]. In Diesel engine applications,
combined with smoke-limited fueling, both the steady-state low end torque and the
transient response become even worse. In order to solve this inherent weakness of engine
downsizing through turbocharging, various technologies have been developed for the
turbocharger itself such as inertia reduction, aerodynamics and bearing improvements
[25], variable geometry on both compressor and turbine sides [26], and electrically
assisted turbocharger [27], as well as for the charging system architecture such as twin-
turbo system [28], sequential system [29], and dual-stage system [30]. Also a number of
alternative charging systems, such as positive displacement supercharger and electric
compressor, are used in some applications either by themselves [31-33] or in combination
6
with the turbocharger [27, 34-35]. Even thought these devices generally increase fuel
consumption, the benefits of using them can outweigh their shortcomings in some cases
depending on the system design philosophy and the type of applications as they
substantially reduce the turbo-lag associated with the exhaust driven turbochargers.
1.2. Literature Review on Air Charging Systems
1.2.1. Positive displacement supercharger
The most appealing asset of a positive displacement supercharger is its simplicity.
It is easy to install and doesn’t require complicated controls in most cases. It draws power
through mechanical connection to the crankshaft, and its rotational speed is directly
proportional to the rotational speed of the engine. The engine-compressor matching is
relatively easy, and the boost pressure is almost constant over the entire range of engine
operating speeds. Therefore, the torque curve is flat, and the turbo-lag problem is
completely overcome. In effect, a supercharged engine behaves as a naturally aspirated
engine with a larger displacement volume.
It is this linearity that makes designing and predicting its boosting characteristics
relatively easier than turbocharging. However, a supercharged engine consumes more
fuel than a turbocharged engine with comparable power since the supercharger draws
power directly from the engine crankshaft. Another weakness of the supercharger, the
parasitic loss, also comes from its simplicity. Since it is always connected to the
crankshaft even when the boost is not needed, the parasitic losses become problematic
especially at idle and part load conditions. Miyagi et al. [36] showed that for a Lysholm
compressor, 70-80% of the parasitic losses come from unnecessary pumping. Therefore,
it is important to minimize the airflow losses for these superchargers.
7
The most common types of positive displacement superchargers are the Roots
blower and the Lysholm compressor. They are also known as the Roots type supercharger
and screw type supercharger, respectively. The screw type compressor has two rotors, a
male and a female, forming a set of chambers between themselves and the housing. The
volume of the chamber decreases during the rotation and thus compresses the air that is
trapped inside the chamber. The shapes of the two male and female rotors are very
complex and difficult to manufacture. Thus, the cost of the Lysholm compressor is
considerably higher than that of the Roots blower, making it less common. Unlike the
Lysholm compressor, the Roots type blower has two similar rotors forming discrete
volumes but with constant volume. Modern Roots type blowers have three lobes instead
of two, and twisted lobes have become more common.
The Lysholm compressor has higher adiabatic (ηad) and total (ηtotal) efficiency
than the Roots type blower. Takabe et al. [37] shows ηtotal = 70% for the Lysholm
compressor and ηtotal = 50% for the Roots blower, in spite of the lower mechanical
efficiency of the Lysholm compressor due to its higher step up gear ratio. The difference
in efficiency comes from their distinctive compression mechanisms. Unlike the near
adiabatic internal compression of Lysholm compressor, for the Roots blower, the
compression takes place at the outlet as the air exits the blower. This condition is more
comparable to isochoric condition (constant volume process) than adiabatic condition,
thus resulting in lower efficiency and higher heat loss.
However, the actual efficiency of the Lysholm compressor varies with engine
operating condition. In order to fully utilize the higher efficiency of Lysholm compressor,
the charge pressure at the compressors outlet has to be same as the intake manifold
8
pressure. Otherwise, the discharged air must go through either isochoric compression or
isochoric expansion inside the intake manifold, which is known to be less efficient. As a
result, the overall efficiency becomes somewhere between adiabatic and isochoric
efficiency.
1.2.2. Centrifugal compressor as a supercharger
The centrifugal compressor is another type of supercharger that works on a
different principle. It is a dynamic machine, whereas the Lysholm compressor and the
Roots type blower are both positive displacement pumps. The air is accelerated very
rapidly by the impeller and then carefully diffused to recover the kinetic energy as static
pressure. Therefore, the centrifugal compressor operates on internal compression. The
isentropic efficiency of the centrifugal compressor matches or sometimes exceeds that of
the Lysholm compressor [38]. It is very compact in size and significantly less expensive
to manufacture compared to the other types of superchargers.
However, the boosting characteristics of the centrifugal compressor are very non-
linear and peaky when operating with internal combustion engines. It also requires very
high speed to achieve useful boost. In addition, in order to achieve such high speed, well
above 100,000 rpm, in a short period of time, substantial portion of the power must be
wasted on just overcoming the inertia of the compressor during acceleration. The high
speed also demands a gearbox. Therefore, the engine must overcome the combined
inertia of the compressor and the gearbox. This requires that the gearbox must have very
low inertia and can handle very high speed. Therefore, the cost of such gearbox offsets
the cost savings from the compressor unit. This is why this type of compressor is less
common than the other types.
9
1.2.3. Electrically driven supercharger
Electric assist has been used in two ways, either by having an extra electrically
driven supercharger supporting the turbo at low loads and during transients or by having
the electric motor attached directly on the turbocharger shaft. In this study, a centrifugal
compressor is driven electrically by directly attached electric motor to support the
turbocharger at low speeds and transient conditions. This type of arrangement offers a
faster response due to the fact that the rotor of the electric motor can have a lower inertia
because it is not connected to the turbine wheel. It also offers the possibility of higher
boost pressures without variable compressors if it is fitted in series with the regular
turbocharger. A third advantage is that the electric motor doesn’t have to stand as high
temperature as for the electrically assisted turbocharger since it is not in direct contact
with the hot exhaust gas.
1.2.4. Single-stage turbocharging
The transient behavior of a single-stage turbocharger can be improved by
turbocharger development. However, optimizing the flow through blade angles etc. is a
continuous process that has been going on for many years, so no dramatic improvements
are to be expected within a small time frame.
A fixed geometry turbine is not capable of supplying enough power to the
compressor for the boost pressure required for low speed and during transient conditions.
In addition, the flow range of a centrifugal compressor is a limiting factor, and if higher
boost pressures are demanded, it will be even more difficult to achieve satisfactory width
of the usable range since the width of the compressor map becomes narrower as the boost
pressure approaches its maximum.
10
The primary motive for using variable geometry turbines in automotive
applications is to reduce turbo-lag. Even though both the spark ignition engine and the
Diesel engine benefit from this technology, the high exhaust gas temperature in spark
ignition engines have prevented the variable geometry mechanism from being widely
used [39].
Variable geometry turbocharging in Diesel engines has largely overcome the
turbo-lag issue. The dominant VGT technology for Diesel applications is the Variable
Nozzle Turbine (VNT), which is a system that uses pivoting vanes to change the speed
and angle of the exhaust gas as it enters the turbine rotor.
By using variable geometry turbine, the exhaust energy absorbing capabilities of
the turbine is increases substantially, resulting in vast improvements especially during
transients. This is what lies behind the success of passenger car Diesel engines during the
decade. Many research papers are published about the variable geometry turbines [26, 39-
42]. The flow range of the compressor can also be improved though the use of variable
nozzle compressor [43].
As the turbine power increases at low speeds, and subsequently on low mass
flows, the compressor will eventually run into surge. In order to avoid surge, the
compressor maps must be widened. One of the methods to widen the compressor map is
to use variable geometry guide vanes at the compressor inlet. With the variable inlet
guide vanes, the compressor can operate at higher boost level for lower mass flows
without surge.
SEQUENTIAL SYSTEMS - The primary purpose of sequential turbocharging is
to improve transient response at low engine speed. Twin turbocharging also improves the
11
transient response due to the lower inertia compared to the single turbocharger with
similar flow capacity. However, the improvement is much more significant with
sequential turbocharging since only one turbocharger is used at low engine speed instead
of two. Tashima et al. [29] showed that the new sequential twin turbocharger used in
Mazda RX-7 reached the maximum boost pressure 30% faster than the conventional
turbocharger used in the previous model in acceleration test, and improved engine
maximum power by 25% as well.
Backlund et al. [44] claimed that the series-sequential system was preferable to
parallel-sequential system due to rough transition from single to twin turbocharger
operation of the parallel-sequential system. However, Tashima et al. [29] showed that the
pressure drop during the transition was almost eliminated in the parallel-sequential
system by allowing the secondary turbocharger to accelerate before the change-over.
Additionally, the parallel-sequential system has wider flow range than the series-
sequential system. The series-sequential system is essentially a two-stage turbocharging
system, and thus has narrower flow range while it allows for higher boost. Therefore, the
parallel-sequential system is suitable for applications that require wider flow range but
lower boost pressure, such as spark ignition engines, and the series-sequential system for
higher boost applications such as Diesel engines.
1.2.5. Dual-stage turbocharging
Dual-stage turbocharging offers several advantages over single-stage
turbocharging when it is applied properly. Improved specific power level across a broad
speed range is an immediate benefit of the dual-stage turbocharging applied to Diesel
engines [2, 9, 30], as the boost level reached with dual-stage turbocharging system is
12
much higher than single-stage turbocharging system can provide. Unlike spark ignition
engines, Diesel engines benefit from increased boost level in excess of 4 bar as the boost
level is only limited by the peak cylinder pressure.
Dual-stage turbocharging also provides better overall efficiency at high intake
manifold pressure compared to single-stage turbocharging as the compression is done in
two stages instead of one. At high intake manifold pressure in excess of 3.5 bar or more,
the efficiency of single-stage turbocharger becomes unacceptably low whereas the dual-
stage turbocharger operates more efficiently as the pressure ratio at each stage is well
within the efficient region in the performance map. This two stage compression also
effective reduces the likelihood of compressor surging. Since the pressure ratio is divided
into two smaller steps while the mass flow rate is unaffected, the compressor operation is
more robust in terms of surge limit.
In addition, transient behavior of a dual-stage turbocharged engine is improved
because of the combination of a smaller high pressure turbocharger and a larger low
pressure turbocharger [9, 30]. By configuring a relatively small high pressure
turbocharger with a much larger low pressure turbocharger, the dual-stage turbocharging
system provides significantly better boosting characteristics at both steady state and
transient conditions. The smaller turbine at high pressure stage provides more power to
the compressor compared to the single stage counterpart, thus enabling higher boost at
both the early stage of acceleration and the steady state low speed operation. Lower
moment of inertia of the smaller high pressure turbocharger also contributes to the overall
fast response of the dual stage turbocharger performance.
13
1.3. Motivation and objectives
Considering that the fuel efficiency and CO2 reduction are at the top of the agenda
as the fuel cost continues to escalate and concerns grow over future energy supply and
global warming, the recent popularity of Diesel engines seems quite natural. However,
the specific power of Diesel engines are inherently inferior to the spark ignition engines,
and they have been notorious for NVH related issues and emissions. Even though recent
advancements in Diesel engine technologies such as variable geometry turbines, common
rail injection systems, and multiple injection strategies have mostly solved the problems,
the deficiency in specific power has yet to be addressed. In order to increase the specific
power of modern Diesel engines, dual-stage turbocharging must be applied as the air
supply to the engine is the only remaining limiting factor.
Even though dual-stage turbocharging offers many advantages over single-stage
turbocharging, increased cost, complexity of the system, and very challenging nature of
matching procedure have prevented them from widely spread use so far. Furthermore, in
most of the published studies on dual-stage turbocharging, matching procedure has been
very rarely discussed as the matching is mostly done by combining available
turbochargers in a trial-and-error fashion [9, 45], even though careful matching of the
turbochargers is very important to achieve optimal engine performance. A non-optimal
matching of dual stage turbochargers will lead to poor performance at low speed, part
load conditions, since the pressure ratio per stage is even lower than a single-stage system
[38].
Interestingly, the most recent comprehensive study on dual-stage turbocharger
matching dates back to 1970s by Benson et al. [46]. In their study, the matching was
14
done using a lookup table type engine model based on the experimental data obtained
with externally blown air supply. However, the lookup table type engine model used in
the study lacked the fidelity and resolution required for accurate prediction of
turbocharger performance even with the comprehensive set of experimental data used to
construct the engine model. Since the matching for dual-stage turbocharger involves two
sets of turbochargers and interactions between high pressure and low pressure stages as
well as interactions between compressors and turbines, and the error in predicting
turbocharger operation multiplies as it affects the other stages as well, the accuracy of the
engine system model is more crucial for dual-stage turbocharger matching. More recent
advances in modeling and simulation, as well as availability of turbomachinery capable
of providing cost-effective solutions for dual stage systems motivates a new approach
pursued in this study.
Dual-stage turbocharging system with only fixed geometry turbochargers on both
stages still needs improvement when it is to be used in place of larger displacement
engines especially at low engine speed and transient conditions. Although it is preferable
to use exhaust driven turbochargers in terms of efficiency, by joining several different
types of charging devices with the fixed geometry turbocharger, some of the
shortcomings of each devices can be reduced or cancel their drawbacks.
Turbochargers usually lack the low speed boost, as centrifugal compressors
require substantially high rotational speed in order to produce meaningful boost. This is
where the other types of charging systems can enhance the overall boosting
characteristics of the system. Mechanically driven superchargers can provide adequate
boost even at low engine speed taking advantage of its direct connection to the output
15
shaft. The combined effect of the whole system is more consistent boost over the entire
operating range of the engine.
Therefore, the objectives of this research are
• Develop dual-stage turbocharger matching method for a downsized 4.5 l V6
Diesel engine in order to achieve a dual-stage system that performs well both in
low engine speed and transient conditions as well as in the rated condition
compared to the baseline 6.0 l V8 engine in order to achieve engine downsizing
without severe compromise in performance.
• Demonstrate the effectiveness of the matching method by showing efficient
operations of both the high pressure and low pressure turbochargers in a
downsized engine with dual-stage turbocharging system.
• Study the effect of different types of boost control options for a dual-stage system
on the engine performance.
• Investigate hybridization of the dual-stage boosting systems (utilizing different
types of boosting devices) to further improve the low end torque and transient
response, which are often problematic when the engine is aggressively downsized.
• Investigate various types of hybrid boosting systems and compare them with dual-
stage turbocharging system to provide fundamental understandings of dual-stage
boosting options.
16
CHAPTER 2. SIMULATION OF TURBOCHARGED DIESEL ENGINE
2.1. Introduction
The engine system model used in the study is a physics-based thermodynamic
zero-dimensional model originally developed by Assanis et al. [47], and has been used
very successfully for predictions of steady-state engine operation. The model contains
simplified physical descriptions of combustion based on phenomenological models and
engineering correlations that have been validated against test results from Diesel engines
of various sizes, ranging from highway truck engines [47] to large locomotive engines
[48]. An engine dynamics sub-model is added to the model to further extend its capability
to transient performance predictions on crank-angle basis [49]. It is then modified to
include the dual-stage boosting systems in order to evaluate and analyze the interaction
between the boosting system and the engine. Considering that the dual-stage boosting
systems evaluated in this study are mostly non-existent and require extensive matching
and system tuning, the simulation based approach is a cost-effective alternative to an
experimental procedure.
In the engine model, it is assumed that the properties of the gas inside the cylinder
is uniform and depends only on the pressure, temperature and fuel contents. Compared to
the computational fluid dynamics and multi-dimensional engine simulation models, the
zero-dimensional model used in this study is computationally much faster and often more
reliable as this type of model is based on empirical correlations, and can be used in the
17
analysis of the transient characteristics of the boosting systems. However, it is not
capable of predicting emissions related results, and gas dynamics effect. Therefore, the
effect of cylinder-to-cylinder variation and tuning effect (dynamic resonance effect)
cannot be studied with this type of engine simulation models.
2.2. Description of the simulation model
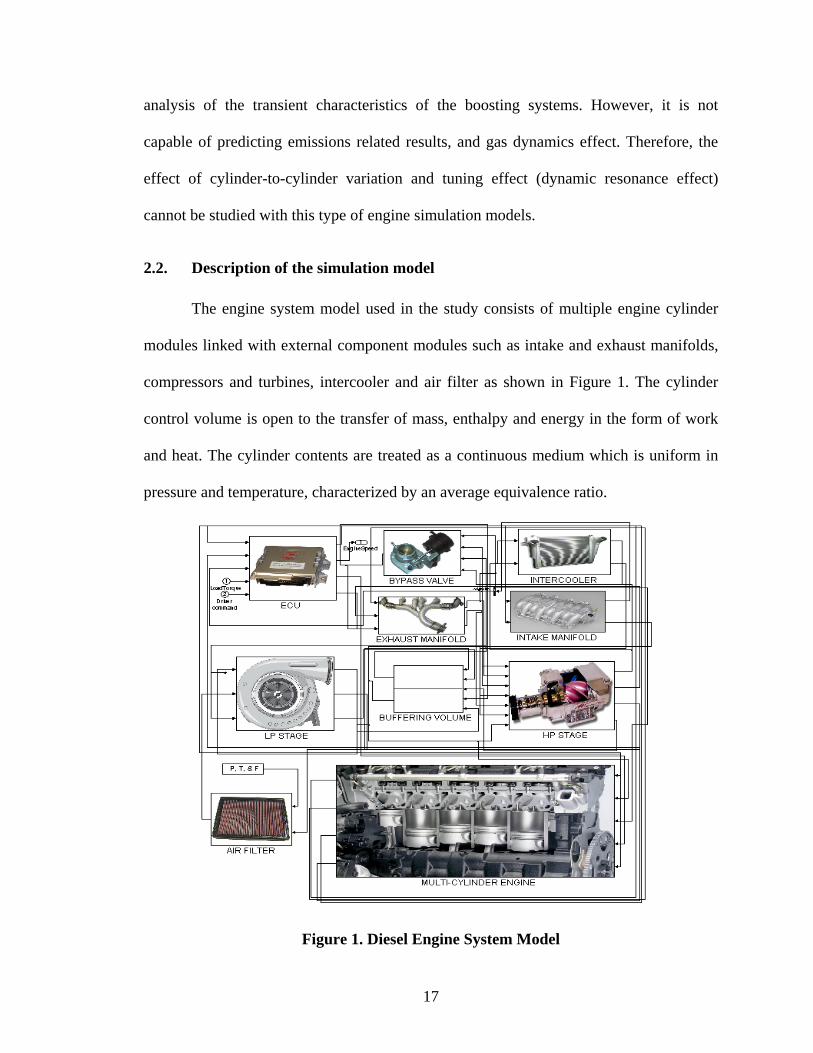
The engine system model used in the study consists of multiple engine cylinder
modules linked with external component modules such as intake and exhaust manifolds,
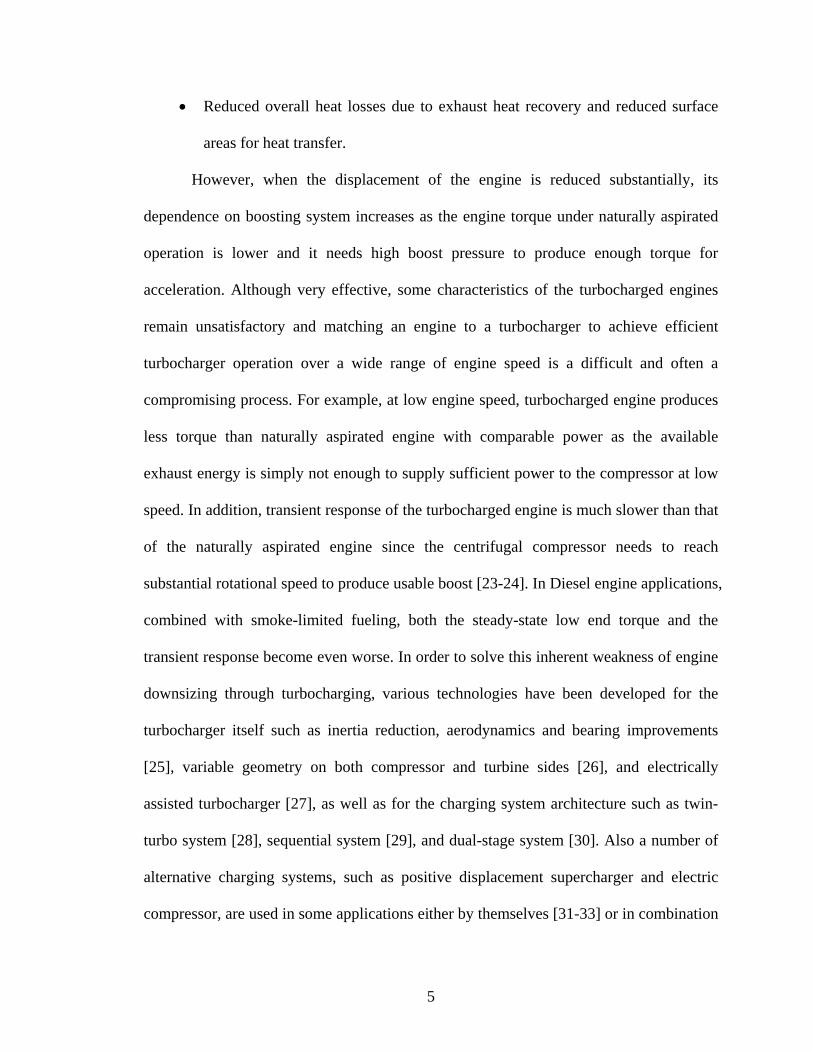
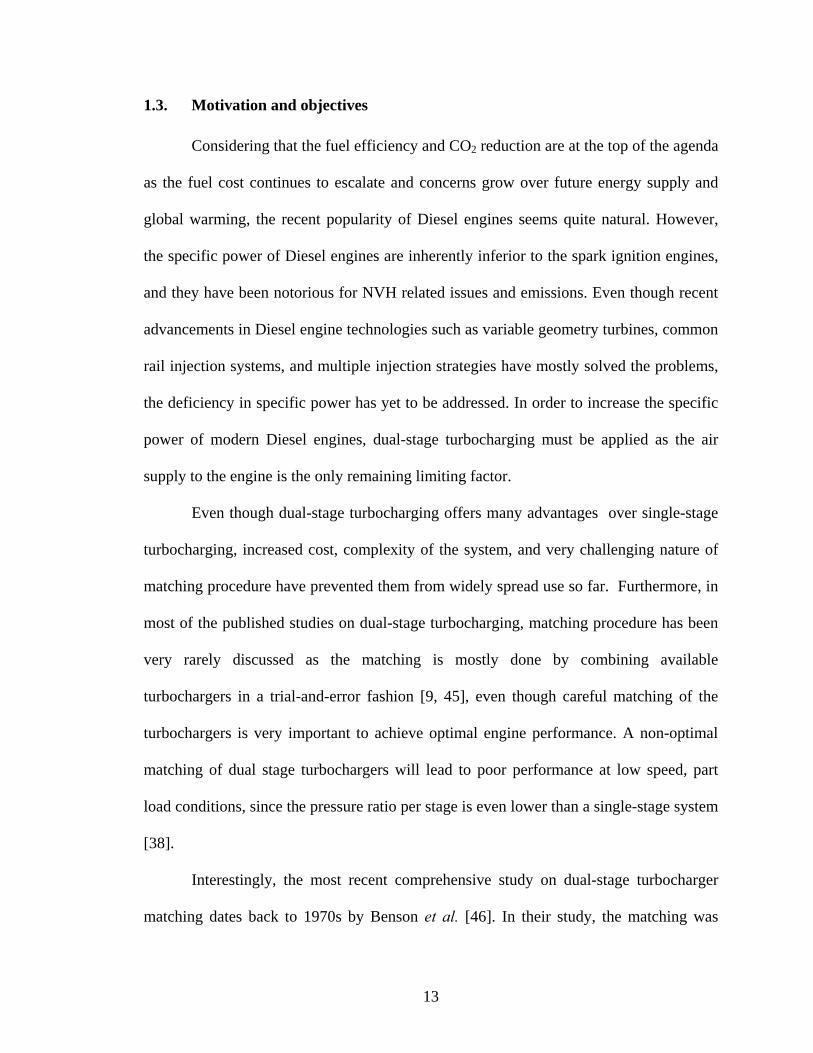
compressors and turbines, intercooler and air filter as shown in Figure 1. The cylinder
control volume is open to the transfer of mass, enthalpy and energy in the form of work
and heat. The cylinder contents are treated as a continuous medium which is uniform in
pressure and temperature, characterized by an average equivalence ratio.
Figure 1. Diesel Engine System Model
18
Thermodynamic properties of the cylinder contents are obtained by empirical
correlation based on the composition of the fuel-air mixture. Throughout the cycle, the
cylinder is treated as a variable volume plenum, spatially uniform in pressure.
Furthermore, the cylinder contents are represented as one continuous medium by defining
an average equivalence ratio and temperature at all times. The cyclic processes in the
cylinders are represented by more fundamental and phenomenological models of
turbulence, combustion and heat transfer. The filling and emptying approach is applied to
the intake and exhaust manifolds.
The Diesel four-stroke cycle is treated as a sequence of continuous processes:
intake, compression, combustion (including expansion), and exhaust. The intake process
begins when the intake valve opens and ends when the intake valve closes. The
compression process begins at the intake valve closing and ends at the time of ignition.
The combustion process begins when ignition occurs and ends when the exhaust valve
opens. The exhaust process begins upon exhaust valve opening and ends when the intake
valve opens and not when the exhaust valve closes.
Mass flow rate through intake and exhaust valves are determined by quasi-steady,
adiabatic, one-dimensional compressible flow equations. Watson correlation is used to
represent the combustion process as a uniformly distributed heat release process. Unlike
intake, exhaust, and compression processes, where the convection is the only mode of
heat transfer, during the combustion process, heat transfer from the gas to the cylinder
wall occurs in two modes, convection and radiation. The convective heat transfer rate is
predicted from a Nusselt-Reynolds number correlation for steady turbulent flow in a pipe
based on the characteristic velocity concept [47]. The radiative heat transfer rate is
19
calculated from the apparent radiant temperature and wall temperature. The specifications
of the engine are summarized in Table 1.
Table 1. Engine Specification Engine Type Diesel, 4-StrokeDisplacement 4.5 l V6Bore 95 mmStroke 105 mmConnecting Rod Length 176 mmCompression Ratio 16.0 / 18.0Maximum Speed 3300 rpmIntake Valve Opening -38o
Intake Valve Closing 252 o / 150 o Exhaust Valve Opening 464 o
Exhaust Valve Closing 768o
2.2.1. Air filter model
Air filter is modeled as a flow restriction. The mass flow through the air filter is a
quasi-one dimensional, adiabatic, steady, inviscid flow through a nozzle [50, 51].
⎥⎥⎥
⎦
⎤
⎢⎢⎢
⎣
⎡
⎟⎟⎠
⎞⎜⎜⎝
⎛−
−⎟⎟⎠
⎞⎜⎜⎝
⎛=
−γγ
γ
γγ
1
0
1
0
21
0
0_ 11
2p
pp
pRT
pAm AFAFeffAF
AF& for 1
0 12 −
⎟⎟⎠
⎞⎜⎜⎝
⎛+
>γγ
γppAF (1)
11
21
0
0_
12 −
+
⎟⎟⎠
⎞⎜⎜⎝
⎛+
=γγ
γγ
RT
pAm effAF
AF& for 1
0 12 −
⎟⎟⎠
⎞⎜⎜⎝
⎛+
≤γγ
γppAF (2)
The flow area and discharge coefficient of the air filter is lumped together as
AFAFDeffAF ACA ×= __ (3)
in the flow rate equation. The ratio of pressure in the air filter to ambient pressure
determines whether the flow is choked or not. Mass flow rate increases as the pressure
ratio increases until the speed of the flow reaches the speed of sound at the throttle. Then
the flow becomes choked. This critical pressure ratio is about 0.528 for ambient air. The
pressure ratio also determines whether the flow is forward or backward. The flow is
20
reversed when the pressure ratio is greater than 1. Same set of governing equations are
also used to model exhaust system in order to simulate exhaust back pressure.
2.2.2. Turbocharger model
Compressor and turbine operating maps are used to determine the mass flow rate
and efficiency from the rotor speed and the pressure ratio across the turbomachinery at
every time step. The power consumed by the compressor and the power developed by the
turbine are calculated from the mass flow rate and the enthalpy change across the device.
The compressor and turbine modules are linked by turbocharger dynamics module that
determines the rotor speed from the energy balance between the compressor and the
turbine.
The boosting system is then connected in a series configuration. The boost control
is achieved utilizing either a bypass valve between high and low pressure turbines or
other means with the hybrid configurations. The bypass valve is activated when the boost
reaches a preset level in order to keep the peak cylinder pressure below the maximum
allowable limit (180 bar).
Buffering volume modules are placed between the compressors and the turbines,
which determine inlet and outlet conditions for each turbomachinery. The buffering
volume modules take mass and energy fluxes as inputs and calculate pressure and
temperature within the control volume. They are then used as outlet conditions for
upstream turbomachinery and inlet conditions for downstream turbomachinery. The
temperature drop in the intercooler is determined from the inlet air temperature, specified
wall temperature and cooling efficiency. The pressure drop in the intercooler is calculated
using an orifice model.
21
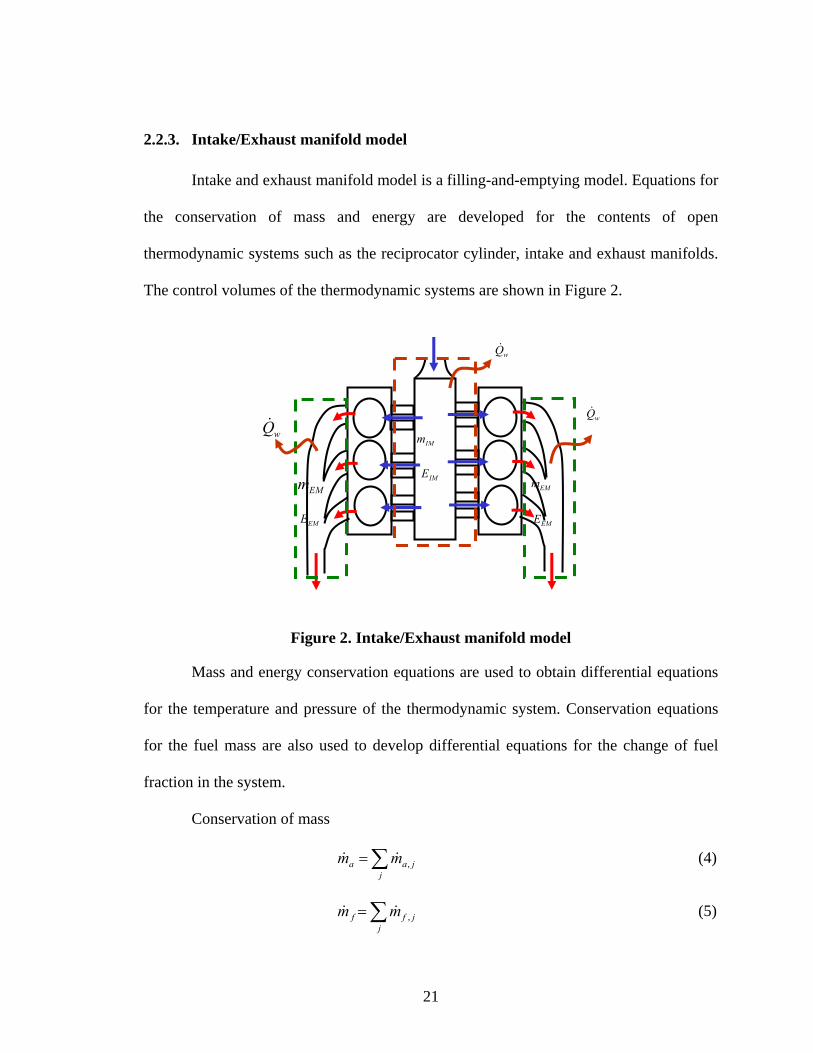
2.2.3. Intake/Exhaust manifold model
Intake and exhaust manifold model is a filling-and-emptying model. Equations for
the conservation of mass and energy are developed for the contents of open
thermodynamic systems such as the reciprocator cylinder, intake and exhaust manifolds.
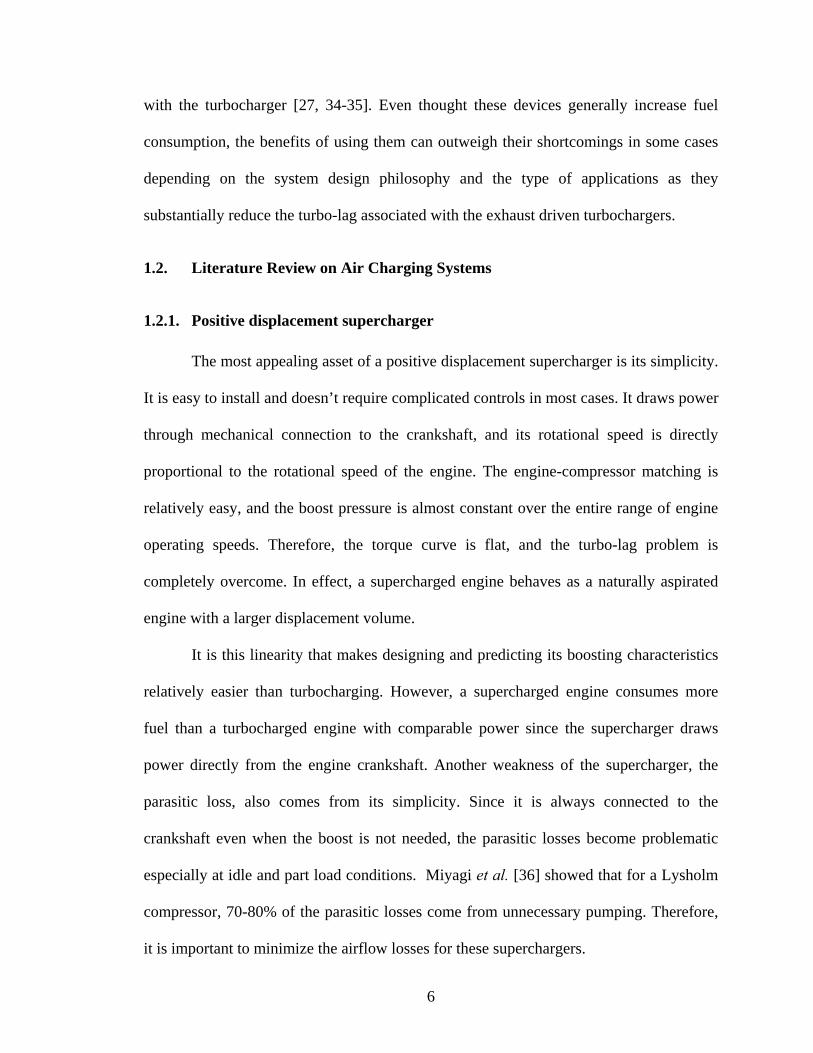
The control volumes of the thermodynamic systems are shown in Figure 2.
Figure 2. Intake/Exhaust manifold model
Mass and energy conservation equations are used to obtain differential equations
for the temperature and pressure of the thermodynamic system. Conservation equations
for the fuel mass are also used to develop differential equations for the change of fuel
fraction in the system.
Conservation of mass
∑=j
jaa mm ,&& (4)
∑=j
jff mm ,&& (5)
IMm
EMm EMm
wQ&
wQ&
wQ&
EME
IME
EME
22
Conservation of energy
WQhmE wj
jj&&&& −−=∑ (6)
( ) ( )pVdtdmh
dtdE −=& (7)
hmVpQhmhm wj
jj &&&&& −+−=∑ (8)
Fuel fraction
fa
f
mmm
F+
= (9)
( )∑ −=j
jj FFmm
F && 1 (10)
Once the governing equations are set up in the FORTRAN code, they are
integrated and solved in MATLAB SIMULINK.
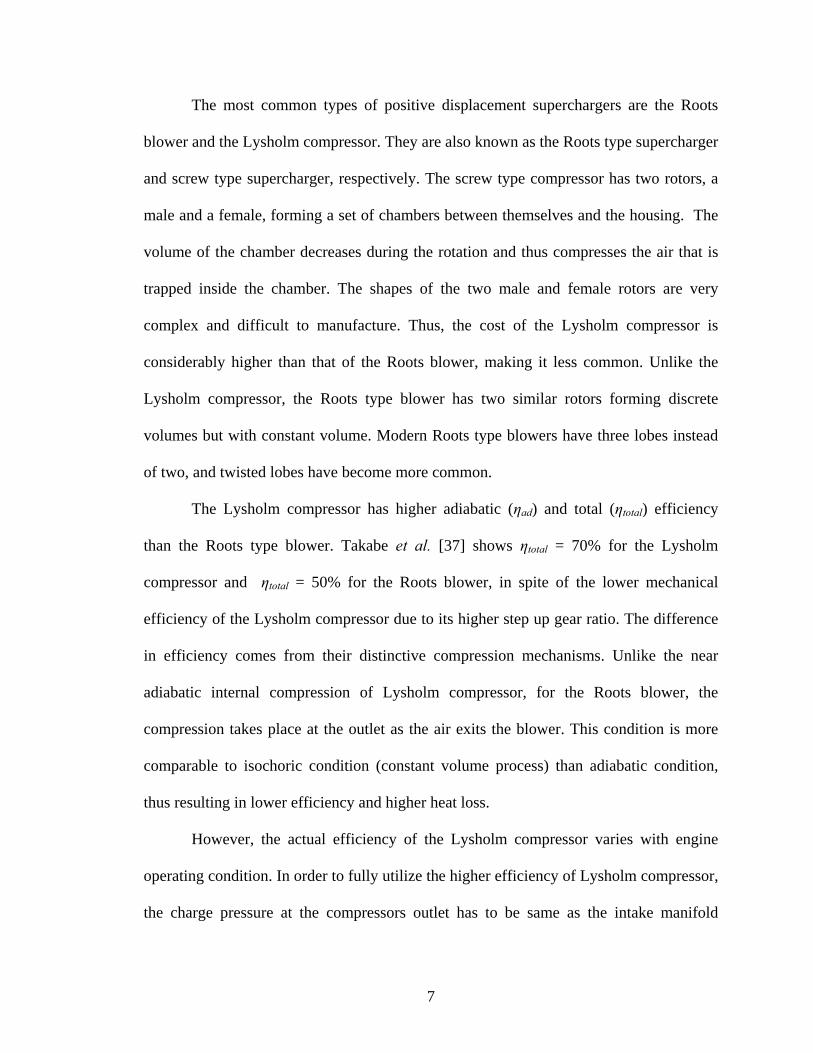
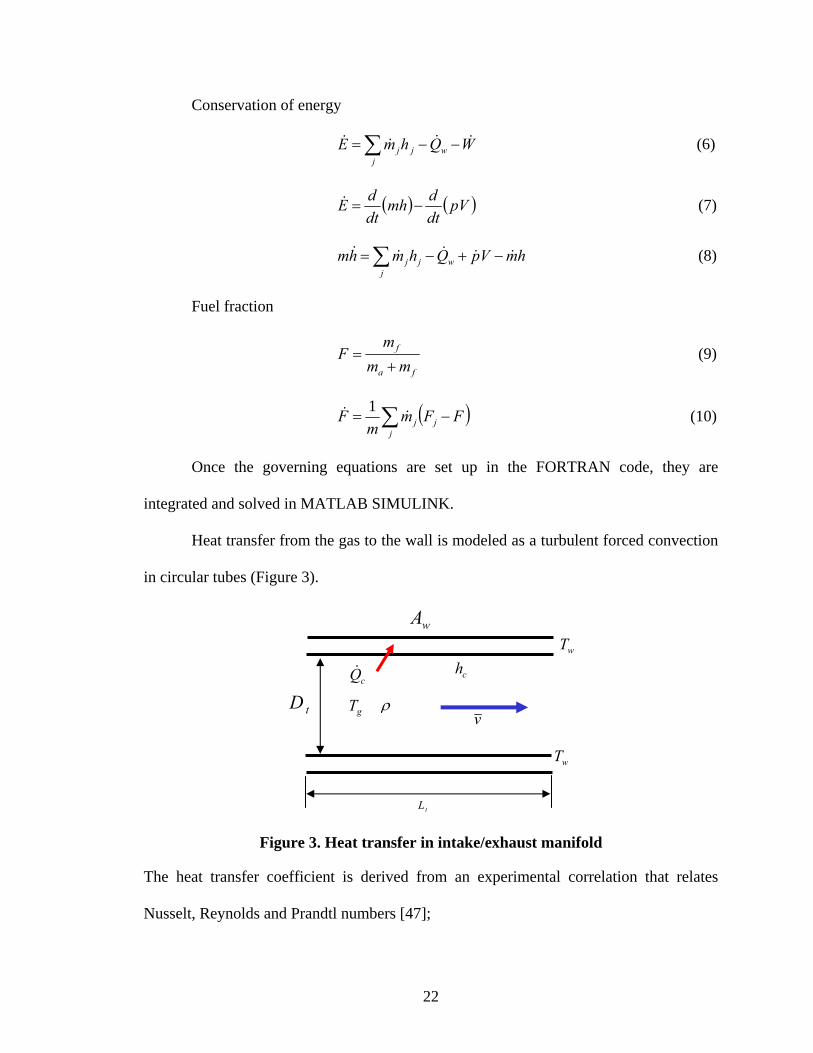
Heat transfer from the gas to the wall is modeled as a turbulent forced convection
in circular tubes (Figure 3).
Figure 3. Heat transfer in intake/exhaust manifold
The heat transfer coefficient is derived from an experimental correlation that relates
Nusselt, Reynolds and Prandtl numbers [47];
wT
gT
cQ&
wA
ch
wT
vρ
tL
tD
23
)( wgwcc TTAhQ −=& (11)
cbaNu PrRe= (12)
The constant, a accounts for entrance effects, pipe bends etc., and exponents b and c are
adjusted to fit experimental data.
The pressure drop is calculated using the friction factors and friction coefficients
for the geometry of the passage. For straight sections,
2
42v
DLfp ρ
=Δ (13)
2.0Re046.0
=f with μ
ρ Dv=Re (14)
where L and D are length and diameter of the passage respectively, ρ is bulk density, v
is average gas velocity. For bends, enlargement and contractions, friction coefficient, Kf
is used, and representative values are reported by Primus et al. [52].
2
2vKp fρ
=Δ (15)
2.2.4. In-cylinder process
Gas properties are calculated assuming ideal gas behavior. At low temperatures
(below 1000 K), the cylinder contents are treated as a homogeneous mixture of non-
reacting ideal gases. At high temperatures (above 1000 K), the properties of the cylinder
contents are calculated with allowance for chemical dissociation by assuming that the
burned gases are in equilibrium, using an approximate calculation method based on
hydrocarbon-air combustion.
The compression process is defined so as to include the ignition delay period, i.e.,
the time interval between the start of the injection process and the ignition point. The
24
total length of the ignition delay is related to the mean cylinder gas temperature and
pressure during the delay period by an empirical Arrhenius expression [47]. Combustion
is modeled as a uniformly distributed heat release process. The rate of heat release is
assumed to be proportional to the rate of fuel burning, which is modeled empirically.
Since the Diesel combustion process is comprised of a pre-mixed and a diffusion-
controlled combustion mechanism, Watson’s fuel burning rate correlation, consisting of
the sum of two algebraic functions, one for each combustion mechanism is used. The
fraction of the total fuel injected that is burnt by either mechanism depends on the length
of the ignition delay period and the engine load and speed.
Heat transfer is included in all the engine processes. Convective heat transfer is
modeled using correlations based on the Nusselt number for the turbulent flow in pipes.
The characteristic velocity and length scales required to evaluate the Reynolds number in
the correlation are obtained from a mean and turbulent kinetic energy model [47], hence
any changes in the flow field inside the cylinder directly affect the heat transfer process.
Radiative heat transfer is added during combustion. The steady-state inside wall surface
temperatures of the piston, cylinder head, and liner can be either specified or calculated
from a specification of the component wall structure.
The rate of change of pressure in the cylinder is a function of volume, temperature,
equivalence ratio, and mass change rate. And the rate of change of temperature is a
function of mass, volume, equivalence ratio, enthalpy flux, and heat transfer rate.
⎟⎟⎠
⎞⎜⎜⎝
⎛+
∂∂
−∂∂
−−∂∂
=mmT
TVV
pp
&&&&
& φφρ
ρρ
ρρρ 11 (16)
25
⎥⎥⎦
⎤
⎢⎢⎣
⎡⎟⎟⎠
⎞⎜⎜⎝
⎛−+−−⎟
⎠⎞
⎜⎝⎛ −= ∑
jwjj Qhm
BmBC
VV
Bh
mm
ABT &&&
&&& 11 φ (17)
where ⎟⎟⎠
⎞⎜⎜⎝
⎛−
∂∂∂∂
+= Tp cpTcA
ρρρ 1 (18)
( )Tcp
B ρρ
−∂∂
= 11 (19)
⎟⎟⎠
⎞⎜⎜⎝
⎛−
∂∂∂∂
+= Tcp
cCρρ
φρφ
1 (20)
These equations do not need an explicit heat release rate expression. However, they are
implicitly linked by burned fuel fraction, F, which appears in the equivalence ratio
equation.
( )saf
af
mmmm
=φ (21)
( ) ( )211
FF
mmsaf −
=&
&φ (22)
2.2.5. Valve flow
A quasi-one-dimensional, steady, adiabatic, inviscid flow model is used to
calculate mass flow rate through the intake and exhaust valves during the gas exchange
process.
21
1
1
2
1
1
221
1
1, 11
2
⎪⎭
⎪⎬
⎫
⎪⎩
⎪⎨
⎧
⎥⎥⎥
⎦
⎤
⎢⎢⎢
⎣
⎡
⎟⎟⎠
⎞⎜⎜⎝
⎛−
−⎟⎟⎠
⎞⎜⎜⎝
⎛=
−γγ
γ
γγ
pp
pp
RT
pAm effv
v& for 1
1
2
12 −
⎟⎟⎠
⎞⎜⎜⎝
⎛+
≤γγ
γpp (23)
11
21
1
1,
12 −
+
⎟⎟⎠
⎞⎜⎜⎝
⎛+
=γγ
γγ
RTpA
m effvv& for
1
1
2
12 −
⎟⎟⎠
⎞⎜⎜⎝
⎛+
>γγ
γpp (24)
26
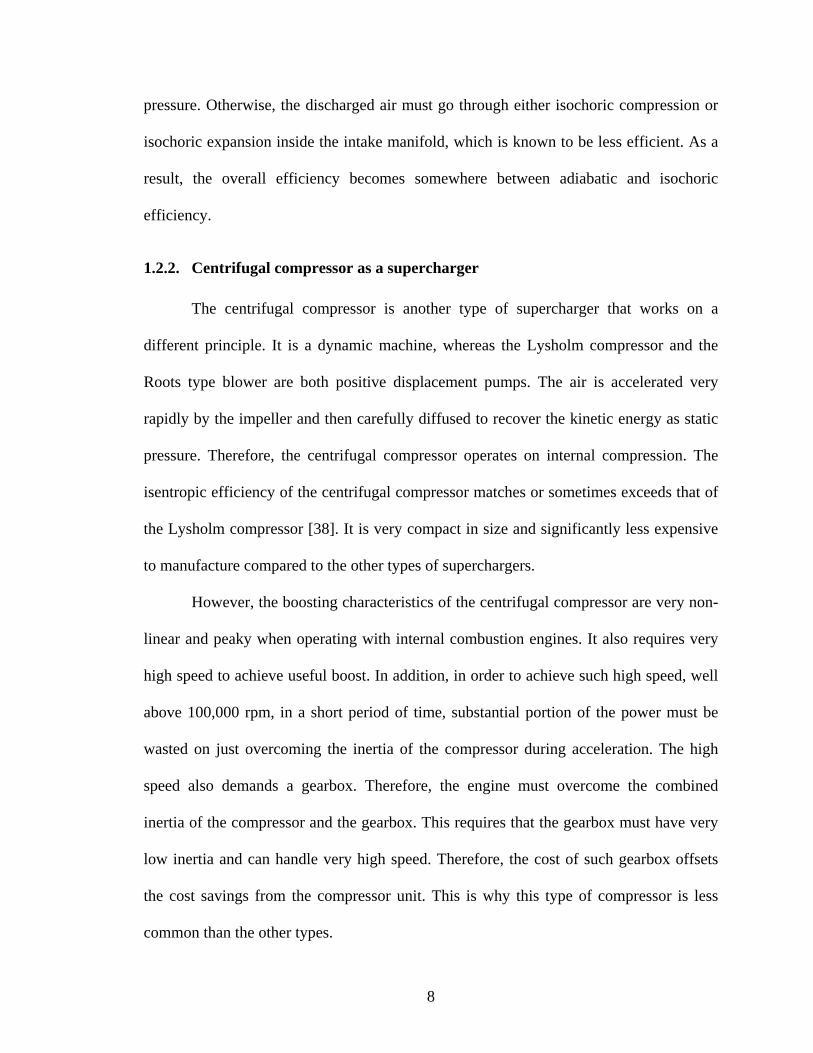
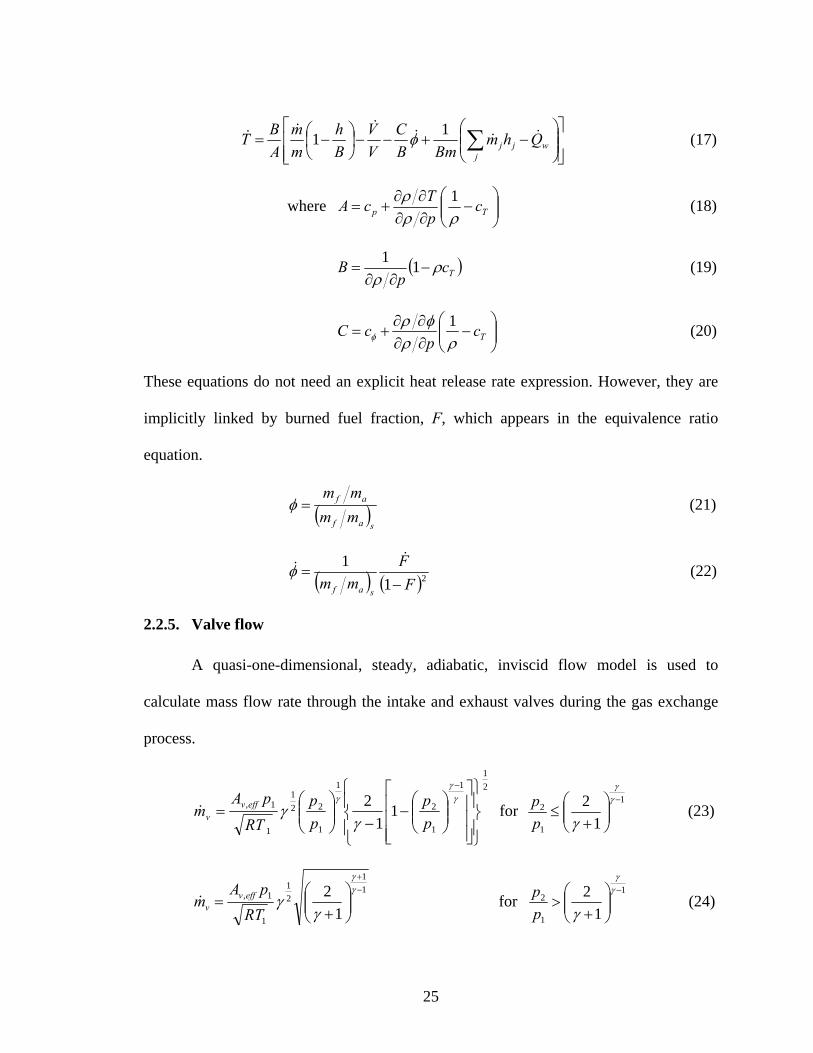
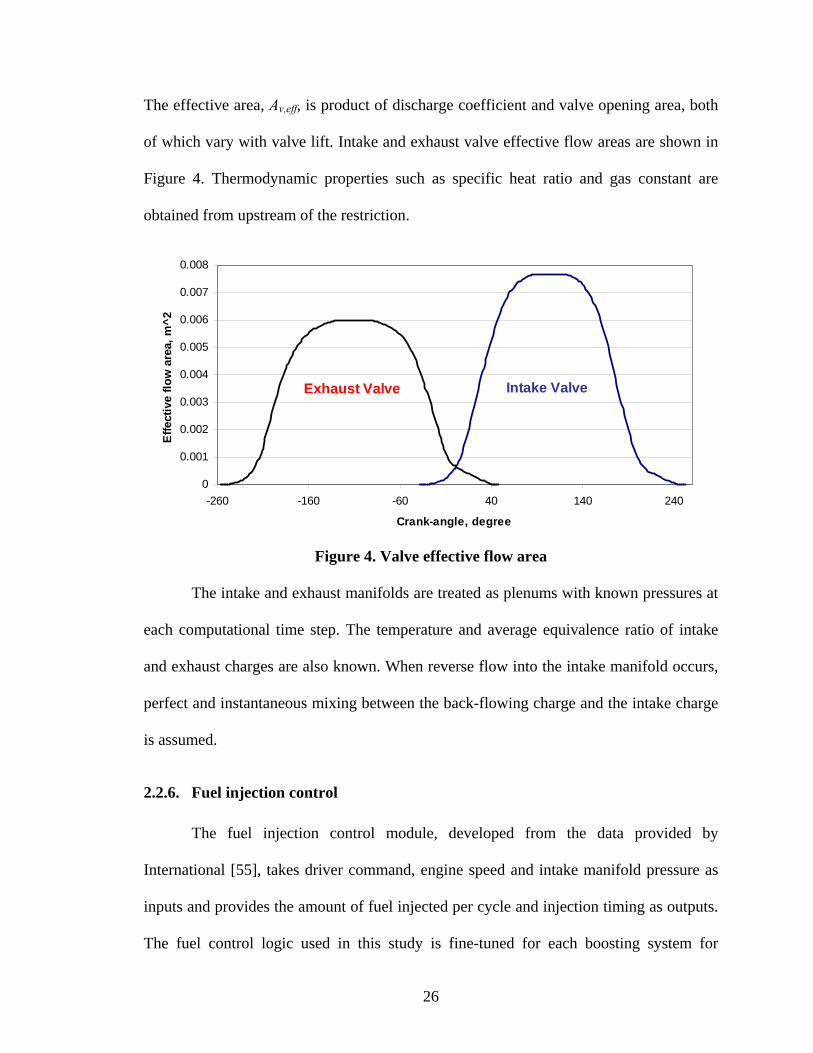
The effective area, Av,eff, is product of discharge coefficient and valve opening area, both
of which vary with valve lift. Intake and exhaust valve effective flow areas are shown in
Figure 4. Thermodynamic properties such as specific heat ratio and gas constant are
obtained from upstream of the restriction.
0
0.001
0.002
0.003
0.004
0.005
0.006
0.007
0.008
-260 -160 -60 40 140 240
Crank-angle, degree
Effe
ctiv
e flo
w a
rea,
m^2
Exhaust Valve Intake Valve
Figure 4. Valve effective flow area
The intake and exhaust manifolds are treated as plenums with known pressures at
each computational time step. The temperature and average equivalence ratio of intake
and exhaust charges are also known. When reverse flow into the intake manifold occurs,
perfect and instantaneous mixing between the back-flowing charge and the intake charge
is assumed.
2.2.6. Fuel injection control
The fuel injection control module, developed from the data provided by
International [55], takes driver command, engine speed and intake manifold pressure as
inputs and provides the amount of fuel injected per cycle and injection timing as outputs.
The fuel control logic used in this study is fine-tuned for each boosting system for
27
optimal performance. The correction of the amount of fuel based on the boost pressure or
density in the intake manifold is especially important during full load acceleration, when
turbo lag may cause the engine to operate with much low boost pressures than normally
experienced under corresponding steady-state conditions. An idle speed control module
governs the fuel flow rate to prevent engine from stalling at low load and low speed
condition.
2.2.7. Vehicle system model
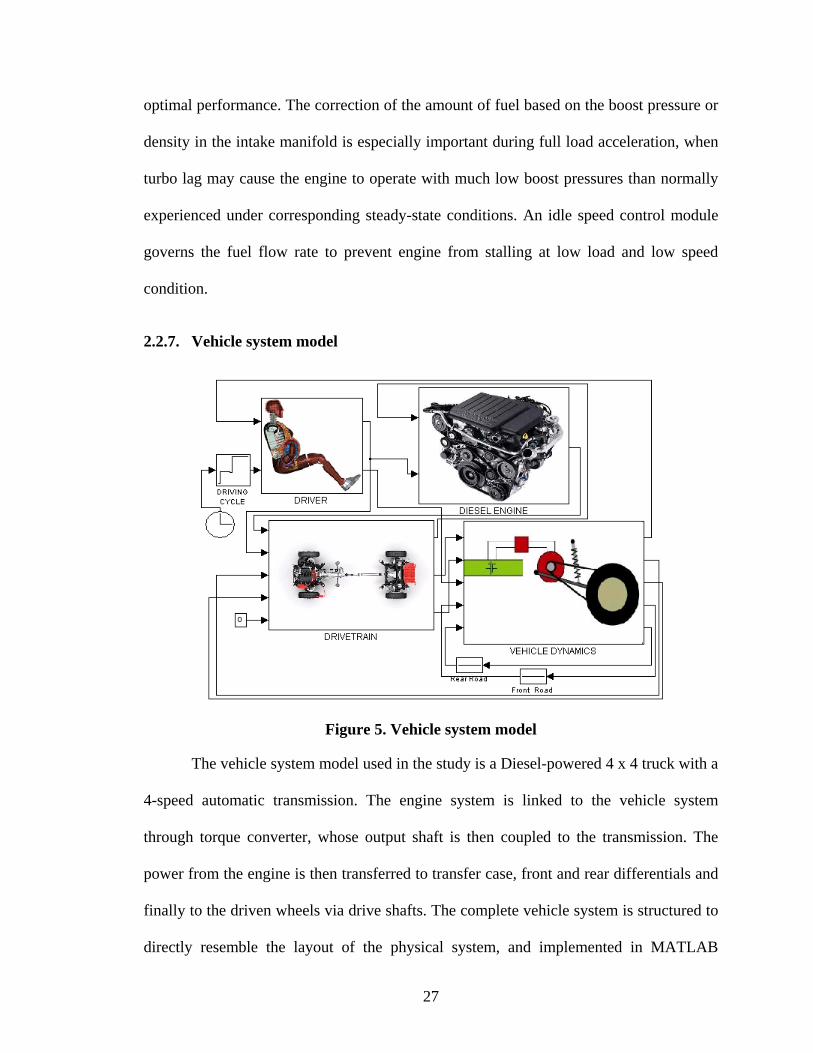
Figure 5. Vehicle system model
The vehicle system model used in the study is a Diesel-powered 4 x 4 truck with a
4-speed automatic transmission. The engine system is linked to the vehicle system
through torque converter, whose output shaft is then coupled to the transmission. The
power from the engine is then transferred to transfer case, front and rear differentials and
finally to the driven wheels via drive shafts. The complete vehicle system is structured to
directly resemble the layout of the physical system, and implemented in MATLAB
28
SIMULINK environment as shown in Figure 5. The driveline and vehicle dynamics
model are modeled in 20SIM, a bond graph modeling language, and converted to C code
[55]. It is then implemented in SIMULINK environment via S-functions.
Links between main modules represent physical parameters that define the
interaction between the components such shaft torque and angular velocity. The driver
module allows the feed-forward simulation to follow a prescribed vehicle speed schedule
by providing the acceleration and brake signal based on the specified speed setting and
the current vehicle speed.
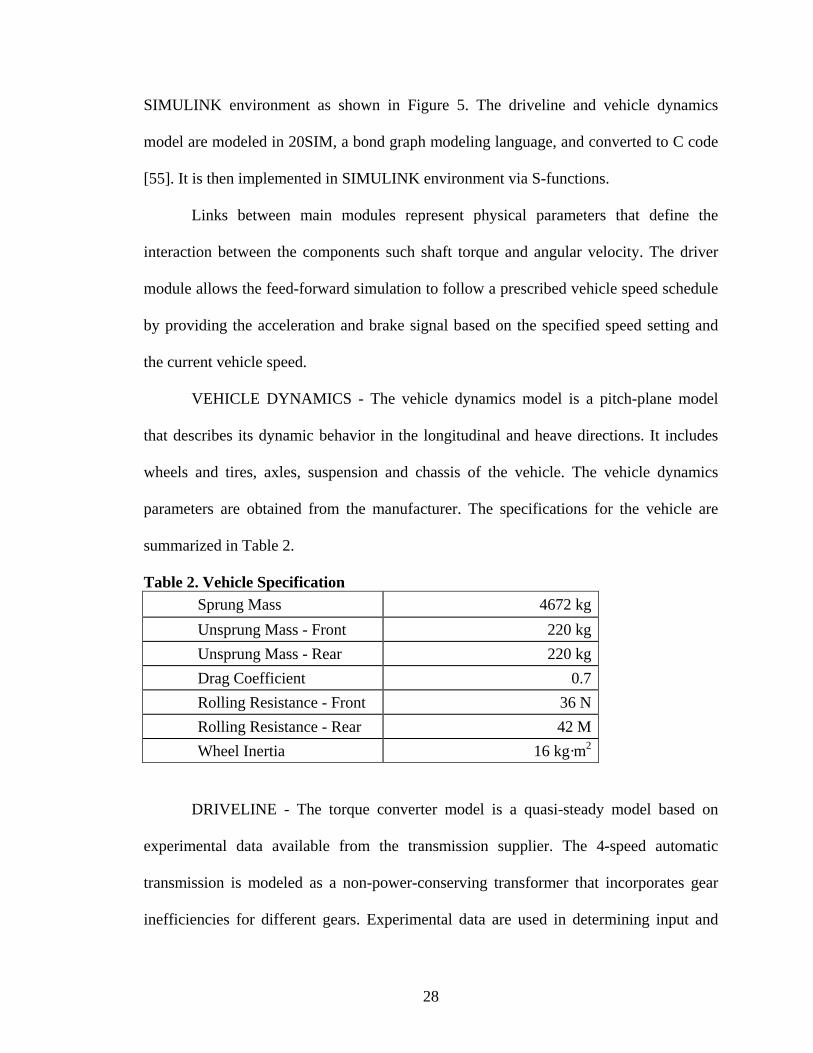
VEHICLE DYNAMICS - The vehicle dynamics model is a pitch-plane model
that describes its dynamic behavior in the longitudinal and heave directions. It includes
wheels and tires, axles, suspension and chassis of the vehicle. The vehicle dynamics
parameters are obtained from the manufacturer. The specifications for the vehicle are
summarized in Table 2.
Table 2. Vehicle Specification Sprung Mass 4672 kg Unsprung Mass - Front 220 kg Unsprung Mass - Rear 220 kg Drag Coefficient 0.7 Rolling Resistance - Front 36 N Rolling Resistance - Rear 42 M Wheel Inertia 16 kg·m2
DRIVELINE - The torque converter model is a quasi-steady model based on
experimental data available from the transmission supplier. The 4-speed automatic
transmission is modeled as a non-power-conserving transformer that incorporates gear
inefficiencies for different gears. Experimental data are used in determining input and
29
output inertias, stiffness and damping rates for transmission, propeller shafts, transfer
case, differentials and drive shafts. The shift logic consists of two sets of shift schedules,
one for up shifts and the other for downshifts. It takes vehicle speed and rack position as
inputs and provides gear selection as an output.
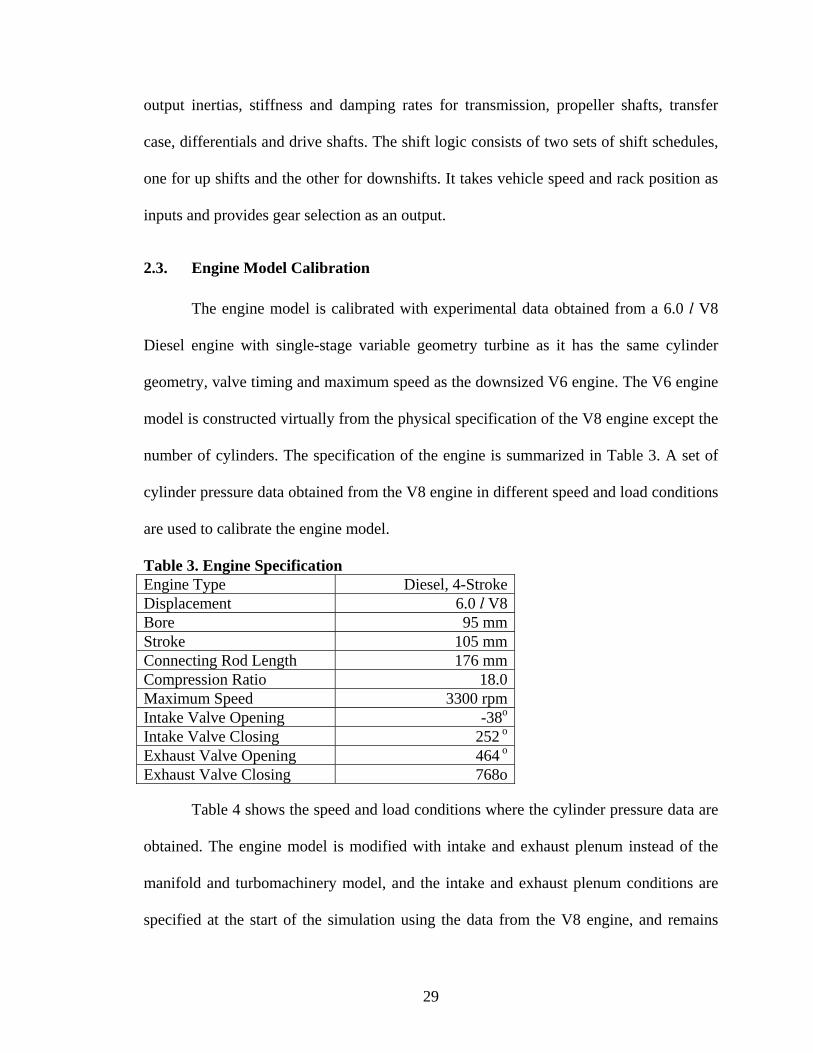
2.3. Engine Model Calibration
The engine model is calibrated with experimental data obtained from a 6.0 l V8
Diesel engine with single-stage variable geometry turbine as it has the same cylinder
geometry, valve timing and maximum speed as the downsized V6 engine. The V6 engine
model is constructed virtually from the physical specification of the V8 engine except the
number of cylinders. The specification of the engine is summarized in Table 3. A set of
cylinder pressure data obtained from the V8 engine in different speed and load conditions
are used to calibrate the engine model.
Table 3. Engine Specification Engine Type Diesel, 4-StrokeDisplacement 6.0 l V8Bore 95 mmStroke 105 mmConnecting Rod Length 176 mmCompression Ratio 18.0Maximum Speed 3300 rpmIntake Valve Opening -38o
Intake Valve Closing 252 o Exhaust Valve Opening 464 o
Exhaust Valve Closing 768o
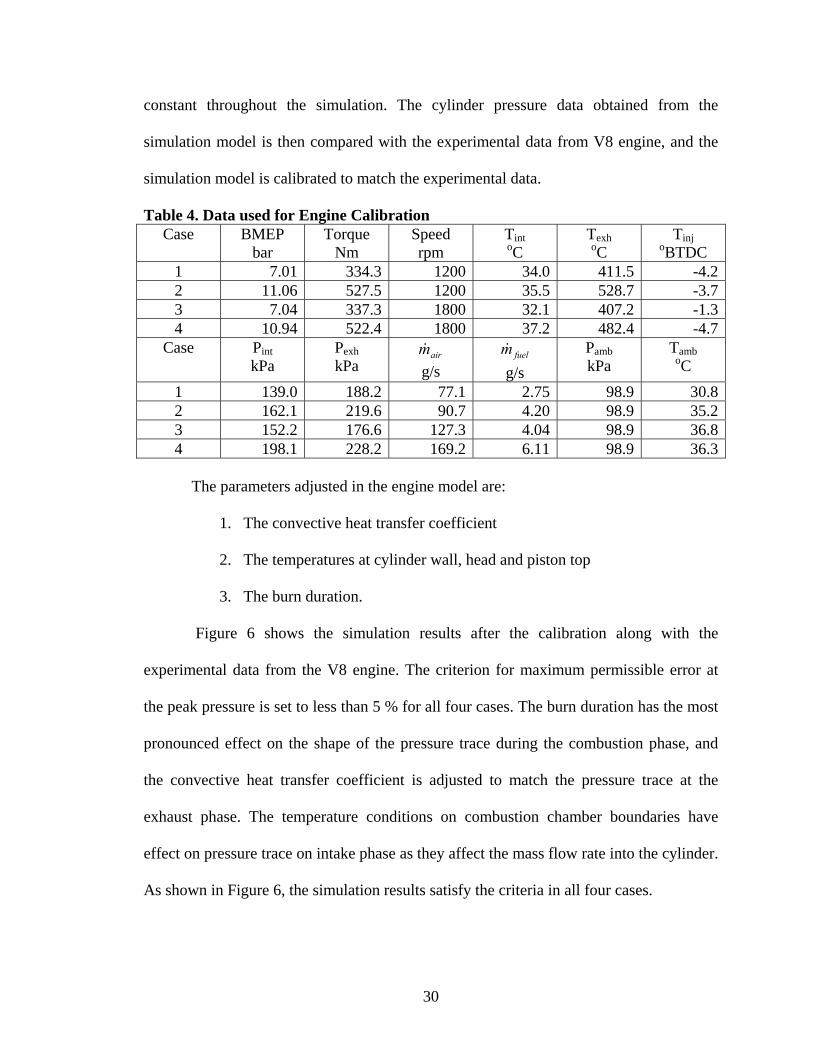
Table 4 shows the speed and load conditions where the cylinder pressure data are
obtained. The engine model is modified with intake and exhaust plenum instead of the
manifold and turbomachinery model, and the intake and exhaust plenum conditions are
specified at the start of the simulation using the data from the V8 engine, and remains
30
constant throughout the simulation. The cylinder pressure data obtained from the
simulation model is then compared with the experimental data from V8 engine, and the
simulation model is calibrated to match the experimental data.
Table 4. Data used for Engine Calibration Case BMEP
bar Torque
Nm Speed rpm
Tint oC
Texh oC
Tinj oBTDC
1 7.01 334.3 1200 34.0 411.5 -4.22 11.06 527.5 1200 35.5 528.7 -3.73 7.04 337.3 1800 32.1 407.2 -1.34 10.94 522.4 1800 37.2 482.4 -4.7
Case Pint kPa
Pexh kPa
airm& g/s
fuelm& g/s
Pamb kPa
Tamb oC
1 139.0 188.2 77.1 2.75 98.9 30.82 162.1 219.6 90.7 4.20 98.9 35.23 152.2 176.6 127.3 4.04 98.9 36.84 198.1 228.2 169.2 6.11 98.9 36.3
The parameters adjusted in the engine model are:
1. The convective heat transfer coefficient
2. The temperatures at cylinder wall, head and piston top
3. The burn duration.
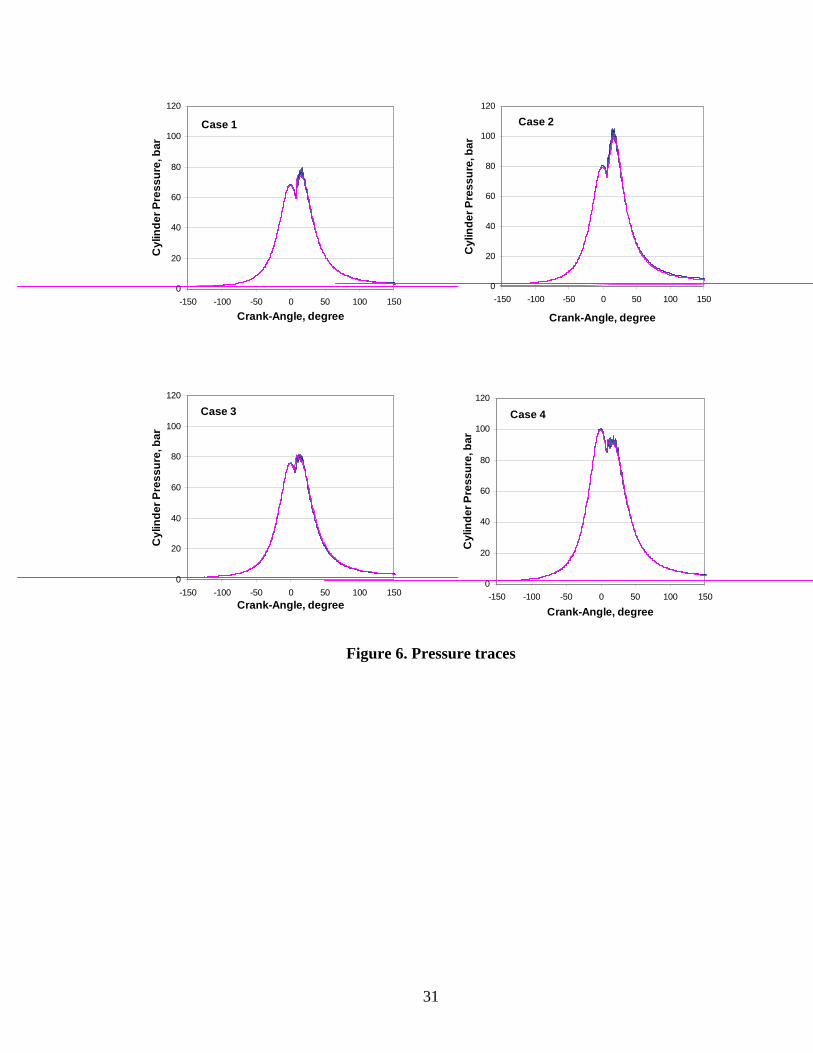
Figure 6 shows the simulation results after the calibration along with the
experimental data from the V8 engine. The criterion for maximum permissible error at
the peak pressure is set to less than 5 % for all four cases. The burn duration has the most
pronounced effect on the shape of the pressure trace during the combustion phase, and
the convective heat transfer coefficient is adjusted to match the pressure trace at the
exhaust phase. The temperature conditions on combustion chamber boundaries have
effect on pressure trace on intake phase as they affect the mass flow rate into the cylinder.
As shown in Figure 6, the simulation results satisfy the criteria in all four cases.
31
0
20
40
60
80
100
120
-150 -100 -50 0 50 100 150
Crank-Angle, degree
Cyl
inde
r Pre
ssur
e, b
ar
Case 1
0
20
40
60
80
100
120
-150 -100 -50 0 50 100 150Crank-Angle, degree
Cyl
inde
r Pre
ssur
e, b
ar
Case 3
0
20
40
60
80
100
120
-150 -100 -50 0 50 100 150
Crank-Angle, degree
Cyl
inde
r Pre
ssur
e, b
ar
Case 2
0
20
40
60
80
100
120
-150 -100 -50 0 50 100 150
Crank-Angle, degree
Cyl
inde
r Pre
ssur
e, b
ar
Case 4
Figure 6. Pressure traces
32
CHAPTER 3. DUAL-STAGE TURBOCHARGER MATCHING
3.1. Matching procedure
Turbocharger matching in general is to optimize the selection of compressor and
turbine combination in order to satisfy the required boosting characteristics for the
specified range of engine operating conditions. Ideally, the compressor efficiency should
be at its maximum in the main operating range of the engine at full load. The distance to
the surge line should be sufficiently large as well.
The matching process hinges upon a thermodynamic cycle analysis with known
properties of working fluid to obtain necessary information about the turbocharger
operation such as pressure ratio, speed, efficiency, and mass flow rate. For the single-
stage turbocharger, it is straightforward to determine pressure and temperature condition
after the compression with the assumed value of compressor efficiency and known inlet
conditions (P1 and T1). In the typical thermodynamic engine system simulation, the
manifold pressure and instantaneous turbocharger speed will be predicted at each
integration step, and the compressor (or turbine) mass flow rates and efficiencies will be
determined from the turbomachinery performance maps. For the dual-stage turbocharger,
however, p2 and T2 are unknown, since the pressure ratio across the low pressure
compressor is unknown even though the overall pressure ratio is known. Therefore, it is
necessary to make assumptions on pressure ratios across each compressor while keeping
the overall pressure ratio constant in order to carry out the rest of the analysis. Once the
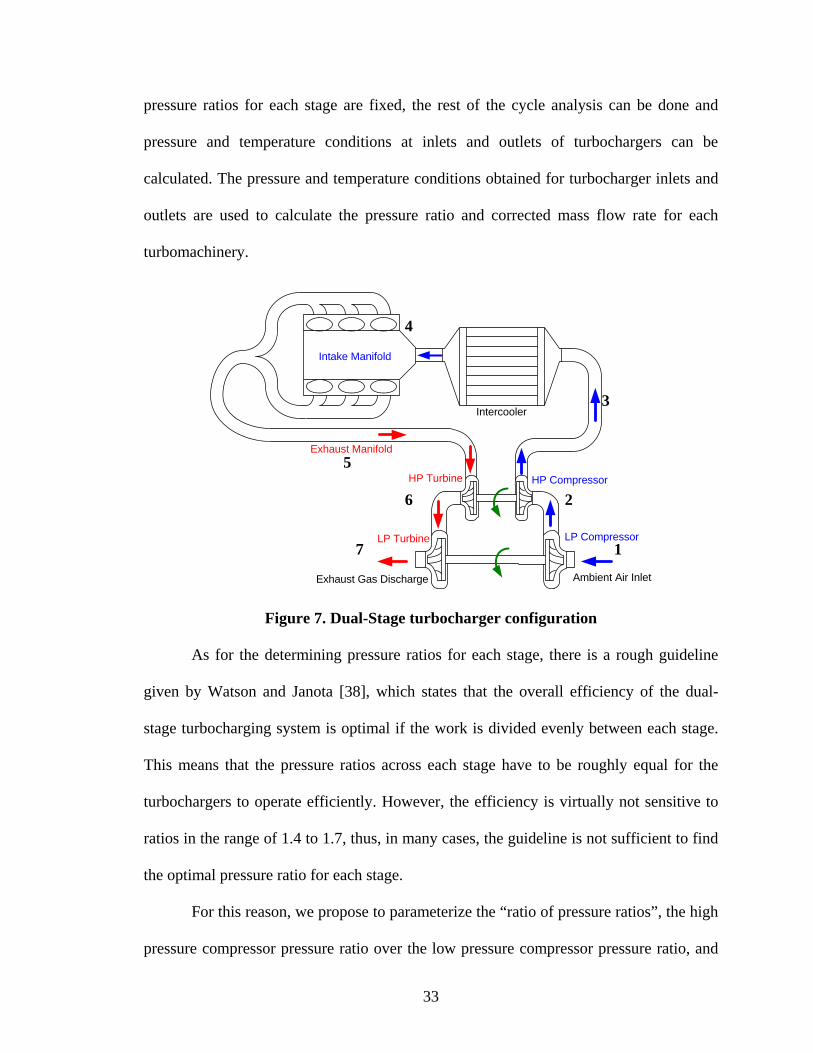
33
pressure ratios for each stage are fixed, the rest of the cycle analysis can be done and
pressure and temperature conditions at inlets and outlets of turbochargers can be
calculated. The pressure and temperature conditions obtained for turbocharger inlets and
outlets are used to calculate the pressure ratio and corrected mass flow rate for each
turbomachinery.
Figure 7. Dual-Stage turbocharger configuration
As for the determining pressure ratios for each stage, there is a rough guideline
given by Watson and Janota [38], which states that the overall efficiency of the dual-
stage turbocharging system is optimal if the work is divided evenly between each stage.
This means that the pressure ratios across each stage have to be roughly equal for the
turbochargers to operate efficiently. However, the efficiency is virtually not sensitive to
ratios in the range of 1.4 to 1.7, thus, in many cases, the guideline is not sufficient to find
the optimal pressure ratio for each stage.
For this reason, we propose to parameterize the “ratio of pressure ratios”, the high
pressure compressor pressure ratio over the low pressure compressor pressure ratio, and
Intercooler
HP Compressor
LP Compressor
HP Turbine
LP Turbine
Ambient Air InletExhaust Gas Discharge
Intake Manifold
Exhaust Manifold
1 7
6
5
4
3
2
34
determine the optimal combination in a systematic way. Known conditions are engine
speed (Ne), pressure and temperature of the ambient air (P1, T1, P7), engine displacement
(Vd) and overall pressure ratio across compressors (P4/P1 or P4). In order to carry out the
calculations from state 1 through 7 and determine thermodynamic properties of each
stage, assumptions must be made on the pressure ratios at each stage (P2/P1, P3/P2),
volumetric efficiency of the engine at the designed operating condition, turbomachinery
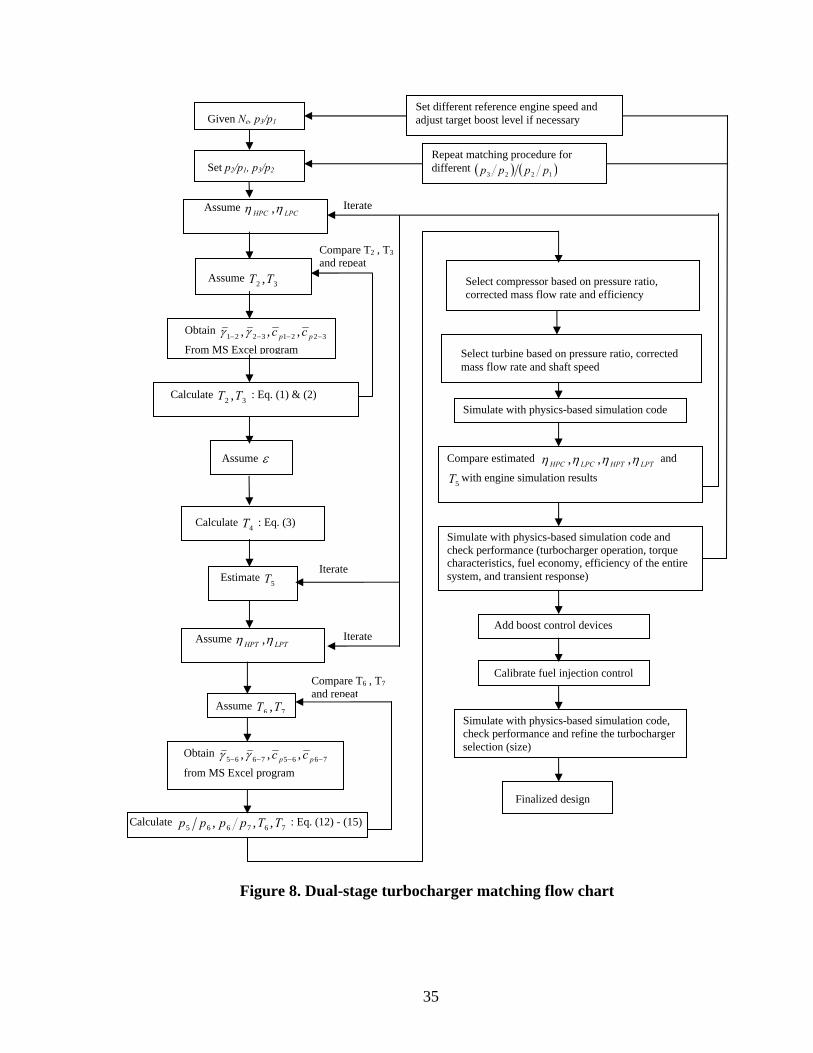
efficiencies and temperature at the exhaust manifold (T5). Thus the procedure requires
iterative calculations illustrated in the Flow Chart shown in Figure 8.
In order to expedite the matching procedure, a Microsoft Excel program with
empirical correlation that calculates thermodynamic properties of the fuel-air mixture is
developed, using the same assumptions as [47]. The program takes temperature, pressure
and fuel fraction of the mixture as inputs and thermodynamic properties of the gas, such
as specific heat ratio, density, gas constant and enthalpy, as outputs. The equations used
in the following procedure, i.e., Eqs. 25 through 47 are also included in the program. As
we describe individual steps in detail, the flow chart shown in Figure 8 will be helpful in
following the flow of the complete procedure.
Step 1. From State 1 to 2
Pressure and temperature at the low pressure compressor inlet are all known. In
order to carry out the calculation, the low pressure compressor outlet conditions must be
known. But they are unknown because the pressure ratio across the low pressure
compressor has not been determined yet. At this stage, known conditions include the
overall pressure rise across the two compressors (P3/P1), engine speed, compressor inlet
conditions (P1, T1) and exhaust back pressure (P7).
35
Given Ne, p3/p1
Set p2/p1, p3/p2
Obtain 32213221 ,,, −−−− pp ccγγ
From MS Excel program
Assume LPCHPC ηη ,
Assume 32 ,TT
Calculate 32 ,TT : Eq. (1) & (2)
Assume ε
Calculate 4T : Eq. (3)
Estimate 5T
Assume LPTHPT ηη ,
Assume 76 ,TT
Obtain 76657665 ,,, −−−− pp ccγγ
from MS Excel program
Select compressor based on pressure ratio, corrected mass flow rate and efficiency
Select turbine based on pressure ratio, corrected mass flow rate and shaft speed
Simulate with physics-based simulation code
Compare estimated LPTHPTLPCHPC ηηηη ,,, and
5T with engine simulation results
Simulate with physics-based simulation code and check performance (turbocharger operation, torque characteristics, fuel economy, efficiency of the entire system, and transient response)
Add boost control devices
Calibrate fuel injection control
Finalized design
Simulate with physics-based simulation code, check performance and refine the turbocharger selection (size)
Set different reference engine speed and adjust target boost level if necessary
Repeat matching procedure for different ( ) ( )1223 pppp
Iterate
Compare T2 , T3 and repeat
Compare T6 , T7 and repeat
Iterate
Iterate
Calculate 767665 ,,, TTpppp : Eq. (12) - (15)
Figure 8. Dual-stage turbocharger matching flow chart
36
For a single-stage turbocharger matching, compressor inlet condition and overall
pressure ratio would be sufficient to complete the analysis. However, with the dual-stage
turbocharger, the individual pressure ratios of the two compressors have to be assumed
first while keeping the overall pressure ratio at a predetermined value. A systematical
method to do this is parameterizing the ratio of each pressure ratio, and check the effect
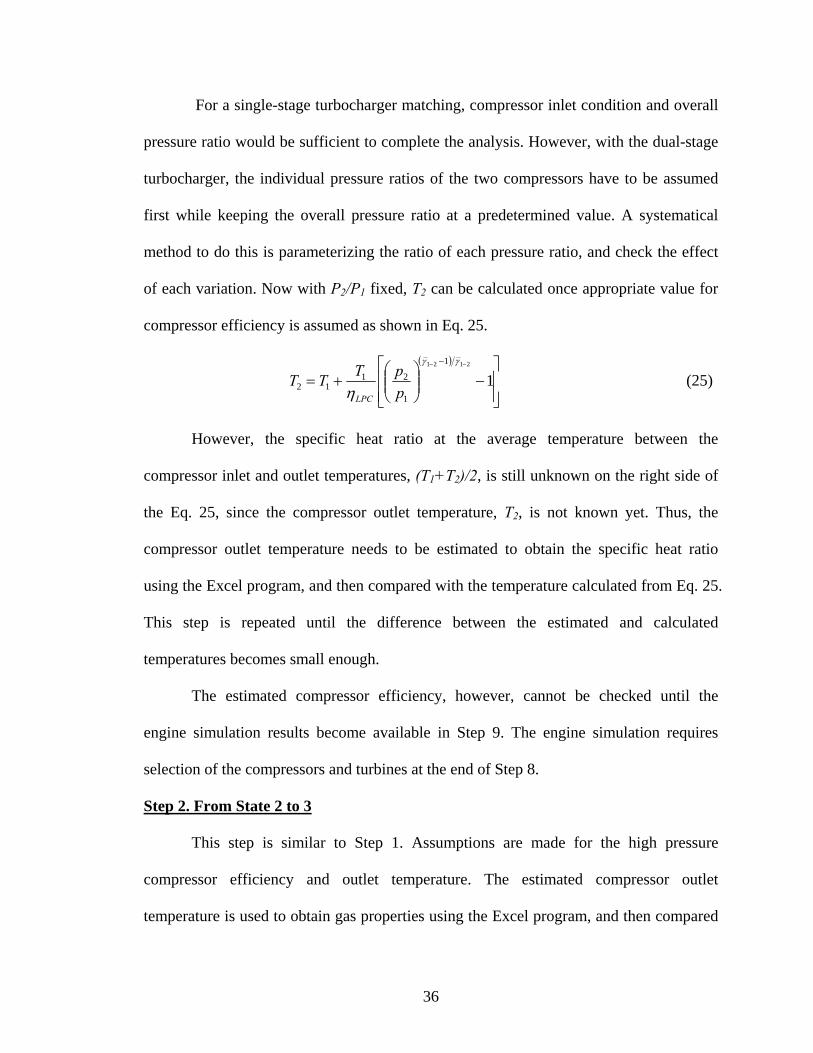
of each variation. Now with P2/P1 fixed, T2 can be calculated once appropriate value for
compressor efficiency is assumed as shown in Eq. 25.
( )
⎥⎥⎦
⎤
⎢⎢⎣
⎡−⎟⎟
⎠
⎞⎜⎜⎝
⎛+=
−− −
12121 1
1
2112
γγ
η ppTTT
LPC
(25)
However, the specific heat ratio at the average temperature between the
compressor inlet and outlet temperatures, (T1+T2)/2, is still unknown on the right side of
the Eq. 25, since the compressor outlet temperature, T2, is not known yet. Thus, the
compressor outlet temperature needs to be estimated to obtain the specific heat ratio
using the Excel program, and then compared with the temperature calculated from Eq. 25.
This step is repeated until the difference between the estimated and calculated
temperatures becomes small enough.
The estimated compressor efficiency, however, cannot be checked until the
engine simulation results become available in Step 9. The engine simulation requires
selection of the compressors and turbines at the end of Step 8.
Step 2. From State 2 to 3
This step is similar to Step 1. Assumptions are made for the high pressure
compressor efficiency and outlet temperature. The estimated compressor outlet
temperature is used to obtain gas properties using the Excel program, and then compared
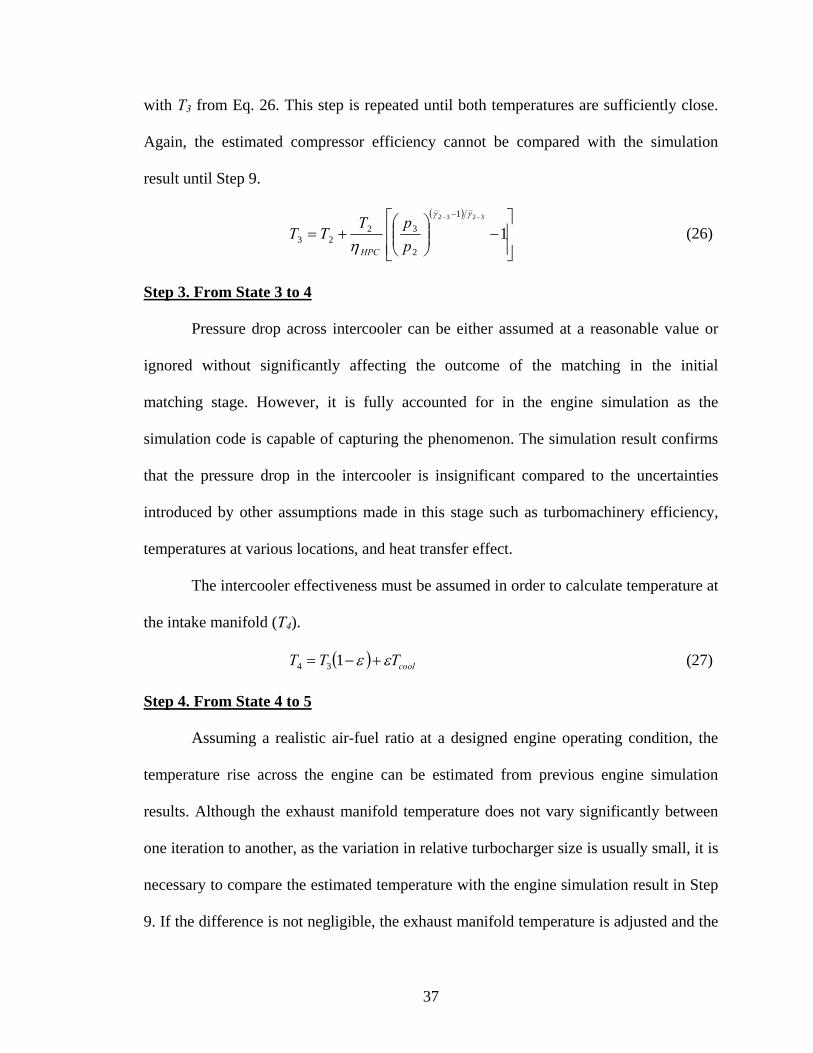
37
with T3 from Eq. 26. This step is repeated until both temperatures are sufficiently close.
Again, the estimated compressor efficiency cannot be compared with the simulation
result until Step 9.
( )
⎥⎥⎦
⎤
⎢⎢⎣
⎡−⎟⎟
⎠
⎞⎜⎜⎝
⎛+=
−− −
13232 1
2
3223
γγ
η ppT
TTHPC
(26)
Step 3. From State 3 to 4
Pressure drop across intercooler can be either assumed at a reasonable value or
ignored without significantly affecting the outcome of the matching in the initial
matching stage. However, it is fully accounted for in the engine simulation as the
simulation code is capable of capturing the phenomenon. The simulation result confirms
that the pressure drop in the intercooler is insignificant compared to the uncertainties
introduced by other assumptions made in this stage such as turbomachinery efficiency,
temperatures at various locations, and heat transfer effect.
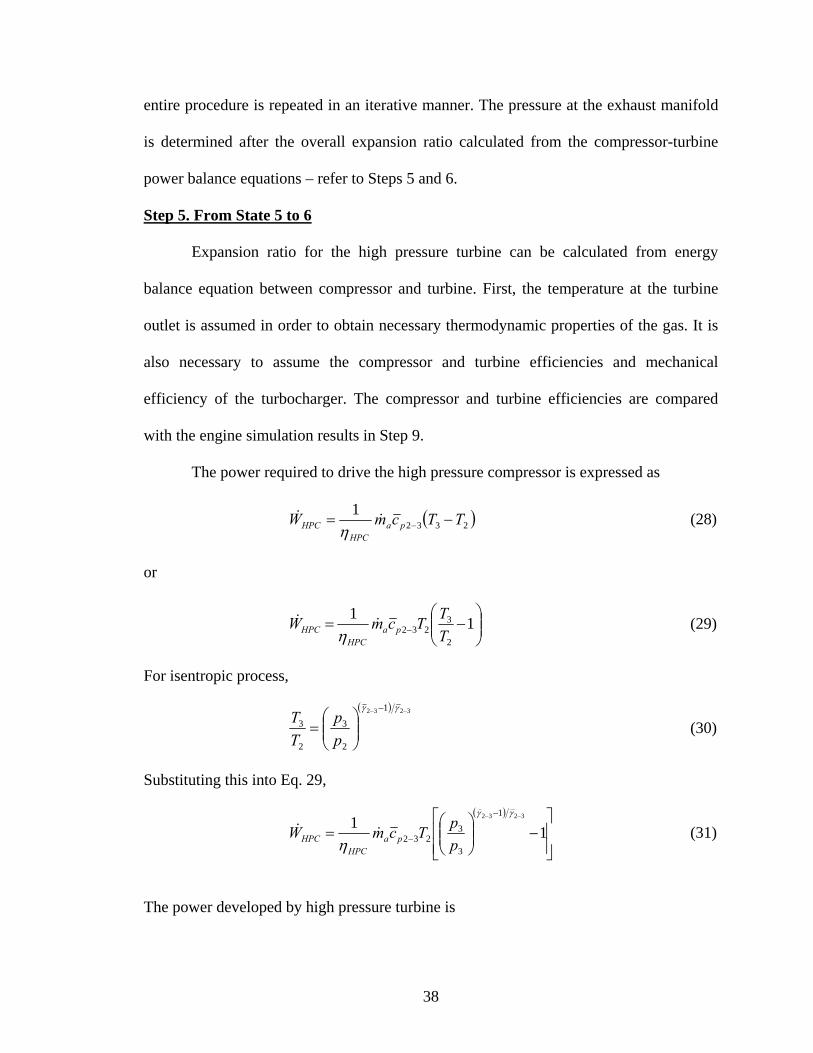
The intercooler effectiveness must be assumed in order to calculate temperature at
the intake manifold (T4).
( ) coolTTT εε +−= 134 (27)
Step 4. From State 4 to 5
Assuming a realistic air-fuel ratio at a designed engine operating condition, the
temperature rise across the engine can be estimated from previous engine simulation
results. Although the exhaust manifold temperature does not vary significantly between
one iteration to another, as the variation in relative turbocharger size is usually small, it is
necessary to compare the estimated temperature with the engine simulation result in Step
9. If the difference is not negligible, the exhaust manifold temperature is adjusted and the
38
entire procedure is repeated in an iterative manner. The pressure at the exhaust manifold
is determined after the overall expansion ratio calculated from the compressor-turbine
power balance equations – refer to Steps 5 and 6.
Step 5. From State 5 to 6
Expansion ratio for the high pressure turbine can be calculated from energy
balance equation between compressor and turbine. First, the temperature at the turbine
outlet is assumed in order to obtain necessary thermodynamic properties of the gas. It is
also necessary to assume the compressor and turbine efficiencies and mechanical
efficiency of the turbocharger. The compressor and turbine efficiencies are compared
with the engine simulation results in Step 9.
The power required to drive the high pressure compressor is expressed as
( )23321 TTcmW paHPC
HPC −= −&&η
(28)
or
⎟⎟⎠
⎞⎜⎜⎝
⎛−= − 11
2
3232 T
TTcmW paHPC
HPC &&η
(29)
For isentropic process,
( ) 3232 1
2
3
2
3−− −
⎟⎟⎠
⎞⎜⎜⎝
⎛=
γγ
pp
TT
(30)
Substituting this into Eq. 29,
( )
⎥⎥⎦
⎤
⎢⎢⎣
⎡−⎟⎟
⎠
⎞⎜⎜⎝
⎛=
−− −
− 11 3232 1
3
3232
γγ
η ppTcmW pa
HPCHPC && (31)
The power developed by high pressure turbine is
39
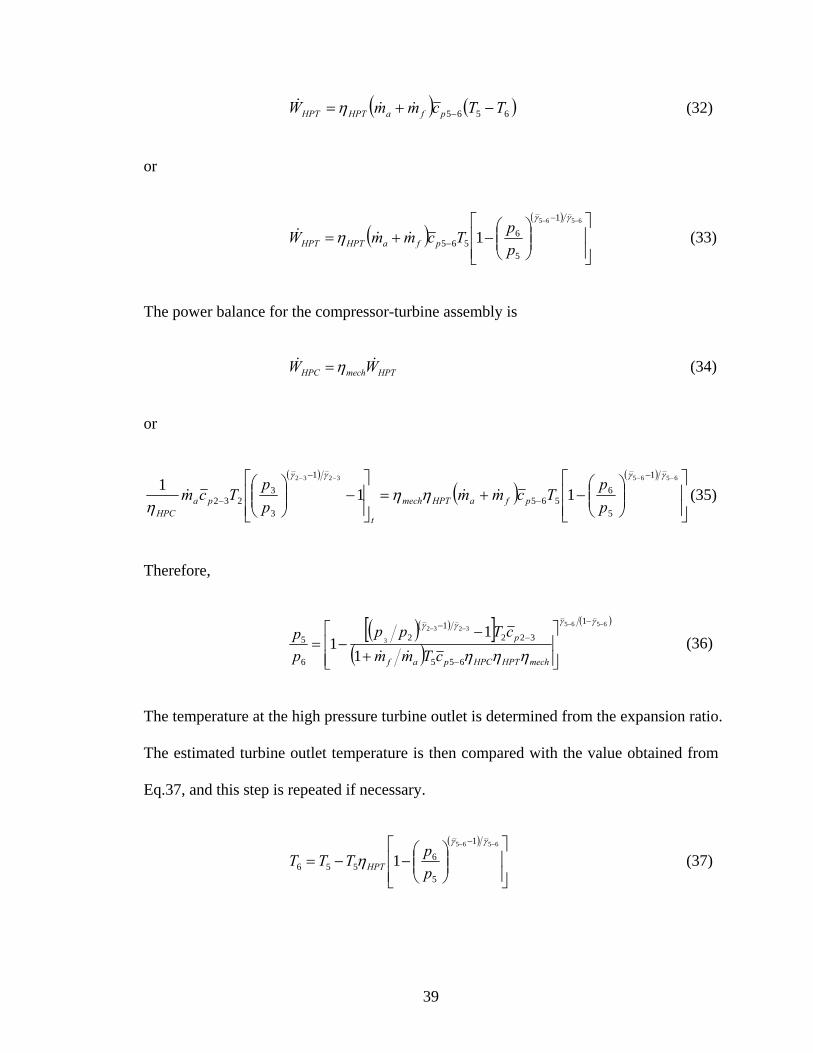
( ) ( )6565 TTcmmW pfaHPTHPT −+= −&&& η (32)
or
( )( )
⎥⎥⎦
⎤
⎢⎢⎣
⎡⎟⎟⎠
⎞⎜⎜⎝
⎛−+=
−− −
−
6565 1
5
6565 1
γγ
ηppTcmmW pfaHPTHPT &&& (33)
The power balance for the compressor-turbine assembly is
HPTmechHPC WW && η= (34)
or
( )
( )( )
⎥⎥⎦
⎤
⎢⎢⎣
⎡⎟⎟⎠
⎞⎜⎜⎝
⎛−+=
⎥⎥⎦
⎤
⎢⎢⎣
⎡−⎟⎟
⎠
⎞⎜⎜⎝
⎛ −−−− −
−
−
−
65653232 1
5
6565
1
3
3232 111
γγγγ
ηηη p
pTcmm
pp
Tcm pfaHPTmech
t
paHPC
&&& (35)
Therefore,
( )( )[ ]
( )( )6565
3232
3
1
655
3221
2
6
5
11
1−−
−−−
−
−−
⎥⎥⎦
⎤
⎢⎢⎣
⎡
+
−−=
γγγγ
ηηη mechHPTHPCpaf
p
cTmmcTpp
pp
&& (36)
The temperature at the high pressure turbine outlet is determined from the expansion ratio.
The estimated turbine outlet temperature is then compared with the value obtained from
Eq.37, and this step is repeated if necessary.
( )
⎥⎥⎦
⎤
⎢⎢⎣
⎡⎟⎟⎠
⎞⎜⎜⎝
⎛−−=
−− − 6565 1
5
6556 1
γγ
ηppTTT HPT (37)
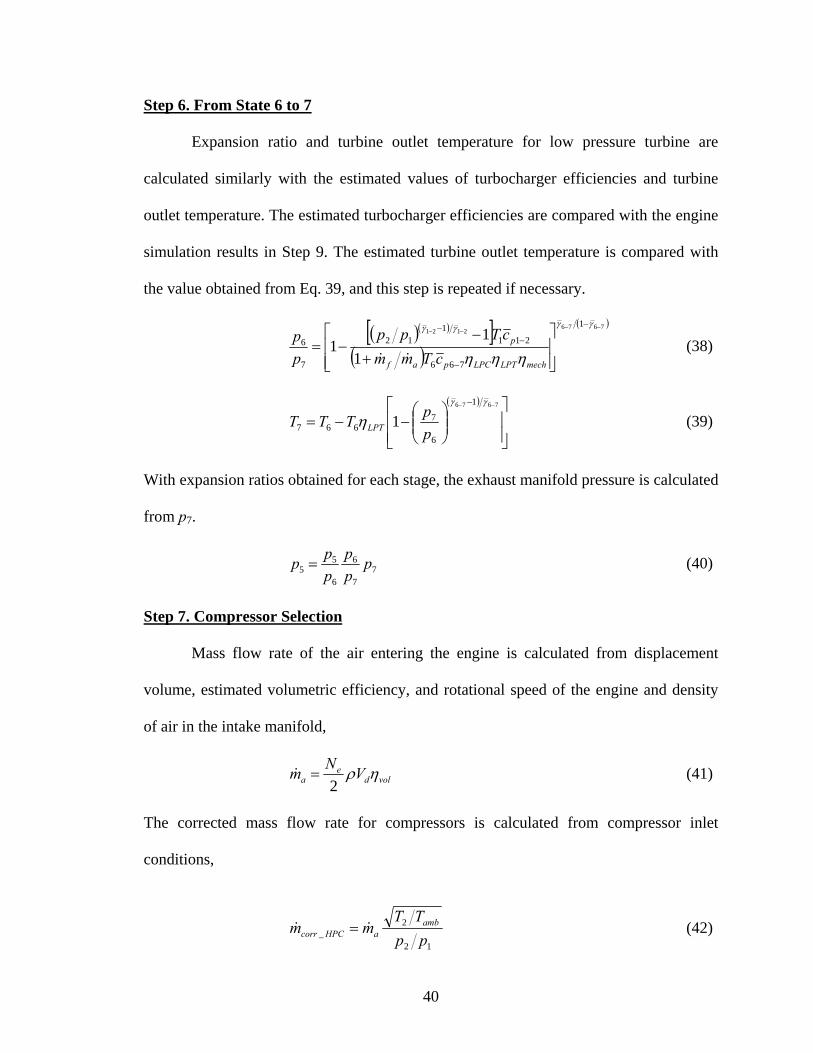
40
Step 6. From State 6 to 7
Expansion ratio and turbine outlet temperature for low pressure turbine are
calculated similarly with the estimated values of turbocharger efficiencies and turbine
outlet temperature. The estimated turbocharger efficiencies are compared with the engine
simulation results in Step 9. The estimated turbine outlet temperature is compared with
the value obtained from Eq. 39, and this step is repeated if necessary.
( )( )[ ]
( )( )7676
21211
766
2111
12
7
6
11
1−−
−−−
−
−−
⎥⎥⎦
⎤
⎢⎢⎣
⎡
+−
−=
γγγγ
ηηη mechLPTLPCpaf
p
cTmmcTpp
pp
&& (38)
( )
⎥⎥⎦
⎤
⎢⎢⎣
⎡⎟⎟⎠
⎞⎜⎜⎝
⎛−−=
−− − 7676 1
6
7667 1
γγ
ηppTTT LPT (39)
With expansion ratios obtained for each stage, the exhaust manifold pressure is calculated
from p7.
77
6
6
55 p
pp
ppp = (40)
Step 7. Compressor Selection
Mass flow rate of the air entering the engine is calculated from displacement
volume, estimated volumetric efficiency, and rotational speed of the engine and density
of air in the intake manifold,
volde
a VNm ηρ2
=& (41)
The corrected mass flow rate for compressors is calculated from compressor inlet
conditions,
12
2_ pp
TTmm amb
aHPCcorr && = (42)
41
and,
11
1_ pp
TTmm amb
aLPCcorr && = (43)
With the corrected mass flow rates and the pressure ratios for each stage,
compressors can be selected for each stage by positioning the operating points on the
most efficient region of the compressor maps made available by the turbomachinery
scaling routine. With the scaling routine, a single compressor map can generate infinitely
many maps by changing the scaling factor. Thus the compressor selection is no longer
limited by the availability from the turbocharger manufacturer. Compressors that perform
most efficiently at the mass flow rate determined from Eq. 42 and 43, and pressure ratios
determined by the ratio of the pressure ratios are selected from compressor maps.
Step 8. Turbine Selection
The mass flow rate of fuel is obtained from air-fuel ratio, since
af mFA
m &&/1
= (44)
The total mass flow rate through the turbine is
fae mmm &&& += (45)
The corrected mass flow rate for turbines is calculated from the turbine inlet conditions
75
5_ pp
TTmm amb
eHPTcorr && = (46)
76
6_ pp
TTmm amb
eLPTcorr && = (47)

42
With the corrected mass flow rates, the expansion ratios, and the shaft speeds
determined from compressor selection, turbines are selected from the turbine maps made
available by the turbomachinery scaling routine.
Step 9. Iteration
In this step, the estimated exhaust manifold temperature, T5, and the estimated
turbomachinery efficiencies, LPCη , LPTη , HPCη , HPTη , are compared with the results from the
physics-based engine simulation code as the initial matching procedure is completed and
the compressors and turbines are selected. The matching procedure is repeated with the
updated values.
Once the simulation results and the assumed values are in reasonable agreement,
the matching is completed for that ‘ratio of pressure ratios’ (or pressure ratio parameter)
parameterized at the beginning of the matching. Then, the turbocharger operations at
various engine operating conditions are evaluated for sufficient surge margin, choking
and the overall efficiency. The engine torque characteristics and transient response of the
system are also evaluated.
Once the evaluation is completed for one ratio of pressure ratios, the entire
matching procedure is repeated for another ratio in order to find the optimal value for the
given target manifold boost, e.g. the procedure is repeated for (P3/P2)/(P2/P1) = 0.8, 1.0,
1.2, etc. Once the evaluation for different ratios of pressure ratios is completed, a decision
can be made about the best ratio for the engine operating condition chosen for a reference
point. A logical choice for a reference operating point is the mid-speed and high load,
essentially a point at which the optimal turbocharger efficiency is desired at the target
boost level (P3/P1).
43
The final step then depends on the system architecture. If no additional device is
used for boost control, the turbochargers selected for the reference operating point are
checked for sufficient surge margin at low engine speed and sufficient flow capacity at
high engine speed using the physics-based engine system simulation.
If boost pressure control devices are used, a follow up study using the engine
system simulation is necessary to further adjust the turbocharger selection. This is
explained in the next sub-section and illustrated in the Flow Chart.
Step 10. Adding Boost Control Devices
It is often necessary to control the boost level in order to prevent the cylinder
pressure from exceeding its designed limit. This is of particular interest in high-speed
engines for passenger cars and trucks. A bypass valve or a wastegate must be added to
the system to keep the maximum cylinder pressure at a safe level. Several parameters are
involved in designing such devices. Valve diameter, spring rate and pre-load pressure are
among the parameters to be determined depending on preset valve activation point
(intake manifold boost). The final design is chosen after iterations using the results from
the physics-based engine simulation code. With the addition of these boost control
devices, it is likely to find a certain degree of deviation from the performance without
such devices. Therefore, it is necessary to refine the turbocharger selection (sizing) at this
stage and iterate on the final design. The fuel injection calibration should be addressed in
parallel, as the boost level changes after the addition of a bypass valve or a wastegate.
Step 11. Checking Critical Operating Conditions and Final Iteration
The efficiency of the entire system, fuel economy, torque characteristics and
transient response of the engine must be carefully investigated to confirm that the targets
44
are met. After the system is evaluated over a full range of steady-state conditions, the
transient response should be investigated as well. An example is discussed in the
following section. This completes the Flow Chart shown in Figure 8.
3.2. Turbomachinery scaling
The scaling routine is based on non-dimensional representation of compressor and
turbine characteristics. The functional relationships between non-dimensional variables
[38] are
⎟⎟⎠
⎞⎜⎜⎝
⎛=
Δ γμ
η ,,,,,01
02
0101
02
01
01
Dm
pp
RTNDf
TT
DpRTm &&
(48)
Since turbochargers operate on a specific gas (air for the compressor, exhaust gas
for the turbine), the values of R and γ are specified. Hence the non-dimensional groups
become
⎟⎟⎠
⎞⎜⎜⎝
⎛=
ΔD
mpp
RTNDf
TT
DpRTm
μη
&&,,,,
01
02
0101
02
01
01 (49)
The Reynolds number of the gas has little effect on the performance of the
machine, and can usually be ignored. Hence
⎟⎟⎠
⎞⎜⎜⎝
⎛=
Δ
01
02
0101
02
01
01 ,,,pp
RTNDf
TT
DpRTm
η&
(50)
Since the turbomachineries to be scaled operates on the same pressure ratio, the
non-dimensional groups become
⎟⎟⎠
⎞⎜⎜⎝
⎛=
Δ
0101
02
01
01 ,,RTNDf
TT
DpRTm
η&
(51)
45
The same impeller/blade tip speed should be maintained among the family of
turbomachinery as the impellers/blades have the same tensile strength and durability
since they are manufactured with the same material.
2211 DNDN = (52)
Assuming the similar geometry, the functional relationship becomes,
22
22
1
1
Dm
Dm &&
= (53)
and
21 ηη = (54)
Even though, the efficiency varies with the size of the turbomachinery in reality,
the variation is usually not very significant if the geometry is similar.
By defining a scaling factor,
1
2
mm&
&=α (55)
the diameter and shaft speed can be expressed as
α1
1
2
2
1 ==NN
DD
(56)
With Eqs. 55 and 56, the compressor/turbine map can be scaled based on either
the mass flow rate (scaling factor) or the diameter. For example, once the scaling factor is
determined, the shaft speed can be scaled by Eq. 56, while the efficiency and the pressure
ratio remain unchanged.
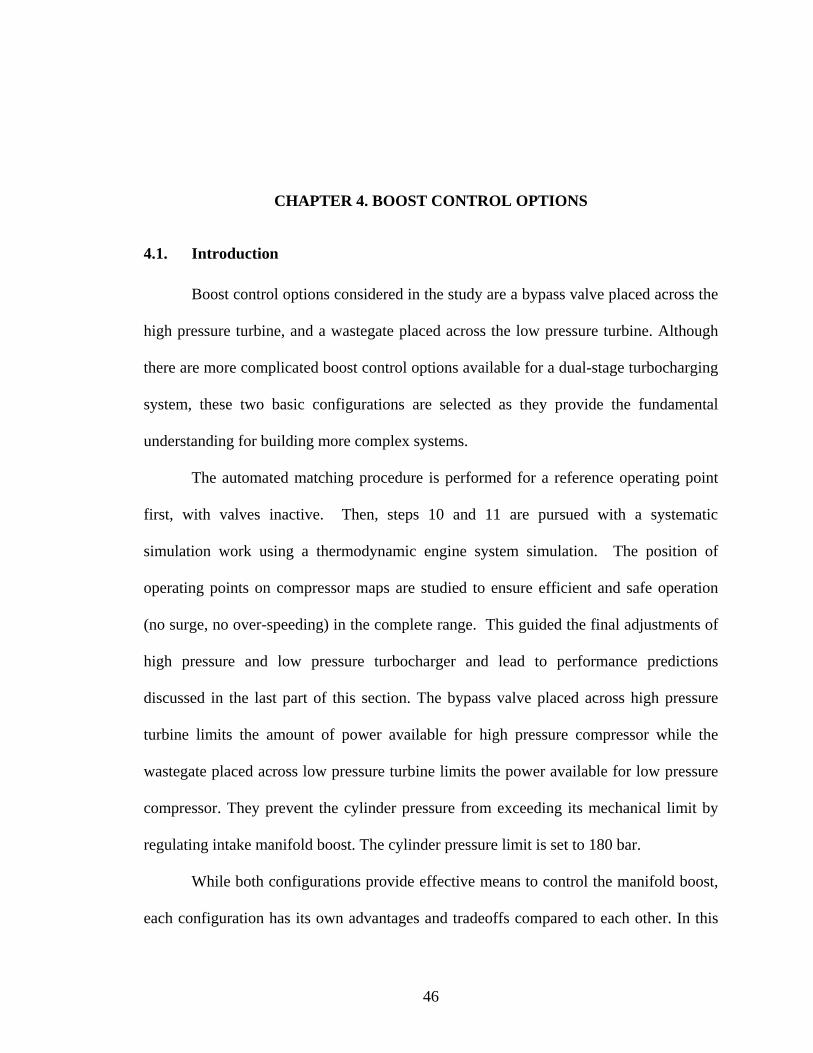
46
CHAPTER 4. BOOST CONTROL OPTIONS
4.1. Introduction
Boost control options considered in the study are a bypass valve placed across the
high pressure turbine, and a wastegate placed across the low pressure turbine. Although
there are more complicated boost control options available for a dual-stage turbocharging
system, these two basic configurations are selected as they provide the fundamental
understanding for building more complex systems.
The automated matching procedure is performed for a reference operating point
first, with valves inactive. Then, steps 10 and 11 are pursued with a systematic
simulation work using a thermodynamic engine system simulation. The position of
operating points on compressor maps are studied to ensure efficient and safe operation
(no surge, no over-speeding) in the complete range. This guided the final adjustments of
high pressure and low pressure turbocharger and lead to performance predictions
discussed in the last part of this section. The bypass valve placed across high pressure
turbine limits the amount of power available for high pressure compressor while the
wastegate placed across low pressure turbine limits the power available for low pressure
compressor. They prevent the cylinder pressure from exceeding its mechanical limit by
regulating intake manifold boost. The cylinder pressure limit is set to 180 bar.
While both configurations provide effective means to control the manifold boost,
each configuration has its own advantages and tradeoffs compared to each other. In this
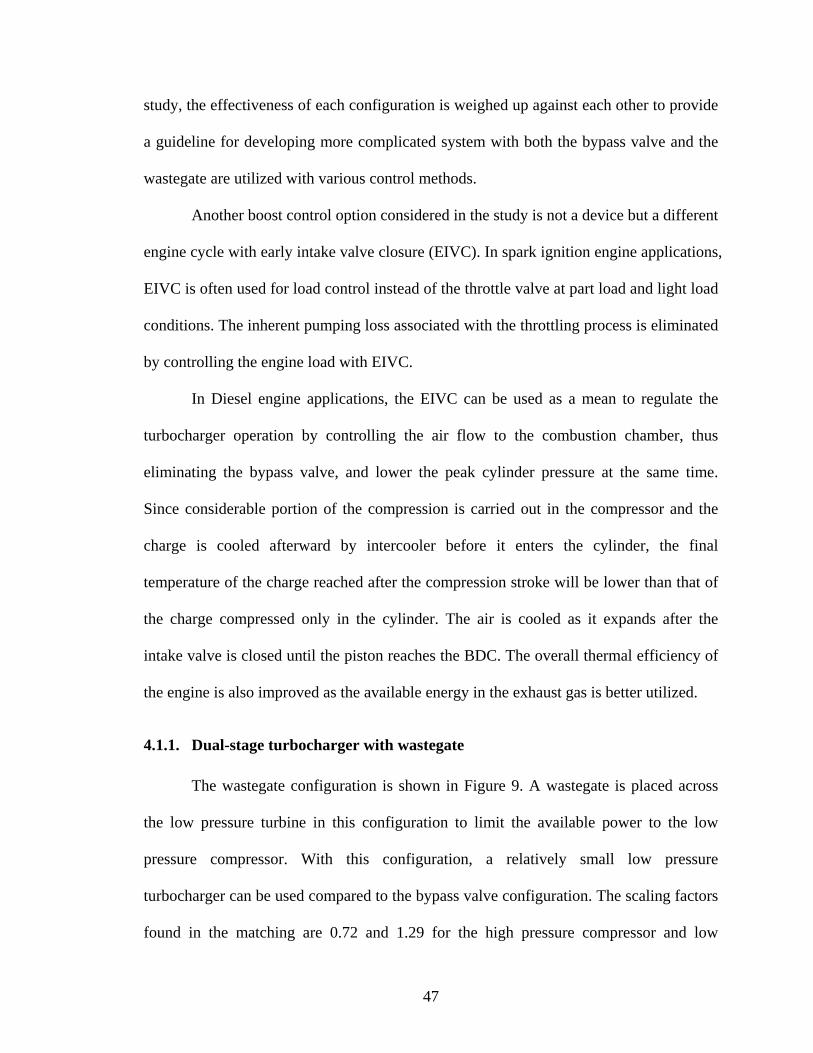
47
study, the effectiveness of each configuration is weighed up against each other to provide
a guideline for developing more complicated system with both the bypass valve and the
wastegate are utilized with various control methods.
Another boost control option considered in the study is not a device but a different
engine cycle with early intake valve closure (EIVC). In spark ignition engine applications,
EIVC is often used for load control instead of the throttle valve at part load and light load
conditions. The inherent pumping loss associated with the throttling process is eliminated
by controlling the engine load with EIVC.
In Diesel engine applications, the EIVC can be used as a mean to regulate the
turbocharger operation by controlling the air flow to the combustion chamber, thus
eliminating the bypass valve, and lower the peak cylinder pressure at the same time.
Since considerable portion of the compression is carried out in the compressor and the
charge is cooled afterward by intercooler before it enters the cylinder, the final
temperature of the charge reached after the compression stroke will be lower than that of
the charge compressed only in the cylinder. The air is cooled as it expands after the
intake valve is closed until the piston reaches the BDC. The overall thermal efficiency of
the engine is also improved as the available energy in the exhaust gas is better utilized.
4.1.1. Dual-stage turbocharger with wastegate
The wastegate configuration is shown in Figure 9. A wastegate is placed across
the low pressure turbine in this configuration to limit the available power to the low
pressure compressor. With this configuration, a relatively small low pressure
turbocharger can be used compared to the bypass valve configuration. The scaling factors
found in the matching are 0.72 and 1.29 for the high pressure compressor and low
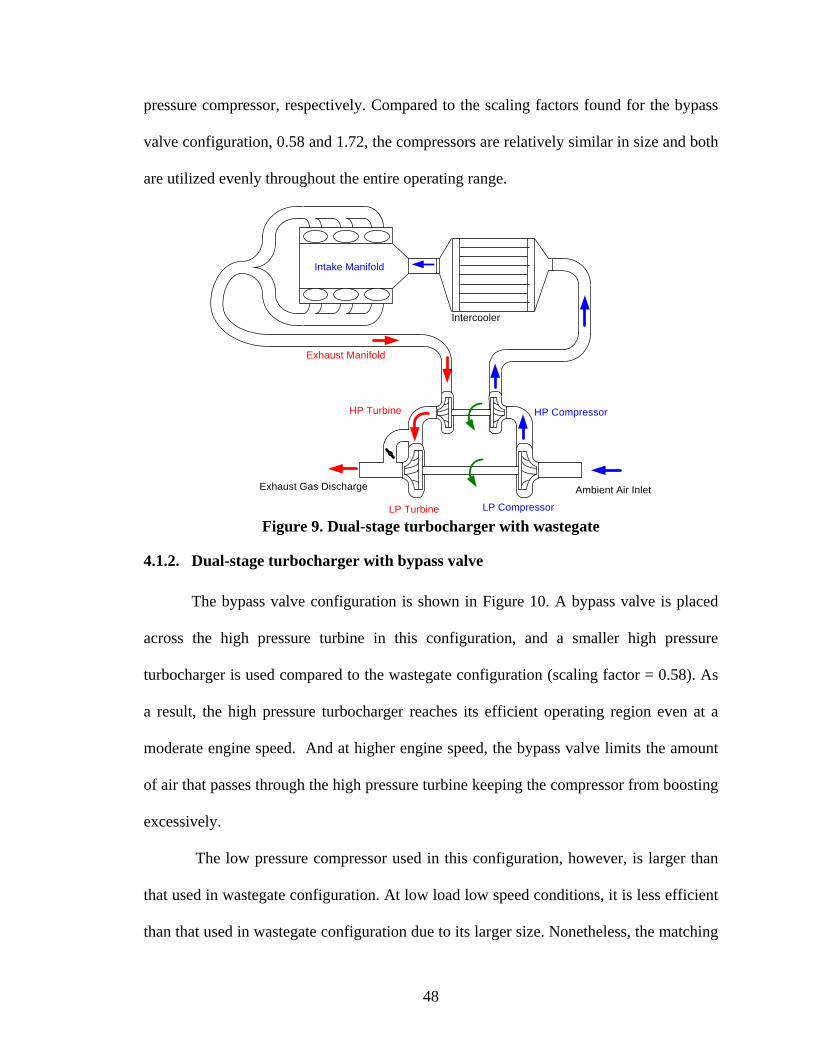
48
pressure compressor, respectively. Compared to the scaling factors found for the bypass
valve configuration, 0.58 and 1.72, the compressors are relatively similar in size and both
are utilized evenly throughout the entire operating range.
Figure 9. Dual-stage turbocharger with wastegate
4.1.2. Dual-stage turbocharger with bypass valve
The bypass valve configuration is shown in Figure 10. A bypass valve is placed
across the high pressure turbine in this configuration, and a smaller high pressure
turbocharger is used compared to the wastegate configuration (scaling factor = 0.58). As
a result, the high pressure turbocharger reaches its efficient operating region even at a
moderate engine speed. And at higher engine speed, the bypass valve limits the amount
of air that passes through the high pressure turbine keeping the compressor from boosting
excessively.
The low pressure compressor used in this configuration, however, is larger than
that used in wastegate configuration. At low load low speed conditions, it is less efficient
than that used in wastegate configuration due to its larger size. Nonetheless, the matching
Intercooler
HP Compressor
LP Compressor
HP Turbine
LP Turbine
Ambient Air InletExhaust Gas Discharge
Intake Manifold
Exhaust Manifold
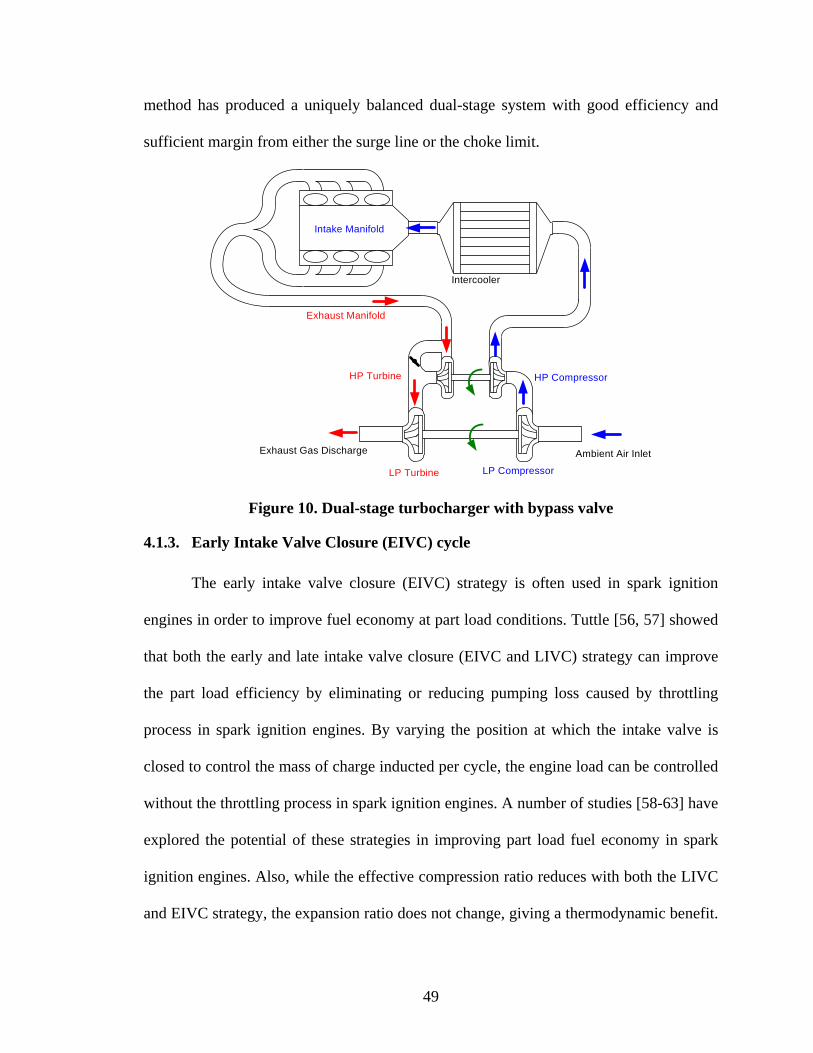
49
method has produced a uniquely balanced dual-stage system with good efficiency and
sufficient margin from either the surge line or the choke limit.
Figure 10. Dual-stage turbocharger with bypass valve
4.1.3. Early Intake Valve Closure (EIVC) cycle
The early intake valve closure (EIVC) strategy is often used in spark ignition
engines in order to improve fuel economy at part load conditions. Tuttle [56, 57] showed
that both the early and late intake valve closure (EIVC and LIVC) strategy can improve
the part load efficiency by eliminating or reducing pumping loss caused by throttling
process in spark ignition engines. By varying the position at which the intake valve is
closed to control the mass of charge inducted per cycle, the engine load can be controlled
without the throttling process in spark ignition engines. A number of studies [58-63] have
explored the potential of these strategies in improving part load fuel economy in spark
ignition engines. Also, while the effective compression ratio reduces with both the LIVC
and EIVC strategy, the expansion ratio does not change, giving a thermodynamic benefit.
Intercooler
HP Compressor
LP Compressor
HP Turbine
LP Turbine
Ambient Air InletExhaust Gas Discharge
Intake Manifold
Exhaust Manifold
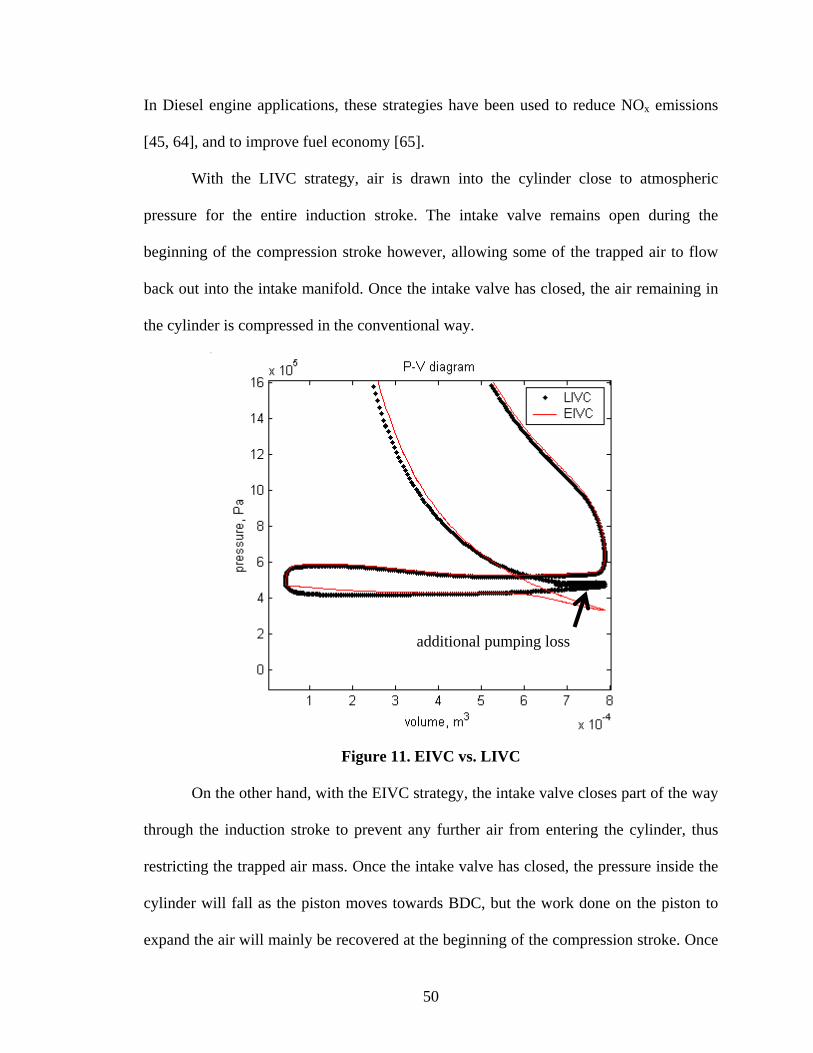
50
In Diesel engine applications, these strategies have been used to reduce NOx emissions
[45, 64], and to improve fuel economy [65].
With the LIVC strategy, air is drawn into the cylinder close to atmospheric
pressure for the entire induction stroke. The intake valve remains open during the
beginning of the compression stroke however, allowing some of the trapped air to flow
back out into the intake manifold. Once the intake valve has closed, the air remaining in
the cylinder is compressed in the conventional way.
Figure 11. EIVC vs. LIVC
On the other hand, with the EIVC strategy, the intake valve closes part of the way
through the induction stroke to prevent any further air from entering the cylinder, thus
restricting the trapped air mass. Once the intake valve has closed, the pressure inside the
cylinder will fall as the piston moves towards BDC, but the work done on the piston to
expand the air will mainly be recovered at the beginning of the compression stroke. Once
additional pumping loss
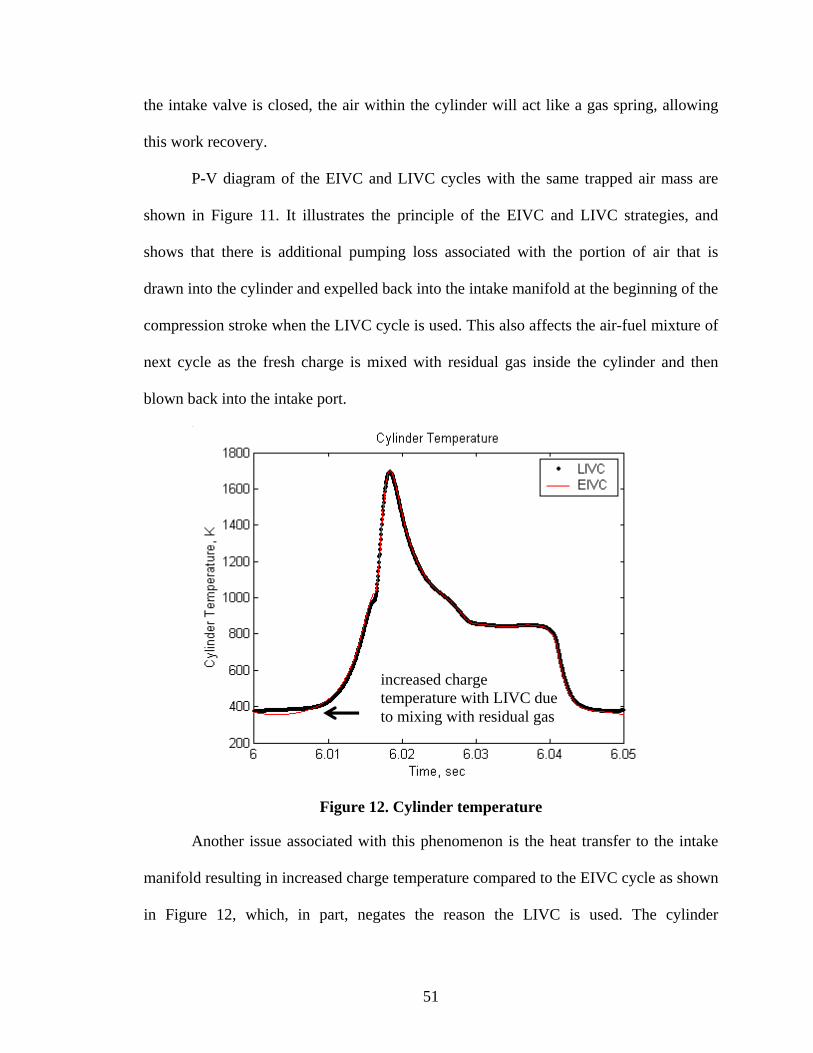
51
the intake valve is closed, the air within the cylinder will act like a gas spring, allowing
this work recovery.
P-V diagram of the EIVC and LIVC cycles with the same trapped air mass are
shown in Figure 11. It illustrates the principle of the EIVC and LIVC strategies, and
shows that there is additional pumping loss associated with the portion of air that is
drawn into the cylinder and expelled back into the intake manifold at the beginning of the
compression stroke when the LIVC cycle is used. This also affects the air-fuel mixture of
next cycle as the fresh charge is mixed with residual gas inside the cylinder and then
blown back into the intake port.
Figure 12. Cylinder temperature
Another issue associated with this phenomenon is the heat transfer to the intake
manifold resulting in increased charge temperature compared to the EIVC cycle as shown
in Figure 12, which, in part, negates the reason the LIVC is used. The cylinder
increased charge temperature with LIVC due to mixing with residual gas
52
temperature plot is also obtained with the same trapped air mass for both EIVC and LIVC
cycles. Besides the benefits of throttle-less operation in SI engines, the LIVC is often
used to reduce charge temperature to avoid knock, but the increased charge temperature
due to the charge expelled from the cylinder, which is mixed with hot residual gas,
creates problem in this regard. In addition, the LIVC strategy is limited in the range of
throttle-less operation as the intake valve closure can occur significantly after the ideal
ignition timing for very light loads. Thus, there exists a conflict between ideal ignition
timing and the ideal intake valve closing timing to reduce the load.
However, the LIVC strategy offers benefits over the EIVC strategy such as lower
cost and better mixing and turbulence that promotes better combustion compared to the
EIVC. With the EIVC cycle, the intake valve needs to resist the adverse pressure when
the intake valve is closed before the bottom dead center, which requires substantial
change in valve train design, whereas only minimal modification is required with the
LIVC cycle. In addition, Tuttle [56, 57] has shown that the EIVC can reduce turbulence
and mixing to levels lower than those experienced over a complete un-throttled induction
stroke, and the subsequent entrainment and combustion processes are slowed down.
However, with the EIVC strategy, deactivating one intake valve at part load can
increase turbulence at reduced air flow. GM has employed such technique in production
engines with conventional valve train. The adverse effect of the EIVC on combustion can
also be countered by using asymmetric valve profiles. Wilson et al. [66] investigated the
effect of such valve profiles on combustion in a fully variable valve train research engine.
The same method is used in Honda VTEC-E engines.

53
The EIVC strategy offers throttle-less operation throughout the engine speed and
load range because there is in principle no limit to the reduction of trapped air mass that
can be achieved by early closing of the intake valve. This is the strategy used in the
Valvetronic, a variable EIVC system, by BMW. GM has also tried the EIVC strategy,
which uses the variable intake valve closing and intake valve lift control to un-throttle the
engine at part-load and light-load operating conditions.
Figure 13. Peak cylinder temperature and pressure
The EIVC also offers reduction of peak temperature and pressure in the cylinder
compared to the conventional valve timing through its charge cooling effect as shown in
Figure 13. The trapped air mass and the amount of fuel injected are same for both the
baseline timing and EIVC, but since considerable portion of the compression is carried
out in the compressor and the charge is cooled afterward by intercooler, the final
temperature of the charge reached after the compression stroke will be lower than it
would have been if the charge was compressed entirely inside the cylinder alone. This
results in lower peak cylinder pressure and temperature during the combustion process. In
54
Diesel engine applications, it can reduce NOx emissions and raise the boost considerably
more than normal level as the peak cylinder pressure is reduced during the combustion.
Additionally, with the lower peak cylinder pressure through EIVC, the injection
timing can be further advanced compared to the conventional valve timing, which leads
to better overall system efficiency. The overall thermal efficiency of the engine is also
improved as the expansion stroke is longer than the effective compression stroke.
In this study, the EIVC is employed to regulate the dual-stage turbocharger
operation by controlling the trapped air charge in the combustion chamber, which allows
the turbocharger to operate without the bypass valve resulting in better system efficiency
thanks to better utilization of the exhaust energy. With the EIVC, the bypass valve is
eliminated and the boost is controlled by varying the IVC timing at medium to high
engine speed.
A preliminary study was performed in order to determine the optimal intake valve
closing timing at 2000 rpm where the bypass valve typically begins to open with
conventional valve timing. Initially, the performance of the engine with the baseline
valve timing was simulated at full load at 2000 rpm, and a series of runs was conducted
to determine optimum intake valve closing timing by comparing the BSFC at a specified
intake manifold pressure.
The intake manifold conditions are specified at the start of the simulation and
remain constant throughout the simulation. In order to eliminate the effect of
turbomachinery matching on overall efficiency of the engine system, the intake manifold
is treated as a plenum, and the exhaust manifold is modified to an open system with
specified pressure. The exhaust manifold temperature is determined by the mass and
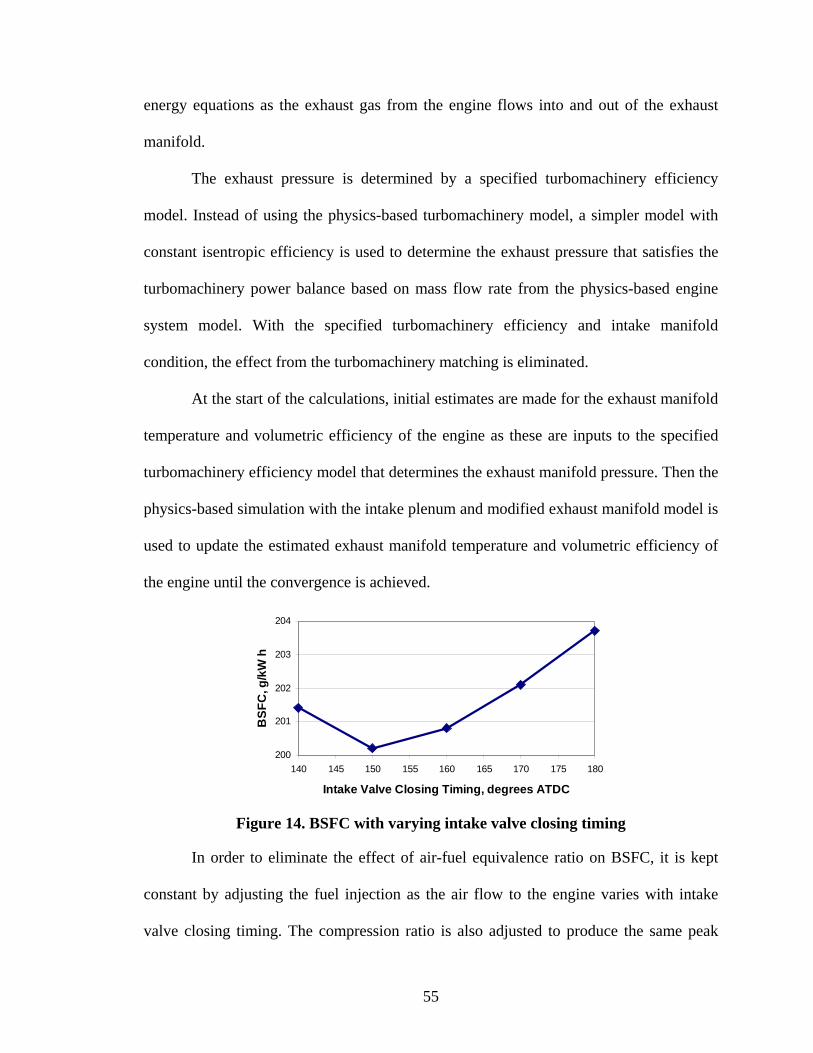
55
energy equations as the exhaust gas from the engine flows into and out of the exhaust
manifold.
The exhaust pressure is determined by a specified turbomachinery efficiency
model. Instead of using the physics-based turbomachinery model, a simpler model with
constant isentropic efficiency is used to determine the exhaust pressure that satisfies the
turbomachinery power balance based on mass flow rate from the physics-based engine
system model. With the specified turbomachinery efficiency and intake manifold
condition, the effect from the turbomachinery matching is eliminated.
At the start of the calculations, initial estimates are made for the exhaust manifold
temperature and volumetric efficiency of the engine as these are inputs to the specified
turbomachinery efficiency model that determines the exhaust manifold pressure. Then the
physics-based simulation with the intake plenum and modified exhaust manifold model is
used to update the estimated exhaust manifold temperature and volumetric efficiency of
the engine until the convergence is achieved.
200
201
202
203
204
140 145 150 155 160 165 170 175 180
Intake Valve Closing Timing, degrees ATDC
BSF
C, g
/kW
h
Figure 14. BSFC with varying intake valve closing timing
In order to eliminate the effect of air-fuel equivalence ratio on BSFC, it is kept
constant by adjusting the fuel injection as the air flow to the engine varies with intake
valve closing timing. The compression ratio is also adjusted to produce the same peak
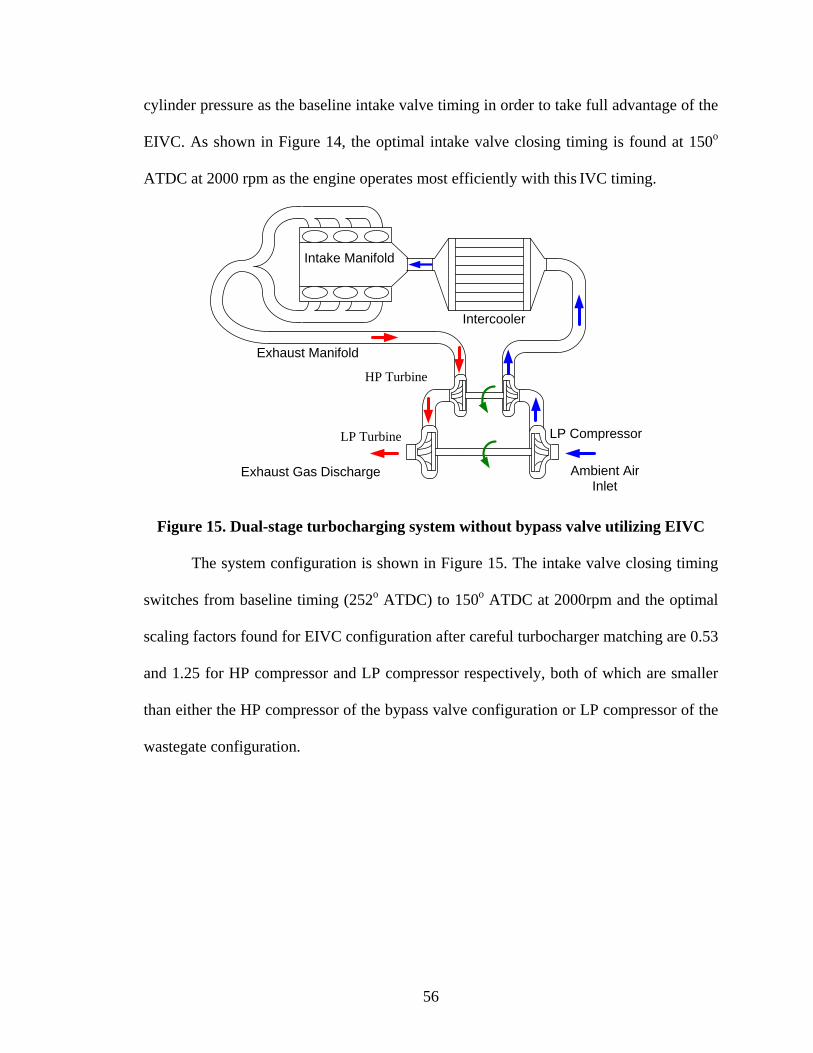
56
cylinder pressure as the baseline intake valve timing in order to take full advantage of the
EIVC. As shown in Figure 14, the optimal intake valve closing timing is found at 150o
ATDC at 2000 rpm as the engine operates most efficiently with this IVC timing.
Figure 15. Dual-stage turbocharging system without bypass valve utilizing EIVC
The system configuration is shown in Figure 15. The intake valve closing timing
switches from baseline timing (252o ATDC) to 150o ATDC at 2000rpm and the optimal
scaling factors found for EIVC configuration after careful turbocharger matching are 0.53
and 1.25 for HP compressor and LP compressor respectively, both of which are smaller
than either the HP compressor of the bypass valve configuration or LP compressor of the
wastegate configuration.
Intercooler
LP Compressor
HP Turbine
LP Turbine
Ambient Air Inlet
Exhaust Gas Discharge
Intake Manifold
Exhaust Manifold
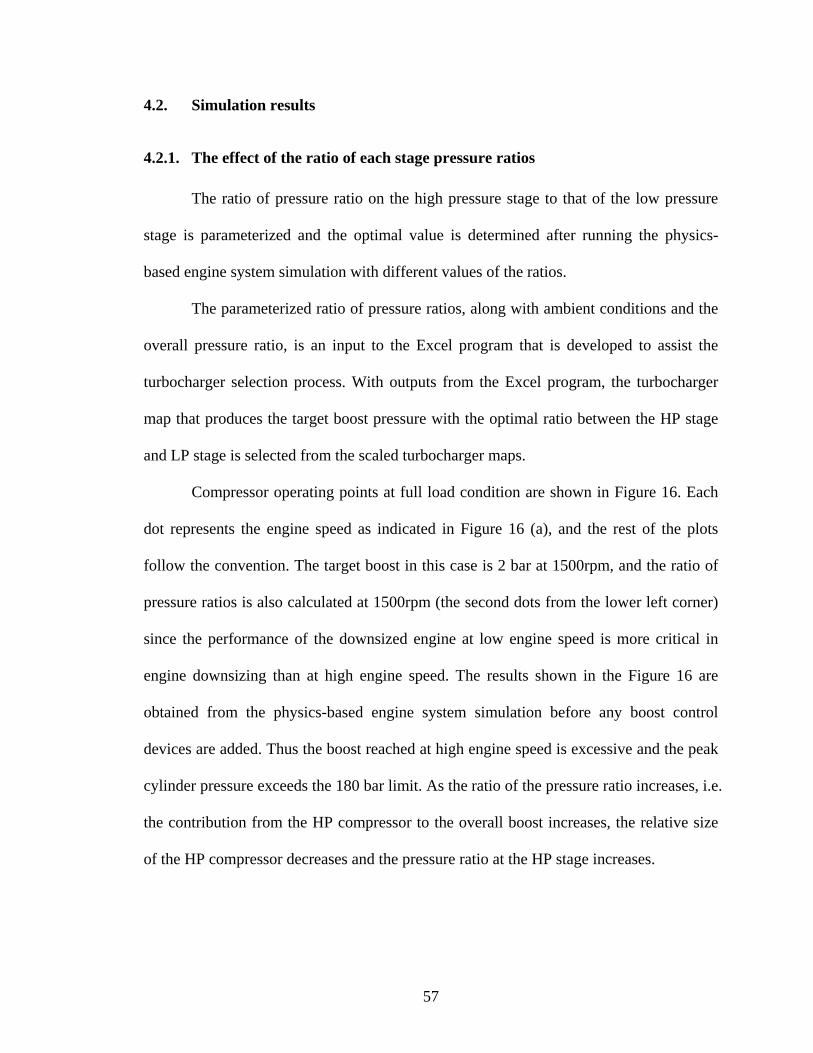
57
4.2. Simulation results
4.2.1. The effect of the ratio of each stage pressure ratios
The ratio of pressure ratio on the high pressure stage to that of the low pressure
stage is parameterized and the optimal value is determined after running the physics-
based engine system simulation with different values of the ratios.
The parameterized ratio of pressure ratios, along with ambient conditions and the
overall pressure ratio, is an input to the Excel program that is developed to assist the
turbocharger selection process. With outputs from the Excel program, the turbocharger
map that produces the target boost pressure with the optimal ratio between the HP stage
and LP stage is selected from the scaled turbocharger maps.
Compressor operating points at full load condition are shown in Figure 16. Each
dot represents the engine speed as indicated in Figure 16 (a), and the rest of the plots
follow the convention. The target boost in this case is 2 bar at 1500rpm, and the ratio of
pressure ratios is also calculated at 1500rpm (the second dots from the lower left corner)
since the performance of the downsized engine at low engine speed is more critical in
engine downsizing than at high engine speed. The results shown in the Figure 16 are
obtained from the physics-based engine system simulation before any boost control
devices are added. Thus the boost reached at high engine speed is excessive and the peak
cylinder pressure exceeds the 180 bar limit. As the ratio of the pressure ratio increases, i.e.
the contribution from the HP compressor to the overall boost increases, the relative size
of the HP compressor decreases and the pressure ratio at the HP stage increases.
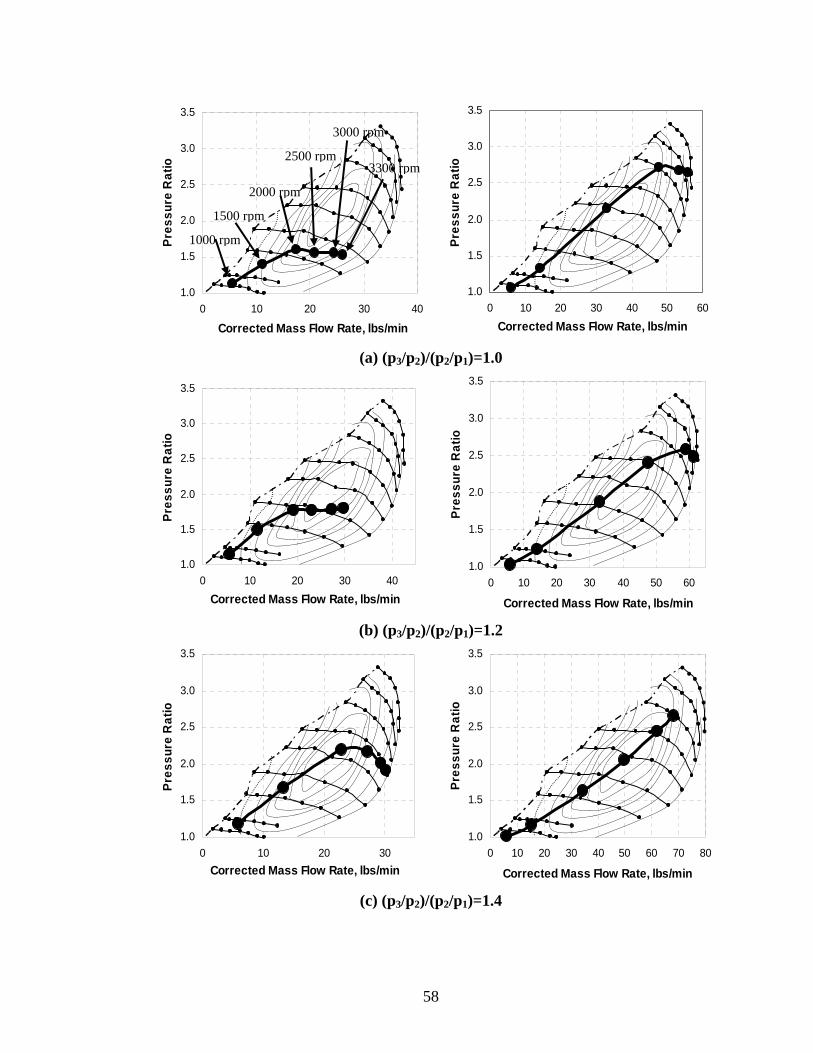
58
(a) (p3/p2)/(p2/p1)=1.0
(b) (p3/p2)/(p2/p1)=1.2
(c) (p3/p2)/(p2/p1)=1.4
1.0
1.5
2.0
2.5
3.0
3.5
0 10 20 30 40
Corrected Mass Flow Rate, lbs/min
Pres
sure
Rat
io
1.0
1.5
2.0
2.5
3.0
3.5
0 10 20 30 40 50 60
Corrected Mass Flow Rate, lbs/min
Pres
sure
Rat
io
1000 rpm
1500 rpm
3000 rpm
2000 rpm
2500 rpm3300 rpm
1.0
1.5
2.0
2.5
3.0
3.5
0 10 20 30 40
Corrected Mass Flow Rate, lbs/min
Pres
sure
Rat
io
1.0
1.5
2.0
2.5
3.0
3.5
0 10 20 30 40 50 60
Corrected Mass Flow Rate, lbs/min
Pres
sure
Rat
io
1.0
1.5
2.0
2.5
3.0
3.5
0 10 20 30Corrected Mass Flow Rate, lbs/min
Pres
sure
Rat
io
1.0
1.5
2.0
2.5
3.0
3.5
0 10 20 30 40 50 60 70 80
Corrected Mass Flow Rate, lbs/min
Pres
sure
Rat
io

59
(d) (p3/p2)/(p2/p1)=1.6 Figure 16. Effect of ratios of each stage pressure ratios on compressor performance
This is reflected in the brake torque produced by the engine and fuel consumption
as shown in Figure 17. With higher ratio of HP stage contribution, i.e. smaller HP
turbocharger, the engine produces more torque at lower engine speed, and less torque at
higher engine speeds as the turbocharger efficiency of the HP turbocharger is reduced
substantially mainly due to its limited flow capacity. The brake specific fuel consumption
(BSFC) also suffers from the reduced turbocharger efficiency at higher engine speeds.
Figure 17. Effect of ratios of each stage pressure ratios on brake torque and BSFC
On the other hand, with lower ratio of HP contribution, the HP compressor is
relatively larger and has sufficient flow capacity even at higher engine speeds, but the LP
250
350
450
550
650
750
1000 1500 2000 2500 3000
Engine Speed, rpm
Bra
ke T
orqu
e, N
-m
(p3/p2)/(p2/p1) = 1.0(p3/p2)/(p2/p1) = 1.2(p3/p2)/(p2/p1) = 1.4(p3/p2)/(p2/p1) = 1.6
180
200
220
240
260
280
300
1000 1500 2000 2500 3000
Engine Speed, rpm
BSF
C, g
/kw
-h
(p3/p2)/(p2/p1) = 1.0(p3/p2)/(p2/p1) = 1.2(p3/p2)/(p2/p1) = 1.4(p3/p2)/(p2/p1) = 1.6
1.0
1.5
2.0
2.5
3.0
3.5
0 10 20 30Corrected Mass Flow Rate, lbs/min
Pres
sure
Rat
io
1.0
1.5
2.0
2.5
3.0
3.5
0 10 20 30 40 50 60 70 80 90
Corrected Mass Flow Rate, lbs/min
Pres
sure
Rat
io
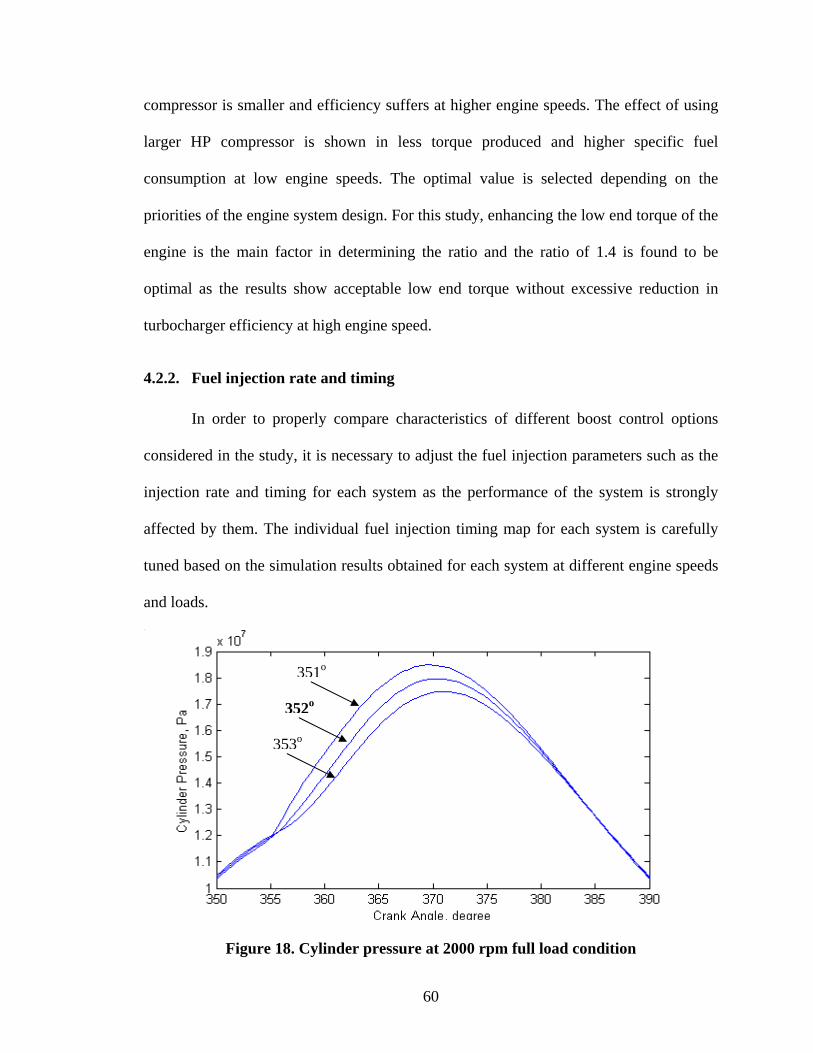
60
compressor is smaller and efficiency suffers at higher engine speeds. The effect of using
larger HP compressor is shown in less torque produced and higher specific fuel
consumption at low engine speeds. The optimal value is selected depending on the
priorities of the engine system design. For this study, enhancing the low end torque of the
engine is the main factor in determining the ratio and the ratio of 1.4 is found to be
optimal as the results show acceptable low end torque without excessive reduction in
turbocharger efficiency at high engine speed.
4.2.2. Fuel injection rate and timing
In order to properly compare characteristics of different boost control options
considered in the study, it is necessary to adjust the fuel injection parameters such as the
injection rate and timing for each system as the performance of the system is strongly
affected by them. The individual fuel injection timing map for each system is carefully
tuned based on the simulation results obtained for each system at different engine speeds
and loads.
Figure 18. Cylinder pressure at 2000 rpm full load condition
352o
353o
351o
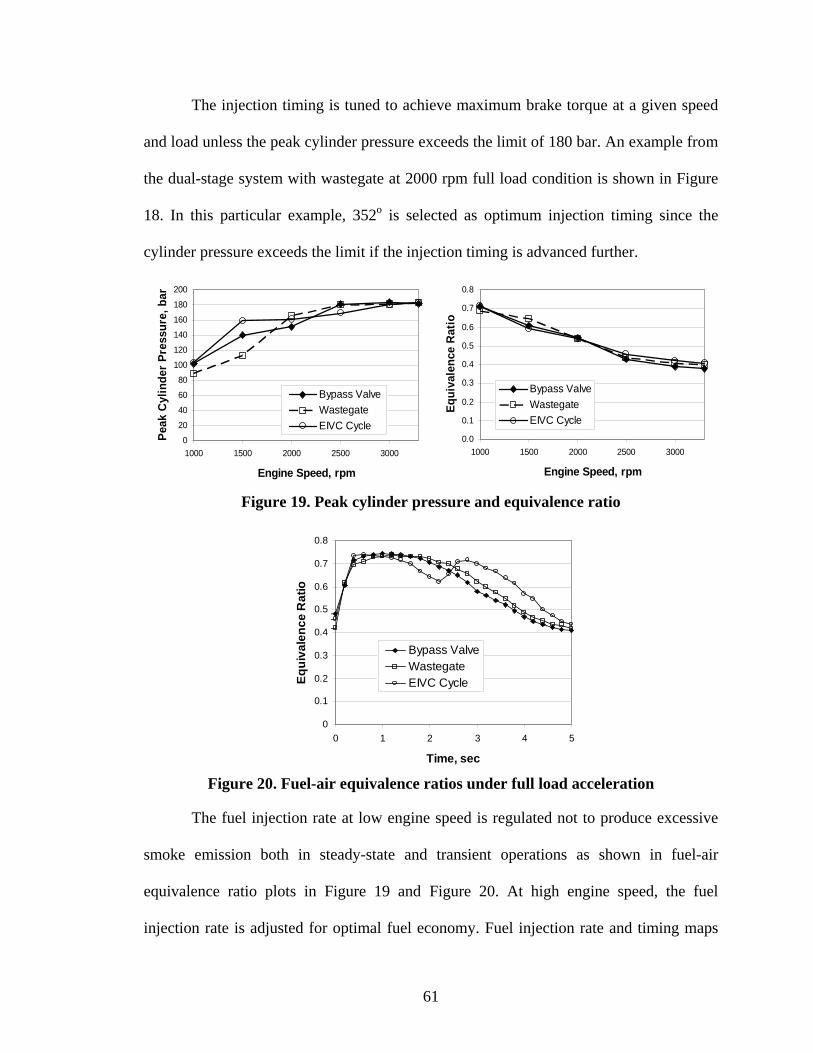
61
The injection timing is tuned to achieve maximum brake torque at a given speed
and load unless the peak cylinder pressure exceeds the limit of 180 bar. An example from
the dual-stage system with wastegate at 2000 rpm full load condition is shown in Figure
18. In this particular example, 352o is selected as optimum injection timing since the
cylinder pressure exceeds the limit if the injection timing is advanced further.
Figure 19. Peak cylinder pressure and equivalence ratio
0
0.1
0.2
0.3
0.4
0.5
0.6
0.7
0.8
0 1 2 3 4 5
Time, sec
Equi
vale
nce
Rat
io
Bypass ValveWastegateEIVC Cycle
Figure 20. Fuel-air equivalence ratios under full load acceleration
The fuel injection rate at low engine speed is regulated not to produce excessive
smoke emission both in steady-state and transient operations as shown in fuel-air
equivalence ratio plots in Figure 19 and Figure 20. At high engine speed, the fuel
injection rate is adjusted for optimal fuel economy. Fuel injection rate and timing maps
0.0
0.1
0.2
0.3
0.4
0.5
0.6
0.7
0.8
1000 1500 2000 2500 3000
Engine Speed, rpm
Equi
vale
nce
Rat
io
Bypass ValveWastegateEIVC Cycle
0
20
40
60
80
100
120
140
160
180
200
1000 1500 2000 2500 3000
Engine Speed, rpm
Peak
Cyl
inde
r Pr
essu
re, b
ar
Bypass ValveWastegateEIVC Cycle
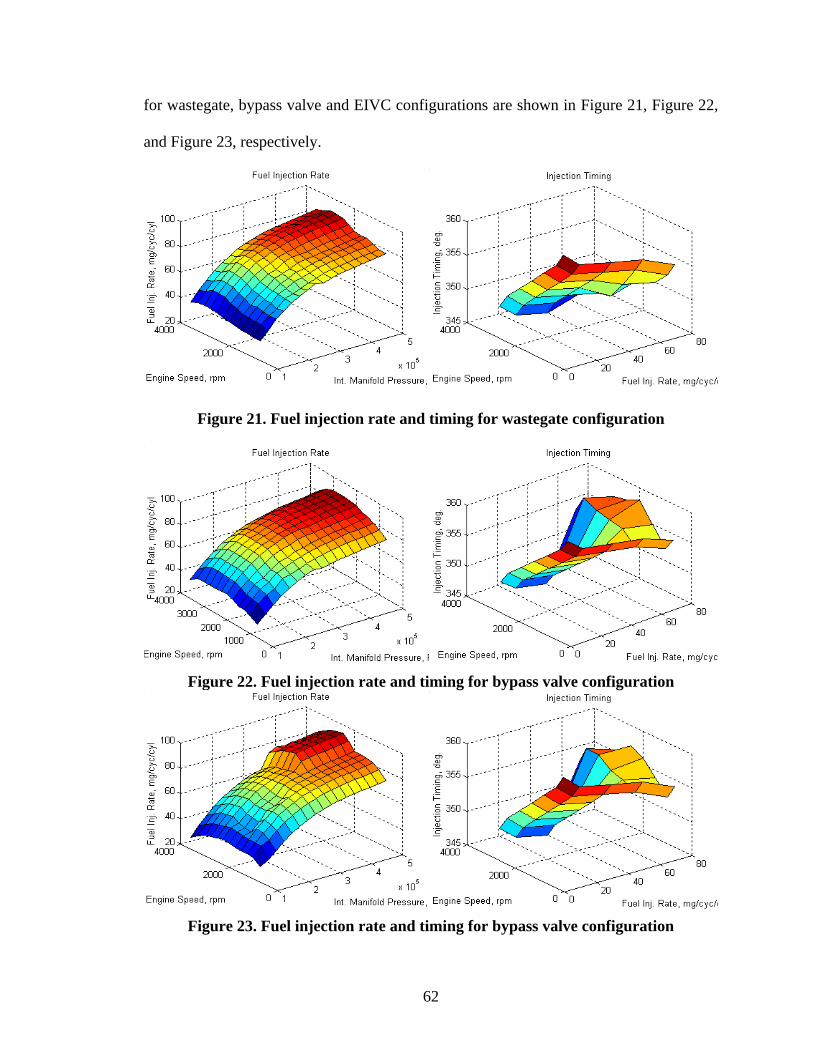
62
for wastegate, bypass valve and EIVC configurations are shown in Figure 21, Figure 22,
and Figure 23, respectively.
Figure 21. Fuel injection rate and timing for wastegate configuration
Figure 22. Fuel injection rate and timing for bypass valve configuration
Figure 23. Fuel injection rate and timing for bypass valve configuration
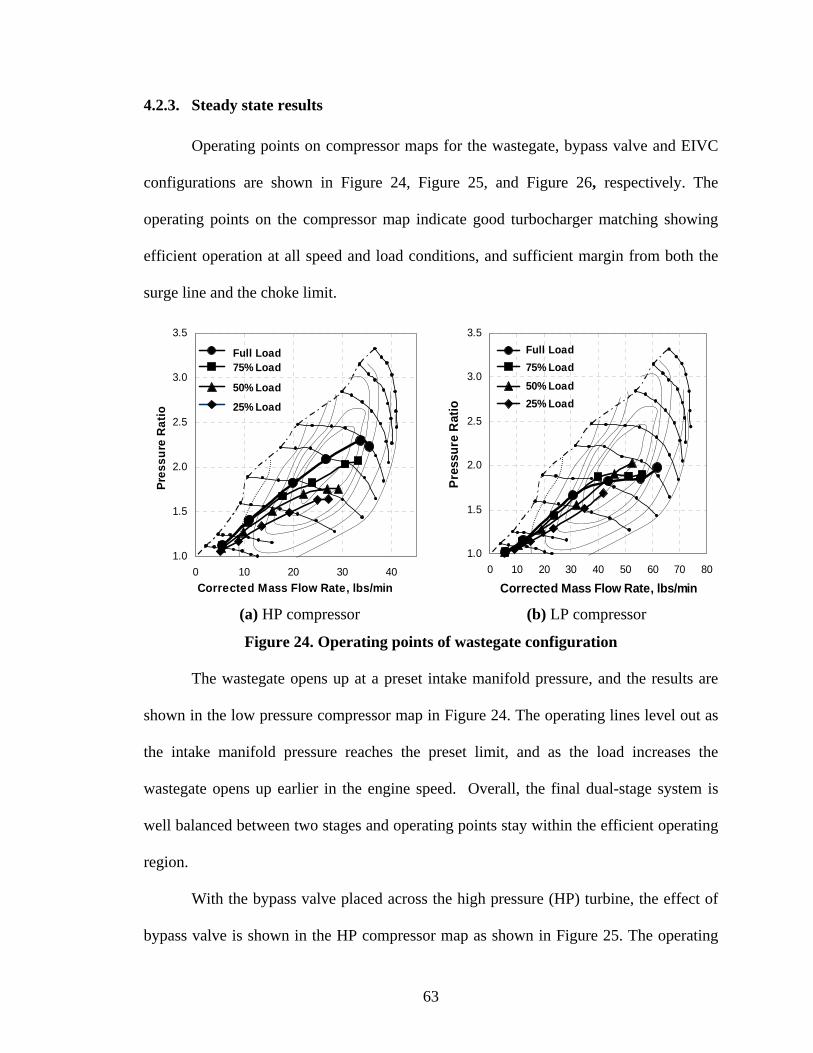
63
4.2.3. Steady state results
Operating points on compressor maps for the wastegate, bypass valve and EIVC
configurations are shown in Figure 24, Figure 25, and Figure 26, respectively. The
operating points on the compressor map indicate good turbocharger matching showing
efficient operation at all speed and load conditions, and sufficient margin from both the
surge line and the choke limit.
(a) HP compressor (b) LP compressor
Figure 24. Operating points of wastegate configuration
The wastegate opens up at a preset intake manifold pressure, and the results are
shown in the low pressure compressor map in Figure 24. The operating lines level out as
the intake manifold pressure reaches the preset limit, and as the load increases the
wastegate opens up earlier in the engine speed. Overall, the final dual-stage system is
well balanced between two stages and operating points stay within the efficient operating
region.
With the bypass valve placed across the high pressure (HP) turbine, the effect of
bypass valve is shown in the HP compressor map as shown in Figure 25. The operating
1.0
1.5
2.0
2.5
3.0
3.5
0 10 20 30 40Corrected Mass Flow Rate, lbs/min
Pres
sure
Rat
io
Full Load
25% Load
50% Load
75% Load
1.0
1.5
2.0
2.5
3.0
3.5
0 10 20 30 40 50 60 70 80
Corrected Mass Flow Rate, lbs/min
Pres
sure
Rat
io
Full Load
25% Load50% Load75% Load
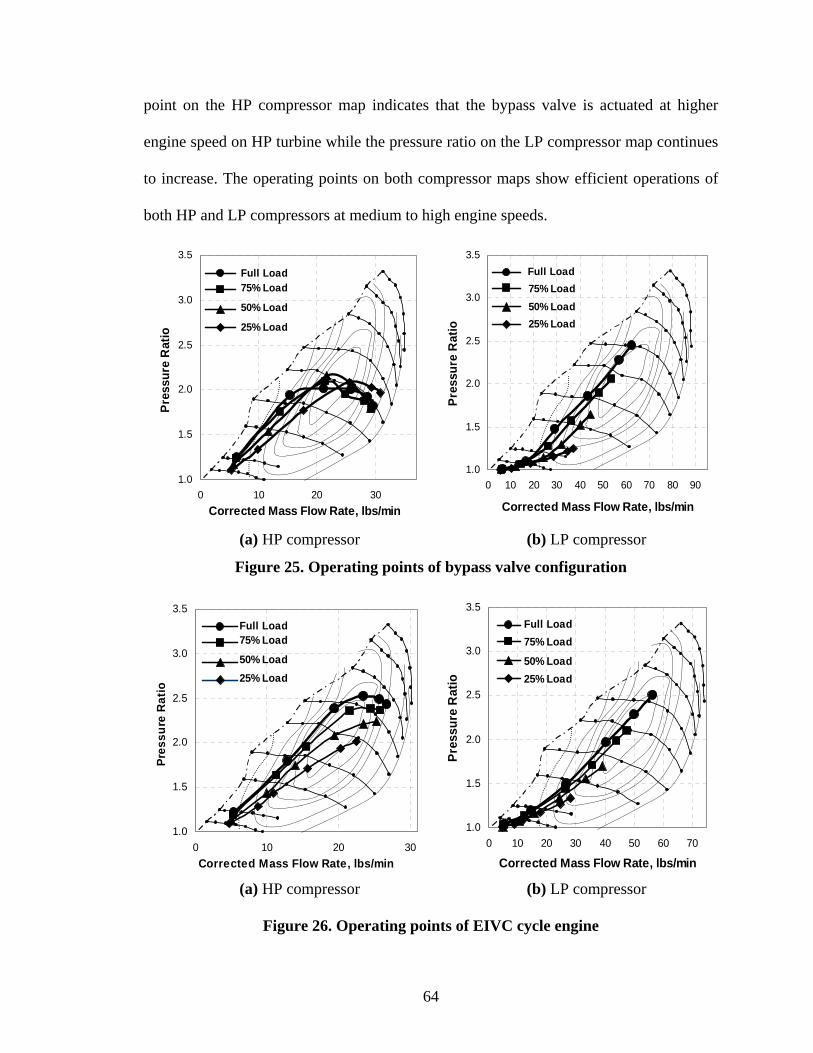
64
point on the HP compressor map indicates that the bypass valve is actuated at higher
engine speed on HP turbine while the pressure ratio on the LP compressor map continues
to increase. The operating points on both compressor maps show efficient operations of
both HP and LP compressors at medium to high engine speeds.
(a) HP compressor (b) LP compressor
Figure 25. Operating points of bypass valve configuration
(a) HP compressor (b) LP compressor
Figure 26. Operating points of EIVC cycle engine
1.0
1.5
2.0
2.5
3.0
3.5
0 10 20 30Corrected Mass Flow Rate, lbs/min
Pres
sure
Rat
io
Full Load
25% Load50% Load
75% Load
1.0
1.5
2.0
2.5
3.0
3.5
0 10 20 30 40 50 60 70
Corrected Mass Flow Rate, lbs/min
Pres
sure
Rat
io
Full Load
25% Load50% Load
75% Load
1.0
1.5
2.0
2.5
3.0
3.5
0 10 20 30Corrected Mass Flow Rate, lbs/min
Pres
sure
Rat
io
Full Load
25% Load
50% Load
75% Load
1.0
1.5
2.0
2.5
3.0
3.5
0 10 20 30 40 50 60 70 80 90
Corrected Mass Flow Rate, lbs/min
Pres
sure
Rat
io
Full Load
25% Load50% Load75% Load
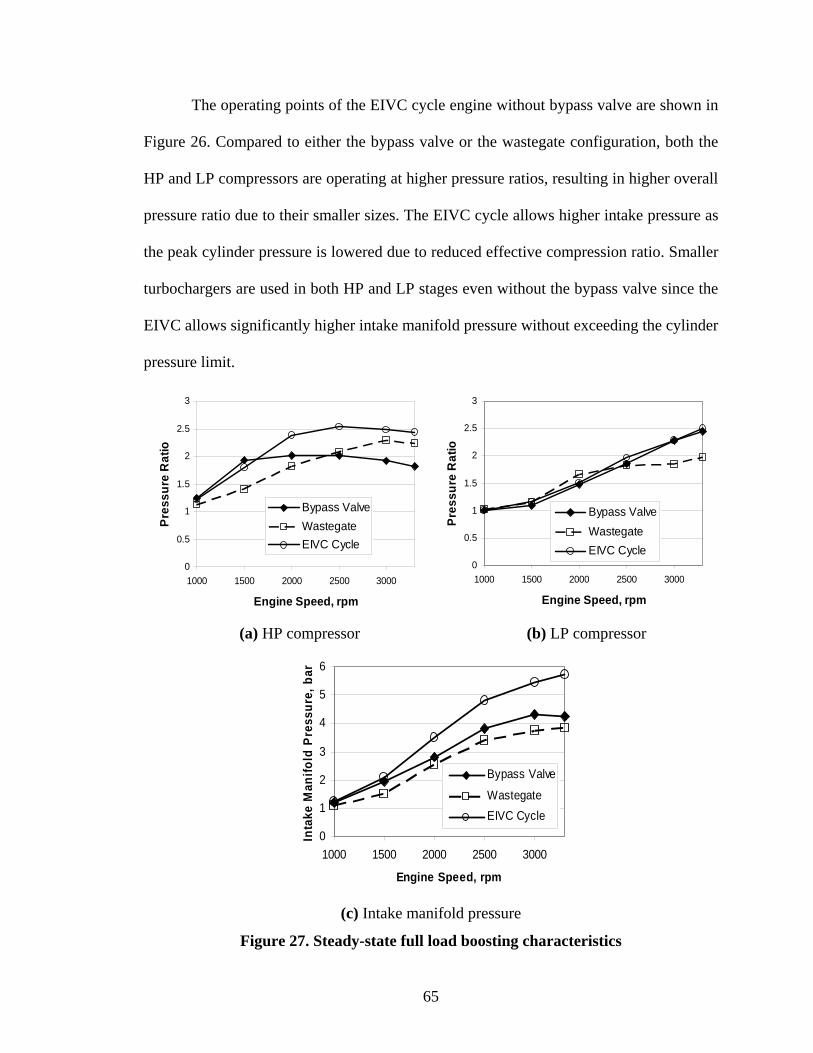
65
The operating points of the EIVC cycle engine without bypass valve are shown in
Figure 26. Compared to either the bypass valve or the wastegate configuration, both the
HP and LP compressors are operating at higher pressure ratios, resulting in higher overall
pressure ratio due to their smaller sizes. The EIVC cycle allows higher intake pressure as
the peak cylinder pressure is lowered due to reduced effective compression ratio. Smaller
turbochargers are used in both HP and LP stages even without the bypass valve since the
EIVC allows significantly higher intake manifold pressure without exceeding the cylinder
pressure limit.
(a) HP compressor (b) LP compressor
0
1
2
3
4
5
6
1000 1500 2000 2500 3000
Engine Speed, rpm
Inta
ke M
anifo
ld P
ress
ure,
bar
Bypass Valve
WastegateEIVC Cycle
(c) Intake manifold pressure
Figure 27. Steady-state full load boosting characteristics
0
0.5
1
1.5
2
2.5
3
1000 1500 2000 2500 3000
Engine Speed, rpm
Pres
sure
Rat
io
Bypass ValveWastegateEIVC Cycle
0
0.5
1
1.5
2
2.5
3
1000 1500 2000 2500 3000
Engine Speed, rpm
Pres
sure
Rat
io
Bypass ValveWastegateEIVC Cycle
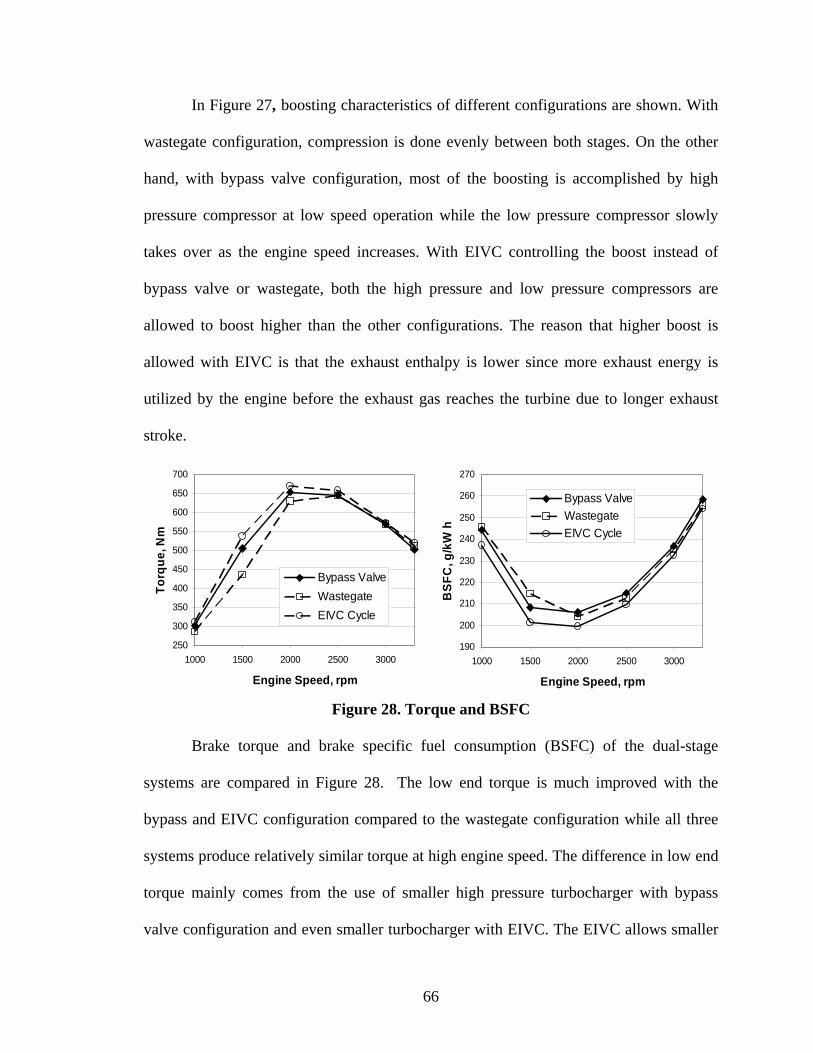
66
In Figure 27, boosting characteristics of different configurations are shown. With
wastegate configuration, compression is done evenly between both stages. On the other
hand, with bypass valve configuration, most of the boosting is accomplished by high
pressure compressor at low speed operation while the low pressure compressor slowly
takes over as the engine speed increases. With EIVC controlling the boost instead of
bypass valve or wastegate, both the high pressure and low pressure compressors are
allowed to boost higher than the other configurations. The reason that higher boost is
allowed with EIVC is that the exhaust enthalpy is lower since more exhaust energy is
utilized by the engine before the exhaust gas reaches the turbine due to longer exhaust
stroke.
Figure 28. Torque and BSFC
Brake torque and brake specific fuel consumption (BSFC) of the dual-stage
systems are compared in Figure 28. The low end torque is much improved with the
bypass and EIVC configuration compared to the wastegate configuration while all three
systems produce relatively similar torque at high engine speed. The difference in low end
torque mainly comes from the use of smaller high pressure turbocharger with bypass
valve configuration and even smaller turbocharger with EIVC. The EIVC allows smaller
250
300
350
400
450
500
550
600
650
700
1000 1500 2000 2500 3000
Engine Speed, rpm
Torq
ue, N
m
Bypass ValveWastegateEIVC Cycle
190
200
210
220
230
240
250
260
270
1000 1500 2000 2500 3000
Engine Speed, rpm
BSF
C, g
/kW
h
Bypass ValveWastegateEIVC Cycle
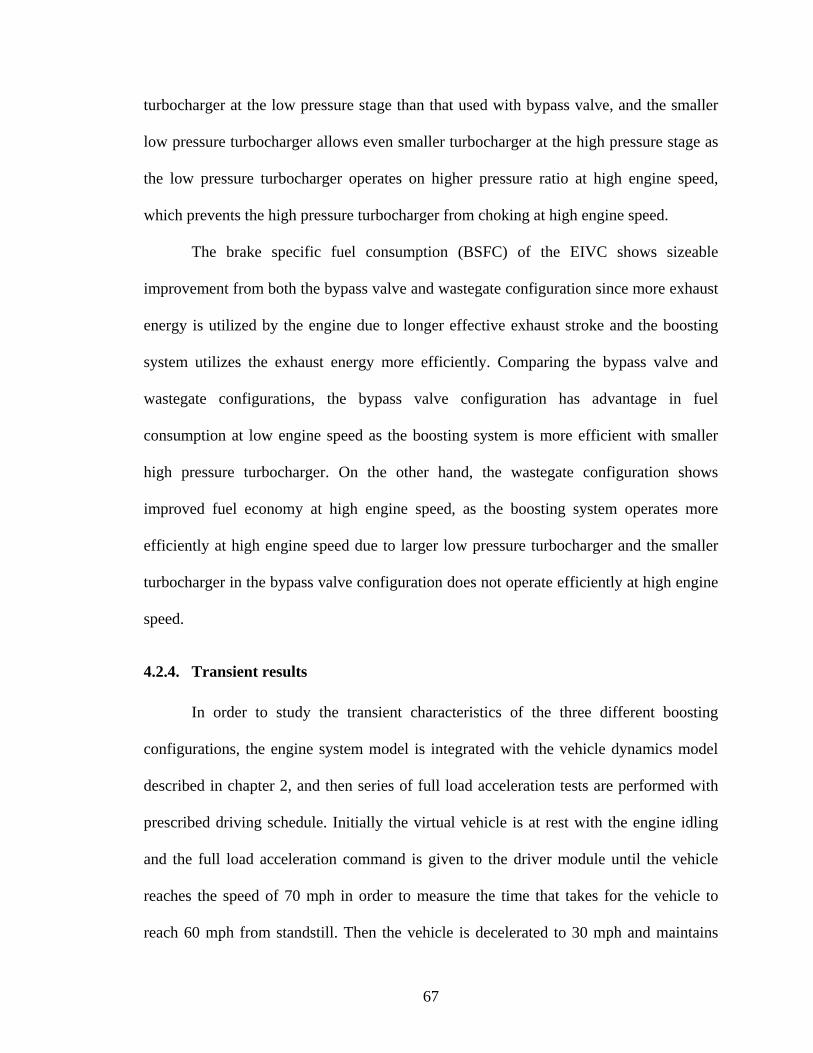
67
turbocharger at the low pressure stage than that used with bypass valve, and the smaller
low pressure turbocharger allows even smaller turbocharger at the high pressure stage as
the low pressure turbocharger operates on higher pressure ratio at high engine speed,
which prevents the high pressure turbocharger from choking at high engine speed.
The brake specific fuel consumption (BSFC) of the EIVC shows sizeable
improvement from both the bypass valve and wastegate configuration since more exhaust
energy is utilized by the engine due to longer effective exhaust stroke and the boosting
system utilizes the exhaust energy more efficiently. Comparing the bypass valve and
wastegate configurations, the bypass valve configuration has advantage in fuel
consumption at low engine speed as the boosting system is more efficient with smaller
high pressure turbocharger. On the other hand, the wastegate configuration shows
improved fuel economy at high engine speed, as the boosting system operates more
efficiently at high engine speed due to larger low pressure turbocharger and the smaller
turbocharger in the bypass valve configuration does not operate efficiently at high engine
speed.
4.2.4. Transient results
In order to study the transient characteristics of the three different boosting
configurations, the engine system model is integrated with the vehicle dynamics model
described in chapter 2, and then series of full load acceleration tests are performed with
prescribed driving schedule. Initially the virtual vehicle is at rest with the engine idling
and the full load acceleration command is given to the driver module until the vehicle
reaches the speed of 70 mph in order to measure the time that takes for the vehicle to
reach 60 mph from standstill. Then the vehicle is decelerated to 30 mph and maintains
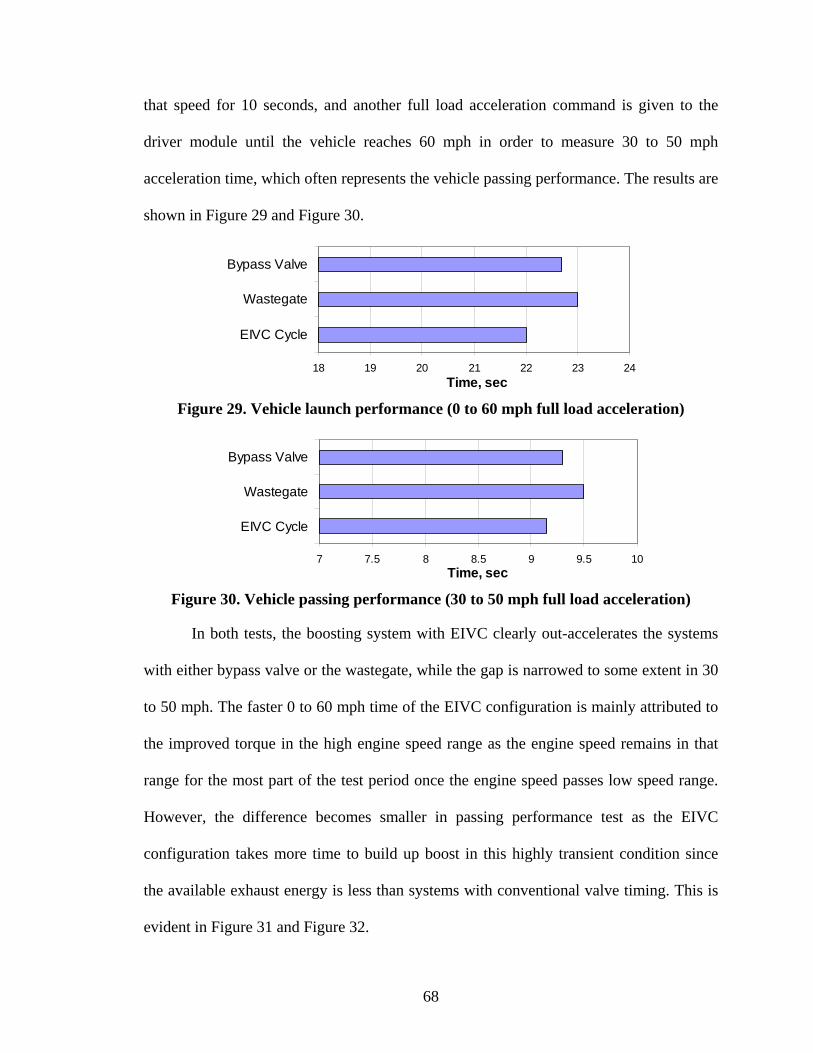
68
that speed for 10 seconds, and another full load acceleration command is given to the
driver module until the vehicle reaches 60 mph in order to measure 30 to 50 mph
acceleration time, which often represents the vehicle passing performance. The results are
shown in Figure 29 and Figure 30.
18 19 20 21 22 23 24
EIVC Cycle
Wastegate
Bypass Valve
Time, sec
Figure 29. Vehicle launch performance (0 to 60 mph full load acceleration)
7 7.5 8 8.5 9 9.5 10
EIVC Cycle
Wastegate
Bypass Valve
Time, sec
Figure 30. Vehicle passing performance (30 to 50 mph full load acceleration)
In both tests, the boosting system with EIVC clearly out-accelerates the systems
with either bypass valve or the wastegate, while the gap is narrowed to some extent in 30
to 50 mph. The faster 0 to 60 mph time of the EIVC configuration is mainly attributed to
the improved torque in the high engine speed range as the engine speed remains in that
range for the most part of the test period once the engine speed passes low speed range.
However, the difference becomes smaller in passing performance test as the EIVC
configuration takes more time to build up boost in this highly transient condition since
the available exhaust energy is less than systems with conventional valve timing. This is
evident in Figure 31 and Figure 32.
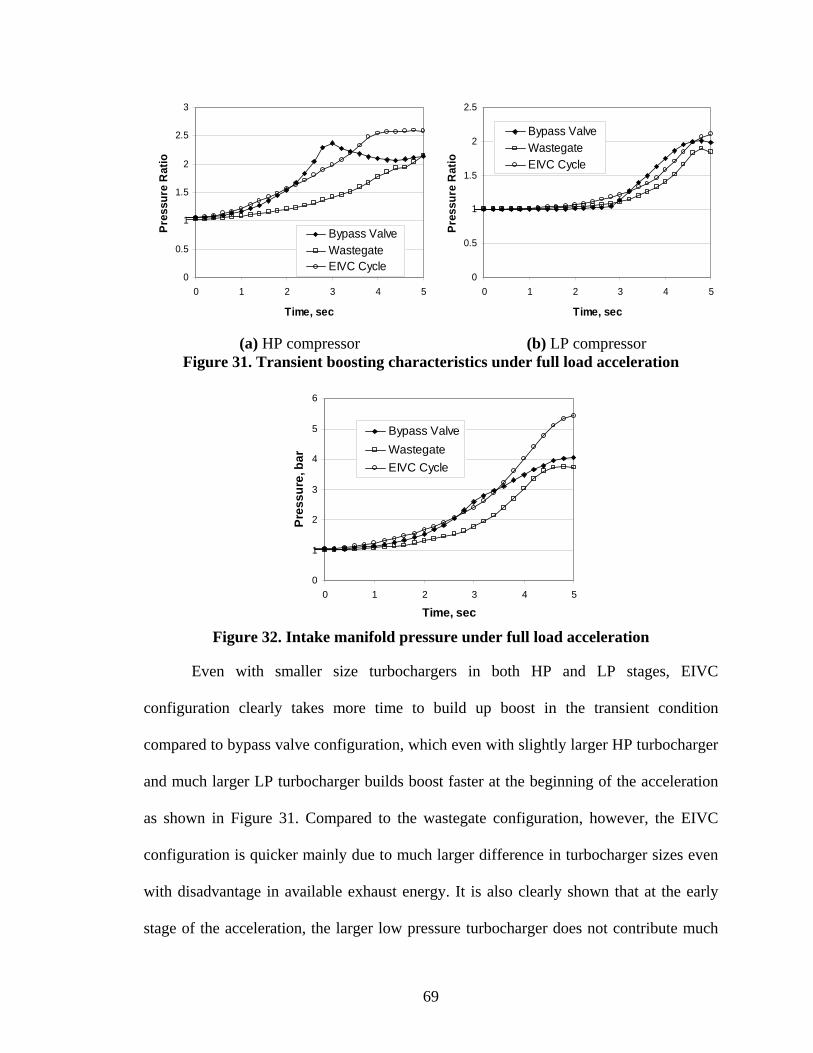
69
(a) HP compressor (b) LP compressor
Figure 31. Transient boosting characteristics under full load acceleration
0
1
2
3
4
5
6
0 1 2 3 4 5
Time, sec
Pres
sure
, bar
Bypass ValveWastegateEIVC Cycle
Figure 32. Intake manifold pressure under full load acceleration
Even with smaller size turbochargers in both HP and LP stages, EIVC
configuration clearly takes more time to build up boost in the transient condition
compared to bypass valve configuration, which even with slightly larger HP turbocharger
and much larger LP turbocharger builds boost faster at the beginning of the acceleration
as shown in Figure 31. Compared to the wastegate configuration, however, the EIVC
configuration is quicker mainly due to much larger difference in turbocharger sizes even
with disadvantage in available exhaust energy. It is also clearly shown that at the early
stage of the acceleration, the larger low pressure turbocharger does not contribute much
0
0.5
1
1.5
2
2.5
3
0 1 2 3 4 5
Time, sec
Pres
sure
Rat
io
Bypass ValveWastegateEIVC Cycle
0
0.5
1
1.5
2
2.5
0 1 2 3 4 5
Time, sec
Pres
sure
Rat
io
Bypass ValveWastegateEIVC Cycle
70
to the overall boost for both configurations and the relative difference in size is not as
important as the high pressure turbocharger size.
4.3. Summary
In this chapter, three different boost control options are compared in terms of
engine performance and fuel consumption. The dual-stage turbocharger matching method
described in chapter 3 is applied to optimize the turbocharger selections for each boost
control options, and the fuel injection rates and timings are also optimized for the
performance and fuel economy improvements using the engine simulation model
described in chapter 2. The results demonstrate very good utilization of both high
pressure and low pressure turbochargers in terms of turbomachinery efficiency and
engine torque characteristics.
The boost control options considered in this chapter include three basic
configurations; a wastegate across the LP turbine, a bypass valve across HP turbine and a
system utilizing EIVC. Between the exhaust bypassing mechanisms investigated in the
study, the bypass valve across the HP stage provides better low end torque and transient
responses mainly due to the use of smaller turbocharger in the HP stage where the
aforementioned performances are critically affected. The bypass configuration has shown
slightly worse performance and fuel economy at high engine speed than the wastegate
configuration as the smaller turbocharger chokes with increased air flow. However, the
bypass valve configuration is preferable since the performance at low engine speed and in
transient condition is more critical in order to allow aggressive engine downsizing.
Overall the system with EIVC proved to be the best among the options in terms of
the engine performance both in steady state and transient operating conditions and fuel
71
economy improvement. The EIVC cycle has inherent advantage over the conventional
valve timing in terms of thermal efficiency as the effective exhaust stroke is longer than
the intake stroke utilizing more exhaust energy. It is also proven to be very effective and
efficient in controlling boost in a dual-stage turbocharging system as it allows the
boosting system to operate without exhaust gas bypassing mechanism, which is possible
because the exhaust enthalpy is lower with longer effective exhaust stroke and the peak
cylinder pressure is reduced due to charge cooling effect allowing much higher boost
without exceeding the mechanical limits of the engine block.
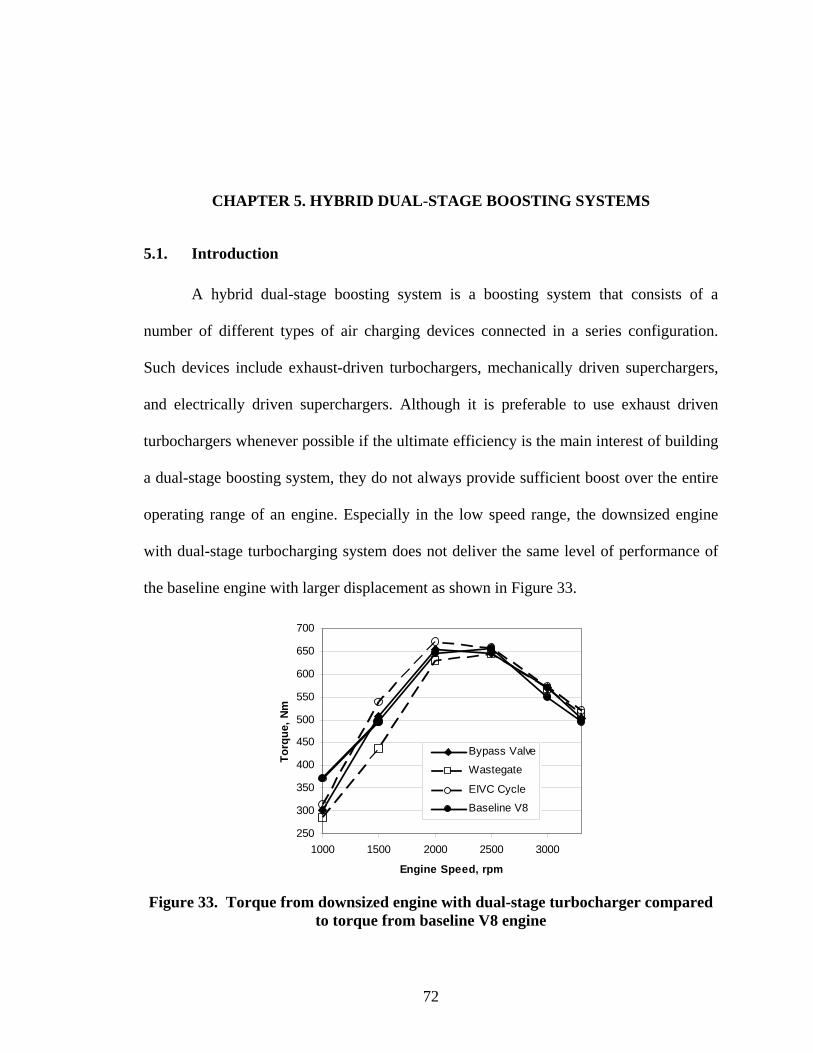
72
CHAPTER 5. HYBRID DUAL-STAGE BOOSTING SYSTEMS
5.1. Introduction
A hybrid dual-stage boosting system is a boosting system that consists of a
number of different types of air charging devices connected in a series configuration.
Such devices include exhaust-driven turbochargers, mechanically driven superchargers,
and electrically driven superchargers. Although it is preferable to use exhaust driven
turbochargers whenever possible if the ultimate efficiency is the main interest of building
a dual-stage boosting system, they do not always provide sufficient boost over the entire
operating range of an engine. Especially in the low speed range, the downsized engine
with dual-stage turbocharging system does not deliver the same level of performance of
the baseline engine with larger displacement as shown in Figure 33.
250
300
350
400
450
500
550
600
650
700
1000 1500 2000 2500 3000
Engine Speed, rpm
Torq
ue, N
m
Bypass Valve
Wastegate
EIVC Cycle
Baseline V8
Figure 33. Torque from downsized engine with dual-stage turbocharger compared
to torque from baseline V8 engine

73
While the torque produced at mid to high engine speed is comparable or even
exceeds the torque produced by the baseline V8 engine, the torque produced in the lower
rpm range is noticeably lower than that of the baseline engine. This is where the
hybridization of the dual-stage boosting system is desirable even though the fuel
economy must be sacrificed to some extent in favor of performance. For example, a
mechanically driven supercharger connected in series with an exhaust driven
turbocharger can provide strong boost even at low engine speed taking advantage of its
direct connection to the output shaft of the engine. The combined effect of the boosting
system is more consistent boost over the entire operating range of the engine at the cost
of slightly less overall efficiency.
Electrically driven superchargers are even better in this regard since they are
completely decoupled from the engine and have the freedom to spin at any rate regardless
of the engine operating condition. With this feature, the hybrid boosting system can
become an effective method not only to increase torque at low engine speed, but also to
reduce smoke by ensuring sufficient air volume. However, the electric motor and power
supply system are the limiting factors [67, 68]. The battery and the generator cannot
supply sufficient power for the electric compressor to maintain air flow as the engine
displacement volume increases.
In general, the hybridization of the boosting system results in fewer compromises
in the boosting system matching. With the hybrid components enhancing the low speed
performance, the turbocharger needs to perform efficiently only within the high speed
range, which in turn improves the overall efficiency of the system.
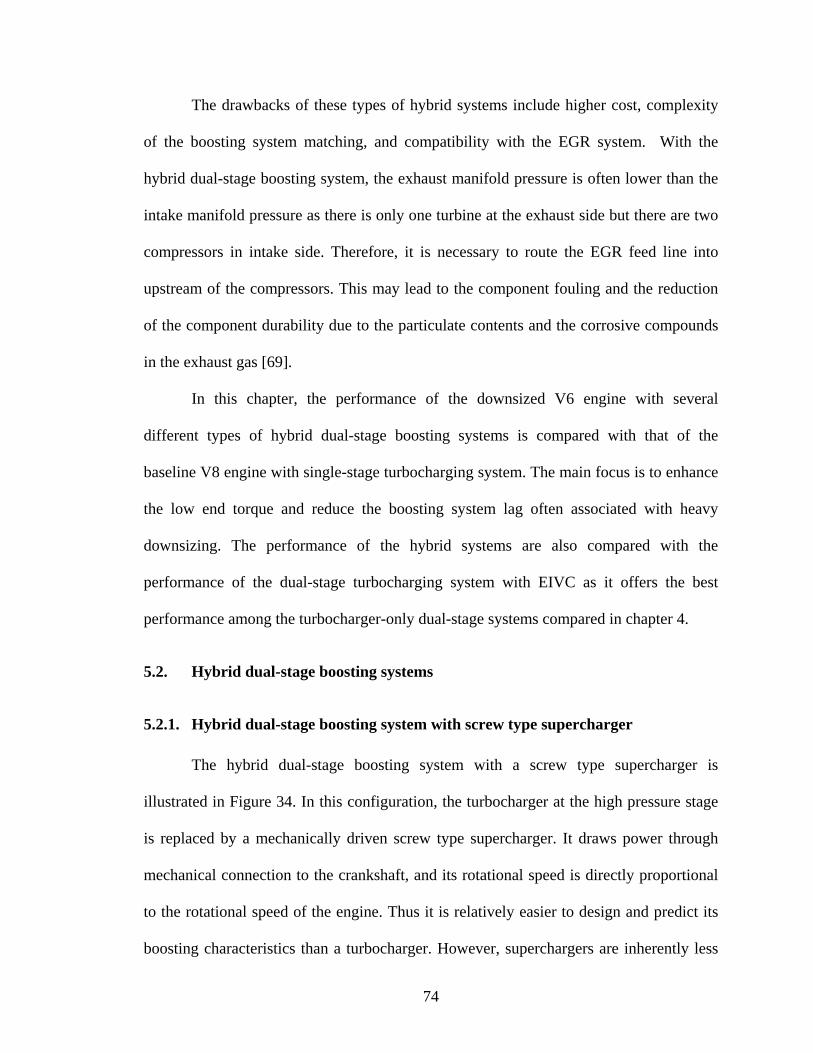
74
The drawbacks of these types of hybrid systems include higher cost, complexity
of the boosting system matching, and compatibility with the EGR system. With the
hybrid dual-stage boosting system, the exhaust manifold pressure is often lower than the
intake manifold pressure as there is only one turbine at the exhaust side but there are two
compressors in intake side. Therefore, it is necessary to route the EGR feed line into
upstream of the compressors. This may lead to the component fouling and the reduction
of the component durability due to the particulate contents and the corrosive compounds
in the exhaust gas [69].
In this chapter, the performance of the downsized V6 engine with several
different types of hybrid dual-stage boosting systems is compared with that of the
baseline V8 engine with single-stage turbocharging system. The main focus is to enhance
the low end torque and reduce the boosting system lag often associated with heavy
downsizing. The performance of the hybrid systems are also compared with the
performance of the dual-stage turbocharging system with EIVC as it offers the best
performance among the turbocharger-only dual-stage systems compared in chapter 4.
5.2. Hybrid dual-stage boosting systems
5.2.1. Hybrid dual-stage boosting system with screw type supercharger
The hybrid dual-stage boosting system with a screw type supercharger is
illustrated in Figure 34. In this configuration, the turbocharger at the high pressure stage
is replaced by a mechanically driven screw type supercharger. It draws power through
mechanical connection to the crankshaft, and its rotational speed is directly proportional
to the rotational speed of the engine. Thus it is relatively easier to design and predict its
boosting characteristics than a turbocharger. However, superchargers are inherently less
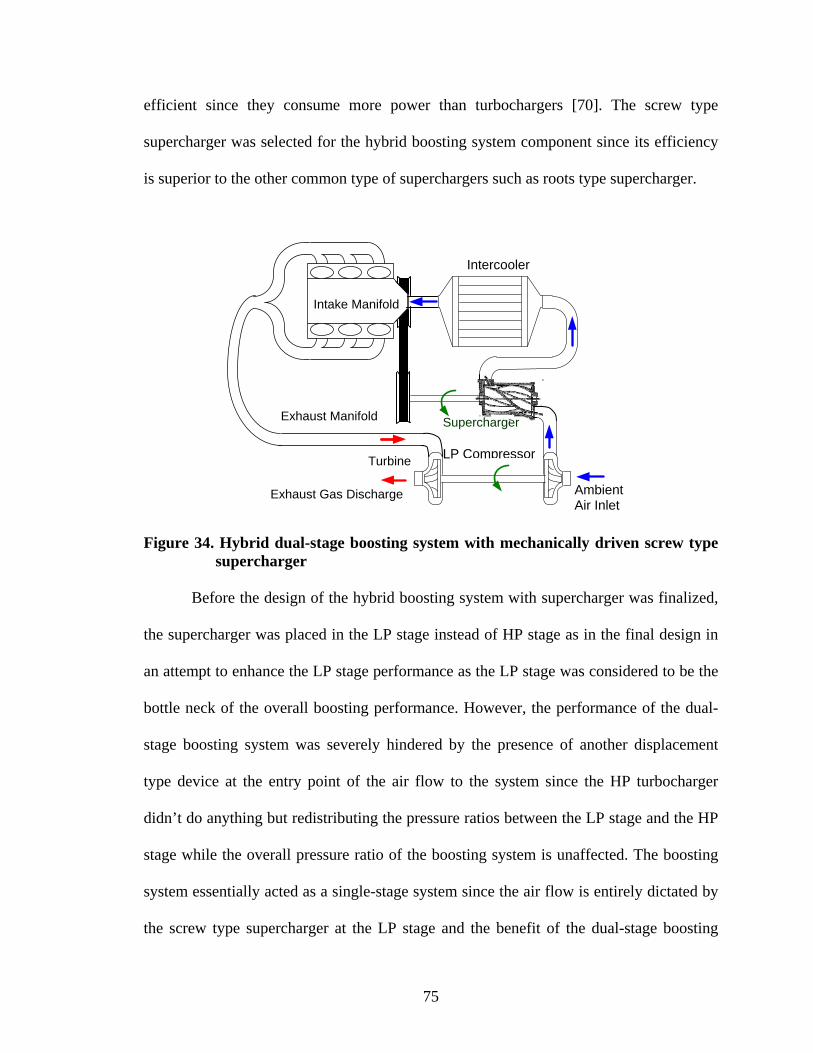
75
efficient since they consume more power than turbochargers [70]. The screw type
supercharger was selected for the hybrid boosting system component since its efficiency
is superior to the other common type of superchargers such as roots type supercharger.
Figure 34. Hybrid dual-stage boosting system with mechanically driven screw type supercharger
Before the design of the hybrid boosting system with supercharger was finalized,
the supercharger was placed in the LP stage instead of HP stage as in the final design in
an attempt to enhance the LP stage performance as the LP stage was considered to be the
bottle neck of the overall boosting performance. However, the performance of the dual-
stage boosting system was severely hindered by the presence of another displacement
type device at the entry point of the air flow to the system since the HP turbocharger
didn’t do anything but redistributing the pressure ratios between the LP stage and the HP
stage while the overall pressure ratio of the boosting system is unaffected. The boosting
system essentially acted as a single-stage system since the air flow is entirely dictated by
the screw type supercharger at the LP stage and the benefit of the dual-stage boosting
Intake Manifold
Exhaust Manifold
Intercooler
Turbine
Exhaust Gas Discharge
Supercharger
LP Compressor
Ambient Air Inlet
76
diminished as the down stream pressure has negligible effect on the mass flow rate of the
screw type supercharger. Therefore, the screw type supercharger had to be moved to the
HP stage as in the final design.
5.2.2. Hybrid dual-stage boosting system with electrically driven supercharger
Figure 35. Hybrid dual-stage boosting system with electrically driven supercharger
In this hybrid boosting system, the turbocharger at the high pressure stage is
replaced by an electrically driven supercharger as shown in Figure 35. A centrifugal
compressor is used in the electrically driven supercharger since it is very compact in size
and has very low rotational inertia. However, even with much less rotational inertia
compared to other types of superchargers, substantial portion of the power must be
wasted in just overcoming the inertia of the compressor when the vehicle is accelerated in
a short period of time as the centrifugal type supercharger requires very high speed (in
excess of 100,000 rpm in many cases) to achieve desired boost. Therefore, the placement
of the electrically driven supercharger at the HP stage is more advantageous as this
configuration allows smaller compressor with less rotational inertia. Another reason that
Intercooler
LP Compressor Turbine
Ambient Air Inlet
Electric Motor
Intake Manifold
Exhaust Manifold
HP Compressor
Exhaust Gas Discharge
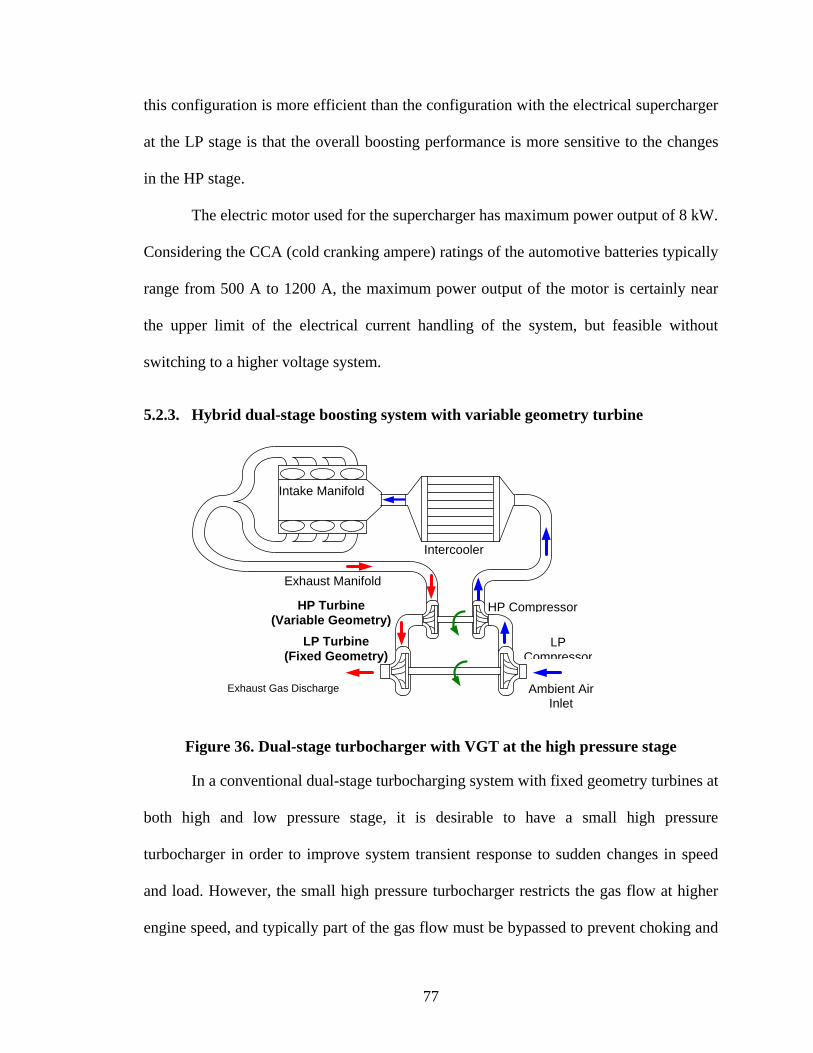
77
this configuration is more efficient than the configuration with the electrical supercharger
at the LP stage is that the overall boosting performance is more sensitive to the changes
in the HP stage.
The electric motor used for the supercharger has maximum power output of 8 kW.
Considering the CCA (cold cranking ampere) ratings of the automotive batteries typically
range from 500 A to 1200 A, the maximum power output of the motor is certainly near
the upper limit of the electrical current handling of the system, but feasible without
switching to a higher voltage system.
5.2.3. Hybrid dual-stage boosting system with variable geometry turbine
Figure 36. Dual-stage turbocharger with VGT at the high pressure stage
In a conventional dual-stage turbocharging system with fixed geometry turbines at
both high and low pressure stage, it is desirable to have a small high pressure
turbocharger in order to improve system transient response to sudden changes in speed
and load. However, the small high pressure turbocharger restricts the gas flow at higher
engine speed, and typically part of the gas flow must be bypassed to prevent choking and
Intercooler
HP Compressor
LP Compressor
HP Turbine (Variable Geometry)
LP Turbine (Fixed Geometry)
Ambient Air Inlet
Intake Manifold
Exhaust Manifold
Exhaust Gas Discharge
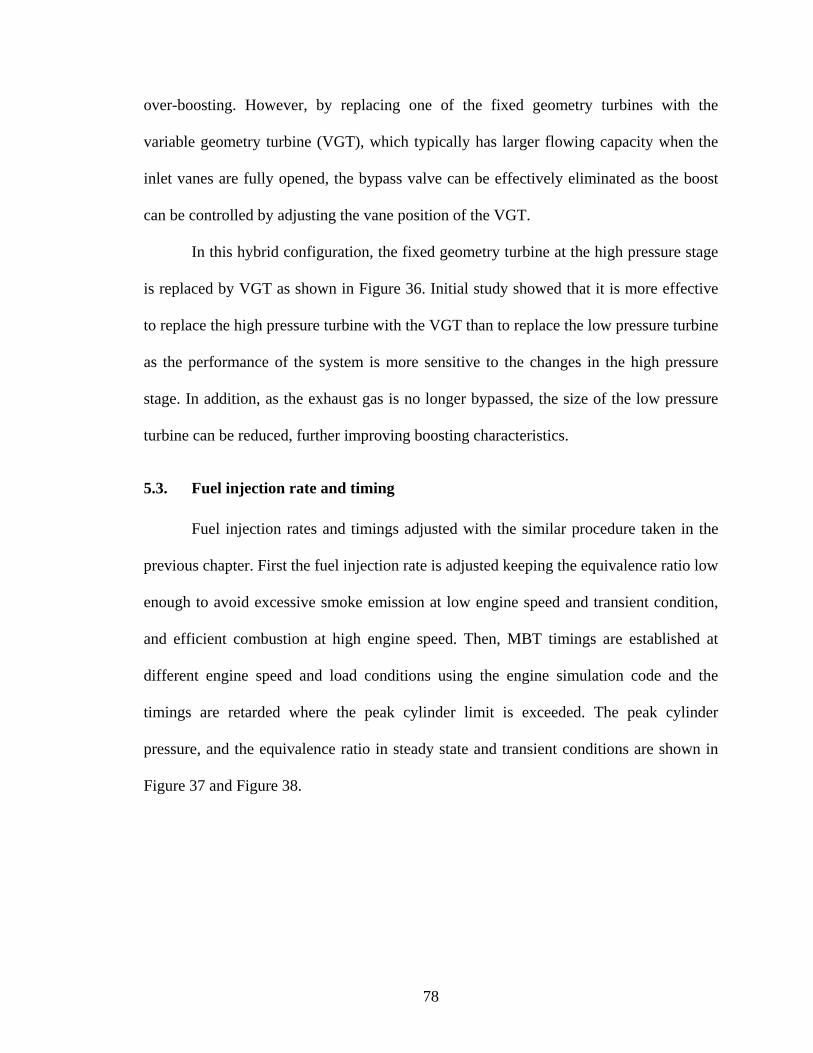
78
over-boosting. However, by replacing one of the fixed geometry turbines with the
variable geometry turbine (VGT), which typically has larger flowing capacity when the
inlet vanes are fully opened, the bypass valve can be effectively eliminated as the boost
can be controlled by adjusting the vane position of the VGT.
In this hybrid configuration, the fixed geometry turbine at the high pressure stage
is replaced by VGT as shown in Figure 36. Initial study showed that it is more effective
to replace the high pressure turbine with the VGT than to replace the low pressure turbine
as the performance of the system is more sensitive to the changes in the high pressure
stage. In addition, as the exhaust gas is no longer bypassed, the size of the low pressure
turbine can be reduced, further improving boosting characteristics.
5.3. Fuel injection rate and timing
Fuel injection rates and timings adjusted with the similar procedure taken in the
previous chapter. First the fuel injection rate is adjusted keeping the equivalence ratio low
enough to avoid excessive smoke emission at low engine speed and transient condition,
and efficient combustion at high engine speed. Then, MBT timings are established at
different engine speed and load conditions using the engine simulation code and the
timings are retarded where the peak cylinder limit is exceeded. The peak cylinder
pressure, and the equivalence ratio in steady state and transient conditions are shown in
Figure 37 and Figure 38.
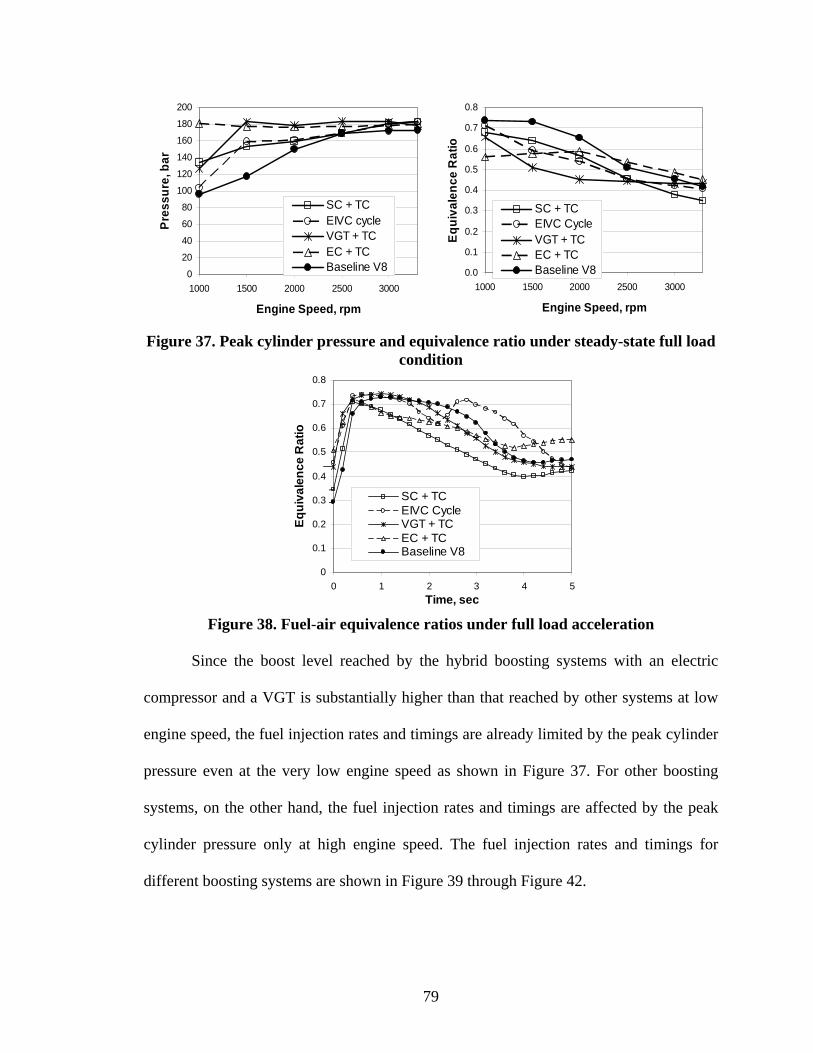
79
Figure 37. Peak cylinder pressure and equivalence ratio under steady-state full load
condition
0
0.1
0.2
0.3
0.4
0.5
0.6
0.7
0.8
0 1 2 3 4 5Time, sec
Equi
vale
nce
Rat
io
SC + TCEIVC CycleVGT + TCEC + TCBaseline V8
Figure 38. Fuel-air equivalence ratios under full load acceleration
Since the boost level reached by the hybrid boosting systems with an electric
compressor and a VGT is substantially higher than that reached by other systems at low
engine speed, the fuel injection rates and timings are already limited by the peak cylinder
pressure even at the very low engine speed as shown in Figure 37. For other boosting
systems, on the other hand, the fuel injection rates and timings are affected by the peak
cylinder pressure only at high engine speed. The fuel injection rates and timings for
different boosting systems are shown in Figure 39 through Figure 42.
0.0
0.1
0.2
0.3
0.4
0.5
0.6
0.7
0.8
1000 1500 2000 2500 3000
Engine Speed, rpm
Equi
vale
nce
Rat
io
SC + TCEIVC CycleVGT + TCEC + TCBaseline V80
20
40
60
80
100
120
140
160
180
200
1000 1500 2000 2500 3000
Engine Speed, rpm
Pres
sure
, bar
SC + TCEIVC cycleVGT + TCEC + TCBaseline V8
80
Figure 39. Fuel injection rate and timing for SC+TC configuration
Figure 40. Fuel injection rate and timing for VGT+TC configuration
Figure 41. Fuel injection rate and timing for EC+TC configuration
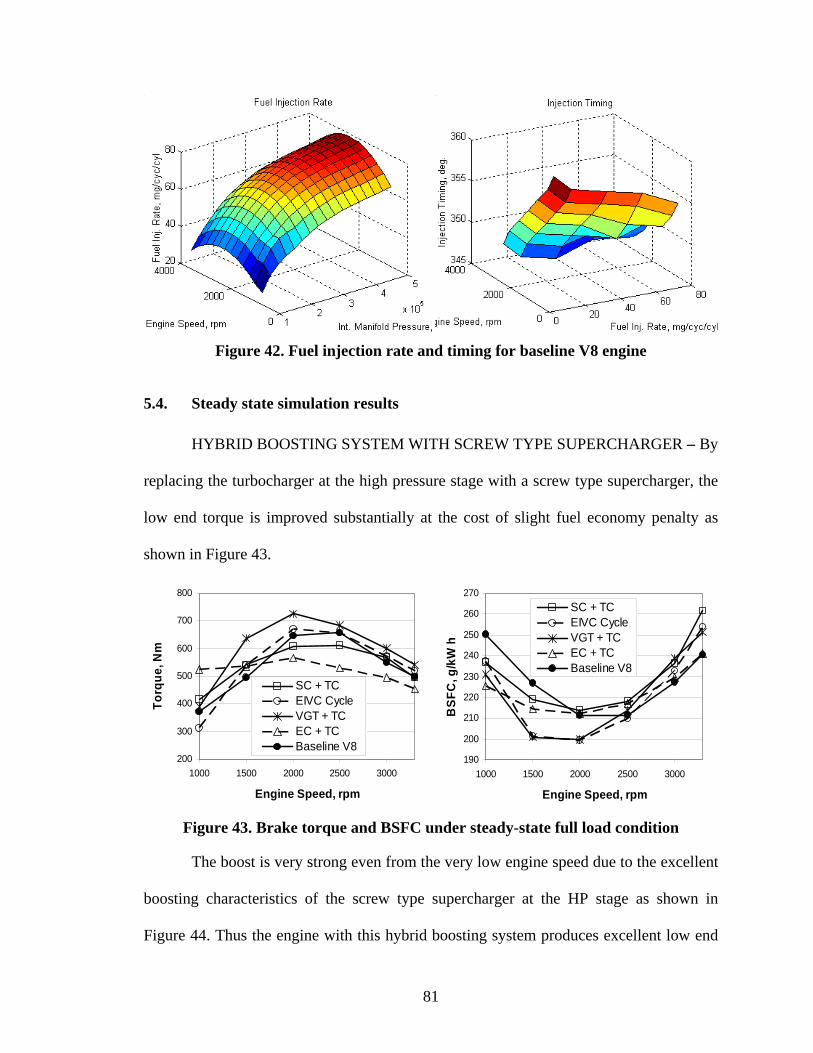
81
Figure 42. Fuel injection rate and timing for baseline V8 engine
5.4. Steady state simulation results
HYBRID BOOSTING SYSTEM WITH SCREW TYPE SUPERCHARGER – By
replacing the turbocharger at the high pressure stage with a screw type supercharger, the
low end torque is improved substantially at the cost of slight fuel economy penalty as
shown in Figure 43.
Figure 43. Brake torque and BSFC under steady-state full load condition
The boost is very strong even from the very low engine speed due to the excellent
boosting characteristics of the screw type supercharger at the HP stage as shown in
Figure 44. Thus the engine with this hybrid boosting system produces excellent low end
200
300
400
500
600
700
800
1000 1500 2000 2500 3000
Engine Speed, rpm
Torq
ue, N
m
SC + TCEIVC CycleVGT + TCEC + TC Baseline V8
190
200
210
220
230
240
250
260
270
1000 1500 2000 2500 3000
Engine Speed, rpm
BSF
C, g
/kW
h
SC + TCEIVC CycleVGT + TCEC + TCBaseline V8
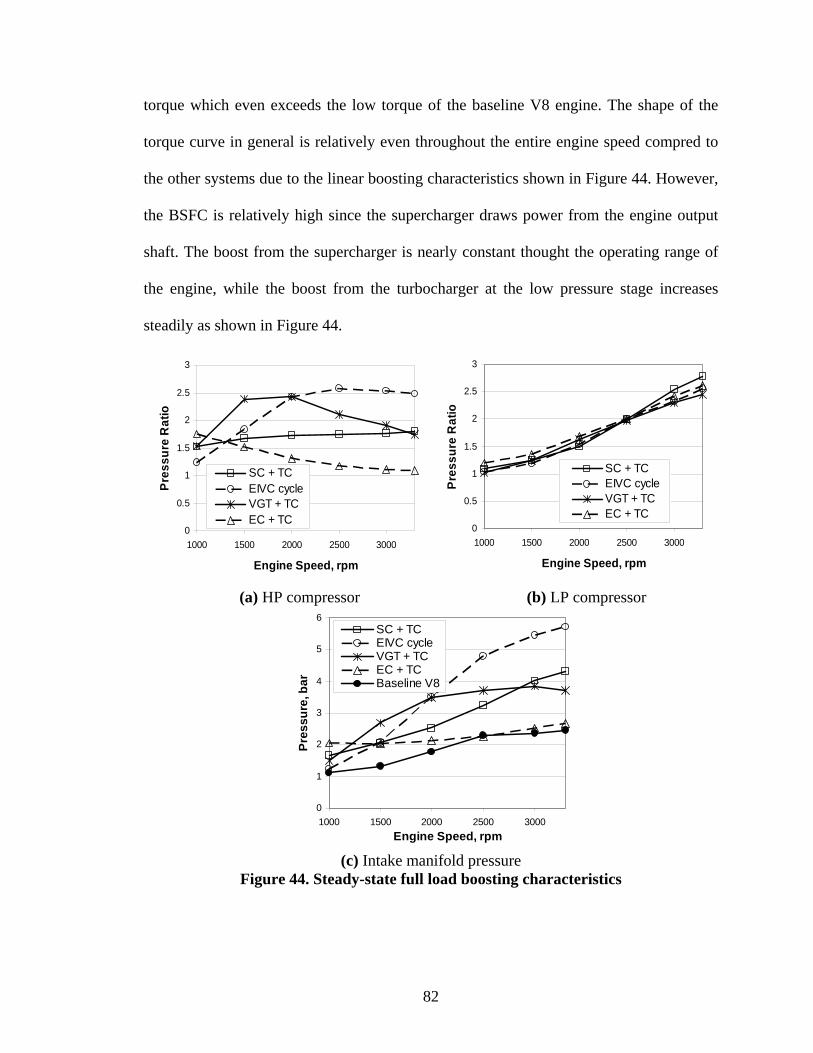
82
torque which even exceeds the low torque of the baseline V8 engine. The shape of the
torque curve in general is relatively even throughout the entire engine speed compred to
the other systems due to the linear boosting characteristics shown in Figure 44. However,
the BSFC is relatively high since the supercharger draws power from the engine output
shaft. The boost from the supercharger is nearly constant thought the operating range of
the engine, while the boost from the turbocharger at the low pressure stage increases
steadily as shown in Figure 44.
(a) HP compressor (b) LP compressor
0
1
2
3
4
5
6
1000 1500 2000 2500 3000Engine Speed, rpm
Pres
sure
, bar
SC + TCEIVC cycleVGT + TCEC + TCBaseline V8
(c) Intake manifold pressure
Figure 44. Steady-state full load boosting characteristics
0
0.5
1
1.5
2
2.5
3
1000 1500 2000 2500 3000
Engine Speed, rpm
Pres
sure
Rat
io
SC + TCEIVC cycleVGT + TCEC + TC
0
0.5
1
1.5
2
2.5
3
1000 1500 2000 2500 3000
Engine Speed, rpm
Pres
sure
Rat
ioSC + TCEIVC cycleVGT + TCEC + TC
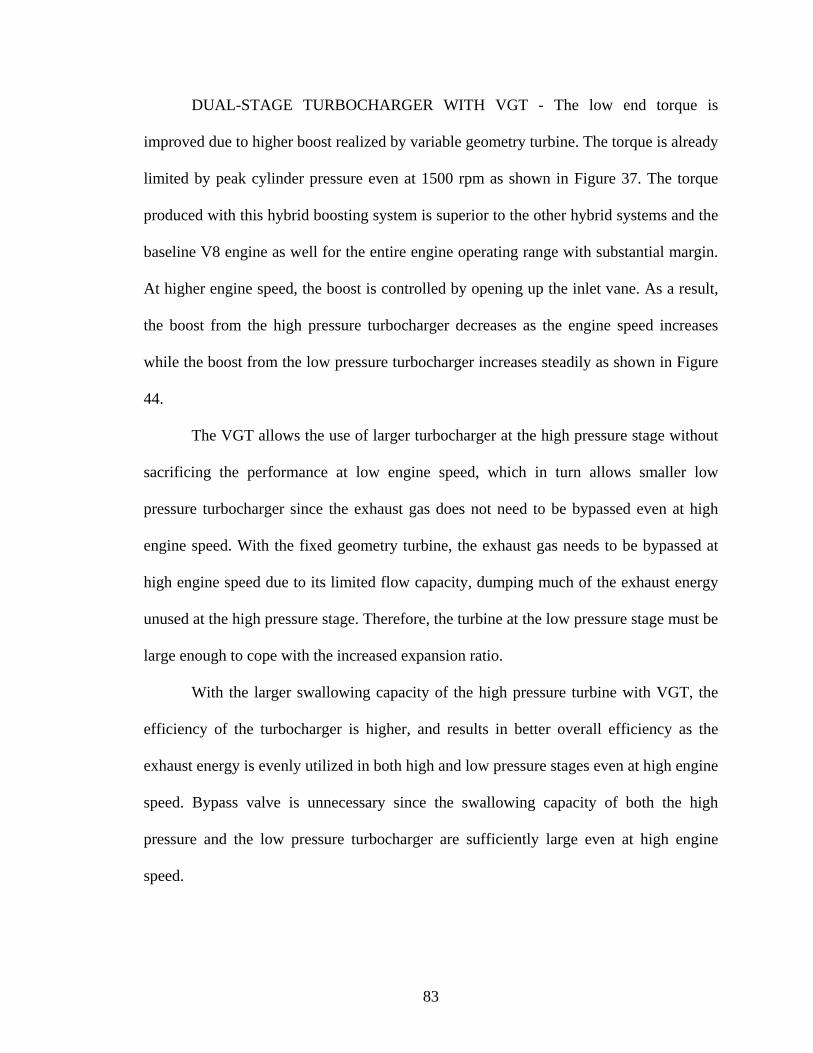
83
DUAL-STAGE TURBOCHARGER WITH VGT - The low end torque is
improved due to higher boost realized by variable geometry turbine. The torque is already
limited by peak cylinder pressure even at 1500 rpm as shown in Figure 37. The torque
produced with this hybrid boosting system is superior to the other hybrid systems and the
baseline V8 engine as well for the entire engine operating range with substantial margin.
At higher engine speed, the boost is controlled by opening up the inlet vane. As a result,
the boost from the high pressure turbocharger decreases as the engine speed increases
while the boost from the low pressure turbocharger increases steadily as shown in Figure
44.
The VGT allows the use of larger turbocharger at the high pressure stage without
sacrificing the performance at low engine speed, which in turn allows smaller low
pressure turbocharger since the exhaust gas does not need to be bypassed even at high
engine speed. With the fixed geometry turbine, the exhaust gas needs to be bypassed at
high engine speed due to its limited flow capacity, dumping much of the exhaust energy
unused at the high pressure stage. Therefore, the turbine at the low pressure stage must be
large enough to cope with the increased expansion ratio.
With the larger swallowing capacity of the high pressure turbine with VGT, the
efficiency of the turbocharger is higher, and results in better overall efficiency as the
exhaust energy is evenly utilized in both high and low pressure stages even at high engine
speed. Bypass valve is unnecessary since the swallowing capacity of both the high
pressure and the low pressure turbocharger are sufficiently large even at high engine
speed.
84
HYBRID BOOSTING SYSTEM WITH ELECTRICALLY DRIVEN SUPER-
CHARGER – The torque is very strong at low engine speed exceeding the low end
torque of the baseline V8 engine, as the electric motor can be operated at its full capacity
even from the idle speed as shown in Figure 43 and Figure 44. The effectiveness of the
electric compressor is clearly shown in low engine speed, but the boost tapers off rapidly
as the 8 kW electric motor becomes limiting at higher engine speed. The power required
to compress the incoming air at medium to high engine speed becomes much larger than
the electric motor can provide and the boosting system effectively becomes a single-stage
system at these speeds. Therefore, the compression ratio of the engine dose not need to be
lowered as the boost pressure at high engine speed where the peak cylinder pressure
reaches its maximum is sufficiently low. The higher compression ratio (18.0) partially
compensates for the performance deficiency with this boosting system.
5.5. Transient simulation results
Similar to the procedures taken in the previous chapter, the engine system model
is integrated with the vehicle dynamics model described and then series of full load
acceleration tests are performed with prescribed driving schedule. The results shown in
Figure 45 and Figure 46 are obtained by running a full load acceleration from 0 to 60
mph, and 30 to 50 mph with the engine systems integrated with the vehicle dynamics
model. The results shown in Figure 47 and Figure 48 represent the boosting
characteristics of the hybrid boosting systems for the first 5 seconds into the full load
acceleration.
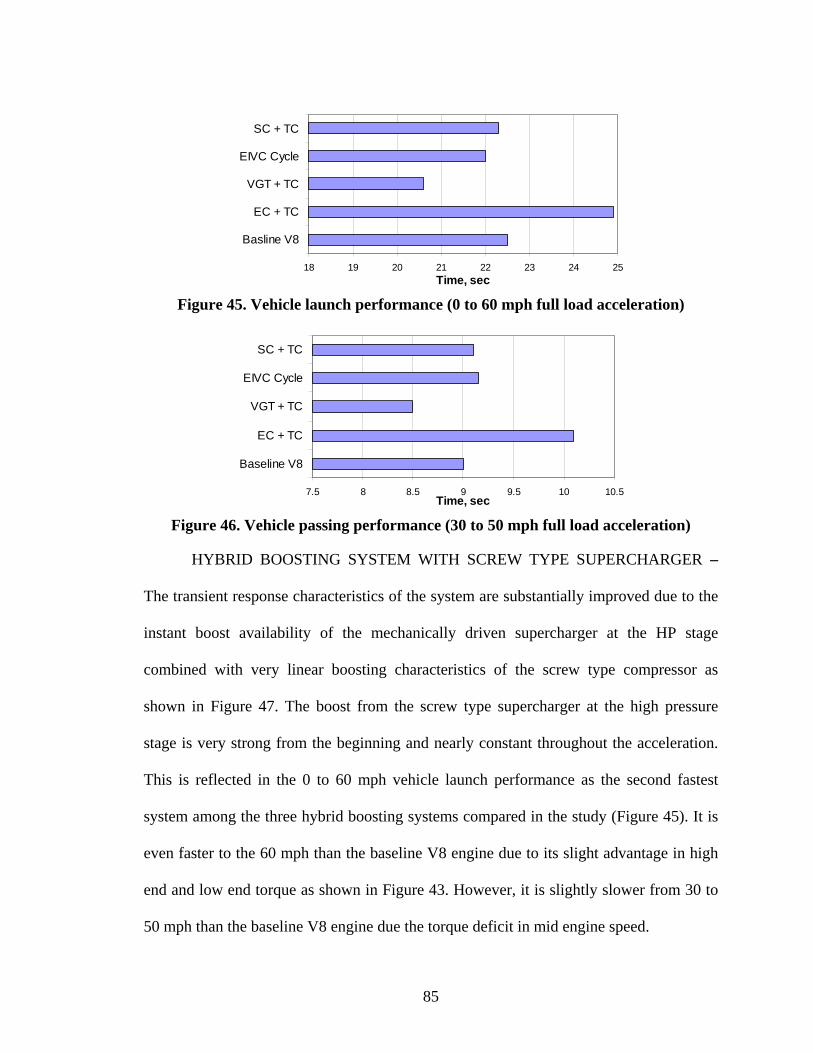
85
18 19 20 21 22 23 24 25
Basline V8
EC + TC
VGT + TC
EIVC Cycle
SC + TC
Time, sec
Figure 45. Vehicle launch performance (0 to 60 mph full load acceleration)
7.5 8 8.5 9 9.5 10 10.5
Baseline V8
EC + TC
VGT + TC
EIVC Cycle
SC + TC
Time, sec
Figure 46. Vehicle passing performance (30 to 50 mph full load acceleration)
HYBRID BOOSTING SYSTEM WITH SCREW TYPE SUPERCHARGER –
The transient response characteristics of the system are substantially improved due to the
instant boost availability of the mechanically driven supercharger at the HP stage
combined with very linear boosting characteristics of the screw type compressor as
shown in Figure 47. The boost from the screw type supercharger at the high pressure
stage is very strong from the beginning and nearly constant throughout the acceleration.
This is reflected in the 0 to 60 mph vehicle launch performance as the second fastest
system among the three hybrid boosting systems compared in the study (Figure 45). It is
even faster to the 60 mph than the baseline V8 engine due to its slight advantage in high
end and low end torque as shown in Figure 43. However, it is slightly slower from 30 to
50 mph than the baseline V8 engine due the torque deficit in mid engine speed.
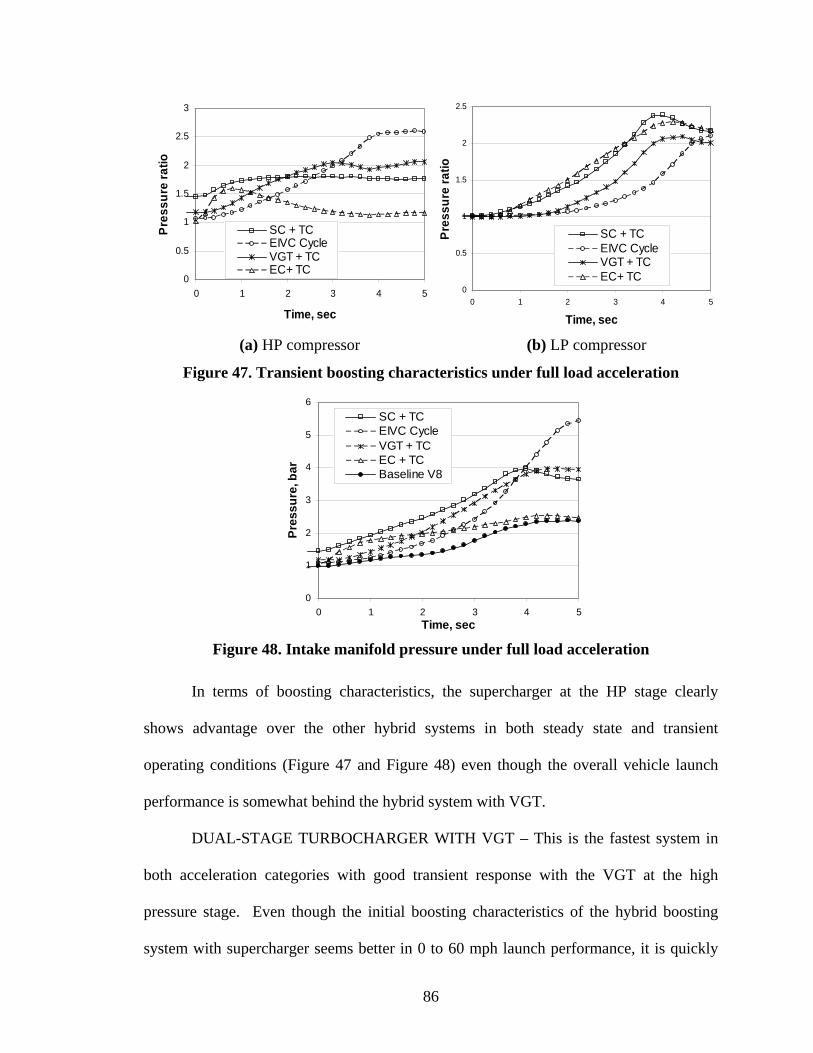
86
(a) HP compressor (b) LP compressor
Figure 47. Transient boosting characteristics under full load acceleration
0
1
2
3
4
5
6
0 1 2 3 4 5Time, sec
Pres
sure
, bar
SC + TCEIVC CycleVGT + TCEC + TCBaseline V8
Figure 48. Intake manifold pressure under full load acceleration
In terms of boosting characteristics, the supercharger at the HP stage clearly
shows advantage over the other hybrid systems in both steady state and transient
operating conditions (Figure 47 and Figure 48) even though the overall vehicle launch
performance is somewhat behind the hybrid system with VGT.
DUAL-STAGE TURBOCHARGER WITH VGT – This is the fastest system in
both acceleration categories with good transient response with the VGT at the high
pressure stage. Even though the initial boosting characteristics of the hybrid boosting
system with supercharger seems better in 0 to 60 mph launch performance, it is quickly
0
0.5
1
1.5
2
2.5
3
0 1 2 3 4 5
Time, sec
Pres
sure
ratio
SC + TCEIVC CycleVGT + TCEC+ TC
0
0.5
1
1.5
2
2.5
0 1 2 3 4 5
Time, sec
Pres
sure
ratio
SC + TCEIVC CycleVGT + TCEC+ TC
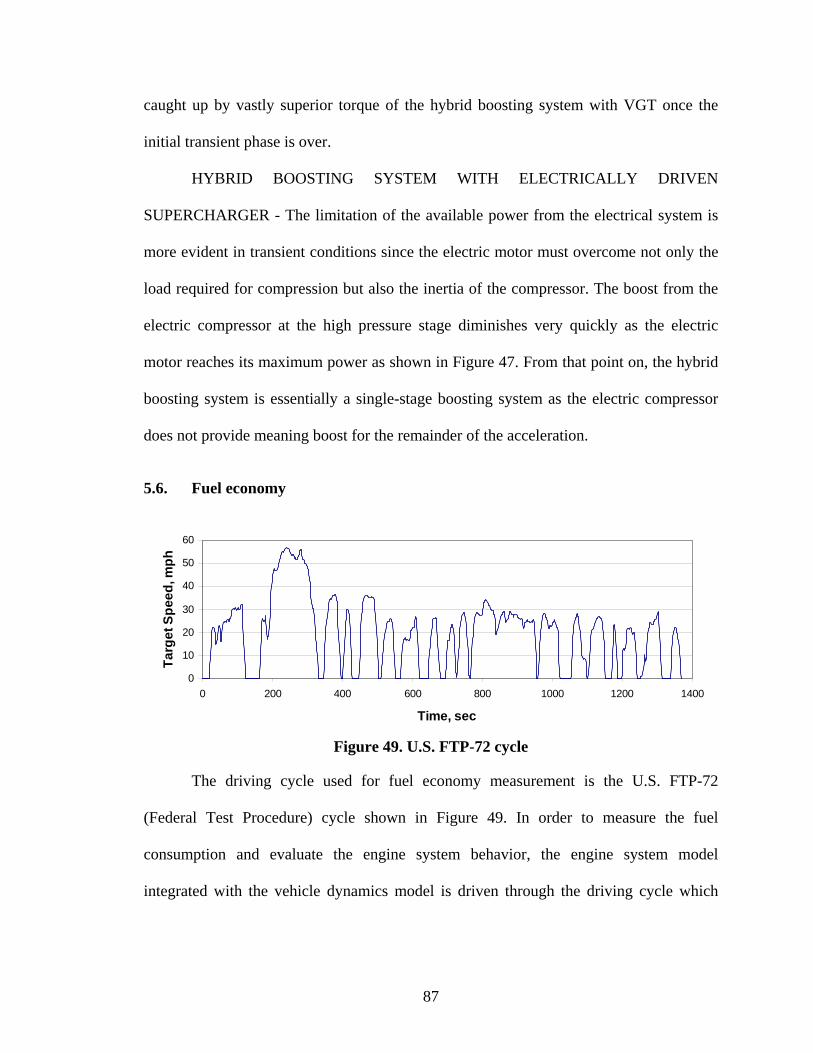
87
caught up by vastly superior torque of the hybrid boosting system with VGT once the
initial transient phase is over.
HYBRID BOOSTING SYSTEM WITH ELECTRICALLY DRIVEN
SUPERCHARGER - The limitation of the available power from the electrical system is
more evident in transient conditions since the electric motor must overcome not only the
load required for compression but also the inertia of the compressor. The boost from the
electric compressor at the high pressure stage diminishes very quickly as the electric
motor reaches its maximum power as shown in Figure 47. From that point on, the hybrid
boosting system is essentially a single-stage boosting system as the electric compressor
does not provide meaning boost for the remainder of the acceleration.
5.6. Fuel economy
0
10
20
30
40
50
60
0 200 400 600 800 1000 1200 1400
Time, sec
Targ
et S
peed
, mph
Figure 49. U.S. FTP-72 cycle
The driving cycle used for fuel economy measurement is the U.S. FTP-72
(Federal Test Procedure) cycle shown in Figure 49. In order to measure the fuel
consumption and evaluate the engine system behavior, the engine system model
integrated with the vehicle dynamics model is driven through the driving cycle which
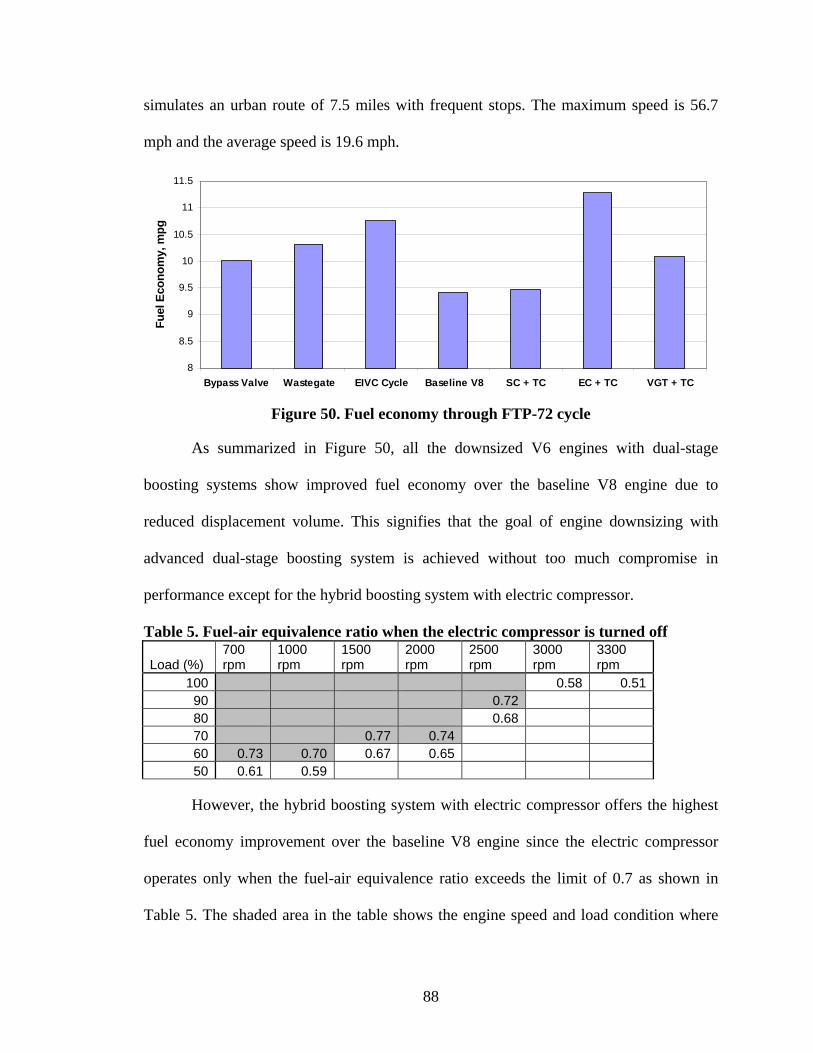
88
simulates an urban route of 7.5 miles with frequent stops. The maximum speed is 56.7
mph and the average speed is 19.6 mph.
8
8.5
9
9.5
10
10.5
11
11.5
Bypass Valve Wastegate EIVC Cycle Baseline V8 SC + TC EC + TC VGT + TC
Fuel
Eco
nom
y, m
pg
Figure 50. Fuel economy through FTP-72 cycle
As summarized in Figure 50, all the downsized V6 engines with dual-stage
boosting systems show improved fuel economy over the baseline V8 engine due to
reduced displacement volume. This signifies that the goal of engine downsizing with
advanced dual-stage boosting system is achieved without too much compromise in
performance except for the hybrid boosting system with electric compressor.
Table 5. Fuel-air equivalence ratio when the electric compressor is turned off
Load (%) 700 rpm
1000 rpm
1500 rpm
2000 rpm
2500 rpm
3000 rpm
3300 rpm
100 0.58 0.51 90 0.72 80 0.68 70 0.77 0.74 60 0.73 0.70 0.67 0.65 50 0.61 0.59
However, the hybrid boosting system with electric compressor offers the highest
fuel economy improvement over the baseline V8 engine since the electric compressor
operates only when the fuel-air equivalence ratio exceeds the limit of 0.7 as shown in
Table 5. The shaded area in the table shows the engine speed and load condition where
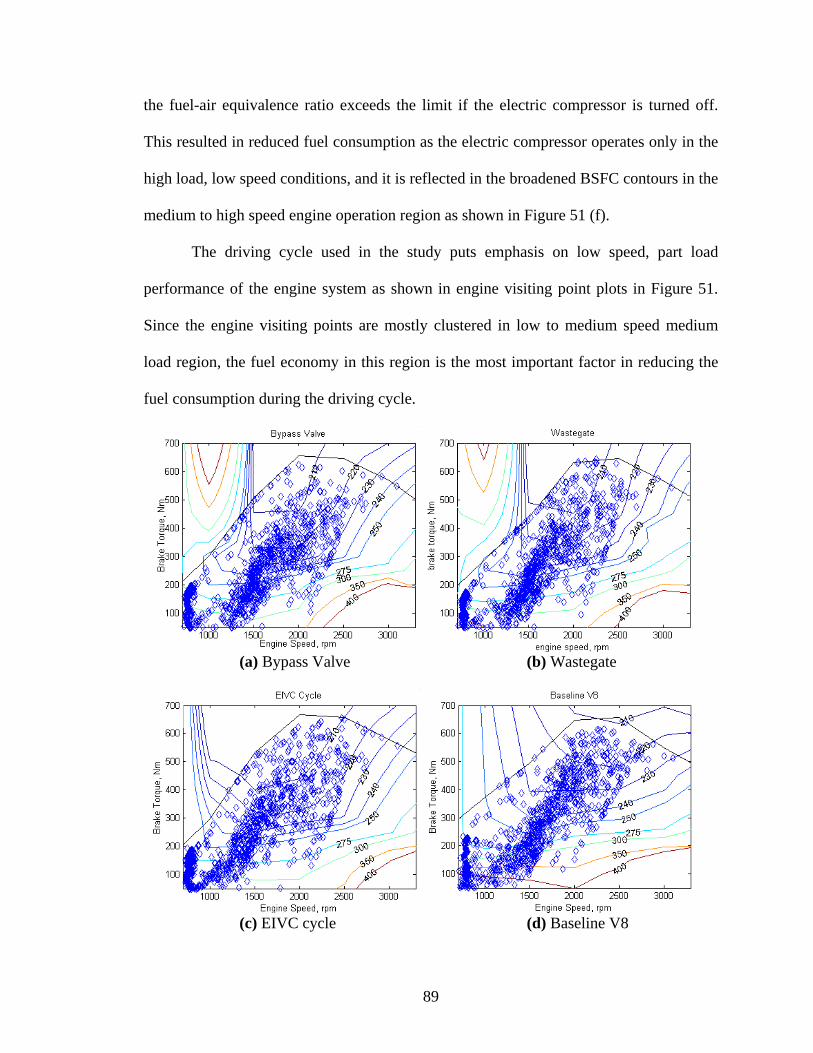
89
the fuel-air equivalence ratio exceeds the limit if the electric compressor is turned off.
This resulted in reduced fuel consumption as the electric compressor operates only in the
high load, low speed conditions, and it is reflected in the broadened BSFC contours in the
medium to high speed engine operation region as shown in Figure 51 (f).
The driving cycle used in the study puts emphasis on low speed, part load
performance of the engine system as shown in engine visiting point plots in Figure 51.
Since the engine visiting points are mostly clustered in low to medium speed medium
load region, the fuel economy in this region is the most important factor in reducing the
fuel consumption during the driving cycle.
(a) Bypass Valve (b) Wastegate
(c) EIVC cycle (d) Baseline V8

90
(e) SC + TC (f) EC + TC
(g) VGT + TC
Figure 51. Engine visiting points during FTP-72 drivng cycle simulation
Compared to the baseline V8 engine, the dual-stage boosting systems in general
moves the efficient region toward the low speed region by taking advantage of the dual-
stage boosting system, and it is reflected in the reduced fuel consumption as the engine
operates in this region more frequently. Bypass valve, wastegate and EIVC cycle systems
are good examples. The dual-stage turbocharging systems are optimized for the low
speed engine operation, and the fuel economies are significantly improved over the
baseline V8 engine and more so with the EIVC cycle as the thermal efficiency of the
engine with improved and the exhaust energy is utilized more efficiently. The hybrid
system with VGT also shows reduced fuel consumption due to the same benefit as the
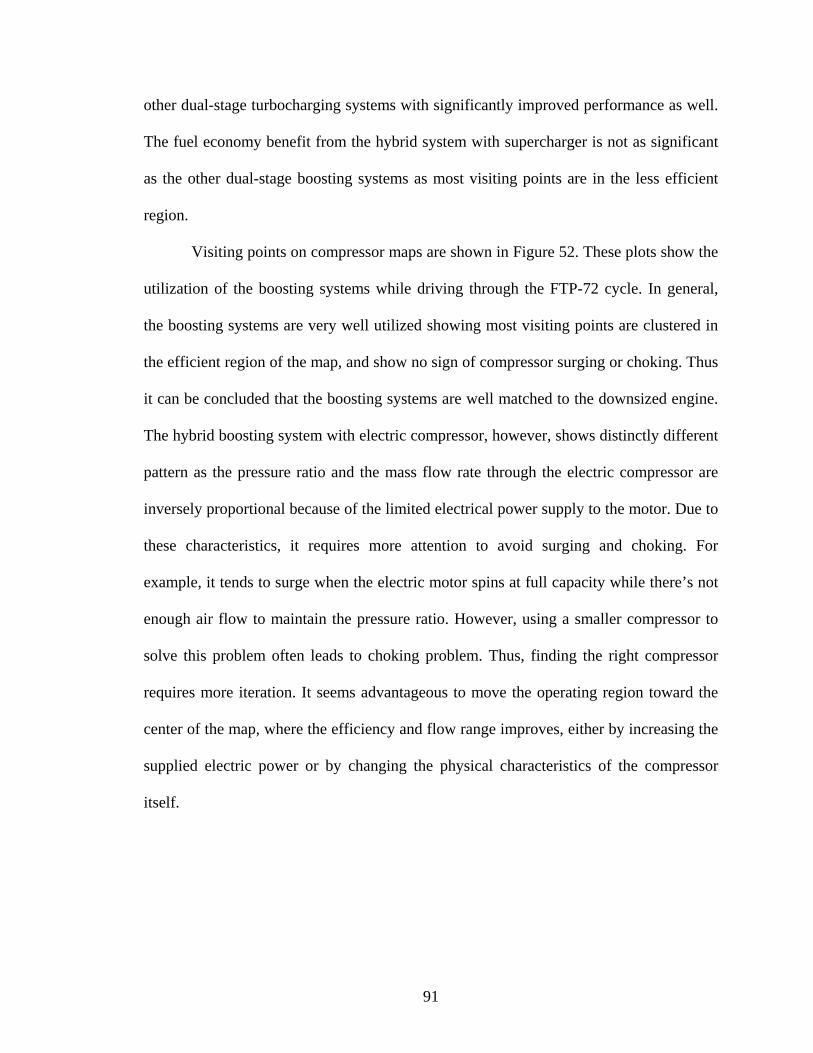
91
other dual-stage turbocharging systems with significantly improved performance as well.
The fuel economy benefit from the hybrid system with supercharger is not as significant
as the other dual-stage boosting systems as most visiting points are in the less efficient
region.
Visiting points on compressor maps are shown in Figure 52. These plots show the
utilization of the boosting systems while driving through the FTP-72 cycle. In general,
the boosting systems are very well utilized showing most visiting points are clustered in
the efficient region of the map, and show no sign of compressor surging or choking. Thus
it can be concluded that the boosting systems are well matched to the downsized engine.
The hybrid boosting system with electric compressor, however, shows distinctly different
pattern as the pressure ratio and the mass flow rate through the electric compressor are
inversely proportional because of the limited electrical power supply to the motor. Due to
these characteristics, it requires more attention to avoid surging and choking. For
example, it tends to surge when the electric motor spins at full capacity while there’s not
enough air flow to maintain the pressure ratio. However, using a smaller compressor to
solve this problem often leads to choking problem. Thus, finding the right compressor
requires more iteration. It seems advantageous to move the operating region toward the
center of the map, where the efficiency and flow range improves, either by increasing the
supplied electric power or by changing the physical characteristics of the compressor
itself.
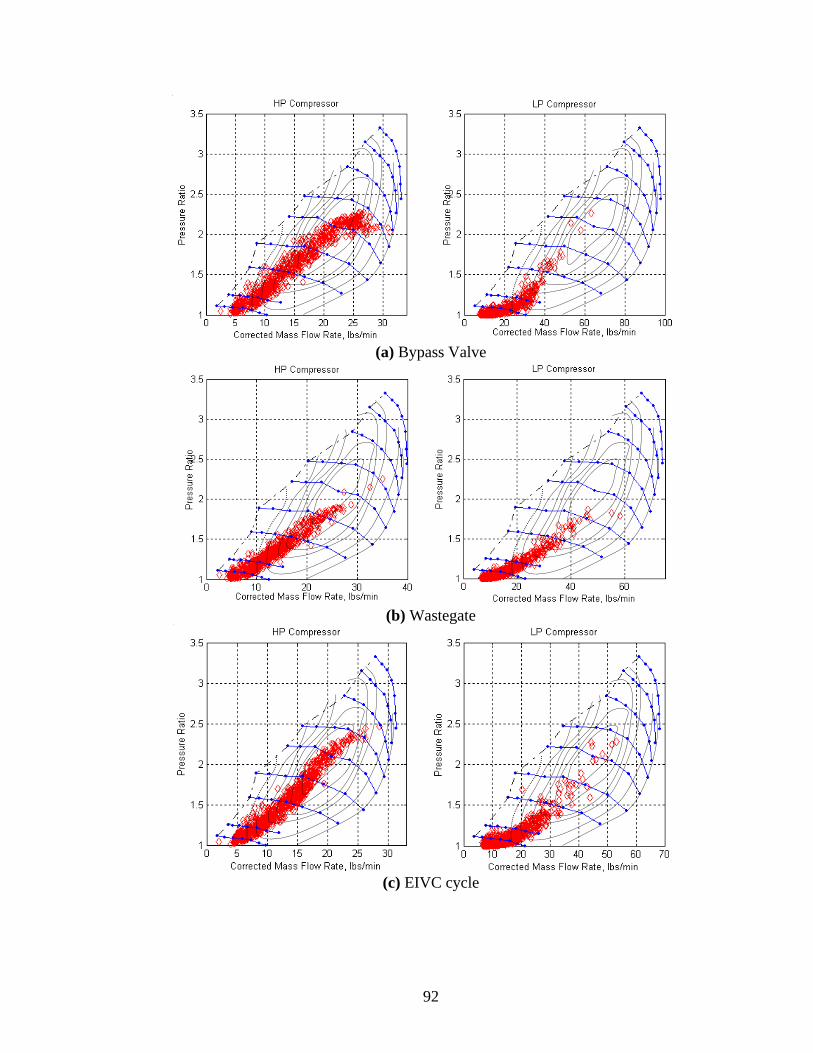
92
(a) Bypass Valve
(b) Wastegate
(c) EIVC cycle
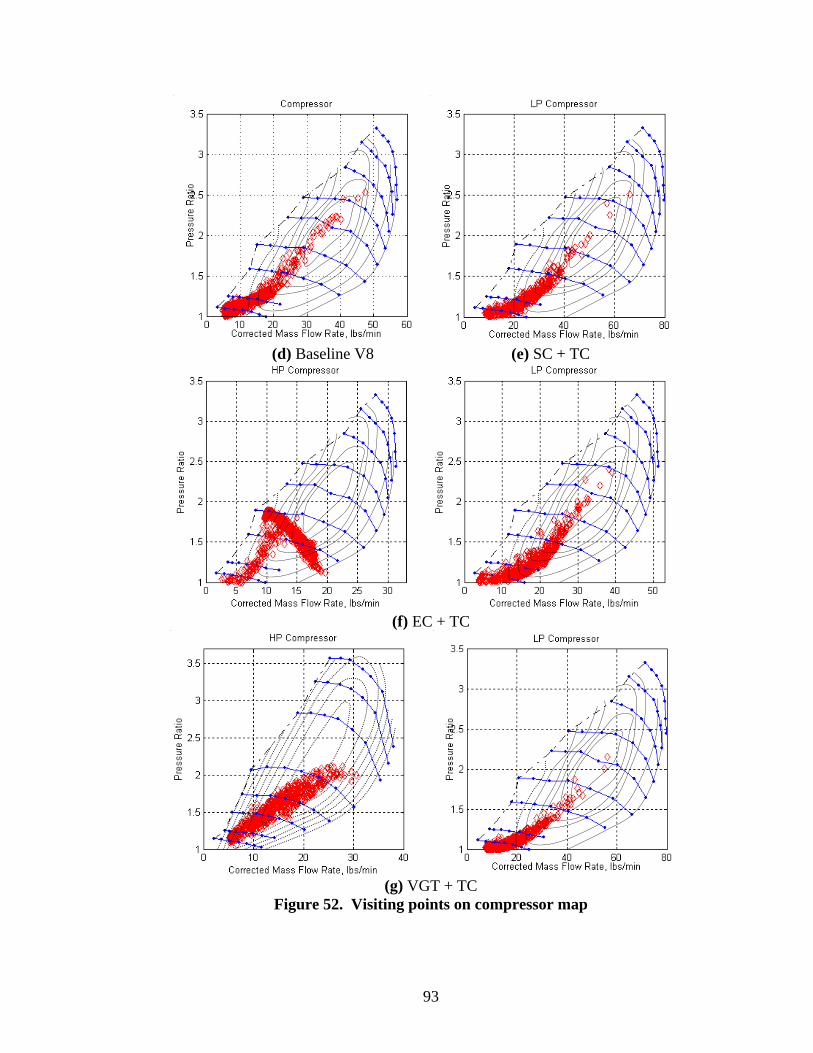
93
(d) Baseline V8 (e) SC + TC
(f) EC + TC
(g) VGT + TC
Figure 52. Visiting points on compressor map
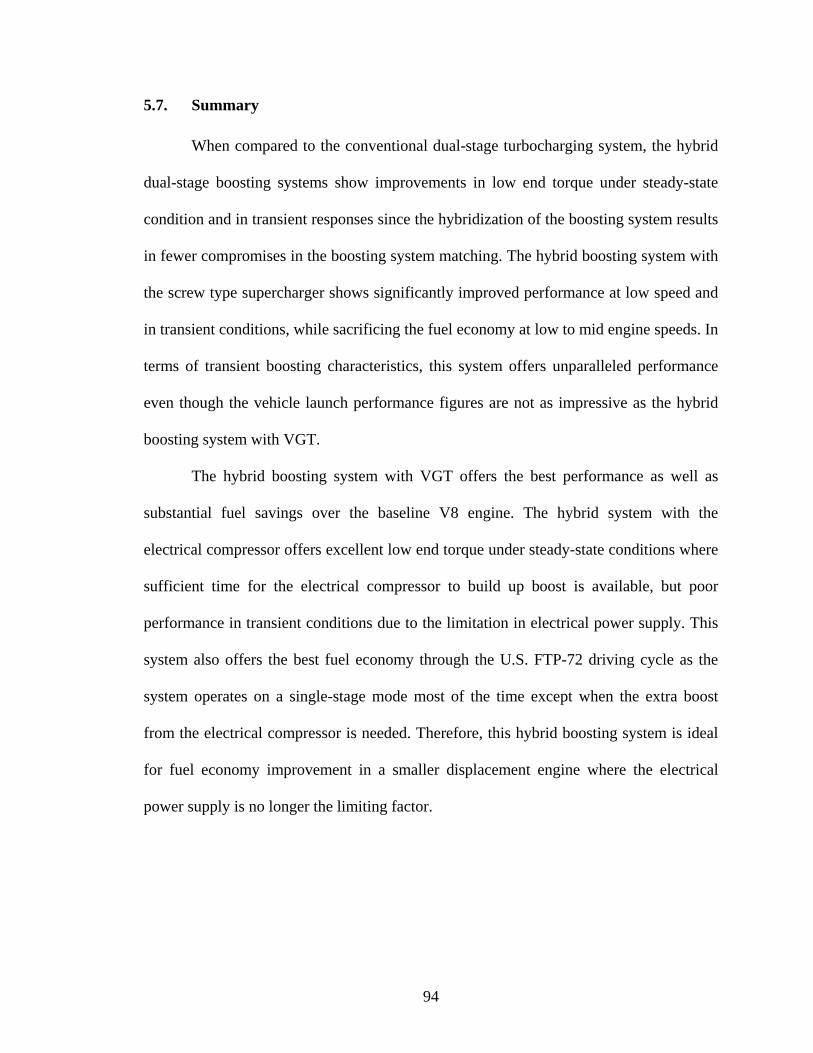
94
5.7. Summary
When compared to the conventional dual-stage turbocharging system, the hybrid
dual-stage boosting systems show improvements in low end torque under steady-state
condition and in transient responses since the hybridization of the boosting system results
in fewer compromises in the boosting system matching. The hybrid boosting system with
the screw type supercharger shows significantly improved performance at low speed and
in transient conditions, while sacrificing the fuel economy at low to mid engine speeds. In
terms of transient boosting characteristics, this system offers unparalleled performance
even though the vehicle launch performance figures are not as impressive as the hybrid
boosting system with VGT.
The hybrid boosting system with VGT offers the best performance as well as
substantial fuel savings over the baseline V8 engine. The hybrid system with the
electrical compressor offers excellent low end torque under steady-state conditions where
sufficient time for the electrical compressor to build up boost is available, but poor
performance in transient conditions due to the limitation in electrical power supply. This
system also offers the best fuel economy through the U.S. FTP-72 driving cycle as the
system operates on a single-stage mode most of the time except when the extra boost
from the electrical compressor is needed. Therefore, this hybrid boosting system is ideal
for fuel economy improvement in a smaller displacement engine where the electrical
power supply is no longer the limiting factor.
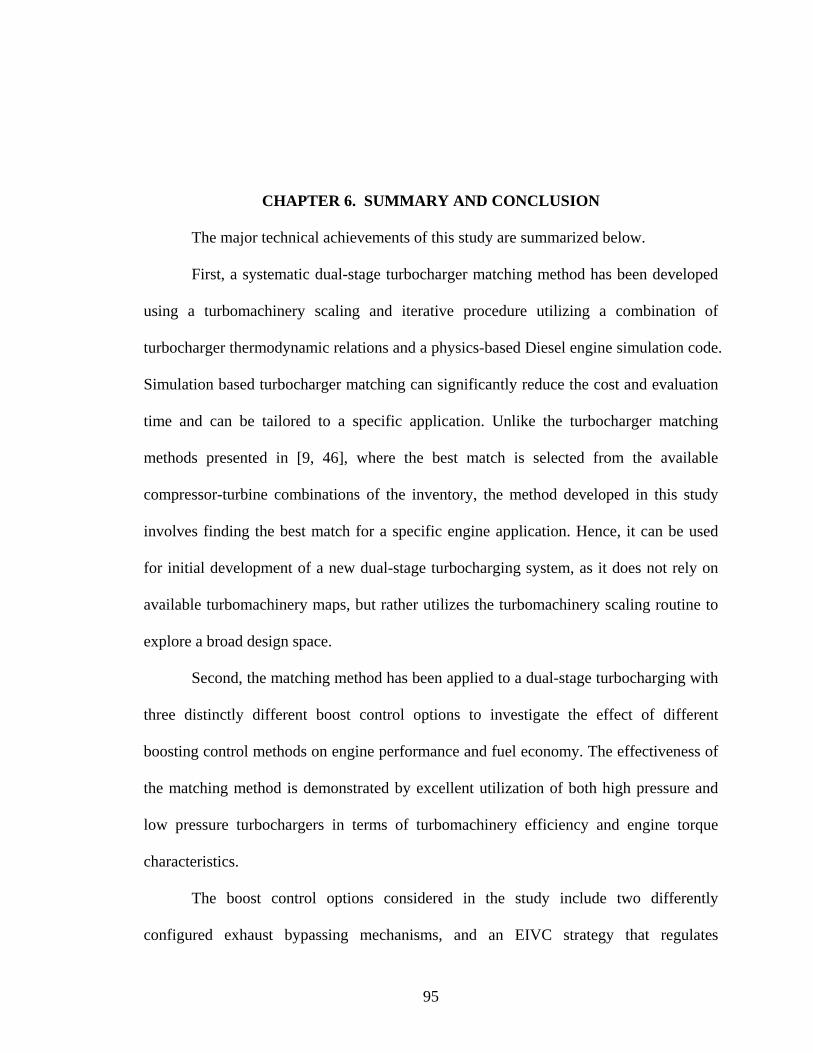
95
CHAPTER 6. SUMMARY AND CONCLUSION
The major technical achievements of this study are summarized below.
First, a systematic dual-stage turbocharger matching method has been developed
using a turbomachinery scaling and iterative procedure utilizing a combination of
turbocharger thermodynamic relations and a physics-based Diesel engine simulation code.
Simulation based turbocharger matching can significantly reduce the cost and evaluation
time and can be tailored to a specific application. Unlike the turbocharger matching
methods presented in [9, 46], where the best match is selected from the available
compressor-turbine combinations of the inventory, the method developed in this study
involves finding the best match for a specific engine application. Hence, it can be used
for initial development of a new dual-stage turbocharging system, as it does not rely on
available turbomachinery maps, but rather utilizes the turbomachinery scaling routine to
explore a broad design space.
Second, the matching method has been applied to a dual-stage turbocharging with
three distinctly different boost control options to investigate the effect of different
boosting control methods on engine performance and fuel economy. The effectiveness of
the matching method is demonstrated by excellent utilization of both high pressure and
low pressure turbochargers in terms of turbomachinery efficiency and engine torque
characteristics.
The boost control options considered in the study include two differently
configured exhaust bypassing mechanisms, and an EIVC strategy that regulates
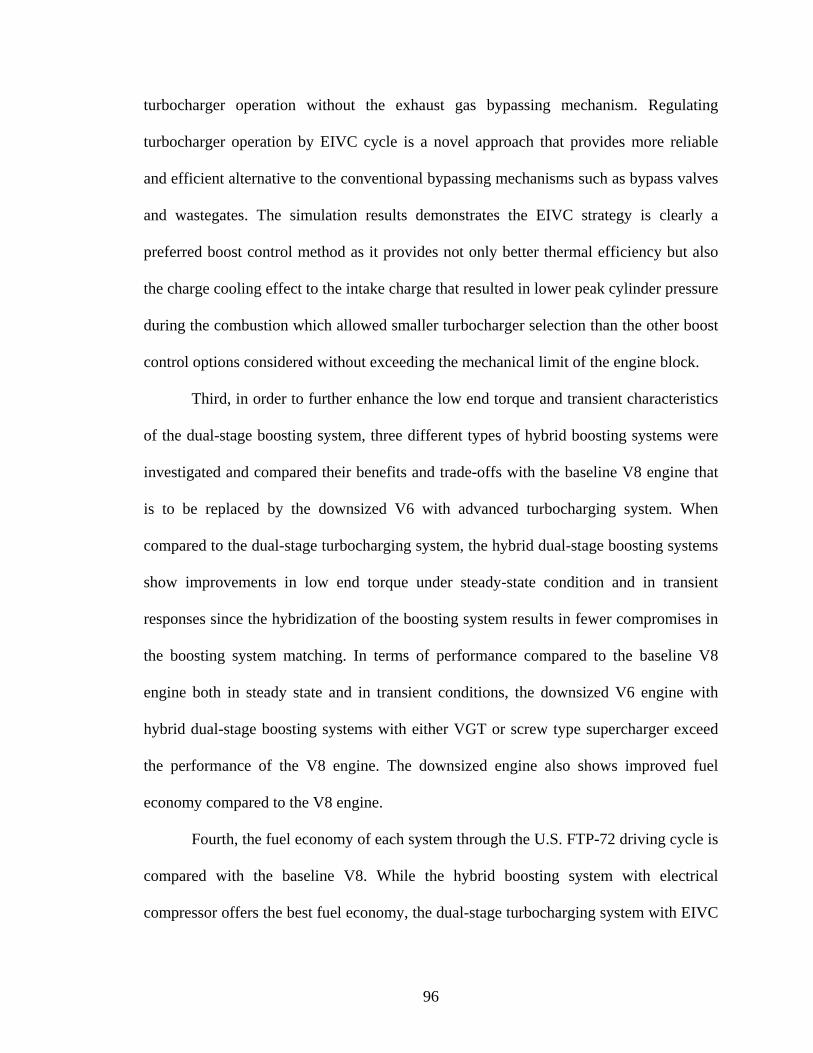
96
turbocharger operation without the exhaust gas bypassing mechanism. Regulating
turbocharger operation by EIVC cycle is a novel approach that provides more reliable
and efficient alternative to the conventional bypassing mechanisms such as bypass valves
and wastegates. The simulation results demonstrates the EIVC strategy is clearly a
preferred boost control method as it provides not only better thermal efficiency but also
the charge cooling effect to the intake charge that resulted in lower peak cylinder pressure
during the combustion which allowed smaller turbocharger selection than the other boost
control options considered without exceeding the mechanical limit of the engine block.
Third, in order to further enhance the low end torque and transient characteristics
of the dual-stage boosting system, three different types of hybrid boosting systems were
investigated and compared their benefits and trade-offs with the baseline V8 engine that
is to be replaced by the downsized V6 with advanced turbocharging system. When
compared to the dual-stage turbocharging system, the hybrid dual-stage boosting systems
show improvements in low end torque under steady-state condition and in transient
responses since the hybridization of the boosting system results in fewer compromises in
the boosting system matching. In terms of performance compared to the baseline V8
engine both in steady state and in transient conditions, the downsized V6 engine with
hybrid dual-stage boosting systems with either VGT or screw type supercharger exceed
the performance of the V8 engine. The downsized engine also shows improved fuel
economy compared to the V8 engine.
Fourth, the fuel economy of each system through the U.S. FTP-72 driving cycle is
compared with the baseline V8. While the hybrid boosting system with electrical
compressor offers the best fuel economy, the dual-stage turbocharging system with EIVC
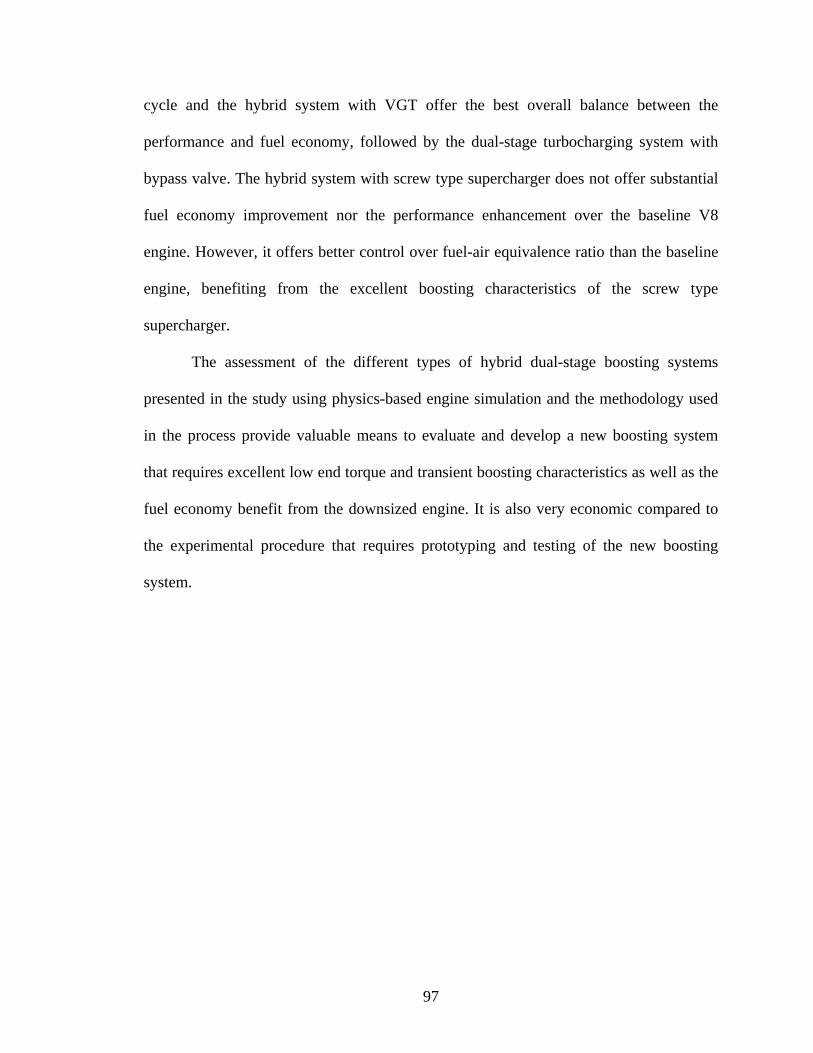
97
cycle and the hybrid system with VGT offer the best overall balance between the
performance and fuel economy, followed by the dual-stage turbocharging system with
bypass valve. The hybrid system with screw type supercharger does not offer substantial
fuel economy improvement nor the performance enhancement over the baseline V8
engine. However, it offers better control over fuel-air equivalence ratio than the baseline
engine, benefiting from the excellent boosting characteristics of the screw type
supercharger.
The assessment of the different types of hybrid dual-stage boosting systems
presented in the study using physics-based engine simulation and the methodology used
in the process provide valuable means to evaluate and develop a new boosting system
that requires excellent low end torque and transient boosting characteristics as well as the
fuel economy benefit from the downsized engine. It is also very economic compared to
the experimental procedure that requires prototyping and testing of the new boosting
system.
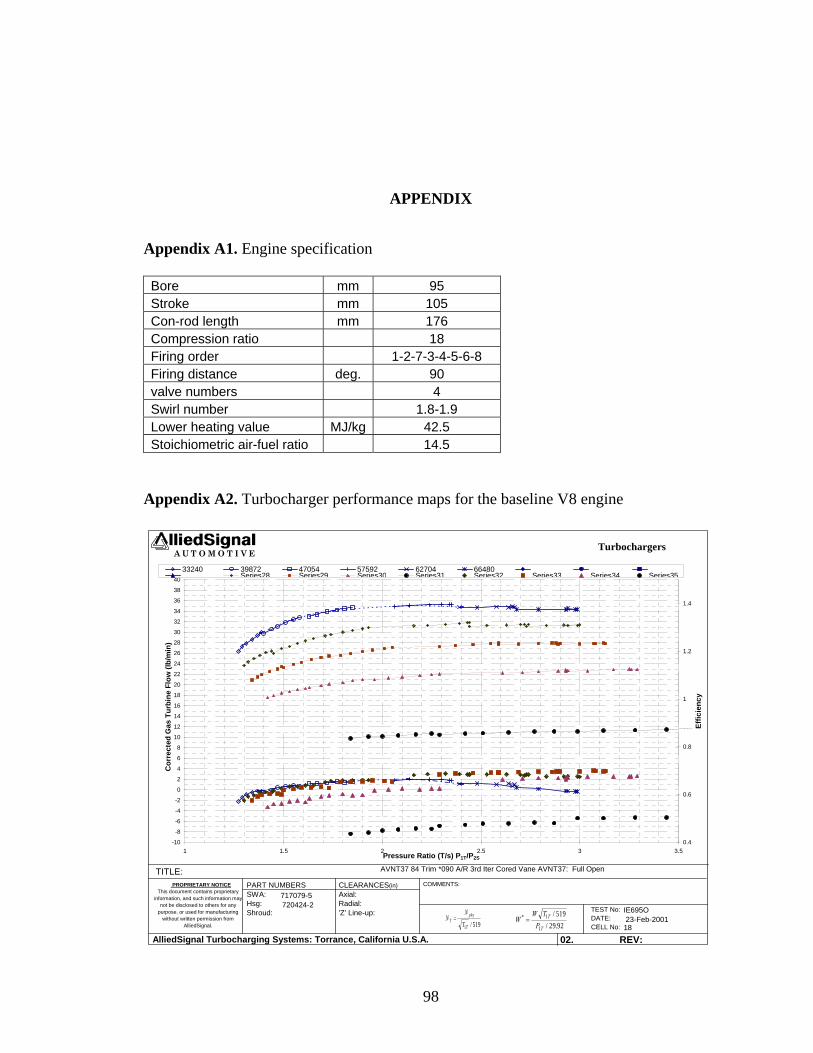
98
APPENDIX
Appendix A1. Engine specification
Bore mm 95 Stroke mm 105 Con-rod length mm 176 Compression ratio 18 Firing order 1-2-7-3-4-5-6-8 Firing distance deg. 90 valve numbers 4 Swirl number 1.8-1.9 Lower heating value MJ/kg 42.5 Stoichiometric air-fuel ratio 14.5
Appendix A2. Turbocharger performance maps for the baseline V8 engine
-10
-8
-6
-4
-2
0
2
4
6
8
10
12
14
16
18
20
22
24
26
28
30
32
34
36
38
40
1 1.5 2 2.5 3 3.5Pressure Ratio (T/s) P1T/P2S
Cor
rect
ed G
as T
urbi
ne F
low
(lb/
min
)
0.4
0.6
0.8
1
1.2
1.4
Effic
ienc
y
33240 39872 47054 57592 62704 66480Series28 Series29 Series30 Series31 Series32 Series33 Series34 Series35
A U T O M O T I V E Turbochargers
PROPRIETARY NOTICEThis document contains proprietary
information, and such information may not be disclosed to others for any
purpose, or used for manufacturing without written permission from
AlliedSignal.
TITLE:
AlliedSignal Turbocharging Systems: Torrance, California U.S.A. 02. REV:
AVNT37 84 Trim *090 A/R 3rd Iter Cored Vane AVNT37: Full Open
COMMENTS:PART NUMBERSSWA: Hsg: Shroud:
717079-5 720424-2
CLEARANCES(in)Axial: Radial: 'Z' Line-up:
IE695O TEST No:
DATE: 23-Feb-2001CELL No: 18
WW T
PT
T
* // .
= 1
1
51929 92
NN
TTphy
T=
1 519/
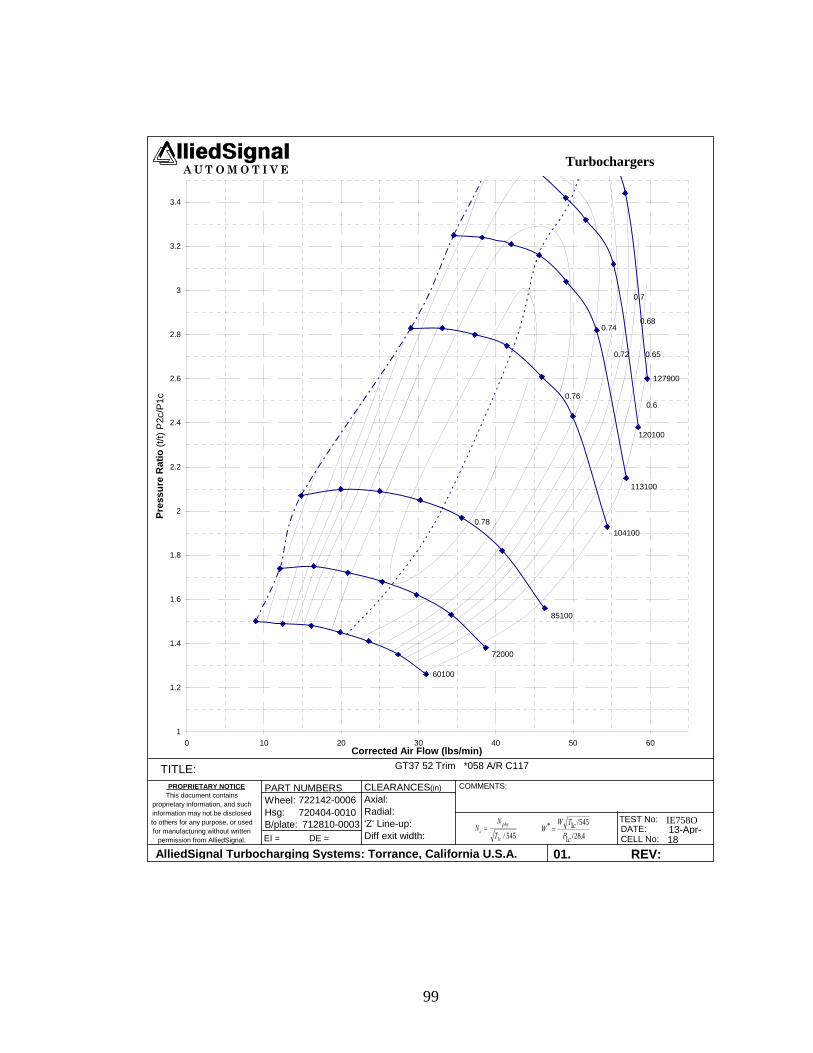
99
60100
72000
85100
104100
113100
120100
127900
0.6
0.65
0.68
0.7
0.72
0.74
0.76
0.78
1
1.2
1.4
1.6
1.8
2
2.2
2.4
2.6
2.8
3
3.2
3.4
0 10 20 30 40 50 60Corrected Air Flow (lbs/min)
Pres
sure
Rat
io (t
/t) P
2c/P
1cA U T O M O T I V E Turbochargers
PROPRIETARY NOTICEThis document contains
proprietary information, and such information may not be disclosed to others for any purpose, or used for manufacturing without written
permission from AlliedSignal.
TITLE:
AlliedSignal Turbocharging Systems: Torrance, California U.S.A. 01. REV:
GT37 52 Trim *058 A/R C117
EI = DE =
PART NUMBERSWheel: Hsg: B/plate:
722142-0006 720404-0010 712810-0003
COMMENTS:CLEARANCES(in)Axial: Radial: 'Z' Line-up: Diff exit width:
NN
Tcphy
c=
1 545/W
W T cP c
* // .
= 1 545
1 28 4
IE758O TEST No:DATE: 13-Apr-CELL No: 18

100
BIBLIOGRAPHY
1. Keppeler, S., Schulte, H., and Hermann Josef Ecker, H. J., “The Technical
Ramifications of Downsizing HSDI Diesel Technology to the 300 cc Displacement
Class,” SAE paper 981916.
2. Cantore, G., Mattarelli, E., and Fontanesi, S., “A New Concept of Supercharging
Applied to High Speed DI Diesel Engines,” SAE paper 2001-01-2485.
3. Ecker, H. J., Schwaderlapp, M., and Gill, D. K., ” Downsizing of Diesel Engines: 3-
Cylinder / 4-Cylinder,” SAE paper 2000-01-0990.
4. Guzzella, L., Wenger, U., and Martin, R., “IC-Engine Downsizing and Pressure-
Wave Supercharging for Fuel Economy,” SAE paper 2000-01-1019.
5. Atkins, M. J., and Koch, C. R., “A Well-to-Wheel Comparison of Several Powertrain
Technologies,” SAE paper 2003-01-0081.
6. Lecointe, B., and Monnier, G., “Downsizing a Gasoline Engine Using Turbocharging
with Direct Injection,” SAE paper 2003-01-0542.
7. Stoffels, H., and Schroeer, M., “NVH Aspects of a Downsized Turbocharged
Gasoline Powertrain with Direct Injection,” SAE paper 2003-01-1664.
8. Beatrice, C., Belardini P., Bertoli, C., Del Giacomo, N., and Migliaccio, M.,
“Downsizing of Common Rail D.I. Engines: Influence of Different Injection
Strategies on Combustion Evolution,” SAE paper 2003-01-1784.
9. Saulnier, S., and Guilain, S., “Computational Study of Diesel Engine Downsizing
Using Two-StageTurbocharging,” SAE paper 2004-01-0929.
101
10. Lake, T., Stokes, J., Murphy, R., Osborne, R., Schamel, A., “Turbocharging Concepts
for Downsized DI Gasoline Engines,” SAE paper 2004-01-0036.
11. Toussaint, Y., “Achieving a Low CO2 Emissions Hybrid Vehicle with a Well to
Wheel Approach,” SAE paper 2000-01-3237.
12. Palumbo, A. J., “The "Space Bus" – Performance, Major Components, and
Implications for Engineered Hybrid Drive Systems for Medium and Heavy Hybrid
Vehicles,” SAE paper 1999-01-3725.
13. Hayes, R. R., Williams, A., Ireland, J., Walkowicz, K., and Black, S., “King County
Metro – Allison Hybrid Electric Transit Bus Testing,” SAE paper 2006-01-3570.
14. Katrašnik, T., “Analysis of Fuel Consumption Reduction Due to Powertrain Hybrid-
ization and Downsizing of ICE,” SAE paper 2006-01-3262.
15. Takada, Y., Ueki, S., and Saito, A., ” Study on Fuel Economy and Nox Emissions of
Medium Duty Hybrid Truck in Real Traffic Conditions,” SAE paper 2004-01-1086.
16. Walters, J., Husted, H., and Rajashekara, K., “Comparative Study of Hybrid
Powertrain Strategies,” SAE paper 2001-01-2501.
17. Polletta, D. F., Louckes, T., and Severinsky, A. J., “Fuel Economy and Performance
Impact of Hybrid Drive Systems in Light Trucks, Vans & SUV's,” SAE paper 2001-
01-2826.
18. Husted, H. L., “A Comparative Study of the Production Applications of Hybrid
Electric Powertrains,” SAE paper 2003-01-2307.
19. Burke, A., “Saving Petroleum with Cost-Effective Hybrids,” SAE paper 2003-01-
3279.
102
20. Tamai, G., Jeffers, M. A., Lo, C., Thurston, C., Tarnowsky, S., and Poulos, S.,
“Development of the Hybrid System for the Saturn VUE Hybrid,” SAE paper 2006-
01-1502.
21. Wu, B., Lin, C. C., Filipi, Z., Peng, H., and Assanis, D., “Optimization of Power
Management Strategies for a Hydraulic Hybrid Medium Truck,” Proceedings of the
2002 Advanced Vehicle Control Conference, Hiroshima, Japan, September 2002.
22. Lin, C. C., Filipi, Z., Louca, L., Peng, H., Assanis, D., Stein, J., “Modelling and
control of a medium-duty hybrid electric truck,” Heavy Vehicle Systems, Int. J. of
Vehicle Design, Vol. 11, Nos. 3/4, 2004.
23. Attard, W., Watson, H. C., Konidaris, S., and Khan, M. A., “Comparing the
Performance and Limitations of a Downsized Formula SAE Engine in Normally
Aspirated, Supercharged and Turbocharged Modes,” SAE paper 2006-32-0072.
24. Lefebvre, A., and Guilain, S., “Modelling and Measurement of the Transient
Response of a Turbocharged SI Engine,” SAE paper 2005-01-0691.
25. Watanabe, T., Koike, T., Furukawa, H., Ikeya, N., Sakakida, M., “Development of
Turbocharger for Improving Passenger Car Acceleration,” SAE paper 960018.
26. Kawaguchi, J., Adachi, K., Kono, S., and Kawakami, T., “Development of VFT
(Variable Flow Turbocharger),” SAE paper 1999-01-1242.
27. Kattwinkel, T., Weiss, R., and Boeschlin, J. P., “Mechatronic Solution for Electronic
Turbocharger,” SAE paper 2003-01-0712.
28. Cantemi, C. G., “Twin Turbo Strategy Operation,” SAE paper 2001-01-0666.
29. Tashima, S., Okmoto, H., Fujimoto, Y., and Nakao, M, “ Sequential Twin
Turbocharged Rotary Engine of the Latest RX-7,” SAE paper 941030.
103
30. Choi, C., Kwon, S., and Cho, S., “Development of Fuel Consumption of Passenger
Diesel Engine with 2 Stage Turbocharger,” SAE paper 2006-01-0021.
31. Serrano, J. R., Arnau, F. J., Dolz, V., Tiseira, A., Lejeune, M., and Auffret, N.,
“Analysis of the Capabilities of a Two-stage Turbocharging System to Fulfill the
US2007 Anti-Pollution Directive for Heavy Duty Diesel Engines,” International
Journal of Automotive Technology, Vol. 9, No. 3, pp. 277-288 (2008).
32. Bonello, M. J., Caldwell, D. M., Pigott, J. A., Prior, G. P., and Schag, T. M., “The
Supercharged Northstar DOHC 4.4L V8 Engine for Cadillac,” SAE paper 2005-01-
1854.
33. Pallotti, P., Torella, E., New, J., Criddle, M., andBrown, J., “Application of an
Electric Boosting System to a Small, Four-Cylinder S.I. Engine,” SAE paper 2003-
32-0039.
34. Ueda, N., Matsuda, N., Kamata, M., and Sakai, H., Kanesaka, H., ” Proposal of New
Supercharging System for Heavy Duty Vehicular Diesel and Simulation Results of
Transient Characteristics,” SAE paper 2001-01-0277.
35. George, S., Morris, G., Dixon, J., Pearce, D., and Heslop, G., “Optimal Boost Control
for an Electrical Supercharging Application,” SAE paper 2004-01-0523.
36. Miyagi, Y., Takabe, S., Miyashita, K., and Ikeya, N., “Experimental study of New
Lysholm Supercharger with a Simple Unloading System”, SAE Paper 960952.
37. Takabe, S., Ikeya, N., and Miyagi, Y., “Second Generation Lysholm Compressor,”
SAE paper 980774.
38. Watson, N. and Janota, M.S., “Turbocharging the internal combustion engine,”
Wiley-Interscience, 1982.
104
39. Johannes Andersen, Erik Karlsson and Anders Gawell, “Variable Turbine Geometry
on SI Engines,” SAE paper 2006-01-0020.
40. Brace, C. J., Cox, A., Hawley, J. G., Vaughan, N. D., Wallace, F. W., Horrocks, R.
W., and Bird, G. L., “Transient Investigation of Two Variable Geometry Turbo-
chargers for Passenger Vehicle Diesel Engines,” SAE paper 1999-01-1241.
41. Arnold, S., Groskreutz, M., Shahed, S. M., and Slupski, K., “Advanced Variable
Geometry Turbocharger for Diesel Engine Applications,” SAE paper 2002-01-0161
42. Filipi, Z., Wang, Y., and Assanis, D., “Efffect of Variable Geometry Turbine (VGT)
on Diesel Engine and Vehicle System Transient Response”, SAE Paper 2001-01-
1247, 2001.
43. Nelson, S. A., Filipi, Z. S., and Assanis, D. N., “The Use of Neural Nets for Matching
Fixed or Variable Geometry Compressor with Diesel Engines,” Journal of
Engineering for Gas Turbines and Power Vol. 125, April 2003, pp. 572-579.
44. Backlund O, Kee P R, Rydquist J E, Giselmo K, Sundin L, “Volvo’s MEP and PCP
Engines: Combining Environmental Benefit with High Performance “, SAE Paper
910010.
45. Millo, F., Mallamo, F., and Mego, G.G., “The Potential of Dual Stage Turbocharging
and Miller Cycle for HD Diesel Engines”, SAE Paper 2005-01-0221, 2005.
46. Benson, R. S., and Sventnicka, F. V., 1974, “Two-Stage Turbocharging of Diesel
Engines: A Matching Procedure and an Experimental Investigation,” SAE Paper No.
740740.
105
47. Assanis, D.N., and Heywood, J.B., “Development and Use of a Computer Simulation
of the Turbocompounded Diesel System for Engine Performance and Component
Heat Transfer Studies”, SAE paper 860329.
48. Poola, R. R., Sekar, R., Assanis, D. N., and Cataldi, G. R., 1996, ‘‘Study of Oxygen-
Enriched Combustion Air for Locomotive Diesel Engines,’’ ICE-Vol. 27-4,
Proceedings of ASME-ICE Fall Technical Conference, Fairborn, OH.
49. Filipi, Z. S., Assanis, D. N., “A Nonlinear, Transient, Single-Cylinder Diesel Engine
Simulation for Predictions of Instantaneous Engine Speed and Torque,” Journal of
Engineering for Gas Turbines and Power, OCTOBER 2001, Vol. 123, pp. 951-959.
50. Anderson, J. D., “Fundamentals of Aerodynamics”, 2nd edition, 1991.
51. Heywood, J. B., “Internal Combustion Engine Fundamentals”, Mc Graw-Hill, Inc.,
1988.
52. Primus, R. J., “A Second Law Approach to Exhaust System Optimization,” SAE
paper 840033.
53. Depcik, C., Assanisn, D. N., “A Universal Heat Transfer Correlation for Intake and
Exhaust Flows in a Spark-Ignition Internal Combustion Engine,” SAE paper 2002-01-
0372.
54. Chang, J., Guralp, O., Filipi, Z., Assanis, D., Kuo, T. W., Najt, P., and Rask, R.,
“New Heat Transfer Correlation for an HCCI Engine Derived from Measurements of
Instantaneous Surface Heat Flux,” SAE paper 2004-01-2996.
55. Assanis, D. N., Filipi, Z., Gravante, S., Grohnke, D., Gui, X., Louca, L., Rideout, G.,
Stein, J., “Validation and Use of SIMULINK Integrated, High Fidelity, Engine-In-
Vehicle Simulation of the International Class VI Truck”, SAE Paper 2000-01-0288.
106
56. Tuttle, J. H., “Controlling Engine Load by Means of Late Intake-Valve Closing”.
SAE paper number 800794.
57. Tuttle, J. H., “Controlling Engine Load by Means of Early Intake-Valve Closing”.
SAE paper number 820408.
58. Assanis, D. N., and B. Bolton, “Variable Valve Timing Strategies for Optimum
Engine Performance and Fuel Economy,” ASME Paper 94-ICE-5, ASME ETCE
Conference, New Orleans, LA, January 23-26, 1994.
59. Asmus, T., “Valve Events and Engine Operation,” SAE Paper 820749.
60. Soderberg, F., and Johansson, B., ”Load Control Using Late Intake Valve Closing in
a Cross Flow Cylinder Head,” SAE paper 2001-01-3554.
61. Martins, J.G., Uzuneanu, K., Ribeiro, B.S., and Jasasky, O., “Thermodynamic
Analysis of an Over-Expanded Engine”, SAE Paper 2004-01-0617.
62. Anderson, M. K., Assanis, D.N., and Filipi, Z.S., “First and Second Law Analyses of
a Naturally-Aspirated, Miller Cycle, SI Engine with Late Intake Valve Closure”, SAE
paper 980889.
63. Moro, D., Ponti, F., and Serra, G., “Thermodynamic Analysis of Variable Valve
Timing Infuence on SI Engine Efficiency,” SAE paper 2001-01-0667.
64. Kamo, R., Mavinahally, N. S., Kamo, L., Bryzik, W., and Reid, M., “Emissions
Comparisons of an Insulated Turbocharged Multi-Cylinder Miller Cycle Diesel
Engine,” SAE paper 980888.
65. Bolton, B., and D. N. Assanis, “Optimum Breathing Strategies for Turbocharged
Diesel Engines Based on the Miller Cycle Concept,” ASME PD-Vol. 64-8.2, pp. 253-
107
262, Second Biennial European Joint Conference on Engineering Systems Design and
Analysis ESDA Proceedings, London, England, July 4-7, 1994.
66. Wilson, N. D., Watkins, A.J. and Dopson, C., “Asymmetric Valve Strategies and
Their Effect on Combustion”, SAE paper number 930821.
67. Kattwinkel, T., Weiss, R., and Boeschlin, J.P., “Mechatronic Solution for Electronic
Turbocharger”, SAE Paper 2003-01-0712, 2003.
68. Munz, S., Schier, M., Schmalzl, H.P., and Bertolini, T., “Design and Performance of
an Innovative Electrically Driven Charging System”, Borg Warner Turbo Systems.
69. Jacobs, T., Assanis, D.N., and Filipi, Z., “The Impact of Exhaust Gas Recirculation
on Performance and Emissions of a Heavy-Duty Diesel Engine”, SAE Paper 2003-
01-1068, 2003.
70. Singer, D.A., “Comparison of a Supercharger vs. a Turbocharger in a Small
Displacement Gasoline Engine Application”, SAE Paper 850244.
Exhaust Manifold Intake Manifold Exhaust Gas Discharge
Ambient Air Inlet