Embed Size (px)
Citation preview
Dual Instruments Dual Instruments or Needless or Needless Duplication?Duplication?
Evaluating the Combined Use of Evaluating the Combined Use of Environmental Flow and Environmental Flow and
Salinity TargetsSalinity TargetsLisa Lee and Tiho Ancev,Lisa Lee and Tiho Ancev,
Agricultural and Resource Agricultural and Resource Economics,Economics,
The University of SydneyThe University of Sydney
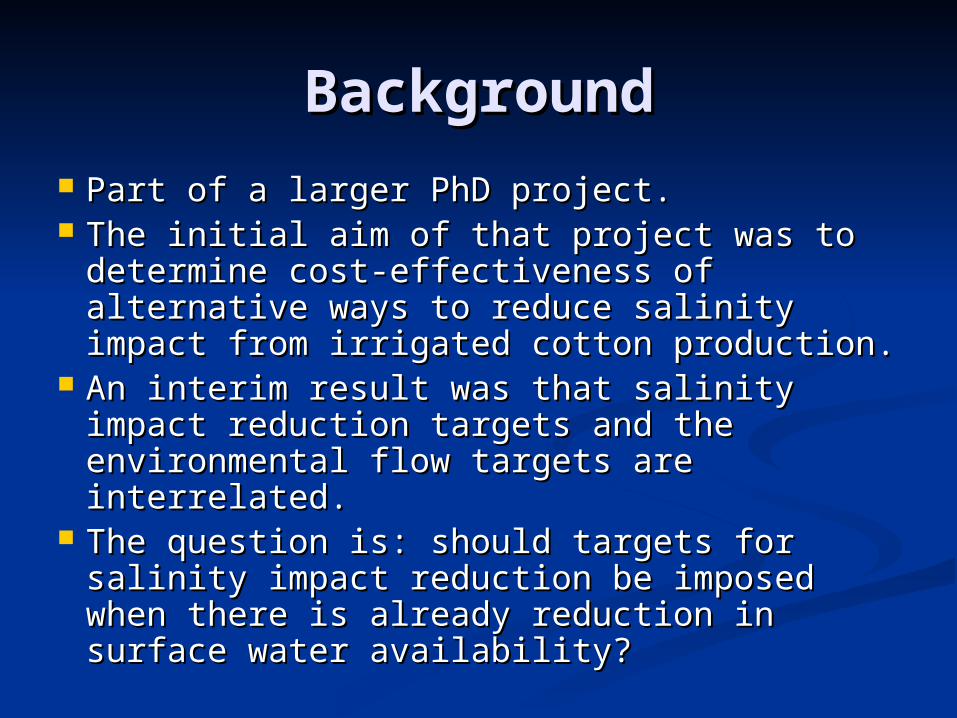
BackgroundBackground Part of a larger PhD project.Part of a larger PhD project. The initial aim of that project was to The initial aim of that project was to
determine cost-effectiveness of alternative determine cost-effectiveness of alternative ways to reduce salinity impact from ways to reduce salinity impact from irrigated cotton production.irrigated cotton production.
An interim result was that salinity impact An interim result was that salinity impact reduction targets and the environmental reduction targets and the environmental flow targets are interrelated.flow targets are interrelated.
The question is: should targets for salinity The question is: should targets for salinity impact reduction be imposed when there is impact reduction be imposed when there is already reduction in surface water already reduction in surface water availability? availability?
IntroductionIntroduction Increasing focus on water resource Increasing focus on water resource
management in Australia in the last 15 management in Australia in the last 15 years.years.
Over-allocation and under-pricing of water Over-allocation and under-pricing of water drives inefficient use.drives inefficient use.
Public pressure for more effective Public pressure for more effective management of scarce water resources.management of scarce water resources.
Water Reform Framework, National Water Water Reform Framework, National Water Initiative, Living Murray First Step, and Initiative, Living Murray First Step, and the most recent Commonwealth Water the most recent Commonwealth Water Plan – aimed at efficient and sustainable Plan – aimed at efficient and sustainable water use.water use.
Water management Water management situationsituation
Water Sharing Plans (WSP) Water Sharing Plans (WSP) introduced for NSW Catchments:introduced for NSW Catchments: Extractive rulesExtractive rules Environmental flowsEnvironmental flows
Also Groundwater WSPs, addressing Also Groundwater WSPs, addressing over-allocated aquifers. Up to 90% over-allocated aquifers. Up to 90% reduction.reduction.
Salinity concerns. Based on past Salinity concerns. Based on past negative experiences with irrigation negative experiences with irrigation induced salinity.induced salinity.
Irrigation induced Irrigation induced salinitysalinity
Occurs as irrigation water leaks below the Occurs as irrigation water leaks below the root zone and deep-drains (or percolates) into root zone and deep-drains (or percolates) into groundwater aquifers. groundwater aquifers.
On its way it may mobilise salt, which can On its way it may mobilise salt, which can subsequently result in increased stream and subsequently result in increased stream and soil salinity.soil salinity.
This is a most serious problem along the main This is a most serious problem along the main stem of the River Murray in SA, but end-of-stem of the River Murray in SA, but end-of-valley salinity targets also introduced in NSW. valley salinity targets also introduced in NSW.
SA
QLD
NSW
"
"
"
"
"
MURRUMBIDGEE RIVER
MURRAY RIVER
EDWARD RIVER
HOP
KIN
S R
IVER
YARRA RIVER
HUNTER RIVER
MACQUARIE RIVER
KIE
WA
RIV
ER
RIVER MURRAY
GWYDIR RIVER
DARLING RIVER
YANKO CREEK
TURON RIVERLACHLAN RIVER
GENOA RIVER
MOLE RIVER
CLY
DE
RIV
ER
NAMOI RIVER
BARNARD RIVER
SARA RIVER
SEVEN CR
EEKS
TWEED R
IVER
COLO RIVER
FITZROY RIVER
BARWON RIVER
LA TROBE RIVER
KIN
G R
IVE
R
PEEL RIVER
MURRAY RIVER
MURRAY RIVER
SYDNEY
CANBERRA
MELBOURNE
NEWCASTLE
HAY
COOMA
DUBBO
MOREE
ORANGE
WARRENNYNGAN
WALGETT
QUIRINDI
GUNNEDAH
GRIFFITH
NARRABRI
INVERELL
GIL GANDRA
COONAMBLE
ST GEORGE
DENILIQUIN
WELLINGTON
WAGGA WAGGA
COOTAMUNDRA
BROKEN HILL
GOONDIWINDI
WEST WYALONG
MURRAY BRIDGE
COONABARABRAN
WA
NT
SA
QLD
NSW
VIC
TAS
AUSTRALIAWA
NT
SA
QLD
NSW
VIC
TAS
AUSTRALIA
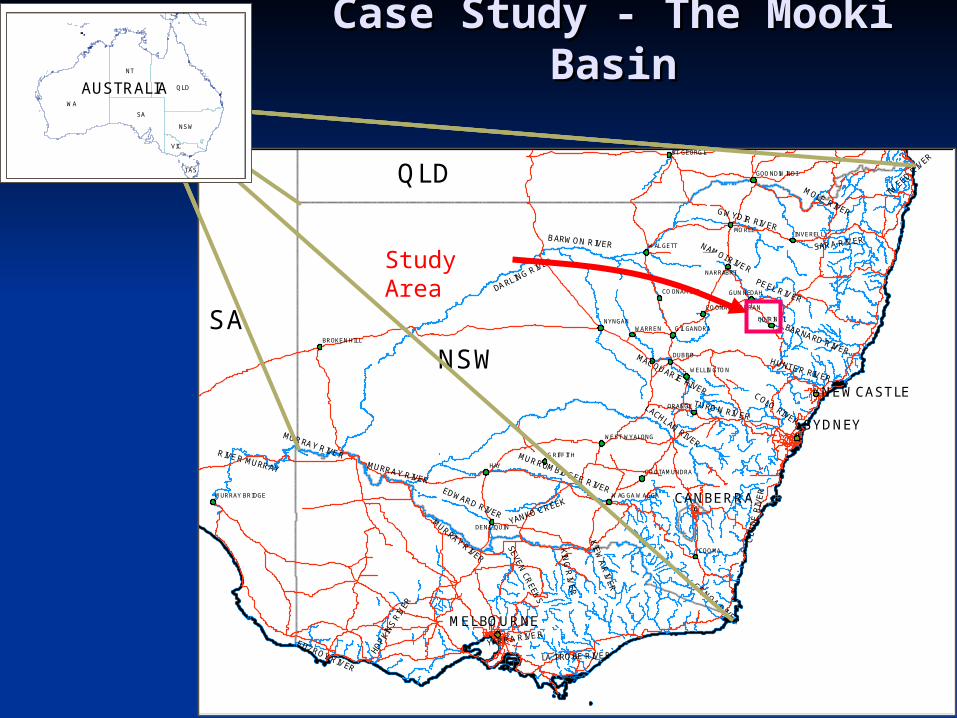
Study Area
Case Study - The Mooki Case Study - The Mooki BasinBasin
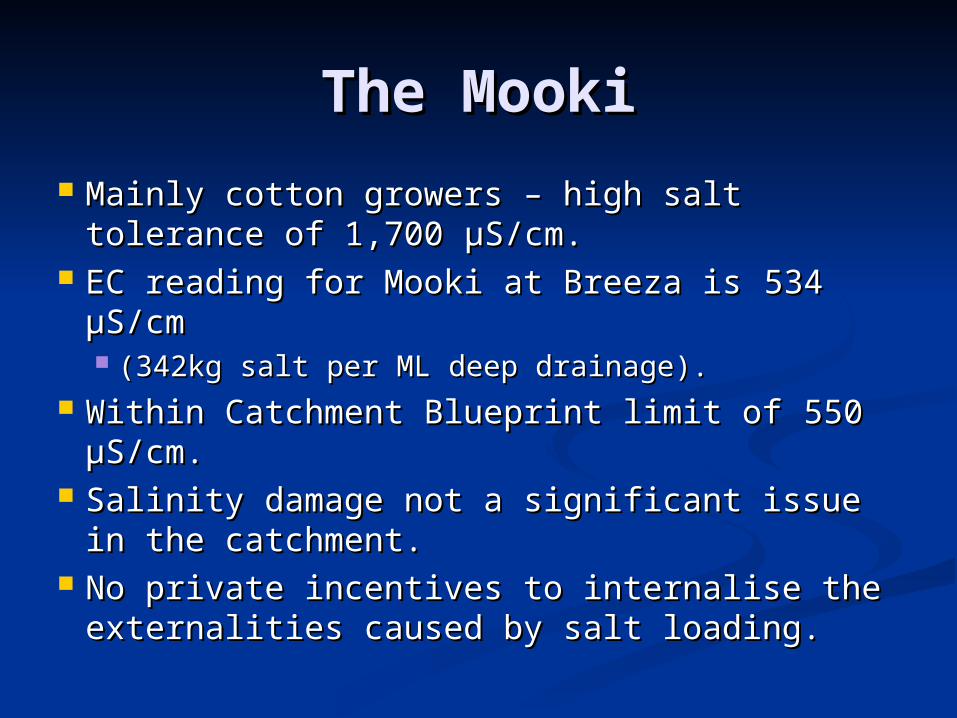
The MookiThe Mooki
Mainly cotton growers – high salt tolerance Mainly cotton growers – high salt tolerance of 1,700 of 1,700 µS/cm.µS/cm.
EC reading for Mooki at Breeza is EC reading for Mooki at Breeza is 534 534 µS/cm µS/cm (342kg salt per (342kg salt per ML deep drainage).ML deep drainage).
Within Catchment Blueprint limit of Within Catchment Blueprint limit of 550 550 µS/cm.µS/cm.
Salinity damage not a significant issue in Salinity damage not a significant issue in the catchment.the catchment.
No private incentives to internalise the No private incentives to internalise the externalities caused by salt loading. externalities caused by salt loading.
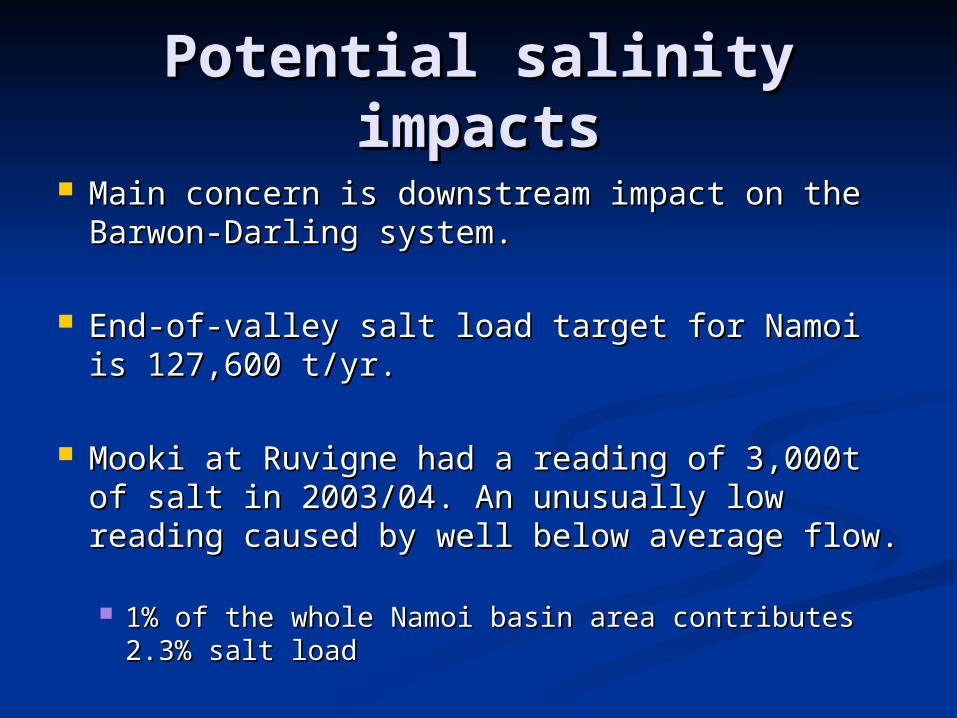
Potential salinity impactsPotential salinity impacts
Main concern is downstream impact on the Main concern is downstream impact on the Barwon-Darling system.Barwon-Darling system.
End-of-valley salt load target for Namoi is End-of-valley salt load target for Namoi is 127,600 t/yr127,600 t/yr..
Mooki at Ruvigne had a reading of 3,000t of Mooki at Ruvigne had a reading of 3,000t of saltsalt in 2003/04. An unusually low reading in 2003/04. An unusually low reading caused by well below average flow. caused by well below average flow. 1% of the whole Namoi basin area contributes 1% of the whole Namoi basin area contributes
2.3% salt load2.3% salt load
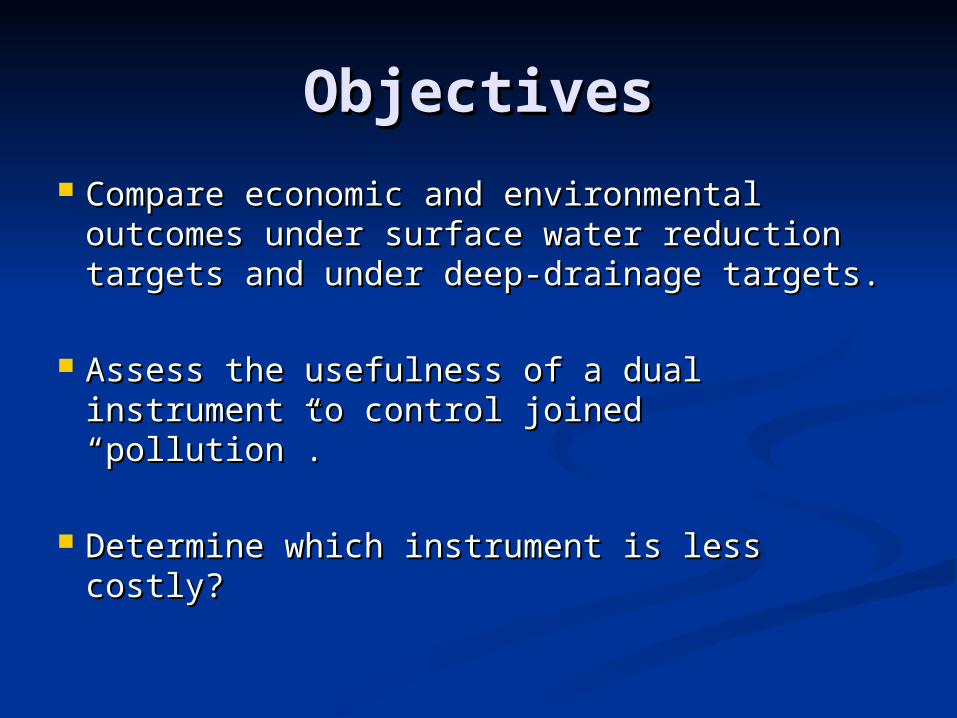
ObjectivesObjectives
Compare economic and environmental Compare economic and environmental outcomes under surface water reduction outcomes under surface water reduction targets and under deep-drainage targets.targets and under deep-drainage targets.
Assess the usefulness of a dual Assess the usefulness of a dual instrument to control joined “pollution”.instrument to control joined “pollution”.
Determine which instrument is less Determine which instrument is less costly?costly?
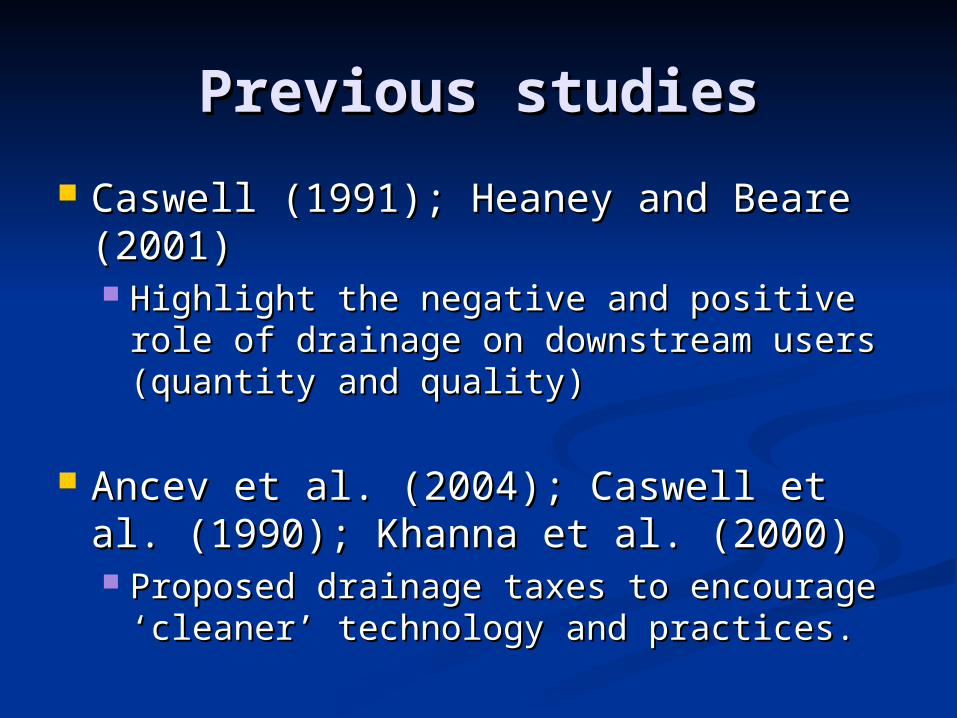
Previous studiesPrevious studies
Caswell (1991); Heaney and Beare Caswell (1991); Heaney and Beare (2001)(2001) Highlight the negative and positive role Highlight the negative and positive role
of drainage on downstream users of drainage on downstream users (quantity and quality) (quantity and quality)
Ancev et al. (2004); Caswell et al. Ancev et al. (2004); Caswell et al. (1990); Khanna et al. (2000)(1990); Khanna et al. (2000) Proposed drainage taxes to encourage Proposed drainage taxes to encourage
‘cleaner’ technology and practices.‘cleaner’ technology and practices.
Previous studiesPrevious studies
Legras and Lifran (2006Legras and Lifran (2006)) Decoupled policy instruments separately Decoupled policy instruments separately
for water quantity and for salinity impact. for water quantity and for salinity impact. Found inefficient when the two are related.Found inefficient when the two are related.
Whitten et al. (2005)Whitten et al. (2005); ; Weinberg et al. Weinberg et al. (1993)(1993) Significant gap in hydrological Significant gap in hydrological
understandingunderstanding Water instrument in own right is sufficientWater instrument in own right is sufficient
Analytical framework:Analytical framework:A stylised storyA stylised story
Catchment manager imposes reductions in surface Catchment manager imposes reductions in surface water allocations to ensure environmental flows. water allocations to ensure environmental flows. The manager is not worried about salinity impacts.The manager is not worried about salinity impacts.
The catchment manager may come under pressure The catchment manager may come under pressure from the manager of the whole basin, to impose from the manager of the whole basin, to impose salinity impact reduction targets in order to salinity impact reduction targets in order to ensure that the end-of-valley target is not ensure that the end-of-valley target is not breached.breached.
How can the catchment manager evaluate this How can the catchment manager evaluate this “dual” instrument? “dual” instrument?
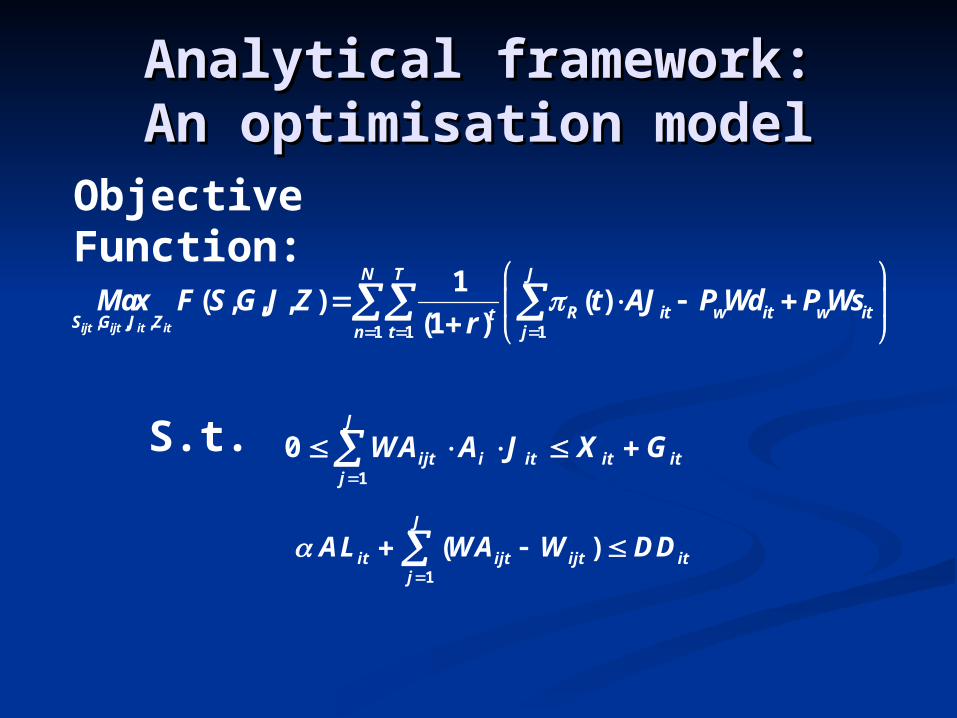
Analytical framework:Analytical framework:An optimisation modelAn optimisation model
1
( )J
it ijt ijt itj
AL WA W DD
1
0J
ijt i it it itj
WA A J X G
, , ,1 1 1
1( , , , ) ( )
(1 )ijt ijt it it
N T J
R it w it w ittS G J Zn t j
Max F S G J Z t AJ P Wd P Wsr
S.t.
Objective Function:
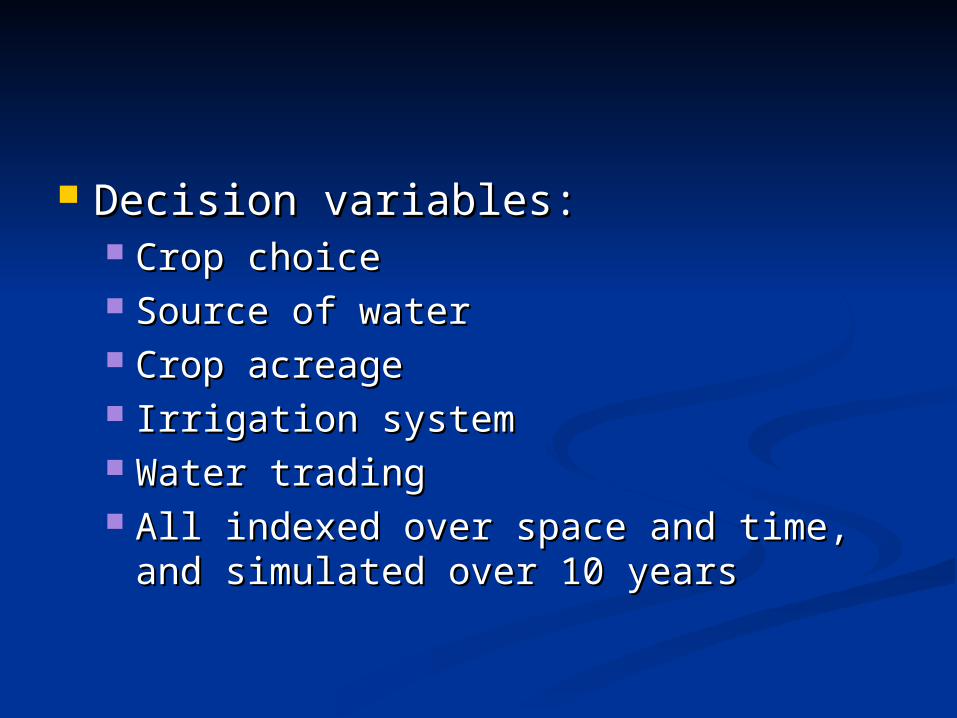
Decision variables:Decision variables: Crop choiceCrop choice Source of water Source of water Crop acreageCrop acreage Irrigation systemIrrigation system Water tradingWater trading All indexed over space and time, and All indexed over space and time, and
simulated over 10 yearssimulated over 10 years
Biophysical ModelBiophysical Model
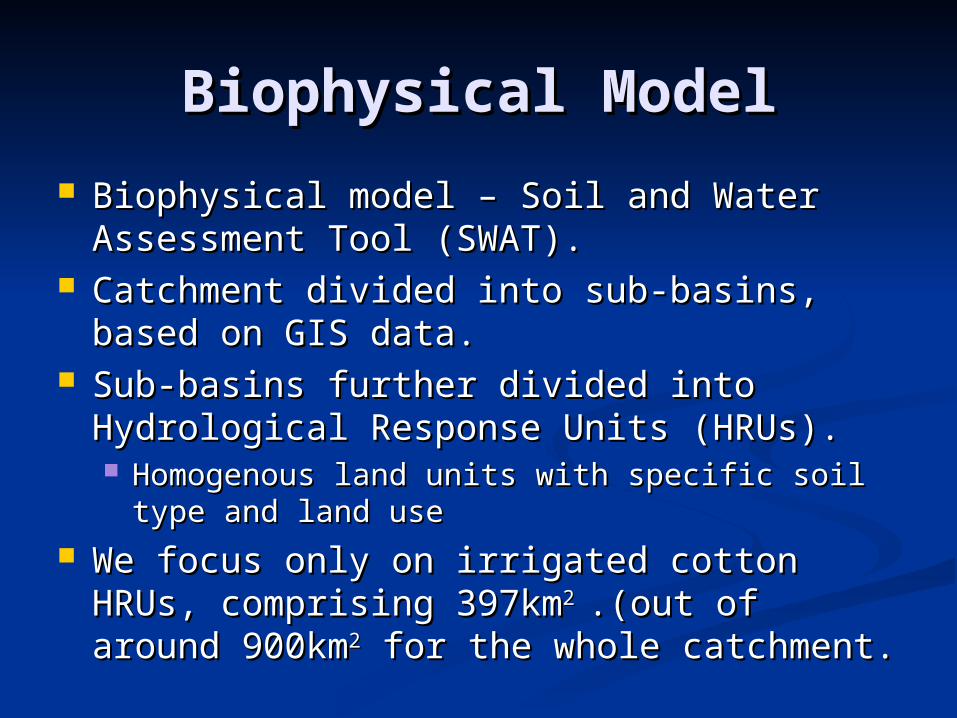
Biophysical model – Soil and Water Biophysical model – Soil and Water Assessment Tool (SWAT).Assessment Tool (SWAT).
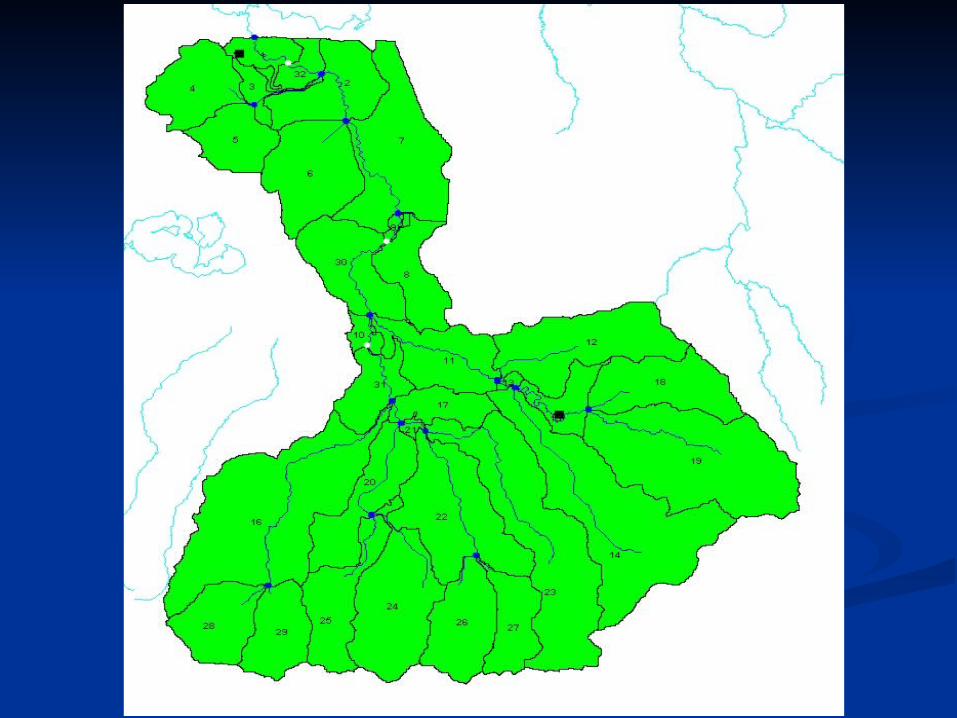
Catchment divided into sub-basins, based Catchment divided into sub-basins, based on GIS data.on GIS data.
Sub-basins further divided into Sub-basins further divided into Hydrological Response Units (HRUs). Hydrological Response Units (HRUs). Homogenous land units with specific soil type Homogenous land units with specific soil type
and land useand land use We focus only on irrigated cotton HRUs, We focus only on irrigated cotton HRUs,
comprising 397kmcomprising 397km2 2 .(out of around 900km.(out of around 900km22 for the whole catchment. for the whole catchment.
Biophysical ModelBiophysical Model
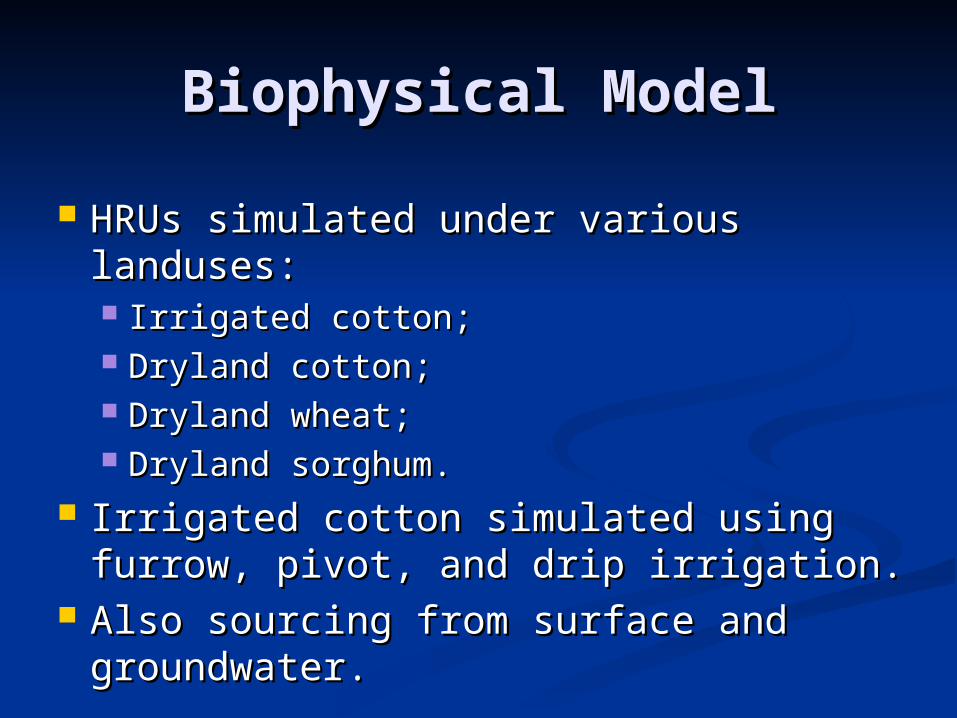
HRUs simulated under various HRUs simulated under various landuses:landuses: Irrigated cotton; Irrigated cotton; Dryland cotton;Dryland cotton; Dryland wheat;Dryland wheat; Dryland sorghum.Dryland sorghum.
Irrigated cotton simulated using furrow, Irrigated cotton simulated using furrow, pivot, and drip irrigation.pivot, and drip irrigation.
Also sourcing from surface and Also sourcing from surface and groundwater.groundwater.
Biophysical ModelBiophysical Model
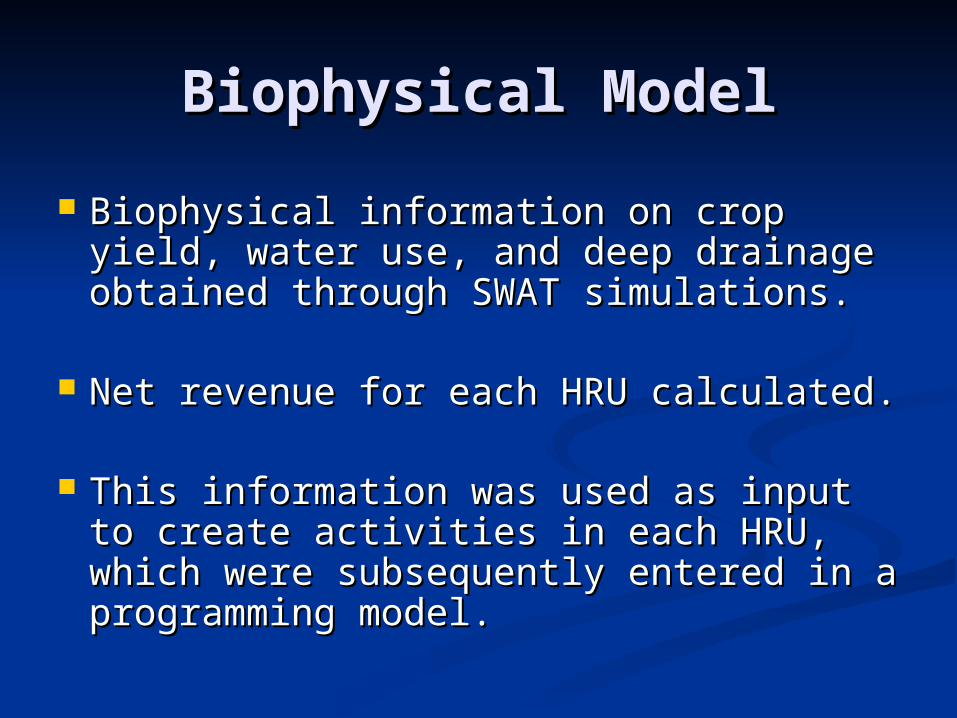
Biophysical information on crop yield, Biophysical information on crop yield, water use, and deep drainage water use, and deep drainage obtained through SWAT simulations. obtained through SWAT simulations.
Net revenue for each HRU calculated.Net revenue for each HRU calculated.
This information was used as input to This information was used as input to create activities in each HRU, which create activities in each HRU, which were subsequently entered in a were subsequently entered in a programming model.programming model.
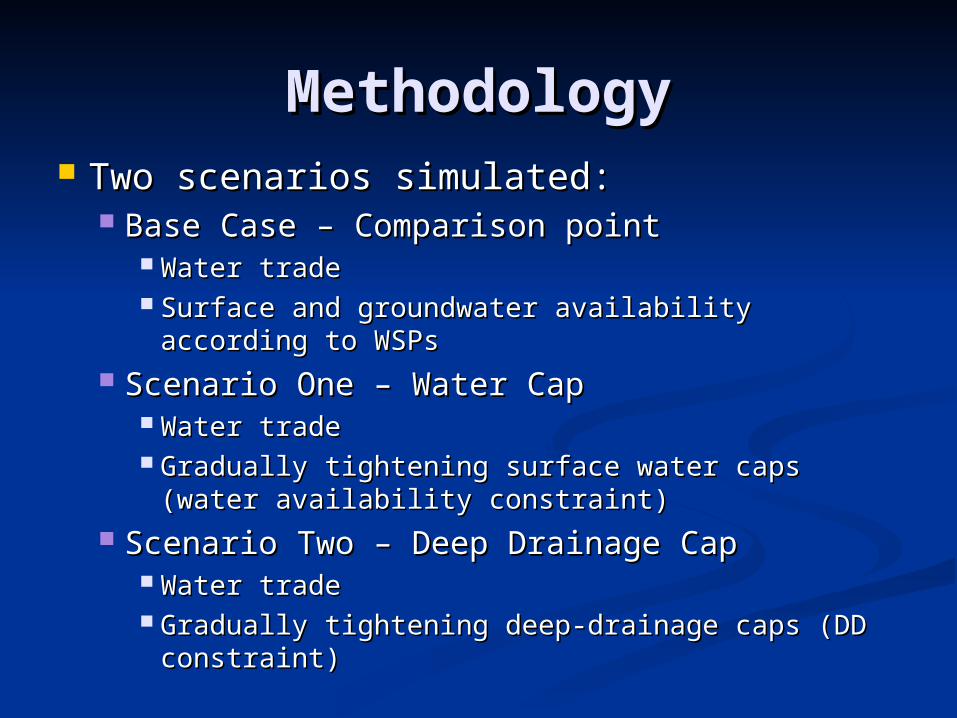
MethodologyMethodology Two scenarios simulated:Two scenarios simulated:
Base Case – Comparison pointBase Case – Comparison point Water tradeWater trade Surface and groundwater availability according to Surface and groundwater availability according to
WSPsWSPs Scenario One – Water CapScenario One – Water Cap
Water tradeWater trade Gradually tightening surface water caps (water Gradually tightening surface water caps (water
availability constraint)availability constraint) Scenario Two – Deep Drainage CapScenario Two – Deep Drainage Cap
Water tradeWater trade Gradually tightening deep-drainage caps (DD Gradually tightening deep-drainage caps (DD
constraint)constraint)
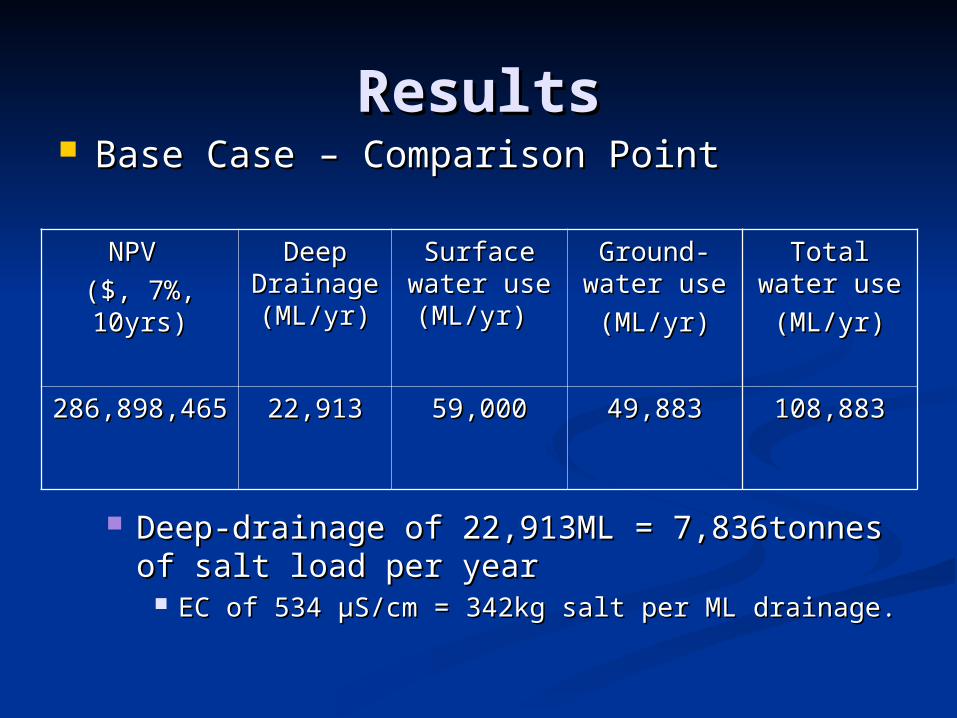
ResultsResults Base Case – Comparison PointBase Case – Comparison Point
Deep-drainage of 22,913ML = 7,836tonnes of Deep-drainage of 22,913ML = 7,836tonnes of salt load per yearsalt load per year
EC of 534 µS/cm = 342kg salt per ML drainage.EC of 534 µS/cm = 342kg salt per ML drainage.
NPV NPV
($, 7%, ($, 7%, 10yrs)10yrs)
Deep Deep Drainage Drainage (ML/yr)(ML/yr)
Surface Surface water use water use (ML/yr)(ML/yr)
Ground-Ground-water usewater use
(ML/yr)(ML/yr)
Total water Total water use use
(ML/yr)(ML/yr)
286,898,465 286,898,465 22,91322,913 59,00059,000 49,88349,883 108,883108,883
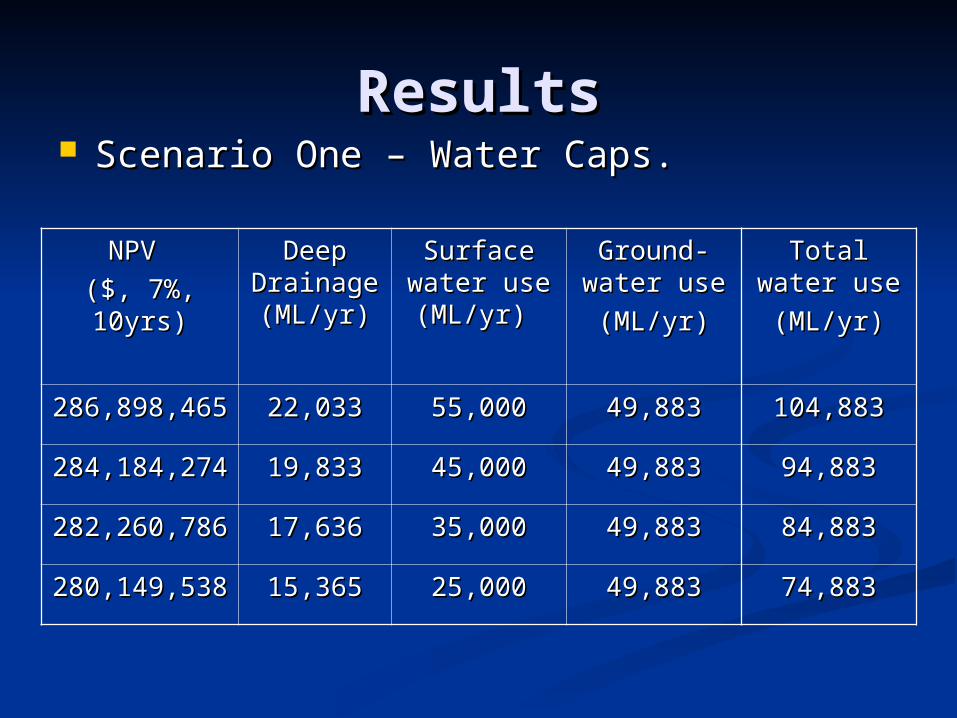
ResultsResults
NPV NPV
($, 7%, ($, 7%, 10yrs)10yrs)
Deep Deep Drainage Drainage (ML/yr)(ML/yr)
Surface Surface water use water use (ML/yr)(ML/yr)
Ground-Ground-water usewater use
(ML/yr)(ML/yr)
Total water Total water use use
(ML/yr)(ML/yr)
286,898,465286,898,465 22,03322,033 55,00055,000 49,88349,883 104,883104,883
284,184,274284,184,274 19,83319,833 45,00045,000 49,88349,883 94,88394,883
282,260,786282,260,786 17,63617,636 35,00035,000 49,88349,883 84,88384,883
280,149,538280,149,538 15,36515,365 25,00025,000 49,88349,883 74,88374,883
Scenario One – Water Caps.Scenario One – Water Caps.
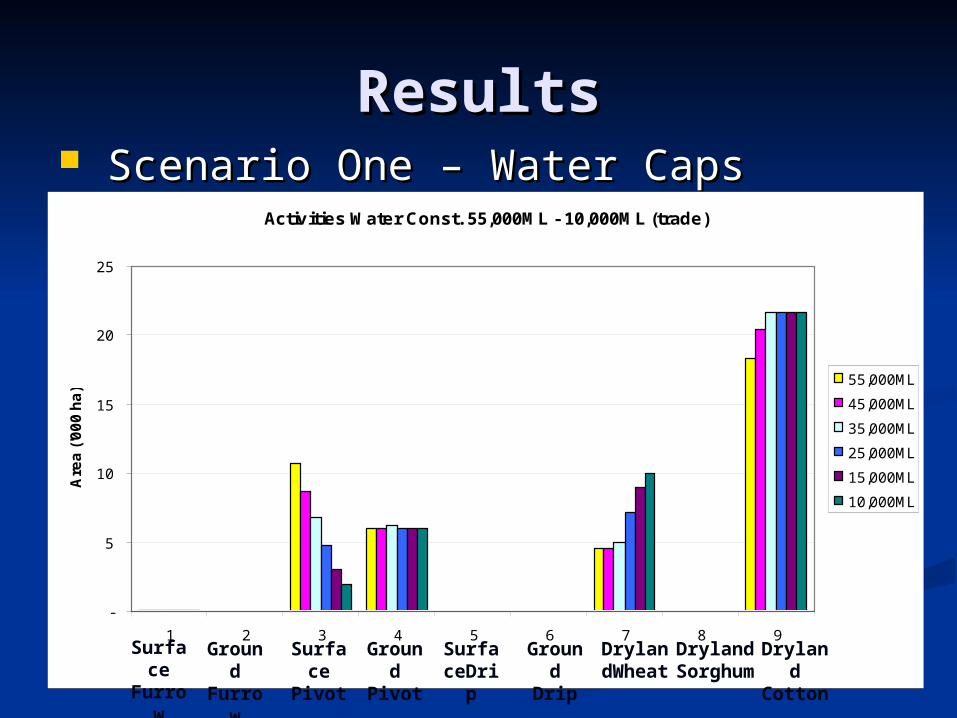
ResultsResults Scenario One – Water Caps Scenario One – Water Caps (cont.)(cont.) Activities Water Const. 55,000ML - 10,000ML (trade)
-
5
10
15
20
25
1 2 3 4 5 6 7 8 9
Activities
Are
a (
'00
0 h
a)
55,000ML
45,000ML
35,000ML
25,000ML
15,000ML
10,000ML
Surface
Furrow
Ground
Furrow
Surface
Pivot
Ground
Pivot
SurfaceDri
p
Ground
Drip
DrylandWhea
t
Dryland
Sorghum
Dryland
Cotton
ResultsResults
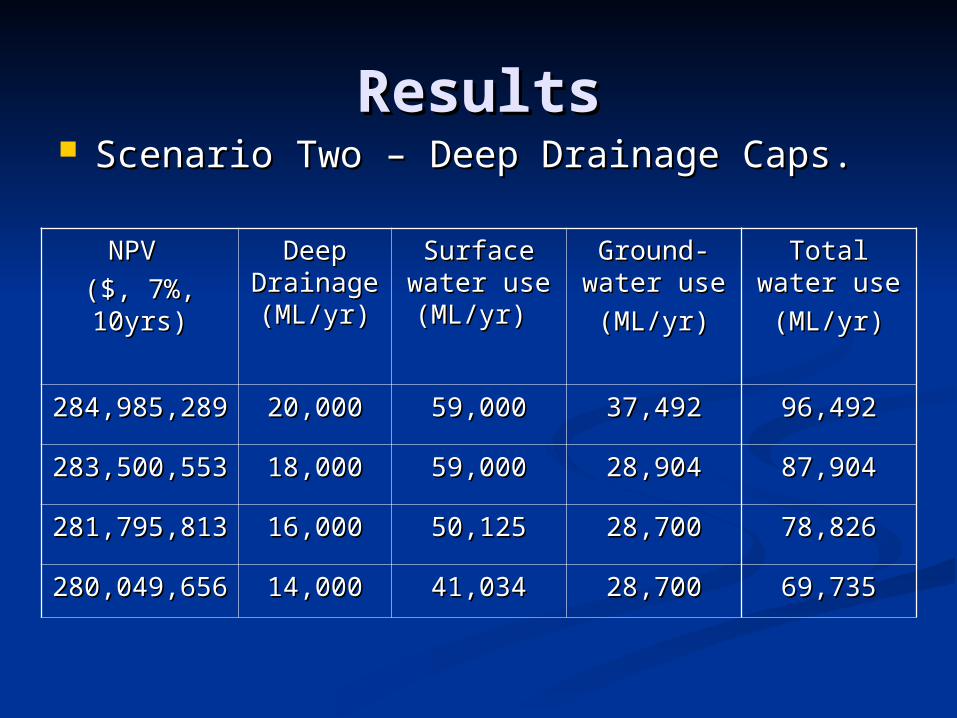
NPV NPV
($, 7%, ($, 7%, 10yrs)10yrs)
Deep Deep Drainage Drainage (ML/yr)(ML/yr)
Surface Surface water use water use (ML/yr)(ML/yr)
Ground-Ground-water usewater use
(ML/yr)(ML/yr)
Total water Total water use use
(ML/yr)(ML/yr)
284,985,289284,985,289 20,00020,000 59,00059,000 37,49237,492 96,49296,492
283,500,553283,500,553 18,00018,000 59,00059,000 28,90428,904 87,90487,904
281,795,813281,795,813 16,00016,000 50,12550,125 28,70028,700 78,82678,826
280,049,656280,049,656 14,00014,000 41,03441,034 28,70028,700 69,73569,735
Scenario Two – Deep Drainage Caps.Scenario Two – Deep Drainage Caps.
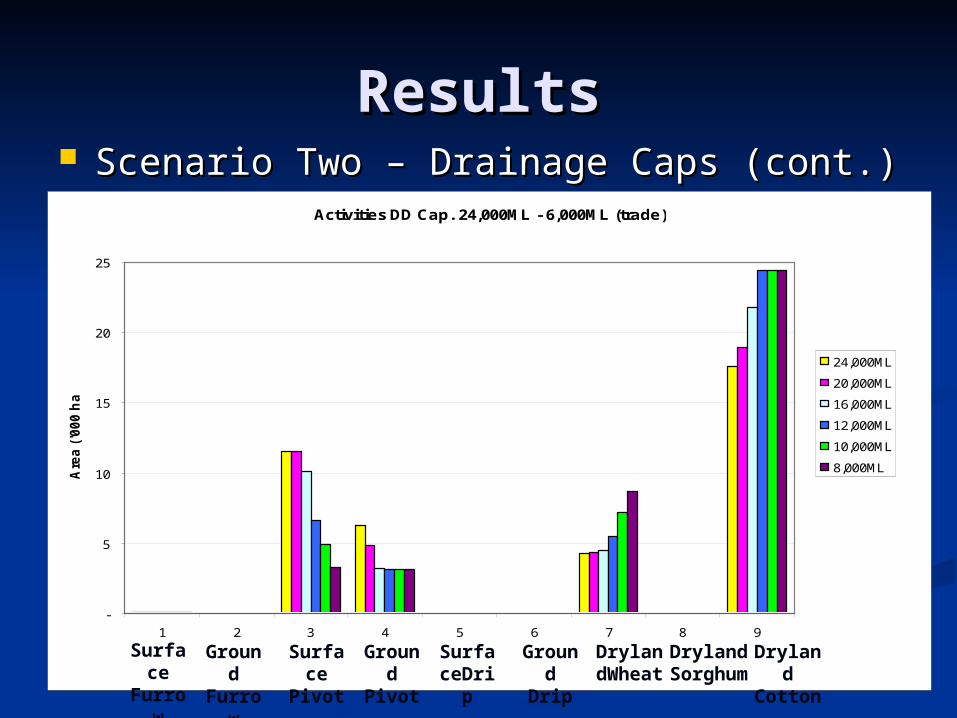
ResultsResults Scenario Two – Drainage Caps (cont.)Scenario Two – Drainage Caps (cont.)
Activities DD Cap. 24,000ML - 6,000ML (trade)
-
5
10
15
20
25
1 2 3 4 5 6 7 8 9
Activity
Are
a (
'000 h
a)
24,000ML
20,000ML
16,000ML
12,000ML
10,000ML
8,000ML
Surface
Furrow
Ground
Furrow
Surface
Pivot
Ground
Pivot
SurfaceDri
p
Ground
Drip
DrylandWhea
t
Dryland
Sorghum
Dryland
Cotton
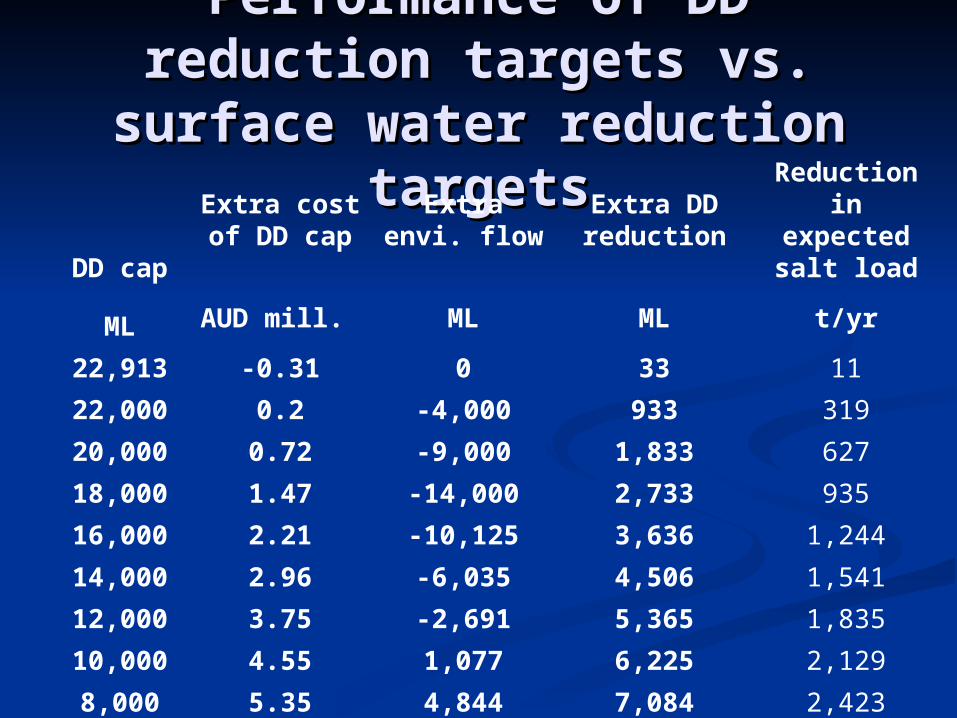
Performance of DD Performance of DD reduction targets vs. reduction targets vs.
surface water reduction surface water reduction targetstargets
DD cap
Extra cost of DD cap
Extra envi. flow
Extra DD reduction
Reduction in expected salt
load
ML AUD mill. ML ML t/yr
22,913 -0.31 0 33 11
22,000 0.2 -4,000 933 319
20,000 0.72 -9,000 1,833 627
18,000 1.47 -14,000 2,733 935
16,000 2.21 -10,125 3,636 1,244
14,000 2.96 -6,035 4,506 1,541
12,000 3.75 -2,691 5,365 1,835
10,000 4.55 1,077 6,225 2,129
8,000 5.35 4,844 7,084 2,423
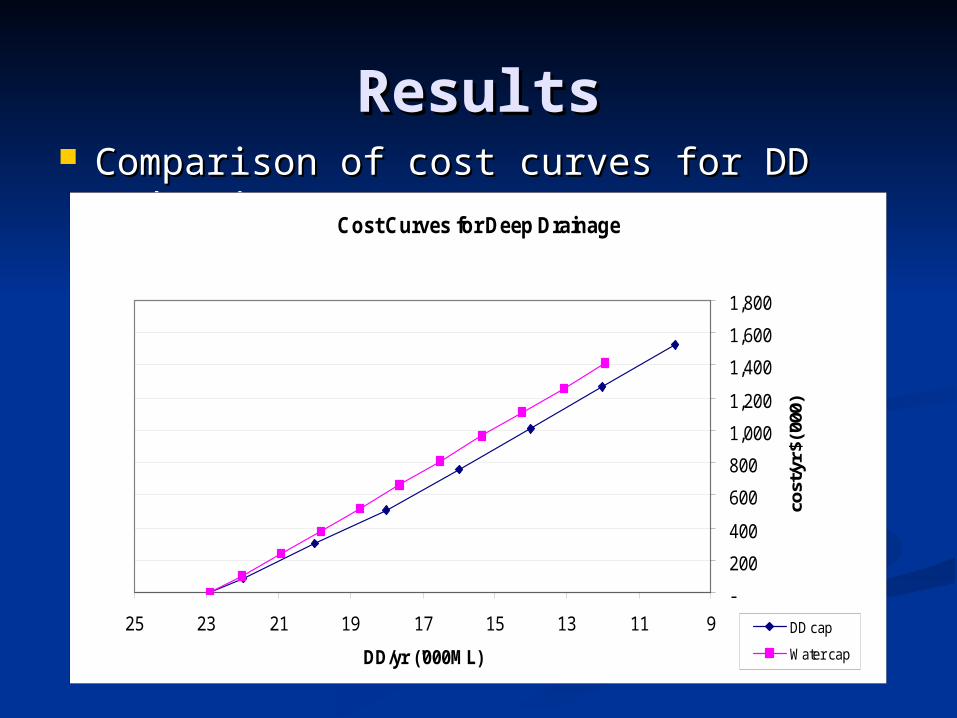
ResultsResults Comparison of cost curves for DD Comparison of cost curves for DD
reductionreduction Cost Curves for Deep Drainage
-
200
400
600
800
1,000
1,200
1,400
1,600
1,800
91113151719212325
DD/yr ('000ML)
cost
/yr $
('000
)
DD cap
Water cap
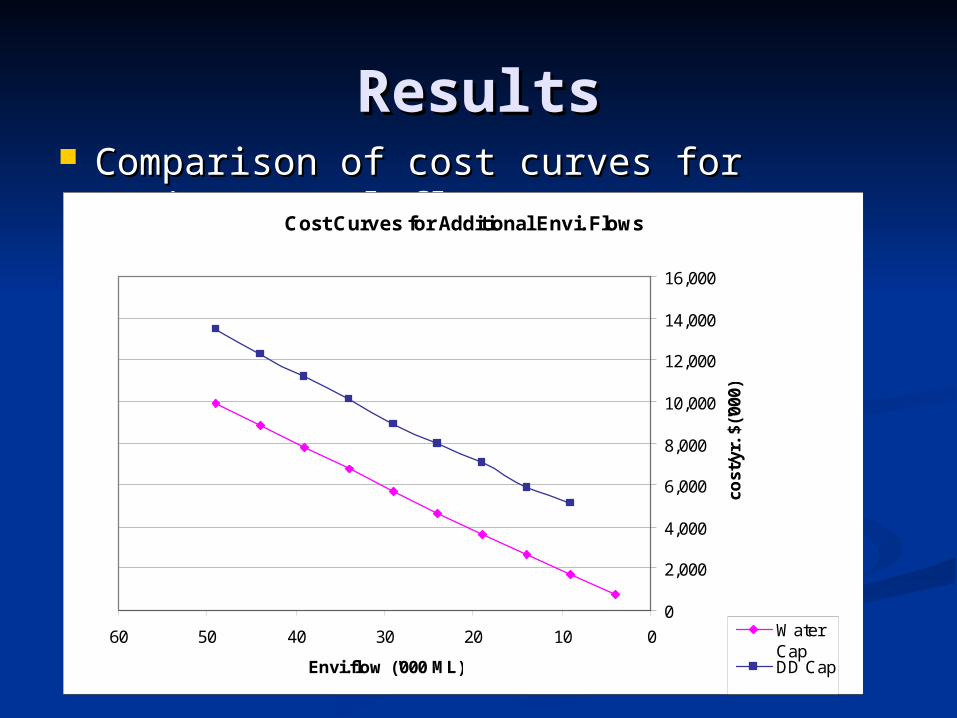
ResultsResults Comparison of cost curves for Comparison of cost curves for
environmental flowsenvironmental flowsCost Curves for Additional Envi. Flows
0
2,000
4,000
6,000
8,000
10,000
12,000
14,000
16,000
0102030405060
Envi.flow ('000 ML)
cost
/yr.
$('0
00)
WaterCapDD Cap
DiscussionDiscussion When there is a reduction of surface water When there is a reduction of surface water
availability, the costs of attaining deep-drainage availability, the costs of attaining deep-drainage reduction without imposing an explicit deep-reduction without imposing an explicit deep-drainage target are very similar to the costs of drainage target are very similar to the costs of attaining deep-drainage reduction when explicit attaining deep-drainage reduction when explicit targets are imposed. targets are imposed.
Reduction of surface water occurs when explicit Reduction of surface water occurs when explicit deep-drainage reduction targets are imposed. deep-drainage reduction targets are imposed. The costs of attaining reduction in surface water The costs of attaining reduction in surface water use are much greater under deep-drainage cap, use are much greater under deep-drainage cap, then under surface water reduction rules.then under surface water reduction rules.
ConclusionConclusion Irrigation induced salinity has been a very Irrigation induced salinity has been a very
serious problem in the Murray-Darling Basin serious problem in the Murray-Darling Basin system in Australia.system in Australia.
Based on past experience with irrigation Based on past experience with irrigation induced salinity, deep-drainage reduction induced salinity, deep-drainage reduction targets have been imposed, or are currently targets have been imposed, or are currently being considered in many catchments in NSW.being considered in many catchments in NSW.
In the circumstances were surface water In the circumstances were surface water availability declines, deep-drainage targets availability declines, deep-drainage targets are not necessary and may impose high cost are not necessary and may impose high cost on irrigators that are already under financial on irrigators that are already under financial stress. stress.