Embed Size (px)
Citation preview

Glasgow Theses Service
http://theses.gla.ac.uk/
Du Beau, Amy (2013) Neurotransmitter phenotypes of descending
systems in the rat lumbar spinal cord. PhD thesis.
http://theses.gla.ac.uk/4721/
Copyright and moral rights for this thesis are retained by the author
A copy can be downloaded for personal non-commercial research or
study, without prior permission or charge
This thesis cannot be reproduced or quoted extensively from without first
obtaining permission in writing from the Author
The content must not be changed in any way or sold commercially in any
format or medium without the formal permission of the Author
When referring to this work, full bibliographic details including the
author, title, awarding institution and date of the thesis must be given

i
Neurotransmitter phenotypes of descending systems in the rat lumbar
spinal cord
Amy Du Beau (BS, MS)
Thesis submitted in fulfilment for the degree of Doctor of Philosophy Institute of Neuroscience and Psychology
College of Medical, Veterinary and Life Sciences
November 2013

ii
Summary
Descending systems from the brain exert a major influence over sensory and motor
processes within the spinal cord. Although many descending systems are known to
have an excitatory effect on spinal interneurons, there is a paucity of knowledge
regarding their neurotransmitter phenotypes. Each descending pathway has
distinctive anatomical, neurochemical and physical attributes which contribute to
the selection and execution of appropriately adaptive motor patterns.
The overarching aims of this study were (1) to determine the neurotransmitter
phenotypes of axons descending from the reticular formation, specifically the
medial longitudinal fasciculus (MLF) and the caudal ventral lateral medulla (CVLM),
and the corticospinal tract (CST) within lower lumbar segments of the rat spinal
cord, (2) to investigate the neuronal targets of these systems, and (3) to classify
these neurons according to their morphological and geometric properties within
laminar boundaries.
Descending pathways of adult rats were anterogradely labelled using the b-subunit
of cholera toxin (CTb) injected into the MLF and CVLM to label medullary axons
and into the sensorimotor cortex to label CST axons. Spinal cord sections
containing labelled axons were immunoreacted with various antibody
combinations. Immunofluorescent tissues were examined with confocal
microscopy in the transverse, parasagittal and horizontal planes. To investigate
the targets of these descending systems, labelled sections were reacted with
antibody against choline acetyltransferase (ChAT) and immunoreactive
interneurons were reconstructed in three dimensions.
A series of complimentary immunoreactions revealed that the volumetric densities
of descending medullary axons contained a heterogeneous combination of
transmitters and that the phenotypes and proportions of transmitters used by the
MLF and CVLM do not differ significantly. The majority of medullary axons were
excitatory, expressing vesicular glutamate transporter 2 (VGLUT2), with fewer
axons expressing glycine or γ-aminobutyric acid (GABA). A small population
iii
expressed both of these inhibitory amino acids. A portion of these medullary
axonal populations were not immunoreactive to the tested antibodies and were
not serotonergic. CST axons were homogeneously glutamatergic, expressing
vesicular glutamate transporter 1 (VGLUT1).
Contact densities of ChAT interneurons revealed that the dorsal horn received
more input from the CST than partition cells populating the intermediate zone
(laminae VI/VII) and central canal cells (lamina X), but all targeted cell
populations were richly innervated by VGLUT1. Dendrites that were orientated
dorsally relative to their soma were observed to have a greater density of
combined inputs from the CST and VGLUT1. Findings suggest that ChAT
interneurons in lamina III were activated by cutaneous primary afferents, which
are known to be involved in presynaptic inhibition. The CST may act through these
defined populations of ChAT interneurons to influence the processing of incoming
sensory information.
Excitatory and inhibitory medullary axons descending from the CVLM were found to
target ChAT interneurons and populations were classified according to their
dendritic orientation in the transverse plane as either mediolateral or
dorsoventral. In lamina X, cells orientated dorsoventrally received significantly
greater excitatory CVLM input than those situated more dorsally whereas
mediolaterally orientated cells received significantly greater inhibitory CVLM input
than partition cells, located in the laminae VI/VII region. The CVLM pathway is
likely to sculpt motor activity using both excitatory and inhibitory transmitters via
morphologically and geometrically defined populations of ChAT interneurons.
Axons descending from the MLF were found to target ChAT interneurons. In the
intermediate regions of laminae VI/VII and lamina X, the majority of ChAT
interneurons were immunoreactive to neuronal nitric oxide synthase (nNOS),
designated as ChAT::nNOS interneurons. Interneurons targeted by the MLF were
contacted by serotonin (5-HT) containing terminals and these cells also received
contacts from axons immunoreactive to dopamine β-hydroxylase (DBH), an enzyme
that converts dopamine (DA) to noradrenalin (NA). The contact densities of
partition cells were compared to central canal cells and inputs from 5-HT and MLF

iv
axons were similar. However, the ChAT::nNOS population received comparably
greater modulation from 5-HT not contained within descending MLF axons. ChAT
partition cells that do not contain nNOS are considered to be the likely source of
central boutons (C boutons) onto motoneurons in the ventral horn. Although some
descending systems can directly affect motoneurons, most of their actions are
mediated via interneurons and properties of these populations have been further
elucidated by findings from this study.
v
Table of contents
Summary…………………………………………………………………………………………………… ...... ii
List of Figures………………………………………………………………………………………… ...... viii
List of tables…………………………………………………………………………………………… ....... xi
Acknowledgement…………………………………………………………………………………. ...... xiii
Author's Declaration…………………………………………………………….………….…….……..xiv
Abbreviations……………………………………..……………………………………………………….….xv
1 Chapter 1. General introduction .................................................. 18
1.1 Descending pathways of the mammalian spinal cord ......................... 19
1.2 Spinal cord organisation .......................................................... 19
1.3 Characterising descending pathways ............................................ 20
1.3.1 Corticospinal tract ............................................................ 22
1.3.2 Reticulospinal tracts .......................................................... 23
1.3.3 Other descending systems ................................................... 25
1.4 Axonal pathfinding ................................................................. 26
1.5 Neurotransmission at the synapse ............................................... 27
1.6 Neuroreceptors and neurotransmitters of spinal neurons ................... 32
1.6.1 Glutamate ...................................................................... 32
1.6.2 Glycine and GABA ............................................................. 33
1.6.3 Monoamines .................................................................... 35
1.7 Neuronal specification in sensorimotor systems .............................. 37
1.7.1 Group Ia, Ib and II interneurons ............................................ 38
1.7.2 Commissural interneurons ................................................... 42
1.7.3 ChAT interneurons ............................................................ 42
1.8 Neural Networks ................................................................... 44
1.9 Physical properties of spinal neurons ........................................... 45
1.10 Scope of this research and overarching aims ................................ 46
2 Chapter 2. General experimental methods ...................................... 47
2.1 Surgical procedures and anaesthesia ........................................... 48
2.2 Perfusion, dissection and tissue preparation for immunocytochemistry .. 53
2.3 Identification of injection sites .................................................. 54
2.4 Orientation of immunofluorescent spinal cord tissue ........................ 55
2.5 Antibody characterisation ........................................................ 57
2.6 Image acquisition and confocal microscopy ................................... 58
2.7 Tissue allocation for experiments…………………………………………………….………..60

vi
2.8 Statistical analyses ................................................................ 65
3 Chapter 3. Neurotransmitter phenotypes of medullary axonal projections within lower lumbar spinal segments ................................................... 67
3.1 Introduction ........................................................................ 68
3.2 Methods ............................................................................. 70
3.2.1 Image acquisition ............................................................. 70
3.2.2 Derivation of laminar volume ............................................... 70
3.2.3 Statistical Analysis ............................................................ 73
3.3 Results ............................................................................... 75
3.3.1 Aim 1: To determine the distribution of medullary axons projecting to lower lumbar spinal cord segments. ................................................. 75
3.3.2 Aim 2: To determine the neurotransmitter phenotypes of axon terminals descending from the MLF and CVLM within lower lumbar spinal cord segments ................................................................................. 81
3.3.3 Aim 3: To determine the neurotransmitter phenotypes of inhibitory axon terminals from the MLF and the CVLM within lower lumbar spinal cord segments ................................................................................. 90
3.3.4 Aim 4: To determine if medullary axons projecting to lower lumbar spinal cord segments contain serotonin ............................................. 98
3.4 Discussion .......................................................................... 101
3.4.1 Qualitative summary ........................................................ 101
3.4.2 Labelling of descending systems ........................................... 102
3.4.3 Identification of neurotransmitter phenotypes .......................... 102
4 Chapter 4. Axon terminals descending from the sensorimotor cortex and their neuronal targets in lower lumbar spinal cord segments .................... 105
4.1 Introduction ....................................................................... 106
4.2 Methods ............................................................................ 109
4.2.1 Image acquisition and analyses ............................................ 109
4.2.2 Laminar boundaries in the parasagittal plane ........................... 112
4.2.3 Stereological techniques to examine neuronal targets ................. 115
4.3 Results .............................................................................. 119
4.3.1 Aim 1: To determine the distribution of axon terminals descending from the sensorimotor cortex within lower lumbar spinal cord segments .... 119
4.3.2 Aim 2. To identify the neurotransmitter phenotype of CST axons in lower lumbar segments ............................................................... 123
4.3.3 Aim 3: To investigate immunoreactive contacts onto ChAT interneurons receiving input from the CST across laminar boundaries ........................ 125
4.3.4 Aim 4: Classification of ChAT dendritic orientations as related to their contact densities ...................................................................... 132
4.4 Discussion .......................................................................... 136
vii
4.4.1 Distribution of excitatory descending sensorimotor axons ............ 136
4.4.2 Neuronal targets of descending sensorimotor axon terminals ........ 137
4.4.3 Stereologically classified interneuronal populations ................... 139
5 Chapter 5. Targets of the descending reticulospinal pathways ............ 141
5.1 Introduction ....................................................................... 142
5.2 Methods ............................................................................ 145
5.2.1 Image acquisition and analyses ............................................ 145
5.2.2 Laminar boundaries in the horizontal plane ............................. 146
5.3 Results .............................................................................. 150
5.3.1 Aim 1: To identify the neurochemical content of contacts onto ChAT interneurons from descending CVLM axons across laminar boundaries in the transverse plane ....................................................................... 150
5.3.2 Aim 2: To investigate neuromodulation of intermediate zone interneurons innervated by the MLF in the horizontal plane ................... 157
5.3.3 Aim 3: To determine the relationship of ChAT::nNOS interneurons in laminae VI, VII and X .................................................................. 164
5.3.4 Aim 4: To qualitatively compare ChAT interneurons in naïve rat tissue receiving modulatory input from monoamines in the parasagittal plane ..... 168
5.4 Discussion .......................................................................... 173
5.4.1 Excitatory and inhibitory CVLM inputs onto ChAT interneurons across laminar boundaries .................................................................... 173
5.4.2 Serotonergic inputs onto interneurons in laminae VI, VII and X innervated by the MLF ................................................................ 175
5.4.3 The relationship of ChAT::nNOS interneurons in laminae VI, VII and X with 5-HT ............................................................................... 176
5.4.4 Qualitative comparison of ChAT interneurons in naïve rat tissue receiving modulatory input from monoamines .................................... 177
6 Concluding Remarks ................................................................. 179
Appendices for Chapter 1 .................................................................. 185
Appendices for Chapter 2 .................................................................. 188
Appendices for Chapter 3 .................................................................. 190
Appendices for Chapter 4 .................................................................. 194
Appendices for Chapter 5 .................................................................. 203
List of references………………….……………………………………………………………………………..213 Publication .................................................................................. 241

viii
List of Figures
Figure 1.1 Neurotransmitter synthesis and release at the synapse .................. 31
Figure 1.2 General schematic of recurrent inhibition ................................. 41
Figure 2.1 Injection sites for the descending systems in the sagittal plane ....... 49
Figure 2.2 The stereotaxic frame ......................................................... 51
Figure 2.3 Bregma, lambda and the sagittal sutures of the rat skull ............... 52
Figure 2.4 Anterograde transport of CTb labelling terminals in a lower lumbar segment ....................................................................................... 55
Figure 2.5 Three-dimensional spinal cord block in transverse, parasagittal and horizontal spatial planes .................................................................... 56
Figure 2.6 Confocal microscope instrument schematic ............................... 61
Figure 2.7 Sequential immunoreaction diagram ........................................ 63
Figure 2.8 Diagram of general image acquisition and data collection methods ... 64
Figure 2.9 Normal probability plot ....................................................... 66
Figure 3.1 Conceptual model of bilateral laminar regions containing CTb terminals.................................................................................. .....72
Figure 3.2 Derivation of laminar volume using hexagons........................ ......73
Figure 3.3 Brain reconstructions for MLF and CVLM injection sites...................77
Figure 3.4 Distributon of labelled terminals from the MLF............................78
Figure 3.5 Distribution of labelled terminals from the CVLM..........................79
Figure 3.6 Immunochemistry of MLF terminals..........................................84
Figure 3.7 Immunochemistry of CVLM terminals.........................................85
Figure 3.8 Example of an a priori histogram plot......................................86
Figure 3.9 Volumetric density comparison of MLF and CVLM terminal transmitter content..........................................................................................87
Figure 3.10 Laminar densities of excitatory and inhibitory medullary axon terminals........................................................................................89
Figure 3.11 Immunochemistry of inhibitory axons.......................................92
ix
Figure 3.12 Scatter plot comparison of glycine and GABA volumetric densities from MLF and CVLM axonal populations..........................................................93
Figure 3.13 Transverse medial and lateral regions......................................94
Figure 3.14 Volumetric densities of glycinergic axons from the MLF and CVLM across laminae.................................................................................95
Figure 3.15 Volumetric densities of GABAergic axons from the MLF and CVLM across laminae.................................................................................96
Figure 3.16 Volumetric densities of axons from the MLF and CVLM containing both inhibitory amino acids across laminae.....................................................97
Figure 3.17 Immunofluorescent axons from the MLF and serotonin..................99
Figure 3.18 Immunofluorescent axons from the CVLM and serotonin...............100
Figure 3.19 Qualitative summary of medullary axon neurochemicals..............101
Figure 4.1 ChAT interneuron conceptually visualised in spinal cord grey matter 111
Figure 4.2 Laminar boundary maps in the parasagittal plane ....................... 114
Figure 4.3 Derivation of XY Ratios ....................................................... 116
Figure 4.4 Dendritic orientation in the parasagittal plane .......................... 117
Figure 4.5 Brain reconstruction for CST injection site ............................... 120
Figure 4.6 Distribution of labelled terminals from the CST .......................... 121
Figure 4.7 ChAT neurons revealed in an L4 transverse and parasagittal section . 122
Figure 4.8 Immunoreactive CST axon terminals ....................................... 124
Figure 4.9 Descending CST inputs onto ChAT interneuron in the transverse plane ................................................................................................ 126
Figure 4.10 Neuronal densities of ChAT interneurons receiving CST input across transverse laminar boundaries ............................................................ 127
Figure 4.11 ChAT interneuron in laminae III / IV of an L4 spinal segment in the parasagittal plane .......................................................................... 130
Figure 4.12 Neuronal densities of ChAT interneurons receiving CST input across parasagittal laminar boundaries .......................................................... 131
Figure 4.13 Dendritic orientations of reconstructed ChAT interneurons in the parasagittal plane, Part I (Dorsal) ........................................................ 133
Figure 4.14 Dendritic orientations of reconstructed ChAT interneurons in the parasagittal plane, Part II (Ventral) ...................................................... 134
x
Figure 4.15 Dendritic orientations relative to total contact density in the parasagittal plane .......................................................................... 135
Figure 5.1 Laminar boundaries in the horizontal plane .............................. 148
Figure 5.2 ChAT interneuron in lamina VII receiving excitatory CVLM input ...... 152
Figure 5.3 ChAT soma receiving inhibitory CVLM input .............................. 153
Figure 5.4 Neuronal densities of morphologically defined ChAT interneurons receiving CVLM boutons containing VGLUT2 across transverse laminar boundaries ................................................................................................ 154
Figure 5.5 Neuronal densities of morphologically defined ChAT interneurons receiving CVLM boutons containing VGAT across transverse laminar boundaries . 155
Figure 5.6 Dendritic densities of ChAT interneurons classified according to distance of immunoreactive CVLM boutons from soma ............................... 156
Figure 5.7 ChAT::nNOS interneuron receiving input from the MLF and 5-HT ..... 159
Figure 5.8 Reconstructed ChAT interneuron receiving input from the MLF and 5-HT ................................................................................................ 160
Figure 5.9 Density comparison nNOS::ChAT interneurons receiving input from the MLF and 5-HT ................................................................................ 161
Figure 5.10 Relationship of ChAT and ChAT::nNOS interneuronal populations receiving input from the MLF and 5-HT across intermediate laminar boundaries in the horizontal plane ........................................................................ 162
Figure 5.11 Bilateral comparison of densities of interneurons targeted by 5-HT and descending MLF axons ...................................................................... 163
Figure 5.12 Relationship of ChAT::nNOS immunoreactive interneurons in the intermediate zone with 5-HT ............................................................. 166
Figure 5.13 The relationship of ChAT, nNOS and ChAT::nNOS expressing interneurons in laminae VI - VII and X ................................................... 167
Figure 5.14 Neuromodulation of ChAT interneurons .................................. 169
Figure 5.15 ChAT interneurons neuromodulated by 5-HT and NA near the central canal .......................................................................................... 171
Figure 5.16 Density comparison of ChAT interneurons in the parasagittal plane receiving modulatory input from monoamines ......................................... 172
xi
.
List of tables
Table 1.1 Characterisitcs of descending pathways......................................21
Table 2.1 Stereotaxic coordinates for the descending systems.......................49
Table 3.1 Summary of primary and secondary antibody combinations and concentrations.................................................................................74 Table 3.2 Laminar volumes for L3, L4 and L5 lumbar spinal segments..............80 Table 4.1 Summary of primary and secondary antibody combination and concentrations .............................................................................. 118
Table 5.1 Summary of primary and secondary antibody combinations and concentration ............................................................................... 149
Appendices 1
Figure 1 Brain reconstructions for all MLF brain injection sites..............185
Figure 2 Brain reconstructions for all CVLM brain injection sites...........186
Figure 3 Brain reconstructions for all sensorimotor cortex brain injection
sites....................................................................................187
Appendices 2
Table 1 Laboratory reagents.......................................................188
Table 2 Primary antibody characterisation......................................189
Table 3 Allocation of processed spinal cord tissue containing
anterograde labelled axons (and naïve tissue) for all experiments…………..190
Appendices 3
Table 1 Glutamatergic axon terminals from the MLF and CVLM..............191
Table 2 Excitatory and inhibitory axon terminals from the MLF and CVLM.192
Table 3 Inhibitory axon terminals from the MLF and CVLM...................193
Appendices 4
Table 1 CST axon terminals immunoreacted with antibodies against VGLUT1
and VGLUT2...........................................................................194
Table 2 CST axon terminals immunoreacted with antibodies against VGLUT1,
VGLUT2 and VGAT...................................................................195
Table 3 Immunoreactive boutons onto laminae I-V ChAT interneurons
targeted by the CST in the transverse plane....................................196

xii
Table 4 Immunoreactive boutons onto laminae VI-VII ChAT interneurons
targeted by the CST in the transverse plane....................................197
Table 5 Immunoreactive boutons onto laminae X ChAT interneurons targeted
by the CST in the transverse plane...............................................198
Table 6 Immunoreactive boutons onto laminae I-V ChAT interneurons
targeted by the CST in the parasagittal plane..................................199
Table 7 Immunoreactive boutons onto laminae VI-VII ChAT interneurons
targeted by the CST in the parasagittal plane..................................200
Table 8 Immunoreactive boutons onto laminae X ChAT interneurons targeted
by the CST in the parasagittal plane..............................................201
Table 9 Densities of ChAT dorsoventral and rostrocaudal interneurons
related to dendritic orientations..................................................202
Appendices 5
Table 1 Glutamatergic contacts onto laminae III-V ChAT interneurons
targeted by the CVLM in the transverse plane..................................203
Table 2 Glutamatergic contacts onto laminae VI-VII ChAT interneurons
targeted by the CVLM in the transverse plane..................................204
Table 3 Glutamatergic contacts onto laminae X ChAT interneurons targeted
by the CVLM in the transverse plane.............................................205
Table 4 Inhibitory contacts onto laminae III-V ChAT interneurons targeted by
the CVLM in the transverse plane.................................................206
Table 5 Inhibitory contacts onto laminae VI-VII ChAT interneurons targeted
by the CVLM in the transverse plane.............................................207
Table 6 Inhibitory contacts onto laminae X ChAT interneurons targeted by
the CVLM in the transverse plane.................................................208
Table 7 Laminae VI-VII ChAT interneurons targeted by the MLF and 5-HT in
the horizontal plane.................................................................209
Table 8 Laminae X ChAT interneurons targeted by the MLF and 5-HT in the
horizontal plane......................................................................210
Table 9 The relationship of ChAT, nNOS and ChAT::nNOS interneurons in
laminae VI, VII and X in the transverse plane...................................211
Table 10 Monoaminergic contacts onto ChAT interneurons in laminae VI, VII
and X in the parasagittal plane....................................................212

xiii
Acknowledgement
Many thanks to those within the Spinal Cord Group for all your contributions. To
Drs. Anne Bannatyne and Erika Polgár for being so kind and offering practical
advice, delivered with understanding plus a sense of humour. Thanks to Robert
Kerr and Christine Watt for all you do and much more. And to Professor Andrew
Todd. Thanks to Andrew Toft for always listening to my zany ideas and sharing
your own. Thanks to Leanne and Debbie for being extra helpful. Thanks to
Professor David Maxwell for supervising this project.
Thanks to Dr. David Simmons and all those within the “psychology side” of our
Institute of Neuroscience and Psychology for always including me. Amber, for
mulling it over with coffee even on the rainiest days.
Thanks to my former professor, my friend and confidante, Dr. Rudy Candler for
being the best “old timey” Alaskan chemist, for your encouragement and because
you let me lead. Thanks to my Aunt Mozelle, Catherine and Pierre for your
continual support. For Fran, for never forgetting. Thank you Birch, because you
are my friend.

xiv
Author’s declaration
I declare that this thesis has been written by me and that the work presented in
this thesis is my own. Professor David Maxwell contributed to this work by
performing surgical procedures in rats with my assistance. I confirm that this
thesis has not been submitted in any previous application for a higher degree.
Amy Du Beau Date

xv
Abbreviations
Prefixes:
α anti
Δ change in
n 10-9 nano
µ 10-3 micro
m 10-2 milli
12 cerebellar lobule 12
4V 4th ventricle
5-HT serotonin (5-hydroxytryptamine)
ACh acetylcholine
Alexa 488 Alexa-fluor 488
Amb ambiguus nucleus
AMPA α-amino-3-hydroxy-5-methyl-4-isoxazolepropionic acid
ANOVA analysis of variance
AP anterior-posterior
ATP adenosine triphosphate
Ave. average
AvPB avidin Pacific Blue
C caudal
C Celsius (degrees)
C boutons central boutons
cc central canal
Cg2 cingulate cortex 2
ChAT choline acetyltransferase; cholinergic
CIN commissural interneuron
CNS central nervous system
contra contralateral
CPu caudate putamen, striatum
CPG central pattern generator
CS corticospinal
CST corticospinal tract
CTb b-subunit of cholera toxin
CVLM caudal ventral lateral medulla
Cy5 Cyanine 5
D dorsal
D1, D2 dopaminergic receptors
DA dopamine
DAB 3, 3’-diaminobenzidine

xvi
DBH dopamine β-hydroxylase
DV dorsoventral
Dyl 649 Dylight 649
e Euler’s number (≈ 2.72)
EtOH ethanol
g grams
g.pig guinea pig
GABA γ-aminobutyric acid
GAD65, 67 glutamic acid decarboxylase isoform 65, 67
Gi granular insular cortex
GlyT2 glycine transporter 2
gt. goat
H+-ATPase H+-adenosine triphosphate
HRP horseradish peroxidase
Ia I IN Ia inhibitory interneuron
ICC immunocytochemistry
IgG immunoglobin
IOBe inferior olive beta subnucleus
ip intraperitoneal
ipsi ipsilateral
kDa kilodalton
L lateral
L litre
L3, L4, L5 lumbar spinal segment(s) 3, 4, 5
log logarithmic, base 10
LRtS5 lateral reticular nucleus, subtrigeminal part
LV lateral ventricle
m metre
M molar = moles (or mol) per litre
M1 primary motor cortex
M2 secondary motor cortex
ML mediolateral
MLF medial longitudinal fasciculus
MN motoneuron
mo. mouse
mRNA messenger ribonucleic acid
NA noradrenaline
NADPH nicotinamide adenine dinucleotide phosphate
NMDA N-methyl-D-aspartate
nNOS neuronal nitric oxide synthase
No. number
NOS nitric oxide synthase
PB phosphate buffer

xvii
PBS phosphate buffer saline
PBST phosphate buffer saline plus Triton X-100 ©
PCRt parvicellular reticular nucleus
PMn paramedian reticular nucleus
PMT photomultiplier
psi pound-force per square inch absolute
py pyramidal tract
r radius or radii
R rostral
rbt. rabbit
RC Renshaw cell
REM rapid-eye movement
RetS reticulospinal
RetST reticulospinal tract
Rh Red rhodamine red
Ro raphé obscurus
ROb raphé obscurus nucleus
rs Spearman correlation test
SD standard deviation
Sp5I spinal trigeminal nucleus, interpolar part
UV vis ultra-violet visible
V0,1,2,3 embryonic interneurons
V ventral
V volt
VGAT vesicular GABA transporter
VGLUT vesicular glutamate transporter (VGLUT1, 2 ,3)
vhc ventral hippocampal commissure
VIAAT vesicular inhibitory amino acid transporter
VST vestibulospinal tract
wm white matter
ΔpH chemical gradient
ΔΨ electrical gradient
γ gamma
λ wavelength (nanometre)
π pi (≈ 3.14)

1 Chapter 1. General introduction

19
1.1 Descending pathways of the mammalian spinal cord
Descending pathways are differentially involved in motor processes resulting
from mechanisms involving the entire motor network rather than the brain
commanding the spinal cord. Each descending pathway has distinctive
neurochemical, anatomical and functional features. Since the advent of
anterograde labelling techniques, these pathways can be traced. The aim of this
chapter is to introduce a contextual common denominator by highlighting
prominent literature reporting all aspects of the corticospinal and reticulospinal
tracts terminating in the lower lumbar rat spinal cord. Because the spinal cord
is highly conserved evolutionarily, the rat model may translate to
phylogenetically higher vertebrates. Topics in this chapter include organisation
of select descending systems, connectivity of neurons, neurotransmission at
molecular and cellular levels, neuronal specification and geometry.
1.2 Spinal cord organisation
The spinal cord is a tubular bundle of tissue extending from the brain that acts
as a conduit for electrochemical signals that drive motor circuits. Transverse
sections are comprised of the peripheral white matter tracts and the central
grey matter containing neurons. The posterior median sulcus is the groove
located dorsally and the anterior median fissure is ventral groove such that the
cord assumes an elliptical shape. Three meninges cover the spinal cord: the
outer dura mater, the arachnoid mater, and the inner pia mater. The
subarachnoid space between the arachnoid and delicate pia mater is filled with
cerebrospinal fluid. Sixty years ago, Bror Rexed identified anatomically distinct
areas corresponding to horizontally stacked layers to classify cat spinal laminae
based upon cytoarchitectonic features and this scheme was later adapted to
others species including the rat (Molander et al., 1984).

20
1.3 Characterising descending pathways
Mammalian motor pathways incorporate many different phylogenetically
conserved descending systems and others which may have appeared later in
evolution. In order to investigate descending pathways, their key characteristics
must be defined. Signature features such as their origin in the brain, pattern of
terminations, neurochemical properties and neuronal targets within the spinal
cord are recognised (Table 1.1). As of yet, these key characteristics have not
been fully elucidated for any major descending pathway. Adaptively appropriate
motor movements are recruited and instantiated neurons must integrate
information from descending pathways by tempering sensory and segmental
inputs (Lemon, 2008). Mechanisms controlling features such as firing thresholds
and synaptic gain may play major roles in integrating motor responses (Hultborn
et al., 2004). An important consideration when investigating descending systems
is that any single neuroanatomical pathway can mediate multiple functions
(Lemon, 2008).

21
Characteristic Specification
Origin Location of neurons of origin in the brain of the given descending pathway
Synaptic input Nature of the major inputs to these neurons of origin
Fibre number and size/length
Numbers and lengths of descending fibres and distribution of fibre diameters along the pathway
Course Trajectory followed by fibres belonging to the pathway
Target/terminations Location and type of interneurons or motoneurons receiving terminations from the pathway as defined by both level within the spinal cord and laminae within the grey matter
Collaterals Other supraspinal targets innervated by axon collaterals from the same pathway
Molecular identity Characteristic surface and other molecules important for axonal pathfinding
Transmitter(s) and neuromodulators
Transmitters employed at synaptic and presynaptic targets of the descending pathway
Transmission Timing, patterns and type of activity exhibited by neurons contributing to pathway
Lesion/inactivation Behavioural effects resulting from damaged descending pathway
Table 1.1 Characteristics of descending pathways
Key features of any given descending pathway are specified (adapted from Lemon, 2008).

22
1.3.1 Corticospinal tract
The only input to the spinal cord originating above the brainstem is from the
cerebral cortex. The mammalian CST represents the longest and most direct
pathway by which the cerebral cortex affects spinal activity (Armand, 1982,
Miller, 1987). The CST makes a substantial contribution to volitional movements
and precisely controlled coordinated actions, such as fractionated movements of
the digits (Curfs et al., 1996, Lawrence and Hopkins, 1976, Lawrence and
Kuypers, 1968, Liang et al., 1991). Goal-directed limb movements are
controlled mostly by the CST and also rubrospinal pathways, with the latter
originating from the magnocellular division of the red nucleus (Kuypers, 1981).
In rats, the neurons of origin of the CST are located principally in motor and
somatosensory cortices (Donoghue and Wise, 1982, Hicks and D'Amato, 1977,
Leong, 1983, Wise and Jones, 1977) and this organisation is highly conserved in
vertebrates. Corticospinal (CS) fibres descend through the internal capsule and
enter the midbrain to the cerebral peduncles. Descending cortical fibres
disperse into smaller bundles in the pons. Cortical fibres descending to the
medulla congregate into discreet triangular bundles known as the pyramidal
tract. Most CS fibres decussate at the level of the spinomedullary junction,
entering the lateral white matter of the spinal cord, which accounts for why one
side of the body is controlled by the opposite side of the brain. CS axons were
found to directly project contralaterally to laminae I and II (Casale et al., 1988,
Liang et al., 1991) and ramify in laminae III – VII with few projections found in
the ventral horn (Antal, 1984, Brown, 1971, Casale et al., 1988, Liang et al.,
1991). The highest density of ipsilateral CS fibres is in the region of lamina VIII
and medial lamina VII, both in cervical and lumbar segments (Jankowska and
Edgley, 2006). Although these ipsilateral ramifications are rare, they do exist
(Kuypers and Brinkman, 1970, Nyberg-Hansen, 1966) and these ipsilateral CS
terminations are a viable source of axonal sprouting which are postulated to
enhance recovery of contralaterally projecting neurons after injury (Dum and
Strick, 1996).
Electrophysiological techniques have demonstrated that coordinated movements
of forelimbs and digits in rats are directly attributed to strong cortico-
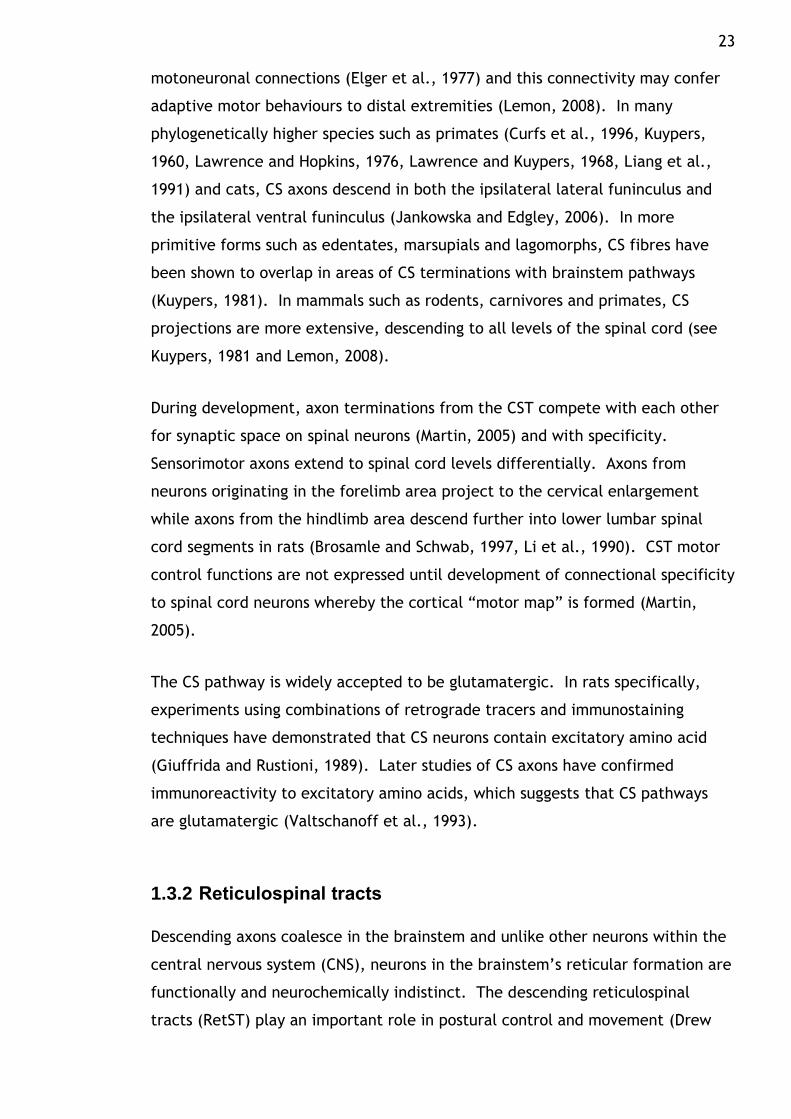
23 motoneuronal connections (Elger et al., 1977) and this connectivity may confer
adaptive motor behaviours to distal extremities (Lemon, 2008). In many
phylogenetically higher species such as primates (Curfs et al., 1996, Kuypers,
1960, Lawrence and Hopkins, 1976, Lawrence and Kuypers, 1968, Liang et al.,
1991) and cats, CS axons descend in both the ipsilateral lateral funinculus and
the ipsilateral ventral funinculus (Jankowska and Edgley, 2006). In more
primitive forms such as edentates, marsupials and lagomorphs, CS fibres have
been shown to overlap in areas of CS terminations with brainstem pathways
(Kuypers, 1981). In mammals such as rodents, carnivores and primates, CS
projections are more extensive, descending to all levels of the spinal cord (see
Kuypers, 1981 and Lemon, 2008).
During development, axon terminations from the CST compete with each other
for synaptic space on spinal neurons (Martin, 2005) and with specificity.
Sensorimotor axons extend to spinal cord levels differentially. Axons from
neurons originating in the forelimb area project to the cervical enlargement
while axons from the hindlimb area descend further into lower lumbar spinal
cord segments in rats (Brosamle and Schwab, 1997, Li et al., 1990). CST motor
control functions are not expressed until development of connectional specificity
to spinal cord neurons whereby the cortical “motor map” is formed (Martin,
2005).
The CS pathway is widely accepted to be glutamatergic. In rats specifically,
experiments using combinations of retrograde tracers and immunostaining
techniques have demonstrated that CS neurons contain excitatory amino acid
(Giuffrida and Rustioni, 1989). Later studies of CS axons have confirmed
immunoreactivity to excitatory amino acids, which suggests that CS pathways
are glutamatergic (Valtschanoff et al., 1993).
1.3.2 Reticulospinal tracts
Descending axons coalesce in the brainstem and unlike other neurons within the
central nervous system (CNS), neurons in the brainstem’s reticular formation are
functionally and neurochemically indistinct. The descending reticulospinal
tracts (RetST) play an important role in postural control and movement (Drew
24 and Rossignol, 1990a, Drew and Rossignol, 1990b, Grillner and Dubuc, 1988,
Peterson et al., 1978). Neurons in the pontomedullary reticular formation are
known to control posture and stability during reaching and walking in cats
(Prentice and Drew, 2001, Schepens and Drew, 2004). Medullary axons
projecting to lumbar segments were found to use a combination of excitatory
and inhibitory transmitters and act directly on contralateral motoneurons, or
indirectly via interneurons found outside motor nuclei (Bannatyne et al., 2003).
The RetST arises in the medial medulla and descends into the dorsolateral
funinculus of the cord (Holmqvist and Lundberg, 1959, Holmqvist and Lundberg,
1961) with bilateral ramifications. This terminal distribution pattern may be
similar at each spinal segmental level (Matsuyama et al., 1999) as demonstrated
by anterograde tracing studies in cat. Retrograde tracer transport studies have
shown that the medial pontomedullary reticular formation projects to the entire
length of the spinal cord in the cat (Hayes and Rustioni, 1981, Tohyama et al.,
1979), the opossum (Martin et al., 1979) and monkey (Coulter et al., 1979,
Kneisley et al., 1978).
Neurons projecting from the reticular formation descend through or adjacent to
the medial longitudinal fasciculus (MLF), further extending to the spinal
ventromedial funinculus to ultimately ramify in laminae VI - IX at all segmental
levels of the cord (Nyberg-Hansen, 1965, Petras, 1967a). Collateral fibres of
these neurons are bilaterally distributed with ramifications in laminae VI-VIII and
X at all levels of the cord (Holstege and Kuypers, 1982, Martin et al., 1979). The
medial RetST arises from neurons in the pons and gigantocellular reticular nuclei
(Ito et al., 1970, Peterson et al., 1975). Bilateral pathways in the ventral and
ventrolateral funiculi arise from the nucleus reticularis gigantocellularis
(Basbaum et al., 1978). Findings from retrograde tracing studies in rat suggest
that neurons originating from gigantocellular reticular nuclei are commissural
and project to cervical, thoracic and lumbar segments (Reed et al., 2008).
However, most projections from the gigantocellular reticular nucleus are
principally ipsilateral (Sakai et al., 2009, Tohyama et al., 1979). Stimulation of
the gigantocellular nucleus activates axial musculature and this synaptic
connectivity is proposed to be excitatory (Robbins et al., 1992) and a proportion
25 of fibres from the gigantocellular complex can be either serotonergic or
peptidergic (Bowker et al., 1981a, Bowker et al., 1982).
The caudal ventral lateral medulla (CVLM) plays a major role in autonomic
regulation. Some CVLM neurons make direct inhibitory connections with neurons
in the reticular formation of the rostral ventrolateral medulla that project to the
spinal cord and presumably affect the excitability of sympathetic preganglionic
neurons (Agarwal et al., 1990, Aicher et al., 1995, Gieroba et al., 1992, Li et al.,
1992). The RetST controls autonomic functions by influencing preganglionic cells
and most of these influential fibres are derived from the lateral RetST with few
components from the medial RetST. However, other descending tracts, e.g. CS,
vestibulospinal, are assumed to exert regulatory effects of autonomic functions
as well (Lemon, 2008). Glycinergic neurons in the ventromedial medulla may
mediate motor atonia during rapid-eye movement (REM) sleep yet within this
same anatomical region there is an embedded anatomical structure, the
supraolivary medulla, purely containing glutamatergic neurons (Vetrivelan et al.,
2009).
1.3.3 Other descending systems
The ventromedial brainstem pathway, which generally is inclusive of the RetST,
includes the tectospinal tract and interstitiospinal tract arising from the
midbrain, and lateral and medial vestibulospinal tracts (VST) (Sugiuchi et al.,
2004). Propriospinal axons from these pathways project bilaterally into the
cervical enlargements (tectospinal) and can reach lumbar segments. Kuypers
considered this group of pathways as a bilateral postural control system for
head, neck, trunk and proximal limb movements (Kuypers, 1981, Lawrence and
Kuypers, 1968).
The dorsolateral brainstem pathways, including the rubrospinal tract arising
from the magnocellular red nucleus (Kennedy, 1990, Kuchler et al., 2002, Muir
and Whishaw, 2000) and the pontospinal tract descend contralaterally in the
dorsolateral funinculus. These pathways provide additional capacity for flexion
movements involving more distal limb segments (Kuypers, 1981).

26 “Emotional motor pathways” can influence motor functions at the spinal level as
well (Holstege, 1998). The raphé spinal pathway includes a diffuse system
arising from the lower brainstem and fibres terminate widely at all spinal levels.
Transmitters and neuromodulators in these pathways include 5-HT and NA
(Mason, 1997). This pathway is involved in various adaptive motor activities
such as defensive postures, pupil dilation, cardiovascular changes, vocalisation
and sexual behaviours, all of which are integral to an organism’s fitness and
survival (Vanderhorst et al., 2000).
1.4 Axonal pathfinding
The connectivity of heterogeneous neurons within the spinal cord give insights
into complex sensorimotor systems. The complexity of such connections has
been referred to as “the wiring problem” whereby axons must selectively find
pathways to reach their neuronal targets that enable formation of appropriate
synaptic connections (see Spitzer, 2004). Axon terminals contacting cells can
be either boutons terminals, which are terminations of axonal branches, or
boutons en passant, which appear as swellings along non-myelinated axons and
at nodes of Ranvier along myelinated axons (Hammond, 2001). Molecular cues,
e.g. ambient thermal and/or pH fluctuations, can promote synapse formation by
guiding axons and mediating their association with targets, but much less is
known about physical cues, e.g. physical constraints, of axonal pathfinding
(Nguyen et al., 2002). Axonal sprouting is not just an abortive attempt at
regeneration, but part of a defined sequence of events that can enable
transected axons to reconnect to their intended target. In contrast to
peripheral nerves, central axons cannot regenerate (Bareyre et al., 2002). To
further elucidate how axonal pathfinding may not only structure but actually
predict properties of networks of neurons, an outstanding issue is to identify the
common neurochemistry of axonal targets and then pair these populations with
their morphology, geometry and functionality.

27
1.5 Neurotransmission at the synapse
From Hebb’s rule (1949), if two neurons fire simultaneously, the synapses
between them are strengthened and the activity of several neurons converging
onto a single neuron further strengthens these synapses. Properties of individual
neurons are adaptive and synaptic strength may vary in response to sensory
input and central modulation (Buchanan and Grillner, 1991, Takahashi et al.,
2001) as well as their inherent membrane properties (Dale and Kuenzi, 1997,
Wallen et al., 1989).
Neurotransmission at chemical synapses is a sequence of temporal and spatial
events initiated when a change in action potential (in units volt (V)) invades the
presynaptic terminal (Figure 1.1). Synapses are specialised cell-to-cell contacts
where electrical signals are converted to chemical signals that diffuse between
cells. Although there are multitudes of kinds of synapses, they exist in two
prevailing forms: electrical and chemical. Electrical coupling is achieved
through extremely close apposition (≈ 3 nanometre (nm)) of the presynaptic to
postsynaptic membrane (Wang, 2008). Electrical synapses are either rectifying
where current flows in both directions or non-rectifying with unidirectional
current flow. Because electrical transmission is independent of chemical
signalling translation, it is advantageously fast.
In contrast, chemical synapses are, by nature, rectifying as the presynapse sends
transmitter molecules across the cleft. For this reason, chemical synapses can
be structurally asymmetrical as evidenced at the ultrastructural level.
Postsynaptic density areas range from 0.01 to 0.5 micrometre2 (µm2) (Wang,
2008) and in three dimensions, the surfaces of pre- and postsynaptic membranes
would have the shape of two plates facing each other. Chemical synapses are
characterised as a cluster of small vesicles (30-50 nm in diameter) at the
presynapse (Wang, 2008). Chemical transmission confers changing the sign of the
signal. Electrical depolarisation of the cell membrane opens the Ca2+ permeable
receptor channel. Presynaptic depolarisation elicited by an action potential can
trigger the release of an inhibitory transmitter, which then causes
hyperpolarisation at the postsynapse. This flux changes the threshold potential
and propagates an electrochemical cascade along the length of the axon. Signal
conversion occurs primarily at active zones, specialised electron-dense

28 proteinaceous sites on the presynaptic nerve terminal (Couteaux and Pecot-
Dechavassine, 1970). Excitation can thus become inhibition. Reducing tonic
presynaptic inhibition in intraspinal terminals would effectively “open the gate”
and allow signals to flow (Rudomin and Schmidt, 1999).
Inhibition of afferent activity can occur at any place in the synaptic pathway,
but it is most strategic for inhibition to occur at the closest site, even before the
unnecessary afferent activity has produced any appreciable disturbance in the
CNS. There are three prime locations in the afferent pathway that can
accomplish presynaptic inhibition: (1) the sensory receptor, (2) the primary
afferent terminal, and (3) the second-order cell that is the postsynapse. While
direct inhibition of peripheral receptors is common in invertebrates, presynaptic
inhibition is preferentially employed in vertebrates. Presynaptic inhibition can
be comparatively advantageous since it suppresses information flow in some
intraspinal branches, but not in other branches of the same afferent and
therefore may allow for selective excitation of neuronal target as needed for
appropriately refined motor control and sensory discrimination (Rudomin and
Schmidt, 1999).
Data suggest that each synaptic vesicle has a single H+-adenosine triphosphate
(H+-ATPase) (Takamori et al., 2006). This H+-ATPase couples hydrolysis of one
adenosine triphosphate (ATP) molecule to the inward transmembrane movement
of two protons and generation of a chemical gradient (ΔpH) and an electrical
gradient (ΔΨ). Under normal physiological conditions, there is an estimated 1-2
pH unit gradient and a 40-80 mV potential across the synaptic vesicle
membrane. Anions such as Cl- can permeate the synaptic vesicle membrane and
reduce ΔΨ which facilitates formation of a larger ΔpH (Johnson, 1988). Both
forms of synaptic transmission, electrical and chemical, coexist on cells
throughout the CNS. Synaptic transmission is not a static process as connectivity
strength may be depressed or potentiated. Such potentiated changes in synaptic
strength/weakness is plasticity. Depression is a complex phenomenon with both
pre- and postsynaptic components entailing the depletion of readily releasable
pools of vesicles, saturation, or desensitization of postsynaptic receptors (Neher,
1998). Control of temporal and spatial patterns of neurotransmitter signalling is
optimally achieved by removing the transmitter from the synaptic cleft.

29 Although glial cells do not actively participate in synaptic transmission, they
help define synaptic connectivity by maintaining signalling of neurons.
Mechanisms of synaptic transmission and reuptake are shown in Figure 1.1.

30
31
Figure 1.1 Neurotransmitter synthesis and release at the synapse
Electrical current flows across the presynaptic membrane when depolarized and neurotransmitters are released into the synaptic cleft, targeting receptors at the postsynaptic site (A). The inset box (A) shows the synaptic site at the cleft. Excitatory glutamate from mitochondrial glutamine is synthesized and released into the synaptic cleft (B) with postsynaptic uptake. Glutamate is transported into neurons via excitatory amino acid transporters and then loaded into synaptic vesicles via vesicular glutamate transporters. Inhibitory transmitter glycine (C) is synthesized by various pathways (e.g. serine) and GABA (D) which is synthesized from glutamate by the enzyme glutamic acid decarboxylase and loaded into vesicles via vesicular inhibitory amino acid transporters (VIAAT). High affinity transporters terminate the activity of these transmitters, which are then recycled to the synaptic terminal for reuse.
32
1.6 Neuroreceptors and neurotransmitters of spinal neurons
Two broadly distinct types of neuroreceptors have evolved to bind
neurotransmitter molecules and execute postsynaptic signalling: ionotropic and
metabotropic receptors. Ligand-gated ionotropic receptors are further
subdivided into three groups, kainite, α-amino-3-hydroxy-5-methyl-4-
isoxazolepropionic acid (AMPA) and N-methyl-D-aspartate (NMDA), each of which
are comprised of various subunits with unique stoichiometry. The overriding
principle of neuroreception is that transmitter molecules in the cleft are
received at complementary postsynaptic receptors that give measured and
detectable synaptic responses.
1.6.1 Glutamate
In the spinal cord, glutamate is used by primary afferents, excitatory
interneurons, projection neurons and some descending axons (Broman, 1993).
Glutamate is expressed throughout the CNS and contributes to both normal and
pathological neural activities. Synaptically released glutamate activates both
AMPA and NMDA ionotropic receptors although not necessarily at the same
synapse within the spinal cord (Dale, 1986, Dale and Roberts, 1985). Once
glutamate is released from the presynaptic nerve terminal, AMPA receptors
mediate rapid depolarisation whereas NMDA receptors mediate a much slower
response that is permeable to Ca2+ and blocked by Mg2+ (Alford et al., 2003). In
vertebrates, locomotor networks rely upon the co-activation of AMPA and NMDA
receptors activated by glutamate released from descending fibres such as from
the RetST (Brodin et al., 1988, Dale and Roberts, 1984, Jordan, 1998, Roberts et
al., 1985). Glutamate can excite neurons by activating several different types of
postsynaptic receptors. In particular, the NMDA activated receptor is of interest
due to its putative role in synaptic plasticity (Houk et al., 1993). Glutamate
uptake in vesicles depends primarily on ΔΨ rather than ΔpH with affinities in the
low millimolar (mM) range (Wang, 2008).

33 Three unique vesicular glutamate transporters have been identified. VGLUT1
messenger ribonucleic acid (mRNA) predominates within the neocortex and
cerebellar cortex. Within the cord, VGLUT1 is associated specifically with large-
diameter myelinated primary afferents (Varoqui et al., 2002). VGLUT2 mRNA is
found within brainstem nuclei, thalamic nuclei and cerebellar deep nuclei
(Wang, 2008). Within the cord, VGLUT2 is associated with populations of
interneurons (Varoqui et al., 2002) and its expression in nociceptors is essential
for normal perception of acute pain and heat hyperalgesia (Scherrer et al.,
2010). Throughout the CNS, including the spinal cord, neurons containing
VGLUT1 and VGLUT2 exist as independent populations (see Aihara et al., 2000,
Bellocchio et al., 2000, Fremeau Jr et al., 2001, Kaneko et al., 2002, Ni et al.,
1995, Sakata-Haga et al., 2001, Takamori et al., 2000). However, for unknown
reasons, colocalisation of these transporters is commonly observed in the
developing CNS (Nakamura et al., 2005), occurring infrequently in the adult
(Hioki et al., 2003). In contrast, the transporter of glutamate’s third isoform,
VGLUT3, is expressed in neurons not classically considered glutamatergic
(Fremeau Jr et al., 2001, Gras et al., 2002, Schafer et al., 2002) as it is not
necessarily confined to glutamatergic neurons. VGLUT3’s function remains
enigmatic (Fremeau et al., 2004). In terms of the functional significance of
VGLUT3, this excitatory transmitter may increase acetylcholine (ACh) vesicular
filling, ultimately stimulating ChAT transmission. VGLUT3 accelerates 5-HT
transmission at the level of specific 5-HT terminals and can exert inhibitory
control at the raphé level. Findings indicate that loss of VGLUT3 expression
leads to anxiety-associated behaviours (Amilhon et al., 2010).
1.6.2 Glycine and GABA
Inhibition of the vertebrate CNS is necessary to temper surplus afferent impulses
(see Rudomin and Schmidt, 1999) and many spinal neurons are inhibited by
glycine and GABA (Curtis et al., 1981). These amino acids act on ligand-gated
chloride channels: glycine and GABAA receptors, respectively. GABA transport
relies on both ΔpH and ΔΨ (Wang, 2008). Glycine is the smallest amino acid
with a molecular mass ≈ 50% less than glutamate (75 vs. 147 kilodalton (kDa)).
34 Comparatively low molecular mass leads to better permeability penetration in
tissues.
For spinal interneurons, the balance between the activity of GABAergic and
serotonergic fibres may set the level of excitability (Holstege, 1991). GABA may
modify the time course of synaptic inputs with a much lower affinity than
glycine (Lu et al., 2008), shortening the duration of glycinergic inhibition to
control postsynaptic excitability with precision. GABAergic neurons throughout
the CNS contain high levels of parvalbumin, a slow Ca2+ buffer associated with
regulation of short-term plasticity (Caillard et al., 2000).
An important function of GABAergic inhibition is to suppress the response of
dorsal horn neurons to low-threshold mechanical stimuli. GABAergic neurons
and ionotropic GABAA receptors are also found in the spinal dorsal horn where
they control the propagation of pain signals from the periphery to higher CNS
areas (Zeilhofer et al., 2009). In the ventral horn, GABA acts at both pre- and
postsynaptic sites to regulate motoneuron activity and consequently is vital for
normal motor function. Dysfunction of inhibitory systems leads to exaggerated
reflexes associated with spasticity (see Baldissera et al., 1981). GABA may be
especially important for regulating burst intensity, which affects the speed of
motor responses (Houk et al., 1993). Inhibitory synaptic transmission is
mediated by glycine and GABA is considered to be a prerequisite for coordinated
action of muscles during locomotion (Nishimaru and Kakizaki, 2009). Abnormal
synchronous gait may be due to a local defect in the mammalian lumbar spinal
cord circuitry, and at the level of the synapse, sarcosine, an agent that blocks
the reuptake of glycine, restores normal synchronous activation patterns
(Kullander, 2005). Immunocytochemistry (ICC) studies on development changes
of the distribution of inhibitory neurons demonstrate that GABAergic neurons are
amongst the earliest to populate ventral regions of the rat lumbar spinal cord
(Ma et al., 1992) and as synaptic inhibition begins to function, fetal motoneurons
transition from being GABAergic to glycinergic (Nishimaru and Kakizaki, 2009).
Because many boutons in the spinal cord contain both glycine and GABA (Ornung
et al., 1994, Taal and Holstege, 1994, Todd et al., 1995) the notion that they
may act as cotransmitters is plausible. Neurons with axons ascending to the
midbrain principally show GABAergic markers, or coincident GABAergic and

35 glutamatergic function (Martin et al., 2011). However, the coincident presence
of glycine and GABA in axon terminals does not prove that they both transmit at
synapses formed by these axons. For instance, glycine and GABA coexist in
cerebellar Golgi cells (Ottersen et al., 1988) but there is reasonable doubt that
glycine functions as a transmitter in this situation (Luque et al., 1995). Further,
these amino acids coexist at axo-axonic synapses in the cord (Todd et al., 1995)
although glycine is likely not involved in presynaptic inhibition (Todd et al.,
1996).
1.6.3 Monoamines
Neuromodulators can change neural information processing by regulating
synaptic transmitter release, altering baseline membrane potential and spiking
activity, and modifying long-term synaptic plasticity (Jankowska et al., 2000).
Axons containing 5-HT are especially abundant in the grey matter of the cord
and corroborative evidence indicates that while some classes of spinal neurons
are heavily innervated by 5-HT, others receive few inputs (Alvarez et al., 1998,
Stewart and Maxwell, 1999). 5-HT and NA modulate spinal pathways selectively
and differentially (Bras et al., 1989, Bras et al., 1990, Jankowska et al., 2000,
Jankowska et al., 1997).
Sensory transmission to superficial and deep dorsal horn neurons is either
depressed by 5-HT in rats (Garraway and Hochman, 2001, Lopez-Garcia, 1998,
Lopez-Garcia and King, 1996) or, alternatively, in a smaller proportion of cases,
5-HT actually potentiates sensory transmission (El-Yassir et al., 1988).
In rats, electrical stimulation of the dorsal raphé lowered movement thresholds
and this effect could be blocked in vivo by direct cortical application of WAY-
100135, a 5-HT1A antagonist, indicating that 5-HT is primarily acting through the
5-HT1A receptor (Scullion et al., 2013). In a complimentary study investigating
motor movements of forelimbs in rats, in vivo bath application of tissues with
application of WAY-100135 induced action potential firing whereas the agonist 8-
OH-DPAT , a 5-HT1A agonist, had the opposite effect. Taken together, these
results demonstrate that 5-HT, acting through 5-HT1A receptors, plays an

36 excitatory role in motor map expression (Scullion et al., 2013). Previous studies
have shown that other neuromodulators alter cortical motor map expression,
including DA (Brown et al., 2011, Brown et al., 2009, Metz et al., 2004) and ACh
(Conner et al., 2003, Ramanathan et al., 2009). When motor map integrity is
disrupted, behavioural deficits, e.g. reaching for a desired object with the
contralateral paw, are observed (Whishaw, 2000).
Neuromodulators can alter the gain of certain groups of premotor interneurons
(Jankowska et al., 2000). Gain may be a result of an interaction between
diffuse descending neuromodulators and highly specific local synaptic inhibitory
circuits. The effect on motoneuronal excitability is so strong that even motor
behaviours requiring minimal force would be virtually impossible without
substantial monoaminergic drive. Because raphé output was found to increase in
tandem with locomotion, motoneuronal gain may be proportional to the level of
force exerted. In the rat dorsal horn, neurons descending from the rostral
ventromedial medulla are the major source of serotonergic projections (Potrebic
et al., 1994). The control of dendritic processes via descending monoaminergic
inputs is likely to be vital for normal motor behaviour. Many bulbospinal
monoaminergic systems with heterogeneous transmitter phenotypes act on a
variety of spinal metabotropic receptor subtypes, suggestive of the notion that
spinal neuromodulation is a highly differentiated process (see Garraway and
Hochman, 2001). Thus, a key issue is that the brainstem nuclei that are the
origin of 5-HT and NA inputs to the cord are highly state dependent (Heckman et
al., 2008).
When 5-HT and DA are coupled in concentrations sufficient to produce a
measurable motor output, a rostrocaudal gradient of excitability emerges as
observed in the mouse spinal cord, putatively attributed to the differential
distribution of receptors along the spinal cord (Christie and Whelan, 2005).
Serotonergic and noradrenergic inputs to the spinal cord originate in the
brainstem while descending dopaminergic pathways originate in the
hypothalamus (Jordan et al., 2007). Modulatory actions of monoamines on
spinal commissural interneurons coordinating left-right hindlimb muscle activity
were investigated and the differences of these actions were found to depend
upon the intrinsic properties of those interneurons rather than the patterns of
37 innervation by monoaminergic fibres (Hammar et al., 2004). The synaptic
actions of 5-HT and NA may be exerted onto dendrites and somata of spinal
interneurons rather than axon terminals, as evidenced at the ultrastructural
level. However, the mechanisms underlying the effects of neuromodulators
have not been fully elucidated and these transmitters may be operating at either
pre- or postsynaptic sites (Maxwell et al., 2000).
1.7 Neuronal specification in sensorimotor systems
Spinal neurons serve two main functions: to relay cutaneous sensory information
to higher centres in the brain and to integrate proprioceptive input and motor
output. These two functional systems are partially anatomically segregated with
neurons and circuits that are capable of processing cutaneous sensory input
populating the dorsal horn. Comparatively, circuits involved in proprioception
and motor control are situated in the ventral horn (Jessell, 2000). In the
developing embryonic spinal cord, a functional shift occurs as the
neurotransmitter phenotype of interneurons populating the ventral spinal cord
changes. Numerous development studies have identified four class of embryonic
interneurons, designated as V0, V1, V2 and V3 (see Alvarez, et al., 2005).
However, little is known about their adult phenotype. Cell fates could be
influenced by ambient flux encountered in the embryonic environment, i.e., ΔpH
and temperature, as they further differentiate and populate the spinal cord.
The allocation of cell fate in the spinal cord depends upon two signalling systems
which intersect along the rostrocaudal and dorsoventral axes of the neural tube,
establishing a grid-like set of positional cues (Lumsden and Krumstauf, 1996,
Pituello, 1997). The position of progenitor cells along these axes is thought to
influence their fate by defining which inductive neurochemical signals, and the
concentrations, to which they are exposed (Jessell, 2000). Signalling along the
rostrocaudal axis of the neural tube establishes the main subdivisions of the CNS:
forebrain, midbrain, brainstem and spinal cord (Lumsden and Krumstauf, 1996)
and the dorsoventral signalling system has a prominent role of in establishing
neuronal diversity (Pituello, 1997).

38
1.7.1 Group Ia, Ib and II interneurons
Interneurons are typically confined within the CNS whereas motoneurons extend
beyond. First order interneurons are monosynpatically excited by sensory
afferent fibres whereas second, third, and “higher order interneurons” are
excited by other neurons. Finally, last order interneurons synapse onto
motoneurons. Individual interneurons can actually excite at different orders
simultaneously (Jankowska, 1992) so the terminology can become ambiguous. As
primary afferents enter the spinal cord, fibres bifurcate and branch as either
ascending or descending collaterals that descend to motor nuclei. Most primary
afferent fibres from receptors in skin, subcutaneous tissue, muscle, fascia, joint
capsules and viscera enter the CNS through the dorsal roots (Brown, 1981).
Proprioceptors contain their own sensory receptors, termed proprioceptors,
which are integral to motor control. Figure 1.2 schematically illustrates afferent
recurrent inhibition.
Type Ia sensory fibres primarily respond to changes in length of muscle fibres. Ia
interneurons especially tend to populate ventral lamina VII with dominant inputs
from Ia afferents (Hultborn et al., 1971). They are characterised by inputs from
sensory Ia muscle afferents and provide reciprocal inhibition to antagonistic
motor pools (Eccles et al., 1956). Excitation of interneurons by Ia afferents from
extensors (agonist) muscles evokes inhibition of flexor (antagonist) muscles and
vice versa such that these interneurons mediate Ia reciprocal inhibition
(Jankowska, 1992). Group Ia interneurons are modulated by Renshaw cells
(Hultborn et al., 1971), which are defined as inhibitory interneurons located at
the mediolateral border of the motor nuclei (Brown, 1981). In contrast to Ia
interneurons, Renshaw cells do not receive direct input from primary afferents
and their excitation by other interneurons is relatively limited (Jankowska,
2013). Descending tract axons and peripheral afferents may excite Ia inhibitory
interneurons not only directly but also indirectly via fusimotor neurons and
muscle spindle primaries (Jankowska, 1992).
Another type of proprioceptor, besides muscle spindles, are Golgi tendon organs
which are innervated by group Ib sensory axons that respond to tendon stretch.
Group Ib axons enter the spinal cord with extensive branching and synapse on
ventral horn interneurons. Group Ib interneurons depend upon peripheral input

39 from a greater variety of afferents. Therefore, presynaptic inhibition is thought
to be relatively more essential to controlling Ib interneurons than Ia
interneurons. Presynaptic inhibition may then not only weaken but change the
relative contribution of these afferents to the excitation of Ib interneurons
(Jankowska, 1992). Ib fibres have collaterals that arborise widely in the
intermediate region (Brown, 1981) (Figure 1.2).
Axons from secondary endings in muscle spindles are Group II afferent fibres.
Group II fibres contact respond to changes in muscle fibre length and group II
interneurons are found mainly in the grey matter of mid-lumbar, e.g. L4
(Cavallari et al., 1987), and lumbosacral segments and receive strong
monosynaptic innervation from group II fibres (Jankowska, 1992). In the dorsal
horn, group II interneurons are heterogeneous and may be either excitatory or
inhibitory. First order interneurons in group II afferent pathways have been
distinguished according to their anatomical location within the spinal grey
matter: laminae IV-V, VI-VII, and VIII (Maxwell et al., 1997). Findings indicate
that inhibitory dorsal horn group II interneurons exercise widespread inhibitory
control over multiple cell types located on both sides of the spinal cord
(Bannatyne et al., 2006). Monoamines were found to powerfully influence
premotor interneurons monosynaptically activated by group II afferents (Bras et
al., 1989, Bras et al., 1990, Jankowska et al., 2000) and although the precise
mechanism of this influence is still unknown, findings demonstrate there is a
morphological basis for modulatory actions as the vast majority (95%) of
monoaminergic contacts were found on dendritic processes (Maxwell et al.,
2000).
Neurons within laminae V - VII integrate inputs from group Ib afferents,
mediating reflex actions from tendon organs, and from group II muscle spindle
afferents. Patterns of reflex actions from these groups and task dependent
changes in their actions, such as during locomotor tasks, are influenced by
premotor interneurons integrating information from both afferent groups (Edgley
and Jankowska, 1987). However, a further review of compiled evidence
demonstrates that in all of these subpopulations differences between individual
interneurons mediating reflex actions from group Ib afferents and/or from group
II afferents are only minor, not distinctive, and they may therefore operate as

40 one functional population. Therefore, these neurons may be more appropriately
classified as “group I/II interneurons” (Jankowska and Edgley, 2010).

41
Figure 1.2 General schematic of recurrent inhibition
Excitatory synapses are represented as triangular shapes and inhibitory synapses as round dots. Renshaw cell (RC) with inhibitory axons, shown in green, is activated by a recurrent collateral from an extensor motoneuron (MN), forming a feedback loop. Ia inhibitory interneuron (Ia I IN), shown in grey, excited by Ia afferents. Gamma (γ) MN and extensor MN directly innervate extensor muscle. Descending tracts both excite and inhibit RC.

42
1.7.2 Commissural interneurons
Commissureal interneurons (CINs) are characterised by axons crossing the
midline, associated with coordinating left-right locomotion. CINs are a
heterogeneous population involved in both phasic postural adjustments and
rhythmic alternating movements during locomotion, swimming and scratching.
In the rodent lumbar spinal cord, axonal projections of CINs are distinctly inter-
segmental (ascending, descending or both) or intra-segmental (Stokke et al.,
2002) where “inter” refers to between segments and “intra” is within segments.
CINs are heterogeneous and the most reliably identified population are premotor
lamina VII interneurons with both excitatory and inhibitory neurochemical
profiles (Jankowska, 2007). An investigation of axonal projections of
reticulospinal (RetS) neurons in adult cats revealed that distinct populations of
CINs in intermediate zones directly excite and inhibit motoneurons located
contralaterally (Bannatyne et al., 2003). Investigation of CINs in the cat spinal
cord revealed that CIN subpopulations depend on intrinsic interneuronal inputs
rather than on patterns of innervation by desending monoaminergic fibres. Such
modulatory effects of monoamines on different populations of interneurons
might permit reconfiguration of the actions of CINs according to behavioural
context requiring adaptively appropriate locomotor responses (Hammar et al.,
2004).
1.7.3 ChAT interneurons
At the level of the synapse, vesicular transport of ACh depends primarily on ΔpH
(Wang, 2008) and muscarinic ACh receptors belong to the class of metabotropic
receptors. ACh is synthesized in the cytoplasm of ChAT nerve terminals,
concentrating in synaptic vesicles until release. At the spinal level, endogenous
ACh is especially important for modulating sensory processing. ACh was once
considered to be the only neurotransmitter released at both central and
peripheral synapses of somatic motoneurons (Curtis and Ryall, 1964, Eccles et
al., 1954, Windhorst, 1996) although more recent studies have challenged this
idea (Herzog et al., 2004, Mentis et al., 2006, Nishimaru et al., 2005). In the
spinal cord, intrinsic ACh acts as biogenic amine transmitter. In contrast to
bulbospinal monoamine transmitters i.e., 5-HT, DA and NA, ACh is distinct in

43 that it facilitates evoked excitatory postsynaptic potentials (Garraway and
Hochman, 2001). A monoclonal antibody to ChAT, the ACh synthesising enzyme,
has been used to localise ChAT within neurons in ICC preparations of adult rat
spinal cord (Barber, 1984).
Modulatory influences on neuronal output and behaviour are mediated by sets of
ChAT interneurons that can elicit an array of postsynaptic responses. The
activation of cortical ChAT systems modulates sensory threshold, states of
attention and consolidation of memory (Giocomo and Hasselmo, 2007, Lawrence,
2008, Pauli and O'Reilly, 2008). Morphological and functional features of ChAT
spinal neurons enable them to collect segmental information in superficial layers
of the dorsal horn and modulate it over several segments (Mesnage et al., 2011).
The spinal cord contains several classes of ChAT interneurons with proposed
roles in sensory processing and motor output (Barber, 1984, Huang et al., 2000,
Phelps et al., 1984). Insights into ChAT modulatory function have emerged
through pharmacological manipulation of ChAT receptors, however, due to their
widespread distribution, the link between the dynamics of ChAT microcircuitry
and physiological function is not yet fully established (Wess, 2003). As a result,
defining the contribution of individual classes of ChAT modulator interneurons to
specific behaviours is challenging (Zagoraiou et al., 2009).
Neurons immunoreactive for ChAT have been classified and include preganglionic
autonomic neurons, small dorsal horn neurons found in laminae III-V,
motoneurons, partition neurons found in lamina VII, and central canal neurons in
lamina X (Barber, 1984, Borges and Iversen, 1986, Houser et al., 1983, Phelps et
al., 1984, Sherriff and Henderson, 1994). The ChAT plexus of dendritic
processes in laminae II-III (Ribeiro-da-Silva and Cuello, 1990a) arise, at least in
part, from intrinsic spinal neurons, most likely those with somata in laminae III-
IV (Barber, 1984). These neurons are rare and disperse along the mediolateral
axis (Mesnage et al., 2011). In lamina III, ChAT interneurons receive contacts
from both myelinated and unmyelinated primary afferents and different classes
of afferents target particular dendritic domains and are likely to be components
of an inhibitory feedback pathway monosynaptically activated by primary
afferents (Olave et al., 2002). ChAT partition cells segregate into ipsilaterally
44 and bilaterally projecting populations where the latter preferentially exhibit
connectivity to functionally equivalent motoneuron pools (Stepien et al., 2010).
As some ChAT cells may be considered a subset of nitric oxide synthase (NOS
cells), many ChAT cells are immunoreactive to neuronal nitric oxide synthase
(nNOS) (Spike et al., 1993). The enzyme nicotinamide adenine dinucleotide
phosphate (NADPH diaphorase) is expressed as nNOS isoform throughout the
brain and spinal cord (Bredt et al., 1991b, Mizukawa et al., 1989, Valtschanoff et
al., 1992, Vincent and Kimura, 1992). Specifically in the lumbar cord, NADPH
diaphorase is largely restricted to GABAergic neurons in lumbar segments and
this enzyme tends to coincide with neurons in which GABA coexists with glycine
or ACh (Spike et al., 1993). The highest concentration of nNOS reactive cells are
found in laminae II and III and around the central canal with some cells scattered
through the laminae IV-VI region. In the ventral horn, nNOS immunoreactive
cells can be found but motoneurons are not labelled (Valtschanoff et al., 1992).
Motoneurons are known to receive prominent ChAT inputs, C boutons, from
spinal interneurons. Zagoraiou et al. (2009) have shown that the transcription
factor Pitx2 marks a small population of spinal ChAT interneurons, V0C neurons,
which represent the sole source of C boutons. These C boutons align with
postsynaptic m2 class muscarinic receptors and K+ channels (Hellström et al.,
2003, Muennich and Fyffe, 2004, Wilson et al., 2004) and these synapses exert a
modulatory influence on motoneuron firing (Brownstone et al., 1992).
1.8 Neural Networks
Neural networks in the spinal cord are capable of producing rhythmic
movements even when isolated from the brain and sensory inputs. These
“neural oscillators” are referred to as central pattern generators (CPGs)
(MacKay-Lyons, 2002). Core sets of excitatory and inhibitory spinal interneurons
construct spinal motor networks (Grillner and Jessell, 2009). Command
repetoires are structured before a movement begins and are sent to the muscle
with the correct timing such that the entire sequence may be executed in the
absence of peripheral feedback (Marsden et al., 1984). Spinal cord CPGs
produce coordinated activation of flexor and extensor motoneurons during
locomotion (McCrea and Rybak, 2008). At the level of the synapse,
45 neuromodulators can evoke changes in CPG properties, conferring flexibility
(MacKay-Lyons, 2002). Sensory afferents involved in muscle and cutaneous
reflexes have important regulatory functions by ensuring phase transition in
locomotion and preserving balance. Sensory feedback is vital for modulation of
motor outputs, but it is unclear whether sensory feedback is necessary for the
development of the CPG (Kullander, 2005).
1.9 Physical properties of spinal neurons
Because the majority of synapses in the CNS are found on dendrites, the
regulation of dendritic arbors is of critical importance to neural organisation
(Snider, 1988). To some degree, dendritic arbors appear to be established at
early developmental stages by intrinsic genetic mechanisms (Banker and Cowan,
1979, Honig and Hume, 1986, Kriegstein and Dichter, 1983). However, dendritic
arborisation is also influenced by extrinsic factors, particularly neural
connections (Deitch and Rubel, 1984a) and neurotrophic molecules may affect
dendritic arborisation as well (Snider, 1988). The complexity and variety of
dendritic processes raise difficult questions concerning the role played by
neuronal geometry in shaping neural behaviour. The development of
quantitative models for characterising the detailed branching patterns of
dendritic trees is a major step toward providing a basis for defining the
functional roles of spinal neurons (Lindsay et al., 2007). Stereological
techniques provide meaningful quantitative descriptions of the geometry of
three-dimensional structures from measurements that are on two-dimensional
images (see Schmitz and Hof, 2005).
A common feature of reconstruction models is the use of parametric
distributions to characterise morphological data (Ascoli et al., 2001, Burke et
al., 1992). Historically, Ramon y Cajal (1909) described three discreet types of
neurons in the substantia gelatinosa (lamina II) and later studies (Gobel, 1975,
Gobel, 1978) using intracellular staining have defined four main types of neurons
in the cat dorsal horn: islet, stalked, arboreal and border (Grudt and Perl, 2002).
In a study involving transgenic mice expressing green fluorescent protein
specifically in cholinergic interneurons, ratios of dendritic and axonal processes
were found to be significantly elongated rostrocaudally as correlated to distinct
46 tonic and phasic firing properties such that a marked anisotropy emerged
(Mesnage et al., 2011). Results from a study of mammalian autonomic ganglia
related the number of axons in synaptic contact with various types of cells and
the anatomical complexities of their various cell targets (Purves and Hume,
1981). Taken together, such findings raise the possibility that a function of
dendrites is to regulate the number of different innervating axons. The number
of different dendritic and axonal processes that innervate neurons is a major
determinant of their ability to integrate information (Hume and Purves, 1981).
1.10 Scope of this research and overarching aims
Descending systems are differentially involved in sensorimotor processes
associated with hindlimb movement within the spinal cord. However, the
neurotransmitters used by these systems and their neuronal targets within the
spinal cord is largely unknown. To trace descending systems, axon terminals
were labelled by anterograde transport of CTb and the corresponding
reconstructed brain injections sites for all experiments are shown in Appendices
Figures 1, 2 and 3. These investigations will address each of the following
overarching aims:
To identify the neurotransmitter phenotypes and distribution of axons
descending from the medulla and the sensorimotor cortex that project to
lower lumbar spinal segments
To identify the neurochemical content of contacts onto ChAT and
ChAT::nNOS expressing interneurons targeted by descending axons
To classify these neuronal populations targeted by descending systems
according to their morphology across laminar boundaries and their dendritic
orientations

47
2 Chapter 2. General experimental methods
48 This chapter presents a detailed overview of all general experimental methods
and materials used throughout this project to fulfil the principal aims.
Subsequent experimental chapters will present experimental techniques specific
to that investigation.
2.1 Surgical procedures and anaesthesia
All animal procedures were conducted in accordance with British Home Office
regulations and the Animals Scientific Procedures Act (1986) with approval by
the Glasgow University Ethics committee. Professor David Maxwell injected the
CTb into the rat brains with my assistance. Prior to surgery, adult male albino
Sprague Dawley rats (Harlan, Bicester, UK) were housed in groups in
temperature controlled cages on a 12 hour light/dark cycle with behavioural
enrichments provided and freely accessible food and water. The stereotaxic
coordinates for each descending system are listed in Table 2.1. There are two
methods to finding the stereotaxic coordinates of an intended injection target
site, interaural and bregma. For the medullary injection sites, interaural
coordinates were used. Bregma coordinates were used for the sensorimotor
cortex rather than interaural because these coordinates are closer to the target.
Any given injection site was found from the list of anatomical structures in the
stereotaxic atlas (Paxinos and Watson, 2003) with the anterior-posterior (AP)
coordinate indicated in the sagittal diagram grid (Figure 2.1). The dorsoventral
(DV) and mediolateral (ML) coordinates were then determined from the
corresponding coronal diagram grid.

49
Table 2.1 Stereotaxic coordinates for the descending systems
Interaural coordinates are used to target the medullary sites (MLF and CVLM) and bregma coordinates are used to target the sensorimotor cortex. AP = anterior posterior; DV = dorsoventral; ML = mediolateral; mm = millimetre.
Figure 2.1 Injection sites for the descending systems in the sagittal plane
Coordinates for the CST (blue grid), medullary RetST-MLF (pink grid) and RetST-CVLM (orange grid) are indicated (mm = millimetre). Based on Paxinos and Watson, 2003.

50
Immediately preceding surgery, rats were weighed (250-350 grams (g)) on a
balance scale (Adventurer-Pro, Ohaus) and deeply anaesthetised with an
intraperitoneal injection (ip) of a 2:1 cocktail of the dissociative drug Ketamine
(Boehringer Ingelheim Vetmedica, Inc., USA) and Xylazine (Bayer Plc., UK) at 0.1
millilitre (ml) / 100 g. Fur was shaved from the scalp (Contura Shaver, Vet
Tech, UK) and the rat was transferred to the surgical theatre and placed onto a
heated platform (Vet Tech Solutions LTD). Surgical instruments were autoclaved
(SES Little Sister 3, Eschmann). The depth of the anaesthetic effect was gauged
by the withdrawal reflex; the back paw was squeezed tightly to evoke
withdrawal of the limb. If this reflex was absent, then the surgical procedure
may proceed or otherwise the rat was given a supplemental dose of the
injectable anaesthetic (≈ 0.1 ml ip). The withdrawal reflex was checked
regularly throughout the procedure to assess whether further drug was necessary
to ensure deep anaesthesia. For some of our stereotaxic procedures, rats were
anaesthetised with gaseous isoflurane, a halogenated ether: 2-chloro-2-
(difluoromethoxy)-1,1,1-trifluoro-ethane (Sigma Aldrich, UK) delivered via a
compact anaesthetic trolley with a vapouriser (Vet Tech Solutions LTD). After
the isoflurane was initially introduced in an anaesthetic chamber (Vet Tech
Solutions LTD), a face mask was fitted to continuously administer a 2%+ dose
scavenged using an Active Scavenging Unit (Fluo Vac System, Vet Tech
Solutions).
Under strict aseptic conditions, the rat was fitted into the stereotaxic frame
(World Precision Instruments, Inc.) as shown in Figure 2.2. Equidistant ear bars
were inserted into the external auditory meatus such that the head may rotate
freely up and down but not sideways. The head was finally secured by placing
incisors into the clamped incisor bar. Sterile surgical drapes isolated the
surgical area. The incision site was swabbed with ethanol and the rat’s eyes
were protected with a thin layer of petroleum-based eye ointment (Lacri-Lube,
Allergan) and/or gauze moistened with water. The skull was then exposed with
the incised skin retracted. Bregma, lambda and the sagittal suture were
represented as shown in Figure 2.3.
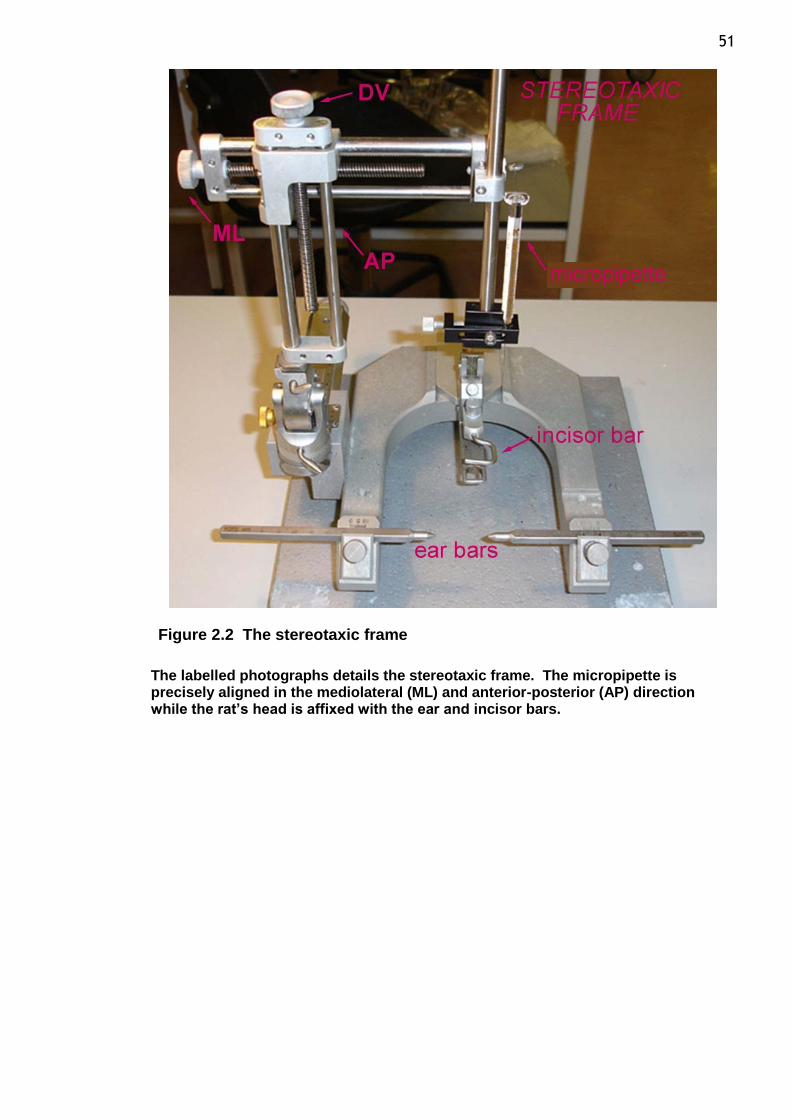
51
Figure 2.2 The stereotaxic frame
The labelled photographs details the stereotaxic frame. The micropipette is precisely aligned in the mediolateral (ML) and anterior-posterior (AP) direction while the rat’s head is affixed with the ear and incisor bars.

52
Figure 2.3 Bregma, lambda and the sagittal sutures of the rat skull
The sutures are visualised during the stereotaxic procedures. Based on Paxinos and Watson, 2003.
To zero the stereotaxic frame, the tip of the glass micropipette was aligned with
the sagittal suture (or Bregma for the sensorimotor cortex injection site) and the
ML reading from the Vernier scale (mm) was recorded as ‘zero’. For the AP and
DV coordinates, the tip of the micropipette was situated at the right ear bar
with the readings each recorded as ‘zero.’ To calculate the target coordinates,
the known stereotaxic coordinates were subtracted from these ‘zero’ figures. A
burr hole was drilled through the skull with a dental drill (World Precision
Instruments, Inc.) to accommodate the micropipette with a tapered tip diameter
of approximately 20 µm. If necessary, bleeding from the skin or bone
surrounding the burr hole was cauterised with a thermal cautery unit (Geiger
Medical Technologies) to prevent blood from clogging the glass tip. The
micropipette was filled with 1% CTb (Sigma-Aldrich Co., Poole, UK) in distilled
water with a Pico injector (World Precision Instruments, Sarasota, FL, USA). For
medullary injections, 200 nl of CTb was injected and 3 x 200 nl for the
sensorimotor cortex injections. The micropipette was inserted into the brain
and lowered to the designated DV target coordinate. CTb was pulse titrated at a
rate of 1-5 pound-force per square inch, absolute (psi) using the Pico injector.
The micropipette was left in place for five minutes to prevent backflow of CTb
into the glass tip. The micropipette was then withdrawn and the wound was

53 then sutured (Coated VICRYL suture, Ethicon) and the procedure concluded. The
anti-inflammatory drug, Carprofen (0.1 ml / 100 g ip; Pfizer) was given. Under
close veterinary supervision, the rat was transferred to a recovery cage and
normal exploratory behaviour was expected within minutes. Within 2-4 hours,
the rat was fully recovered and food and water were freely provided.
2.2 Perfusion, dissection and tissue preparation for immunocytochemistry
After a six day postoperative survival period, rats were anaesthetised with
Pentobarbitone (1 ml / 200 g ip; Sigma-Aldrich, UK). Professor David Maxwell
performed the perfusions with my assistance. When the withdrawal reflex was
absent, the rat was perfused with mammalian ringer solution immediately
followed by 1L of 4% paraformaldehyde (Sigma-Aldrich, UK) in 0.1 phosphate
buffer (PB). Reagents were introduced by a syringe through the left ventricle
via gravity feed. The spinal cord and brain were removed and stored in bottles
containing paraformaldehyde fixative solution overnight at 4°C. To cryoprotect
the brain, sucrose was added to this fixative solution (3 g / 10 ml). The cortex
and brainstem were cut into 100 µm coronal sections with a freezing microtome
(Leitz, Wetzlar) for histological examination of the injection site. Lower lumbar
spinal cord segments from L3 to L5 were cut in 60 µm transverse, parasagittal
and horizontal sections with a Vibratome (Leica VT10005). Brain and cord
sections were immediately dehydrated in a 1:1 solution of ethanol (EtOH) in
distilled water to enhance antibody penetration. Surfactants denature proteins
and for antibodies to optimally penetrate the tissue’s lipid bilayer, all antibody
combinations were diluted with 0.3% Triton X-100 (Sigma-Aldrich, UK) in
phosphate buffer saline (plus Triton X-100 ©) (PBST). Surplus sections were
stored in glycerol at -20°Celsius (C). Whole blocks of tissue were cryoprotected
by overnight saturation with sucrose PB, drained, then stored in liquid nitrogen,
which freezes instantly at -210°C. Formulae for common laboratory reagents
used throughout this project are provided in Appendix 2 Table 1.
54
2.3 Identification of injection sites
Injection sites of the brain and axon terminals labelled by anterograde transport
of CTb of the cord were revealed using the chromogen 3, 3’-diaminobenzidine
(DAB; Sigma-Aldrich, UK). Brain sections and a few representative transverse
cord sections were incubated in goat anti (α)-CTb (List Quadratech, USA) at
1:1000 for 2 days at 4°C followed by three quick rinses in phosphate buffer
saline (PBS). Sections were kept free-floating during all incubations on an
agitation platform (IKA Vibrax VXR Shaker). Sections were then incubated in
biotinylated α-goat immunoglobulin (IgG) (Jackson Immunoresearch, USA) at
1:500 for 4 hours at 25°C followed by three quick rinses in PBS. Sections were
finally incubated in avidin horseradish peroxidase (HRP; Sigma-Aldrich, UK) at
1:1000 for 2 hours at 25°C followed by two quick rinses in PB. Finally DAB
solution in PB was activated by H2O2 and filtered with sections immediately
reacted for 10 minutes. Immunoreactive anatomical sites appeared as a rusty-
brown colour. Sections were mounted on gelatinised slides and stored overnight
in formalin vapour. Serial solutions of distilled water, 70% EtOH, 90% EtOH,
100% EtOH and finally a histological clearing agent (Histo-clear II, National
Diagnostics, USA) dehydrated and cleared the mounted slides, which were then
cover-slipped using a histological mounting medium (Histomount, National
Diagnostics, USA). Sections were observed with a transmission light microscope
(Nikon Eclipse E600, Sury, UK) and digitally photographed with an AxioCam
camera (Carl ZEISS, Inc., Germany) using AxioVision 4.8 software (Carl ZEISS,
Inc., Germany). To determine specific anatomical structures targeted by the
CTb injections, coronal templates from the stereotaxic rat brain atlas (Paxinos
and Watson, 2003) were referenced. Representative photomicrographs are
shown in Figure 2.4. Brain injection sites for all animals are shown in Appendix
1 Figures 1, 2 and 3.
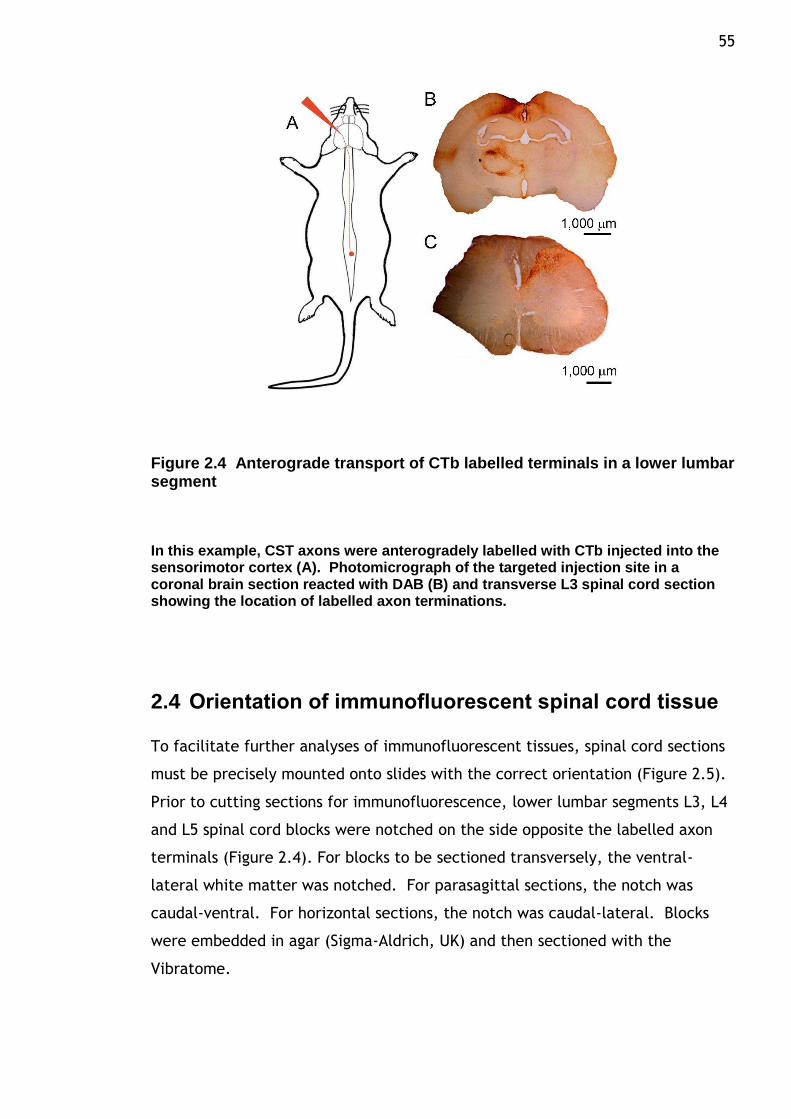
55
Figure 2.4 Anterograde transport of CTb labelled terminals in a lower lumbar segment
In this example, CST axons were anterogradely labelled with CTb injected into the sensorimotor cortex (A). Photomicrograph of the targeted injection site in a coronal brain section reacted with DAB (B) and transverse L3 spinal cord section showing the location of labelled axon terminations.
2.4 Orientation of immunofluorescent spinal cord tissue
To facilitate further analyses of immunofluorescent tissues, spinal cord sections
must be precisely mounted onto slides with the correct orientation (Figure 2.5).
Prior to cutting sections for immunofluorescence, lower lumbar segments L3, L4
and L5 spinal cord blocks were notched on the side opposite the labelled axon
terminals (Figure 2.4). For blocks to be sectioned transversely, the ventral-
lateral white matter was notched. For parasagittal sections, the notch was
caudal-ventral. For horizontal sections, the notch was caudal-lateral. Blocks
were embedded in agar (Sigma-Aldrich, UK) and then sectioned with the
Vibratome.

56
Figure 2.5 Three-dimensional spinal cord block in transverse, parasagittal and horizontal spatial planes
D = dorsal; V = ventral; R = rostral; C = caudal; L = lateral; cc = central canal; wm = white matter.

57
2.5 Antibody characterisation
Primary antibodies against transporters, neurotransmitters and receptors were
selected to fulfil the aims of this project. I conducted all ICC experimental
techniques and subsequent analyses on processed tissues. A primary antibody
has a selective affinity to a target antigen already present in the tissue. Spinal
cord sections were incubated in various primary antibody combinations raised in
different species. Then sections were incubated in the species-specific
secondary antibody combinations conjugated to various fluorophores (Figure
2.6). A secondary antibody is generally an IgG raised in donkey against the IgG
belonging to the animal species of the paired primary antibody. The specificity
of any given primary antibody is demonstrated by a negative control: the
absence of immunoreactivity in regions of the CNS known not to contain neurons
that transport the tracer. For a positive control, the antibody is tested on
neurons that are known to contain the target antigen. To ensure quality control
for each antibody used in this project, the supplier provided referenced
information about the immunoprecipitation and immunoblotting tests to
determine an antibody’s specificity and optimal concentration. Information
pertaining to the specificity, controls, species reactivity and application of
primary antibodies used for all experiments are listed in Appendix 2 Table 2.
For all ICC experiments presented in this project, the following general
techniques were followed unless otherwise indicated. Continuously agitated
spinal cord sections were incubated for three days at 4°C in various primary
antibody combinations then incubated overnight in secondary antibody
combinations at 4°C. Sections were always rinsed in PBS three times after each
incubation period. With notches aligned, sections were mounted on glass slides
and cover-slipped with a glycerol based anti-fade medium (Vectashield; Vector
Laboratories, Burlingame, CA, USA). For experiments using four primary
antibodies, sections were sequentially reacted. The fourth primary antibody is
paired with biotin bound to avidin. Biotin is a very small coenzyme (molecular
weight = 244.31 g/mol) that binds specifically to avidin with a high affinity.
Avidin is conjugated to a fluorophore. All secondary antibodies were supplied by
Jackson ImmunoResearch, West Grove, USA, except Alexa-fluor 488 (Alexa 488)
and avidin Pacific Blue (AvPB), which was supplied by Molecular Probes, Eugene,

58 USA. Sequentially reacted sections were then scanned twice as described in
Figure 2.7.
2.6 Image acquisition and confocal microscopy
For all experiments, immunoreactions were repeated for three animals (n = 3). I
examined all processed tissues using confocal microscopy. Terminals were
counted as positive only if fully filled with a given marker in the same focal
plane. Contacts were defined as being in close apposition to neuronal processes
in the same focal plane with no intervening black pixels. The radii (r) and
surface areas of somata were mathematically calculated based on the measured
perimeter from the projected confocal image using Image J 1.43u software
programme (National Institutes of Health, USA). The transcendental value of pi
(π) was designated as 3.14 to approximate the radii of soma that are assumed to
be spherically shaped for the purposes of these experiments. Radius (µm) =
perimeter / (2π) and surface area (µm2) = 4πr2. The number, length and surface
area of dendrites was recorded directly from Neurolucida Explorer 9.14.3
software (MBF Bioscience – MicroBrightField, Inc. 1987-2010).
Immunoreactive sections were scanned with a three-colour channel laser
confocal microscope (Bio-Rad, Hemel Hempstead UK) as shown in Figure 2.7,
which also describes the fluorophores used throughout this project. Sections
were scanned at x40 oil immersion with a zoom factor of 2 with a 0.5 µm z-
separation (unless otherwise indicated in subsequent chapters). To locate
specific neurons within sections, especially in the parasagittal and horizontal
plane, low power images were scanned at x20 with a zoom factor of 1 with a 1-2
µm z-separation. Slightly overlapping serial scans were montaged as necessary
to fully reconstruct dendritic processes. Neurons were reconstructed in three
dimensions using Neurolucida 9.14.3 software (MBF Bioscience –
MicroBrightField, Inc. 1987-2010). Images are displayed in single focal planes,
unless otherwise indicated, with colour channels separated and adjusted using
Adobe Photoshop 7.0 (1990-2000).
Data from the all experiments were gleaned from analyses based upon confocal
microscopy where immunofluorescent axon terminals and their neuronal targets
59 were quantified. Structures forming putative appositions can be detected from
a series of thin optical sections that are a fraction of a micron in depth.
Therefore, it is highly probable any two structures in apposition in a single
optical plane form a synaptic contact since they cannot physically lie above or
below each other in that plane of focus. General image acquisition and data
analyses methods are outlined in Figure 2.8.
2.7 Tissue allocation for experiments
Processed spinal cord segments L3, L4 or L5 containing anterogradely labelled
axons descending from the MLF, CVLM or CST were allocated for all experiments
as indicated in Appendix 2 Table 3. Surplus tissues were routinely stored and
used for later experiments. A few sections from any given single agar-embedded
segment could be cut in a given plane of orientation, removed from the
Vibratome chuck, re-embedded in agar, and remounted in another plane such
that further sections from a single segment could be cut in more than one
spatial plane for use in subsequent experiments.

60

61
Figure 2.6 Confocal microscope instrument schematic
Highly ordered laser light is scanned across the spinal cord tissue section by rotating scanning mirrors. The tissue is illuminated axially rather than at different angles so the entire optical field is uniformly illuminated. Optical sections occur as light passes through the pinhole
to the photomultiplier (PMT) detector. Excited particles in the tissue fluoresce at a given wavelength, (nm). Some of the excitation energy is lost as excited electrons drop to a lower shell state, finally resting as light is emitted as detected colour. The fluorescent light (B, blue line) is descanned by the same mirrors that scan the excitation light (A, red line), which then passes through the dichroic mirror and selectively through the pinhole where light not incident from the focal plane is rejected. The light passing through the pinhole is then detected by the PMT, resulting in a sharply resolved image. Fluorophores: AvPB = Avidin Pacific Blue; Alexa 488 = Alexa-fluor 488; Rh Red = Rhodamine Red; Dyl 649 = Dylight 649. AvPB is detected within the ultra-violet visible (UV vis) range. Based on Semwogerere and Weeks, 2005.
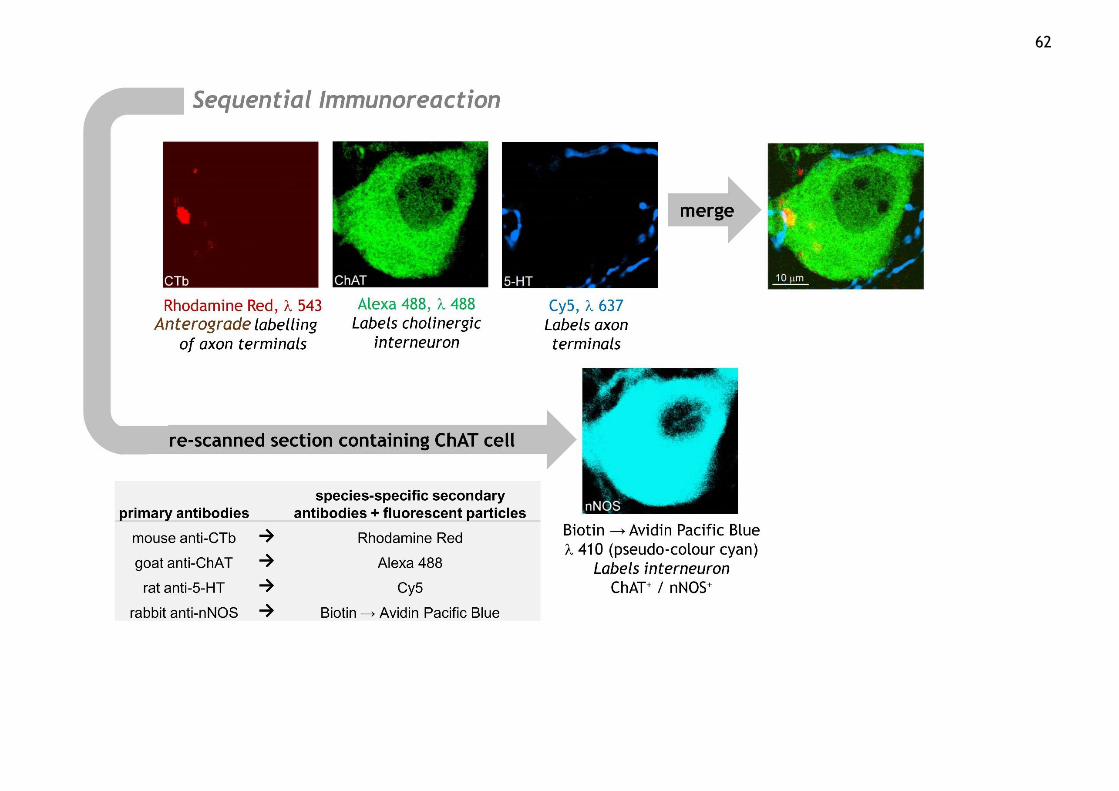
62

63
Figure 2.7 Sequential immunoreaction diagram
The diagram describes the process of triple labelling immunocytochemistry for CTb, ChAT and 5-HT and the sequential labelling of nNOS. The confocal images show how the labelling can be visualised independently in separate colour (red, green, blue) channels and merged to assess the spatial distribution of antigens in a single optical plane. To perform sequential immunochemistry with an additional primary antibody, nNOS, the section is re-scanned with the blue diode within the ultra-violet visible (UV vis) range. This additional nNOS labelling is revealed by AvPB, indicating the cell is positive for both ChAT and nNOS. The secondary antibody Cyanine 5 (Cy5) can be used interchangeably with Dyl 649, visualised as blue (see Figure 2.6).

64
Figure 2.8 Diagram of general image acquisition and data collection methods
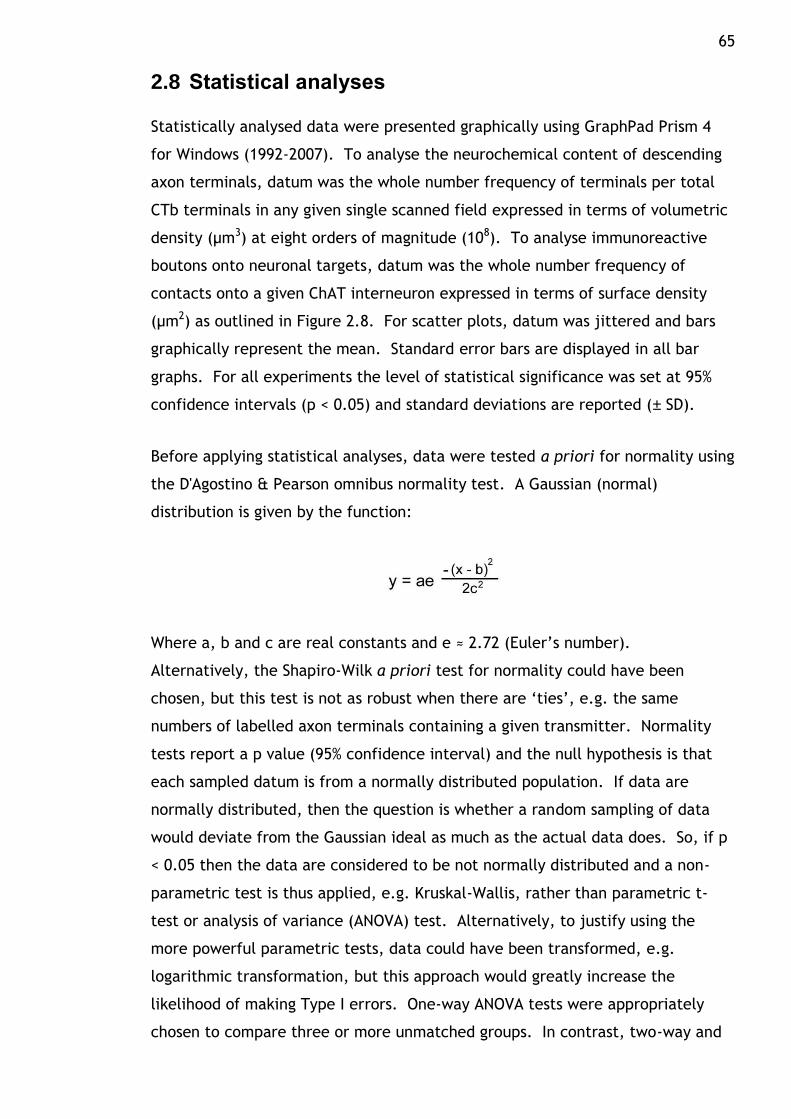
65
2.8 Statistical analyses
Statistically analysed data were presented graphically using GraphPad Prism 4
for Windows (1992-2007). To analyse the neurochemical content of descending
axon terminals, datum was the whole number frequency of terminals per total
CTb terminals in any given single scanned field expressed in terms of volumetric
density (µm3) at eight orders of magnitude (108). To analyse immunoreactive
boutons onto neuronal targets, datum was the whole number frequency of
contacts onto a given ChAT interneuron expressed in terms of surface density
(µm2) as outlined in Figure 2.8. For scatter plots, datum was jittered and bars
graphically represent the mean. Standard error bars are displayed in all bar
graphs. For all experiments the level of statistical significance was set at 95%
confidence intervals (p < 0.05) and standard deviations are reported (± SD).
Before applying statistical analyses, data were tested a priori for normality using
the D'Agostino & Pearson omnibus normality test. A Gaussian (normal)
distribution is given by the function:
Where a, b and c are real constants and e ≈ 2.72 (Euler’s number).
Alternatively, the Shapiro-Wilk a priori test for normality could have been
chosen, but this test is not as robust when there are ‘ties’, e.g. the same
numbers of labelled axon terminals containing a given transmitter. Normality
tests report a p value (95% confidence interval) and the null hypothesis is that
each sampled datum is from a normally distributed population. If data are
normally distributed, then the question is whether a random sampling of data
would deviate from the Gaussian ideal as much as the actual data does. So, if p
< 0.05 then the data are considered to be not normally distributed and a non-
parametric test is thus applied, e.g. Kruskal-Wallis, rather than parametric t-
test or analysis of variance (ANOVA) test. Alternatively, to justify using the
more powerful parametric tests, data could have been transformed, e.g.
logarithmic transformation, but this approach would greatly increase the
likelihood of making Type I errors. One-way ANOVA tests were appropriately
chosen to compare three or more unmatched groups. In contrast, two-way and

66 three-way ANOVA tests determine the effect of two and three respective
nominal predictor variables and are thus not applicable to the address the
following investigations.
Although a priori tests are sufficient to determine whether data are normally
distributed, some experimental data are displayed graphically. The premise is
that the normal probability plots compares the sampled data with what is
expected of normally distributed data. If the data is normal, then the
probability plot assumes a pattern of linearity, y = mx + b (where y and x are
real constants, m is the slope and b is the y-intercept), when columnar data is
numerically ordered (Figure 2.9).
Post hoc test for a linear trend to determine whether groups increase or
decrease systemically or randomly. Dunn’s multiple comparison post hoc tests
accompany nonparametric tests to compare differences in the sum of ranks with
significance reported as p values. Tukey’s post hoc tests accompany parametric
tests to compares every mean with every other mean.
Figure 2.9 Normal probability plot
The data from an imaginary population assuming a Gaussian distribution (A) was numerically ordered (smallest to largest) and the resulting normal probability plot was linear (y = mx + b) with the line of best fit shown (B). For experimental data sets, a priori D'Agostino & Pearson omnibus normality tests determined whether data were parametric or not so that the appropriate statistical tests were chosen. To visualise a priori analyses, data were plotted graphically.

67
3 Chapter 3. Neurotransmitter phenotypes of medullary axonal projections within lower lumbar spinal segments
68
3.1 Introduction
Many descending systems are known to excite spinal neurons yet the
neurotransmitter phenotypes used by these systems still are largely unknown.
Although the RetS pathways are phylogenetically amongst the oldest of the
descending pathways, their role in limb movement remain elusive (see
Jankowska and Edgley, 2006). The independent activities of postural control
and movement indicate descending pathways use separate yet closely
interacting regulatory signals (Schepens and Drew, 2003) and the RetST is likely
to serve a fundamental role in integrating such activities (Jankowska and Edgley,
2006). There are several components to the RetST; from Latin, “reticulated”
means intricately web-like. Located in the tegmentum of the brainstem from
the mesencephalon through the myelencephalon, the reticular formation
represents a smooth functional transition between descending and ascending
sensorimotor systems.
This study focuses on the neurotransmitter content of axon terminals descending
from the MLF and CVLM. Electrophysiological studies have demonstrated that
stimulation of the MLF activates many reticulospinal fibres which produce
profound effects on networks involved in motor control (Edgley et al., 2004,
Jankowska et al., 2003). Pharmacological, lesion and electrophysiological
studies in the rat have established that the CVLM participates in many vital
autonomic functions such as baroreceptive, vestibulosympathetic and
somatosympathetic reflexes (Agarwal et al., 1990, Aicher et al., 1995, Jeske et
al., 1993).
The systems descending from the reticular formation have been reported as
having heterogeneous transmitter content. Many systems descending from the
medulla are serotonergic (Bowker et al., 1981b) and diverse neurochemicals
originating from the medullary raphé such as 5-HT can elicit rhythmic motor
activities (Alford et al., 2003, Jordan and Schmidt, 2002a, Rossignol et al.,
2002). Axons descending from the medulla may also contain other co-
transmitters such as amino acids and peptides (Bowker and Abbott, 1990,
Maxwell et al., 1996). There is evidence in the rat (Vetrivelan et al., 2009) and
mouse (Martin et al., 2011) that spinally projecting neurons surrounding the MLF
region contain VGLUT2 mRNA which is consistent with electrophysiological
69 evidence in cats that many medullary axons send strong excitatory signals to
spinal neurons (see Achermann and Borbely, 1994, Edgley et al., 2004, Hammar
et al., 2011, Jankowska et al., 2003, Wilson and Yoshida, 1969) while other
medullary axons are glycinergic (Holstege and Bongers, 1991) and GABAergic
(Antal et al., 1996, Holstege, 1991). There is further evidence that these
inhibitory transmitters may be co-localised within the same neurons (Hossaini et
al., 2012).
It is hypothesised that axons descending from the reticular formation project
differentially to lower lumbar spinal cord segments and express a combination of
transmitters. Because the MLF and CVLM are anatomically and functionally
distinct systems, then it is hypothesised that they express different transmitters
in different ratios. If these axon terminations express inhibitory transmitters,
then evidence of co-localisation is expected. Descending medullary axons are
hypothesised to express 5-HT. In order to investigate the neurotransmitter
phenotypes of anterogradely labelled medullary axons projecting to lower
lumbar segments of the spinal cord, a series of immunoreactions were conducted
with subsequent analyses. The experiments addressed the following aims:
To determine the distribution of medullary axons projecting to lower
lumbar spinal cord segments
To determine the neurotransmitter phenotypes of axon terminals
descending from the MLF and CVLM within lower lumbar spinal cord
segments
To determine the neurotransmitter phenotypes of inhibitory axon terminals
from the MLF and the CVLM within lower lumbar spinal cord segments
To determine if medullary axons projecting to lower lumbar spinal cord
segments contain serotonin

70
3.2 Methods
3.2.1 Image acquisition
For the following series of experiments, brain injection sites from a total of ten
rats were visualised using DAB as a chromogen were reconstructed (Appendix 1
Figures 1 and 2). For each series of experiments (Table 3.1), images were
captured from a minimum of six transverse sections per animal. Immunoreactive
sections were scanned by using a 40x oil immersion lens with a zoom factor of 2
and z-separation of 0.5 µm. For each section at least three fields with a 100 µm
X 100 µm scanning area were obtained from different regions of the grey matter.
Using Neurolucida, a 10 x10 µm grid was superimposed over the image stacks.
To avoid bias, stacks were visualised in the red channel first such that only CTb
immunoreactivity was shown. Approximately one terminal per grid cell was
counted (depending upon the given section) and then each counted terminal was
evaluated again separately in the green and blue channels to count the other
marker(s). Terminals were counted as positive only if fully filled with a given
marker in the same focal plane. To accurately determine the laminar location
of terminals, semi-opaque standard templates of transverse spinal cord
segments (based on Molander et al. 1984) were overlaid onto scanned images as
necessary. Scale bar lengths are denoted on all images. Datum was the average
number of immunoreactive axon terminals containing a given neurotransmitter
per total labelled terminals in any given scan field (see Figure 2.8).
3.2.2 Derivation of laminar volume
First the surface areas of each scaled bilateral laminar region for L3, L4 and L5
transverse sections was found as indicated in the conceptual model where I
deconstructed laminar regions. Each spinal cord lamina is as if an area under a
curve confined by dorsal and ventral boundaries, which can be theoretically
conceptualised as an integral function. Cubic volumes were based on 60 µm
thick sections (Figure 3.1) since sections processed for ICC were uniformly cut at
60 µm for maximum antibody penetration (see Chapter 2). Transverse templates
were filled with hexagonal grids and hexagons were manually counted and
summed (Figure 3.2). Hexagons straddling laminar borders were counted as

71 ‘halves’ and summed accordingly. Hexagons were chosen rather than square
grids because they stack optimally in curved spaces, e.g. carbon molecules,
snowflakes, honeycombs: since hexagons have 120 degree angles, three can
come together in corners for a total of 360 degrees (see Kepler, 1596). Datum
was expressed in terms of cubic density (µm3) at eight orders of magnitude (108).

72
Figure 3.1. Conceptual model of bilateral laminar regions containing CTb terminals
Bilateral laminar regions of a representative L4 section (based on Molander et al., 1984) were deconstructed. For L4 segments, lamina IX regions are fully embedded within lamina VII, shown subtracted from the intermediate region (A). Any given laminar area X can be conceptualised as an area within a curved space confined by dorsal and ventral laminar boundaries, as an integral (B). Labelled CTb terminals exist within three dimensional laminar volume of space, as shown in the hexagonal prism, uniformly cut at a thickness of 60 µm (C).

73
Figure 3.2. Derivation of laminar volume using hexagons
A transverse L4 section template is shown as an example (based on Molander et al., 1984). Scaled templates were filled with hexagonal grids. Hexagons were counted and summed to find the volume of L3, L4 and L5 rat spinal cord segments.
3.2.3 Statistical Analysis
Nonparametric tests necessitate that the sampled data does not assume a Gaussian
(normal) distribution and data were checked a priori for normality. Although the
Gaussian assumption accounts for the distribution of the overall population, rather
than just the sampled data, the a priori assessed the scatter of the distribution
from the following experiments. The Kruskal-Wallis test compared the medians of
sampled data with Dunn’s multiple comparisons test post hoc to test the
neurotransmitter content of axons across laminar regions.

74
Table 3.1. Summary of primary and secondary antibody combination and concentrations
DAB was used as a substrate to visualise CTb staining. All secondary antibodies were raised in donkey and conjugated to Rh Red, Dyl 649 (supplied by Jackson ImmunoResearch, West Grove, USA) or Alexa 488 (supplied by Molecular Probes, Eugene, USA). Avidin HRP and DAB supplied by Sigma-Aldrich, Dorset, UK. Antibody labelling: CTb, traces myelinated axons; VGLUT1 and VGLUT2, synaptic vesicles; vesicular GABA transporter (VGAT), glycinergic and GABAergic synaptic vesicles; glycine transporter 2 (GlyT2), plasma membrane; glutamic acid decarobylase 67 (GAD67), synaptic vesicles recognising GAD isoform with molecular weight 67 Kd; 5-HT, synaptic terminals.

75
3.3 Results
3.3.1 Aim 1: To determine the distribution of medullary axons projecting to lower lumbar spinal cord segments.
3.3.1.1 MLF and CVLM axon labelling within lumbar segments
CTb was injected into the MLF, slightly to the left of the midline (Table 2.1) to
label descending axons anterogradely. The CTb tracer diffused into the raphé
obscuris, paramedian reticular nucleus and tectospinal tract. A considerable
number of terminals were found on both sides of the spinal cord and were
distributed in the intermediate grey matter and ventral horn including motor
nuclei. CTb was injected into the CVLM to label axons (Table 2.1) and the tracer
also diffused into the ambiguous nucleus and solitary tract. Reconstructed brain
injection sites are shown in Figure 3.3. Terminals from the CVLM were principally
found ipsilateral to the injection site and were distributed in the intermediate grey
matter and ventral horn including motor nuclei. For both systems, a few terminals
were found in the white matter. Axons projecting from these descending systems
are shown in Figures 3.4 and 3.5. These systems were found to project differently
to spinal laminae as hypothesised.
The mathematically derived volumes of grey and white matter laminar regions for
L3, L4 and L5 sections were expressed in scientific notation. Most laminae were
found to be six orders of magnitude in volume. Lamina VII volumes were an order
of magnitude greater except in the L5 segment and lamina X had the smallest
volume at 5 orders of magnitude. The L4 segment at the hindlimb enlargement
has the greatest total volume and L5 the least (Table 3.2).

76

77
Figure 3.3. Brain reconstructions for MLF and CVLM injection sites
Exemplary reconstructions of the CTb injection sites labelling the MLF and CVLM. The inner black shaded areas represent the core of the injection site and the grey shaded areas represent the maximum diffusion of CTb within the brain. 100 µm thick coronal sections reacted with DAB to reveal the tracer are shown on the left with corresponding drawings on the right. Template drawings are from Paxinos and Watson (1997). For the MLF injection site, the CTb tracer labelled the MLF (medial longitudinal fasciculus), ROb (raphé obscurus nucleus) and ts (tectospinal tract) with other anatomical sites included for contextual reference, including the 4V (4th ventricle), Gi (granular insular cortex), IOBe (inferior olive beta subnucleus), PMn (paramedian reticular nucleus), py (pyramidal tract) and Sp5I (spinal trigeminal nucleus, interpolar part). For the CVLM injection site, the CTb tracer labelled the CVLM (caudal ventral lateral medulla), Amb (ambiguus nucleus) with diffusion into the LRtS5 (lateral reticular nucleus, subtrigeminal part) with other anatomical sites included for contextual reference, including 12 (cerebellar lobule 12), PCRt (parvicellular reticular nucleus) and Ro (raphé obscurus). Brain reconstructions from all experiments are shown in Appendix 1 Figures 2 and 3.

78
Figure 3.4. Distribution of labelled terminals from the MLF
Labelled terminals in the lumbar cord were revealed with DAB shown on the left. The notch is contralateral relative to the injection site. The drawings on the right show the distribution of terminals superimposed onto standard L3, L4 and L5 transverse sections (based on Molander et al., 1984). Terminals were plotted from 60 µm thick sections.

79
Figure 3.5. Distribution of labelled terminals from the CVLM
Labelled terminals in the lumbar cord were revealed with DAB shown on the left. The notch is contralateral relative to the injection site. The drawings on the right show the distribution of terminals superimposed onto standard L3, L4 and L5 transverse sections (based on Molander et al., 1984). Terminals were plotted from 60 µm thick sections.
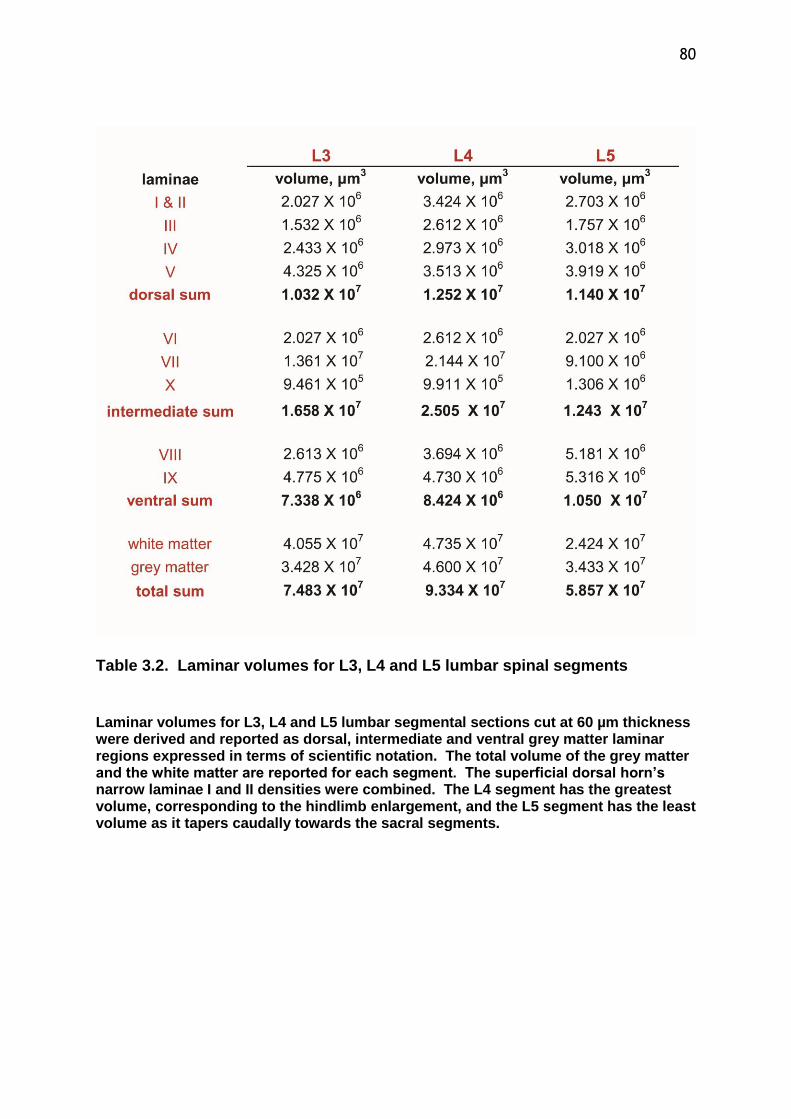
80
Table 3.2. Laminar volumes for L3, L4 and L5 lumbar spinal segments
Laminar volumes for L3, L4 and L5 lumbar segmental sections cut at 60 µm thickness were derived and reported as dorsal, intermediate and ventral grey matter laminar regions expressed in terms of scientific notation. The total volume of the grey matter and the white matter are reported for each segment. The superficial dorsal horn’s narrow laminae I and II densities were combined. The L4 segment has the greatest volume, corresponding to the hindlimb enlargement, and the L5 segment has the least volume as it tapers caudally towards the sacral segments.
81
3.3.2 Aim 2: To determine the neurotransmitter phenotypes of axon terminals descending from the MLF and CVLM within lower lumbar spinal cord segments
To investigate the neurochemical properties of glutamatergic terminals descending
from the MLF and CVLM, sections were reacted with a combination of antibodies
against CTb, VGLUT1 and VGLUT2 (Table 3.1). A total of 361 axons terminals from
the MLF (n = 3) and 2881 axon terminals from the CVLM (n = 3) within the grey
matter were analysed. From the MLF population, terminals containing VGLUT2 had
an average density of 4.72 per µm3 108 (±1.62) with negligible expression of
VGLUT1. From the CVLM population, terminals containing VGLUT2 had an average
volumetric density of 3.93 per µm3 108 (±0.11) while terminals containing VGLUT1
had a nearly negligible density of 0.02 per µm3 108 (±01.01) (Appendix 3 Table 1).
To investigate excitatory and inhibitory MLF and CVLM axons, sections were
reacted with a combination of antibodies against CTb, VGAT and a mixture of
VGLUT1 and VGLUT2 raised in the same species (g. pig) such that these two VGLUT
antibodies reacted with the same secondary antibody (Table 3.1). Throughout this
present investigation, this antibody mixture will be denoted as [VGLUT1 +
VGLUT2]. A total of 745 axon terminals from the MLF (n = 3) and 1,619 axon
terminals from the CVLM (n = 3) within the grey matter were sampled. From the
MLF population, terminals containing [VGLUT1 + VGLUT2] had an average density
of 5.38 per µm3 108 (±0.75) and terminals containing VGAT had an average density
of 1.90 per µm3 108 (±0.57). From the CVLM population, terminals containing
[VGLUT1 + VGLUT2] had an average density of 5.34 per µm3 108 (±0.63) and
terminals containing VGAT had an average density of 1.96 per µm3 108 (±0.36)
(Appendix 3 Table 2). Immunofluorescent confocal microscope images from these
reactions are shown Figures 3.6 and 3.7.
The a priori D’Agostino & Pearson omnibus normality test indicated that the data
did not assume a normal distribution and the distribution is shown as a histogram
plot. Consequently, nonparametric tests were consequently applied (Figure 3.8).
As hypothesised, desending MLF and CVLM axons express a heterogeneous

82
combination of neurotransmitters, however the neurochemical content of axons
descending from these two distinct medullary anatomical sites were found to not
significantly differ (Figure 3.9).
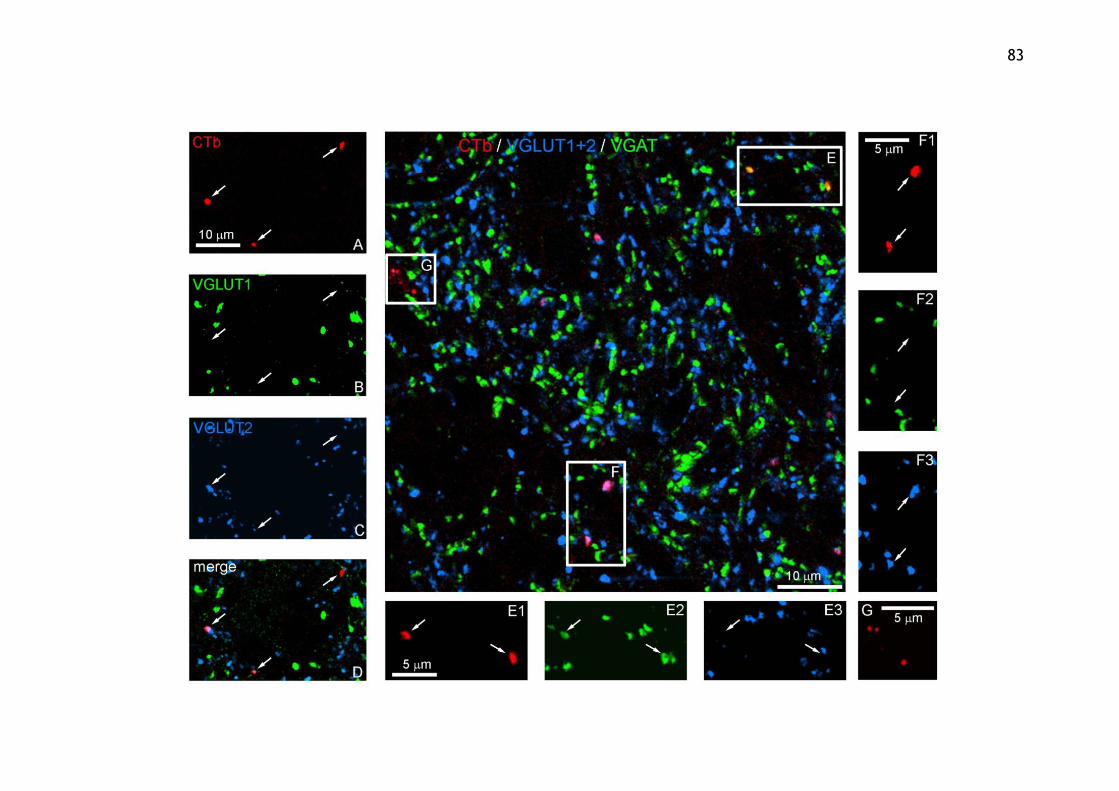
83

84
Figure 3.6. Immunochemistry of MLF terminals
In single optical planes, immunoreactive CTb terminals (A) were negative for VGLUT1 (B) and positive for VGLUT2 (C) as shown in magenta in the merged image (D). Inset box E shows CTb terminals (E1) positive for VGAT (E2) and negative for [VGLUT1+VGLUT2]. Inset box F shows CTb terminals (F1) negative for VGAT (F2) and positive for [VGLUT1+VGLUT2] (F3). Inset box G shows CTb terminals negative for both markers.

85
Figure 3.7. Immunochemistry of CVLM terminals In single optical planes, immunoreactive CTb terminals (A) are negative for VGLUT1 (B) and positive for VGLUT2 denoted by blue pointers (C) as shown in the merged image (D). CTb terminals (E) are positive for VGAT denoted by green pointers (F) and positive for [VGLUT1+VGLUT2] denoted by blue pointers (G) as shown in the merged image (H). For all panels, negative CTb terminals are denoted by white pointers.

86
Figure 3.8. Example of an a priori histogram plot
This histogram shows that the data does not assume a Gaussian distribution as confirmed by the a priori D’Agostino & Pearson omnibus normality test. Therefore nonparametric tests were applied to analyse data from experiments. For normally distributed data, the distribution would be linear (y = mx + b). Normality was tested for all experimental data and this example shows the distribution of the volumetric densities of axon terminals within a 100 µm X 100 µm scan field immunoreactive to VGLUT2 (n = three animals) and VGAT (n = three animals).

87
Figure 3.9. Volumetric density comparison of MLF and CVLM terminal transmitter content
Kruskal-Wallis tests compared the median densities of glutamatergic axons (A) in all examined laminae; the populations did not differ. The median density of excitatory and inhibitory axons (B) did not differ (p > 0.05). Each datum represents one 100 µm X 100 µm scan field containing an averaged number of labelled axon terminals containing the given transmitter per total terminals. Scatter plot bars represent the mean. N = 3 animals. (A) MLF, 361 terminals examined; CVLM, 2881 terminals examined (B) MLF, 745 terminals examined; CVLM, 1619 terminals examined.
88
3.3.2.1 Laminar density comparison of excitatory and inhibitory axon terminals projecting from the MLF and CVLM
The grey matter density of medullary axons was found to be lesser in intermediate
laminae VI, VII and X for both VGLUT2 and VGAT as compared to the laminae
examined more dorsally. The transmitter ratio of axonal populations was most
evident in the ventral horn with excitatory densities greater for MLF axons and
inhibitory densities greater for CVLM axons. In dorsal laminae I-V, CVLM axons
exhibited the greatest densities of both transmitters. These anatomically distinct
axonal populations were not significantly different in terms of their transmitter
density across laminar boundaries (Figure 3.10).

89
Figure 3.10. Laminar densities of excitatory and inhibitory medullary axon terminals
Kruskal-Wallis tests compared the median densities of axonal populations containing VGLUT2 (A) and VGAT (B) across laminar boundaries (p > 0.05). MLF and CVLM populations containing VGLUT2 and VGAT did not differ significantly. Medullary axons were predominantly excitatory (A) with lesser expression of inhibitory amino acids (B). Each coloured bar represents 100 µm X 100 µm scan fields containing an averaged number of labelled axon terminals containing the given transmitter per total terminals within the indicated laminar region. Standard error bars shown. N = 3 animals. (A) MLF, 361 terminals examined; CVLM, 2881 terminals examined (B) MLF, 745 terminals examined; CVLM, 1619 terminals examined.
90
3.3.3 Aim 3: To determine the neurotransmitter phenotypes of inhibitory axon terminals from the MLF and the CVLM within lower lumbar spinal cord segments
Sections were reacted with a combination of antibodies against CTb, GlyT2 and
GAD67 (Table 3.1). From the MLF population, a total of 2,421 immunoreactive
axon terminals were analysed (n = 3) and 3,923 terminals (n = 3) from the CVLM
population. From the MLF population, terminals containing GlyT2 had an average
density of 2.17 per µm3 108 (±0.85) and 3.30 per µm3 108 (±0.55) from the CVLM
population. From the MLF population, terminals containing GAD67 had an average
density of 2.96 per µm3 108 (±2.34) and 2.07 per µm3 108 (±0.32) from the CVLM
population. A few CTb terminals were found to be double labelled for both GlyT2
and GAD67. Double labelled MLF axons had an average density of 0.51 per µm3 108
(± 0.34) and double labelled CVLM axons had an average density of 0.68 per µm3
108 (± 0.06) (Appendix 3 Table 3). Immunofluorescent confocal microscope images
from these reactions are shown in Figure 3.11. The volumetric densities of these
populations did not differ significantly (Figures 3.12). As hypothesised, MLF and
CVLM axons do express inhibitory transmitters and although there is evidence of
co-localisation, this expression is comparatively limited.
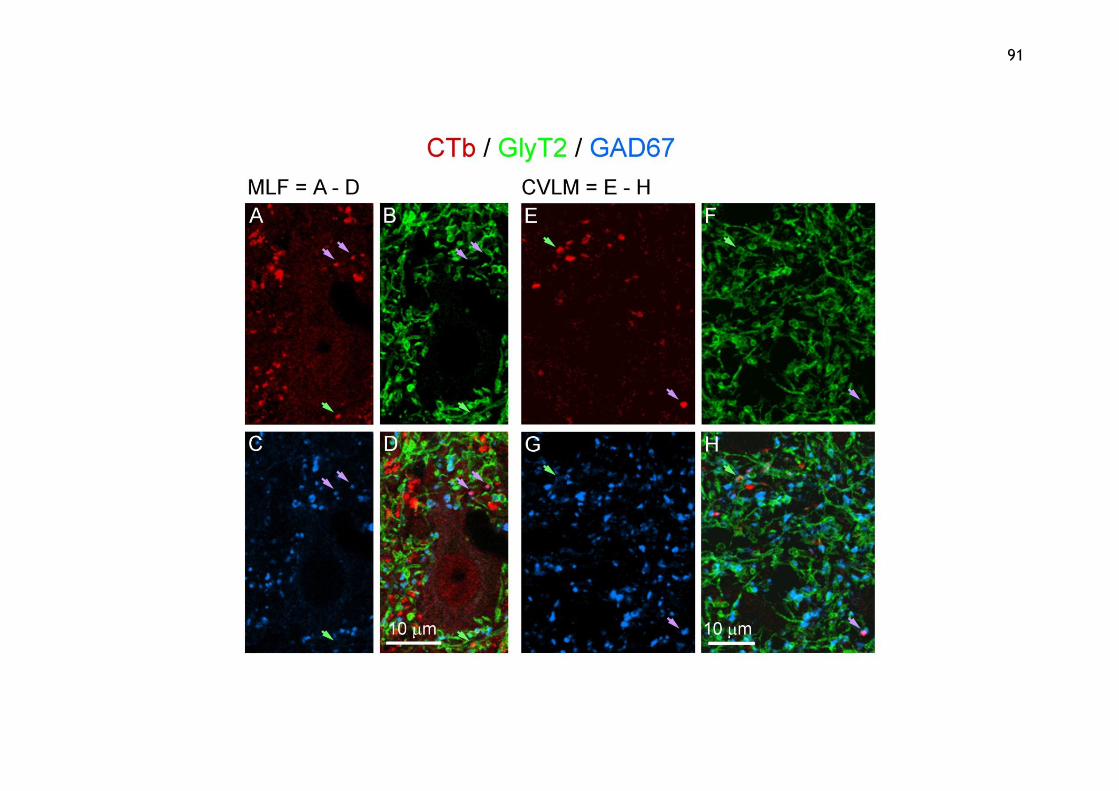
91

92
Figure 3.11. Immunochemistry of inhibitory axons
In single optical planes, immunoreactive CTb terminals from the MLF (A) and CVLM (E) are positive for GlyT2 (B, F) and GAD67 (C, G) as indicated by green and lavender arrows, respectively, in the merged images (D, H) as shown in single optical planes. Immunoreactivity for GlyT2 typically surrounds boutons as the transporter is found in the plasma membrane rather than in the cytoplasm.

93
Figure 3.12. Scatter plot comparison of glycine and GABA volumetric densities from MLF and CVLM axonal populations The volumetric density of inhibitory axon terminals from the MLF (circles) and CVLM (squares) did not significantly differ. Comparatively few axons were double labelled for both inhibitory amino acids. Kruskal-Wallis with Dunn’s multiple comparison post hoc compared medians (p > 0.05). Each datum represents one 100 µm X 100 µm scan field containing an averaged number of labelled axon terminals containing the given transmitter per total terminals. Scatter plot bars represent the mean. N = 3 animals. MLF, 2421 terminals examined; CVLM, 3923 terminals examined.
3.3.3.1 Laminar comparison of axon terminals containing glycine and GABA projecting from the MLF and CVLM
Although the inhibitory transmitters of these distinct medullary pathways do not
significantly differ, there were differences found across laminar boundaries. The
volumetric density of glycinergic and GABAergic axons projecting from the MLF and
CVLM were investigated in defined medial and lateral laminar regions (Figure
3.13). The density of glycinergic terminals were more evenly distributed across
laminar boundaries in the MLF population as compared to the CVLM population,

94
where the lamina X density especially differed from dorsal regions (Figure 3.14).
The greatest density of GABAergic terminals from the MLF was found in lamina X,
but this effect was less pronounced for the CVLM population (Figure 3.15). The
density of axons containing both inhibitory amino acids was most apparent in
laminae VI and VII for both descending pathways with a considerable density also
in lamina X (Figure 3.16).
Figure 3.13. Transverse medial and lateral regions
Spinal L4 section shown as an example (based on Molander et al., 1984). The medial region is shaded darker with lateral regions shown in paler beige.
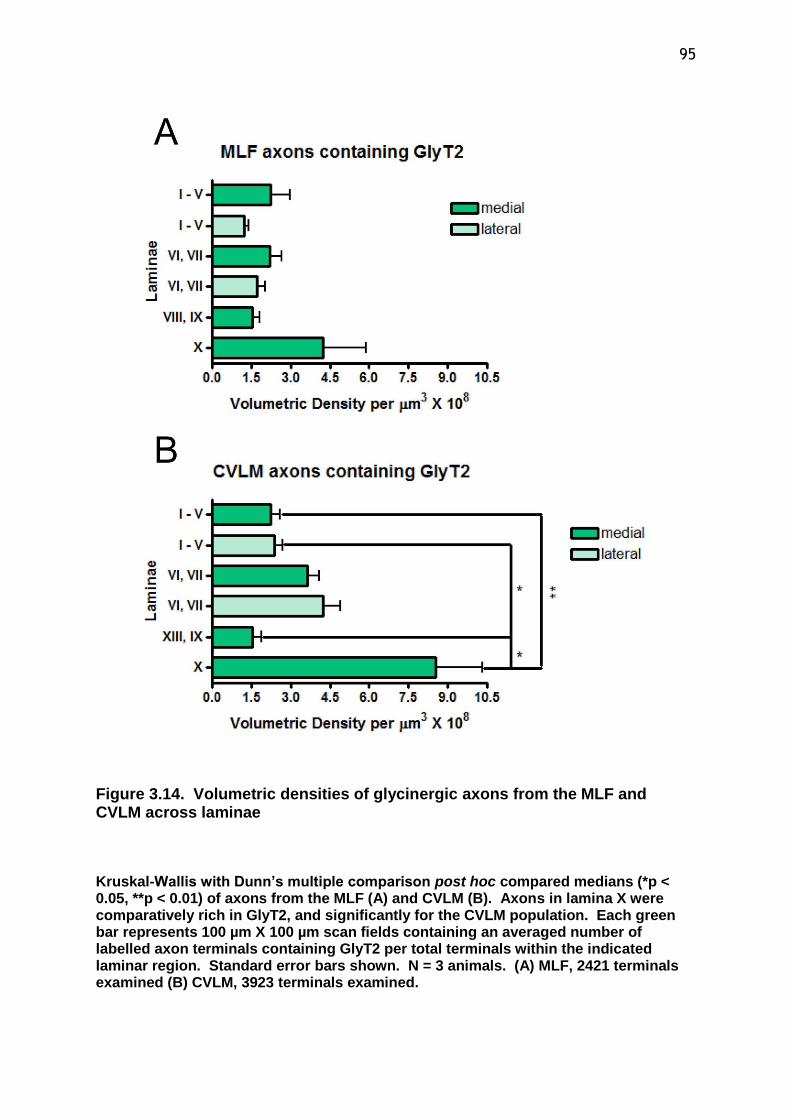
95
Figure 3.14. Volumetric densities of glycinergic axons from the MLF and CVLM across laminae
Kruskal-Wallis with Dunn’s multiple comparison post hoc compared medians (*p < 0.05, **p < 0.01) of axons from the MLF (A) and CVLM (B). Axons in lamina X were comparatively rich in GlyT2, and significantly for the CVLM population. Each green bar represents 100 µm X 100 µm scan fields containing an averaged number of labelled axon terminals containing GlyT2 per total terminals within the indicated laminar region. Standard error bars shown. N = 3 animals. (A) MLF, 2421 terminals examined (B) CVLM, 3923 terminals examined.
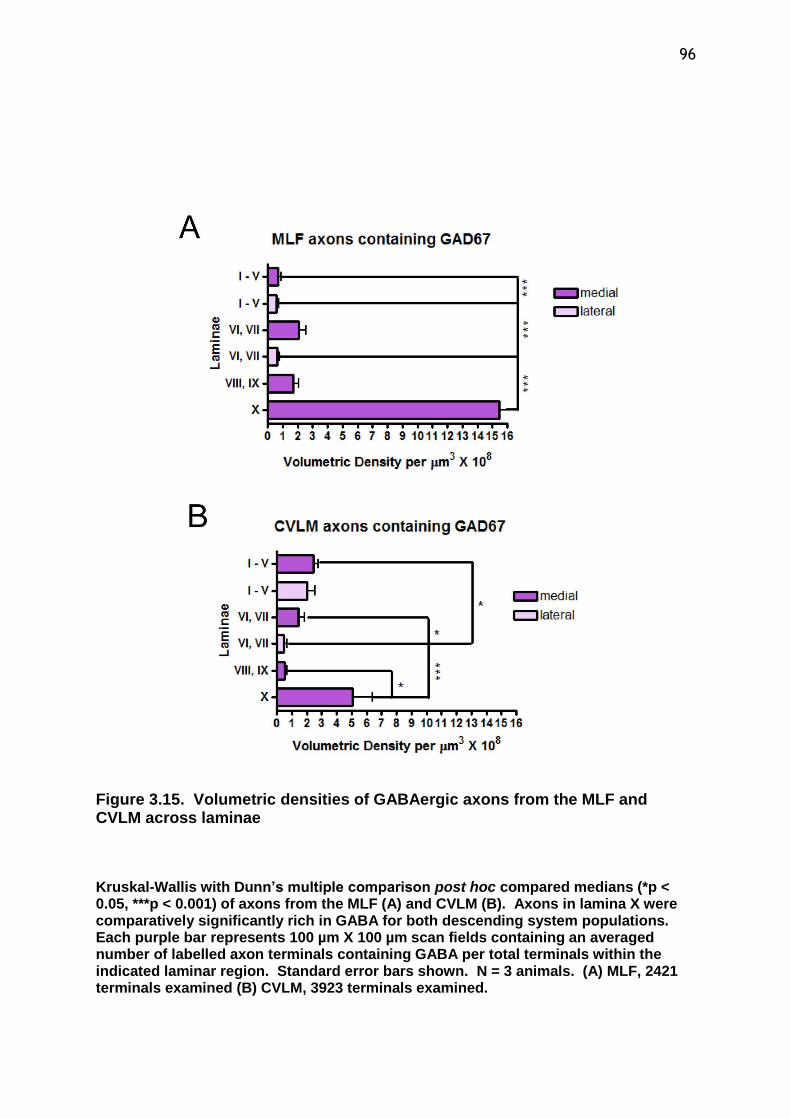
96
Figure 3.15. Volumetric densities of GABAergic axons from the MLF and CVLM across laminae
Kruskal-Wallis with Dunn’s multiple comparison post hoc compared medians (*p < 0.05, ***p < 0.001) of axons from the MLF (A) and CVLM (B). Axons in lamina X were comparatively significantly rich in GABA for both descending system populations. Each purple bar represents 100 µm X 100 µm scan fields containing an averaged number of labelled axon terminals containing GABA per total terminals within the indicated laminar region. Standard error bars shown. N = 3 animals. (A) MLF, 2421 terminals examined (B) CVLM, 3923 terminals examined.

97
Figure 3.16. Volumetric densities of axons from the MLF and CVLM containing both inhibitory amino acids across laminae Kruskal-Wallis with Dunn’s multiple comparison post hoc compared medians (p > 0.05) of axons from the MLF (A) and CVLM (B). Lamina X axonal populations for both descending systems were comparatively rich in amino acids although differences across laminar boundaries were not significant. There was considerably variability of inhibitory axonal densities in intermediate laminae VI and VII. Each blue bar represents 100 µm X 100 µm scan fields containing an averaged number of labelled axon terminals doubled labelled for both GlyT2 and GAD67 per total terminals within the indicated laminar region. Standard error bars shown. N = 3 animals. (A) MLF, 2421 terminals examined (B) CVLM, 3923 terminals examined.

98
3.3.4 Aim 4: To determine if medullary axons projecting to lower lumbar spinal cord segments contain serotonin
To determine if medullary axon terminals contained 5-HT, in two separate
immunoreactions from three animals, sections with terminals from MLF were
reacted with a combination of antibodies against CTb, [VGLUT1+VGLUT2] and 5-HT
and further sections were reacted with CTb, VGAT and 5-HT (Table 3.1). A total of
80 immunofluorescent terminals were examined with no evidence of the presence
of 5-HT in terminals (Figure 3.17). Further, sections with terminals from the CVLM
from one animal were reacted with antibodies against CTb and 5-HT. All examined
terminals were negative for 5-HT (Figure 3.18). Although medullary axons were
hypothesised to express 5-HT, these terminals were uniformally non-reactive to
antibody against 5-HT.

99
Figure 3.17. Immunofluorescent axons from the MLF and serotonin
Immunoreactive CTb terminals (A & E, red) from the MLF were reacted with antibodies against 5-HT (B & F, green) and VGAT (C, blue) and a mixture of VGLUT1+VGLUT2 (G, blue) denoted by black-dotted pointers. Negative CTb terminals were denoted by white pointers. All terminals were negative for 5-HT as shown in merged panels (D & H) in single optical planes.

100
Figure 3.18. Immunofluorescent axons from the CVLM and serotonin Immunoreactive CTb terminals from the CVLM (A) were reacted with 5-HT (B) and all terminals were negative for 5-HT as shown in the merged panel (C) in single optical planes.
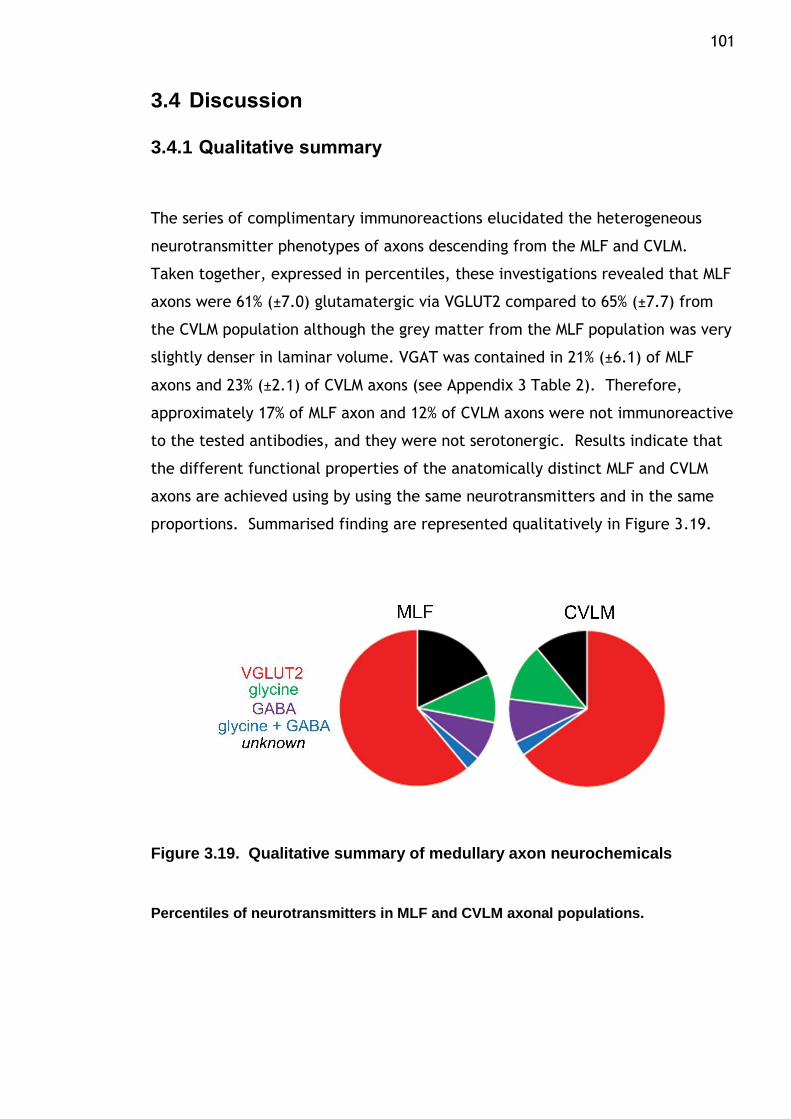
101
3.4 Discussion
3.4.1 Qualitative summary
The series of complimentary immunoreactions elucidated the heterogeneous
neurotransmitter phenotypes of axons descending from the MLF and CVLM.
Taken together, expressed in percentiles, these investigations revealed that MLF
axons were 61% (±7.0) glutamatergic via VGLUT2 compared to 65% (±7.7) from
the CVLM population although the grey matter from the MLF population was very
slightly denser in laminar volume. VGAT was contained in 21% (±6.1) of MLF
axons and 23% (±2.1) of CVLM axons (see Appendix 3 Table 2). Therefore,
approximately 17% of MLF axon and 12% of CVLM axons were not immunoreactive
to the tested antibodies, and they were not serotonergic. Results indicate that
the different functional properties of the anatomically distinct MLF and CVLM
axons are achieved using by using the same neurotransmitters and in the same
proportions. Summarised finding are represented qualitatively in Figure 3.19.
Figure 3.19. Qualitative summary of medullary axon neurochemicals
Percentiles of neurotransmitters in MLF and CVLM axonal populations.

102
3.4.2 Labelling of descending systems
CTb has been used extensively as a retrograde tracer but is also sequestered by
cells and axons (Chen and Aston-Jones, 1995) such that CTb may be transported
anterogradely as well as retrogradely (Ericson and Blomqvist, 1988). As with
other tracers, CTb may be taken up by axons of passage in the CNS (Chen and
Aston-Jones, 1995) and therefore the possibility that this tracer has
contaminated axons derived from cell sources beyond the intended target area
of injection cannot be excluded. This may be especially likely with MLF
injections since fibres from the VST (Nyberg-Hansen and Mascitti, 1964, Wilson
and Peterson, 1978) and the tectospinal tract (Petras, 1967) also descend into
this region although medial VST axons in rat terminate in the cervical dorsal
horn (Bankoul and Neuhuber, 1992). So a consideration for MLF injections is
that, in addition to RetS axons, spinoreticular cells were also labelled
retrogradely and their collateral axons may have contaminated these findings.
However, another study using a very sensitive method for revealing CTb reported
that retrogradely transported CTb is detected in cell bodies and proximal
dendrites but not in axons or fibre bundles (Angelucci et al., 1996).
3.4.3 Identification of neurotransmitter phenotypes
The discovery of VGLUT1 and VGLUT2 and the production of specific antibodies
against them have been proven to be a reliable method for identifying axon
terminals that contain glutamate. ICC localisation of glutamate, glutaminase, or
the expression of reuptake transporters for excitatory amino acids has been used
to reliably identify glutamatergic axons projecting to the spinal cord (Alvarez et
al., 2004, Oliveira et al., 2003, Persson et al., 2006, Todd et al., 2003, Varoqui
et al., 2002). In the spinal cord, most large diameter myelinated primary
afferent axons contain VGLUT1 whereas terminals of spinal interneurons contain
VGLUT2 (Todd et al., 2003, Varoqui et al., 2002). Although this information
indicates the source of excitatory terminals in the spinal cord, further studies
have found that other descending axons contain VGLUT1 and VGLUT2 (Du Beau
et al., 2012). Based upon extensive electrophysiological findings in the cat,
most descending systems are known to monosynaptically excite their target
spinal neurons (see (Jankowska, 1992, Jankowska and Edgley, 2010).

103 The introduction of antibodies against VGAT provides a reliable method for
identifying inhibitory axon terminals since this transporter is found in both
glycinergic and GABAergic boutons (Chaudhry et al., 1998). Colocalisation of
glycine and GABA has been reported for many spinal interneurons and especially
in the dorsal horn (Todd and Spike, 1993). The results from this study indicate
that most inhibitory axons from both the MLF and CVLM are either purely
glycinergic or GABAergic. However, another study using fluorescent in situ
hybridization techniques found many spinally projecting neurons in the
ventromedial medulla contain mRNAs for both GlyT2 and GAD67 (Hossaini et al.,
2012). GAD exists as two isoforms with molecular masses of 65 and 67 kDa
(GAD65 and GAD67, respectively), which are encoded by independent genes
(Erlander et al., 1991). While both isoforms are present in most GABAergic
neurons in the rat CNS, GAD65 appears to specifically target membranes and
nerve endings, whereas GAD67 is more extensively distributed in cells (Feldblum
et al., 1995, Mackie et al., 2003). Both forms synthesise GABA, but GAD67 might
preferentially synthesise cytoplasmic GABA (Soghomonian and Martin, 1998).
Descending inhibitory mechanisms predominantly function via inhibitory
interneurons (Lundberg, 1982). Collective studies suggest that glycinergic
neurons in the ventral medial medulla may mediate motor atonia during REM
sleep (Hajnik et al., 2000, Holmes and Jones, 1994, Lai and Siegel, 1988, Lai and
Siegel, 1992, Morales et al., 2006, Schenkel and Siegel, 1989, Siegel et al., 1991)
although recent studies in rats have challenged this idea (Lu et al., 2000) as
normal REM atonia has been reported after lesioning the medial medulla in rats
(Lu et al., 2008).
The MLF injection sites included the raphé obscuris which is known to project to
the intermediate grey matter and the ventral horn (Bowker et al., 1981b) yet
none of the labelled axons contained 5-HT. The most plausible explanation is
that most raphé spinal axons are unmyelinated (Westlund et al., 1992) and
therefore may not sequester the CTb tracer. However, cells containing 5-HT
have successfully been retrogradely traced with CTb (Tanaka et al., 2006) so this
discrepancy may be due specifically to the anterograde transport of CTb.
104 A proportion of RetS axons were not labelled by the markers used in this study
(Figure 3.19). Possible explanations are that these terminals contain another
transmitter not tested for or they are glutamatergic as unmyelinated primary
afferents expressing neither VGLUT1 nor VGLUT2 (Todd et al., 2003). These
terminals plausibly may contain VGLUT3, a transporter present in raphé spinal
axons that project to sympathetic regions of the spinal cord (Nakamura et al.,
2005a).
The inhibitory actions of the RetST in nocioceptive pathways associated with the
discrimination of painful stimuli are well documented (Fields and Basbaum,
1978) and many of these systems use monoaminergic transmitters which are
known to depress peripheral inputs to many premotor interneurons (Dougherty
et al., 2005) and may play a role in sculpting motor movements. So as the
neurochemical profiles of neurons from these reticular components overlap,
their diverse functional roles may be indistinct too (see Mason, 2001). Most
actions of descending systems are mediated via interneurons (Jankowska, 1992)
and these systems are crucial in the selection of motor patterns by influencing
interneuronal activities.

105
4 Chapter 4. Axon terminals descending from the sensorimotor cortex and their neuronal targets in lower lumbar spinal cord segments
106
4.1 Introduction
Phylogenetically advanced species must have sophisticated motor pathways
linking supraspinal motor centres with the spinal cord. Unlike brainstem motor
pathways which are well developed at birth, the CS pathway is not (Kudo et al.,
1993, Martin et al., 1980). Each cortical neuron is uniquely receptive with a bias
towards the somatosensory modality (Houk et al., 1993) which indicates that a
variety of sensorimotor combinations are represented in the motor cortex
initiating appropriate limb movements (Houk, 1989). The motor cortex may
function to select specific motor commands by filtering sensory information
discriminately and also by coordinating the activities of other descending
systems related to the control of distal and proximal muscles (Canedo, 1997).
Compared to other descending pathways, the CST is highly collateralised which
accounts for why the CST can mediate more fractionated types of movements
that characterise distal extremities (Kuypers, 1981). Although the CST is
classically considered a crossed pathway, ipsilateral projections in the
lumbosacral enlargement are considered potentially significant in terms of
understanding the repercussions of cortical or spinal lesions (see Jankowska and
Edgley, 2006).
The vertebrate CNS is exposed to a continual barrage of afferent impulses from
various sensory organs such that overall information-processing capabilities are
exceeded. The central control of information flow in peripheral afferents seems
to play an important role in generating integrated movements and the
processing of sensory information, including nociceptive information. CS axons
descending to the dorsal horn are an important source of presynaptic inhibition
of primary afferent fibres (Canedo, 1997, Wall and Lidierth, 1997) and the CST
may allow gating or filtering of sensory afferent input associated with volitional
motor commands (Lemon, 2008). Sensory neurotransmission from primary
afferents onto spinal neurons appears to be principally mediated by glutamate.
For this reason, considerable attention has been directed to the identification of
glutamatergic markers in the spinal cord, especially in relation to sensory
afferents. While both VGLUT1 and VGLUT2 have been reported to be contained
in terminals of glutamatergic neurons and in the spinal cord, only large diameter
primary afferents contain VGLUT1 (Alvarez et al., 2004, Oliveira et al., 2003,
Persson et al., 2006, Todd et al., 2003).
107 The synaptic interconnections between afferent fibres and their interneuronal
targets in the dorsal horn of the rat are complex (Rudomin and Schmidt, 1999).
In terms of motor behaviour, excitatory and inhibitory interneurons that are
activated by primary afferents clearly play different roles (Aggelopoulos et al.,
1996, Holmqvist and Lundberg, 1959, Holmqvist and Lundberg, 1961) and a
fundamental goal is to characterise their neuronal targets, input properties and
morphologies. The spinal cord contains several classes of ChAT interneurons
with proposed roles in sensory processing and motor output (Barber, 1984, Huang
et al., 2000, Phelps et al., 1984). Spinal circuits dedicated to the control of
motor output are constructed from a complex array of interneuron subtypes
(Bannatyne et al., 2009, Jankowska, 2001) that derive from cardinal progenitor
domains (Goulding, 2009, Jessell, 2000), implying that a single progenitor
domain gives rise to multiple subclasses of adult interneurons (Zagoraiou et al.,
2009). The activation of cortical systems expressing ChAT modulate sensory
thresholds, states of attention and the consolidation of memory (Giocomo and
Hasselmo, 2007, Lawrence, 2008, Pauli and O'Reilly, 2008). Within the spinal
cord, innervation by ChAT is apparently intrinsic rather than derived from the
brain (Sherriff et al., 1991) or from the periphery (Barber, 1984).
Spinal interneurons are currently classified according to their synaptic inputs as
well as their ability to modulate motoneuron firing (Jankowska, 1992).
Therefore, the mechanisms that select specific synaptic inputs onto interneurons
are of key interest. Adult interneurons may acquire their pattern of connectivity
by the loss or weakening and/or the gain or strengthening of specific synaptic
inputs during development (Mentis et al., 2006). The pruning of synaptic inputs
plays important roles in shaping adult connectivity in many parts of the CNS
(Crepel et al., 1976, Katz and Crowley, 2002, Katz and Shatz, 1996, Kim and
Kandler, 2003, Shatz, 1983) yet the mechanisms determining these patterns of
synaptic connections onto spinal interneurons are uncertain (Mentis et al.,
2006). Because of the enormous diversity in distinct presynaptic neuronal
subtypes and the fact that cell bodies can be distantly located from their
interconnected neurons, investigating the organisation of overall connectivity
patterns can be a challenging task (Stepien et al., 2010).
108 Neurons and circuits that process cutaneous sensory input are concentrated in
the dorsal horn whereas circuits involved in proprioception and motor control
are largely confined ventrally. How spinal neurons are allocated in the cord is
dependent on signalling systems that intersect along the rostrocaudal and
dorsoventral axes, establishing a grid-like set of positional cues (Jessell, 2000).
Signalling along the rostrocaudal axis establishes the main subdivisions of the
CNS (Jessell, 2000, Lumsden and Krumstauf, 1996). Anatomical evidence
indicates that neurons extend their dendrites to allow for potential synaptic
connections (Stepanyants and Chklovskii, 2005) and it is proposed that dendrites
and axons are ideally matched to anatomically maximize connections to their
potential connection partners (Cuntz, 2012) and theoretical predictions from
optimality criteria are congruent with this idea (Wen and Chklovskii, 2008). For
dendritic and axonal processes, wiring principles and branching patterns are
certainly intertwined (Chklovskii and Koulakov, 2004, Cuntz et al., 2007, Wen
and Chklovskii, 2008). Further, branching patterns can actually be predicted
(Cuntz et al., 2010) such that a direct link between specific patterns of synaptic
connectivity to the corresponding dendritic tree emerges (Cuntz, 2012) although
the diverse factors that determine the number of axons innervating any single
neuron are largely unknown (Purves and Hume, 1981). To some degree,
dendritic processes appear to specified at early development stages (Banker and
Cowan, 1979, Honig and Hume, 1986, Kriegstein and Dichter, 1983) although
dendritic processes are influenced too by extrinsic factors, especially neural
connections (Benes et al., 1977, Deitch and Rubel, 1984b, Sumner and Watson,
1971).
It is hypothesised that axons from the sensorimotor cortex will express VGLUT1
and terminate dorsally in lower lumbar spinal cord segments. CST axons are
expected to contact ChAT interneurons, principally in dorsal laminae. The
orientation of ChAT dendrites is hypothesised to correlate to their input
densities. In order to investigate descending sensorimotor axons in the cord and
their neuronal targets, a series of immunoreactions were conducted with
subsequent analyses. The following experiments addressed the following aims:
109 To determine the distribution of anterogradely labelled axon terminals
descending from the sensorimotor cortex within lower lumbar spinal cord
segments
To identify the neurotransmitter phenotype of CST axons in lower lumbar
segments
To investigate immunoreactive contacts onto ChAT interneurons receiving
input from the CST across laminar boundaries
To classify ChAT interneurons dendritic orientations as related to their
contact densities
4.2 Methods
4.2.1 Image acquisition and analyses
For the following series of experiments, spinal cord tissue from nine rats
receiving CTb injections into the sensorimotor cortex were processed for
analyses (Appendices 1 Figure 3). The neurotransmitter content of CST axons
was establishing using ICC techniques with subsequent confocal microscopy and
analyses. Laboratory techniques, image acquisition and statistical analyses were
congruent with methods as outlined in Chapters 2 and 3.
For the analyses of interneuronal targets of the CST, datum was the number of
immunoreactive terminals per mean contact surface density (1,000 µm2) across
defined spinal laminar regions. To represent the horizontally stacked laminae in
the transverse plane, bar graphs are displayed horizontally while bar graphs from
the experiment conducted in the parasagittal plane are represented vertically.
To analyse findings, the a priori D'Agostino & Pearson omnibus normality test
revealed that experimental data did not assume a Gaussian distribution.
Therefore the nonparametric Kruskal-Wallis test compared medians of sampled
data with Dunn’s multiple comparison’s post hoc to test the differences between
the neurochemical content of boutons contacting interneurons across laminar
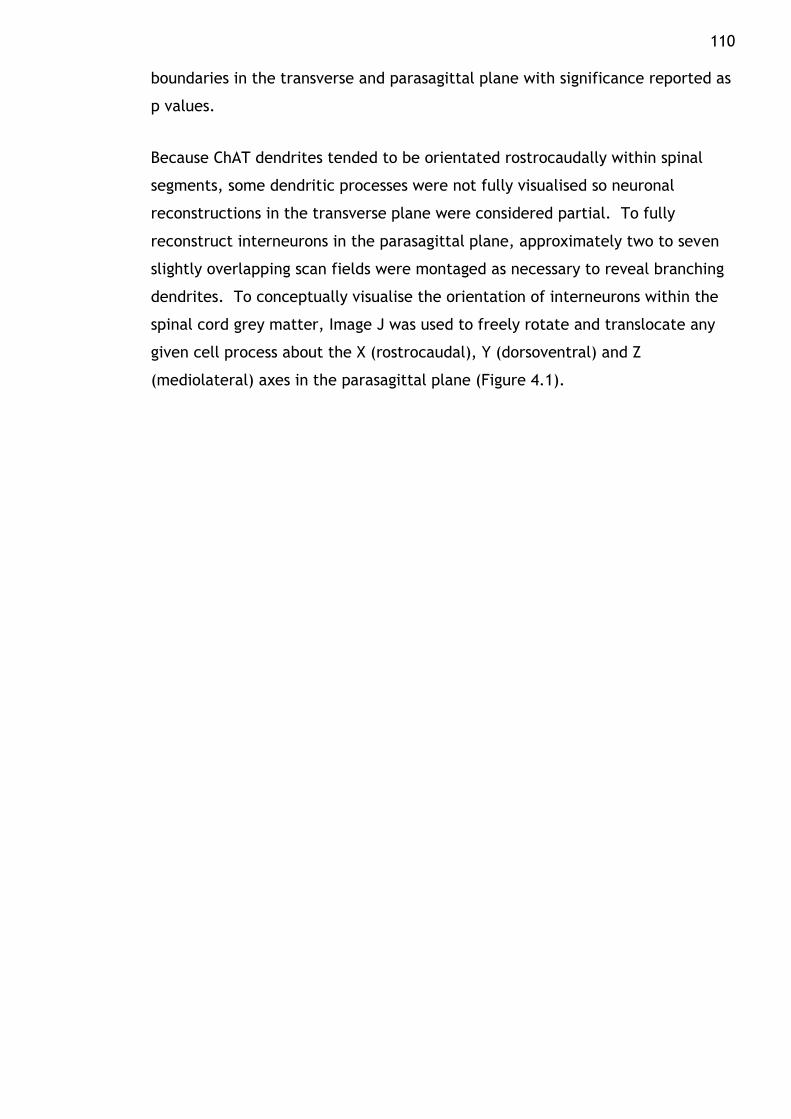
110 boundaries in the transverse and parasagittal plane with significance reported as
p values.
Because ChAT dendrites tended to be orientated rostrocaudally within spinal
segments, some dendritic processes were not fully visualised so neuronal
reconstructions in the transverse plane were considered partial. To fully
reconstruct interneurons in the parasagittal plane, approximately two to seven
slightly overlapping scan fields were montaged as necessary to reveal branching
dendrites. To conceptually visualise the orientation of interneurons within the
spinal cord grey matter, Image J was used to freely rotate and translocate any
given cell process about the X (rostrocaudal), Y (dorsoventral) and Z
(mediolateral) axes in the parasagittal plane (Figure 4.1).
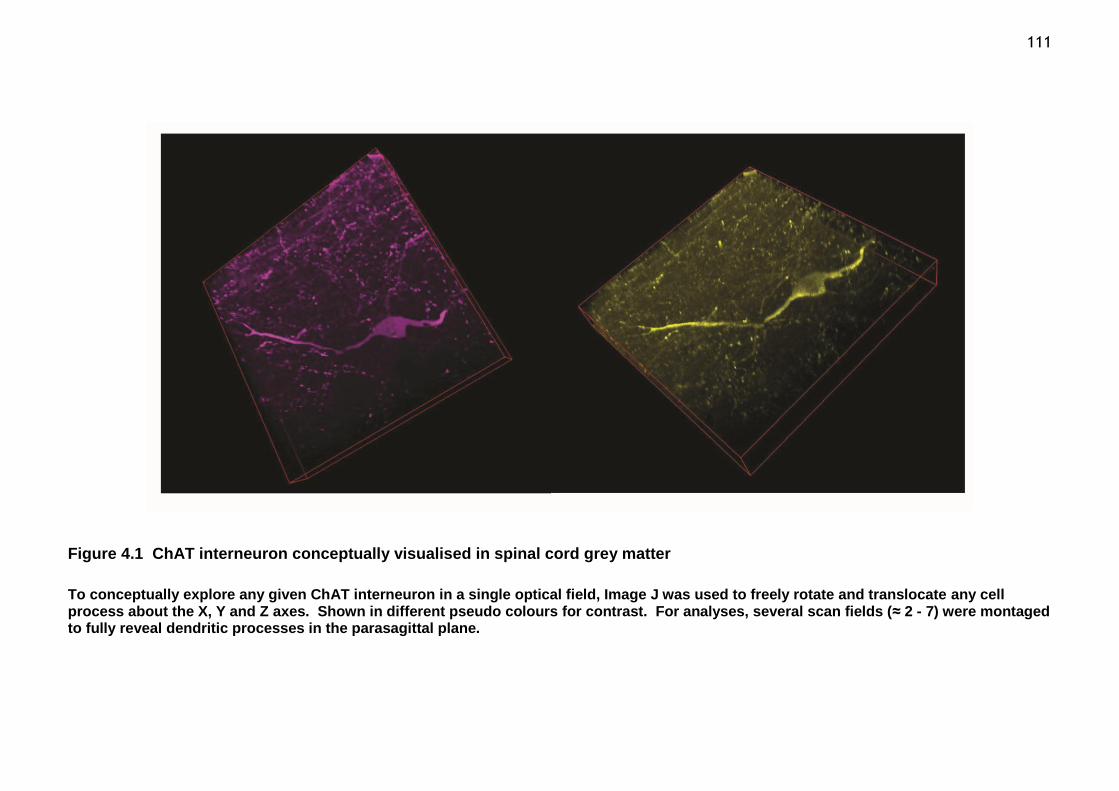
111
Figure 4.1 ChAT interneuron conceptually visualised in spinal cord grey matter
To conceptually explore any given ChAT interneuron in a single optical field, Image J was used to freely rotate and translocate any cell process about the X, Y and Z axes. Shown in different pseudo colours for contrast. For analyses, several scan fields (≈ 2 - 7) were montaged to fully reveal dendritic processes in the parasagittal plane.

112
4.2.2 Laminar boundaries in the parasagittal plane
Standard transverse templates based upon Molander’s scheme are conventionally
used to accurately locate neurons within spinal cord laminae of rat. Transverse
templates are advantageous since they can be applied uniformly and consistently
to all sections within a given lumbar segment since the spinal cord is shaped as
an elliptical tube (see Figure 2.5). Conversely, for parasagittally sectioned
segments, each cut section is different and there was no applicable consensual
template and thus laminar boundaries were undefined. Based upon standard
transverse templates, I derived laminar boundary maps for L3, L4 and L5
segments cut in the parasagittal plane at 120 µm increments and intermediate
60 µm increments can be readily inferred as well. A square grid was
superimposed over standard transverse template. Scaled ‘cuts’ at 120 µm
increments represent how the segment is sectioned from the midline (central
canal), which lies flat against the Vibratome chuck. Coordinates were plotted
along the vertical axes corresponding to the transverse laminar boundaries and
then extrapolated into the parasagittal plane as horizontal lines. To accurately
determine the laminar location of interneurons, these parasagittal templates
served as ‘maps’ of the scanned images and scaled semi-opaque templates were
overlaid onto scanned images as necessary (Figure 4.2).

113

114
Figure 4.2 Laminar boundary maps in the parasagittal plane
An exemplary L4 transverse template hemisphere (based on Molander et al., 1984) is shown (A) with a superimposed square grid at 120 µm increments designated as ‘cuts’ such that Cut 1 is 120 µm from the midline, Cut 2 is 240 µm and so on. As an example of the established laminar maps, Cuts 3, 6 and 8 are highlighted (red narrow vertical rectangles) with the plotted transverse coordinates extrapolated into the parasagittal plane as shown in B, C and D, respectively, shown as blue horizontal lines. Sections were notched caudal-ventrally, indicated by the corner grey triangles, to accurately orientate the sections mounted onto slides. Note that Cut 8 (D) approaching the lateral edge of the cord, for example, is comprised of a sizable proportion of white matter surrounded by lamina III dorsally and lamina VII ventrally on this mounted section.

115
4.2.3 Stereological techniques to examine neuronal targets
Stereological analyses were performed on ChAT interneuron reconstructions
exported from Neuroexplorer using Image J. Dendritic branching patterns of
ChAT interneurons were assessed as XY Ratios in the parasagittal plane. A
rectangle was drawn around each scaled neuron to exactly and entirely
encompass all dendritic branches where the X axis was the rostrocaudal
dimension and the Y axis was the dorsoventral dimension. For any imaginary
neuron in the parasagittal plane, if the X and Y axes were equal such that all
dendritic branches were fully contained within a square, then the dimensionless
XY Ratio was one. By definition, rostrocaudally orientated neurons had an XY
Ratio greater than one and dorsoventrally orientated neurons had an XY Ratio
less than one (Figure 4.3).
To describe the orientation of dendritic branching relative to the soma in the
parasagittal plane, the geometric centres of both the entire interneuron and the
soma were located. Connecting these two centres established a vector with four
direction possibilities: dorsocaudal, dorsorostral, ventrorostral or ventrocaudal.
That is, dendrites were determined to be predominantly situated towards a
given anatomical direction (Figure 4.4).
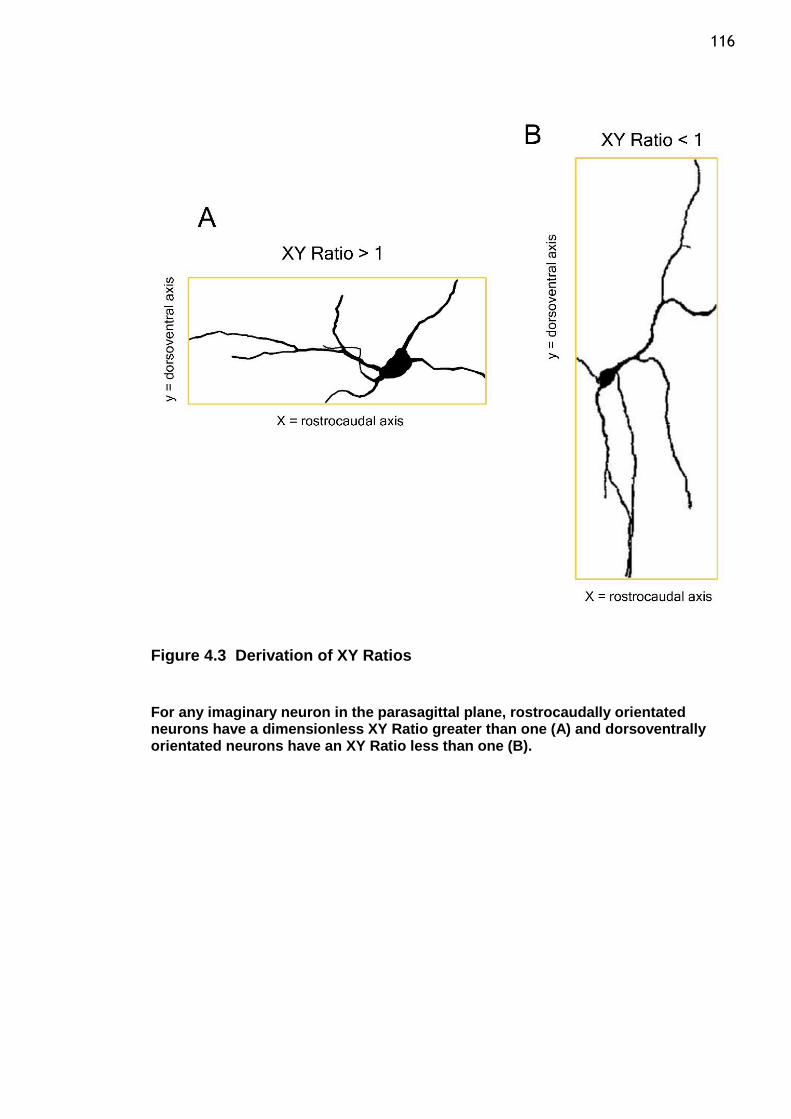
116
Figure 4.3 Derivation of XY Ratios
For any imaginary neuron in the parasagittal plane, rostrocaudally orientated neurons have a dimensionless XY Ratio greater than one (A) and dorsoventrally orientated neurons have an XY Ratio less than one (B).

117
Figure 4.4 Dendritic orientation in the parasagittal plane
To find the dendritic orientation for any imaginary neuron in the parasagittal plane (A), all dendritic branches were encompassed within a rectangle and the geometric centre of neuronal processes was located as indicated by the gold dot (B) and similarly for the soma (C). By connecting these two centres, there are four possible anatomical directions: dorsocaudal, dorsorostral, ventrorostral or ventrocaudal. The dendritic orientation of this neuron is dorsocaudal as indicated by the vector arrow (C). That is, dendrites were predominantly situated towards the dorsocaudal axis relative to the soma in this example.

118
Table 4.1 Summary of primary and secondary antibody combination and concentrations DAB was used as a substrate to CTb visualise staining. All secondary antibodies were raised in donkey and conjugated to biotin, Rh Red, Dyl 649 (supplied by Jackson ImmunoResearch, West Grove, USA) or Alexa 488 (supplied by Molecular Probes, Eugene, USA). Avidin HRP and DAB supplied by Sigma-Alrich, Dorset, UK. Antibody labelling: CTb, traces myelinated axons; VGLUT1 and VGLUT2, synaptic vesicles; VGAT, glycinergic and GABAergic synaptic vesicles; ChAT, cholinergic neuronal processes.
119
4.3 Results
4.3.1 Aim 1: To determine the distribution of axon terminals descending from the sensorimotor cortex within lower lumbar spinal cord segments
Injection sites to label the CST targeted the primary and secondary motor cortex
and the adjacent primary sensory cortex (Figure 4.5). Labelled terminals in the
grey matter of the lumbar spinal cord were most numerous in dorsal laminae I -
VI contralateral to the injection site and were especially concentrated medially
near lamina IV. Fewer terminals were present in lamina VII and only rarely were
found in the ventral horn. Occasionally very sparse terminations were found
within the ipsilateral intermediate grey matter (Figure 4.6). The predominantly
dorsal location of labelled CST axons in spinal laminae is congruent with the
hypothesis although a considerable number of terminals were found to populate
intermediate laminar regions also.
4.3.1.1 Location of cholinergic neurons in the transverse plane
Input properties of populations of ChAT interneurons analysed in the following
experiments included small dorsal horn neurons especially located in the
laminae III - V region, partition neurons in the lamina VII region and central
canal neurons within lamina X (Figure 4.7).
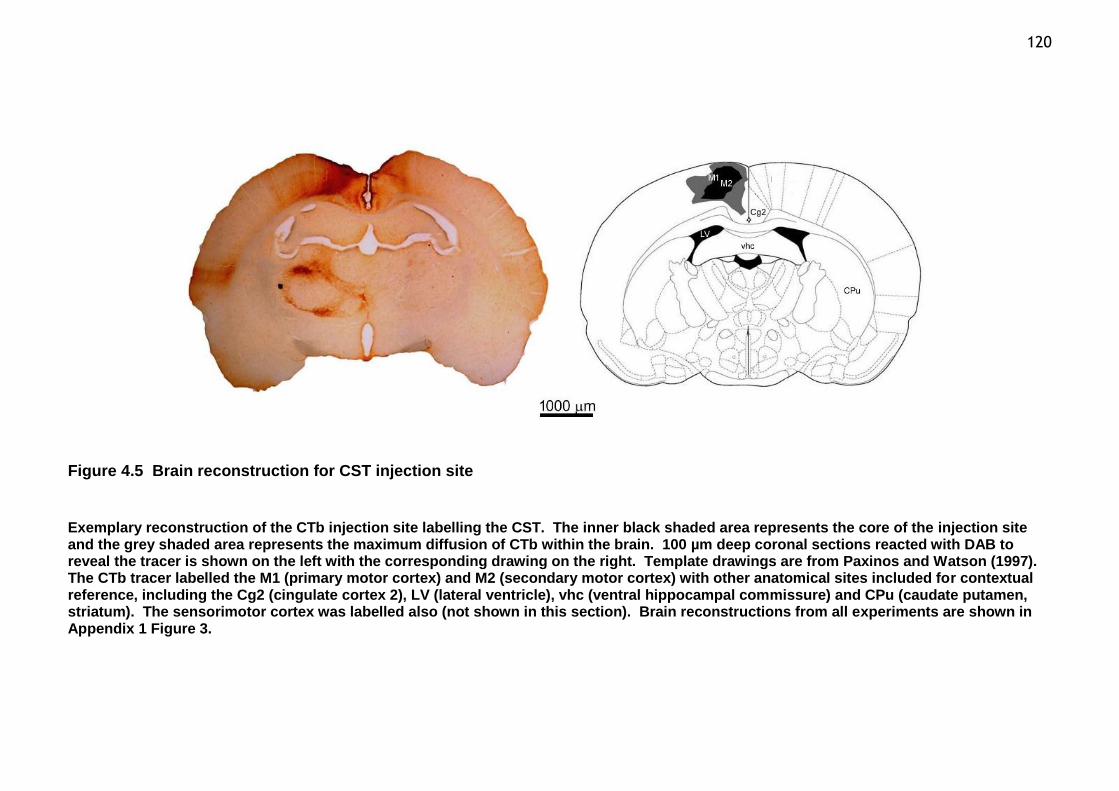
120
Figure 4.5 Brain reconstruction for CST injection site
Exemplary reconstruction of the CTb injection site labelling the CST. The inner black shaded area represents the core of the injection site and the grey shaded area represents the maximum diffusion of CTb within the brain. 100 µm deep coronal sections reacted with DAB to reveal the tracer is shown on the left with the corresponding drawing on the right. Template drawings are from Paxinos and Watson (1997). The CTb tracer labelled the M1 (primary motor cortex) and M2 (secondary motor cortex) with other anatomical sites included for contextual reference, including the Cg2 (cingulate cortex 2), LV (lateral ventricle), vhc (ventral hippocampal commissure) and CPu (caudate putamen, striatum). The sensorimotor cortex was labelled also (not shown in this section). Brain reconstructions from all experiments are shown in Appendix 1 Figure 3.

121
Figure 4.6 Distribution of labelled terminals from the CST
Labelled terminals in the lumbar cord were revealed with DAB shown on the left. The notch is ipsilateral relative to the injection site (notch not visible in L5 section). The drawings on the right show the distribution of terminals superimposed onto standard L3, L4 and L5 transverse sections (based on Molander et al., 1984). Terminals were plotted from 60 µm thick sections.
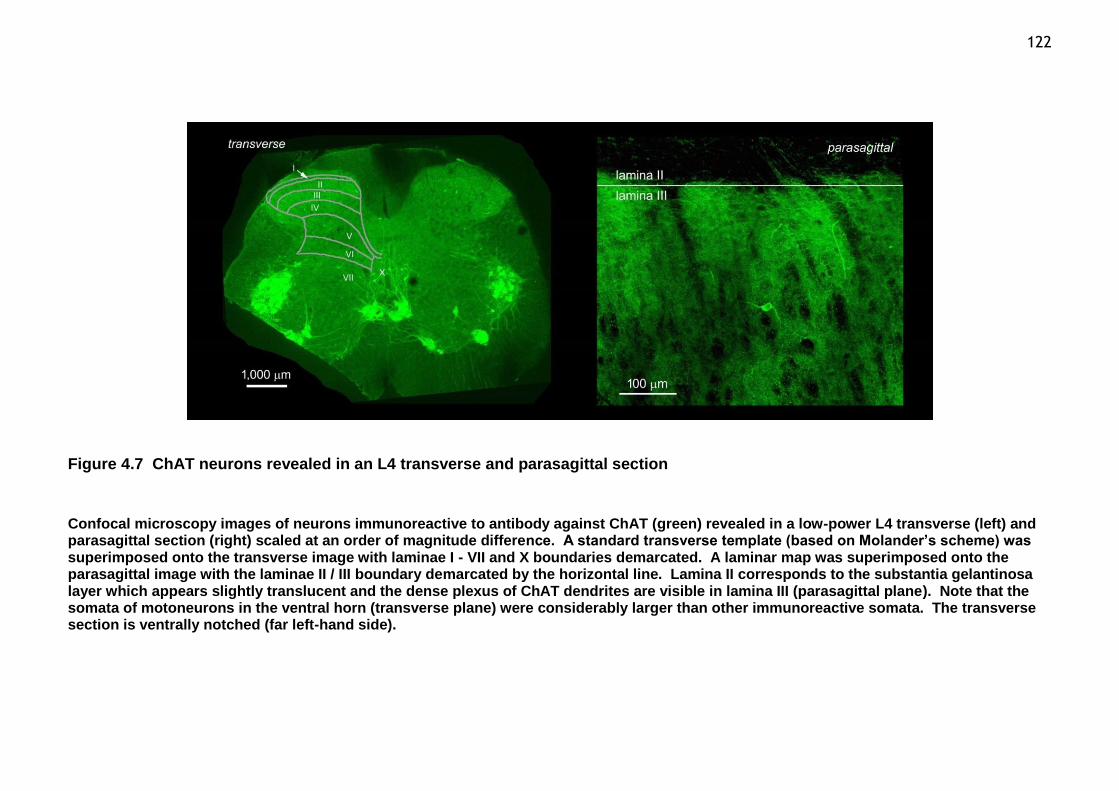
122
Figure 4.7 ChAT neurons revealed in an L4 transverse and parasagittal section
Confocal microscopy images of neurons immunoreactive to antibody against ChAT (green) revealed in a low-power L4 transverse (left) and parasagittal section (right) scaled at an order of magnitude difference. A standard transverse template (based on Molander’s scheme) was superimposed onto the transverse image with laminae I - VII and X boundaries demarcated. A laminar map was superimposed onto the parasagittal image with the laminae II / III boundary demarcated by the horizontal line. Lamina II corresponds to the substantia gelantinosa layer which appears slightly translucent and the dense plexus of ChAT dendrites are visible in lamina III (parasagittal plane). Note that the somata of motoneurons in the ventral horn (transverse plane) were considerably larger than other immunoreactive somata. The transverse section is ventrally notched (far left-hand side).

123
4.3.2 Aim 2. To identify the neurotransmitter phenotype of CST axons in lower lumbar segments
To investigate the neurochemical properties of glutamatergic terminals
descending from the CST, sections from three animals were reacted with a
combination of antibodies against CTb, VGLUT1 and VGLUT2 (Table 4.1). A total
of 1227 axon terminals from the CST within the grey matter of lower lumbar
segments were analysed. Congruent with the hypothesis, VGLUT1 was contained
in 98.99% (± 0.18) of labelled axons with a negligible VGLUT2 content of 1.01% (±
0.18) as shown (Appendix 4 Table 1).
To verify that CST axons were not immunoreactive to VGAT, section from three
animals were reacted with a combination of antibodies against CTb, VGAT and a
mixture of VGLUT1 and VGLUT2 raised in the same species (g. pig) such that
these two antibodies reacted with the same secondary antibody (Table 4.1).
Throughout this chapter, this antibody mixture will be denoted as [VGLUT1 +
VGLUT2]. A total of 881 axons from the CST within the grey matter of lower
lumbar segments were analysed. [VGLUT1 + VGLUT2] was contained in 100% of
labelled axon with no VGAT present as shown (Appendix 4 Table 2).
Immunofluorescent confocal microscope images from these reactions are shown
(Figure 4.8).

124
Figure 4.8 Immunoreactive CST axon terminals
In single optical planes, immunoreactive CTb terminals (A) were positive for VGLUT1 (B) and negative for VGLUT2 (C) as shown in yellow in the merged image (D). Immunoreactive CTb terminals (E) were negative for VGAT (F) and positive for combined VGLUT1 and VGLUT2 (G) as shown in magenta in the merged panel (H). Note that all labelled terminals are glutamatergic.

125
4.3.3 Aim 3: To investigate immunoreactive contacts onto ChAT interneurons receiving input from the CST across laminar boundaries
4.3.3.1 Transverse plane
To investigate the neurochemical properties of contacts onto reconstructed
interneurons, transverse sections from three animals were reacted with a
combination of antibodies against CTb, VGLUT1 and ChAT (Table 4.1). A total of
63 reconstructed cells in the grey matter of lower lumbar segments were
examined (Appendix 4 Tables 3, 4, and 5). There were sparse descending inputs
from the sensorimotor cortex onto ChAT interneurons in the dorsal horn and
fewer in the intermediate laminae. A representative image from confocal
microscopy is shown (Figure 4.9).
The two sources of inputs onto ChAT interneurons were reported as total
VGLUT1 contacts and then CTb contacts containing VGLUT1 (CTb+VGLUT1).
ChAT interneurons were classified according to their laminar location and were
reported accordingly to their surface densities. ChAT interneurons received
more CST contacts in dorsal laminae I - V than those in the intermediate laminae
VI, VII and X (Figure 4.10).

126
Figure 4.9 CST inputs onto ChAT interneuron in the transverse plane
Cholinergic interneuron (green) in lamina X from a transverse section shown as a projected image. From the inset box, the right-hand side vertical panel detail in separate colour channels shows a dendrite receiving a VGLUT1+CTb contact (magenta) and two more distal VGLUT1 contacts (blue). All scale bars = 5 µm.

127
Figure 4.10 Neuronal densities of ChAT interneurons receiving CST input across transverse laminar boundaries
Cholinergic interneurons were classified according to their laminar location. Each coloured bar represents mean densities of interneurons populating dorsal and intermediate laminae as indicated along the Y axes, standard error bars shown. In the transverse plane, horizontal bars represent the horizontally stacked laminae based upon Molander’s scheme. Somata (A) and dendritic processes (B) in the dorsal horn received more CST contacts (magenta bars) than those in intermediate laminae and all processes received VGLUT1 contacts (blue bars). Lamina X received sparse innervation from the CST but VGLUT1 densities were significantly greater than in intermediate laminae. Kruskal-Wallis with Dunn’s multiple comparison’s post hoc (*p < 0.05, **p < 0.01, ***p < 0.001). N = 3 animals. Laminae I-V (15 cells): somata, 54 total VGLUT1 contacts and 37 CTb+VGLUT1 contacts; dendrites, 74 total VGLUT1 contacts and 58 CTb+VGLUT1 contacts. Laminae VI-VII (17 cells): somata, 32 total VGLUT1 contacts and 0 CTb+VGLUT1 contacts; dendrites, 43 total VGLUT1 contacts and 4 CTb+VGLUT1 contacts. Laminae X (32 cells): somata, 64 total VGLUT1 contacts and 3 CTb+VGLUT1 contacts; dendrites, 70 total VGLUT1 contacts and 3 CTb+VGLUT1 contacts.

128
4.3.3.2 Parasagittal plane
To further investigate the neurochemical properties of contacts onto
reconstructed interneurons in the parasagittal plane, the same antibody
combination (Table 4.1) was performed on tissue from three animals with
labelled CST axons. Dendritic processes from this experiment were fully
visualised for reconstruction with slightly greater sampling in intermediate zones
and therefore slightly larger somatic radii are reported. From this experiment, a
total of 35 fully reconstructed cells in the grey matter of lower lumbar segments
were examined (Appendix 4 Tables 6, 7, and 8) and a representative confocal
microscopy image is shown with an accompanying reconstruction (Figure 4.11).
ChAT interneurons received more CST contacts dorsally but unlike dendritic
processes investigated in the transverse plane, there were slightly more inputs
found on interneurons in intermediate laminae VI, VII and X. To compare results
between the transverse and parasagittal experiments, the axes representing
mean densities are scaled identically for dendritic processes and then for the
soma (Figures 4.12).
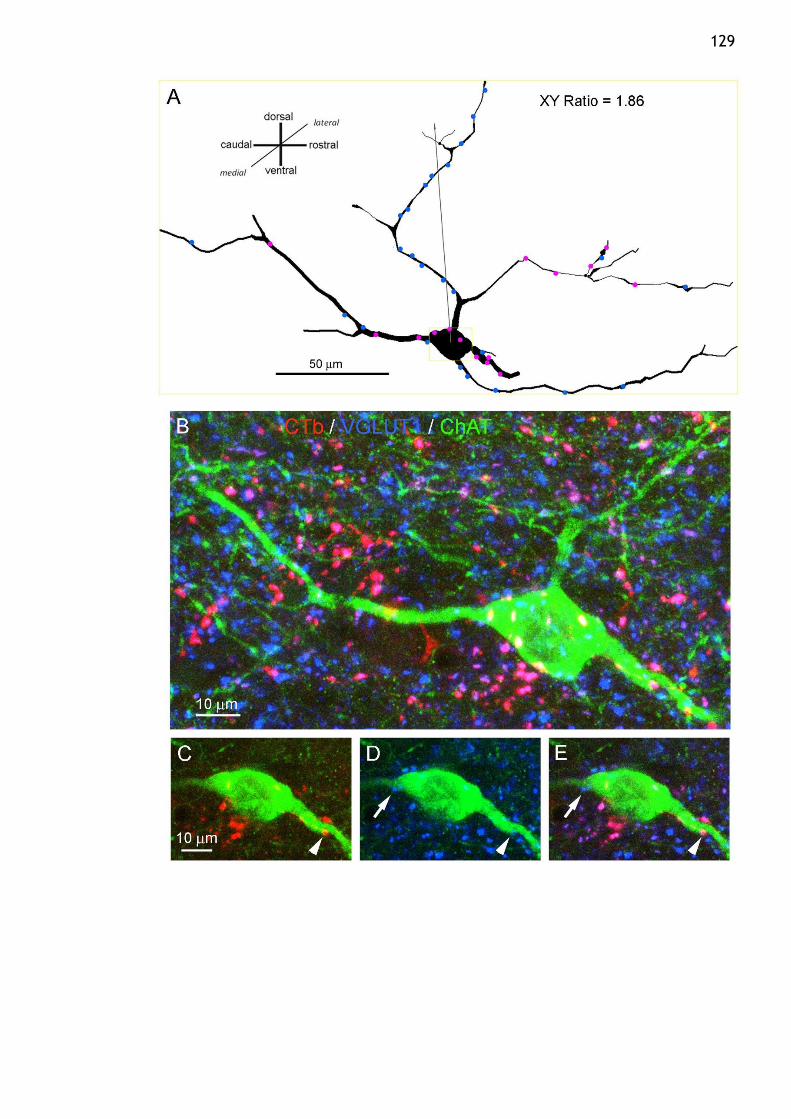
129

130
Figure 4.11 ChAT interneuron in laminae III / IV of an L4 spinal segment in the parasagittal plane
Three dimensional reconstruction in the parasagittal plane (A) with VGLUT1+CTb boutons (magenta) and VGLU1 boutons (blue) shown. The dimensionless XY Ratio relates the linear rostrocaudal (X) and dorsoventral (Y) parameters. The grey vector arrow denotes the dorsocaudal orientation, derived from the soma’s geometric centre to the interneuron’s geometric centre. Projected confocal microscope image (B) showing the neurochemical properties of the ChAT interneuron (green) receiving inputs descending from the CST (red) enriched with VGLUT1 (blue). In single optical planes, inset boxes show a CTb labelled terminal (C) and a VGLUT1 bouton (D). The merged image (E) shows this CTb marker coinciding with VGLUT1 (magenta) in three colour channels.

131
Figure 4.12 Neuronal densities of ChAT interneurons receiving CST input across parasagittal laminar boundaries
ChAT interneurons were classified according to their laminar location. Each coloured bar represents mean densities of interneuronal populations found in dorsal and intermediate laminae, standard error bars shown. In the parasagittal plane, vertical bars represent the stacked laminae based upon Molander’s scheme. Somata (A) and dendritic processes (B) in the dorsal horn received more CST contacts (magenta bars) than those in intermediate laminae and all processes received VGLUT1 contacts (blue bars). The CST targeted dendritic processes (B) in intermediate laminae and near the central canal rather than somata (A) with significantly greater contact densities. Kruskal-Wallis with Dunn’s multiple comparison’s post hoc (*p < 0.05, **p < 0.01, ***p < 0.001). N = 3 animals. Laminae I-V (12 cells): somata, 78 total VGLUT1 contacts and 19 CTb+VGLUT1 contacts; dendrites, 222 total VGLUT1 contacts and 48 CTb+VGLUT1 contacts. Laminae VI-VII (9 cells): somata, 33 total VGLUT1 contacts and 5 CTb+VGLUT1 contacts; dendrites, 95 total VGLUT1 contacts and 30 CTb+VGLUT1 contacts. Laminae X (14 cells): somata, 64 total VGLUT1 contacts and 7 CTb+VGLUT1 contacts; dendrites, 160 total VGLUT1 contacts and 23 CTb+VGLUT1 contacts.

132
4.3.4 Aim 4: Classification of ChAT dendritic orientations as related to their contact densities
To investigate the relationship of neuronal geometry to contact densities,
reconstructed ChAT interneurons were classified according to their predominant
dendritic orientation indicated by resultant vectors (Figures 4.13, 4.14 and
4.15). The population of dorsoventral cells (XY Ratio < 1) having dendrites
situated mostly dorsocaudally from their soma had greater total mean combined
contact density from VGLUT1 and VGLUT1+CTb (2.94 per 1,000 µm2 ± 0.83). In
comparison, dorsorostrally orientated cells had just slightly lesser mean
densities (1.76 per 1,000 µm2 ± 0.64). Ventrorostrally orientated cells (1.10 per
1,000 µm2 ± 0.39) and dendrites situated predominantly ventrocaudally had the
fewest mean contact densities (0.94 per 1,000 µm2 ± 0.17) (Appendix 4 Table 9).
For the population of rostrocaudal cells (XY Ratio > 1) with dendrites situated
mostly dorsocaudally from their soma had the greatest total mean combined
contact densities from VGLUT1 and VGLUT1+CTb (1.65 per 1,000 µm2 ± 0.78).
Dorsorostrally orientated cells had just slightly lower mean densities (1.36 per
1,000 µm2 ± 0.48), then ventrocaudally orientated cells (0.93 per 1,000 µm2 ±
0.47) and dendrites situated predominantly ventrorostrally had the least mean
contact densities (0.84 per 1,000 µm2 ± 0.64) (Appendix 4 Table 9). While the
mean contact densities of these stereologically defined populations did not
statistically differ significantly, a qualitative pattern was apparent upholding the
hypothesis that the geometric orientation of dendritic arbors relates to input
density (Figure 4.15).

133
Figure 4.13 Dendritic orientations of reconstructed ChAT interneurons in the parasagittal plane, Part I (Dorsal) Three dimensional reconstruction of ChAT interneurons in the parasagittal plane with VGLU1 boutons (blue) and VGLUT1+CTb boutons (magenta). Dimensionless XY Ratios and total contact densities with laminar locations are reported. To describe how dendritic branches were predominantly situated relative to their soma, there were four possible directional orientations (dorsocaudal, dorsorostral ventrocaudal, ventrorostral). Dorsocaudal (A) and dorsorostral (B) orientations are denoted by gold vector arrows.
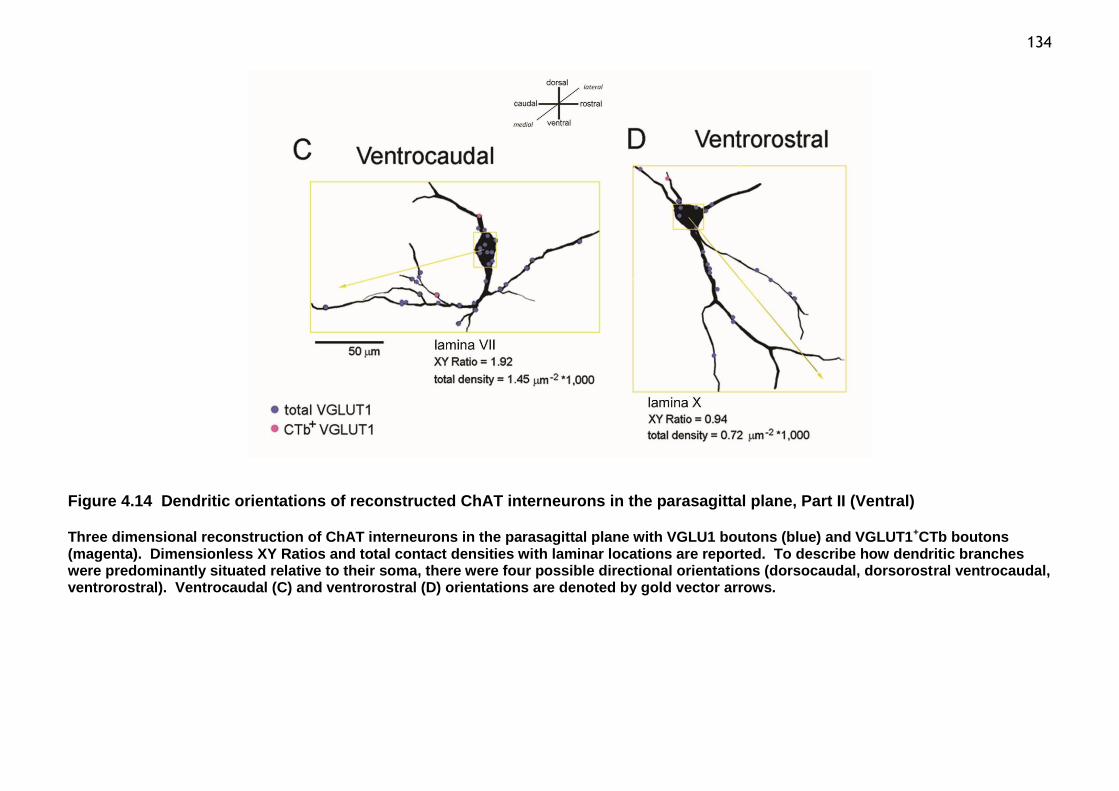
134
Figure 4.14 Dendritic orientations of reconstructed ChAT interneurons in the parasagittal plane, Part II (Ventral) Three dimensional reconstruction of ChAT interneurons in the parasagittal plane with VGLU1 boutons (blue) and VGLUT1+CTb boutons (magenta). Dimensionless XY Ratios and total contact densities with laminar locations are reported. To describe how dendritic branches were predominantly situated relative to their soma, there were four possible directional orientations (dorsocaudal, dorsorostral ventrocaudal, ventrorostral). Ventrocaudal (C) and ventrorostral (D) orientations are denoted by gold vector arrows.

135
Figure 4.15 Dendritic orientations relative to total contact density in the parasagittal plane
Two populations of ChAT interneurons (XY Ratio > 1, A or XY Ratio < 1, B) were further classified according to the predominant orientation of their dendritic branches. Interneurons having dendrites that branched predominantly dorsocaudally (black bars) had greater total mean contact densities while ventrorostrally and ventrocaudally dendritic arbors were lesser (paler grey bars). This relationship was not statistically significant but qualitatively consistent for both populations (A, B). Kruskal-Wallis with Dunn’s multiple comparison’s post hoc (ns > 0.05) for n = 3 animals. Standard error bars shown.

136
4.4 Discussion
4.4.1 Distribution of excitatory descending sensorimotor axons
The greatest density of anterogradely labelled CST terminals was in the dorsal
horn contralateral to the injection site, especially in laminae III - VI. While this
dorsal pattern of CST axon terminations was hypothesised, there were sparse
terminations found in the intermediate zone also, with considerably less in the
ventral horn. These findings are consistent with reports from similar studies
(Antal, 1984, Brown, 1971, Casale et al., 1988, Valtschanoff et al., 1993).
Numerous projections to the superficial dorsal horn were also found, which is
also consistent with previous observations (Casale et al., 1988). In rats the
principal crossed component descends within the dorsal region of the dorsal
white columns (Brosamle and Schwab, 1997, Liang et al., 1991), propagating
numerous collateral branches terminating in the dorsal horn and intermediate
zone grey matter. Observations from this study show the dorsal column region
was strongly labelled with the CTb tracer.
Findings from this ICC study demonstrates that the descending CST is
homogeneously excitatory via VGLUT1 as hypothesised. A negligible few labelled
terminals contained VGLUT2 and no terminals contained VGAT. Consistent with
observations from this study, VGLUT1 is known to be most abundant in laminae
III - IV and medial lamina V. The distribution pattern of axons containing
VGLUT1 supports the idea that this transporter is responsible for glutamatergic
uptake from cutaneous and muscle mechanoreceptors synapses (Alvarez et al.,
2004). Alvarez et al. (2004) reports that the interpretation of immunopositive
boutons is complicated because of the existence of significant metabolic pools of
glutamate and glutaminase that are unrelated to neurotransmission (De Biasi and
Rustioni, 1990, Storm-Mathisen et al., 1995). However, synaptic terminals of
spinal sensory afferents are strongly immunoreactive for glutamate, which
suggests a glutamatergic function (Broman, 1993, De Biasi and Rustioni, 1988, De
Biasi and Rustioni, 1990, Valtschanoff et al., 1994). VGLUT1 mRNA is also highly
expressed in the deep layers of the cerebral cortex where CST neurons are

137 located (Fremeau Jr et al., 2001, Ni et al., 1994). Then, the CST is an important
source of small VGLUT1 varicosities (Persson et al., 2006).
4.4.2 Neuronal targets of descending sensorimotor axon terminals
Results from the present ICC study provided insights into the distribution of
primary afferents and CST fibres contacting ChAT interneurons. The dorsal horn
population were all richly innervated by VGLUT1, the transporter associated
with large diameter myelinated primary afferents (Todd et al., 2003, Varoqui et
al., 2002). While the greatest VGLUT1 densities were found in dorsal horn
interneurons, the lamina X population notably received considerable VGLUT1
input as well. Across laminar boundaries, VGLUT1 contact densities varied
considerably less than did densities from the CST. Descending CST axons
sparsely contacted the population surrounding lamina X central canal cluster
cells. Data from earlier studies have indicated that primary sensory afferent
fibres excite ChAT interneurons and that ACh released by axon terminals of
these interneurons modulates sensory information via both pre- and postsynaptic
mechanisms (Ribeiro-da-Silva and Cuello, 1990a).
ChAT interneurons are likely components of an inhibitory feedback pathway
monosynaptically activated by primary afferents (Olave et al., 2002) and findings
from the present study suggest that the CST acts through ChAT interneurons to
influence the processing of incoming sensory information. Further, based upon
comprehensive findings from electrophysiological investigations in the cat, the
monosynaptic action of most descending systems onto their spinal target neurons
is excitatory (Jankowska, 1992). The classical form of presynaptic inhibition is
associated with primary afferent depolarisation, which is mediated by inhibitory
interneurons that form axo-axonic synapses with terminals of primary afferent
axons (Rudomin and Schmidt, 1999). Schmidt and collaborator have shown that
some pathways mediating primary afferent depolarisation are modality specific.
Such findings suggest that the ensuing presynaptic inhibition could play an
important role in sensory discrimination by eliminating surplus excitation (Jänig
et al., 1967, Rudomin and Schmidt, 1999). The pharmacological action of
powerful seizure-inducing GABA receptor antagonists, gabazine, picrotoxin, and
bicuculline, can radically alter primary afferent stimulation (Game and Lodge,

138 1975). Lesions of the CST cause a breakdown in fine sensorimotor control, which
implies a deterioration not only in motor function, but also in mechanisms of
sensory feedback (Lemon and Griffiths, 2005).
Consistent with findings from the present study, numerous ChAT interneurons
are known to populate the superficial dorsal horn, particularly lamina III (Barber,
1984, Borges and Iversen, 1986, Kimura et al., 1981, Phelps et al., 1984).
Dendrites are dense in lamina III with fibres and terminals concentrated slightly
deeper in laminae III - V (Phelps et al., 1984, Phelps et al., 1988). There is little
evidence to suggest that ACh itself is a primary afferent transmitter (Gwyn and
Flumerfelt, 1971, Karczmar et al., 1980) since, for instance, spinal cord
transection or neonatal capsaicin negligibly effects the expression of ChAT in the
dorsal horn (Holzer-Petsche et al., 1986). Although some descending systems
can have direct actions on motoneurons (Lemon, 2008) most of their actions are
mediated through interneurons (Jankowska, 1992).
Olave and others (2002) investigated the input of unmyelinated primary
afferents onto ChAT interneurons by injecting the transganglionic tract tracer
Bandeiraea simplicifolia isolectin b4 (IB4) into the sciatic nerve in rat. IB4
labels unmyelinated afferent fibres (Finkelstein et al., 1974, Ganser et al., 1983,
Goldstein and Winter, 1999, Scott et al., 1990, Trojanowski et al., 1982) by
binding predominantly to a subgroup of unmyelinated non-peptidergic primary
afferents (Silverman and Kruger, 1990). Primary afferents which bind IB4
formed contacts with ChAT interneurons and axons labelled with IB4 were found
to form an obvious plexus in lamina II. Many axons labelled with IB4 are likely to
respond to noxious stimuli (Fang et al., 2000) and ChAT cells are known to not
possess the substance P receptor (Naim et al., 1997). These findings are
congruent with observations that peptidergic afferents form sparse appositions
with ChAT cells (Olave et al., 2002).
Some of the inputs to lamina X central canal cluster cells may be derived from
primary afferents, since early Golgi studies (Scheibel and Scheibel, 1969) have
shown that primary afferent fibres terminate among neurons in lamina X
(Barber, 1984). Further, the results of physiological studies indicate that
neurons in this region respond with a short latency to action potentials in
modality specific cutaneous afferents (Honda and Perl, 1981). Descending CS
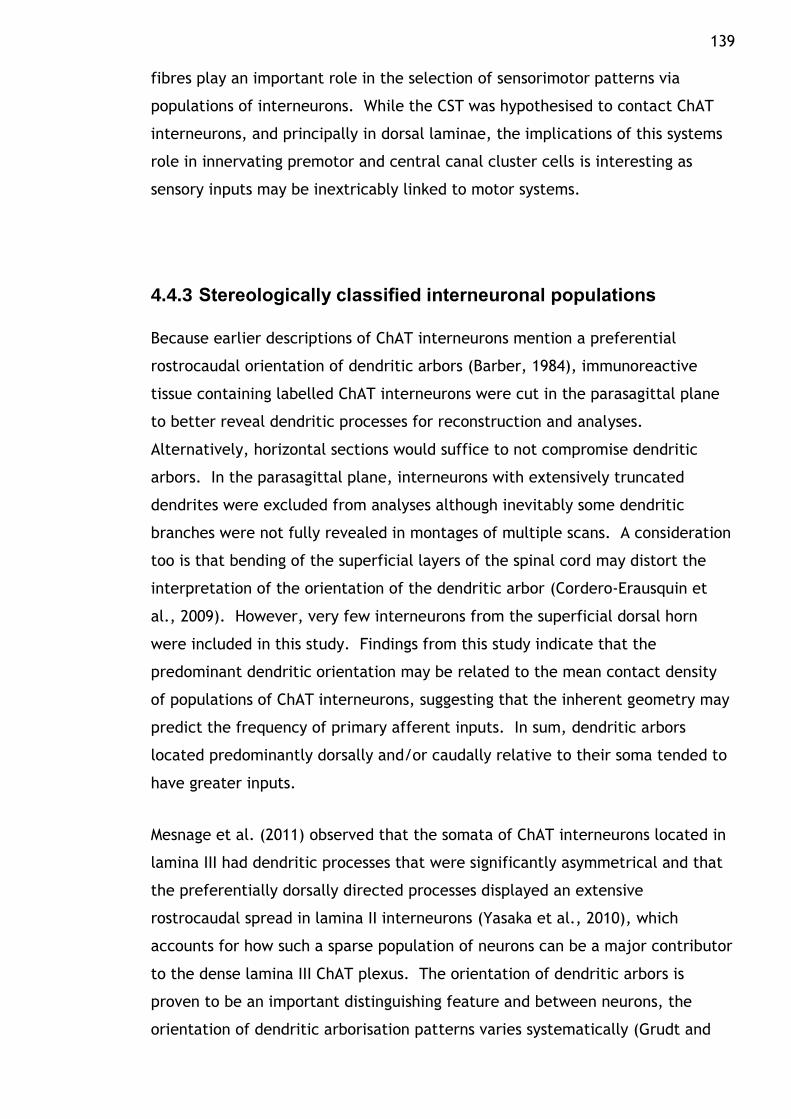
139 fibres play an important role in the selection of sensorimotor patterns via
populations of interneurons. While the CST was hypothesised to contact ChAT
interneurons, and principally in dorsal laminae, the implications of this systems
role in innervating premotor and central canal cluster cells is interesting as
sensory inputs may be inextricably linked to motor systems.
4.4.3 Stereologically classified interneuronal populations
Because earlier descriptions of ChAT interneurons mention a preferential
rostrocaudal orientation of dendritic arbors (Barber, 1984), immunoreactive
tissue containing labelled ChAT interneurons were cut in the parasagittal plane
to better reveal dendritic processes for reconstruction and analyses.
Alternatively, horizontal sections would suffice to not compromise dendritic
arbors. In the parasagittal plane, interneurons with extensively truncated
dendrites were excluded from analyses although inevitably some dendritic
branches were not fully revealed in montages of multiple scans. A consideration
too is that bending of the superficial layers of the spinal cord may distort the
interpretation of the orientation of the dendritic arbor (Cordero-Erausquin et
al., 2009). However, very few interneurons from the superficial dorsal horn
were included in this study. Findings from this study indicate that the
predominant dendritic orientation may be related to the mean contact density
of populations of ChAT interneurons, suggesting that the inherent geometry may
predict the frequency of primary afferent inputs. In sum, dendritic arbors
located predominantly dorsally and/or caudally relative to their soma tended to
have greater inputs.
Mesnage et al. (2011) observed that the somata of ChAT interneurons located in
lamina III had dendritic processes that were significantly asymmetrical and that
the preferentially dorsally directed processes displayed an extensive
rostrocaudal spread in lamina II interneurons (Yasaka et al., 2010), which
accounts for how such a sparse population of neurons can be a major contributor
to the dense lamina III ChAT plexus. The orientation of dendritic arbors is
proven to be an important distinguishing feature and between neurons, the
orientation of dendritic arborisation patterns varies systematically (Grudt and
140 Perl, 2002) yet the mechanism determining these patterns of synaptic
connections onto spinal interneurons are uncertain (Mentis et al., 2006).
Analysis of connectivity between ChAT partition cells and motoneurons have
revealed that the existence of ipsilaterally and bilaterally projecting
populations, both with widespread rostrocaudal segmental origin, and the latter
with preferential connectivity to equivalent motoneurons bilaterally (Stepien et
al., 2010).
The present study has demonstrated heterogeneous dendritic branching patterns
across laminar regions. A proposed function of dendritic processes is to
integrate neurochemical information (Hume and Purves, 1981). Based upon
previous comparative studies of dendritic complexity in neonatal and adult
ganglion neurons (Purves and Hume, 1981), the matching of neuronal geometric
properties and innervation patterns occur postnatally (Hume and Purves, 1981).
During development, descending CST terminals compete with each other for
synaptic space on spinal neurons and more active terminals are competitively
able to secure more synaptic space. Such early synaptic activity may be
attributed to the refinement of CS connections (Martin, 2005), even before
adaptive motor behaviours are expressed (Lawrence and Hopkins, 1976, Martin,
1985).

141
5 Chapter 5. Targets of the descending reticulospinal pathways
142
5.1 Introduction
Distinct populations of spinal neurons with specific functions can be identified
based on their common features of transmitter/receptor expression patterns,
morphology, connectivity and their membrane properties. Many medullary
raphé neurons receive convergent inputs related to multiple spinal systems,
which suggests they may serve compound functions (Mason, 2001). In lower
lumbar spinal segments, populations of descending RetS axon terminations are
known to be a neurochemically heterogeneous; the majority of axons express
VGLUT2 while a smaller proportion express VGAT (Du Beau et al., 2012).
Modulatory influences on neuronal output and locomotion are mediated by sets
of ChAT interneurons that elicit a diverse array of postsynaptic responses
(Zagoraiou et al., 2009) yet the neurochemical properties of descending systems
targeting these cell populations remain largely unknown. Among the identified
groups of ChAT interneurons (Barber, 1984) that show especially strong ChAT
immunoreactivity are central canal cluster cells populating lamina X and
partition cells in the intermediate zone that extends medially from lamina X
towards the lateral edges of the grey matter (see Barber, 1984).
Many ChAT interneurons in the rat spinal cord are known to contain NOS (Spike
et al., 1993). The enzyme NADPH diaphorase, which is known to be present in
the brain (Thomas and Pearse, 1964) and many spinal neurons, is considered to
correspond to NOS and several histochemical studies have mapped the
distribution of these neurons (Bredt et al., 1991a, Mizukawa et al., 1989,
Valtschanoff et al., 1992, Vincent and Kimura, 1992). The neuronal form of
nitric oxide, nNOS, is the enzyme responsible for synthesis of gaseous nitric
oxide by neurons (see Tricoire and Tania, 2012). Pharmacological studies
suggest that NOS may be involved in transmission in sympathetic ganglia (Briggs,
1992) and also in somatosensory processing (Haley et al., 1992, Kitto et al.,
1992, Meller et al., 1992a, Meller et al., 1992b, Moore et al., 1991).
Brainstem neurons implicated in the initiation of locomotion include
serotonergic, dopaminergic, noradrenergic, and glutamatergic neurons which
give rise to descending tracts (Jordan et al., 2007). Endogenous 5-HT
contributes to the development of spinal locomotor circuits (Branchereau et al.,

143 2002, Cazalets et al., 2000, Pflieger et al., 2002). Besides these long-term
trophic effects, further studies have shown that monoamines can elicit rhythmic
spinal cord activity with a locomotor-like pattern (Alford et al., 2003, Jordan
and Schmidt, 2002b, Rossignol et al., 2002). 5-HT is considered to be a pivotal
modulator of spinal motor networks. By engaging diverse 5-HT receptor
subtypes at both the pre- and postsynapse, locomotor rhythm is effectively
stabilised (Grillner and Jessell, 2009). Data from studies of neonatal mouse
preparations suggest that activation of dopaminergic receptors, either by
endogenous DA or by 5-HT, contributes to the effectiveness of 5-HT induced
locomotor-like activity (Madriaga et al., 2004) and such findings are consistent
with the proposal that release of multiple monoamines, i.e., 5-HT, DA and NA,
can evoke and/or modulate coordinated locomotion (Jordan and Schmidt,
2002b).
Most, if not all, DA terminals in the spinal cord are thought to arise from the A11
cell group of the hypothalamus (Björklund and Skagerberg, 1979, Qu et al.,
2006, Skagerberg and Lindvall, 1985) yet the role of these A11 cell groups in the
initiation of locomotion has not been explicitly tested (Jordan et al., 2007).
Adrenaline is released by the adrenal medulla and NA is then synthesised from
DA by DBH, binding to adrenergic receptors (Creese and Iversen, 1975). In
subcortical regions, ChAT interneurons regulate the output of dopaminergic
pathways implicated in sensorimotor learning, action selection and reward
(Joshua et al., 2008, Maskos et al., 2005, Mena-Segovia et al., 2008, Wang et al.,
2006). The pharmacological receptor subtypes mediating the actions of NA and
5-HT are notable. Findings from intracellular recordings in the rat spinal cord
suggest that NA may inhibit nocioceptive input by increasing the potassium
conductance of neurons (North and Yoshimura, 1984). NA and 5-HT released by
descending monoaminergic neurons may differ in the potency with which they
depress transmission from afferents to different functional types of neurons.
This depression may involve different membrane receptors at different locations
(Bras et al., 1990). In the dorsal horn (Lu and Perl, 2007), intermediate zone
and ventral horn, transmission of NA may be depressed principally through
activation of the α2 adrenergic receptor (Bras et al., 1990). However, evidence
from pharmacological studies indicate that the excitatory effects of NA may
occur through activation of the α1 adrenergic receptor (Lu and Perl, 2007).

144
In the spinal cord, DA can also elicit locomotor-like activity in isolated neonatal
preparations (Jiang et al., 1999, Kiehn and Kjaerulff, 1996, Madriaga et al.,
2004, Whelan, 1996) although specific dopaminergic neurons that give rise to a
descending pathway involved in the initiation of locomotion have not been
identified (Jordan et al., 2007). Because the activity of the motor output
system is controlled by the cohort of premotor neurons, the last-order neurons
establishing direct synaptic connections, understanding the connectivity rules of
defined premotor interneurons to functionally distinct motoneurons is essential
for understanding how the motor output system is organised (Stepien et al.,
2010).
It is hypothesised that axons descending from the MLF and CVLM will contact
ChAT interneurons and with different input densities across laminar boundaries
in lower lumbar spinal segments. At least some ChAT interneurons are expected
to express nNOS in intermediate zones and these cells are hypothesised to
receive input from 5-HT and NA. MLF axons are hypothesised to contact ChAT
interneurons bilaterally across intermediate laminar boundaries as visualised in
the horizontal plane. In order to investigate the neuronal targets of descending
axons labelled anterogradely from the RetST CVLM and MLF and the role of
monoamines within the spinal cord, a series of immunoreactions were conducted
with subsequent analyses. The experiments addressed the following aims:
To identify the neurochemical content of contacts onto ChAT interneurons
from descending CVLM axons across laminar boundaries in the transverse
plane
To investigate the contacts onto intermediate zone interneurons innervated
by the MLF in the horizontal plane
To determine the relationship of ChAT::nNOS interneurons in laminae VI, VII
and X with 5-HT
To qualitatively compare ChAT interneurons receiving modulatory input
from monoamines in the parasagittal plane

145
5.2 Methods
5.2.1 Image acquisition and analyses
For the following series of experiments, spinal cord tissue from four rats
receiving CTb injections into the CVLM and three rats receiving CTb injections
into the MLF were processed for analyses (Appendix 1 Figures 1 and 2).
Additionally, processed tissue was used from one naïve Sprague Dawley rat with
no injection site (Table 5.1). Medullary axons contacting spinal neurons were
traced anterogradely using CTb and their neurotransmitter content was
established using ICC techniques. Laboratory techniques, image acquisition and
statistical analyses were consistent with methods as outlined in previous
Chapters 2, 3, and 4. The distribution of the experimental data was determined
by the a priori D'Agostino & Pearson omnibus normality test so that the
appropriate statistical analyses were chosen.
To represent the horizontally stacked laminae in the transverse plane, bar
graphs are displayed horizontally while bar graphs from the experiment
conducted in the horizontal plane are represented vertically. Scholl analyses
was used as a method to investigate the morphology of interneurons using
Neurolucida software. For any interneuron, the total diameter in µm units was
found by drawing an outer concentric circle or ‘shell’ that encompassed the
length of all dendritic processes. An inner shell was then drawn at half this
calculated diameter to delineate proximal (inner) and distal (outer) dendritic
locations. Immunoreactive contacts were counted as proximal or distal
depending on whether they were situated inside or outside of this inner
concentric shell.
To investigate the relationship between interneurons immunoreactive to ChAT
and nNOS, sections were scanned using a different confocal microscopy method
such that interneurons immunoreactive to ChAT fluoresced at 488 nm (green)
and nNOS interneurons fluoresced at 410 nm and emitted at 455 nm (blue)
within the ultra-violet visible (UV vis) range. Interneurons expressing both ChAT
and nNOS, designated as ChAT::nNOS interneurons, were detected at both

146 wavelengths within the same focal planes and soma and proximal dendrites
assumed the same shape (see Figures 2.6 and 2.7). A series of confocal
microscopy scans were taken at low-power (x20) with a zoom factor of 1 with a
2 µm z-separation and immunoreactive interneurons within scan fields were
counted using Neuroludica software. A 20x20 µm grid was superimposed over
the image stacks. To avoid bias stacks were visualised in the green channel first
such that only ChAT immunoreactivity was shown. Approximately one soma per
grid cell was counted (depending upon the given scan field) and then each
counted soma was evaluated again separately in the blue channel to assess
whether the given soma also expressed nNOS. To accurately determine the
laminar location of soma, semi-opaque standard templates of transverse spinal
cord segments (based on Molander et al., 1984) were overlaid onto scanned
images as necessary.
5.2.2 Laminar boundaries in the horizontal plane
To determine the laminar location of spinal neurons, accurate laminar maps are
necessary. Standard transverse templates based upon Molander’s scheme are
advantageous since they can be consistently applied to all sections within a
given lumbar segment. Like tissues sectioned parasagittally (see Chapter 4),
laminar boundaries in the horizontal plane were undefined since each cut
section is different and there was no consensual template. Based upon standard
transverse templates, I derived laminar boundary maps for L3, L4 and L5
segments cut in the horizontal plane at 120 µm increments where intermediate
60 µm increments can be readily interpolated as well. A square grid was
superimposed over standard transverse templates. Scaled ‘cuts’ at 120 µm
increments represent how the segment is sectioned from the most superficial
dorsal horn as the Vibratome blade then progressively cuts in the ventral
direction towards the chuck (see Chapter 2). Coordinates were plotted along
the horizontal axes corresponding to the transverse laminar boundaries and then
extrapolated into the horizontal plane as vertical lines. These horizontal
templates served as ‘maps’ of the scanned images and scaled semi-opaque
templates were overlaid onto scaled as necessary. Unlike the parasagittal
laminar maps, I observed that several laminar boundaries were not as clearly
delineated. That is, some cuts straddled borders diagonally and were comprised
of more than one lamina and/or layers of white matter (Figure 5.1).
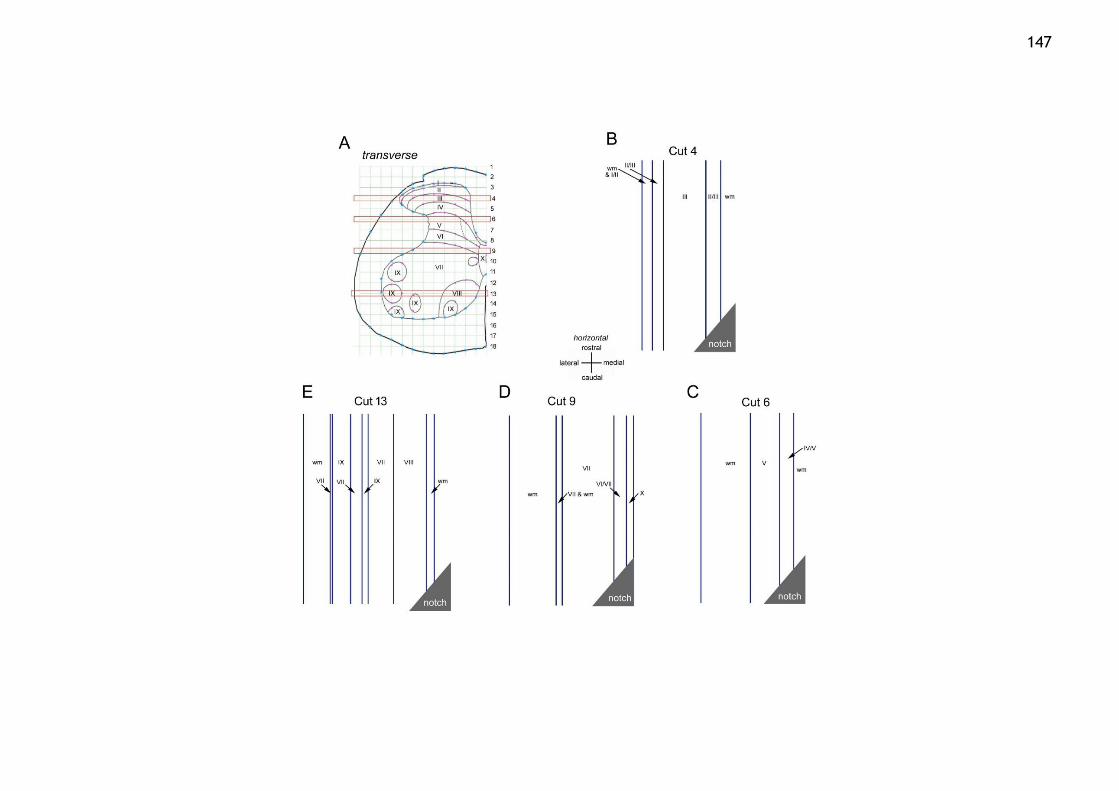
147
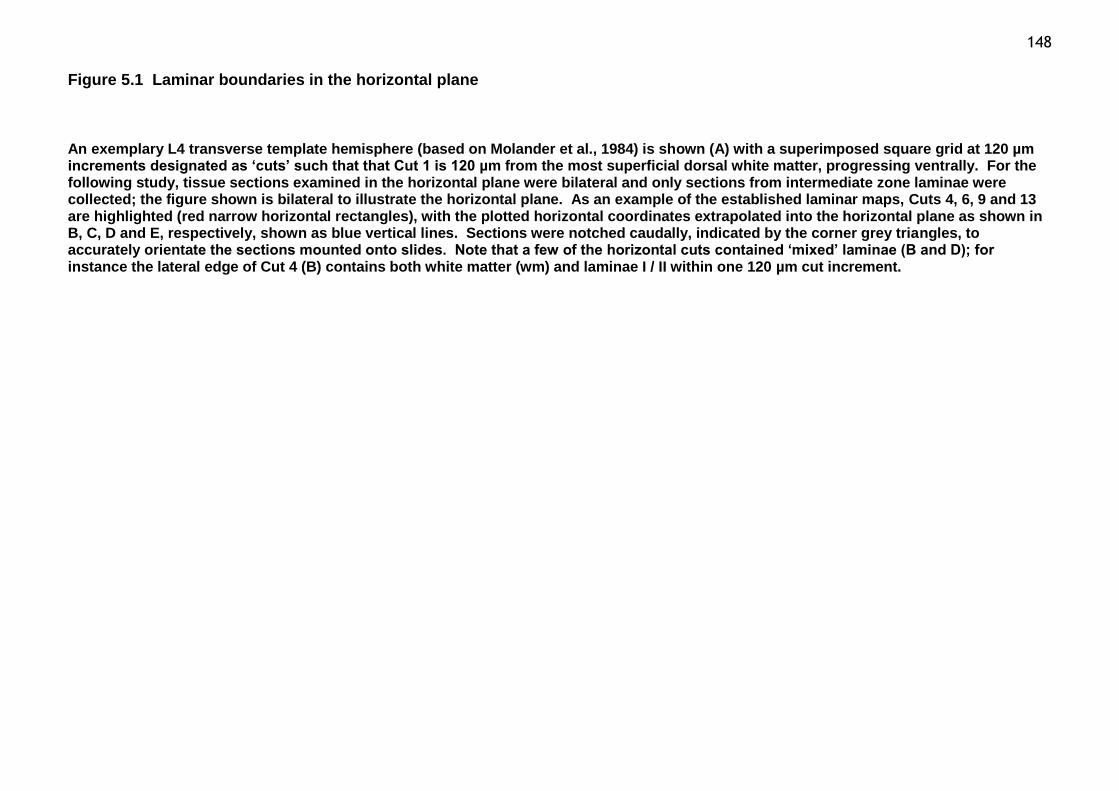
148
Figure 5.1 Laminar boundaries in the horizontal plane
An exemplary L4 transverse template hemisphere (based on Molander et al., 1984) is shown (A) with a superimposed square grid at 120 µm increments designated as ‘cuts’ such that that Cut 1 is 120 µm from the most superficial dorsal white matter, progressing ventrally. For the following study, tissue sections examined in the horizontal plane were bilateral and only sections from intermediate zone laminae were collected; the figure shown is bilateral to illustrate the horizontal plane. As an example of the established laminar maps, Cuts 4, 6, 9 and 13 are highlighted (red narrow horizontal rectangles), with the plotted horizontal coordinates extrapolated into the horizontal plane as shown in B, C, D and E, respectively, shown as blue vertical lines. Sections were notched caudally, indicated by the corner grey triangles, to accurately orientate the sections mounted onto slides. Note that a few of the horizontal cuts contained ‘mixed’ laminae (B and D); for instance the lateral edge of Cut 4 (B) contains both white matter (wm) and laminae I / II within one 120 µm cut increment.
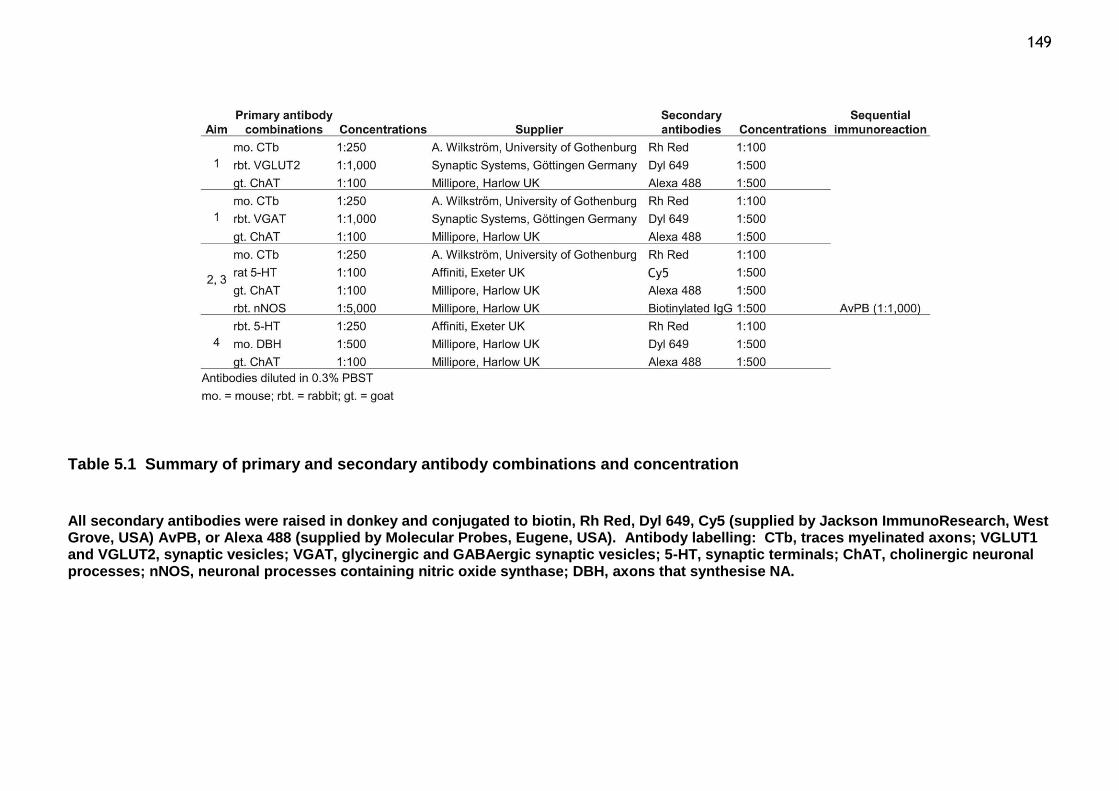
149
Table 5.1 Summary of primary and secondary antibody combinations and concentration
All secondary antibodies were raised in donkey and conjugated to biotin, Rh Red, Dyl 649, Cy5 (supplied by Jackson ImmunoResearch, West Grove, USA) AvPB, or Alexa 488 (supplied by Molecular Probes, Eugene, USA). Antibody labelling: CTb, traces myelinated axons; VGLUT1 and VGLUT2, synaptic vesicles; VGAT, glycinergic and GABAergic synaptic vesicles; 5-HT, synaptic terminals; ChAT, cholinergic neuronal processes; nNOS, neuronal processes containing nitric oxide synthase; DBH, axons that synthesise NA.
150
5.3 Results
5.3.1 Aim 1: To identify the neurochemical content of contacts onto ChAT interneurons from descending CVLM axons across laminar boundaries in the transverse plane
CTb was injected into the CVLM of three animals to anterogradely label
descending axon terminals in lower lumbar spinal segments sectioned
transversely (see Figures 3.3 and 3.5). To investigate the excitatory
neurochemical properties of labelled CVLM axons targeting reconstructed
interneurons, sections were reacted with a combination of antibodies against
CTb, VGLUT2 and ChAT and a total of 57 reconstructed cells in the grey matter
of lower lumbar segments were examined (Appendix 5 Tables 1, 2 and 3).
Similarly, to investigate inhibitory CVLM axonal targets, transverse sections from
three animals were reacted with a CTb, VGAT and ChAT and a total of 61
reconstructed cells were examined. Populations of interneurons were classified
according to their location within laminae III-V, VI-VII and X (Appendix 5 Tables
4, 5 and 6). ChAT interneurons were morphologically classified as mediolateral
(XY Ratio > 1) or dorsoventral (XY Ratio < 1) according to the elongation of their
dendritic branches within spinal laminae (see Figure 4.3). Confocal microscopy
images are shown from both experiments (Figures 5.2 and 5.3). The a priori
D'Agostino & Pearson omnibus normality test indicated that data did not assume
a normal distribution and therefore the Kruskal-Wallis with Dunn’s multiple
comparisons post hoc to compare medians.
The majority of descending CVLM axons targeting ChAT interneurons contained
VGLUT2. ChAT interneurons receiving excitatory CVLM inputs were found
predominantly in laminae VI and VII. Descending glutamatergic CVLM axons
preferentially targeted mediolaterally orientated interneurons in all laminae
except in lamina X where the densities of dorsoventrally orientated dendritic
processes were significantly greater (Figure 5.4). ChAT interneurons receiving
inhibitory CVLM inputs were found predominantly in dorsal laminae III, IV and V.
However, a considerable portion of mediolaterally orientated dendritic
processes near the central canal received inhibitory input and densities were
significantly greater than those found in intermediate laminae VI and VII (Figure
151 5.5). To compare the morphology of CVLM boutons onto ChAT interneurons,
Sholl analyses compared mean dendritic densities from these experiments.
Significantly, excitatory CVLM boutons containing VGLUT2 were situated on
distal dendrites while inhibitory CVLM boutons containing VGAT tended to target
proximal dendrites. Glutamatergic CVLM boutons showed the greatest range of
target sites onto distal dendrites (Figure 5.6).
As hypothesised, descending CVLM axons did contact ChAT interneurons with
considerable variation in input densities across laminar boundaries, with only
minor differences between mediolaterally or dorsoventrally orientated
interneurons. In particular, lamina X was found to be richly innervated by both
excitatory and inhibitory immunoreactive CVLM fibres.

152
Figure 5.2 ChAT interneuron in lamina VII receiving excitatory CVLM input
Confocal microscopy image of an interneuron immunoreactive to ChAT (A) in a single optical plane. The proximal dendrite (arrow) received descending CVLM input (B) enriched with VGLUT2 (C) as revealed in the merged image (D) denoted by the arrow.
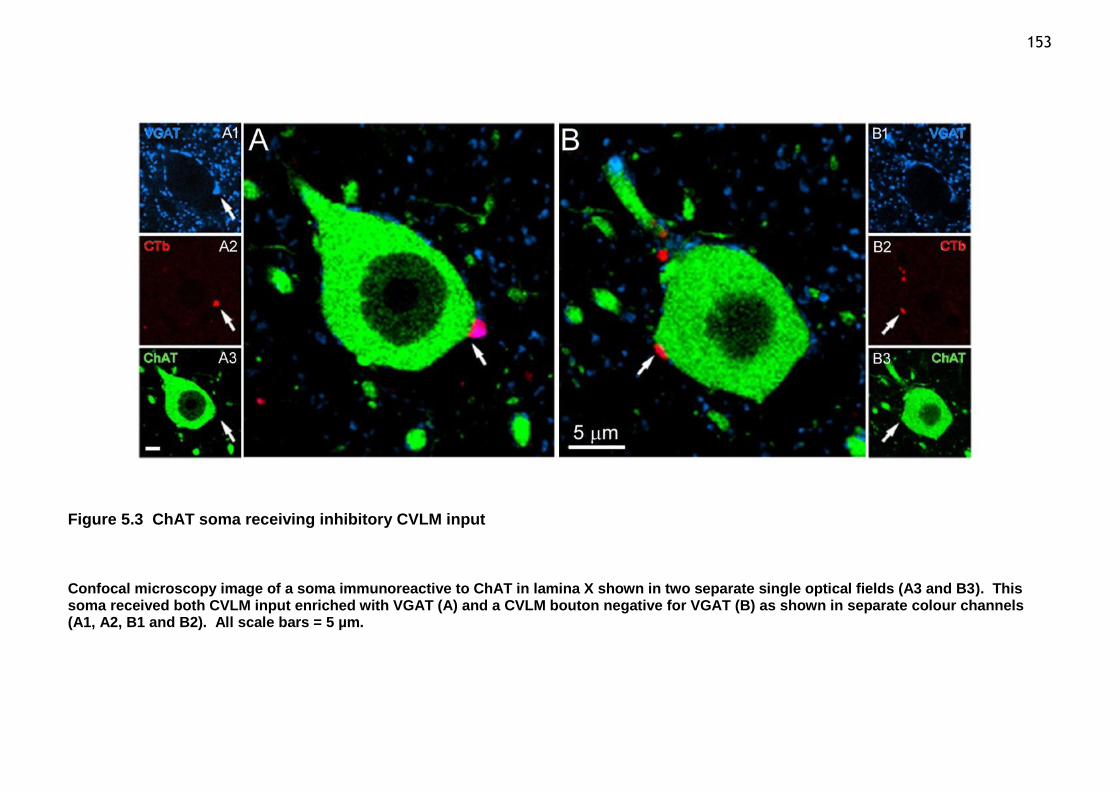
153
Figure 5.3 ChAT soma receiving inhibitory CVLM input
Confocal microscopy image of a soma immunoreactive to ChAT in lamina X shown in two separate single optical fields (A3 and B3). This soma received both CVLM input enriched with VGAT (A) and a CVLM bouton negative for VGAT (B) as shown in separate colour channels (A1, A2, B1 and B2). All scale bars = 5 µm.
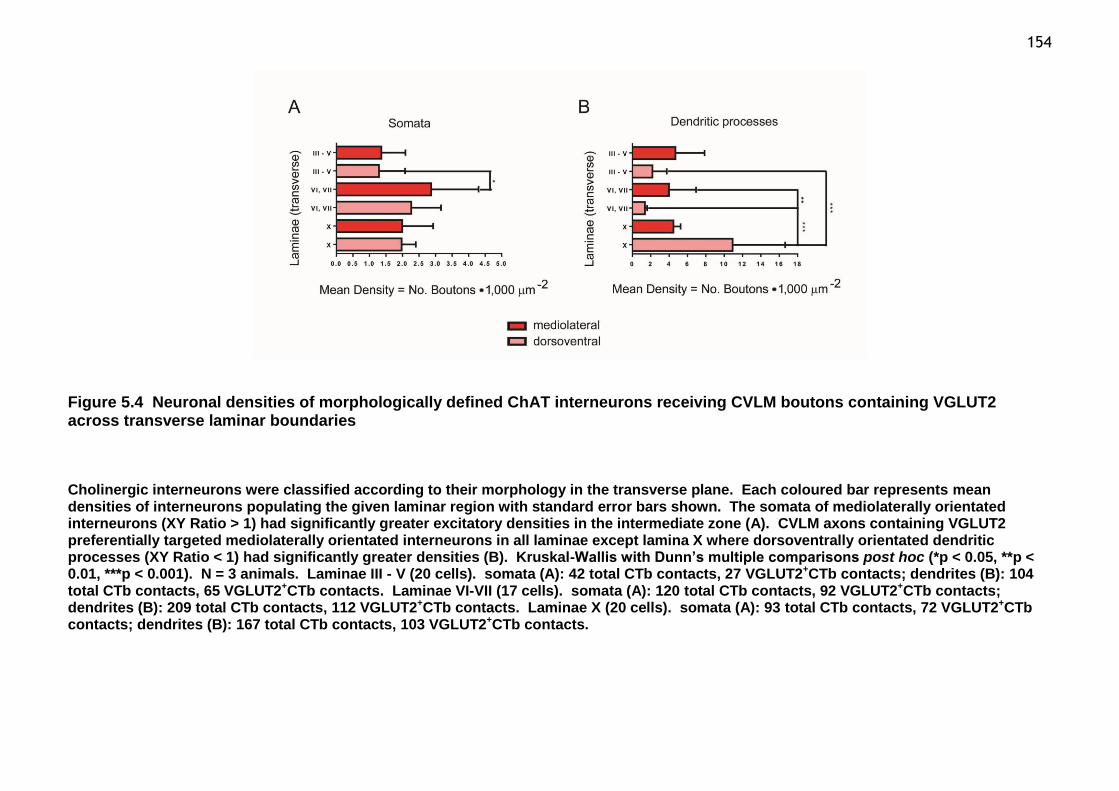
154
Figure 5.4 Neuronal densities of morphologically defined ChAT interneurons receiving CVLM boutons containing VGLUT2 across transverse laminar boundaries
Cholinergic interneurons were classified according to their morphology in the transverse plane. Each coloured bar represents mean densities of interneurons populating the given laminar region with standard error bars shown. The somata of mediolaterally orientated interneurons (XY Ratio > 1) had significantly greater excitatory densities in the intermediate zone (A). CVLM axons containing VGLUT2 preferentially targeted mediolaterally orientated interneurons in all laminae except lamina X where dorsoventrally orientated dendritic processes (XY Ratio < 1) had significantly greater densities (B). Kruskal-Wallis with Dunn’s multiple comparisons post hoc (*p < 0.05, **p < 0.01, ***p < 0.001). N = 3 animals. Laminae III - V (20 cells). somata (A): 42 total CTb contacts, 27 VGLUT2+CTb contacts; dendrites (B): 104 total CTb contacts, 65 VGLUT2+CTb contacts. Laminae VI-VII (17 cells). somata (A): 120 total CTb contacts, 92 VGLUT2+CTb contacts; dendrites (B): 209 total CTb contacts, 112 VGLUT2+CTb contacts. Laminae X (20 cells). somata (A): 93 total CTb contacts, 72 VGLUT2+CTb contacts; dendrites (B): 167 total CTb contacts, 103 VGLUT2+CTb contacts.

155
Figure 5.5 Neuronal densities of morphologically defined ChAT interneurons receiving CVLM boutons containing VGAT across transverse laminar boundaries
Cholinergic interneurons were classified according to their morphology in the transverse plane. Each green bar represents mean densities of interneurons populating the given laminar region with standard error bars shown. The somata of mediolaterally orientated interneurons (XY Ratio > 1) had greater inhibitory densities in dorsal laminae III - V (A). CVLM axons containing VGAT preferentially targeted mediolaterally orientated dendritic processes in lamina X with significantly greater inhibitory densities (B). Kruskal-Wallis with Dunn’s multiple comparisons post hoc (*p < 0.05). N = 3 animals. Laminae III - V (19 cells). somata (A): 52 total CTb contacts, 13 VGAT+CTb contacts; dendrites (B): 122 total CTb contacts, 35 VGAT+CTb contacts. Laminae VI-VII (24 cells). somata (A): 45 total CTb contacts, 13 VGAT+CTb contacts; dendrites (B): 120 total CTb contacts, 45 VGAT+CTb contacts. Laminae X (18 cells). somata (A): 38 total CTb contacts, 9 VGAT+CTb contacts; dendrites (B): 96 total CTb contacts, 45 VGAT+CTb contacts.

156
Figure 5.6 Dendritic densities of ChAT interneurons classified according to distance of immunoreactive CVLM boutons from soma
Sholl analyses compared the mean dendritic densities of all examined ChAT interneurons receiving excitatory (red) and inhibitory (green) CVLM inputs. A concentric circle or ‘shell’ encompassed all dendritic processes and those that were situated within the inner half were designated as proximal and those outside the shell were distal. CVLM boutons containing VGLUT2 were situated significantly further distally (open circles) while boutons containing VGAT were found proximally (closed circles), closer to somata, as described in the methods. There were significant morphological differences between dendrites receiving excitatory and inhibitory CVLM inputs. Kruskal-Wallis with Dunn’s multiple comparison’s post hoc (***p < 0.001; n = 57 interneurons for VGLUT2 experiment and n = 61 interneurons for VGAT experiment). Scatter plot bars represent the means.

157
5.3.2 Aim 2: To investigate neuromodulation of intermediate zone interneurons innervated by the MLF in the horizontal plane
CTb was injected into the MLF of three animals to anterogradely label
descending axon terminals in lower lumbar spinal segments (see Figures 3.3 and
3.4) sectioned horizontally. To investigate the interneurons targeted by labelled
MLF axons and their serotonergic inputs, sections were reacted with a
combination of antibodies against CTb, 5-HT, ChAT and nNOS (Table 5.1).
Immunoreactive sections were first scanned in the red, blue and green channels
to detect CTb, 5-HT and ChAT, respectively. Then sections were re-scanned
such that the nNOS signal was detected in the UV vis range (as described in the
methods section). Processes specifically in intermediate laminae VI, VII and
lamina X populations were scanned for analyses. In the laminae VI - VII
population, 17 ChAT interneurons were fully reconstructed and 38.10% (±20.62)
of these cells also expressed nNOS. In the lamina X population, 15 ChAT
interneurons were reconstructed and 90.48% (±16.50) of these cells also
expressed nNOS. These cells were designated as ChAT::nNOS (Appendix 5 Tables
7 and 8). The a priori D'Agostino & Pearson omnibus normality test indicated
that data were distributed normally and therefore the ANOVA with Tukey’s post
hoc compared means.
While none of the descending MLF axon terminals targeting these interneurons
contained 5-HT (see Chapter 3), 5-HT boutons did form contacts onto these
interneurons as hypothesised. A representative confocal microscopy image
(Figure 5.7) and an interneuron reconstructed in three dimensions are shown
(Figure 5.8). The average densities of ChAT interneurons were classified
according to their positive or negative expression of nNOS. All interneurons
received slightly greater input from 5-HT than from descending MLF axons. The
densities of ChAT and ChAT::nNOS populations did not significantly differ in
terms of their inputs sources as indicated by the scatter plot (Figure 5.9).
The input properties relating the densities of ChAT and ChAT::nNOS
interneuronal populations were examined in the laminae VI-VII intermediate

158 zone and lamina X surrounding the central canal. The densities of ChAT::nNOS
population received significantly greater serotonergic input than from MLF axons
and this relationship was similar across laminar boundaries (Figure 5.10).
As a considerable number of labelled MLF axons terminate bilaterally (see Figure
3.4), the contact densities of contralaterally and ipsilaterally located ChAT and
ChAT::nNOS interneurons targeted by the MLF and receiving input from 5-HT
were compared in laminae VI, VII and X. The inputs from both MLF axons and 5-
HT were found to be very similar for the contralateral and ipsilateral populations
(Figure 5.11). This finding confirms that MLF axons target ChAT interneurons
bilaterally, as indicated by diffusion of CTb surrounding the injection site.
Addressing the hypothesis, some of the examined ChAT interneurons expressed
nNOS in these laminar regions. However, their neurochemical profiles were not
significant in terms of inputs received from the MLF or from 5-HT.

159
Figure 5.7 ChAT::nNOS interneuron receiving input from the MLF and 5-HT
Confocal microscopy image of a soma immunoreactive to ChAT (A) and nNOS (D) in lamina X shown in a single optical section. This soma received input from the MLF as indicated by the CTb marker in the red channel (B) and from 5-HT shown in the blue channel (C). MLF axons did not contain 5-HT.

160
Figure 5.8 ChAT interneuron receiving input from the MLF and 5-HT
Three dimensional reconstruction of a ChAT interneuron in the horizontal pane receiving input from descending MLF axons (red) and from 5-HT (blue). This exemplary interneuron is orientated rostrocaudally within the grey matter of laminae VI of an L4 segment.
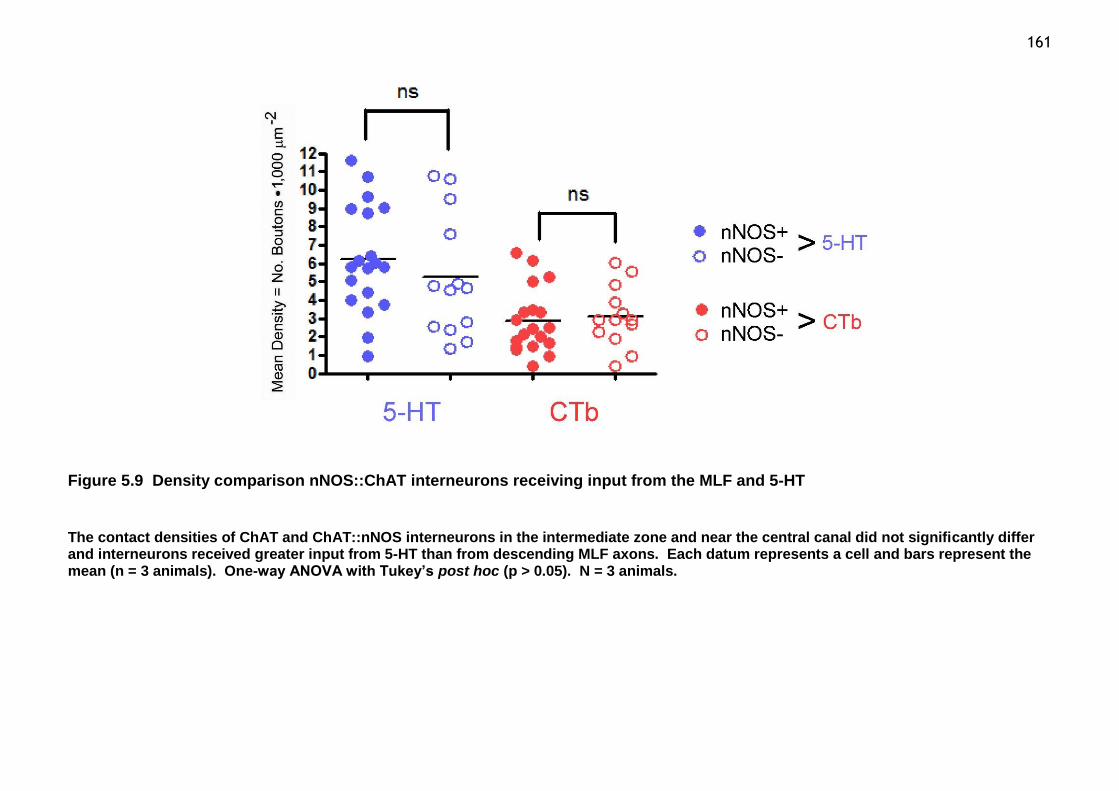
161
Figure 5.9 Density comparison nNOS::ChAT interneurons receiving input from the MLF and 5-HT
The contact densities of ChAT and ChAT::nNOS interneurons in the intermediate zone and near the central canal did not significantly differ and interneurons received greater input from 5-HT than from descending MLF axons. Each datum represents a cell and bars represent the mean (n = 3 animals). One-way ANOVA with Tukey’s post hoc (p > 0.05). N = 3 animals.

162
Figure 5.10 Relationship of ChAT and ChAT::nNOS interneuronal populations receiving input from the MLF and 5-HT across intermediate laminar boundaries in the horizontal plane
The nNOS::ChAT population of interneurons receiving input from 5-HT (purple) and from the MLF (lavender) had greater densities in both laminae VI and VII (A) and near the central canal (B). Each coloured bar represents mean densities of interneurons populating the given laminar region with standard error bars shown. The densities of populations receiving input from 5-HT differed significantly from those innervated by the MLF in these intermediate zones. Each datum represents a cell (n = 3 animals). One-way ANOVA with Tukey’s post hoc (*p < 0.05). N = 3 animals. Laminae VI-VII (17 cells (38.10% ChAT::nNOS)). Somata: 61 5-HT contacts, 37 CTb contacts. Dendritic: 200 5-HT contacts, 79 CTb contacts. Lamina X (15 cells (90.48% ChAT::nNOS)). Somata: 33 5-HT contacts, 27 CTb contacts. Dendritic: 112 5-HT contacts, 49 CTb contacts.
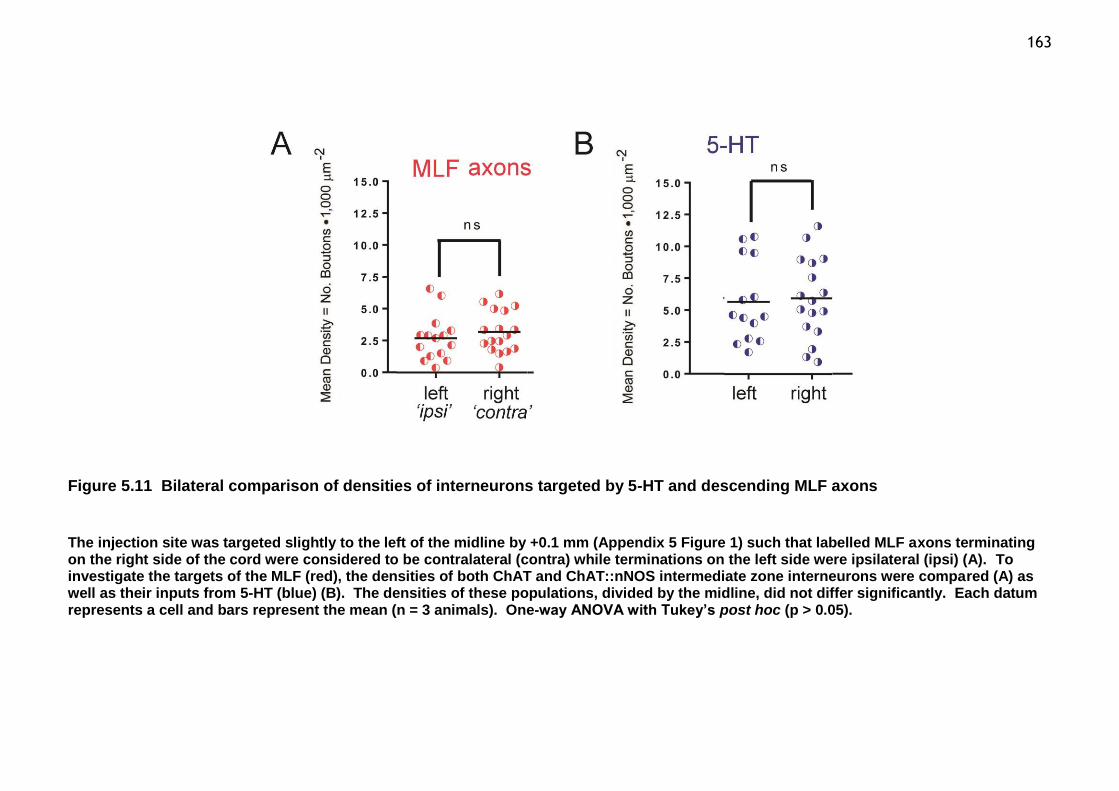
163
Figure 5.11 Bilateral comparison of densities of interneurons targeted by 5-HT and descending MLF axons
The injection site was targeted slightly to the left of the midline by +0.1 mm (Appendix 5 Figure 1) such that labelled MLF axons terminating on the right side of the cord were considered to be contralateral (contra) while terminations on the left side were ipsilateral (ipsi) (A). To investigate the targets of the MLF (red), the densities of both ChAT and ChAT::nNOS intermediate zone interneurons were compared (A) as well as their inputs from 5-HT (blue) (B). The densities of these populations, divided by the midline, did not differ significantly. Each datum represents a cell and bars represent the mean (n = 3 animals). One-way ANOVA with Tukey’s post hoc (p > 0.05).

164
5.3.3 Aim 3: To determine the relationship of ChAT::nNOS interneurons in laminae VI, VII and X
To investigate the relationship between interneurons expressing ChAT, nNOS
and/or ChAT::nNOS in laminae VI, VII and X, transverse sections from three
animals receiving CTb injections in the MLF were reacted with the same
antibody combination against CTb, 5-HT, ChAT and nNOS. However, the
immunoreactive expression of MLF axons and 5-HT was not the focus of this
present aim. Although the CTb tracer signal was present, it was not detected
using this particular confocal microscopy method. The ANOVA with Tukey’s post
hoc compared means.
In laminae VI and VII, 80 total immunoreactive interneurons were counted with
27.74% (± 3.64) expressing ChAT, 38.70% (± 4.15) expressing nNOS and 33.56%
(± 7.51) expressing both markers. In lamina X, 105 total immunoreactive
interneurons were counted with 17.70% (± 3.83) expressing ChAT, 42.72% (±
2.30) expressing nNOS and 39.58% (± 3.75) expressing both markers (Appendix 5
Table 9). Low-power confocal microscopy scans revealed the relationship of
these interneurons and 5-HT was revealed also (Figure 5.12). Interneurons
expressing nNOS were the most prevalent population in these laminar regions
with a considerable portion immunoreactive to both markers (Figure 5.13).

165

166
Figure 5.12 Relationship of ChAT::nNOS immunoreactive interneurons in the intermediate zone with 5-HT
Projected low-power confocal microscopy image of intermediate zone regions containing ChAT interneurons visualised in the green channel. (A) L4 transverse section with laminar boundaries indicated by a superimposed standard template based upon Molander’s scheme. (B) nNOS cells are visualised in the blue channel. The merged image reveals ChAT (green), nNOS (blue) ChAT::nNOS (cyan) cell populations (C) and 5-HT immunoreactivity is visualised in the red channel, especially present near the central canal (cc). The ChAT::nNOS cell shown in the inset box (C) is immunoreactive to both ChAT (D) and nNOS (E) as visualised in separate colour channels. While the CTb tracer is present, it is not visible using this particular confocal microscopy method. Immunofluorescence is shown in pseudo-colours. Note that 5-HT is present in all laminar regions.

167
Figure 5.13 The relationship of ChAT, nNOS and ChAT::nNOS expressing interneurons in laminae VI - VII and X
Immunoreactive interneurons in laminae VI - VII (A) and lamina X (B) were counted. The majority of interneurons expressed nNOS (blue) and in the lamina X populations, the number of these cells differed significantly from those cells expressing ChAT::nNOS (green) and ChAT (yellow). ChAT interneurons were found less frequently in both laminar populations. One-way ANOVA with Tukey’s post hoc for n = 3 animals (***p < 0.001). Standard error bars shown. Laminae VI-VII: 80 total cells (27.74% ChAT, 38.7% nNOS, 33.56% ChAT::nNOS). Lamina X: 105 total cells (17.70% ChAT, 42.72% nNOS, 39.58% ChAT::nNOS).
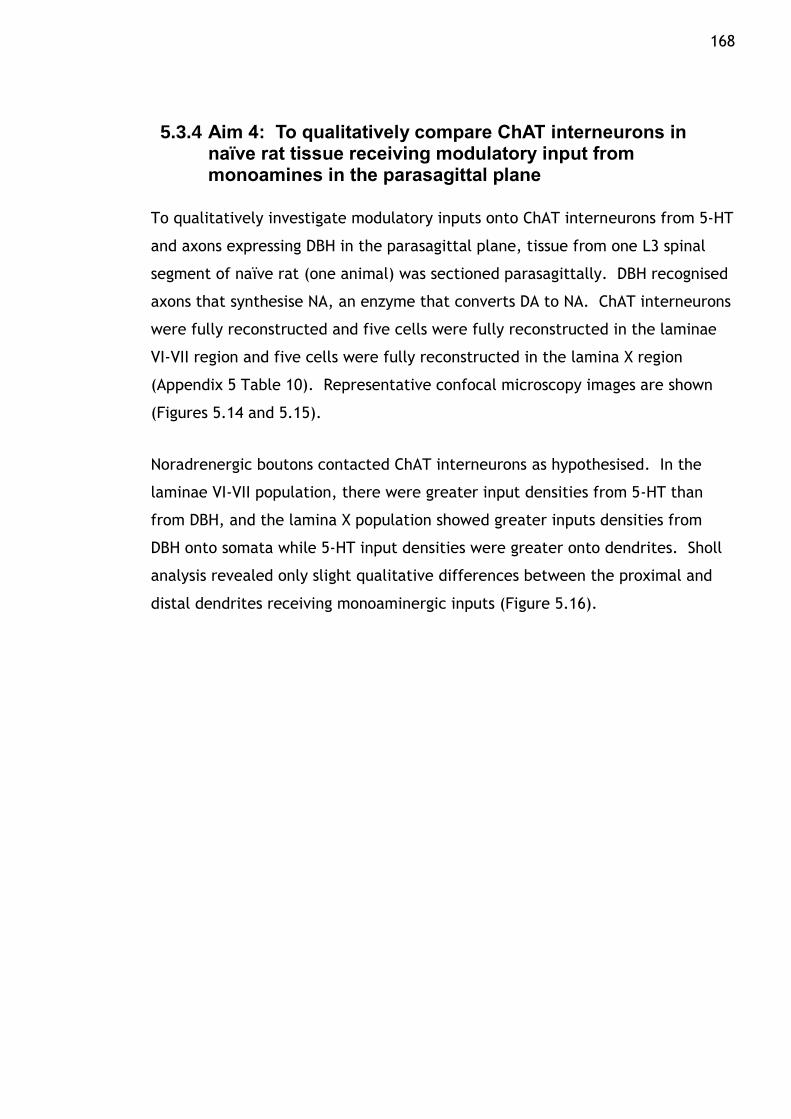
168
5.3.4 Aim 4: To qualitatively compare ChAT interneurons in naïve rat tissue receiving modulatory input from monoamines in the parasagittal plane
To qualitatively investigate modulatory inputs onto ChAT interneurons from 5-HT
and axons expressing DBH in the parasagittal plane, tissue from one L3 spinal
segment of naïve rat (one animal) was sectioned parasagittally. DBH recognised
axons that synthesise NA, an enzyme that converts DA to NA. ChAT interneurons
were fully reconstructed and five cells were fully reconstructed in the laminae
VI-VII region and five cells were fully reconstructed in the lamina X region
(Appendix 5 Table 10). Representative confocal microscopy images are shown
(Figures 5.14 and 5.15).
Noradrenergic boutons contacted ChAT interneurons as hypothesised. In the
laminae VI-VII population, there were greater input densities from 5-HT than
from DBH, and the lamina X population showed greater inputs densities from
DBH onto somata while 5-HT input densities were greater onto dendrites. Sholl
analysis revealed only slight qualitative differences between the proximal and
distal dendrites receiving monoaminergic inputs (Figure 5.16).

169
Figure 5.14 Neuromodulation of a ChAT interneuron
An immunoreactive ChAT interneuron in naïve rat tissue was revealed in a single channel projected confocal microscopy ’raw’ image in lamina IV of an L4 segment sectioned parasagittally (A). Both monoamines (chemical structures, A) contacted this soma and proximal dendrite with 5-HT boutons denoted by arrows and DBH boutons denoted by arrowheads in a single optical field (B). 5-HT (C) and DBH (D) are shown in separate colour channels in single optical fields. DBH converts DA to NA by addition of a hydroxyl group within synaptic vesicles (A).
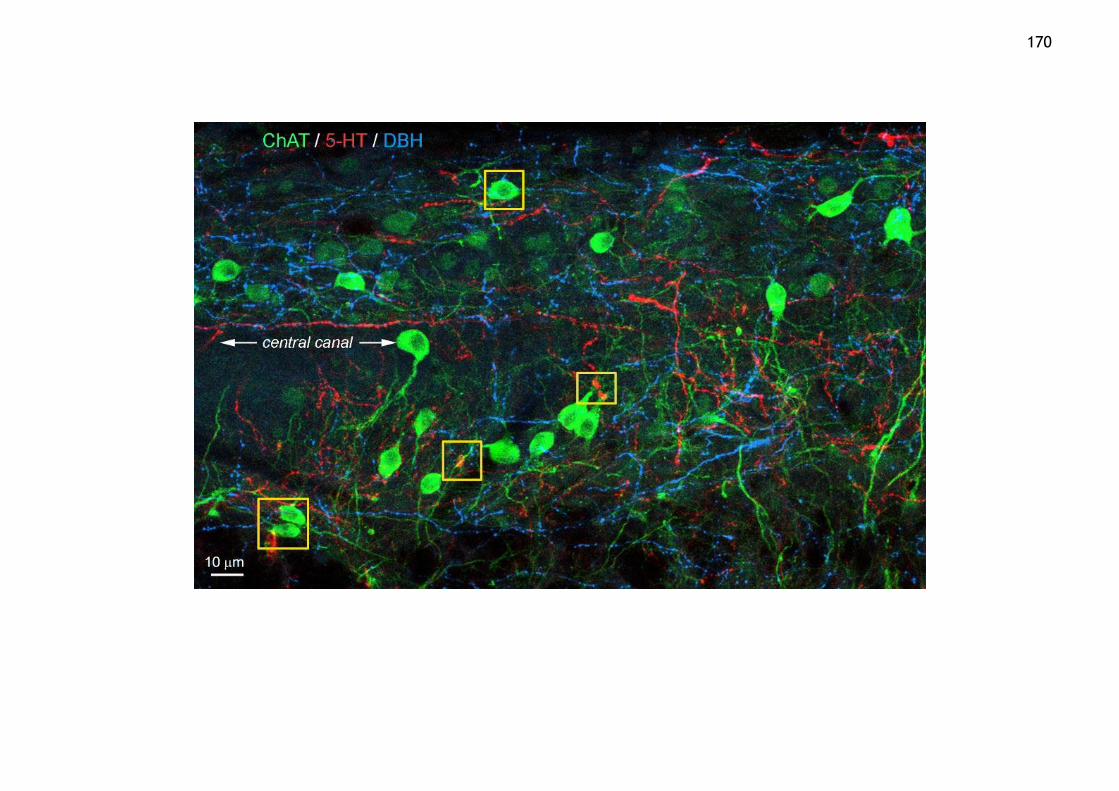
170
171
Figure 5.15 ChAT interneurons neuromodulated by 5-HT and NA near the central canal
Projected low-power confocal microscopy image of immunoreactive ChAT interneurons distributed about the central canal as indicated. Yellow inset boxes indicate regions of interest as both 5-HT and DBH marker were found to contact interneurons. Not that the central canal is visualised horizontally in the parasagittal plane.
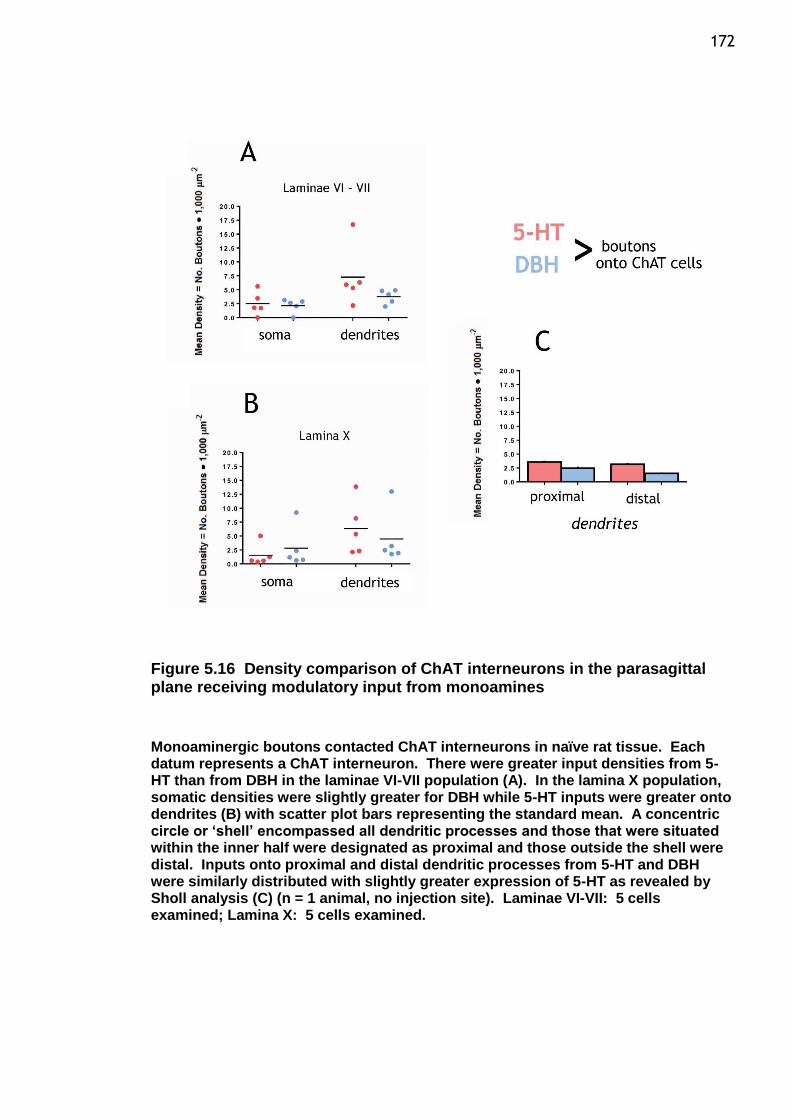
172
Figure 5.16 Density comparison of ChAT interneurons in the parasagittal plane receiving modulatory input from monoamines
Monoaminergic boutons contacted ChAT interneurons in naïve rat tissue. Each datum represents a ChAT interneuron. There were greater input densities from 5-HT than from DBH in the laminae VI-VII population (A). In the lamina X population, somatic densities were slightly greater for DBH while 5-HT inputs were greater onto dendrites (B) with scatter plot bars representing the standard mean. A concentric circle or ‘shell’ encompassed all dendritic processes and those that were situated within the inner half were designated as proximal and those outside the shell were distal. Inputs onto proximal and distal dendritic processes from 5-HT and DBH were similarly distributed with slightly greater expression of 5-HT as revealed by Sholl analysis (C) (n = 1 animal, no injection site). Laminae VI-VII: 5 cells examined; Lamina X: 5 cells examined.
173
5.4 Discussion
5.4.1 Excitatory and inhibitory CVLM inputs onto ChAT interneurons across laminar boundaries in the transverse plane
Analyses of data from this anterograde tract tracing and immunohistochemical
study has provided insights into the distribution of descending excitatory and
inhibitory CVLM input onto populations of ChAT interneurons. Antibody against
VGAT detected both glycinergic and GABAergic boutons. Overall, ChAT
interneurons had greater contacts densities from VGLUT2 positive CVLM axon
terminals than from VGAT positive terminals. Within the spinal cord,
coordination between neurons is controlled principally by the interaction
between glutamate and glycine (Brodin and Grillner, 1985a, Brodin and Grillner,
1985b, Dale, 1985, Dale et al., 1986, Dale and Roberts, 1985, Grillner and
Wallen, 1980). The CVLM is likely to sculpt motor activity using both excitatory
and inhibitory transmitters in tandem. In terms of the overall neural networks
underlying the rhythmic patterns of locomotion, neurons need a source of
excitation, which may be intrinsic to the neuron or may come from neurons
external to the network (Alford et al., 2003). In generating any motor output,
inhibitory synaptic transmission and inhibitory interneurons are crucial for
coordinating antagonistic muscles of each joint (Baldissera et al., 1981),
especially controlling temporal and spatial activation patterns of limbs on both
sides of the body. Thus, inhibition is essential for controlling the speed and
stability of the locomotor rhythm (Nishimaru and Kakizaki, 2009).
In contrast to densities of VGLUT2 positive CVLM boutons on proximal dendrites,
there was considerable variability of distally located VGLUT2 positive CVLM
boutons. A methodological consideration may be that dendritic arbors were not
fully visualised, especially for mediolaterally orientated cells in transverse
sections. The dendritic distribution of VGAT positive CVLM boutons was
comparatively uniform. An interesting finding was the significantly greater CVLM
input onto lamina X central canal cells, both excitatory and inhibitory. The area
surrounding the central canal emerged as a region of interest. Pertinent to this

174 laminar region and the adjacent intermediate zone, Renshaw cells act as
premotor inhibitory interneurons that are excited by motoneuron axon
collaterals before they leave the spinal cord (Jankowska, 2013) via the
activation of nicotinic receptors (Alvarez and Fyffe, 2007, Willis, 1971).
Dendritic processes of Renshaw cells have been uniquely characterised as having
a high density of proximal inhibitory synapses (Alvarez and Fyffe, 2007).
All intermediate zone interneurons are regarded as intersegmental neurons that
may span a few segments but do not extend beyond lumbar segments. Further,
all of the subpopulations of intermediate zone interneurons included
interneurons innervated by group I and II afferents (Jankowska and Edgley,
2010). In the intermediate zone, group Ia interneurons located in the grey
matter of lamina VII were originally considered merely to serve as relays to
change the type of transmitter from excitatory (in synapses made by peripheral
afferents) to inhibitory (glycine) but Ia interneurons also function as
premotoneuron integration centres (Jankowska, 2013) by relaying sensory reflex
inputs to motoneurons (Hultborn et al., 1971, Jankowska, 1992, Wang, 2008,
Windhorst, 2007). As these interneuronal groups have now been more
appropriately classified collectively as group I/II interneurons (Jankowska and
Edgley, 2010), results from the present study indicate that these groups are
targeting premotor interneurons using VGLUT2 and VGAT.
The neuronal orientation, mediolateral or dorsoventral, within any given laminar
region was not significant in terms of contact densities. However, differences in
glutamatergic and inhibitory densities between laminar regions were apparent.
Interestingly, all laminar regions contained mediolaterally and dorsoventrally
orientated interneurons, suggestive of the inherent morphological diversity of
ChAT interneurons. In terms of the hypothesis, considerable variation of contact
densities were observed throughout spinal laminae and this result was seemingly
irrespective of morphological parameters, indicative of the complexity of
instantiated interneurons. A recent comparative study of intermediate zone
excitatory and inhibitory interneurons in the cat spinal cord found no
discernable pattern regarding the location or the extent of dendritic arbors.
However, major morphological differences were found in their axonal
projections; excitatory interneurons projected either ipsilaterally, bilaterally or

175 contralaterally while inhibitory interneurons projected exclusively ipsilaterally
and this finding was confirmed by electrophysiological data (Bannatyne et al.,
2009). In sum, individual partition cells receiving descending input from the
CVLM having divergent morphological patterns may be recruited selectively to
modulate pools of motoneurons with specificity, executing behaviourally
appropriate motor tasks requiring alternation of extensor burst amplitudes (see
Zagoraiou et al., 2009, Stepien et al., 2010).
5.4.2 Serotonergic inputs onto interneurons in laminae VI, VII and X innervated by the MLF
MLF axons were labelled anterogradely and this ICC study provided insights into
descending MLF inputs onto populations of ChAT and ChAT::nNOS interneurons in
laminae VI, VII and X in the horizontal plane. The inherent orientation of ChAT
dendrites may be better accommodated in tissues sectioned horizontally and/or
parasagittally rather than transversely. However, horizontal sections can be
disadvantageous since the hemispheres can separate while cutting, especially
sections from the superficial dorsal or deep ventral horn. Because I was
investigating interneurons in the grey matter of intermediate zones near the
central canal, horizontal sections were ideal since this region is contiguous.
Horizontal sections allowed for bilateral examination of the cord, which is
pertinent considering that MLF axons are known to be distributed bilaterally (Du
Beau et al., 2012). Labelled MLF axons projecting to the right (contralateral)
and left (ipsilateral) sides of the cord relative to the injection site were found to
target cells nearly equally, as might be expected since the MLF injection site
was targeted very close to the midline (mediolateral = +0.1mm). Contact
densities from both sources were similar across laminar regions with the
ChAT::nNOS populations receiving statistically insignificantly greater
serotonergic modulation. This finding confirms that the CTb tracer diffused
across the midline to label descending MLF axons. Other studies have reported
that serotonergic fibres have been found in all laminae of the cord and at all
rostrocaudal levels, as in the rat (Jones and Light, 1990), which fits the concept
that the serotonergic systems exert an overarching modulatory role on both
sensory and motor functions (Mason and Leung, 1996, White et al., 1996).
176 A recent confocal microscopy study investigating intracellularly labelled CINs
found that the number and pattern of contacts from serotonergic and
noradrenergic fibres were very similar (Hammar et al., 2004). Such findings
suggest that the differences in the modulatory actions of monoamines, and the
subsequent changes in the recruitment of morphological subpopulations in
various behavioural situations, depends upon the intrinsic properties of the
interneurons rather than on the pattern of innervation by monoamines.
Monoamines contacting group II premotor interneurons may be strategically
positioned to influence primary afferent inputs, as both occur predominantly on
dendritic processes (Maxwell and Riddell, 1999). Descending monoaminergic
systems were observed to have similar actions on excitatory and inhibitory group
II pathways (Jankowska et al., 1993, Schomburg and Steffens, 1988), which is
consistent with findings of similar density and patterns of distribution of
contacts onto populations of premotor interneurons (Maxwell et al., 2000).
5.4.3 The relationship of ChAT::nNOS interneurons in laminae VI, VII and X with 5-HT
Analysis of immunoreactive interneurons expressing ChAT and nNOS in
intermediate zones and surrounding the central canal characterised the role of
premotor interneurons. The majority of cells expressed nNOS and
neurochemical expressions were similar across laminar boundaries. Lamina X
provides a ChAT relay between the dorsal, intermediate and ventral grey matter
(Borges and Iversen, 1986). Many peptides are present within lamina X (Gibson
et al., 1981) and some ChAT neurons could be peptidergic (Borges and Iversen,
1986), which may serve regulatory functions for ChAT neurons in other laminar
regions (Butcher and Woolf, 1982). Previous studies have found that ChAT
partition cells that do not express nNOS likely give rise to C boutons on
motoneurons. C boutons regulate the excitability of motoneurons via m2
muscarinic receptors (see Miles et al., 2007) and muscarinoreceptive neurons are
known to provide a sustained monosynaptic bilateral excitation to RetS neurons
(Smetana et al., 2010). The transcription factor Pitx2 marks a small cluster of
spinal ChAT interneurons, VOc neurons, which are the sole source of C boutons
synapses onto spinal motoneurons (Zagoraiou et al., 2009). The biophysical

177 processes of VOc neurons, e.g. slow tonic firing and large afterhyperpolarising
potentials, are typical of ChAT and monoaminergic modulatory neurons (Bennett
et al., 2000, Li and Bayliss, 1998, Masuko et al., 1986) and their connectivity
suggests that they participate in the spinal premotor network devoted to the
modulation of motor output (Zagoraiou et al., 2009).
5.4.4 Qualitative comparison of ChAT interneurons in naïve rat tissue receiving modulatory input from monoamines
Immunoreactive ChAT interneurons from naïve tissue that received no tract
tracer injection were reconstructed in intermediate zones and lamina X.
Monoaminergic boutons contacted these cell populations, with great inputs from
5-HT than DBH, although there was an outlying cell having an exceptionally high
serotonergic dendritic density (16.73 per 1,000 µm2) as compared to the mean
(7.29 per 1,000 µm2 ±5.52). Data were not statistically analysed since one
animal was used for this particular experiment.
Catecholaminergic and serotonergic regions of the CNS are largely
heterogeneous with respect to their synaptic connections as demonstrated in
studies in the rat. In the intermediate and ventral horn in cat, NA and 5-HT
released in tandem by descending monoaminergic neurons were found to differ
in the potency with which they depress transmission from incoming afferents yet
this effect was not apparent in the dorsal horn (Bras et al., 1989).
Immunoreactive fibres for tyrosine hydroxylase, the enzyme involved in the
synthesise of catecholamine neurotransmitters (see Kumer et al., 1996), have
been found in all spinal laminae, and might represent noradrenergic, adrenergic
and/or dopaminergic fibres (VanderHorst and Ulfhake, 2006). NA can prevent
spinal interneurons from responding to nerve impulses from muscle spindle
afferents while having no effect on transmission from primary afferents to the
very same neuron (Jankowska, 2013). Dopaminergic receptors can contribute to
5-HT evoked rhythmogenesis in networks of spinal neurons (Madriaga et al.,
2004). A pharmacological study revealed that low concentrations of 5-HT (< 10
µM) combined with DA can produce a stable locomotor rhythm in rats and mice
(Jiang et al., 1999, Sqalli-Houssaini et al., 1993, Whelan et al., 2000). At higher

178 concentrations (10 - 100 µM), 5-HT alone can activate spinal locomotor circuits.
Taken together, data suggest that high concentrations of 5-HT may be cross-
reacting and activating DA receptors, specifically D1 and D2 receptor families
(Madriaga et al., 2004). Further, different DA receptors may be found in
different laminar locations within the rat spinal cord (van Dijken et al., 1996).
Such findings add credence to the idea that catecholaminergic and serotonergic
signalling pathways interact to produce locomotion (Madriaga et al., 2004).

179
6 Concluding Remarks

180 The present investigation revealed the heterogeneous neurochemical profile of
medullary axonal projections in lower lumbar segments. While the MLF and
CVLM are anatomically and functionally distinct, they were found to use the
same transporters, principally VGLUT2 (61% and 65%, respectively), and in
statistically the same proportions. Rarely a RetST terminal was observed to
contain both VGLUT1 and VGLUT2. Colocalisation of these two transporters is
frequently observed in the developing CNS (see Nakamuara et al., 2005) but
occurs only occasionally in the adult (Hioki et al., 2003). While the significance
of this observation is not clear, colocalisation may possibly confer special
functional properties on these synapses (Todd et al., 2003). An alternative
explanation is that it may be a residual developmental phenomenon (Hioki et
al., 2003). In the rodent brain, extensive expression of VGLUT2 is already
evident at birth in contrast to VGLUT1. In many regions of the CNS, VGLUT2 is
down-regulated in parallel with an increase in VGLUT1 expression (Boulland et
al., 2004, Fremeau et al., 2004). A plausible speculation is that patterns of
primary afferents in adult rats may be reflecting development changes of axonal
connectivity as the cortical “motor map” forms. Results from the present study
have revealed that virtually all axons descending from the CST were found to
contain VGLUT1 (Du Beau et al., 2012).
MLF and CVLM axons were immunoreactive to VGAT (21% and 23%, respectively),
accounting for the expression of GlyT2 (9.05% and 12.51%, respectively) and
GAD67 (7.54% and 8.67%, respectively) with only a minor proportion of terminals
expressing both inhibitory amino acids (2.15% and 2.91%, respectively). During
REM sleep, the balance between GABAergic and serotonergic fibres descending
from the lower brainstem shifts where serotonergic fibres are inactive (Holstege,
1991, Siegel, 1989). Alternatively, findings from electrophysiological recordings
in cat motoneurons showing that projections meditating muscle atonia are
glycinergic (Soja et al., 1987) is congruent with more recent collective studies
implicating the activation of glycinergic neurons in the ventromedial medulla
during this oneiric state (see Holstege, 1991). Taken together, the presumed
glycinergic part of this system may be especially active during REM sleep
whereas the GABAergic part would be active during other states of sleep and
wakefulness (Holstege, 1991). In addition to active inhibition by glycine and
GABA, dysfacilitation of serotonergic and noradrenergic transmission has been
181 demonstrated in the depression of motoneuronal activity during REM sleep
(Fenik et al., 2004). In sum, the hypothesis that the generation and
maintenance of REM atonia are under the influence of many cell groups and
neurotransmitters is likely (see Siegel, 1989). To quantify the reciprocal
relationship of these inhibitory amino acids and their role in the motor atonia, a
further approach would be to investigate the spinal neuronal targets of
inhibitory axons descending from the ventromedial medulla. There is
ultrastructural evidence that glycine and GABA may act as cotransmitters within
the spinal cord. Gephyrin, a scaffolding protein associated with inhibitory
synapses, can differentiate between glycine and GABA at postsynaptic release
sites (Todd et al., 2006).
Findings from the present investigation have revealed that a proportion of
labelled MLF and CVLM axons (17% and 12%, respectively) were not
immunoreactive to the tested antibodies and none of the labelled axons
contained 5-HT, as plausibly explained by the fact that most raphé spinal axons
are unmyelinated (Westlund et al., 1992) and consequently may not sequester
CTb. These unidentified axons may be glutamatergic as unmyelinated primary
afferents (Todd et al., 2003) or possibly may contain VGLUT3, as discussed in
Chapter 3. Controversy exists regarding the proportions of serotonergic
medullary raphé and ventromedial reticular cells that project to the spinal cord
(see Mason, 2001). These discrepancies are likely due to differences in the
anatomical regions studied and in the transport efficiency of the various
retrograde tracers used. Regardless of the precise numbers, there is no doubt
that the descending projection from the medullary raphé and ventromedial
reticular nuclei includes serotonergic and nonserotonergic neurons, both of
which are likely to be of functional significance in the spinal cord (Mason, 2001).
Neuroanatomical studies have used the transganglionic tract tracer IB4 to label
unmyelinated afferent fibres (Finkelstein et al., 1974, Ganser et al., 1983,
Goldstein and Winter, 1999, Scott et al., 1990, Trojanowski et al., 1982) and this
marker could be useful in identifying the unknown neurotransmitter
phenotype(s) used by medullary axons from the neurochemically and
anatomically diverse reticular formation.

182 The present investigation revealed that ChAT interneurons were richly
innervated by CST axons expressing VGLUT1, especially in the dorsal horn. The
dorsal horn ChAT plexus, as observed in previous studies, is localised in lamina III
(Barber et al., 1984) and/or lamina II (Olave et al., 2002). Since these ChAT
processes interact with central terminals of primary afferents, then they are
likely controlling the entry of sensory information (Ribeiro-da-Silva and Cuello,
1990b). In sum, the ChAT dorsal plexus seems to be fundamental to the
modulatory effects of ACh on sensory transmissions. Because dendrites of ChAT
interneurons are better rendered in spinal parasagittal sections in the rat
(Barber, 1984, Olave et al., 2002), classical transverse sections may have
overlooked the extent of these dendritic branching patterns. Three-dimensional
reconstructions of ChAT neurons have demonstrated a unique morphological
signature with a significantly asymmetrical orientation of dendritic processes
(Mesnage et al., 2011). The present study has revealed a uniform pattern of
greater afferent inputs onto cells with dorsally situated dendritic processes. In
terms of stereology, anatomical evidence demonstrates that neurons send out
their dendrites to maximise connections to their potential connection partners
(Stepanyants and Chklovskii, 2005) and theoretical predictions are based upon
such connectivity principles.
In terms of functional implications, there is accumulating evidence suggesting
that impairments of the CST due to injury is not restricted to contralateral
movement as ipsilateral movement may be affected too (see Lemon 2008 review
Pg. 197). Based upon such evidence, neurons in the intact hemisphere may be
involved with the recovery of motor function (Jankowska and Edgley, 2006b)
although there is no consensus about these mechanism (Cauraugh and Summers,
2005, Chen et al., 2002, Hallet, 2001, Serrian et al., 2004). Axonal sprouting
may be considered part of a general rewiring of cortical connections that
explain, at least in part, functional recovery after spinal cord injury (Bareyre et
al, 2004). An important consideration is that descending pathways function as
part of an overarching network rather than as separate controllers of the spinal
cord. As Edgerton has written, “the spinal cord functions as part of the brain,
not as its servant” (see Jankowska and Edgley 2006).

183 The postsynaptic properties of neurons targeted by the CST could be further
investigated by immunoreaction with parvalbumin, a slow Ca2+ buffer associated
with regulation of short-term synaptic plasticity (Caillard et al., 2000). In the
spinal cord, specific cell types and their connectivity patterns have been
distinguished by their expression of different calcium binding proteins (Anelli
and Heckman, 2005). Spinal interneurons that express parvalbumin receive
inputs from myelinated primary afferents and are a likely source of the
inhibitory inputs that selectively regulate non-noxious tactile inputs (Hughes et
al., 2012). An important goal is to understand the role of the CST in gating
sensory afferent inputs and how it might function to rescind unnecessary
reafference.
Descending motor commands that produce specific motor patterns may be
coupled to both brainstem monoaminergic nuclei, e.g. the emotional descending
system, and to reciprocal inhibitory interneurons in the spinal cord (see
Heckman, 2008). The present investigation has provided insights into the
neurochemical properties of medullary axons targeting ChAT and ChAT::nNOS
interneurons, particularly medial partition cells and central canal cell
populations receiving monoaminergic inputs. ChAT interneurons in these regions
that lack nNOS are candidate sources of C boutons onto motoneurons that
regulate excitability via m2 muscarinic receptors (Zagoraiou et al., 2009).
Sherrington (1906) has referred to motoneurons as “the final common pathway.”
Multiple central and peripheral influences coalesce into the motoneuron
activations that produce adaptably appropriate motor behaviours (Wolpaw,
2010). Descending monoaminergic systems confer overall behavioural flexibility
by modulating spinal reflexes (Jankowska and Edgley, 2010). A key problem is
that the descending projections are highly diffuse; the monoaminergic system is
not organised in the specific fashion that characterises other systems, e.g. the
CST (Bjorklund, 1982). Diffuse neuromodulation could plausibly provide the
appropriate overall level of motor pool excitability and specific spinal inhibitory
pathways could be used to specifically focus this excitability.
While the present investigations focus on properties of individual neurons,
findings have implications for understanding networks of neurons with broad
application. When commissural muscarinic terminals originating from lamina X
184 interneurons and intermediate zone partition cells are activated, short-term
potentiation of glutamatergic inputs to motoneurons are induced. This short-
term potentiation is occluded in the presence of the muscarinic antagonist
atropine (Bertrand and Cazalets, 2011), an anti-cholinergic alkaloid. The
present investigations have elucidated the role of ChAT interneurons in the
spinal motor systems in these specific laminar regions. Interactions between
ChAT and glutamatergic neurotransmitter systems have been shown to influence
numerous forms of synaptic plasticity throughout the CNS (see Martella et al.,
2009). Experimental models based on spinal cord reflexes facilitate the study of
the gradual plasticity that makes possible most rapid learning phenomena.
These models reveal principles that may apply to learning and memory
throughout the CNS. Additionally, they offer new approaches to guiding activity-
dependent plasticity so as to restore functions lost to spinal cord injury, trauma
or disease (Wolpaw, 2010).
Individual neurons are adaptive and synaptic strength may vary in response to
central modulation or sensory input (see Alford et al., 2003). Many interneurons
targeted by descending systems are tempered by multisensory inputs arising
from various afferent sensory signals and different muscles (see Jankowska and
Edgley, 2010). Activity in the developing CST and the sensory consequences,
which are inextricably linked to movement, shape the termination topography,
morphology, and possibly spinal circuits more generally (see Martin, 2005).
Cumulative findings have further implications for isolating and redirecting spinal
sensory signals. For instance, haptics exploits the sense of afferent touch arising
from mechanical signals such as the movement of limbs, contact force and
torque. Haptic perception can now be feasibly investigated in novel ways.
Mechanical stimulation can be used to enhance volitional remote control of
robotic devices, e.g. prosthetics (see Robles-De-La-Torre, 2008), to interface
patterns of rhythmic locomotion in concert with supraspinal commands.

185
Appendices for Chapter 1: Brain reconstructions for all experiments
Appendix 1 Figure 1 Brain reconstructions for all MLF brain injection sites
100 µm thick coronal sections were reacted with DAB to reveal the CTb tracer labelling the MLF. To identify the labelled anatomical regions, template drawings from Paxinos and Watson (1997) were superimposed onto scaled photomicrographs. The cerebellum is not shown. The inner darker brown area depicts the core of the injection site and the outer brown area depicts the maximum diffusion of CTb within the brain. During the surgical procedures, the glass micropipette was positioned into the left side of the brain very near the midline (mediolateral = + 0.1). Labelled anatomical regions are shown and described in Chapter 3 and surgical procedures are described in Chapter 2. Animal numbers are designated (1 - 8) for all experiments.

186
Appendix 1 Figure 2 Brain reconstructions for all CVLM brain injection sites
100 µm thick coronal sections were reacted with DAB to reveal the CTb tracer labelling the CVLM. To identify the labelled anatomical regions, template drawings from Paxinos and Watson (1997) were superimposed onto scaled photomicrographs. The cerebellum is not shown. The inner darker brown area depicts the core of the injection site and the outer brown area depicts the maximum diffusion of CTb within the brain. During the surgical procedures, the glass micropipette was positioned into the left side of the brain. Labelled anatomical regions are shown and described in Chapter 3 and surgical procedures are described in Chapter 2. Animal numbers are designated (1 - 6) for all experiments.

187
Appendix 1 Figure 3 Brain reconstructions for all sensorimotor cortex brain injection sites
100 µm thick coronal sections were reacted with DAB to reveal the CTb tracer labelling the CST. To identify the labelled anatomical regions, template drawings from Paxinos and Watson (1997) were superimposed onto scaled photomicrographs. The inner darker brown area depicts the core of the injection site and the outer brown area depicts the maximum diffusion of CTb within the brain. During the surgical procedures, the glass micropipette was positioned into the left side of the brain. Labelled anatomical regions are shown and described in Chapter 4 and surgical procedures are described in Chapter 2. Animal numbers are designated (1 - 9) for all experiments.

188
Appendices for Chapter 2: Laboratory reagents
Appendix 2 Table 1 Formulae for common laboratory reagents
C = Celsius; g = grams; L = litres; log = logarithmic, base 10; ml = millilitre; M = molar (moles per litre).
To prepare 4 L of 0.1 M phosphate buffer (PB) stock solution: 37.4 g of NaH2PO (2H2O) in 1200 ml H2O
84.9 g Na2HPO4 in 3000 ml H2O
Distilled water is added to bring the total volume to 4 L with buffered pH 7.4 To prepare 0.3 M phosphate buffer saline solution (PBS):
100 ml of 0.2 M PB in 1900 distilled water plus 36 g NaCl Sucrose PB: 30 g sucrose in PB PBST: 0.3% Triton X-100 in PB Ringer solution:
Contains CaCl2 + KCl + NaCl + NaHCO3 + glucose in PB, buffered to pH 7.4 To prepare 1L of 4% paraformaldehyde fixative solution:
40 g paraformaldehyde 400 ml distilled H2O at ≈ 68°C
500 ml 0.2 PB NaOH, to raise pH (few drops)
Solution is cooled and then filtered with enough distilled water added to bring the total volume to 1 L with pH adjusted as necessary
pH = - log [H+]

189
Appendix 2 Table 2 Primary antibody characterisation
The following summarised information regarding antibody specificity, controls, species reactivity, and application is provided as per suppliers’ data information as referenced in Tables 3.1, 4.1 and 5.1 in Chapters 3, 4 and 5, respectively.
5-HT Labels synaptic terminals containing 5-HT.
This antibody was quality control tested using
standard immunocytochemistry (ICC) methods.
This antiserum demonstrates positive labelling of
rat hypothalamus, raphé nuclei and spinal cord
using indirect immunofluorescent and AvHRP
techniques.
ChAT Labels cells by catalysing the reversible
synthesis of ACh from acetyl coenzyme and
choline at ChAT synapses. The specificity of
ChAT is shown by ChAT neurons in the brain and
spinal cord. Positive controls include the
presence of immunostaining in human placenta
lysates, rat forebrain/rostral hypothalamus. For
quality assurance, this antiserum is routinely
evaluated by Western blots on mouse brain
lysates.
CTb Traces myelinated axons possessing the
GM1 ganglioside, retrogradely and
anterogradely. The specificity of antibody
against CTb is demonstrated by the lack of
staining in regions of the CNS that did not
contain neurons that had transported the tracer
and by the presence of immunostaining in
neurons known to project to the injection sites.
DBH Recognises the enzyme DBH that is present
in axons that synthesise NA. This antiserum
reacts with a single band on Western blots of
bovine adrenal homogenates. For positive
controls, this antibody stains only cells known to
contain DBH, such as sympathetic neurons,
adrenal medullary cells and central adrenergic
neurons.
GAD67 Labels synaptic vesicles recognising
glutamic acid decarboxylase isoform 67. To
ensure specificity, this antisera was found to
react with 67kDa isoform of GAD67 of rat, mouse
and human origins. Quality assurance was
evaluated by immunohistochemistry by SK-N-SH
cell lysate (human neuroblastoma cell line).
GlyT2 Labels the plasma membrane. To ensure
specificity, this antisera was tested on tissue
sections from the CNS and the staining pattern
corresponds to the pattern described using in
situ hybridisation with probes to GlyT2 mRNA.
nNOS Labels cells producing nitric oxide. The
specificity of this antibody is shown by
immunoreactivity with nNOS in the human brain
and this sequence is highly conserved in rat and
mouse as well. Antibody binding is neutralised in
Western blot by pre-adsorption with the
immunogen peptide.
VGAT This antibody is specific for VGAT
(molecular weight 57 kDa) and antisera
specificity is assured by Western blot on rat
retina lysates. The immunogen peptide shows no
significant homology with other known proteins.
VGLUT1 This antibody is specific for VGLUT1
(molecular weight 62 kDa) localised in synaptic
vesicles exhibiting excitatory features. Antisera
specificity is assured by ICC on tissue sections
from the rat CNS corresponding to the pattern
described using other antisera to VGLUT1.
VGLUT2 This antibody is specific for VGLUT2
(molecular weight 52 kDa) localised in synaptic
vesicles exhibiting excitatory features. Antisera
specificity is assured by Western blots on rat
brain lysate.
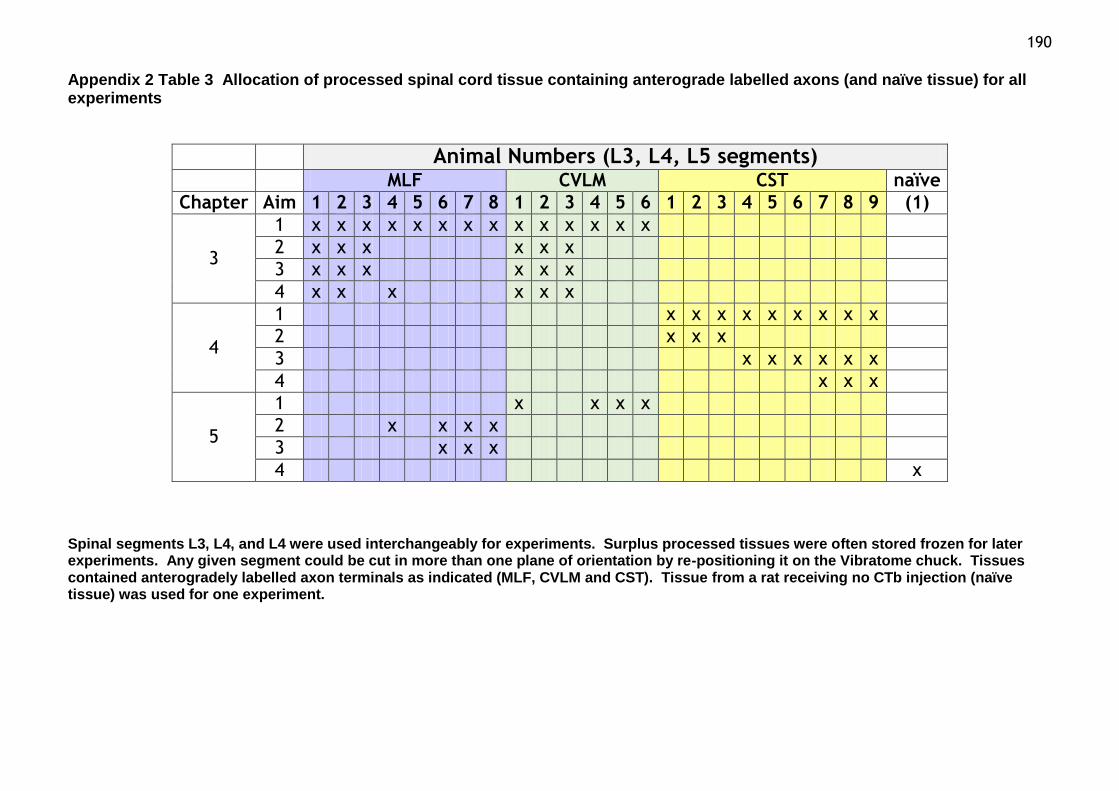
190
Appendix 2 Table 3 Allocation of processed spinal cord tissue containing anterograde labelled axons (and naïve tissue) for all experiments
Animal Numbers (L3, L4, L5 segments) MLF CVLM CST naïve
Chapter Aim 1 2 3 4 5 6 7 8 1 2 3 4 5 6 1 2 3 4 5 6 7 8 9 (1)
3
1 x x x x x x x x x x x x x x
2 x x x x x x
3 x x x x x x
4 x x x x x x
4
1 x x x x x x x x x
2 x x x
3 x x x x x x
4 x x x
5
1 x x x x
2 x x x x
3 x x x
4 x Spinal segments L3, L4, and L4 were used interchangeably for experiments. Surplus processed tissues were often stored frozen for later experiments. Any given segment could be cut in more than one plane of orientation by re-positioning it on the Vibratome chuck. Tissues contained anterogradely labelled axon terminals as indicated (MLF, CVLM and CST). Tissue from a rat receiving no CTb injection (naïve tissue) was used for one experiment.
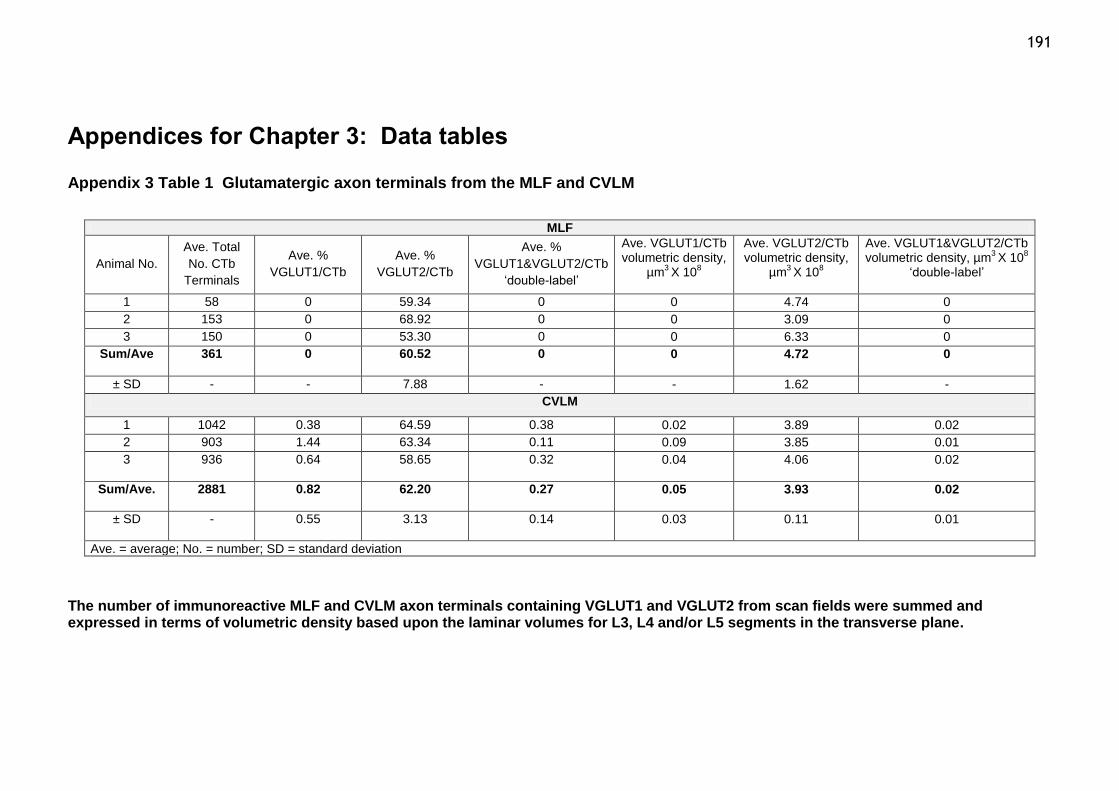
191
Appendices for Chapter 3: Data tables
Appendix 3 Table 1 Glutamatergic axon terminals from the MLF and CVLM
MLF
Animal No.
Ave. Total
No. CTb
Terminals
Ave. %
VGLUT1/CTb
Ave. %
VGLUT2/CTb
Ave. %
VGLUT1&VGLUT2/CTb
‘double-label’
Ave. VGLUT1/CTb volumetric density,
µm3 X 10
8
Ave. VGLUT2/CTb volumetric density,
µm3 X 10
8
Ave. VGLUT1&VGLUT2/CTb volumetric density, µm
3 X 10
8
‘double-label’
1 58 0 59.34 0 0 4.74 0
2 153 0 68.92 0 0 3.09 0
3 150 0 53.30 0 0 6.33 0
Sum/Ave 361 0 60.52 0 0 4.72 0
± SD - - 7.88 - - 1.62 -
CVLM
1 1042 0.38 64.59 0.38 0.02 3.89 0.02
2 903 1.44 63.34 0.11 0.09 3.85 0.01
3 936 0.64 58.65 0.32 0.04
4.06
0.02
Sum/Ave. 2881 0.82 62.20 0.27 0.05
3.93 0.02
± SD - 0.55 3.13 0.14 0.03
0.11
0.01
Ave. = average; No. = number; SD = standard deviation
The number of immunoreactive MLF and CVLM axon terminals containing VGLUT1 and VGLUT2 from scan fields were summed and expressed in terms of volumetric density based upon the laminar volumes for L3, L4 and/or L5 segments in the transverse plane.
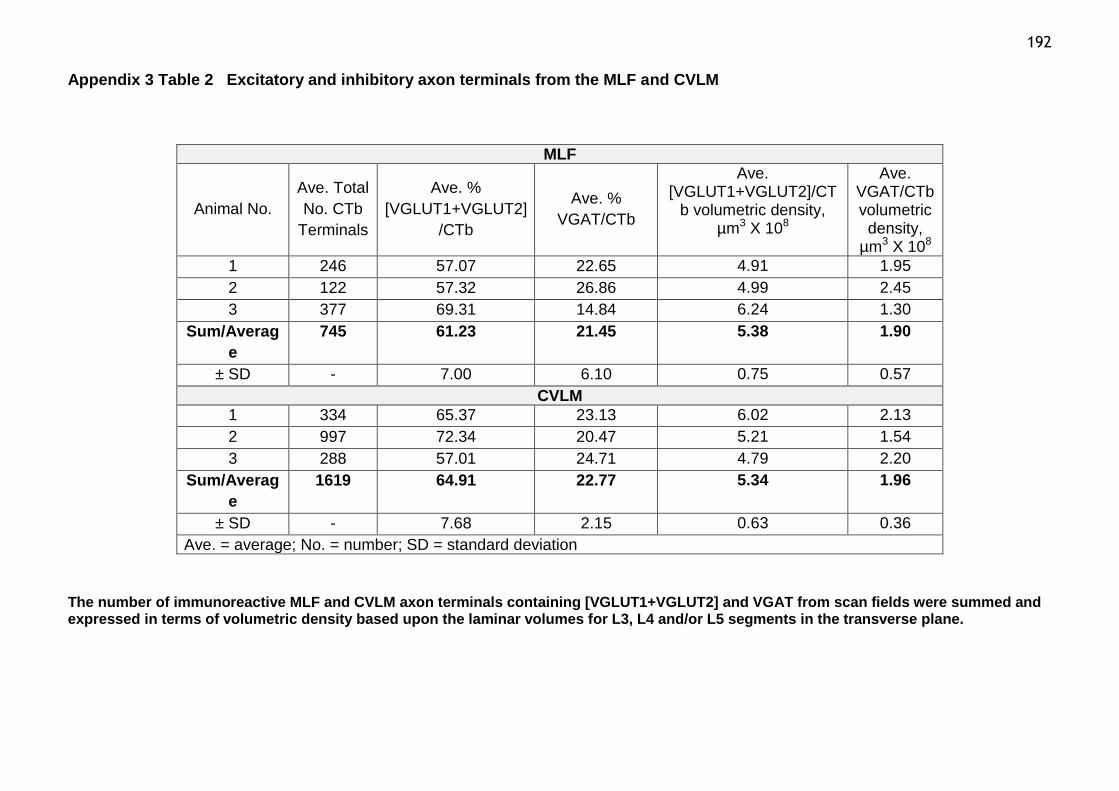
192
Appendix 3 Table 2 Excitatory and inhibitory axon terminals from the MLF and CVLM
MLF
Animal No.
Ave. Total
No. CTb
Terminals
Ave. %
[VGLUT1+VGLUT2]
/CTb
Ave. %
VGAT/CTb
Ave. [VGLUT1+VGLUT2]/CT
b volumetric density, µm3 X 108
Ave. VGAT/CTb volumetric
density, µm3 X 108
1 246 57.07 22.65 4.91 1.95
2 122 57.32 26.86 4.99 2.45
3 377 69.31 14.84 6.24 1.30
Sum/Averag
e
745 61.23 21.45 5.38 1.90
± SD - 7.00 6.10 0.75 0.57
CVLM
1 334 65.37 23.13 6.02 2.13
2 997 72.34 20.47 5.21 1.54
3 288 57.01 24.71 4.79 2.20
Sum/Averag
e
1619 64.91 22.77 5.34 1.96
± SD - 7.68 2.15 0.63 0.36
Ave. = average; No. = number; SD = standard deviation
The number of immunoreactive MLF and CVLM axon terminals containing [VGLUT1+VGLUT2] and VGAT from scan fields were summed and expressed in terms of volumetric density based upon the laminar volumes for L3, L4 and/or L5 segments in the transverse plane.
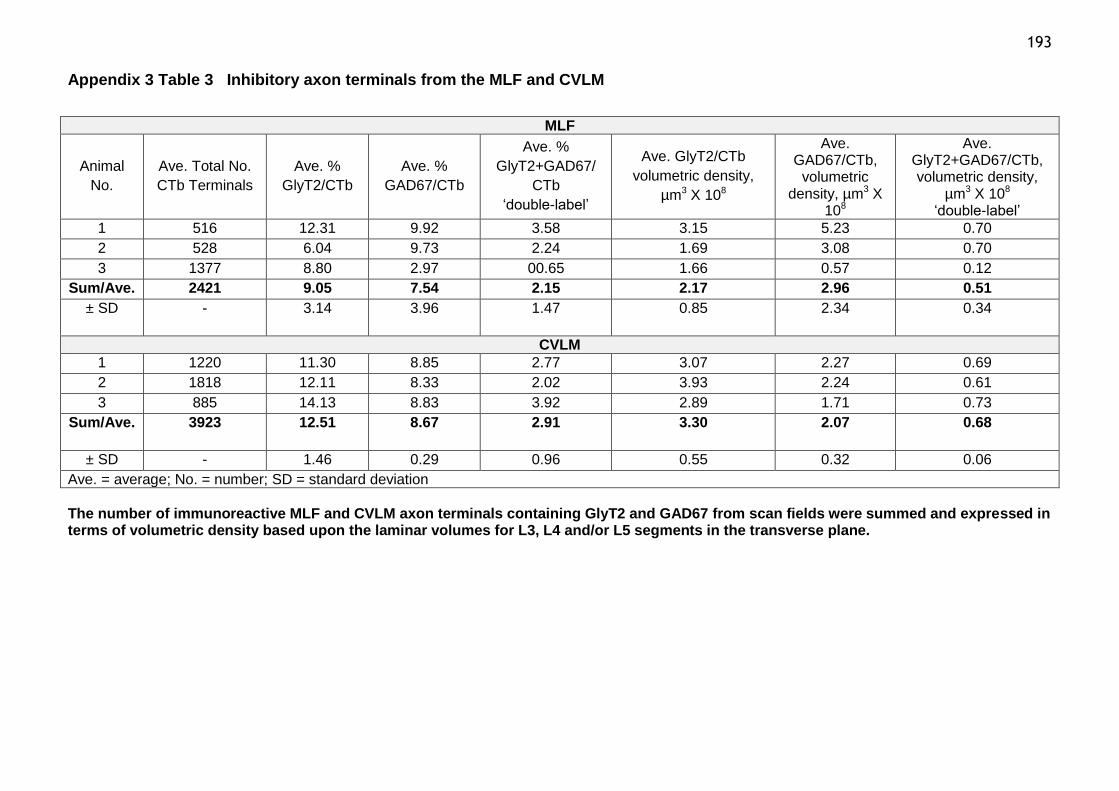
193
Appendix 3 Table 3 Inhibitory axon terminals from the MLF and CVLM
MLF
Animal
No.
Ave. Total No.
CTb Terminals
Ave. %
GlyT2/CTb
Ave. %
GAD67/CTb
Ave. %
GlyT2+GAD67/
CTb
‘double-label’
Ave. GlyT2/CTb
volumetric density,
µm3 X 108
Ave. GAD67/CTb,
volumetric density, µm3 X
108
Ave. GlyT2+GAD67/CTb, volumetric density,
µm3 X 108
‘double-label’
1 516 12.31 9.92 3.58 3.15 5.23 0.70
2 528 6.04 9.73 2.24 1.69 3.08 0.70
3 1377 8.80 2.97 00.65 1.66 0.57 0.12
Sum/Ave. 2421 9.05 7.54 2.15 2.17 2.96 0.51
± SD - 3.14 3.96 1.47 0.85
2.34
0.34
CVLM
1 1220 11.30 8.85 2.77 3.07 2.27 0.69
2 1818 12.11 8.33 2.02 3.93 2.24 0.61
3 885 14.13 8.83 3.92 2.89 1.71 0.73
Sum/Ave. 3923 12.51 8.67 2.91
3.30 2.07 0.68
± SD - 1.46 0.29 0.96 0.55 0.32 0.06
Ave. = average; No. = number; SD = standard deviation
The number of immunoreactive MLF and CVLM axon terminals containing GlyT2 and GAD67 from scan fields were summed and expressed in terms of volumetric density based upon the laminar volumes for L3, L4 and/or L5 segments in the transverse plane.
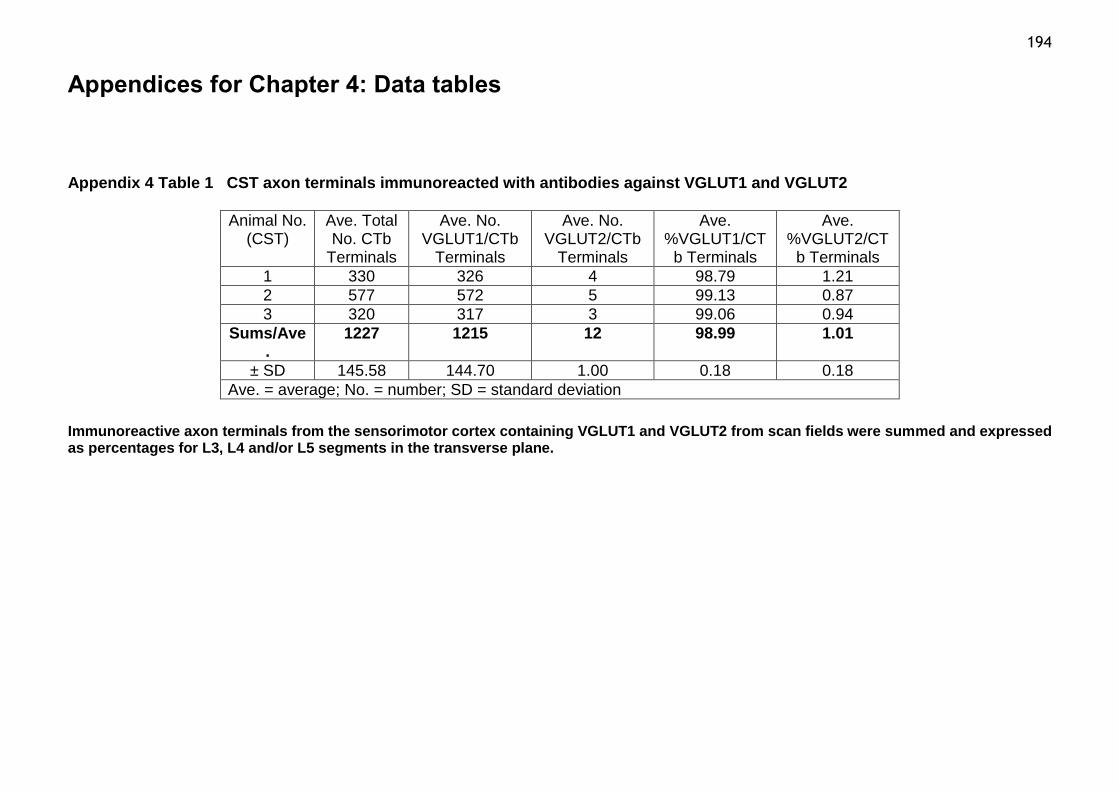
194
Appendices for Chapter 4: Data tables
Appendix 4 Table 1 CST axon terminals immunoreacted with antibodies against VGLUT1 and VGLUT2
Animal No. (CST)
Ave. Total No. CTb
Terminals
Ave. No. VGLUT1/CTb
Terminals
Ave. No. VGLUT2/CTb
Terminals
Ave. %VGLUT1/CT
b Terminals
Ave. %VGLUT2/CT
b Terminals
1 330 326 4 98.79 1.21
2 577 572 5 99.13 0.87
3 320 317 3 99.06 0.94
Sums/Ave.
1227 1215 12 98.99 1.01
± SD 145.58 144.70 1.00 0.18 0.18
Ave. = average; No. = number; SD = standard deviation
Immunoreactive axon terminals from the sensorimotor cortex containing VGLUT1 and VGLUT2 from scan fields were summed and expressed as percentages for L3, L4 and/or L5 segments in the transverse plane.
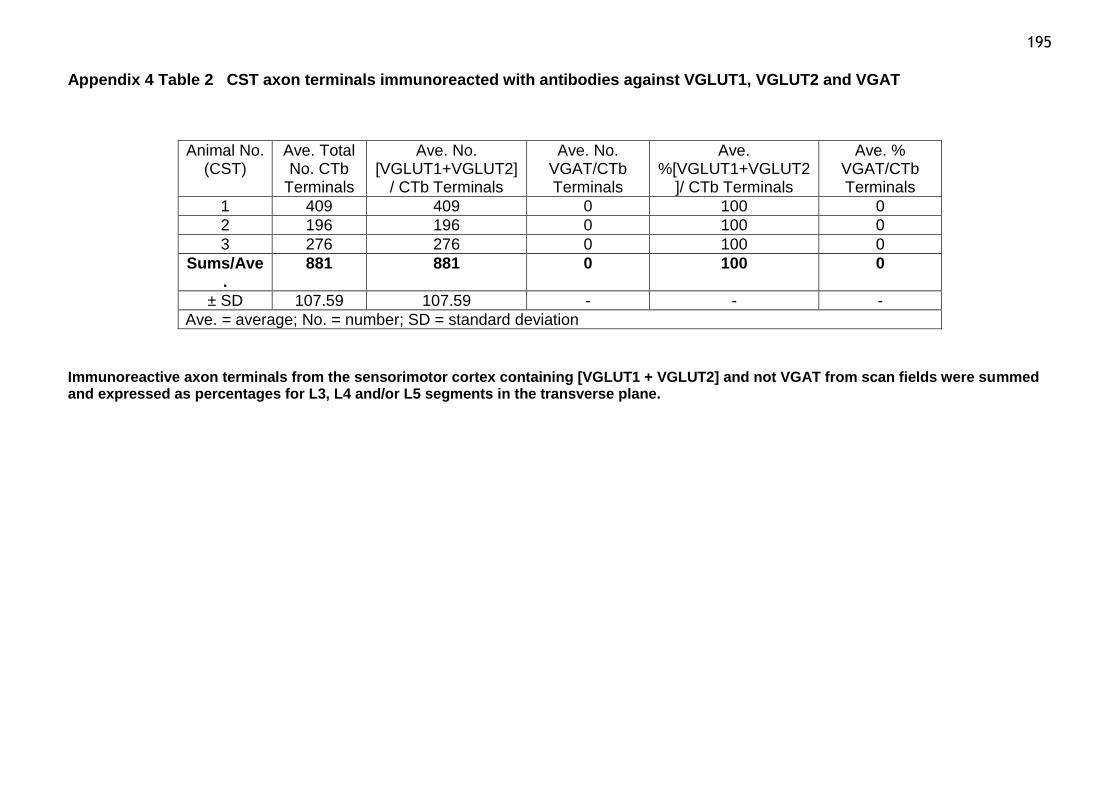
195
Appendix 4 Table 2 CST axon terminals immunoreacted with antibodies against VGLUT1, VGLUT2 and VGAT
Animal No. (CST)
Ave. Total No. CTb
Terminals
Ave. No. [VGLUT1+VGLUT2]
/ CTb Terminals
Ave. No. VGAT/CTb Terminals
Ave. %[VGLUT1+VGLUT2
]/ CTb Terminals
Ave. % VGAT/CTb Terminals
1 409 409 0 100 0
2 196 196 0 100 0
3 276 276 0 100 0
Sums/Ave.
881 881 0 100 0
± SD 107.59 107.59 - - -
Ave. = average; No. = number; SD = standard deviation
Immunoreactive axon terminals from the sensorimotor cortex containing [VGLUT1 + VGLUT2] and not VGAT from scan fields were summed and expressed as percentages for L3, L4 and/or L5 segments in the transverse plane.

196
Appendix 4 Table 3 Immunoreactive boutons onto laminae I- V ChAT interneurons targeted by the CST in the transverse plane
LAMINAE I - V TRANSVERSE
Density = No. Boutons • 1,000 µm-2
SOMATIC
Animal No. (CST)
No. Cells
Ave. No. CTb+VGLUT1 Contacts
Ave. Total No. VGLUT1 Contacts
Ave. Radii µm
Ave. CTb+VGLUT1 Contacts
Ave. Total VGLUT1 Contacts
4 5 8 17 9.13 1.57 5.23
5 3 8 9 8.23 2.56 5.28
6 7 21 28 8.34 0.67 2.83
Sum/Ave 15 37
54 8.58 1.60 4.45
± SD - 7.51 9.54 0.47 0.95 1.40
DENDRITIC
Animal No. (CST)
No. Cells
Ave. No. CTb+VGLUT1 Contacts
Ave. Total No. VGLUT1 Contacts
Ave. No. Dendrites
Ave. Length
µm
Ave. CTb+VGLUT1 Contacts
Ave. Total VGLUT1 Contacts
4 5 12 18 2.80 134.20 2.73 4.93
5 3 4 4 2.33 43.23 3.73 3.73
6 7 42 52 2.29 116.33 2.24 15.58
Sum/Ave 15 58 74 2.47 97.92 2.47 8.08
± SD - 20.03 24.68 0.28 48.20 0.28 6.53
Ave. = average; No. = number; SD = standard deviation
VGLUT1+CTb and VGLUT1contacts onto ChAT interneurons were expressed in terms of surface area densities.
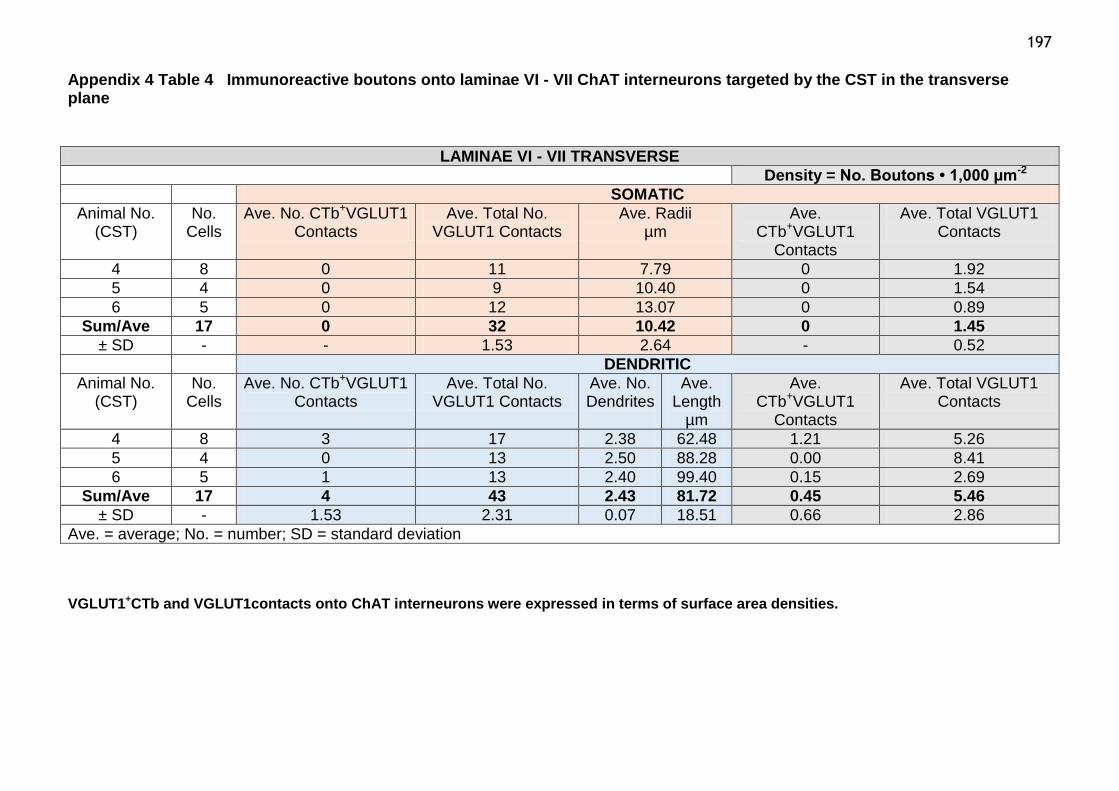
197
Appendix 4 Table 4 Immunoreactive boutons onto laminae VI - VII ChAT interneurons targeted by the CST in the transverse plane
LAMINAE VI - VII TRANSVERSE
Density = No. Boutons • 1,000 µm-2
SOMATIC
Animal No. (CST)
No. Cells
Ave. No. CTb+VGLUT1 Contacts
Ave. Total No. VGLUT1 Contacts
Ave. Radii µm
Ave. CTb+VGLUT1
Contacts
Ave. Total VGLUT1 Contacts
4 8 0 11 7.79 0 1.92
5 4 0 9 10.40 0 1.54
6 5 0 12 13.07 0 0.89
Sum/Ave 17 0 32 10.42 0 1.45
± SD - - 1.53 2.64 - 0.52
DENDRITIC
Animal No. (CST)
No. Cells
Ave. No. CTb+VGLUT1 Contacts
Ave. Total No. VGLUT1 Contacts
Ave. No. Dendrites
Ave. Length
µm
Ave. CTb+VGLUT1
Contacts
Ave. Total VGLUT1 Contacts
4 8 3 17 2.38 62.48 1.21 5.26
5 4 0 13 2.50 88.28 0.00 8.41
6 5 1 13 2.40 99.40 0.15 2.69
Sum/Ave 17 4 43 2.43 81.72 0.45 5.46
± SD - 1.53 2.31 0.07 18.51 0.66 2.86
Ave. = average; No. = number; SD = standard deviation
VGLUT1+CTb and VGLUT1contacts onto ChAT interneurons were expressed in terms of surface area densities.

198
Appendix 4 Table 5 Immunoreactive boutons onto lamina X ChAT interneurons targeted by the CST in the transverse plane
LAMINA X TRANSVERSE
Density = No. Boutons • 1,000 µm-2
SOMATIC
Animal No. (CST)
No. Cells
Ave. No. CTb+VGLUT1
Contacts
Ave. Total No. VGLUT1 Contacts
Ave. Radii µm
Ave. CTb+VGLUT1
Contacts
Ave. Total VGLUT1 Contacts
4 14 0 19 7.98 0 1.75
5 10 2 24 8.88 0.20 2.31
6 8 1 21 10.63 0.10 1.87
Count/Sum/Ave 32 3 64 9.16 0.10 1.98
± SD - 1.00 2.52 1.35 0.10 0.29
DENDRITIC
Animal No. (CST)
No. Cells
Ave. No. CTb+VGLUT1
Contacts
Ave. Total No. VGLUT1 Contacts
Ave. No. Dendrites
Ave. Length
µm
Ave. CTb+VGLUT1
Contacts
Ave. Total VGLUT1 Contacts
4 1 34 2.00 87.22 0.07 4.78
5 1 21 1.90 59.77 0.26 7.89
6 1 15 3.00 94.24 0.10 3.91
Count/Sum/Ave 3 70 2.30 80.41 0.14 5.53
± SD 0.00 9.71 0.61 18.22 0.10 2.09
Ave. = average; No. = number; SD = standard deviation
VGLUT1+CTb and VGLUT1contacts onto ChAT interneurons were expressed in terms of surface area densities.

199
Appendix 4 Table 6 Immunoreactive boutons onto laminae I - V ChAT interneurons targeted by the CST in the parasagittal plane
LAMINAE I - V PARASAGITTAL
Density = No. Boutons • 1,000 µm-2
SOMATIC
Animal No. (CST)
No. Cells
Ave. No. CTb+VGLUT1
Contacts
Ave. Total No. VGLUT1 Contacts
Ave. Radii µm
Ave. CTb+VGLUT1
Contacts
Ave. Total VGLUT1 Contacts
7 2 7 12 11.92 2.22 3.99
8 5 5 21 8.26 1.80 5.24
9 5 7 45 9.51 1.21 9.29
Count/Sum/Ave 12 19 78 9.90 1.74 6.17
± SD - 1.15 17.06 1.86 0.51 2.27
DENDRITIC
Animal No. (CST)
No. Cells
Ave. No. CTb+VGLUT1
Contacts
Ave. Total No. VGLUT1 Contacts
Ave. No. Dendrites
Ave. Length
µm
Ave. CTb+VGLUT1
Contacts
Ave. Total VGLUT1 Contacts
7 2 14 37 4.50 582.00 3.26 9.25
8 5 12 66 2.20 290.04 1.79 8.51
9 5 22 119 2.80 261.96 4.72 18.13
Count/Sum/Ave 12 48 222 3.17 378.00 3.26 11.96
± SD - 5.29 41.58 1.19 177.23 1.46 5.35
Ave. = average; No. = number; SD = standard deviation
VGLUT1+CTb and VGLUT1contacts onto ChAT interneurons were expressed in terms of surface area densities.
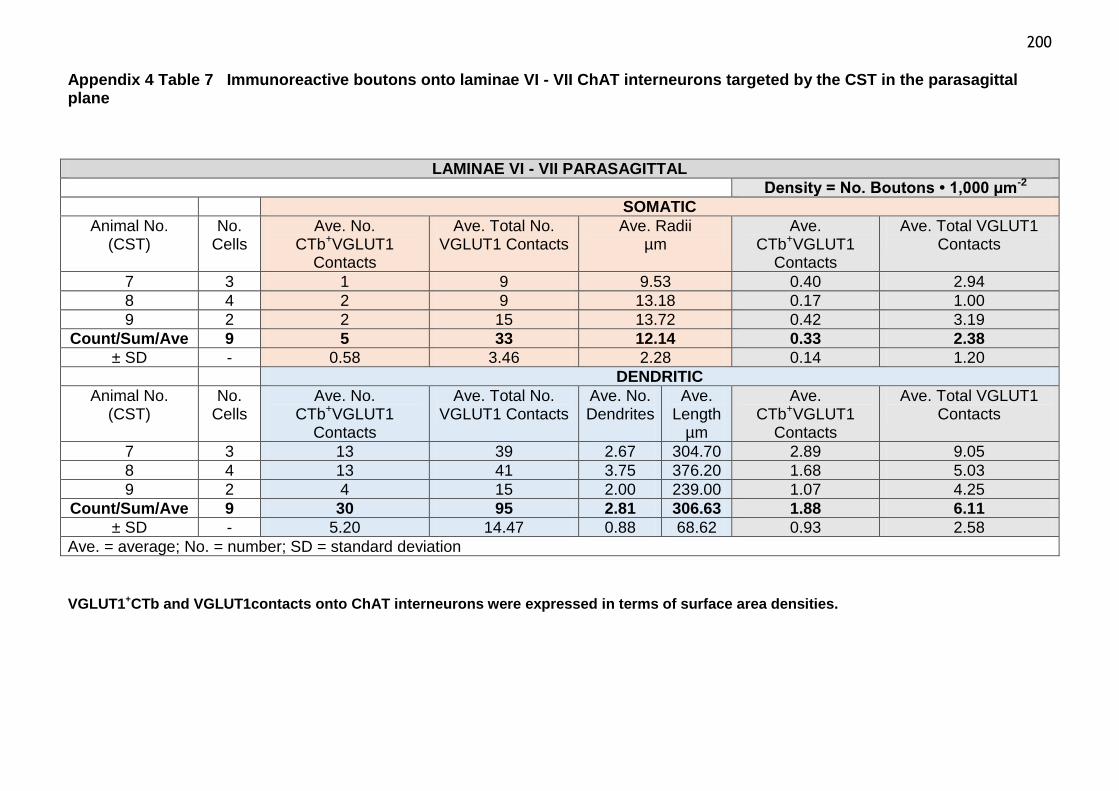
200
Appendix 4 Table 7 Immunoreactive boutons onto laminae VI - VII ChAT interneurons targeted by the CST in the parasagittal plane
LAMINAE VI - VII PARASAGITTAL
Density = No. Boutons • 1,000 µm-2
SOMATIC
Animal No. (CST)
No. Cells
Ave. No. CTb+VGLUT1
Contacts
Ave. Total No. VGLUT1 Contacts
Ave. Radii µm
Ave. CTb+VGLUT1
Contacts
Ave. Total VGLUT1 Contacts
7 3 1 9 9.53 0.40 2.94
8 4 2 9 13.18 0.17 1.00
9 2 2 15 13.72 0.42 3.19
Count/Sum/Ave 9 5 33 12.14 0.33 2.38
± SD - 0.58 3.46 2.28 0.14 1.20
DENDRITIC
Animal No. (CST)
No. Cells
Ave. No. CTb+VGLUT1
Contacts
Ave. Total No. VGLUT1 Contacts
Ave. No. Dendrites
Ave. Length
µm
Ave. CTb+VGLUT1
Contacts
Ave. Total VGLUT1 Contacts
7 3 13 39 2.67 304.70 2.89 9.05
8 4 13 41 3.75 376.20 1.68 5.03
9 2 4 15 2.00 239.00 1.07 4.25
Count/Sum/Ave 9 30 95 2.81 306.63 1.88 6.11
± SD - 5.20 14.47 0.88 68.62 0.93 2.58
Ave. = average; No. = number; SD = standard deviation
VGLUT1+CTb and VGLUT1contacts onto ChAT interneurons were expressed in terms of surface area densities.
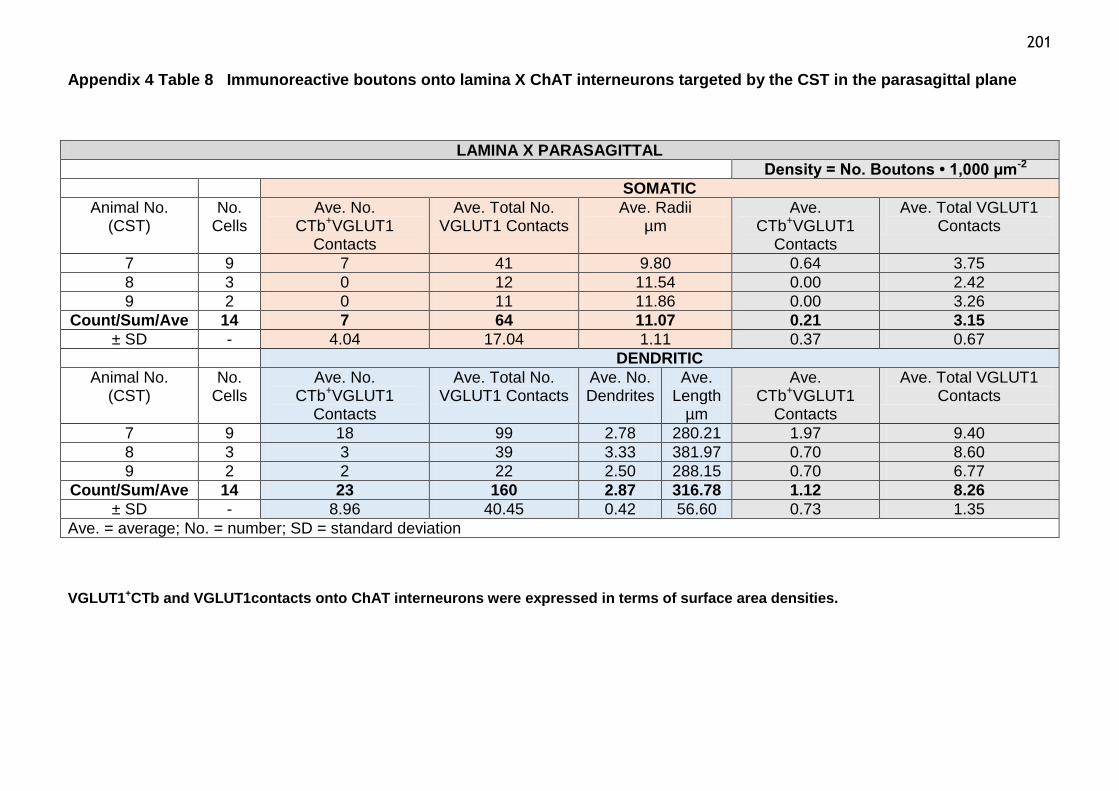
201
Appendix 4 Table 8 Immunoreactive boutons onto lamina X ChAT interneurons targeted by the CST in the parasagittal plane
LAMINA X PARASAGITTAL
Density = No. Boutons • 1,000 µm-2
SOMATIC
Animal No. (CST)
No. Cells
Ave. No. CTb+VGLUT1
Contacts
Ave. Total No. VGLUT1 Contacts
Ave. Radii µm
Ave. CTb+VGLUT1
Contacts
Ave. Total VGLUT1 Contacts
7 9 7 41 9.80 0.64 3.75
8 3 0 12 11.54 0.00 2.42
9 2 0 11 11.86 0.00 3.26
Count/Sum/Ave 14 7 64 11.07 0.21 3.15
± SD - 4.04 17.04 1.11 0.37 0.67
DENDRITIC
Animal No. (CST)
No. Cells
Ave. No. CTb+VGLUT1
Contacts
Ave. Total No. VGLUT1 Contacts
Ave. No. Dendrites
Ave. Length
µm
Ave. CTb+VGLUT1
Contacts
Ave. Total VGLUT1 Contacts
7 9 18 99 2.78 280.21 1.97 9.40
8 3 3 39 3.33 381.97 0.70 8.60
9 2 2 22 2.50 288.15 0.70 6.77
Count/Sum/Ave 14 23 160 2.87 316.78 1.12 8.26
± SD - 8.96 40.45 0.42 56.60 0.73 1.35
Ave. = average; No. = number; SD = standard deviation
VGLUT1+CTb and VGLUT1contacts onto ChAT interneurons were expressed in terms of surface area densities.

202
Appendix 4 Table 9 Densities of ChAT dorsoventral and rostrocaudal interneurons related to dendritic orientations
XY Ratio < 1 (DV) Orientation, Parasagittal
Total VGLUT1 and VGLUT1+CTb contact density = No. Boutons ● 1,000 µm-2
Animal No. (CST)
Dorsocaudal
Dorsorostral Ventrorostral Ventrocaudal
7 2.35 2.48 0.72 0.78
8 3.52 1.23 1.50 0.91
9 - 1.58 1.10 1.13
Averages 2.94 1.76 1.10 0.94
± SD 0.83 0.64 0.39 0.17
XY Ratio > 1 (RC) Orientation, Parasagittal
Total VGLUT1 and VGLUT1+CTb contact density = No. Boutons ● 1,000 µm-2
Animal No. (CST)
Dorsocaudal
Dorsorostral Ventrorostral Ventrocaudal
7 1.55 1.02 1.58 0.79
8 1.24 1.91 0.48 1.45
9 2.17 1.16 0.47 0.55
Averages 1.65 1.36 0.84 0.93
± SD 0.78 0.48 0.64 0.47
Ave. = average; No. = number; SD = standard deviation
The VGLUT1+CTb and VGLUT1 contact densities of dorsoventral (DV) ChAT interneurons (XY Ratio < 1) and rostrocaudal (RC) ChAT interneurons (XY Ratio > 1) across I-VII and X laminar boundaries were classified according to their dendritic orientation.
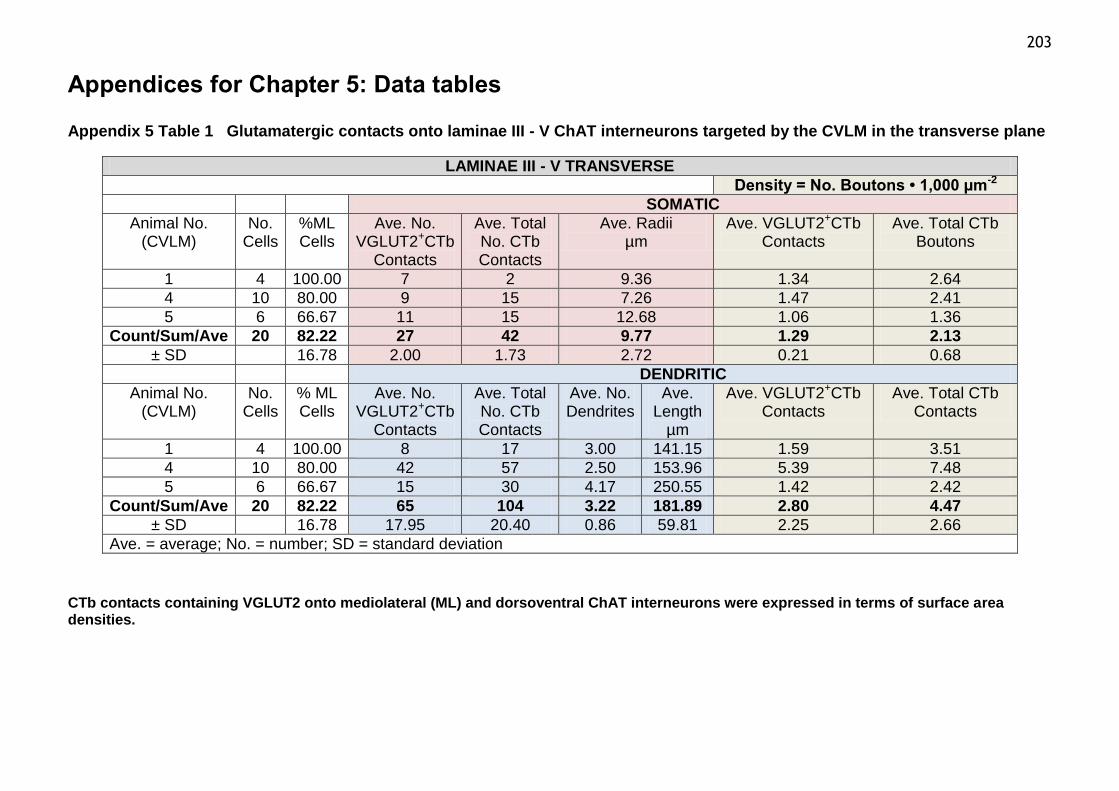
203
Appendices for Chapter 5: Data tables
Appendix 5 Table 1 Glutamatergic contacts onto laminae III - V ChAT interneurons targeted by the CVLM in the transverse plane
LAMINAE III - V TRANSVERSE
Density = No. Boutons • 1,000 µm-2
SOMATIC
Animal No. (CVLM)
No. Cells
%ML Cells
Ave. No. VGLUT2+CTb
Contacts
Ave. Total No. CTb
Contacts
Ave. Radii µm
Ave. VGLUT2+CTb Contacts
Ave. Total CTb
Boutons
1 4 100.00 7 2 9.36 1.34 2.64
4 10 80.00 9 15 7.26 1.47 2.41
5 6 66.67 11 15 12.68 1.06 1.36
Count/Sum/Ave 20 82.22 27 42 9.77 1.29 2.13
± SD 16.78 2.00 1.73 2.72 0.21 0.68
DENDRITIC
Animal No. (CVLM)
No. Cells
% ML Cells
Ave. No. VGLUT2+CTb
Contacts
Ave. Total No. CTb Contacts
Ave. No. Dendrites
Ave. Length
µm
Ave. VGLUT2+CTb Contacts
Ave. Total CTb
Contacts
1 4 100.00 8 17 3.00 141.15 1.59 3.51
4 10 80.00 42 57 2.50 153.96 5.39 7.48
5 6 66.67 15 30 4.17 250.55 1.42 2.42
Count/Sum/Ave 20 82.22 65 104 3.22 181.89 2.80 4.47
± SD 16.78 17.95 20.40 0.86 59.81 2.25 2.66
Ave. = average; No. = number; SD = standard deviation
CTb contacts containing VGLUT2 onto mediolateral (ML) and dorsoventral ChAT interneurons were expressed in terms of surface area densities.
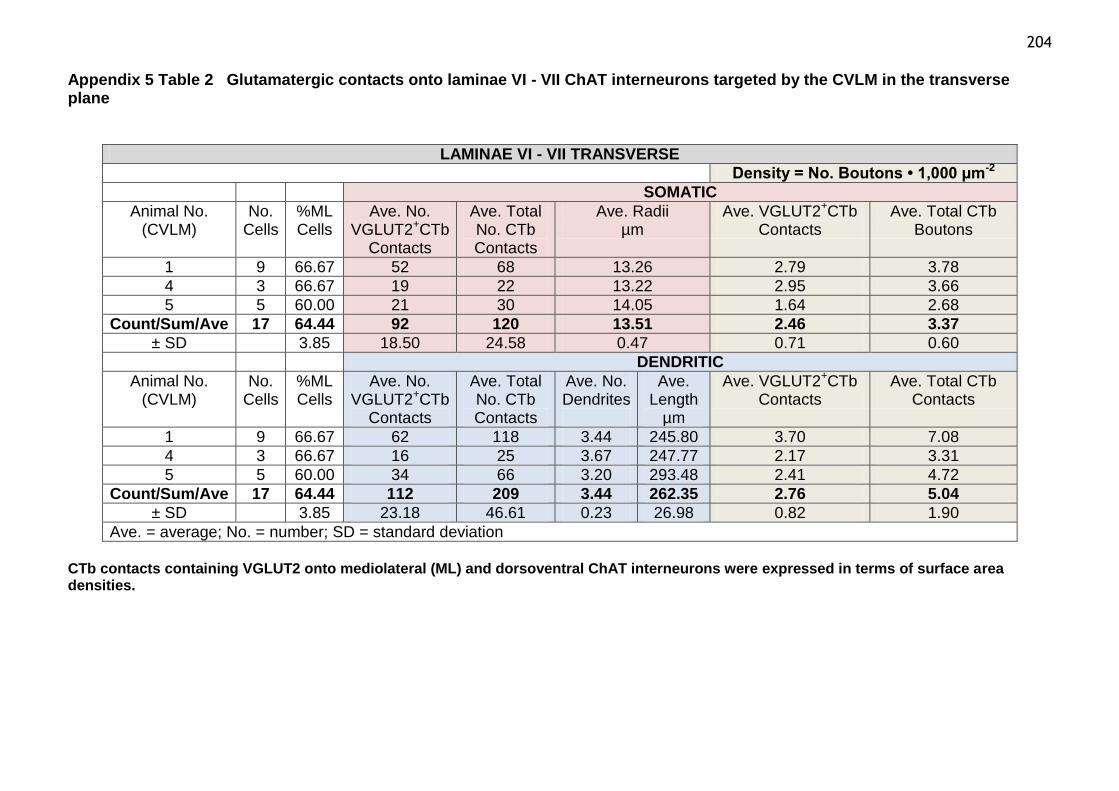
204
Appendix 5 Table 2 Glutamatergic contacts onto laminae VI - VII ChAT interneurons targeted by the CVLM in the transverse plane
LAMINAE VI - VII TRANSVERSE
Density = No. Boutons • 1,000 µm-2
SOMATIC
Animal No. (CVLM)
No. Cells
%ML Cells
Ave. No. VGLUT2+CTb
Contacts
Ave. Total No. CTb
Contacts
Ave. Radii µm
Ave. VGLUT2+CTb Contacts
Ave. Total CTb
Boutons
1 9 66.67 52 68 13.26 2.79 3.78
4 3 66.67 19 22 13.22 2.95 3.66
5 5 60.00 21 30 14.05 1.64 2.68
Count/Sum/Ave 17 64.44 92 120 13.51 2.46 3.37
± SD 3.85 18.50 24.58 0.47 0.71 0.60
DENDRITIC
Animal No. (CVLM)
No. Cells
%ML Cells
Ave. No. VGLUT2+CTb
Contacts
Ave. Total No. CTb Contacts
Ave. No. Dendrites
Ave. Length
µm
Ave. VGLUT2+CTb Contacts
Ave. Total CTb
Contacts
1 9 66.67 62 118 3.44 245.80 3.70 7.08
4 3 66.67 16 25 3.67 247.77 2.17 3.31
5 5 60.00 34 66 3.20 293.48 2.41 4.72
Count/Sum/Ave 17 64.44 112 209 3.44 262.35 2.76 5.04
± SD 3.85 23.18 46.61 0.23 26.98 0.82 1.90
Ave. = average; No. = number; SD = standard deviation CTb contacts containing VGLUT2 onto mediolateral (ML) and dorsoventral ChAT interneurons were expressed in terms of surface area densities.

205
Appendix 5 Table 3 Glutamatergic contacts onto lamina X ChAT interneurons targeted by the CVLM in the transverse plane
LAMINAE X TRANSVERSE
Density = No. Boutons • 1,000 µm-2
SOMATIC
Animal No. (CVLM)
No. Cells
%ML Cells
Ave. No. VGLUT2+CTb
Contacts
Ave. Total No. CTb
Contacts
Ave. Radii µm
Ave. VGLUT2+CTb Contacts
Ave. Total CTb
Boutons
1 4 25.00 8 18 10.65 1.30 3.08
4 6 66.67 24 26 12.59 2.01 2.41
5 10 20.00 40 49 12.02 2.24 2.99
Count/Sum/Ave 20 37.22 72 93 11.75 1.85 2.83
± SD 25.62 16.00 16.09 1.00 0.49 0.36
DENDRITIC
Animal No. (CVLM)
No. Cells
%ML Cells
Ave. No. VGLUT2+CTb
Contacts
Ave. Total No. CTb Contacts
Ave. No. Dendrites
Ave. Length
µm
Ave. VGLUT2+CTb Contacts
Ave. Total CTb
Contacts
1 4 25.00 21 28 3.25 126.50 7.60 10.43
4 6 66.67 40 46 2.33 166.43 7.86 9.09
5 10 20.00 69 93 3.30 159.70 9.58 12.28
Count/Sum/Ave 20 37.22 130 167 2.96 150.88 8.34 10.60
± SD 25.62 24.17 33.56 0.54 21.38 1.08 1.60
Ave. = average; No. = number; SD = standard deviation CTb contacts containing VGLUT2 onto mediolateral (ML) and dorsoventral ChAT interneurons were expressed in terms of surface area densities.

206
Appendix 5 Table 4 Inhibitory contacts onto laminae III - V ChAT interneurons targeted by the CVLM in the transverse plane
LAMINAE III - V TRANSVERSE
Density = No. Boutons • 1,000 µm-2
SOMATIC
Animal No. (CVLM)
No. Cells
%ML Cells
Ave. No. VGAT+CTb Contacts
Ave. Total No. CTb
Contacts
Ave. Radii µm
Ave. VGAT+CTb Contacts
Ave. Total CTb
Boutons
6 7 57.14 6 25 9.85 0.84 3.63
1 9 44.44 7 22 11.63 0.66 1.76
5 3 66.67 0 5 14.49 0.00 0.60
Count/Sum/Ave 19 56.08 13 52 11.99 0.50 2.00
± SD 11.15 3.79 10.79 2.34 0.44 1.53
DENDRITIC
Animal No. (CVLM)
No. Cells
%ML Cells
Ave. No. VGAT+CTb Contacts
Ave. Total No. CTb Contacts
Ave. No. Dendrites
Ave. Length
µm
Ave. VGAT+CTb Contacts
Ave. Total CTb
Contacts
6 7 57.14 9 61 2.57 227.76 1.27 5.61
1 9 44.44 19 47 2.67 142.13 1.67 4.16
5 3 66.67 7 14 3.00 168.83 1.22 2.72
Count/Sum/Ave 19 56.08 35 122 2.75 179.57 1.38 4.16
± SD 11.15 6.43 24.13 0.23 43.81 0.25 1.45
Ave. = average; No. = number; SD = standard deviation
CTb contacts containing VGAT onto mediolateral (ML) and dorsoventral ChAT interneurons were expressed in terms of surface area densities.

207
Appendix 5 Table 5 Inhibitory contacts onto laminae VI - VII ChAT interneurons targeted by the CVLM in the transverse plane
LAMINAE VI - VII TRANSVERSE
Density = No. Boutons • 1,000 µm-2
SOMATIC
Animal No. (CVLM)
No. Cells
%ML Cells
Ave. No. VGAT+CTb Contacts
Ave. Total No. CTb
Contacts
Ave. Radii µm
Ave. VGAT+CTb Contacts
Ave. Total CTb
Boutons
6 11 27.28 4 18 13.21 0.19 0.78
1 5 40.00 4 13 11.02 0.65 1.95
5 8 12.50 5 14 9.49 0.52 1.46
Count/Sum/Ave 24 26.59 13 45 11.24 0.45 1.40
± SD 13.76 0.58 2.65 1.87 0.24 0.59
DENDRITIC
Animal No. No. Cells
%ML Cells
Ave. No. VGAT+CTb Contacts
Ave. Total No. CTb Contacts
Ave. No. Dendrites
Ave. Length
µm
Ave. VGAT+CTb Contacts
Ave. Total CTb
Contacts
6 11 27.28 12 58 4.00 294.02 0.60 2.57
1 5 40.00 16 34 2.00 195.16 1.68 4.00
5 8 12.50 14 28 1.88 60.36 1.29 5.49
Count/Sum/Ave 24 26.59 45 120 2.63 183.18 1.19 4.02
± SD 13.76 2.65 15.87 1.19 117.29 0.54 1.46
Ave. = average; No. = number; SD = standard deviation CTb contacts containing VGAT onto mediolateral (ML) and dorsoventral ChAT interneurons were expressed in terms of surface area densities.

208
Appendix 5 Table 6 Inhibitory contacts onto lamina X ChAT interneurons targeted by the CVLM in the transverse plane
LAMINAE X TRANSVERSE
Density = No. Boutons • 1,000 µm-2
SOMATIC
Animal No. (CVLM)
No. Cells
%ML Cells
Ave. No. VGAT+CTb Contacts
Ave. Total No. CTb
Contacts
Ave. Radii µm
Ave. VGAT+CTb Contacts
Ave. Total CTb
Boutons
6 3 80.10 3 3 11.28 0.55 0.55
1 9 70.22 4 20 9.92 0.44 2.03
5 6 62.21 2 15 9.68 0.50 2.19
Count/Sum/Ave 18 70.84 9 38 10.29 0.50 1.59
± SD 8.96 1.00 8.74 0.86 0.05 0.90
DENDRITIC
Animal No. No. Cells
%ML Cells
Ave. No. VGAT+CTb Contacts
Ave. Total No. CTb Contacts
Ave. No. Dendrites
Ave. Length
µm
Ave. VGAT+CTb Contacts
Ave. Total CTb
Contacts
6 3 80.10 7 12 4.33 188.57 2.12 3.80
1 9 70.22 33 53 3.22 179.87 3.99 6.28
5 6 62.21 5 31 2.33 106.23 1.05 6.82
Count/Sum/Ave 18 70.84 45 96 3.30 158.22 2.39 5.64
± SD 8.96 15.62 20.52 1.00 45.23 1.49 1.61
Ave. = average; No. = number; SD = standard deviation
CTb contacts containing VGAT onto mediolateral (ML) and dorsoventral ChAT interneurons were expressed in terms of surface area densities.

209
Appendix 5 Table 7 Laminae VI - VII ChAT interneurons targeted by the MLF and 5-HT in the horizontal plane
MLF LAMINAE VI-VII HORIZONTAL
Density = No. Boutons • 1,000 µm-2
SOMATIC
Animal No. (MLF)
No. ChAT Cells
%contra-lateral cells
%ChAT cells
nNOS+
No. CTb Contacts
No. 5-HT Contacts
Ave. Radii µm
Ave. Density CTb
Contacts
Ave. Density 5-HT Contacts
6 7 42.86 14.29 14 7 12.93 1.00 0.40
7 4 75.00 50.00 4 17 10.63 0.68 3.07
8 6 33.33 50.00 19 37 12.09 1.01 2.56
Count/Sum/Ave 17 50.40 38.10 37 61 12.18 0.89 2.01
± SD - 21.83 20.62 7.64 15.28 1.35 0.19 1.42
DENDRITIC
Animal No. (MLF)
No. ChAT Cells
%contra-lateral cells
%ChAT cells
nNOS+
No. CTb Contacts
No. 5-HT Contacts
Ave. No. Dendrites
Ave. Length
µm
Ave. Density CTb
Contacts
Ave. Density 5-HT Contacts
6 7 42.86 14.29 34 42 3.86 372.41 2.16 2.65
7 4 75.00 50.00 13 33 2.25 266.33 1.84 4.70
8 6 33.33 50.00 32 125 2.67 322.72 2.36 6.68
Count/Sum/Ave 17 50.40 38.10 79 200 2.92 320.49 2.12 4.68
± SD - 21.83 20.62 11.59 50.72 0.83 53.08 0.26 2.01
Ave. = average; No. = number; SD = standard deviation CTb contacts and 5-HT contacts onto ChAT interneurons located in bilaterally intermediate zones were expressed in terms of surface area densities. Interneurons classified as contralateral were located opposite to the MLF brain injection site.
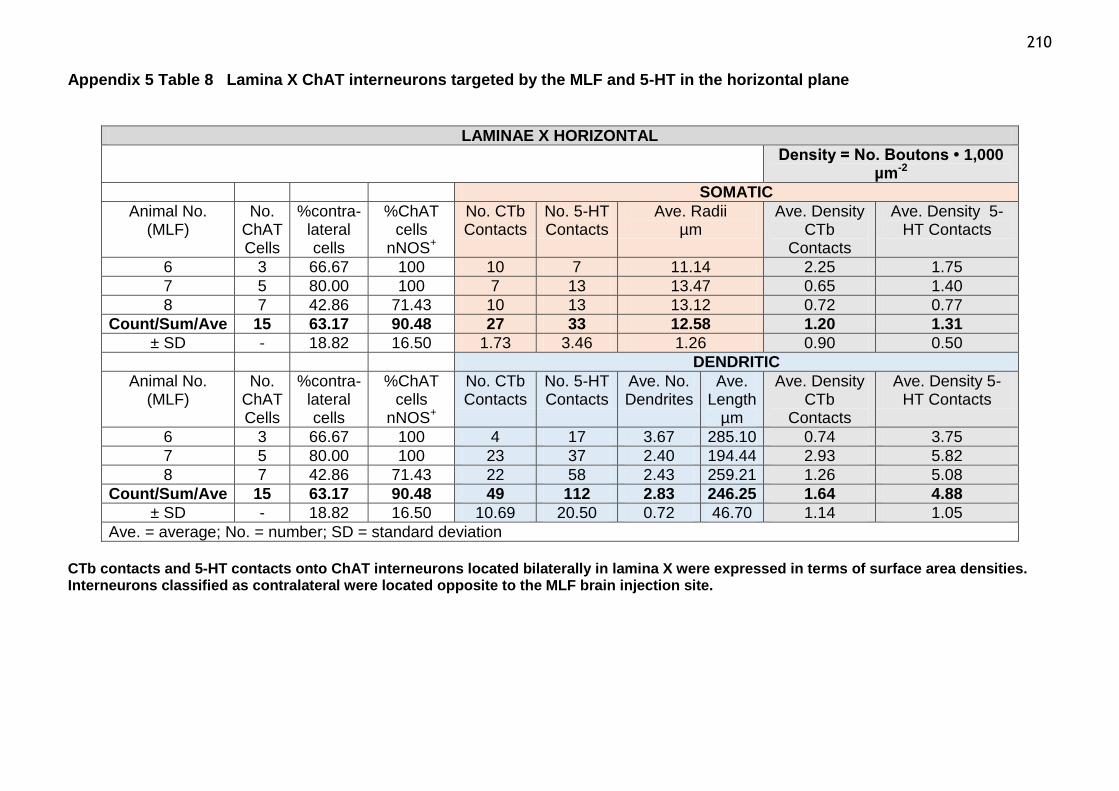
210
Appendix 5 Table 8 Lamina X ChAT interneurons targeted by the MLF and 5-HT in the horizontal plane
LAMINAE X HORIZONTAL
Density = No. Boutons • 1,000 µm-2
SOMATIC
Animal No. (MLF)
No. ChAT Cells
%contra-lateral cells
%ChAT cells
nNOS+
No. CTb Contacts
No. 5-HT Contacts
Ave. Radii µm
Ave. Density CTb
Contacts
Ave. Density 5-HT Contacts
6 3 66.67 100 10 7 11.14 2.25 1.75
7 5 80.00 100 7 13 13.47 0.65 1.40
8 7 42.86 71.43 10 13 13.12 0.72 0.77
Count/Sum/Ave 15 63.17 90.48 27 33 12.58 1.20 1.31
± SD - 18.82 16.50 1.73 3.46 1.26 0.90 0.50
DENDRITIC
Animal No. (MLF)
No. ChAT Cells
%contra-lateral cells
%ChAT cells
nNOS+
No. CTb Contacts
No. 5-HT Contacts
Ave. No. Dendrites
Ave. Length
µm
Ave. Density CTb
Contacts
Ave. Density 5-HT Contacts
6 3 66.67 100 4 17 3.67 285.10 0.74 3.75
7 5 80.00 100 23 37 2.40 194.44 2.93 5.82
8 7 42.86 71.43 22 58 2.43 259.21 1.26 5.08
Count/Sum/Ave 15 63.17 90.48 49 112 2.83 246.25 1.64 4.88
± SD - 18.82 16.50 10.69 20.50 0.72 46.70 1.14 1.05
Ave. = average; No. = number; SD = standard deviation CTb contacts and 5-HT contacts onto ChAT interneurons located bilaterally in lamina X were expressed in terms of surface area densities. Interneurons classified as contralateral were located opposite to the MLF brain injection site.
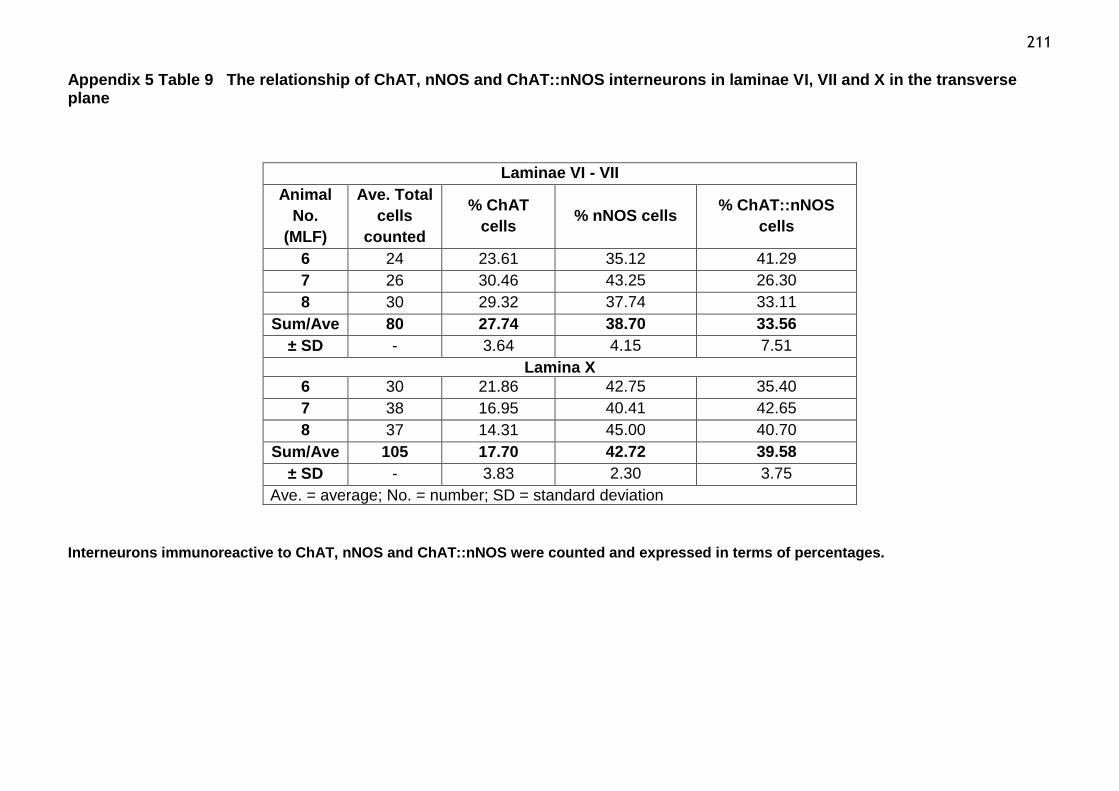
211
Appendix 5 Table 9 The relationship of ChAT, nNOS and ChAT::nNOS interneurons in laminae VI, VII and X in the transverse plane
Laminae VI - VII
Animal
No.
(MLF)
Ave. Total
cells
counted
% ChAT
cells % nNOS cells
% ChAT::nNOS
cells
6 24 23.61 35.12 41.29
7 26 30.46 43.25 26.30
8 30 29.32 37.74 33.11
Sum/Ave 80 27.74 38.70 33.56
± SD - 3.64 4.15 7.51
Lamina X
6 30 21.86 42.75 35.40
7 38 16.95 40.41 42.65
8 37 14.31 45.00 40.70
Sum/Ave 105 17.70 42.72 39.58
± SD - 3.83 2.30 3.75
Ave. = average; No. = number; SD = standard deviation
Interneurons immunoreactive to ChAT, nNOS and ChAT::nNOS were counted and expressed in terms of percentages.

212
Appendix 5 Table 10 Monoaminergic contacts onto ChAT interneurons in laminae VI, VII and X in the parasagittal plane
PARSAGITTAL
Somatic Dendritic
Density = No. Boutons X 1,000 µm
-2
Density = No. Boutons X 1,000 µm
-2
Naïve tissue
No. Cells
Ave. No. 5-HT
Boutons
Ave. No. DBH
Boutons
Ave. Radii,
µm
Ave. Density 5-HT
Boutons
Ave. Density
DBH Boutons
Ave. No. 5-HT
Boutons
Ave. No. DBH
Boutons
Ave. No. Dendrites
Ave. Length,
µm
Ave. Density 5-HT
Boutons
Ave. Density
DBH Boutons
Laminae VI/VII
Sums/Ave.
5 41 28 14.44 2.51 2.15 95 64 3.00 282.69 7.29 3.76
± SD 7.01 3.97 3.25 2.13 1.27 11.02 10.31 0.71 201.02 5.52 1.26
Lamina X Sums/Ave
. 5 17 31 12.79 1.56 2.82 29 18 3.00 163.26 6.37 4.47
± SD 4.83 8.90 1.39 1.96 3.64 2.86 1.34 1.00 62.00 4.86 4.80
5-HT and DBH contacts onto ChAT interneurons were expressed in terms of were expressed in terms of surface area densities. Immunoreactive tissue was from one naïve rat with no tract tracing injection.
213
List of references
ACHERMANN, P. & BORBELY, A. A. 1994. Simulation of daytime vigilance by the additive interaction of a homeostatic and a circadian process. Biol. Cybern., 71, 115-121.
AGARWAL, S. K., GELSEMA, A. J. & CALARESU, F. R. 1990. Inhibition of rostral VLM by baroreceptor activation is relayed through caudal VLM. Am J Physiol 258, 1271-1278.
AGGELOPOULOS, N. C., BURTON, M. J., CLARKE, R. W. & EDGLEY, S. A. 1996. Characterization of a descending system that enables crossed group II inhibitory reflex pathways in the cat spinal cord. J Neurosci, 16, 723-729.
AICHER, S. A., KURUCZ, O. S., REIS, D. J. & MILNER, T. A. 1995. Nucleus tractus solitarius efferent terminals synapse on neurons in the caudal ventrolateral medulla that project to the rostral ventrolateral medulla. Brain Research, 693, 51-63.
AIHARA, Y., MASHIMA, H., ONDA, H., HISANO, S., KASUYA, H., HORI, T., YAMADA, S., TOMURA, H., YAMADA, Y., INOUE, I., KOJIMA, I. & TAKEDA, J. 2000. Molecular Cloning of a Novel Brain-Type Na+-Dependent Inorganic Phosphate Cotransporter. Journal of Neurochemistry, 74, 2622-2625.
ALFORD, S., SCHWARTZ, E. & DI PRISCO, G. V. 2003. The Pharmacology of Vertebrate Spinal Central Pattern Generators. The Neuroscientist, 9, 217-228.
ALVAREZ, F. J. & FYFFE, R. E. W. 2007. The continuing case for the Renshaw cell. The Journal of Physiology, 584, 31-45.
ALVAREZ, F. J., PEARSON, J. C., HARRINGTON, D., DEWEY, D., TORBECK, L. & FYFFE, R. E. W. 1998. Distribution of 5-hydroxytryptamine-immunoreactive boutons on α-motoneurons in the lumbar spinal cord of adult cats. The Journal of Comparative Neurology, 393, 69-83.
ALVAREZ, F. J., VILLALBA, R. M., ZERDA, R. & SCHNEIDER, S. P. 2004. Vesicular glutamate transporters in the spinal cord, with special reference to sensory primary afferent synapses. The Journal of Comparative Neurology, 472, 257-280.
AMILHON, B., LEPICARD, E., RENOIR, T., MONGEAU, R., POPA, D., POIREL, O., MIOT, S., GRAS, C., GARDIER, A., GALLEGO, J., HAMON, M., LANFUMEY, L., GASNIER, B., GIROS, B. & EL MESTIKAWY, S. 2010. VGLUT3 (Vesicular Glutamate Transporter Type 3) Contribution to the Regulation of Serotonergic Transmission and Anxiety. Journal of Neuroscience, 306, 2198-2210.
214 ANELLI, R. & HECKMAN, C. J. 2005. The calcium binding proteins calbindin, parvalbumin, and calretinin have specific patterns of expression in the gray matter of cat spinal cord. Journal of Neurocytology, 34, 369-385.
ANGELUCCI, A., CLASCÁ, F. & SUR, M. 1996. Anterograde axonal tracing with the subunit B of cholera toxin: a highly sensitive immunohistochemical protocol for revealing fine axonal morphology in adult and neonatal brains. Journal of Neuroscience Methods, 65, 101-112.
ANTAL, M. 1984. Termination areas of corticobulbar and corticospinal fibres in the rat. J Hirnforsch 25, 647-659.
ANTAL, M., PETKÓ, M., POLGÁR, E., HEIZMANN, C. W. & STORM-MATHISEN, J. 1996. Direct evidence of an extensive GABAergic innervation of the spinal dorsal horn by fibres descending from the rostral ventromedial medulla. Neuroscience, 73, 509-518.
ARMAND, J. 1982. The origin, course and terminations of cortico- spinal fibers in various mammals. Prog Brain Res, 57, 329-360.
ASCOLI, G. A., KRISHMAR, S. J., NASUTO, S. L. & SENFT, S. L. 2001. Generation, description and storage of dendritic morphology data. Philos. Trans. R. Soc. (Lond), 2001, 1131.
BALDISSERA, F., HULTBORN, H. & ILLERT, M. 1981. Integration in spinal neuronal systems. In: BROODS, V. (ed.) Handbook of Physiology, The Nervous System, 2. Bathesda, MD: American Physiological Society.
BANKER, G. A. & COWAN, W. M. 1979. Further observation on hippocampal neurons in dispersed cell culture. J Comp Neurol, 187, 469-494.
BANKOUL, S. & NEUHUBER, W. L. 1992. A direct projection from the medial vestibular nucleus to the cervical spinal dorsal horn of the rat, as demonstrated by anterograde and retrograde tracing. Anat. Embryol., 185, 77-85.
BANNATYNE, B. A., EDGLEY, S. A., HAMMAR, I., JANKOWSKA, E. & MAXWELL, D. J. 2003. Networks of inhibitory and excitatory commissural interneurons mediating crossed reticulospinal actions. European Journal of Neuroscience, 18, 2273-2284.
BANNATYNE, B. A., EDGLEY, S. A., HAMMAR, I., JANKOWSKA, E. & MAXWELL, D. J. 2006. Differential Projections of Excitatory and Inhibitory Dorsal Horn Interneurons Relaying Information from Group II Muscle Afferents in the Cat Spinal Cord. The Journal of Neuroscience, 26, 2871-2880.
BANNATYNE, B. A., LIU, T. T., HAMMAR, I., STECINA, K., JANKOWSKA, E. & MAXWELL, D. J. 2009. Excitatory and inhibitory intermediate zone interneurons in pathways from feline group I and II afferents: differences in axonal projections and input. The Journal of Physiology, 587, 379-399.
BARBER, R. P., PHELPS, P.E., HOUSER, C.R., CRAWFORD, G.D., SALVATERRA, P.M., VAUGH, J.E. 1984. The morphology and distribution of neurons containing choline acetyltransferase in the adult rat spinal cord: an immunocytochemical study. J Comp Neurol, 229, 329-346.

215 BAREYRE, F. M., HAUDENSCHILD, B. & SCHWAB, M. E. 2002. Long-lasting sprouting and gene expression changes induced by the monoclonal antibody IN-1 in the adult spinal cord. J. Neurosci., 22, 7097-7110.
BASBAUM, A. I., CLANTON, C. H. & FIELDS, H. L. 1978. Three bulbospinal pathways from the rostral medulla of the cat: An autoradiographic study of pain modulating systems. J Comp Neurol, 178, 209-224.
BELLOCCHIO, E. E., REIMER, R. J., FREMEAU, R. T. & EDWARDS, R. H. 2000. Uptake of Glutamate into Synaptic Vesicles by an Inorganic Phosphate Transporter. Science, 289, 957-960.
BENES, F. M., PARKS, T. N. & RUBEL, E. W. 1977. Rapid dendritic atrophy following deafferentation: An EM morphometric analysis. Brain Research, 122, 1-13.
BENNETT, B. D., CALLAWAY, J. C. & WILSON, C. J. 2000. Intrinsic Membrane Properties Underlying Spontaneous Tonic Firing in Neostriatal Cholinergic Interneurons. The Journal of Neuroscience, 20, 8493-8503.
BERTRAND, S. S. & CAZALETS, J. R. 2011. Cholinergic partition cells and lamina X neurons induce a muscarinic-dependent short-term potentiation of commissural glutamatergic inputs in lumbar motoneurons. Frontiers in Neural Circuits, 5, 1-15. BJÖRKLUND, A. & SKAGERBERG, G. 1979. Evidence for a major spinal cord projection from the diencephalic A11 dopamine cell group in the rat using transmitter-specific fluorescent retrograde tracing. Brain Research, 177, 170-175.
BJÖRKLUND, A., SKAGERBERG, G. 1982. Descending monoaminergic projections to the spinal cord. In Brain Stem Control of Spinal Mechanisms. Elsevier Biomedial Press, Amsterdam, 55-88.
BORGES, L. F. & IVERSEN, S. D. 1986. Topography of choline acetyltransferase Immunoreactive Neurons and fibers in the rat spinal cord. Brain Research, 362, 140-148.
BOULLAND, J.-L., QURESHI, T., SEAL, R. P., RAFIKI, A., GUNDERSEN, V., BERGERSEN, L. H., FREMEAU, R. T., EDWARDS, R. H., STORM-MATHISEN, J. & CHAUDHRY, F. A. 2004. Expression of the vesicular glutamate transporters during development indicates the widespread corelease of multiple neurotransmitters. The Journal of Comparative Neurology, 480, 264-280.
BOWKER, R. M. & ABBOTT, L. C. 1990. Quantitative re-evaluation of descending serotonergic and non-serotonergic projections from the medulla of the rodent: evidence for extensive co-existence of serotonin and peptides in the same spinally projecting neurons, but not from the nucleus raphe magnus. Brain Research, 512, 15-25.
BOWKER, R. M., STEINBUSCH, H. W. & COULTER, J. D. 1981a. Serotonergic and peptidergic projections to the spinal cord demonstrated by a combined retrograde HRP histochemical and immunocytochemical staining method. Brain Res, 211, 412-417.

216 BOWKER, R. M., WESTLUND, K. N. & COULTER, J. D. 1981b. Origins of serotonergic projections to the spinal cord in rat: An immunocytochemical-retrograde transport study. Brain Research, 226, 187-199.
BOWKER, R. M., WESTLUND, K. N. & COULTER, J. D. 1982. Origins of serotonergic projections to the lumbar spinal cord in the monkey using a combined retrograde transport and immunocytochemical technique. Brain Res, 9, 271-278.
BRANCHEREAU, P., CHAPRON, J. & MAYRAND, P. 2002. Descending 5-hydroxytryptamine raphe inputs repress the expression of serotonergic neurons and slow the maturation of inhibitory systems in mouse embryonic spinal cord. J Neurosci, 22, 2598-2606.
BRAS, H., CAVALLARI, P., JANKOWSKA, E. & D., M. 1989b. Comparison of effects of monoamines on transmission in spinal pathways from group I and II muscle afferents in the cat. Exp Brain Res, 76, 27-37.
BRAS, H., JANKOWSKA, E., NOGA, B. R. & SKOOG, B. 1990. Comparison of effects of various types of NA and 5-HT agonists on transmission from group II muscle afferents in the cat. Eur J Neurosci, 2, 1029-1039.
BREDT, D. S., GLATT, C. E., HWANG, P. M., FOTUHI, M., DAWSON, T. M. & SNYDER, S. H. 1991. Nitric oxide synthase protein and mRNA are discretely localized in neuronal populations of mammalian central nervous systems together with NADPH diaphorase. Neuron, 7, 615-624.
BREDT, D. S., GLATT, C. E., HWANG, P. M., FOTUHI, M., DAWSON, T. M. & SNYDER, S. H. 1991b. Nitric oxide synthase protein and mRNA are discretely localized in neuronal populations of the mammalian CNS together with NADPH diaphorase. Neuron, 7, 615-624.
BRIGGS, C. A. 1992. Potentiation of nicotinic transmission in the rat superior cervical sympathetic galgion: Effects of cyclic GMP and nitric oxide generators. Brain Res, 573, 139-146.
BRODIN, L. & GRILLNER, S. 1985a. The role of putative excitatory amino acid neurotransmitters in the initiation of locomotion in the lamprey spinal cord. II. The effects of amino acid uptake inhibitors. Brain Research, 360, 149-158.
BRODIN, L. & GRILLNER, S. 1985b. The role of putative excitatory amino acid neurotransmitters in the initiation of locomotion in the lamprey spinal cord. I. The effects of excitatory amino acid antagonists. Brain Research, 360, 139-148.
BRODIN, L., GRILLNER, S., DUBUC, R., OHTA, Y., KASICKI, S. & HOKFELT, T. 1988. Reticulospinal neurons in lamprey: transmitters, synaptic interactions and their role during locomotion. Arch Ital Biol, 126, 317-345.
BROMAN, J. 1993. Neurotransmitters in subcortical somatosensory pathways. Anat Embryol (Berl), 189, 181-214.
BROSAMLE, C. & SCHWAB, M. E. 1997. Cells of origin, course, and termination patterns of the ventral, uncrossed component of the mature rat corticospinal tract. J Comp Neurol, 386, 293-303.
217 BROWN, A. G. 1981. Organization in the Spinal Cord, The anatomy and physiology of identified neurones, Berlin Heidelberg New York, Springer-Verlag.
BROWN, A. R., ANTLE, M. C., HU, B. & TESKEY, G. C. 2011. High frequency stimulation of the subthalamic nucleus acutely rescues motor deficits and neocortical movement representations following 6-hydroxydopamine administration in rats. Experimental Neurology, 231, 82-90.
BROWN, A. R., HU, B., ANTLE, M. C. & TESKEY, G. C. 2009. Neocortical movement representations are reduced and reorganized following bilateral intrastriatal 6-hydroxydopamine infusion and dopamine type-2 receptor antagonism. Experimental Neurology, 220, 162-170.
BROWN, L. T. 1971. Projections and termination of the corticospinal tract in rodents. Exp Brain Res, 13, 432-450.
BROWNSTONE, R. M., JORDAN, L. M., SHEFCHYK, S. J., NOGA, B. R. & KRIELLAARS, D. J. 1992. On the regulation of repetitive firing in lumbar motoneurones during fictive locomotion in the cat. Exp Brain Res, 90, 441-455.
BUCHANAN, J. T. & GRILLNER, S. 1991. 5-Hydroxytryptamine depresses reticulospinal excitatory postsynaptic potentials in motoneurons of the lamprey. Neuroscience Letters, 122, 71-74.
BURKE, R. E., MARKS, W. B. & ULFHAKE, B. 1992. A parsimonious description of motoneuron dendritic morphology using computer simulation. J Neurosci, 12, 2403.
BUTCHER, L. L. & WOOLF, N. J. 1982. Cholinergic and serotonergic systems in the brain and spinal cord: anatomic organization, role in intercellular communication processes, and interactive mechanisms. Prog Brain Res, 55, 1-40.
CAILLARD, O., MORENO, H., SCHWALLER, B., LLANO, I., CELIO, M.R. & MARTY, A. 2000. Role of the calcium-binding protein parvalbumin in short-term synaptic plasticity. Proc Natl Acad Sci U S A, 97 (24), 13372-7.
CANEDO, A. 1997. Primary motor cortex influences on the descending and ascending systems. Prog Neurobiol, 51, 287-335.
CASALE, E. J., LIGHT, A. R. & RUSTIONI, A. 1988. Direct projection of the corticospinal tract to the superficial laminae of the spinal cord in the rat. The Journal of Comparative Neurology, 278, 275-286.
CAURAUGH, J. H. & SUMMERS, J. J. 2005. Neural plasticity and bilateral movements: a rehabilitation approach for chronic stroke. Prog Neurobiol, 75, 309-320.
CAVALLARI, P., EDGLEY, S. A. & JANKOWSKA, E. 1987. Post-synaptic actions of midlumbar interneurones on motoneurones of hind-limb muscles in the cat. The Journal of Physiology, 389, 675-689.
CAZALETS, J.-R., GARDETTE, M. & HILAIRE, G. 2000. Locomotor Network Maturation Is Transiently Delayed in the MAOA-Deficient Mouse. Journal of Neurophysiology, 83, 2468-2470.
218 CHAUDHRY, F. A., REIMER, R. J., BELLOCCHIO, E. E., DANBOLT, N. C., OSEN, K. K., EDWARDS, R. H. & STORM-MATHISEN, J. 1998. The Vesicular GABA Transporter, VGAT, Localizes to Synaptic Vesicles in Sets of Glycinergic as Well as GABAergic Neurons. The Journal of Neuroscience, 18, 9733-9750.
CHEN, R., COHEN, L. G. & HALLETT, M. 2002. Nervous system reorganization following injury. Neuroscience 111, 761-773.
CHEN, S. & ASTON-JONES, G. 1995. Evidence that cholera toxin B subunit (CTb) can be avidly taken up and transported by fibers of passage. Brain Research, 674, 107-111.
CHKLOVSKII, D. & KOULAKOV, A. 2004. Maps in the brain: what can we learn from them? Annu Rev Neurosci, 27, 369 - 392.
CHRISTIE, K. J. & WHELAN, P. J. 2005. Monoaminergic establishment of rostrocaudal gradients of rhythmicity in the neonatal mouse spinal cord. Journal of Neurophysiology, 94, 1554-1564.
CONNER, J. M., CULBERSON, A., PACKOWSKI, C., CHIBA, A. A. & TUSZYNSKI, M. H. 2003. Lesions of the Basal Forebrain Cholinergic System Impair Task Acquisition and Abolish Cortical Plasticity Associated with Motor Skill Learning. Neuron, 38, 819-829.
CORDERO-ERAUSQUIN, M., ALLARD, S., DOLIQUE, T., BACHAND, K., RIBEIRO-DA-SILVA, A. & DE KONINCK, Y. 2009. Dorsal horn neurons presynaptic to lamina I spino-parabrachial neurons revealed by transynaptic labelling. J Comp Neurol, 517, 601-615.
COULTER, J. D., BOWKER, R. M., WISE, S. P., MURRAY, C. I., CASTIGLIONI, A. J. & WESTLUND, K. N. 1979. Cortical, tectal and medullary descending pathways to the cervial spinal cord. Prog Brain Res, 50, 263-274.
COUTEAUX, R. & PECOT-DECHAVASSINE, M. 1970. Synaptic vesicles and pouches at the level of "active zones" of the neuromuscular junction. C R Acad Sci Hebd Seances Acad Sci D, 271, 2346-2349.
CREESE, I. & IVERSEN, S. D. 1975. The pharmacological and anatomical substrates of the amphetamine response in the rat. Brain Research, 83, 419-436.
CREPEL, F., MARIANI, J. & DELHAYE-BOUCHAUD, N. 1976. Evidence for a multiple innervation of Purkinje cells by climbing fibers in the immature rab cerebellum. J Neurobiol, 7, 567-578.
CUNTZ, H. 2012. The dendritic density field of a cortical pyramidal cell. Frontiers in Neuroanatomy, 6.
CUNTZ, H., BORST, A. & SEGEV, I. 2007. Optimization principles of dendritic structure. Theoretical Biology and Medical Modelling, 4, 21.
CUNTZ, H., FORSTNER, F., BORST, A. & HÄUSSER, M. 2010. One Rule to Grow Them All: A General Theory of Neuronal Branching and Its Practical Application. PLoS Comput Biol, 6, e1000877.

219 CURFS, M. H. J. M., GRIBNAU, A. A. M. & DEDEREN, P. J. W. C. 1996. Direct cortico-motoneuronal synaptic contacts are present in the adult rat cervical spinal cord and are first established at postnatal day 7. Neuroscience Letters, 205, 123-126.
CURTIS, D. R. & RYALL, R. W. 1964. Nicotinic and muscarinic receptors of Renshaw cells. Nature, 87, 652-653.
CURTIS, D. R., HOSLI, L. & JOHNSTON 1981. A pharmacological study of the depression of spinal neurones by glycine and related amino acids. Exp Brain Res, 6, 1-18.
DALE, N. & KUENZI, F. M. 1997. Ion channels and the control of swimming in the Xenopus embryo. Progress in Neurobiology, 53, 729-756.
DALE, N. & ROBERTS, A. 1984. Excitatory amino acid receptors in Xenopus embryo spinal cord and their role in the activation of swimming. J Physiol, 348, 527-543.
DALE, N. & ROBERTS, A. 1985. Dual-component amino-acid-mediated synaptic potentials: excitatory drive for swimming in Xenopus embryos. J Physiol, 363, 35-59.
DALE, N. 1985. Reciprocal inhibitory interneurones in the Xenopus embryo spinal cord. The Journal of Physiology, 363, 61-70.
DALE, N. 1986. Excitatory synaptic drive for swimming mediated by amino acid receptors in the lamprey. Prog Neurobiol, 53, 729-756.
DALE, N., OTTERSON, O. P., ROBERTS, A. & STORM-MATHISEN, J. 1986. Inhibitory neurones of a motor pattern generator in Xenopus revealed by antibodies to glycine. Nature, 324.
DE BIASI, S. & RUSTIONI, A. 1988. Glutamate and substance P coexist in primary afferent terminals in the superficial laminae of spinal cord. Proceedings of the National Academy of Sciences, 85, 7820-7824.
DE BIASI, S. & RUSTIONI, A. 1990. Ultrastructural immunocytochemical localization of excitatory amino acids in the somatosensory system. Journal of Histochemistry & Cytochemistry, 38, 1745-54.
DEITCH, J. S. & RUBEL, E. W. 1984a. Afferent influences on brain stem auditory nuclei of the chicken: the course and specificity of dendritic atrophy following deafferentation. J Comp Neurol, 229.
DEITCH, J. S. & RUBEL, E. W. 1984b. Afferent influences on brain stem auditory nuclei of the chicken: time course and specificity of dendritic atrophy following deafferentation. J Comp Neurol, 229, 66-79.
DONOGHUE, J. P. & WISE, S. P. 1982. The motor cortex of the rat: cytoarchitecture and microstimulation. J Comp Neurol, 212, 76-88.

220 DOUGHERTY, K. J., SAWCHUK, M. A. & HOCHMAN, S. 2005. Properties of Mouse Spinal Lamina I GABAergic Interneurons. Journal of Neurophysiology, 94, 3221-3227.
DREW, T. & ROSSIGNOL, S. 1990a. Functional organization within the medullary reticular formation of intact unanesthetized cat. I. Movements evoked by microstimulation. Journal of Neurophysiology, 64, 767-781.
DREW, T. & ROSSIGNOL, S. 1990b. Functional organization within the medullary reticular formation of intact unanesthetized cat. II. Electromyographic activity evoked by microstimulation. Journal of Neurophysiology, 64, 782-795.
DU BEAU, A., SHAKYA SHRESTHA, S., BANNATYNE, B. A., JALICY, S. M., LINNEN, S. & MAXWELL, D. J. 2012. Neurotransmitter phenotypes of descending systems in the rat lumbar spinal cord. Neuroscience, 227, 67-79.
DUM, R. P. & STRICK, P. L. 1996. Spinal cord terminations of the medial wall motor areas in macaque monkeys. J Neurosci, 16, 6513-6525.
ECCLES, J. C., FATT, P. & KOKETSU, K. 1954. Cholinergic and inhibitory synapses in a pathway from motor axons collaterals to motoneurones. J Physiol Lond, 126, 524-562.
ECCLES, J. C., FATT, P. & LANDGREEN, S. 1956. Central pathway for direct inhibitory action of impulses in largest afferent nerve fibers to muslce. J. Physiol., 19, 75-98.
EDGLEY, S. A. & JANKOWSKA, E. 1987. An interneuronal relay for group I and II muscle afferents in the midlumbar segments of the cat spinal cord. The Journal of Physiology, 389, 647-674.
EDGLEY, S. A., JANKOWSKA, E. & HAMMAR, I. 2004. Ipsilateral Actions of Feline Corticospinal Tract Neurons on Limb Motoneurons. The Journal of Neuroscience, 24, 7804-7813.
ELGER, C. E., SPECKMANN, E. J., CASPERS, H. & JANZEN, R. W. C. 1977. Cortico-spinal connections in the rat. I. Monosynaptic and polysynaptic responses of cervical motoneurons to epicortical stimulation. Experimental Brain Research, 28, 385-404.
EL-YASSIR, N., FLEETWOOD-WALKER, S. M. & MITCHELL, R. 1988. Heterogeneous effects on serotonin in the dorsal horn of rat: the involvement of 5-HT1 receptor subtypes. Brain Res, 456, 147-158.
ERICSON, H. & BLOMQVIST, A. 1988. Tracing of neuronal connections with cholera toxin subunit B: light and electron microscopic immunohistochemistry using monoclonal antibodies. J Neurosci Methods, 24, 225-235.
ERLANDER, M. G., TILLAKARATNE, N. J. K., FELDBLUM, S., PATEL, N. & TOBIN, A. J. 1991. Two genes encode distinct glutamate decarboxylases. Neuron, 7, 91-100.
221 FANG, X., DJOUHRI, L. & LAWSON, S. N. 2000. Sensory receptor properties of isolectin B4-positive (IB4+) and -negative (IB4-) dorsal root ganglion (DRG) neurones in vivo in the rat. Soc Neurosci Abstr, 26.
FELDBLUM, S., DUMOULIN, A., ANOAL, M., SANDILLON, F. & PRIVAT, A. 1995. Comparative distribution of GAD65 and GAD67 mRNAs and proteins in the rat spinal cord supports a differential regulation of these two glutamate decarboxylases in vivo. J Neurosci Res, 15, 742-57.
FENIK, V., DAVIES, R. O. & KUBIN, L. 2004. Combined antagonism of aminergic excitatory and amino acid inhibitory receptors in the XII nucleus abolishes REM sleep-like depression of hypoglossal motoneuronal activity. Arch Ital Biol, 142, 237-249.
FIELDS, H. & BASBAUM, A. I. 1978. Brainstem control of spinal pain-transmission neurons. Ann. Rev. Physiol., 40, 217-48.
FINKELSTEIN, R. A., BOESMAN, M., NEOH, S. H., LARUE, M. K. & DELANEY, R. 1974. Dissociation and recombination of the subunits of the cholera enterotoxin (choleragen). The Journal of Immunology, 113, 145-150.
FREMEAU JR, R. T., TROYER, M. D., PAHNER, I., NYGAARD, G. O., TRAN, C. H., REIMER, R. J., BELLOCCHIO, E. E., FORTIN, D., STORM-MATHISEN, J. & EDWARDS, R. H. 2001. The Expression of Vesicular Glutamate Transporters Defines Two Classes of Excitatory Synapse. Neuron, 31, 247-260.
FREMEAU, R. T., VOLGLMAIER, S., SEAL, R. P. & EDWARDS, R. H. 2004. VGLUTs define subsets of excitatory neurons and suggest novel roles for glutamate. Trends in Neuroscience, 27, 98-103.
GAME, C. J. & LODGE, D. 1975. The pharmacology of the inhibition of dorsal horn neurones by impulses in myelinated cutaneous afferents in the cat. Exp Brain Res, 23, 75-84.
GANSER, A. L., KIRCHNER, D. A. & WILLINGER, M. 1983. Ganglioside localization on myelinated nerve fibres by cholera toxin binding. J Neurocytol, 12, 921-938.
GARRAWAY, S. M. & HOCHMAN, S. 2001. Modulatory actions of serotonin, norephinephrine, dopamine, and acetylcholine in spinal cord deep dorsal horn neurons. J Neurophysiol, 86, 2183-2194.
GIBSON, S. J., POLAK, J. M., BLOOM, S. R. & WALL, P. D. 1981. The distribution of nine peptides in rat spinal cord with special emphasis on the substantia gelatinosa and on the area around the central canal (lamina X). J Comp Neurol, 201, 65-79.
GIBSON, S. J., POLAK, J. M., BLOOM, S. R. & WALL, P. D. 1981. The distribution of nine peptides in rat spinal cord with special emphasis on the substantia gelatinosa and on the area around the central canal (lamina X). J Comp Neurol, 201, 65-79.
GIEROBA, Z. J., LI, Y. W. & BLESSING, W. W. 1992. Characteristics of caudal ventrolateral medullary neurons antidromically activated from rostral ventrolateral medulla in the rabbit. Brain Research, 582, 196-207.

222 GIOCOMO, L. & HASSELMO, M. 2007. Neuromodulation by Glutamate and Acetylcholine can Change Circuit Dynamics by Regulating the Relative Influence of Afferent Input and Excitatory Feedback. Molecular Neurobiology, 36, 184-200.
GIUFFRIDA, R. & RUSTIONI, A. 1989. Glutamate and aspartate immunoreactivity in corticospinal neurons of rats. The Journal of Comparative Neurology, 288, 154-164.
GOBEL, S. 1975. Golgi studies of the substantia gelatinosa neurons in the spinal trigeminal nucleus. Journal of Comparative Neurology, 162, 397-416.
GOBEL, S. 1978. Golgi stuides of the neurons in layer I of the dorsal horn of the medulla (trigeminal nucleus caudalis). Journal of Comparative Neurology, 180, 375-393.
GOLDSTEIN, I. J. & WINTER, H. G. 1999. The Griffonia simplicifolia I-B4 isolectin. A probe for alpha-D-galactosyl end groups. Subcell Biochem, 32, 127-141.
GOULDING, M. 2009. Circuits controlling vertebrate locomotion: moving in a new direction. Nat Rev Neurosci, 10, 507-518.
GRAS, C., HERZOG, E. & BELLENCHI, G. C. 2002. A third vesicular glutamate transporter expressed by cholinergic and serotonergic neurons. J Neurosci, 22, 5442-5451.
GRILLNER, S. & DUBUC, R. 1988. Control of locomotion in vertebrates: spinal and supraspinal mechanims. Adv Neurol, 47, 425-453.
GRILLNER, S. & JESSELL, T. M. 2009. Measured motion: searching for simplicity in spinal locomotor networks. Curr Opin Neurobiol, 19, 572-86.
GRILLNER, S. & WALLEN, P. 1980. Does the central pattern generation for locomotion in lamprey depend on glycine inhibition? Acta Physiol Scand, 110, 103-105.
GRUDT, T. J. & PERL, E. R. 2002. Correlations between neuronal morphology and electrophysiological features in the rodent superficial dorsal horn. The Journal of Physiology, 540, 189-207.
GWYN, D. G. & FLUMERFELT, B. A. 1971. Acetylcholinesterase in non-cholinergic neurones: A histochemical study of dorsal root ganglion cells in the rat. Brain Research, 34, 193-198.
HAJNIK, T., LAI, Y. Y. & SIEGEL, J. M. 2000. Atonia-Related Regions in the Rodent Pons and Medulla. Journal of Neurophysiology, 84, 1942-1948.
HALEY, J. E., DICKENSON, A. H. & SCHACHTER, M. 1992. Electrophysiological evidence for a role of nitric oxide in prolonged chemical nociception in the rat. Neuropharmacology, 31, 251-258.
HALLET, M. 2001. Functional reorganization after lesions of the human brain: studies with transcranial magnetic stimulation. Rev Neurol, 157, 822-826.
HAMMAR, I., BANNATYNE, B. A., MAXWELL, D. J., EDGLEY, S. A. & JANKOWSKA, E. 2004. The actions of monoamines and distribution of noradrenergic and

223 serotoninergic contacts on different subpopulations of commissural interneurons in the cat spinal cord. European Journal of Neuroscience, 19, 1305-1316.
HAMMAR, I., KRUTKI, P., DRZYMALA-CELICHOWSKA, H., NILSSON, E. & JANKOWSKA, E. 2011. A trans-spinal loop between neurones in the reticular formation and in the cerebellum. The Journal of Physiology, 589, 653-665.
HAMMOND, C. 2001. Cellular and Molecular Neurobiology, second edition. Institut de la Mediterranee. Marseille, France. Academic Press.
HAYES, N. L. & RUSTIONI, A. 1981. Descending projections from brainstem and sensorimotor cortex to spinal enlargements in the cat. Single and double retrograde tracer studies. Exp Brain Res, 141, 89-107.
HECKMAN, C. J., HYNGSTROM, A. S. & JOHNSON, M. 2008. Active properties of motoneurone dendrites: diffuse descending neuromodulation, focused local inhibition. J Physiol, 586, 1225-1231.
HELLSTRÖM, J., OLIVEIRA, A. L. R., MEISTER, B. & CULLHEIM, S. 2003. Large cholinergic nerve terminals on subsets of motoneurons and their relation to muscarinic receptor type 2. The Journal of Comparative Neurology, 460, 476-486.
HERZOG, E., LANDRY, M., BUHLER, E., BOUALI-BENAZZOUZ, R., LEGAY, C., HENDERSON, C. E., NAGY, F., DREYFUS, P., GIROS, B. & MESTIKAWY, S. 2004. Expression of vesicular glutamate transporters, VGLU1 and VGLUT2 in cholinergic spinal motoneurons. Eur J Neurosci, 20, 1752-1760.
HICKS, S. P. & D'AMATO, C. J. 1977. Locating corticospinal neurons by retrograde axonal transport of horseradish peroxidase. Exp Neurol, 56, 410-420.
HIOKI, H., FUJIYAMA, F., TAKI, K., TOMIOKA, R., FURUTA, T., TAMAMAKI, N. & KANEKO, T. 2003. Differential distribution of vesicular glutamate transporters in the rat cerebellar cortex. Neuroscience, 117, 1-6.
HOLMES, C. J. & JONES, B. E. 1994. Importance of cholinergic, GABAergic, serotonergic and other neurons in the medial medullary reticular formation for sleep-wake states studied by cytotoxic lesions in the cat. Neuroscience, 62, 1179-1200.
HOLMQVIST, B. & LUNDBERG, A. 1959. On the organization of the supraspinal inhibitory control of interneurones of various spinal reflex arcs. Arch Ital Biol, 97, 340-356.
HOLMQVIST, B. & LUNDBERG, A. 1961. Differential supraspinal control of synaptic actions evoked by volleys in the fictive reflex afferents in alpha motoneurones. Acta Physiol Scand, 54 [Suppl 186], 1-5.
HOLSTEGE, G. & KUYPERS, H. G. 1982. The anatomy of brain stem pathways to the spinal cord in cat: a labeled amino acid tracing study. Prog Brain Res, 57, 145-175.

224 HOLSTEGE, G. 1998. The emotional motor system in relation to the supraspinal control of micturition and mating behavior. Behavioural Brain Research, 92, 103-109.
HOLSTEGE, J. 1991. Ultrastructural evidence for GABAergic brain stem projections to spinal motoneurons in the rat. The Journal of Neuroscience, 11, 159-167.
HOLSTEGE, J. C. & BONGERS, C. M. 1991. A glycinergic projection from the ventromedial lower brainstem to spinal motoneurons. An ultrastructural double labeling study in rat. Brain Research, 566, 308-15.
HOLZER-PETSCHE, U., RINNER, I. & LEMBECK, F. 1986. Distribution of choline acetyltransferase activity in rat spinal cord--influence of primary afferents? J Neural Transm, 66.
HONDA, C. N. & PERL, E. R. 1981. Properties of neurons in lamina X and the midline dorsal horn of the sacrococcygeal spinal cord of the cat. Soc Neurosci Abstr, 7, 610.
HONIG, M. C. & HUME, R. I. 1986. Fluorescent carbocyanine dyes allow living neurons of identified origin to be studied in long-term cultures. Cell Biol, 103, 171-187.
HOSSAINI, M., GOOS, J. A. C., KOHLI, S. K. & HOLSTEGE, J. C. 2012. Distribution of Glycine/GABA Neurons in the Ventromedial Medulla with Descending Spinal Projections and Evidence for an Ascending Glycine/GABA Projection. PLoS ONE, 7, e35293.
HOUK, J. C. 1989. in Models of Brain Function (Cotterill, R.M.J., ed.). Cambridge University Press, 309-325.
HOUK, J. C., KEIFER, J. & BARTO, A. G. 1993. Distributed motor commands in the limb premotor network. Trends in Neurosciences, 16, 27-33.
HOUSER, C. R., CRAWFORD, G. D., BARBER, R. P., SALVATERRA, P. M. & VAUGH, J. E. 1983. Organization and morphological characteristics of cholinergic neurons: an immunocytochemical study with a monoclonal antibody to choline acetyltransferase. 266, 1, 97-119.
HUANG, A., NOGA, B. R., CARR, P. A., FEDIRCHUK, B. & JORDAN, L. M. 2000. Spinal Cholinergic Neurons Activated During Locomotion: Localization and Electrophysiological Characterization. Journal of Neurophysiology, 83, 3537-3547.
HUGHES, D. I., SIKANDER, S., KINNON, C. M., BOYLE, K. A., WATANABE, M., CALLISTER, R. J. & GRAHAM, B. A. 2012. Morphological, neurochemical and electrophysiological features of parvalbumin-expressing cells: a likely source of axo-axonic inputs in the mouse spinal dorsal horn. The Journal of Physiology, 590, 3927-3951.
HULTBORN, H., BROWNSTONE, R. M., TOTH, T. I. & GOSSARD, J. P. 2004. Key mechanisms for setting the input-output gain across the motoneuron pool. Prog Brain Res, 143, 77-95.

225 HULTBORN, H., JANKOWSKA, E., LINDSTRÖM, S. & ROBERTS, W. 1971. Neuronal pathway of the recurrent facilitation of motoneurones. The Journal of Physiology, 218, 495-514.
HUME, R. I. & PURVES, D. 1981. Geometry of neonatal neurones and the regulation of synapse elimination. Nature, 293, 469-471.
ITO, M., UDO, M. & MANO, N. 1970. Long inhibitory and excitatory pathways converging onto cat reticular and Deiters' neurons and their relevance to reticulofugal axons. J Neurophysiol, 33, 210-226.
JÄNIG, W., SCHMIDT, R. F. & ZIMMERMANN, M. 1967. Presynaptic depolarization during activation of tonic mechanoreceptors. Brain Research, 5, 514-516.
JANKOWSKA, E. & EDGLEY, S. A. 2006. How can corticospinal tract neurons contribute to ipsilateral movement? A question with implications for recovery of motor function. The Neuroscientist, 12, 67-79.
JANKOWSKA, E. & EDGLEY, S. A. 2010. Functional subdivision of feline spinal interneurons in reflex pathways from group Ib and II muscle afferents; an update. Eur J Neurosci, 32, 881-893.
JANKOWSKA, E. 1992. Interneuronal relay in spinal pathways from proprioceptors. Prog Neurobiol, 38, 335-378.
JANKOWSKA, E. 2001. Spinal interneuronal systems: identification, multifunctional character and reconfigurations in mammals. J Physiol, 533, 31-40.
JANKOWSKA, E. 2007. Spinal interneuronal networks in the cat: elementary components. Brain Research Reviews, 2-10.
JANKOWSKA, E. 2013. Mammalian spinal interneurons. In: PFAFF, D. W. (ed.) Neuroscience in the 21st Century From Basic to Clinical. Springer.
JANKOWSKA, E., HAMMAR, I., CHOJNICKA, B. & HEDÉN, C. H. 2000. Effects of monoamines on interneurons in four spinal reflex pathways from group I and/or group II muscle afferents. Eur J Neurosci, 12, 701-714.
JANKOWSKA, E., HAMMAR, I., DJOUHRI, L., HEDEN, C., LACKBERG, Z. S. & YIN, X. K. 1997. Modulation of responses of four types of feline ascending tract neurons by serotonin and noradrenaline. Eur J Neurosci, 9, 1375-1387.
JANKOWSKA, E., HAMMAR, I., SLAWINSKA, U., MALESZAK, K. & EDGLEY, S. A. 2003. Neuronal Basis of Crossed Actions from the Reticular Formation on Feline Hindlimb Motoneurons. The Journal of Neuroscience, 23, 1867-1878.
JANKOWSKA, E., RIDDELL, J. S., SKOOG, B. & NOGA, B. R. 1993. Gating of transmission to motoneurones by stimuli applied in the locus coeruleus and raphe nuclei of the cat. The Journal of Physiology, 461, 705-722.
JESKE, I., MORRISON, S. F., CRAVO, S. L. & REIS, D. J. 1993. Identification of baroreceptor reflex interneurons in the caudal ventrolateral medulla. American

226 Journal of Physiology - Regulatory, Integrative and Comparative Physiology, 264, R169-R178.
JESSELL, T. M. 2000. Neuronal specification in the spinal cord: inductive signals and transcriptional codes. Nat Rev Genet, 1, 20-29.
JIANG, Z., CARLIN, K. P. & BROWNSTONE, R. M. 1999. An in vitro functionally mature mouse spinal cord preparation for the study of spinal motor networks. Brain Research, 816, 493-499.
JIANG, Z., CARLIN, K. P. & BROWNSTONE, R. M. 1999. An in vitro functionally mature mouse spinal cord preparation for the study of spinal motor networks. Brain Research, 816, 493-499.
JOHNSON, R. G. 1988. Accumulation of biological amines into chromaffin granules: a model for hormone and neurotransmitter transport. Physiol. Rev., 68, 232-307.
JONES, S. L. & LIGHT, A. R. 1990. Termination patterns of serotonergic medullary raphespinal fibers in the rat lumbar spinal cord: an anterograde immunohistochemical study. J Comp Neurol, 297, 267-282.
JORDAN, L. M. & SCHMIDT, B. J. 2002. Propriospinal neurons involved in the control of locomotion: potential targets for repair strategies? Prog Brain Res, 137, 125-139.
JORDAN, L. M. & SCHMIDT, B. J. 2002b. Propriospinal neurons involved in the control of locomotion: potential targets for repair strategies. In: MCKERRACHER, L., DOUCHET, G. & ROSSIGNOL, S. (eds.) Spinal cord trauma: regeneration, neural repair, and functional recovery. Amsterdam: Elsevier Science.
JORDAN, L. M. 1998. Initiation of locomotion in mammals. Ann N Y Acad Sci, 860, 83-93.
JORDAN, L. M., LIU, J., HEDLUND, P. B., AKAY, T. & PEARSON, K. G. 2007. Descending command systems for the initiation of locomotion in mammals. Brain Research Reviews, 57, 183-191.
JOSHUA, M., ADLER, A., MITELMAN, R., VAADIA, E. & BERGMAN, H. 2008. Midbrain dopaminergic neurons and striatal cholinergic interneurons encode the difference between reward and aversive events at different epochs of probabilistic classical conditioning trials. J. Neurosci., 28, 11673-11684.
KANEKO, T., FUJIYAMA, F. & HIOKI, H. 2002. Immunohistochemical localization of candidates for vesicular glutamate transporters in the rat brain. The Journal of Comparative Neurology, 444, 39-62.
KARCZMAR, A. G., NISHI, S., MINOTA, S. & KINDEL, G. 1980. Electrophysiology, acetylcholine and acetylcholinesterase of immature spinal ganglia of the rabbit--an experimental study and a review. Gen Pharmacol, 11, 127-134.
KATZ, L. C. & CROWLEY, J. C. 2002. Development of cortical circuits: lessons from ocular dominance columns. Nat Rev Neurosci, 3, 34-42.
227 KATZ, L. C. & SHATZ, C. J. 1996. Synaptic activity and the construction of cortical circuits. Science, 274, 1133-1138.
KENNEDY, P. R. 1990. Corticospinal, rubrospinal and rubro-olivary projections: a unifying hypothesis. Trends in Neuroscience, 13, 474-479.
KEPLER, J. 1596. The Sacred Mysteries of the Cosmos. Mysterium cosmographicum. Tubingen, Germany.
KIEHN, O. & KJAERULFF, O. 1996. Spatiotemporal characteristics of 5-HT and dopamine-induced rhythmic hindlimb activity in the in vitro neonatal rat. Journal of Neurophysiology, 75, 1472-1482.
KIM, G. & KANDLER, K. 2003. Elimination and strengthening of glycinergic/GABAergic connections during tomotopic map formation. Nat Neurosci, 6, 282-290.
KIMURA, H., MCGEER, P. L., PENG, J. H. & MCGEER, E. G. 1981. The central cholinergic system studied by choline acetyltransferase immunohistochemistry in the cat. The Journal of Comparative Neurology, 200, 151-201.
KITTO, K. F., HALEY, J. E. & WILCOX, G. L. 1992. Involvement of nitric oxide in spinally mediated hyperalgesia in the mouse. Neurosci Lett, 148, 1-5.
KNEISLEY, L. W., BIBER, M. P. & LAVAIL, J. H. 1978. A study of the origin of brainstem projections to monkey spinal cord using the regroade transport methods. Exp Neurol, 60, 116-139.
KRIEGSTEIN, A. N. & DICHTER, M. A. 1983. Morphological classification of rat cortical neurons in cell culture. J Neurosci, 3, 1634-1647.
KUCHLER, M., FOUAD, K., WEINMANN, O., SCHWAB, M. E. & RAINETEAU, O. 2002. Red nucleus projections to distinct motor neuron pools in the rat spinal cord. J Comp Neurol, 448, 349-359.
KUDO, N., FURUKAWA, F. & OKADO, N. 1993. Development of descending fibres to the rat embryonic spinal cord. Neurosci Res, 16, 131-141.
KULLANDER, K. 2005. Genetics moving to neuronal networks. Trends in Neurosciences, 28, 239-247.
KUMER, S. & VRANA, K. 1996. Intricate regulation of tyrosine hydroxylase activity and gene expression. J Neurochem, 67, 443-462.
KUYPERS, H. G. & BRINKMAN, J. 1970. Precentral projections to different parts of the spinal intermediate zone in the rhesus monkey. Brain Res 24, 29-48.
KUYPERS, H. G. 1960. Central cortical projections to motor and somato-sensory cell groups. An experimental study in the rhesus monkey. Brain, 83, 161-184.
KUYPERS, H. G. 1981. Handbook of Physiology Section 1, Vol. II: Motor Control (Brooks, V.B., ed.). American Physiological Society. 597-666.
LAI, Y. & SIEGEL, J. 1988. Medullary regions mediating atonia. The Journal of Neuroscience, 8, 4790-4796.

228 LAI, Y. Y. & SIEGEL, J. M. 1992. Corticotropin-releasing factor mediated muscle atonia in pons and medulla. Brain Research, 575, 63-68.
LAWRENCE, D. G. & HOPKINS, D. A. 1976. The development of motor control in rhesus monkey: evidence concerning the role of corticomotoneuronal connections. Brain, 99, 235-254.
LAWRENCE, D. G. & KUYPERS, H. G. 1968. The functional organization of the motor system in the monkey. I. The effects of bilateral pyramidal lesions. Brain, 91, 1-14.
LAWRENCE, J. J. 2008. Cholinergic control of GABA release: emerging parallels between neocortex and hippocampus. Trends in neurosciences, 31, 317-327.
LEMON, R. N. & GRIFFITHS, J. 2005. Comparing the function of the corticospinal system in different species: organizational differences for motor specialization? Muscle Nerve, 32, 261-279.
LEMON, R. N. 2008. Descending pathways in motor control. Annu. Rev. Neurosci., 31, 195-218.
LEONG, S. K. 1983. Localizing the corticospinal neurons in neonatal, developing and mature albino rat. Brain Res, 265, 1-9.
LI, X. G., FLORENCE, S. L. & KAAS, J. H. 1990. Area Distributions of Cortical Neurons Projecting to Different Levels of the Caudal Brain Stem and Spinal Cord in Rats. Somatosensory and Motor Research 7, 315-335.
LI, Y. W. & BAYLISS, D. A. 1998. Electrophysical properties, synaptic transmission and neuromodulation in serotonergic caudal raphe neurons. Clin Exp Pharmacol Physiol, 25, 468-473.
LI, Y. W., WESSELINGH, S. L. & BLESSING, W. W. 1992. Projections from rabbit caudal medulla to C1 and A5 sympathetic premotor neurons, demonstrated with phaseolus leucoagglutinin and herpes simplex virus. J Comp Neurol, 317, 379-395.
LIANG, F. Y., MORET, V., WIESENDANGER, M. & ROUILLER, E. M. 1991. Corticomotoneuronal connections in the rat: evidence from double-labeling of motoneurons and corticospinal axon arborizations. J Comp Neurol, 311, 356-366.
LINDSAY, K. A., MAXWELL, D. J., ROSENBERG, J. R. & TUCKER, G. 2007. A new approach to reconstruction models of dendritic branching patterns. Mathematical Biosciences, 205, 271-296.
LOPEZ-GARCIA, J. A. & KING, A. E. 1996. Pre- and post-synaptic actions for 5-hydroxytryptamine in the rat lumbar dorsal horn in vitro: implications for somatosensory transmission. Eur J Appl Physiol, 8, 2188-2197.
LOPEZ-GARCIA, J. A. 1998. Serotonergic modulation of the responses to excitatory amino acids of rat dorsal horn neurons in vitro: implications for somatosensory transmission. Eur J Neurosci, 10, 1341-1349.

229 LU, J., GRECO, M. A., SHIROMANI, P. & SAPER, C. B. 2000. Effect of Lesions of the Ventrolateral Preoptic Nucleus on NREM and REM Sleep. The Journal of Neuroscience, 20, 3830-3842.
LU, T., RUBIO, M. E. & TRUSSELL, L. O. 2008. Glycinergic Transmission Shaped by the Corelease of GABA in a Mammalian Auditory Synapse. Neuron, 57, 524-535.
LU, Y. & PERL, E. 2007. Selective action of noradrenaline and serotonin on neurones of the spinal superficial dorsal horn in the rat. J Physiol, 582.1, 127-136.
LUMSDEN, A. & KRUMSTAUF, R. 1996. Patterning the vetebrate neuraxis. Science, 274, 1109-1115.
LUNDBERG, A. 1982. Inhibitory control from the brainstem of transmission from primary afferents to motoneurons, primary afferent terminals and ascending pathways., Amsterdam, Elsevier.
LUQUE, J. M., NELSON, N. & RICHARDS, J. G. 1995. Cellular expression of glycine transporter 2 messenger RNA exclusively in rat hindbrain and spinal cord. Neuroscience, 64, 525-535.
MA, W., BEHAR, T. & BARKER, J. L. 1992. Transient expression of GABA immunoreactivity in the developing rat spinal cord. J Comp Neurol, 325, 271-290.
MACKAY-LYONS, M. 2002. Central Pattern Generation of Locomotion: A Review of the Evidence. Physical Therapy, 82, 69-83.
MACKIE, M., HUGHES, D. I., MAXWELL, D. J., TILLAKARATNE, N. J. K. & TODD, A. J. 2003. Distribution and colocalisation of glutamate decarboxylase isoforms in the rat spinal cord. Neuroscience, 119, 461-472.
MADRIAGA, M. A., MCPHEE, L. C., CHERSA, T., CHRISTIE, K. J. & WHELAN, P. J. 2004. Modulation of Locomotor Activity by Multiple 5-HT and Dopaminergic Receptor Subtypes in the Neonatal Mouse Spinal Cord. Journal of Neurophysiology, 92, 1566-1576.
MARSDEN, C. D., ROTHWELL, J. C. & DAY, B. L. 1984. The use of peripheral feedback in the control of movement. Trends in Neuroscience, 7, 253-258.
MARTELLA, G., TASSONE, A., SCIAMANNA, G., PLATANIA, P., CUOMO, D., VISCOMI, M. T., BONSI, P., CACCI, E., BIAGIONI, S., USIELLO, A., BERNARDI, G., SHARMA, N., STANDAERT, D. G. & PISANI, A. 2009. Impairment of bidirectional synaptic plasticity in the striatum of a mouse model of DYT1 dystonia: role of endogenous acetylcholine. Brain, 132, 2336-2349. MARTIN, E. M., DEVIDZE, N., SHELLEY, D. N., WESTBERG, L., FONTAINE, C. & PFAFF, D. W. 2011. Molecular and neuroanatomical characterization of single neurons in the mouse medullary gigantocellular reticular nucleus. The Journal of Comparative Neurology, 519, 2574-2593.

230 MARTIN, G. F., CABANA, T., CULBERSON, J. L., CURRY, J. J. & TSCHISMADIA, I. 1980. The early development of corticobulbar and corticospinal systems. Studies using the North American opposum. Anat Embryol, 161, 197-213.
MARTIN, G. F., HUMBERTSON, A. O., LAXSON, C. & PANNETON, W. M. 1979. Evidence for direct bulbospinal projections to laminae IX, X and the inter-mediolateral cell column. Studies using axonal transport techniques in the North American opossum. Brain Research, 170, 165-171.
MARTIN, G. F., VERTES R.P., WALTZER R. 1985. Spinal projections of the gigantocellular reticular formation in the rat. Evidence for projections from different areas to lamina I and II and lamina IX. Exp Brain Res, 58, 154-162.
MARTIN, J. 2005. The corticospinal system: from development to motor control. The Neuroscientist, 11, 161-173.
MASKOS, U., MOLLES, B. E., PONS, S., BESSON, M., GUIARD, B. P., GUILLOUX, J. P., EVRARD, A., CAZALA, P., CORMIER, A. & MAMELI-ENGVALL, M. 2005. Nicotine reinforcement and cognition restored by targeted expression of nicotinic receptors. Nature, 436, 103-107.
MASON, P. & LEUNG, C. G. 1996. Physiological functions of pontomedullary raphe and medial reticular neurons. Prog Brain Res, 107, 269-282.
MASON, P. 1997. Physiological identification of pontomedullary serotonergic neurons in the rat. J Neurophysiol, 77, 1087-1098.
MASON, P. 2001. Contributions of the medullary raphe and ventromedial reticular region to pain modulation and other homeostatic functions. Annu Rev Neurosci, 24, 737-777.
MASON, P. 2001a. Contributions of the medullary raphe and ventromedial reticular region to pain modulation and other homeostatic functions. Annu Rev Neurosci, 24, 737-777.
MASUKO, S., NAKAJIMA, Y., NAKAJIMA, S. & YAMAGUCHI, K. 1986. Noradrenergic neurons from the locus ceruleus in dissociated cell culture: culture methods, morphology, and electrophysiology. The Journal of Neuroscience, 6, 3229-3241.
MATSUYAMA, K., MORI, F., KUZE, B. & MORI, S. 1999. Morphology of single pontine reticulospinal axons in the lumbar enlargement of the cat: a study using the anterograde tracer PHA-L. J Comp Neurol, 410, 413-430.
MAXWELL, D. J. & RIDDELL, J. S. 1999. Axoaxonic synapses on terminals of group II muscle spindle afferent axons in the spinal cord of the cat. Eur J Neurosci, 11, 2151-2159.
MAXWELL, D. J., KERR, R., JANKOWSKA, E. & RIDDELL, J. S. 1997. Synaptic connections of dorsal horn group II spinal interneurons: Synapses formed with the interneurons and by their axon collaterals. The Journal of Comparative Neurology, 380, 51-69.
MAXWELL, D. J., RIDDELL, J. S. & JANKOWSKA, E. 2000. Serotoninergic and noradrenergic axonal contacts associated with premotor interneurons in spinal

231 pathways from group II muscle afferents. European Journal of Neuroscience, 12, 1271-1280.
MAXWELL, L., MAXWELL, D. J., NEILSON, M. & KERR, R. 1996. A confocal microscopic survey of serotoninergic axons in the lumbar spinal cord of the rat: co-localization with glutamate decarboxylase and neuropeptides. Neuroscience, 75, 471-480.
MCCREA, D. A. & RYBAK, I. A. 2008. Organization of mammalian locomotor rhythm and pattern generation. Brain Research Reviews, 57, 134-146.
MELLER, S. T., DYKSTRA, C. & GEBHART, G. F. 1992a. Production of endogenous nitric oxide and activation of soluble guanylate cyclase are required for N-methyl-D-aspartate-produced facilitation of the nociceptive tail-flick reflex. European Journal of Pharmacology, 214, 93-96.
MELLER, S. T., PECHMAN, P. S., GEBHART, G. F. & MAVES, T. J. 1992b. Nitric oxide mediates the thermal hyperalgesia produced in a model of neuropathic pain in the rat. Neuroscience, 50, 7-10.
MENA-SEGOVIA, J., WINN, P. & BOLAM, J. P. 2008. Cholinergic modulation of midbrain dopaminergic systems. Brain Res. Rev., 58, 265-271.
MENTIS, G. Z., SIEMBAB, V. C., ZERDA, R., O'DONOVAN, M. J. & ALVAREZ, F. J. 2006. Primary afferent synapses on developing and adult Renshaw cells. J Neurosci, 26, 13297-13310.
MESNAGE, B., GAILLARD, S., GODIN, A. G., RODEAU, J.-L., HAMMER, M., VON ENGELHARDT, J., WISEMAN, P. W., DE KONINCK, Y., SCHLICHTER, R. & CORDERO-ERAUSQUIN, M. 2011. Morphological and functional characterization of cholinergic interneurons in the dorsal horn of the mouse spinal cord. The Journal of Comparative Neurology, 519, 3139-3158.
METZ, G. A., PIECHARKA, D. M., KLEIM, J. A. & WHISHAW, I. Q. 2004. Preserved ipsilateral-to-lesion motor map organization in the unilateral 6-OHDA-treated rat model of Parkinson's disease. Brain Res, 1026, 126-135.
MILLER, M. W. 1987. The origin of corticospinal projection neurons in rat. Experimental Brain Research, 67, 339-351.
MIZUKAWA, K., VINCENT, S. R., MCGEER, P. L. & MCGEER, E. G. 1989. Distribution of reduced-nicotinamide-adenine-dinucleotide-phosphate diaphorase-positive cells and fibers in the cat central nervous system. J Comp Neurol, 279, 281-311.
MOLANDER, C., XU, Q. & GRANT, G. 1984. The cytoarchitectonic organization of the spinal cord in the rat. J Comp Neurol, 230.
MOORE, P. K., OLUYOMI, R. C., BABBEDGE, P., WALLACE, P. & HART, S. L. 1991. L-NG -nitro arginine methyl ester exhibits antinociceptive activity in the mouse. Br J Pharmacol, 102, 198-202.
232 MORALES, F. R., SAMPOGNA, S., RAMPON, C., LUPPI, P. H. & CHASE, M. H. 2006. Brainstem glycinergic neurons and their activation during active (rapid eye movement) sleep in the cat. Neuroscience, 142, 37-47.
MUENNICH, E. A. L. & FYFFE, R. E. W. 2004. Focal aggregation of voltage-gated, Kv2.1 subunit-containing, potassium channels at synaptic sites in rat spinal motoneurones. The Journal of Physiology, 554, 673-685.
MUIR, G. D. & WHISHAW, I. Q. 2000. Red nucleus lesions impair overground locomotion in rats: a kinetic analysis. Eur J Neurosci, 12, 1113-1122.
NAIM, M. Y., SPIKE, R. C., WATT, C., SHEHAB, S. A. S. & TODD, A. J. 1997. Cells in laminae III and IV of the rat spinal cord that possess the neurokinin-1 receptor and have dorsally directed dendrites receive a major synaptic input from techykinin-containing primary afferents. J Neuroscie, 17, 5536-5548.
NAKAMURA, K., HIOKI, H., FUJIYAMA, F. & KANEKO, T. 2005. Postnatal changes of vesicular glutamate transporter (VGluT)1 and VGluT2 immunoreactivities and their colocalization in the mouse forebrain. J. Comp. Neurol., 492, 263-288.
NEHER, E. 1998. Vesicle Pools and Ca2+ Microdomains: New Tools for Understanding Their Roles in Neurotransmitter Release. Neuron, 20, 389-399.
NGUYEN, Q. T., SANES, J. R. & LICHTMAN, J. W. 2002. Pre-existing pathways promote precise projection patterns. Nat Neurosci, 5, 861-867.
NI, B., ROSTECK, P., NADI, S. & PAUL, S. 1994. Cloning and expression of a cDNA encoding a brain-specific Na+ -dependent inorganic phosphate cotransporter. Proc Natl Acad Sci U S A, 91, 5607-5611.
NI, B., WU, X., YAN, G., WANG, J. & PAUL, S. 1995. Regional expression and cellular localization of the Na(+)-dependent inorganic phosphate cotransporter of rat brain. The Journal of Neuroscience, 15, 5789-5799.
NISHIMARU, H. & KAKIZAKI, M. 2009. The role of inhibitory neurotransmission in locomotor circuits of the developing mammalian spinal cord. Acta Physiologica, 197, 83-97.
NISHIMARU, H., RESTREPO, C. E., RYGE, J., YANAGAWA, Y. & KIEHN, O. 2005. Mammalian motor neurons corelease glutamate and acetylcholine at central synapses. Proc Natl Acad Sci U S A, 102, 5245-5249.
NORTH, R.A. & YOSHIMURA, M. 1984. The action of noradrenaline on neurones of the rat substantia gelatinosa in vitro. J Physiol, 349, 43-55. NYBERG-HANSEN, R. & MASCITTI, T. A. 1964. Sites and mode of termination of fibers of the vestibulospinal tract in the cat. An experimental study with silver impregnation methods. Exp Neurol, 122, 369-83.
NYBERG-HANSEN, R. 1965. Sites and mode of termination of reticulo-spinal fibers in the cat: an experimental study with silver impregnation methods. J Comp Neurol, 124, 71-99.

233 NYBERG-HANSEN, R. 1966. Functional organization of descending supraspinal fibre systems to the spinal cord. Anatomical observations and physiological correlations. Ergeb Anat Entwicklungsgesch, 39, 3-48.
OLAVE, M., PURI, N., KERR, R. & MAXWELL, D. 2002. Myelinated and unmyelinated primary afferent axons form contacts with cholinergic interneurons in the spinal dorsal horn. Experimental Brain Research, 145, 448-456.
OLIVEIRA, A. L. R., HYDLING, F., OLSSON, E., SHI, T., EDWARDS, R. H., FUJIYAMA, F., KANEKO, T., HÖKFELT, T., CULLHEIM, S. & MEISTER, B. 2003. Cellular localization of three vesicular glutamate transporter mRNAs and proteins in rat spinal cord and dorsal root ganglia. Synapse, 50, 117-129.
ORNUNG, G., SHUPLIAKOV, O., OTTERSON, O. P., STORM-MATHISEN, J. & CULHEIM, S. 1994. Immunohistochemical evidence for coexistence of glycine and GABA in nerve terminals on cat spinal motoneurones: an ultrastructural study. Neuroreport, 5, 889-892.
OTTERSEN, O. P., STORM-MATHISEN, J. & SOMOGYI, P. 1988. Colocalization of glycine-like and GABA-like immunoreactivities in Golgi cell terminals in the rat cerebellum: a postembedding light and electron microscope study. Brain Res, 450.
PAULI, W. M. & O'REILLY, R. C. 2008. Attentional control of associative learning—A possible role of the central cholinergic system. Brain Research, 1202, 43-53.
PAXINOS, G. & WATSON, C. 2003. The rat brain in stereotaxic coordinates. 3rd ed. New York: Academic Press.
PERSSON, S., BOULLAND, J.-L., ASPLING, M., LARSSON, M., FREMEAU, R. T., EDWARDS, R. H., STORM-MATHISEN, J., CHAUDHRY, F. A. & BROMAN, J. 2006. Distribution of vesicular glutamate transporters 1 and 2 in the rat spinal cord, with a note on the spinocervical tract. The Journal of Comparative Neurology, 497, 683-701.
PETERSON, B. W., MAUNZ, R. A., PITTS, N. G. & MACKEL, R. G. 1975. Patterns of projection and branching of reticulospinal neurons. Exp Brain Res, 23, 333-351.
PETERSON, B. W., PITTS, N. G., FUKUSHIMA, K. & MACKEL, R. G. 1978. Reticulospinal connections with limb and axial motoneurons. Exp Brain Res, 36, 1-20.
PETRAS, J. M. 1967. Cortical, tectal and tegmental fiber connections in the spinal cord of the cat. Brain Res, 6, 275-324.
PFLIEGER, J. F., CLARAC, F. & VINAY, L. 2002. Postural modifications and neuronal excitability changes induced by a short-term serotonin depletion during neonatal development in the rat. J Neurosci, 22, 5108-5117.
PHELPS, P. E., BARBER, R. P. & VAUGHN, J. E. 1988. Generation patterns of four groups of cholinergic neurons in rat cervical spinal cord: A combined tritiated thymidine autoradiographic and choline acetyltransferase immunocytochemical study. The Journal of Comparative Neurology, 273, 459-472.

234 PHELPS, P. E., BARBER, R. P., HOUSER, C. R., CRAWFORD, G. D., SALVATERRA, P. M. & VAUGH, J. E. 1984a. Postnatal development of neurons containing choline acetyltransferase in rat spinal cord: an immunocytochemical study. J Comp Neurol, 229, 347-361.
PITUELLO, F. 1997. Neuronal specification: generating diversity in the spinal cord. Curr Biol, 7, 701-704.
POTREBIC, S., FIELDS, H. L. & MASON, P. 1994. Serotonin immunoreactivity is contained in one physiological cell class in the rat rostral ventromedial medulla. Journal of Neuroscience, 14, 1655-1665.
PRENTICE, S. D. & DREW, T. 2001. Contributions of the reticulospinal system to the postural adjustments occurring during voluntary gait modifications. Journal of Neurophysiology, 85, 679-698.
PURVES, D. & HUME, R. 1981. The relation of postsynaptic geometry to the number of presynaptic axons that innervate autonomic ganglion cells. The Journal of Neuroscience, 1, 441-452.
QU, S., ONDO, W. G., ZHANG, X., XIE, W. J., PAN, T. H. & LE, W. D. 2006. Projections of diencephalic dopamine neurons into the spinal cord in mice. Experimental Brain Research, 168, 152-156.
RAMANATHAN, D., TUSZYNSKI, M. H. & CONNER, J. M. 2009. The Basal Forebrain Cholinergic System Is Required Specifically for Behaviorally Mediated Cortical Map Plasticity. The Journal of Neuroscience, 29, 5992-6000.
REED, W. R., SHUM-SIU, A. & MAGNUSON, D. S. 2008. Reticulospinal pathways in the ventrolateral funiculus with terminations in the cervical and lumbar enlargements of the adult rat spinal cord. Neuroscience, 151, 505-517.
RIBEIRO-DA-SILVA, A. & CUELLO, A. C. 1990a. Choline acetyltransferase-immunoreactive profiles are presynaptic to primary sensory fibers in the rat superficial dorsal horn. J Comp Neurol, 295, 370-384.
RIBEIRO-DA-SILVA, A. & CUELLO, A. C. 1990b. Ultrastructural evidence for the occurrence of two distinct somatostatin-containing systems in the substantia gelatinosa of rat spinal cord. J Chem Neuroanat, 3, 141-153.
ROBBINS, A., SCHWARTZ-GIBLIN, S. & PFAFF, D. W. 1992. Reticulospinal and reticuloreticular pathways for activating the lumbar back muscles in the rat. Exp Brain Res, 92, 46-58.
ROBERTS, A., DALE, N., ENVOY, W. H. & S.R., S. 1985. Synaptic potentials in motoneurons during fictive swimming in spinal Xenopus embryos. J Neurophysiol, 54, 1-10.
ROBLES-DE-LA-TORRE, G. 2008. Principles of haptic perception in virtual environments. In: M., G. (ed.) Human Haptic Perception. BirkHauser Verlag.

235 ROSSIGNOL, S., BOUYER, L., BARTHÉLEMY, D., LANGLET, C. & LEBLOND, H. 2002. Recovery of locomotion in the cat following spinal cord lesions. Brain Research Reviews, 40, 257-266.
RUDOMIN, P. & SCHMIDT, R. F. 1999. Pre-synaptic inhibition in the vertebrate spinal cord revisited. Exp Brain Res, 129, 1-37.
SAKAI, S. T., DAVIDSON, A. G. & BUFORD, J. A. 2009. Reticulospinal neurons in the pontomedullary reticular formation of the monkey (Macaca fascicularis). Neuroscience, 163, 1158-1170.
SAKATA-HAGA, H., KANEMOTO, M., MARUYAMA, D., HOSHI, K., MOGI, K., NARITA, M., OKADO, N., IKEDA, Y., NOGAMI, H., FUKUI, Y., KOJIMA, I., TAKEDA, J. & HISANO, S. 2001. Differential localization and colocalization of two neuron-types of sodium-dependent inorganic phosphate cotransporters in rat forebrain. Brain Research, 902, 143-155.
SCHAFER, M. K., VAROQUI, H., DEFAMIE, N., WEIBE, E. & ERICKSON, J. D. 2002. Molecular cloning and functional identification of mouse vesicular glutamate transporter 3 and its expression in subsets of novel excitatory neurons. J Biol Chem, 277, 50734-50748.
SCHEIBEL, M. E. & SCHEIBEL, A. B. 1969. Terminal patterns in cat spinal cord. Ill. Primary afferent collaterals. Brain Res, 13, 417-443.
SCHENKEL, E. & SIEGEL, J. M. 1989. REM sleep without atonia after lesions of the medial medulla. Neuroscience Letters, 98, 159-165.
SCHEPENS, B. & DREW, T. 2003. Strategies for the Integration of Posture and Movement During Reaching in the Cat. Journal of Neurophysiology, 90, 3066-3086.
SCHEPENS, B. & DREW, T. 2004. Independent and convergent signals from the pontomedullary reticular formation contribute to the control of posture and movement during reaching in the cat. Journal of Neurophysiology, 92, 2217-2238.
SCHERRER, G., LOW, S. A., WANG, X., ZHANG, J., YAMANAKA, H., URBAN, R., SOLORZANO, C., HARPER, B., HNASKO, T. S., EDWARDS, R. H. & BASBAUM, A. I. 2010. VGLUT2 expression in primary afferent neurons is essential for normal acute pain and injury-induced heat hypersensitivity. Proceedings of the National Academy of Sciences, 107, 22296-22301.
SCHOMBURG, E. D. & STEFFENS, H. 1988. The effect of DOPA and clonidine on reflex pathways from group II muscle afferents to alpha-motoneurones in the cat. Exp Brain Res, 71, 442-446.
SCOTT, S., PATEL, N. & LEVINE, J. 1990. Lectin binding identifies a subpopulation of neurons in chick dorsal root ganglia. The Journal of Neuroscience, 10, 336-345.
SCULLION, K., BOYCHUK, J. A., YAMAKAWA, G. R., RODYCH, J. T. G., NAKANISHI, S. T., SETO, A., SMITH, V. M., MCCARTHY, R. W., WHELAN, P. J., ANTLE, M. C.,
236 PITTMAN, Q. J. & TESKEY, G. C. 2013. Serotonin 1A Receptors Alter Expression of Movement Representations. The Journal of Neuroscience, 33, 4988-4999.
SEMWOGERERE, D. & WEEKS, E. 2005. Confocal Microscopy. Encyclopedia of Biomaterials and Biomedial Engineering.
SERRIAN, D. J., STRENS, L. H., CASSIDY, M. J., THOMPSON, A. J. & BROWN, P. 2004. Functional significance of the ipsilateral hemisphere during movement of the affected hand after stroke. Exp Neurol, 190.
SCHMITZ, C. & HOF, P.R. 2005. Design-based stereology in neuroscience. Neuroscience, 130, 813-831.
SHATZ, C. J. 1983. The prenatal development of the cat's retinogeniculate pathway. J Neurosci, 3, 482-499.
SHERRIFF, F. E. & HENDERSON, Z. 1994. A cholinergic propriospinal innervation of the rat spinal cord. Brain Research, 634, 150-154.
SHERRIFF, F. E., HENDERSON, Z. & MORRISON, J. F. B. 1991. Further evidence for the absence of a descending cholinergic projection from the brainstem to the spinal cord in the rat. Neuroscience Letters, 128, 52-56.
SIEGEL, J. M. 1989. Brainstem mechanisms generating REM sleep. In: KRYGER, M. H., ROTH, T. & DEMENT, W. C. (eds.) Principles and practice of sleep medicine. Philadelphia: Saunders.
SIEGEL, J. M., NIENHUIS, R., FEHRINGER, H. M., PAUL, R., SHIROMANI, P., DEMENT, W. C., MIGNOT, E. & CHIU, C. 1991. Neuronal activity in narcolepsy: identification of cataplexy-related cells in the medial medulla. Science, 252, 1315-8.
SILVERMAN, J. D. & KRUGER, L. 1990. Selective neuronal glycoconjugate expression in sensory and autonomic ganglia: relation of lectin reactivity to peptide and enzyme markers. J Neurocytol, 19, 789-801.
SKAGERBERG, G. & LINDVALL, O. 1985. Organization of diencephalic dopamine neurones projecting to the spinal cord in the rat. Brain Research, 342, 340-351.
SMETANA, R., JUVIN, L., DUBUC, R. & ALFORD, S. 2010. A parallel cholinergic brainstem pathway for enhancing locomotor drive. Nat Neurosci, 13, 731-738.
SNIDER, W. 1988. Nerve growth factor enhances dendritic arborization of sympathetic ganglion cells in developing mammals. The Journal of Neuroscience, 8, 2628-2634.
SOGHOMONIAN, J.-J. & MARTIN, D. L. 1998. Two isoforms of glutamate decarboxylase: why? Trends in Pharmacological Sciences, 19, 500-505.
SOJA, P. J., MORALES, F. R., BARANYI, A. & CHASE, M. H. 1987. Effect of inhibitory amino acid antagonists on IPSPs induced in lumbar motoneurons upon stimulaion of the nucleus reticularis gigantocellularis during active sleep. Brain Res, 423, 353-358.

237 SPIKE, R. C., TODD, A. J. & JOHNSTON, H. M. 1993. Coexistence of NADPH diaphorase with GABA, glycine, and acetylcholine in rat spinal cord. J Comp Neurol, 335, 320-333.
SPITZER, N. C. 2004. Coincidence detection enhances appropriate wiring of the nervous system. Proc Natl Acad Sci U S A, 101, 5311-5312.
SQALLI-HOUSSAINI, Y., CAZALETS, J. R. & CLARAC, F. 1993. Oscillatory properties of the central pattern generator for locomotion in neonatal rats. Journal of Neurophysiology, 70, 803-813.
STEPANYANTS, A. & CHKLOVSKII, D. B. 2005. Neurogeometry and potential synaptic connectivity. Trends in neurosciences, 28, 387-394.
STEPIEN, A. E., TRIPODI, M. & ARBER, S. 2010. Monosynaptic Rabies Virus Reveals Premotor Network Organization and Synaptic Specificity of Cholinergic Partition Cells. Neuron, 68, 456-472.
STEWART, W. & MAXWELL, D. J. 1999. A population of lamina III/IV neurokinin-1-immunoreactive cells are targeted by serotinin-immunoreactive axons in the rat dorsal horn. Journal of Physiology-London, 518p, 166.
STOKKE, M. F., NISSEN, U. V., GLOVER, J. C. & KIEHN, O. 2002. Projection patterns of commissural interneurons in the lumbar spinal cord of the neonatal rat. The Journal of Comparative Neurology, 446, 349-359.
STORM-MATHISEN, J., DANBOLT, N. C. & OTTERSEN, O. P. 1995. Localization of glutamate and its membrane transport proteins. In: STONE, T. S. (ed.) CNS neurotransmitters and neuromodulators: glutamate. New York: CRC Press.
SUGIUCHI, Y., KAKEI, S., IZAWA, Y. & SHINODA, Y. 2004. Functional synergies among neck muscles revealed by branching patterns of single long descending motor-tract axons. Prog Brain Res, 143, 411-421.
SUMNER, B. E. & WATSON, W. E. 1971. Retraction and expansion of the dendritic tree of motor neurones of adult rats induced in vivo. Nature, 233, 273-275.
TAAL, W. & HOLSTEGE, J. C. 1994. GABA and glycine frequently colocalize in terminals on cat spinal motoneurons. Neuroreport, 5, 2225-2228.
TAKAHASHI, M., FREED, R., BLACKMER, T. & ALFORD, S. 2001. Calcium influx-independent depression of transmitter release by 5-HT at lamprey spinal cord synapses. The Journal of Physiology, 532, 323-336.
TAKAMORI, S., HOLT, M. & STENIUS, K. 2006. Molecular anatomy of a trafficking organelle. Cell, 127, 831-846.
TAKAMORI, S., RHEE, J. S., ROSENMUND, C. & JAHN, R. 2000. Identification of a vesicular glutamate transporter that defines a glutamatergic phenotype in neurons. Nature, 407, 189-194.
TANAKA, H., AMAMIYA, S., MIURA, N., ARAKI, A., OHINATA, J. & FUJIEDA, K. 2006. Postnatal development of brainstem serotonin-containing neurons projecting to lumbar spinal cord in rats. Brain and Development, 28, 586-591.

238 THOMAS, E. & PEARSE, A. G. E. 1964. The solitary active cells. Histochemical demonstration of damage-resistant nerve cells with a TPN-diaphorase reaction. Acta Neuropathol., 3, 238-249.
TODD, A. J. & SPIKE, R. C. 1993. The localization of classical transmitters and neuropeptides within neurons in laminae I–III of the mammalian spinal dorsal horn. Progress in Neurobiology, 41, 609-645.
TODD, A. J., HUGHES, D. I., POLGAR, E., NAGY, G. G., MACKIE, M., OTTERSEN, O. P. & MAXWELL, D. J. 2003. The expression of vesicular glutamate transporters VGLUT1 and VGLUT2 in neurochemically defined axonal populations in the rat spinal cord with emphasis on the dorsal horn. Eur J Neurosci, 17, 13-27.
TODD, A. J., SPIKE, R. C., CHONG, D. & NEILSON, M. 1995. The relationship between glycine and gephyrin in synapses of the rat spinal cord. Eur J Neurosci, 7, 1-11.
TODD, A., WATT, C., SPIKE, R. & SIEGHART, W. 1996. Colocalization of GABA, glycine, and their receptors at synapses in the rat spinal cord. The Journal of Neuroscience, 16, 974-982.
TOHYAMA, M., SAKAI, K., SALVERT, D., TOURET, M. & JOUVET, M. 1979. Spinal projections from the lower brain stem in the cat as demonstrated by the horseradish peroxidase technique: origins of the reticulospinal tracts and their funicular trajectories. Brain Research, 173, 383-403.
TRICOIRE, L. & TANIA, V. 2012. Neuronal nitric oxide synthase expressing neurons: A journey from birth to neuronal circuits. Frontiers in Neural Circuits, 82, 1-16.
TROJANOWSKI, J. Q., GONATAS, J. O. & GONATAS, N. K. 1982. Horseradish peroxidase (HRP) conjugates of cholera toxin and lectins are more sensitive retrogradely transported markers than free HRP. Brain Research, 231, 33-50.
VALTSCHANOFF, J. G., PHEND, K. D., BERNARDI, P. S., WEINBERG, R. J. & RUSTIONI, A. 1994. Amino acid immunocytochemistry of primary afferent terminals in the rat dorsal horn. Comp Neurol, 346, 237-252.
VALTSCHANOFF, J. G., WEINBERG, R. J. & RUSTIONI, A. 1992. NADPH diaphorase in the spinal cord of rats. J Comp Neurol, 321, 209-222.
VALTSCHANOFF, J. G., WEINBERG, R. J. & RUSTIONI, A. 1993. Amino acid immunoreactivity in corticospinal terminals. Exp Brain Res, 93, 95-103.
VAN DIJKEN, H., DIJK, J., VOOM, P. & HOLSTEGE, J. C. 1996. Localization of dopamine D2 receptor in rat spinal cord identified with immunocytochemistry and in situ hybridization. Eur J Neurosci, 8, 621-628.
VANDERHORST, V. G. J. M. & ULFHAKE, B. 2006. The organization of the brainstem and spinal cord of the mouse: Relationships between monoaminergic, cholinergic, and spinal projection systems. Journal of Chemical Neuroanatomy, 31, 2-36.
239 VANDERHORST, V. G., TERASAWA, E., RALSTON, H. J. R. & HOLSTEGE, G. 2000. Monosynaptic projections from the lateral periaqueductal gray to the nucleus retroambiguus in the rhesus monkey: implications for vocalization and reproductive behavior. J Comp Neurol, 424, 251-268.
VAROQUI, H., SCHÄFER, M. K.-H., ZHU, H., WEIHE, E. & ERICKSON, J. D. 2002. Identification of the Differentiation-Associated Na+/PI Transporter as a Novel Vesicular Glutamate Transporter Expressed in a Distinct Set of Glutamatergic Synapses. The Journal of Neuroscience, 22, 142-155.
VETRIVELAN, R., FULLER, P. M., TONG, Q. & LU, J. 2009. Medullary Circuitry Regulating Rapid Eye Movement Sleep and Motor Atonia. The Journal of Neuroscience, 29, 9361-9369.
VINCENT, S. R. & KIMURA, H. 1992. Histochemical mapping of nitric oxide synthase in the rat brain. Neuroscience, 46, 755-784.
WALL, P. D. & LIDIERTH, M. 1997. Five sources of a dorsal root potenial: their interactions and origins in the superficial dorsal horn. J Neurophysiol, 78, 860-871.
WALLEN, P., BUCHANAN, J. T., GRILLNER, S., HILL, R. H., CHRISTENSON, J. & HOKFELT, T. 1989. Effects of 5-hydroxytryptamine on the afterhyperpolarization, spike frequency regulation, and oscillatory membrane properties in lamprey spinal cord neurons. Journal of Neurophysiology, 61, 759-768.
WANG, Z., KAI, L., DAY, M., RONESI, J., YIN, H. H., DING, J., TKATCH, T., LOVINGER, D. M. & SURMEIER, D. J. 2006. Dopaminergic control of corticostriatal long-term synaptic depression in median spiny neurons is mediated by cholinergic interneurons. Neuron, 50, 443-452.
WANG, Z.-W. E. 2008. Molecular Mechanisms of Neurotransmitter Release, Farmington, CT, Humana Press.
WEN, Q. & CHKLOVSKII, D. B. 2008. A Cost–Benefit Analysis of Neuronal Morphology. Journal of Neurophysiology, 99, 2320-2328.
WESS, J. 2003. Novel insights into muscarinic acetylcholine receptor function using gene targeting technology. Trends in Pharmacological Sciences, 24, 414-420.
WESTLUND, K. N., LU, Y., COGGESHALL, R. E. & WILLIS, W. D. 1992. Serotonin is found in myelinated axons of the dorsolateral funiculus in monkeys. Neuroscience Letters, 141, 35-38.
WHELAN, P. J. 1996. Control of locomotion in the decerebrate cat. Progress in Neurobiology, 49, 481-515.
WHELAN, P., BONNOT, A. & O'DONOVAN, M. J. 2000. Properties of Rhythmic Activity Generated by the Isolated Spinal Cord of the Neonatal Mouse. Journal of Neurophysiology, 84, 2821-2833.

240 WHISHAW, I. Q. 2000. Loss of the innate cortical engram for action patterns used in skilled reaching and the development of behavioral compensation following motor cortex lesions in the rat. Neuropharmacology, 39, 788-805.
WHITE, S. R., FUNG, S. J., JACKSON, D. A. & IMEL, K. M. 1996. Serotonin, norepinephrine and associated neuropeptides: effects on somatic motoneuron excitability. Prog Brain Res, 107, 183-199.
WILLIS, W. D. 1971. The case for the Renshaw cell. Brain Behav Evol, 4, 5-52.
WILSON, J. M., REMPEL, J. & BROWNSTONE, R. M. 2004. Postnatal development of cholinergic synapses on mouse spinal motoneurons. The Journal of Comparative Neurology, 474, 13-23.
WILSON, V. J. & PETERSON, B. W. 1978. Peripheral and central substrates of vestibulospinal reflexes. Physiological Reviews, 58, 80-105.
WILSON, V. J. & YOSHIDA, M. 1969. Comparison of effects of stimulation of Deiters' nucleus and medial longitudinal fasciculus on neck, forelimb, and hindlimb motoneurons. Journal of Neurophysiology, 32, 743-58.
WINDHORST, U. 1996. On the role of recurrent inhibitory feedback in motor control. Prog Neurobiol, 49, 517-587.
WINDHORST, U. 2007. Muscle proprioceptive feedback and spinal networks. Brain Research Bulletin, 73, 155-202.
WISE, S. P. & JONES, E. G. 1977. Cells of origin and terminal distribution of descending projections of the rat somatic sensory cortex. J Comp Neurol, 175, 129-158.
WOLPAW, J. R. 2010. What Can the Spinal Cord Teach Us about Learning and Memory? The Neuroscientist, 16, 532-549.
YASAKA, T., TIONG, S. Y., HUGHES, D. I., RIDDELL, J. S. & TODD, A. J. 2010. Populations of inhibitory and excitatory interneurons in lamina II of the adult rat spinal dorsal horn revealed by a combined electrophysiological and anatomical approach. Pain, 151, 475-488.
ZAGORAIOU, L., AKAY, T., MARTIN, J. F., BROWNSTONE, R. M., JESSELL, T. M. & MILES, G. B. 2009. A cluster of cholinergic premotor interneurons modulates mouse locomotor activity. Neuron, 64, 645-662.
ZEILHOFER, H. U., MÖHLER, H. & DI LIO, A. 2009. GABAergic analgesia: new insights from mutant mice and subtype-selective agonists. Trends in pharmacological sciences, 30, 397-402.

241
Publication