Embed Size (px)
Citation preview

Decision Support System for Selection of Satellite vs. RegionalTreatment for Reuse Systems
WateReuseFoundation

Decision Support System for Selection of Satellite vs. Regional Treatment for Reuse Systems

About the WateReuse Foundation
The mission of the WateReuse Foundation is to conduct and promote applied research on the reclamation, recycling, reuse, and desalination of water. The Foundation’s research advances the science of water reuse and supports communities across the United States and abroad in their efforts to create new sources of high quality water through reclamation, recycling, reuse, and desalination while protecting public health and the environment. The Foundation sponsors research on all aspects of water reuse, including emerging chemical contaminants, microbiological agents, treatment technologies, salinity management and desalination, public perception and acceptance, economics, and marketing. The Foundation’s research informs the public of the safety of reclaimed water and provides water professionals with the tools and knowledge to meet their commitment of increasing reliability and quality. The Foundation’s funding partners include the Bureau of Reclamation, the California State Water Resources Control Board, the Southwest Florida Water Management District, the California Department of Water Resources, and the California Energy Commission. Funding is also provided by the Foundation’s Subscribers, water and wastewater agencies, and other interested organizations. The Foundation also conducts research in cooperation with the Global Water Research Coalition.

Decision Support System for Selection of Satellite vs. Regional Treatment for Reuse Systems
Stephen Davis Malcolm Pirnie, Inc. Cosponsors Bureau of Reclamation California State Water Resources Control Board City of Phoenix Water Services Department Malcolm Pirnie, Inc.
Published by the WateReuse Foundation Alexandria, VA
Disclaimer This report was sponsored by the WateReuse Foundation and cosponsored by the Bureau of Reclamation, the California State Water Resources Control Board, the City of Phoenix Water Services Department, and Malcolm Pirnie, Inc. The Foundation, its Board Members, and the project cosponsors assume no responsibility for the content reported in this publication or for the opinions or statements of facts expressed in the report. The mention of trade names of commercial products does not represent or imply the approval or endorsement of the WateReuse Foundation or the cosponsors. This report is published solely for informational purposes. For more information, contact: WateReuse Foundation 1199 North Fairfax Street, Suite 410 Alexandria, VA 22314 703-548-0880 703-548-5085 (fax) www.WateReuse.org/Foundation © Copyright 2009 by the WateReuse Foundation. All rights reserved. Permission to reproduce must be obtained from the WateReuse Foundation. WateReuse Foundation Project Number: WRF-04-014 WateReuse Foundation Product Number: 04-014-01 ISBN: 978-1-934183-14-4 Library of Congress Control Number: 2009922973 Printed in the United States of America Printed on Recycled Paper

WateReuse Foundation v
CONTENTS
List of Figures ......................................................................................................................................... vi List of Tables ......................................................................................................................................... vii Abbreviations ....................................................................................................................................... viii Foreword ................................................................................................................................................. ix Acknowledgments ................................................................................................................................... xi Executive Summary ............................................................................................................................. xiii Chapter 1. Introduction ......................................................................................................................... 1
Purpose of the DSS ............................................................................................................................. 1 Purpose and Organization of User’s Manual ...................................................................................... 2
Chapter 2. DSS Overview ...................................................................................................................... 3
DSS Structure ..................................................................................................................................... 3 Key Definitions .................................................................................................................................. 4 Intended Planning Applications .......................................................................................................... 6 Data Requirements ............................................................................................................................. 6 Major Assumptions and Limitations ................................................................................................... 6
Chapter 3. Operating Instructions For DSS ...................................................................................... 11
Getting Started .................................................................................................................................. 11 Introduction ...................................................................................................................................... 12 Utility Information and Economic Data ........................................................................................... 13 Satellite Facility Configuration and Cost Estimate ........................................................................... 14 Regional Facility Configuration and Cost Estimate ......................................................................... 21 Decision Criteria and Recommendation ........................................................................................... 23
Chapter 4. Bases of Designs and Costs for Reuse Facilities .............................................................. 27
Summary of Cost Estimation Assumptions ...................................................................................... 27 Water Reclamation Facilities ............................................................................................................ 27 Distribution Systems and Conveyance Pipelines .............................................................................. 40
References ............................................................................................................................................. 45 Appendix A. DSS Application Example ............................................................................................. 47 Appendix B. Conceptual Level Cost Opinions ................................................................................... 53

vi WateReuse Foundation
FIGURES
2-1 Regional treatment system. ............................................................................................ 5 2-2 Satellite treatment system. ............................................................................................. 5 2-3 Conceptual reclaimed water distribution system. .......................................................... 8 3-1 Prompt for enabling macros. ........................................................................................ 11 3-2 Introduction page. ........................................................................................................ 12 3-3 Progress bar. ................................................................................................................. 12 3-4 Navigation button. ........................................................................................................ 13 3-5 Utility Information and Economic Data page. ............................................................. 13 3-6 Button restores default values. ..................................................................................... 14 3-7 Zoom control bar. ......................................................................................................... 14 3-8 Satellite page. ............................................................................................................... 15 3-9 Selection of water quality criteria (end use, state). ...................................................... 15 3-10 Treatment capacity selection. ....................................................................................... 16 3-11 Process selection portion of Satellite page. .................................................................. 17 3-12 Loads returned by the satellite reclamation plant. ....................................................... 17 3-13 Conveyance between the satellite plant and the regional sewer system. ..................... 18 3-14 Distribution system table. ............................................................................................ 18 3-15 Distribution system branches are characterized by their nodes. .................................. 18 3-16 Buttons for adding or deleting nodes with their branches. ........................................... 19 3-17 Reclaimed water production is compared to distribution capacity. ............................. 19 3-18 Display of estimated costs. ........................................................................................... 20 3-19 Satellite alternative cost charts. .................................................................................... 20 3-20 Regional alternative page. ............................................................................................ 21 3-21 Checked options alter the display of the regional alternative. ..................................... 22 3-22 Decision Criteria and Recommendation page. ............................................................. 23 3-23 The types of estimated costs displayed can be changed easily. ................................... 24 3-24 Weighted Decision table. ............................................................................................. 24 3-25 Decision criterion descriptions. .................................................................................... 25 3-26 “Reset Decision Criteria” button. ................................................................................. 26 4-1 Ox treatment train. ....................................................................................................... 33 4-2 SBR treatment train. ..................................................................................................... 34 4-3 MBR treatment train. ................................................................................................... 34 4-4 Simplified distribution system for reclaimed water. .................................................... 43

WateReuse Foundation vii
TABLES
4-1 Influent flow peaking relationships. ............................................................................. 28 4-2 Water quality design criteria. ....................................................................................... 29 4-3 California recycled water quality standards. ................................................................ 30 4-4 Arizona reclaimed water quality standards. ................................................................. 31 4-5 Process unit sizing target criteria. ................................................................................. 35 4-6 Unit process cost-estimating factors and algorithm...................................................... 37 4-7 Treatment option matrix. .............................................................................................. 39 4-8 Treatment facility footprints. ........................................................................................ 40 4-9 Unit process recovery percentages. .............................................................................. 41 4-10 Reclamation plant production ratios (fraction of inflow). ........................................... 42

viii WateReuse Foundation
ABBREVIATIONS
AACE Association for the Advancement of Cost Engineering C customer Dis disinfection DSS Decision Support System Filt filtration ft² square feet gpd gallons per day gpm gallons per minute HRT hydraulic residence time MBR membrane bioreactor MF microfiltration MG million gallons mgd millions of gallons per day mL milliliters mm millimeters MPN most probable number N node NTU Nephelometric Turbidity Units O&M operation and maintenance Ox oxidation ditch PAC Project Advisory Committee RO reverse osmosis SBR squencing batch reactor SRT solids retention time TDS total dissolved solids TOC total organic carbon UF ultrafiltration WRF water reclamation facility

WateReuse Foundation ix
FOREWORD
The WateReuse Foundation, a nonprofit corporation, sponsors research that advances the science of water reclamation, recycling, reuse, and desalination. The Foundation funds projects that meet the water reuse and desalination research needs of water and wastewater agencies and the public. The goal of the Foundation’s research is to ensure that water reuse and desalination projects provide high-quality water, protect public health, and improve the environment.
A Research Plan guides the Foundation’s research program. Under the plan, a research agenda of high-priority topics is maintained. The agenda is developed in cooperation with the water reuse and desalination communities, including water professionals, academics, and Foundation Subscribers. The Foundation’s research focuses on a broad range of water reuse research topics, including the following:
• Definition and addressing of emerging contaminants; • Public perceptions of the benefits and risks of water reuse; • Management practices related to indirect potable reuse; • Groundwater recharge and aquifer storage and recovery; • Evaluation of methods for managing salinity and desalination; and • Economics and marketing of water reuse.
The Research Plan outlines the role of the Foundation’s Research Advisory Council (RAC), Project Advisory Committees (PACs), and Foundation staff. The RAC sets priorities, recommends projects for funding, and provides advice and recommendations on the Foundation’s research agenda and other related efforts. PACs are convened for each project and provide technical review and oversight. The Foundation’s RAC and PACs consist of experts in their fields and provide the Foundation with an independent review, which ensures the credibility of the Foundation’s research results. The Foundation’s Project Managers facilitate the efforts of the RAC and PACs and provide overall management of projects.
The Foundation’s primary funding partner is the U.S. Bureau of Reclamation (BuRec). Other funding partners include the California State Water Resources Control Board, the Southwest Florida Water Management District, Foundation Subscribers, water and wastewater agencies, and other interested organizations. The Foundation leverages its financial and intellectual capital through these partnerships and funding relationships. The Foundation is also a member of two water research coalitions: the Global Water Research Coalition and the Joint Water Reuse & Desalination Task Force.
This publication is intended to communicate the results of a study sponsored by the WateReuse Foundation. The goal of this project was to develop a decision support system (DSS) that streamlines the comparison of satellite and regional approaches to water reuse.
David L. Moore President WateReuse Foundation
G. Wade Miller Executive Director WateReuse Foundation


WateReuse Foundation xi
ACKNOWLEDGMENTS
This project was funded by the WateReuse Foundation in cooperation with the Bureau of Reclamation, the California State Water Resources Control Board, the City of Phoenix Water Services Department, and Malcolm Pirnie, Inc.
This study would not have been possible without the efforts and contributions of many individuals and organizations. These include Malcolm Pirnie’s project team, the Project Advisory Committee (PAC), participating organizations identified below, and the Foundation’s Director of Research Programs and Project Manager, Joshua Dickinson.
The project team thanks the WateReuse Foundation and its cosponsors for funding this endeavor, as well as the participating organizations for their in-kind contributions. It is our sincere hope that the product of this project will be of use to the reuse community and enhanced over time.
Principal Investigator Stephen Davis, P.E., Malcolm Pirnie, Inc.
Project Manager Stephen Osgood, P.E., Malcolm Pirnie, Inc.
Project Team Aziz Ahmed, Malcolm Pirnie, Inc. Brent Alspach, Malcolm Pirnie, Inc. Jack Bryck, Malcolm Pirnie, Inc. Jim Crook, Water Reuse Consultant Tim Francis, Malcolm Pirnie, Inc. Patricia Hausser, Malcolm Pirnie, Inc. Syed Jaffrey, Malcolm Pirnie, Inc. Laurel Passantino, Malcolm Pirnie, Inc. Jennifer Phillips, Malcolm Pirnie, Inc. Steve Porteous, Malcolm Pirnie, Inc. Rajesh Prasad, Malcolm Pirnie, Inc. Jeremy Smith, Malcolm Pirnie, Inc.
Project Advisory Committee Tim Coughlin, Loudoun Water Paul Kinshella, City of Phoenix Water Services Department Richard Mills, California State Water Resources Control Board Hal Schmidt, Brown and Caldwell R. Shane Trussell, Trussell Technologies, Inc. Ken Yokoyama, Bureau of Reclamation

xii WateReuse Foundation
Participating Organizations City of Dallas Water Utilities (TX) City of Folsom Utilities Department (CA) City of Peoria Utilities Department (AZ) City of Phoenix Water Services Department (AZ) City of Scottsdale (AZ) City of Tucson Water Department (AZ) East Bay Municipal Utility District (CA) Irvine Ranch Water District (CA) Malcolm Pirnie, Inc. Pima County Wastewater Management Department (AZ) Southwest Florida Water Management District (FL) West Basin Municipal Water District (CA)

WateReuse Foundation xiii
EXECUTIVE SUMMARY
PROJECT BACKGROUND AND OBJECTIVES This project develops a spreadsheet-based tool to assist utilities in comparing the advantages of constructing a satellite wastewater treatment plant for reclaimed water use and those of using a regional wastewater treatment plant, with inherent distance and elevation concerns of direct users. The flexible tool allows users to develop and apply weights to customized ranking criteria for economic and noneconomic evaluations.
Satellite treatment facilities can offer the advantages of advanced wastewater treatment processes and relative nearness to potential users of reclaimed water. Potentially, this can translate into smaller site footprints, greater automation of treatment facilities, and shorter distribution systems than could be offered by regional treatment systems. Both capital and operating costs associated with distribution may, therefore, be lower. Satellite systems can also reduce hydraulic loads on the downstream wastewater conveyance and treatment facilities and delay the need for their expansion. Since satellite systems are generally wastewater “scalping” systems, however, solids are returned to the sewer and flow to the regional plant for processing.
Existing regional wastewater treatment plants may offer advantages of their own. They may need only to incrementally improve the quality of existing effluent in order to produce reclaimed water. Alternatively, if plant flow capacity must be expanded to produce a new increment of reclaimed water, a regional facility may already have sufficient space available to accommodate new treatment infrastructure without the need to acquire new land.
The choice between developing a new satellite water reclamation plant and producing reclaimed water at an existing wastewater treatment plant requires considering the advantages and disadvantages of both approaches. To facilitate this, the WateReuse Foundation funded the development of a decision support system (DSS) that streamlines the comparison of satellite and regional approaches to water reuse.
The purpose of the DSS is to provide a broadly applicable, standardized approach to evaluating satellite wastewater reclamation systems as an alternative to traditional regional wastewater reclamation facilities. The DSS is intended to support water, wastewater, or regional planning agencies in the United States in preliminary planning activities where new treatment and distribution infrastructure is being considered.


WateReuse Foundation 1
CHAPTER 1
INTRODUCTION
As potable water costs increase and water supplies dwindle, communities are turning to advanced treatment systems that recycle and reuse wastewater as an alternative water source. For some utilities, it may be cost-prohibitive to pump and distribute reclaimed wastewater through miles of distribution lines from a centralized treatment plant. Consequently, utilities are more frequently considering satellite reclamation systems for water reuse as an alternative to expanding regional wastewater treatment facilities.
Satellite treatment facilities can offer the advantages of advanced wastewater treatment processes and relative nearness to potential users of reclaimed water. Potentially, this can translate into smaller site footprints, greater automation of treatment facilities, and shorter distribution systems than could be offered by regional treatment systems. Both capital and operating costs associated with distribution may, therefore, be lower. Satellite systems can also reduce hydraulic loads on the downstream wastewater conveyance and treatment facilities and delay the need for their expansion. Since satellite systems are generally wastewater “scalping” systems, however, solids are returned to the sewer and flow to the regional plant for processing.
Existing regional wastewater treatment plants may offer advantages of their own. They may need only to incrementally improve the quality of existing effluent in order to produce reclaimed water. Alternatively, if plant flow capacity must be expanded to produce a new increment of reclaimed water, a regional facility may already have sufficient space available to accommodate new treatment infrastructure without the need to acquire new land.
The choice between developing a new satellite water reclamation plant and producing reclaimed water at an existing wastewater treatment plant requires considering the advantages and disadvantages of both approaches. To facilitate this, the WateReuse Foundation hired Malcolm Pirnie, Inc. to develop a decision support system (DSS) that streamlines the comparison of satellite and regional approaches to water reuse.
1.1 PURPOSE OF THE DSS The WateReuse Foundation funded the development of the DSS through its solicited research program. The purpose of the DSS is to provide a broadly applicable, standardized approach to evaluating satellite wastewater reclamation systems as an alternative to traditional regional wastewater reclamation facilities. The DSS is intended to support water, wastewater, or regional planning agencies in the United States in preliminary planning activities where new treatment and distribution infrastructure is being considered.
It is to be emphasized that the DSS is intended to be an aid to the decision-making process. Substantial thought and effort went into its development, and it is hoped that it will be found useful for simplified formulation and evaluation of alternative reclamation systems. However, it does not replace careful planning or responsible decision-making. In no case should the data it generates be relied upon for investment decisions without independent analysis.

2 WateReuse Foundation
1.2 PURPOSE AND ORGANIZATION OF USER’S MANUAL The purpose of the User’s Manual is to describe the DSS and provide instructions to the user in the operation of the computerized tool. Reflecting its purpose, the User’s Manual is organized into four chapters. After this introductory chapter, the manual provides an overview of the DSS, instructions for its operation, and details regarding the assumptions that underlie its analysis. In order to assist the user, a completed example and some additional cost information were also included in the appendices.

WateReuse Foundation 3
CHAPTER 2
DSS OVERVIEW
This chapter provides an overview of the DSS. It describes the structure of the DSS, defines regional and satellite systems; highlights the type of planning problems the tool was designed to address; and identifies its data requirements, major assumptions, and limitations.
The DSS consists of a customized Microsoft Excel workbook with dynamically interactive worksheets that calculate relative, planning-level costs of user-defined satellite and regional reuse system alternatives. An enhanced user interface guides the user to input data, select treatment options, define a simplified distribution system, and apply weighted decision criteria to compare the two alternatives.
2.1 DSS STRUCTURE The Excel workbook is organized into five pages for user interaction:
• Introduction • Utility Information and Economic Data • Satellite Facility Configuration and Cost Estimate • Regional Facility Configuration and Cost Estimate • Decision Criteria and Recommendation
In addition to these five pages, an unseen, embedded library of reference data, decision logic, and calculations converts the user’s input data into meaningful output.
The Introduction page provides a concise statement of the DSS’s purpose and describes the data requirements and level of knowledge that the user should have. These requirements are also stated below.
The Utility Information and Economic Data page displays default economic parameters that affect the cost calculations for both the satellite and regional alternatives. This page provides users with the opportunity to modify the parameters and tailor the cost analysis to their needs.
The Satellite Facility Configuration and Cost Estimate page is used to define a satellite reuse alternative. The user enters data to define the satellite treatment facility and its reclaimed water distribution system. The user also chooses a set of end use water quality criteria and a treatment train. Based upon the inputs provided by the user and the stored decision logic and reference data, the DSS calculates and displays a cost for the satellite system that can be compared with that of a regional alternative.
The Regional Facility Configuration and Cost Estimate page is used to define a reuse alternative where treatment is provided by a regional wastewater reclamation plant. Its structure, function, and operation are similar to those of the Satellite page. It can be used to

4 WateReuse Foundation
define a reuse system with the same end use criteria and treatment capacity as the satellite alternative or one that is completely different.
The Decision Criteria and Recommendation page displays the relative cost ranges of the satellite and regional alternatives and provides a set of decision criteria for the user to weight and apply in evaluating the two alternatives. Users can eliminate criteria by assigning weights of zero and can include additional criteria that they have defined. Once the user assigns scores for the criteria being applied to each of the alternatives, the page calculates sets of weighted scores. The alternative with the higher total weighted score is the one recommended by the DSS.
2.2 KEY DEFINITIONS To clarify the types of reuse system alternatives that are addressed by the DSS, the following definitions of satellite and regional treatment systems are provided.
Regional Treatment As used in this DSS, a regional treatment system for reuse is defined as a set of collection, treatment, and distribution infrastructure that receives and treats raw wastewater to a level of quality adequate for disposal to the natural environment, additionally treats a portion of the effluent to a level suitable for reuse, processes residual solids resulting from the treatment processes, conveys the reclaimed water to the point of use, and discharges the remaining effluent to the environment. Figure 2-1 schematically illustrates a regional treatment system.
Here, regional treatment is synonymous with the terms “central” and “centralized” treatment that are encountered in the water and wastewater industries (Guidelines for Water Reuse, 2004; Asano et al., 2007). These types of facilities often are financed through regional collaboration and provide treatment for wastewater that is generated by more than one local jurisdiction. However, a system need not be truly multijurisdictional in order to fit the DSS’s meaning of a regional system.
Satellite Treatment In contrast to a regional facility, a satellite treatment facility sits higher up in the wastewater collection system, upstream of a regional wastewater treatment facility. As used in this DSS, a satellite system diverts raw wastewater from a regional collection system, treats it to a level of quality suitable for reuse, conveys the reclaimed water to the point of use, and returns the residual solids to the collection system. Figure 2-2 illustrates a satellite treatment system.

WateReuse Foundation 5
Figure 2-1. Regional treatment system.
Figure 2-2. Satellite treatment system.
Regional Wastewater Treatment and
Reclamation Facility
Sludge Disposal
Collection
Reclaimed Water To
Reuse Sites
Effluent Discharge
Sludge
Collection Regional
Wastewater Treatment
Facility
Diversion of Influent
Reclaimed Water To
Reuse Sites
Effluent
Satellite Water Reclamation
Facility

6 WateReuse Foundation
2.3 INTENDED PLANNING APPLICATIONS The DSS has been designed to assist agencies in considering whether to develop and distribute a new increment of reclaimed water at a new satellite treatment plant or at a regional treatment plant. It is well suited to planning problems such as:
• Would it be better to supply reclaimed water for a given set of end uses from plant X or plant Y?
• Should reuse program A or B be a higher priority for development?
Portions of the DSS can also be used for considering specific aspects of potential reuse programs (e.g., treatment or distribution) or for general alternative comparison. With iteration, the DSS could also be used to compare composite alternatives or to make multiple pairs of comparisons. In all cases, however, the user must understand the limitations of the tool and the assumptions that were used in its development in order to avoid drawing incorrect or inappropriate conclusions.
2.4 DATA REQUIREMENTS In order to effectively utilize the cost-estimating portion of this tool, DSS users must have a basic understanding of the satellite and regional treatment alternatives they wish to compare. For the satellite treatment plant, the user should know the desired treatment capacity, approximate location, available land area, and elevation in relation to the nearest wastewater interceptor. For the regional facility, the user must be aware of the existing treatment capacity in relation to projected inflows in order to indicate whether expansion is necessary.
The types of end uses for the new reclaimed water must be known, as well as one or more sets of potential end users or customers and their water demands. (A recharge or land application site would be considered a customer in the DSS.) A schematic or conceptual layout of the proposed reclaimed water distribution system is needed to determine which customers will receive water via which delivery node. Distances from the treatment facility to the nodes and from the nodes to the customers will need to be entered by the user. The user must also indicate the approximate elevation change between the treatment facility and the customers who are served through each node.
2.5 MAJOR ASSUMPTIONS AND LIMITATIONS The potential scenarios that could be encountered in evaluating the relative merits of a satellite reclamation system and those of a regional system are practically endless. In order to develop a functional DSS that applies engineering analysis to defined treatment and conveyance options and do so within a limited budget, it was necessary to restrict the potential variations to a manageable number by making several assumptions. This section of the chapter identifies the major assumptions and limitations of the DSS. Beyond what is communicated in this overview of the DSS, Chapter 4 details additional assumptions that were used to define, size, and develop costs for the treatment and distribution systems represented in the DSS. The following fundamental assumptions were made during the development of the DSS:
• The reuse infrastructure evaluated by the tool will be new equipment and facilities. • Wastewater to be reclaimed is predominantly municipal.
WateReuse Foundation 7
• The satellite treatment plant will be located near a sewer interceptor, and residuals can be returned to the interceptor for downstream processing at a regional facility.
• If a regional wastewater treatment facility is expanding its hydraulic capacity, the expansion will include a new treatment train to produce the new increment of reclaimed water.
• If an existing regional wastewater treatment facility does not need expansion, additional treatment of effluent will be necessary to produce the new increment of reclaimed water.
The user also should be aware of other fundamental limitations of the DSS. These relate to treatment, distribution, and cost estimation.
Treatment Analysis The DSS was designed to address relatively small systems. The average daily flow into the satellite treatment plant or the new treatment processes at the regional plant that the DSS can accept ranges from 0.5 to 20 million gallons per day (mgd).
The DSS addresses two types of reuse: direct reuse and indirect reuse via groundwater recharge. No distinction is made between different types of direct reuse (e.g., open access irrigation versus industrial cooling) or different techniques for recharge (groundwater spreading versus aquifer injection).
Reuse water quality criteria are based on the most stringent Arizona (class A+) and California (disinfected tertiary) criteria described in Chapter 4.2.
In utilizing broad categories of reuse and selecting these sets of water quality criteria, an attempt was made to balance the desire for broad applicability with the need to restrict the sets of criteria used to size and estimate costs for treatment processes.
Arizona and California are two of the most active water reuse states, where substantial planning and development of additional reclaimed water supplies are expected in the future. By selecting these two states’ most stringent criteria, one accommodates a broad array of potential end uses and treatment requirements. For example, California’s disinfected tertiary recycled water quality criteria govern a wide range of potential uses where the principal treatment requirements are turbidity reduction and coliform removal.
In addition, particular aspects of Arizona’s and California’s regulations further broaden their potential applicability where enhanced treatment is required. Specifically, Arizona’s A+ criteria require not only turbidity reduction and coliform removal but also nitrogen removal. If one is injecting into an aquifer, California statutes set rigorous total organic carbon (TOC) limits and require frequent sampling if reverse osmosis (RO) is not used (CDPH, 2008). Because the recharge method (surface or injection), TOC levels, and blending and dilution plans will vary from scenario to scenario, it was assumed that all California recharge would require additional TOC removal via RO.
Consequently, a relatively broad range of potential end uses and types of treatment requirements can be accommodated by the various combinations of state and end use options offered by the DSS. However, the DSS does not allow the user to tailor the treatment processes to highly specific end uses, to select less than the most stringent water quality
8 WateReuse Foundation
criteria classes in California and Arizona, or to select water quality criteria specific to other states.
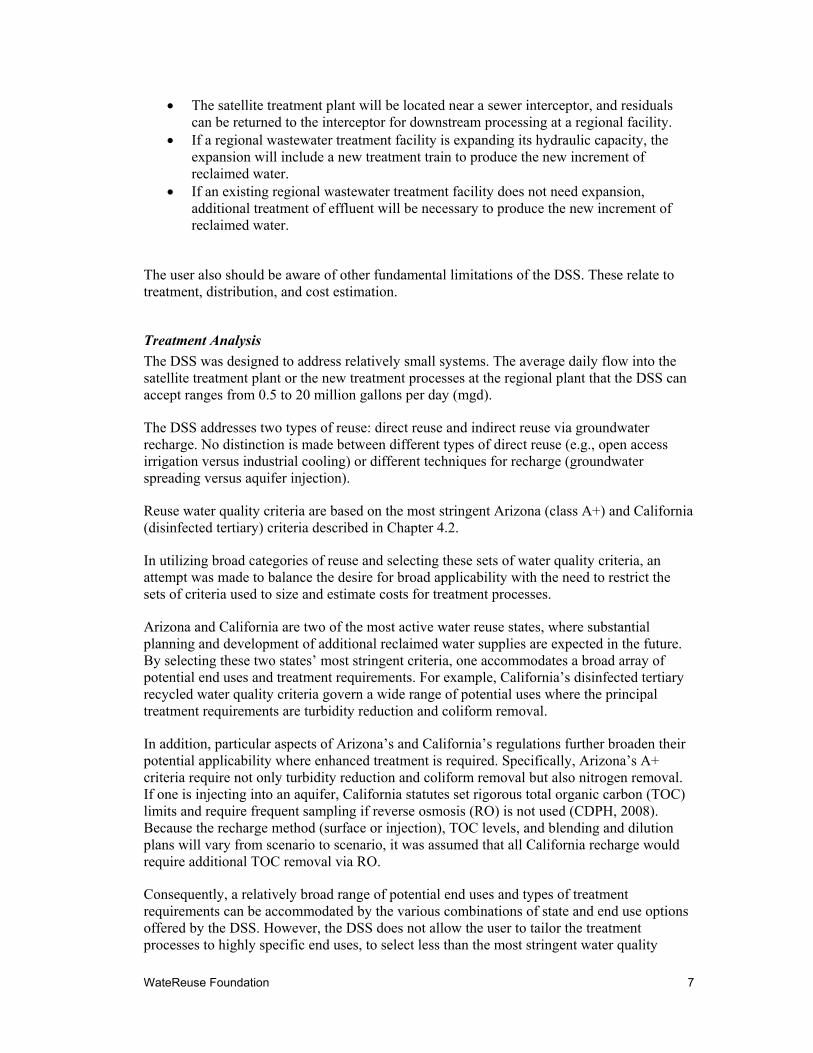
Distribution System Reclaimed water distribution systems are addressed by the DSS in a simplified manner. In the DSS’s conceptual distribution model, illustrated in Figure 2-3, transmission lines radiate from the treatment plant to a set of nodes defined by the DSS user. In turn, distribution lines radiate from each node to a set of customers (i.e., end users of reclaimed water) that is also defined by the DSS user. All customers served by the same node are assumed to be equally equidistant from the node, at the same elevation, with equal water demands.
Figure 2-3. Conceptual reclaimed water distribution system.
Cost Estimation The DSS provides cost estimates to enable comparisons of relative cost between the alternatives. Costs produced by the DSS should not be taken to represent accurate estimates of probable construction or operational costs.
Some costs associated with wastewater treatment facilities are not represented in the estimated costs of alternatives. These include
• Processing, treatment, and disposal of removed solids • Disposal of concentrate from RO treatment • Noise and odor control • Land acquisition

WateReuse Foundation 9
The DSS does not address costs for expansion of the existing wastewater collection system. In addition, the only effluent disposal costs that are addressed by the DSS are those achieved through the reclaimed water distribution system. However, the matrix on the Decision Criteria page allows the DSS user to factor both additional costs and avoided costs into the evaluation.
The level of expected accuracy of the costs calculated by the DSS corresponds to Class 4 estimates as defined by the Association for the Advancement of Cost Engineering (AACE) International. This level of engineering cost estimating is approximate and generally made without detailed engineering data and site layouts, but is appropriate for preliminary budget-level estimating. The accuracy range of a Class 4 estimate is −15 to +20% in the best case and −30 to +50% in the worst case (AACE, 2005).


WateReuse Foundation 11
CHAPTER 3
OPERATING INSTRUCTIONS FOR DSS
The DSS consists of a single Microsoft Excel file containing input fields, calculations, and decision criteria that aid in the evaluation and comparison of satellite and regional reuse alternatives.
The five pages of the DSS are designed to be used sequentially. Understanding the function of each page and relationship of the data among the pages will aid in using the tool effectively. Instructions for using each page are provided below. To assist the user with the tool, a completed example has been provided in Appendix A.
3.1 GETTING STARTED To begin, open the file “WateReuse Foundation DSS.xls.”
To use the Decision Support Tool, you must enable macros in Excel. If you encounter the message shown in Figure 3-1, please select “Enable Macros.”
Figure 3-1. Prompt for enabling macros.
Macro security must be set to Medium or lower to use the DSS.
Refer to the following page for instructions on changing the macro security level:
http://office.microsoft.com/en-us/help/HA010429521033.aspx (Cornell, 2008)
For more information about macro security, refer to this page:
http://office.microsoft.com/en-us/ork2003/HA011403071033.aspx (Microsoft, 2008)

12 WateReuse Foundation
For general help using Microsoft Excel, press F1 or use the Microsoft Office Online Help system.
3.2 INTRODUCTION Once the Excel file is open, you should see the Introduction page (Figure 3-2).
Figure 3-2. Introduction page.
The Introduction (Intro) page provides a concise statement of purpose and data requirements. A more detailed explanation of the tool and its underlying functionality is provided elsewhere in the User’s Manual.
The header rows at the top of each page indicate the user’s location in the tool. The second row, which is orange, indicates the page title. The third row, shown below in Figure 3-3, indicates the user’s progress through the pages by underlining the current page.
Figure 3-3. Progress bar.
Navigation between pages is facilitated by the orange ovals at the top of each page. To begin using the tool, click the orange button shown below in Figure 3-4.
WateReuse Foundation 13
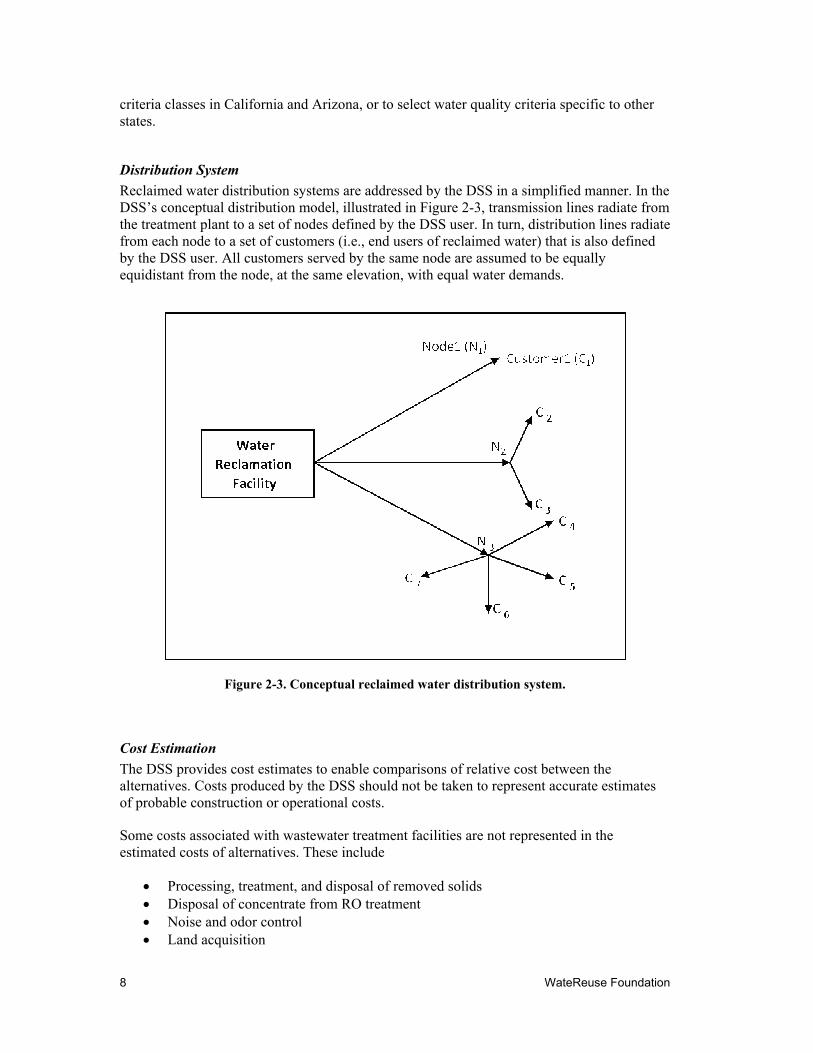
Figure 3-4. Navigation button.
3.3 UTILITY INFORMATION AND ECONOMIC DATA The Information page allows the user to edit global factors used in the cost calculation to adapt the tool to a specific scenario. It is assumed that these factors are applicable to both satellite and regional facilities alike. Refer to Chapter 4 of this manual for details of these factors.
The user can change the values of the factors in the yellow column at any time. (See Figure 3-5.) Calculations that reference this page are automatically updated.
Figure 3-5. Utility Information and Economic Data page.

14 WateReuse Foundation
To return these variables to their default values, click the “Reset Default Values” button (Figure 3-6).
Figure 3-6. Button restores default values.
The Information page contains two features that also are used on subsequent pages: the Dashboard and Zoom Control.
Dashboard The Dashboard indicates the status of the input screens whether or not the minimum information has been entered on each. When the Information page is first loaded or when the user has pressed the “Reset Default Value” button, the Utility Input status is marked “Complete.” Only when the user has altered and cleared one of the yellow input fields on the Information page does the Dashboard Utility Input indicate “Incomplete.”
Zoom Control The Zoom control (Figure 3-7) adjusts the magnification of the numbers and text on the screen.
Figure 3-7. Zoom control bar.
Appearing on the Information page and all subsequent screens, it provides the three commands for changing the size of the screen (increasing the zoom ratio, decreasing the zoom ratio, and resetting the zoom ratio for optimal viewing).
3.4 SATELLITE FACILITY CONFIGURATION AND COST ESTIMATE The Satellite page is used to define a satellite treatment facility and distribution system. (See Figure 3-8.) To help analyze cost ranges, treatment options, and the overall satellite alternative, certain minimum inputs are required. All inputs can be cleared by using the “Reset Satellite Facility” button.

WateReuse Foundation 15
Figure 3-8. Satellite page.
Mandatory Satellite Inputs End Use – Using the dropdown menu shown in Figure 3-9, select the quality of the reuse water to be produced based on one of four standards (Arizona/California - Recharge/Reuse). Arizona recharge and direct use assume water will be treated to class A+ standards. California recharge and direct use assume water will be disinfected tertiary quality. Refer to Chapter 4.2 for a summary of the water quality standards.
Figure 3-9. Selection of water quality criteria (end use, state).

16 WateReuse Foundation
Treatment Capacity – Select one of the capacities available, from 0.5 to 20 mgd.
Figure 3-10. Treatment capacity selection.
Available Land – Enter the amount of land available to build a satellite plant in acres. This entry is required but does not necessarily affect results. It cues the user to compare available land to land requirements in the Process Selection portion of the page.
Process Selection – After the first three mandatory inputs are entered, the Process Selection section of the page is populated with land usage and cost information (capital, operation and maintenance [O&M], and life cycle costs) for the treatment plant. The calculated values are displayed faintly until a secondary treatment process is selected. Three available technologies are presented as choices:
• Ox – oxidation ditch • SBR – sequencing batch reactor • MBR – membrane bioreactor
Choose one of these technologies by clicking the corresponding radio button in the “Select” box (Figure 3-11). The selected technology then becomes highlighted in light blue, along with one or more of the following post-secondary treatment processes:
• Filt – filtration • Dis – disinfection • MF – microfiltration or ultrafiltration (UF) • RO
The additional treatment processes displayed vary with the type of end use that was selected.

WateReuse Foundation 17
Figure 3-11. Process selection portion of Satellite page.
Once a treatment train is selected, the land required and associated costs also are highlighted. The costs of the selected processes are included in the total costs shown at the bottom of the process selection box, graphically displayed on the page, and carried forward to the Decision page.
Once a treatment technology (Ox/SBR/MBR) is selected, the “Load Passed on to Regional Facility” box displays the calculated loads of the solids and any RO concentrate returned to the collection system from the satellite plant (Figure 3-12).
Figure 3-12. Loads returned by the satellite reclamation plant.
Once a selection is made, the Dashboard for Satellite is marked “Complete.” Nevertheless, for most scenarios, the Influent/Solids and Distribution sections of the page also should be filled out to correctly compare a satellite system with a regional system.
Influent and Solid Return Lines This section of the Satellite page is used to specify the pipelines that convey the raw wastewater from the sewer system to the treatment plant and the return flows back to the regional sewer system. See Figure 3-13. Once the elevation differential and distance from the satellite treatment plant have been entered, the costs of the pipelines and associated pumping are added to the totals at the bottom of the Process Selection table.

18 WateReuse Foundation
Figure 3-13. Conveyance between the satellite plant and the regional sewer system.
Distribution System The Distribution System table (Figure 3-14) allows a simplified distribution system to be created by adding nodes that define branches of a delivery network.
Figure 3-14. Distribution system table.
A node receives reclaimed water from the treatment plant and supplies one or more customers at the same elevation with similar flows (Figure 3-15).
Figure 3-15. Distribution system branches are characterized by their nodes.
Nodes can be added or removed from the table by using the Add/Delete Distribution Node buttons (Figure 3-16).
Plant
CustomerCustomerCustomer
Node 1 Branch
Node 2 BranchCustomer

WateReuse Foundation 19
Figure 3-16. Buttons for adding or deleting nodes with their branches.
To fully define a node and its branch, the following data must be entered (Figure 3-14):
• Average flow • Gross elevation change between plant and customers • Minimum customer pressure • Number of customers • Distance from plant to node • Average distance from node to customers
Once a node has been added and its branch defined, the branch’s costs are added to the total distribution costs in the Process Selection table. The Calculated Values box for each node displays the calculated pipeline diameters and pumping capacity that were used to estimate costs.
Information about the reclaimed water available from the treatment plant and the capacity of the distribution system is displayed above the distribution table (Figure 3-17). The “Reclaimed Water Available” value reflects the production capacity of the reclamation plant, which depends on the plant’s influent capacity and the treatment processes previously selected. Any difference between production and distribution capacities is indicated in the orange area above the Distribution System table.
Figure 3-17. Reclaimed water production is compared to distribution capacity.

20 WateReuse Foundation
Cost Charts As data are entered on the Satellite Facility page, estimated costs are displayed in the last three columns of the Process Selection table (Figure 3-18).
Figure 3-18. Display of estimated costs.
Three corresponding charts, showing estimated capital, O&M, and life cycle (present worth) costs, are provided to help analyze the cost components of the satellite treatment alternative (Figure 3-19). The charts update dynamically as data are entered or modified.
Figure 3-19. Satellite alternative cost charts.

WateReuse Foundation 21
3.5 REGIONAL FACILITY CONFIGURATION AND COST ESTIMATE The Regional Facility Configuration and Cost Estimate page is used to describe a regional treatment and distribution alternative (Figure 3-20). The dashboard, reset button, distribution system section, and cost charts function the same as on the Satellite page.
The minimum inputs necessary to generate cost ranges are dependent on the regional treatment scenario and on how reclamation would be accomplished at the regional facility.
Regional Scenario Definition Two options relating to end use and treatment capacity determine how the regional treatment facility will be defined in relation to the satellite facility.
Figure 3-20. Regional alternative page.
22 WateReuse Foundation
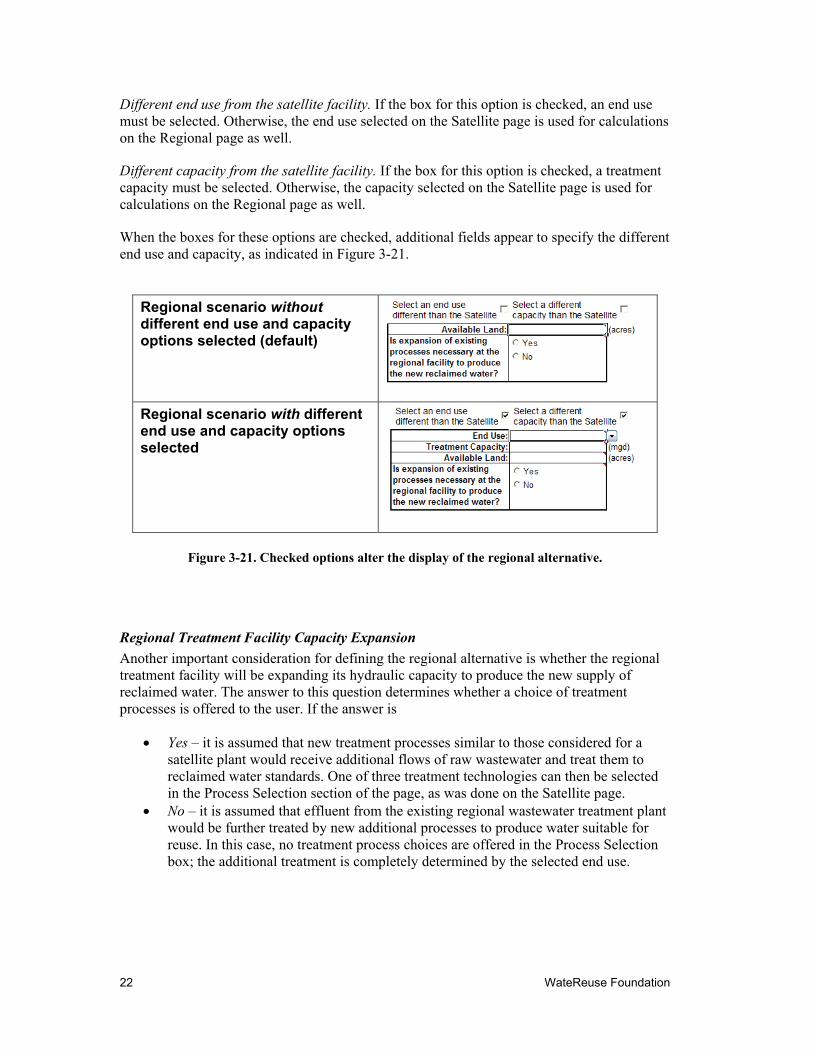
Different end use from the satellite facility. If the box for this option is checked, an end use must be selected. Otherwise, the end use selected on the Satellite page is used for calculations on the Regional page as well.
Different capacity from the satellite facility. If the box for this option is checked, a treatment capacity must be selected. Otherwise, the capacity selected on the Satellite page is used for calculations on the Regional page as well.
When the boxes for these options are checked, additional fields appear to specify the different end use and capacity, as indicated in Figure 3-21.
Regional scenario without different end use and capacity options selected (default)
Regional scenario with different end use and capacity options selected
Figure 3-21. Checked options alter the display of the regional alternative.
Regional Treatment Facility Capacity Expansion Another important consideration for defining the regional alternative is whether the regional treatment facility will be expanding its hydraulic capacity to produce the new supply of reclaimed water. The answer to this question determines whether a choice of treatment processes is offered to the user. If the answer is
• Yes – it is assumed that new treatment processes similar to those considered for a satellite plant would receive additional flows of raw wastewater and treat them to reclaimed water standards. One of three treatment technologies can then be selected in the Process Selection section of the page, as was done on the Satellite page.
• No – it is assumed that effluent from the existing regional wastewater treatment plant would be further treated by new additional processes to produce water suitable for reuse. In this case, no treatment process choices are offered in the Process Selection box; the additional treatment is completely determined by the selected end use.

WateReuse Foundation 23
3.6 DECISION CRITERIA AND RECOMMENDATION The Decision Criteria and Recommendation page (Figure 3-22) has two primary functions:
• Compare satellite and regional treatment costs by using the Level 4 Cost Ranges chart.
• Create a weighted decision matrix.
Figure 3-22. Decision Criteria and Recommendation page.
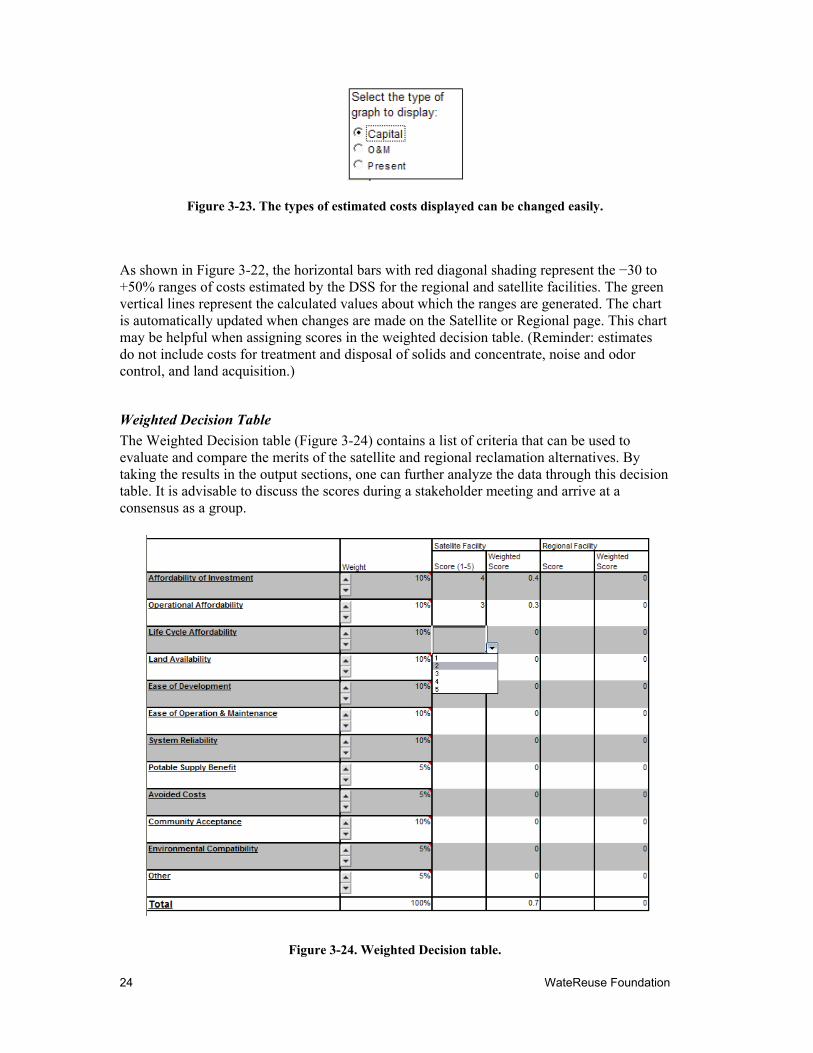
Level 4 Cost Ranges Chart The “Level 4 Cost Ranges” chart at the top of the page can display estimated capital, O&M, or life cycle (present worth) costs. In the box on the right side of the page, click the radio button next to the types of cost that you wish to view (Figure 3-23). The display updates automatically when a different cost type is selected.
24 WateReuse Foundation
Figure 3-23. The types of estimated costs displayed can be changed easily.
As shown in Figure 3-22, the horizontal bars with red diagonal shading represent the −30 to +50% ranges of costs estimated by the DSS for the regional and satellite facilities. The green vertical lines represent the calculated values about which the ranges are generated. The chart is automatically updated when changes are made on the Satellite or Regional page. This chart may be helpful when assigning scores in the weighted decision table. (Reminder: estimates do not include costs for treatment and disposal of solids and concentrate, noise and odor control, and land acquisition.)
Weighted Decision Table The Weighted Decision table (Figure 3-24) contains a list of criteria that can be used to evaluate and compare the merits of the satellite and regional reclamation alternatives. By taking the results in the output sections, one can further analyze the data through this decision table. It is advisable to discuss the scores during a stakeholder meeting and arrive at a consensus as a group.
Figure 3-24. Weighted Decision table.

WateReuse Foundation 25
The intended meaning of each criterion is described within the DSS itself (Figure 3-25). Based on the user’s interpretation of the descriptions, he/she will assign a weight to each criterion. As a default, all criteria have been assigned a weight of 10%. Weights must be assigned in increments of 5% and can be entered into the cell directly or scaled up and down using the arrow buttons on each row. If the weights do not add up to 100%, a warning appears at the top of the table. The user must adjust the default weights to make the warning message disappear.
In addition to assigning a weight to each criterion, the user must also assign a score to both alternatives for all criteria. Scores must be between 1 and 5 and can be entered directly or selected from a dropdown box. A favorable score of 5 indicates that an alternative is extremely favorable, economical, or simple. A score of 1 is assigned to alternatives that are unfavorable, expensive, or institutionally or operationally complex. Because these scores represent quantitative values determined from qualitative descriptions, they will vary from evaluation to evaluation. General descriptions of high (5) and low (1) scores have been provided in the criterion descriptions within the tool itself.
Figure 3-25. Decision criterion descriptions.
Affordability of Investment - the af fordability of the capital investment that would be required to implement the alternative. An alternative with low capital cost would be scored higher than an alternative with high capital cost. The DSS user may wish to consider potential ef fects on sources of repayment (e.g. impact fees, capacity charges, user rates).
Operational Affordability - the af fordability of operating and maintaining the alternative. An alternative with low operation and maintenance (O&M) cost would be scored higher than an alternative with high O&M cost. Potential ef fects on sources of cost recovery (e.g. wastewater rates, reclaimed water rates) may factor into scoring.
Life Cycle Affordability - the af fordability of the total cost to develop and sustain the operation of the alternative over a period of 20 years (i.e. present worth of life cycle costs). An alternative with low life cycle cost would be scored higher than an alternative with high life cycle cost. Potential ef fects on sources for recovering both capital and operating costs (e.g. impact fees / capacity charges, wastewater rates, reclaimed water rates) may factor into scoring.
Land Availability – the availability of land required for treatment and on-site plant storage facilities construction. An alternative requiring a substantial amount of new land in a highly developed area would score lower than an alternative that would make use of land and rights-of -way already owned by the implementing agency.
Ease of Development – the ease with which the alternative could be planned, designed, authorized, permitted, and constructed, including execution and implementation of necessary agreements. An alternative requiring few external approvals, support, oragreements with willing sellers of land and easements would score higher than an alternative with great institutional complexity, permitting challenges, and potential for legal action.
Ease of Operation & Maintenance - the ease of operating and maintaining the alternative. An alternative whose operations would be mostly automated would score higher than one requiring a large number of on-site operations personnel to manage a highly complexsystem. The relative number of operations and maintenance personnel required and the degree of aptitude and training required by them may be factors in scoring.
System Reliability - the expected consistency with which reclaimed water quality requirements would be met. An alternative whose product water is expected to easily meet regulatory criteria and customer expectations would score higher than one where there is a narrow margin between the treatment technology’s capabilities and the regulatory requirement and whose users require relatively high product quality with little tolerance for variability. The size of the reclaimed distribution system and the potential for quality degradation during distribution may factor into scoring.
Potable Supply Benefit – the benef it to water supply reliability of the alternative. An alternative that displaces a larger potable water demand, particularly at times of peak demand, would score higher than one that displaces little potable demand. In cases where the alternatives would serve dif ferent sets of customers, scoring may be inf luenced by any dif ferences in the degree to which existing water sources are constrained or by dif ferences in timing or variability of demand.
Avoided Costs – the magnitude of avoided inf rastructure investments that would otherwise be required if the alternative were not implemented. This could represent the cost of avoided expansion of a wastewater interceptor, pumping station, treatment plant or outfall. It might also represent the cost of an avoided treatment process upgrade to achieve a discharge requirement, or the avoided cost of developing a new increment of potable water supply.
Community Acceptance – the extent to which the alternative would be expected to receive support or acceptance by the af fected community. An alternative would be expected to score high where construction occurs in a sparsely populated area, above ground facilities are shielded f rom view or blend in with the surrounding neighborhood, rate impacts are modest, and consistent outreach has educated the community about the reasons for developing reclaimed water.
Environmental Compatibility – the degree to which the alternative could be implemented without signif icant unmitigated environmental impacts to the natural and human environment. An alternative whose facilities would be constructed in a sensitivenatural area providing habitat for rare species would be expected to score lower than an alternative where construction would occur in an already disturbed area with few natural values and where traf f ic, noise, odor, and air quality impacts would be mitigated.
Other – user def ined criteria not included above but important for comparing alternatives.
26 WateReuse Foundation
After one assigns weights and scores, the weight assigned to each criterion is multiplied by the score for each alternative to calculate its weighted score. The weighted scores are summed to determine a total weighted score for each of the two alternatives. The alternative with the highest score is the “preferred alternative.” After the preferred alternative has been selected, the user may wish to revisit the weights and scores that may have been questionable. A sensitivity analysis can be performed to determine if changing the weights and scores changes the overall outcome of the assessment.
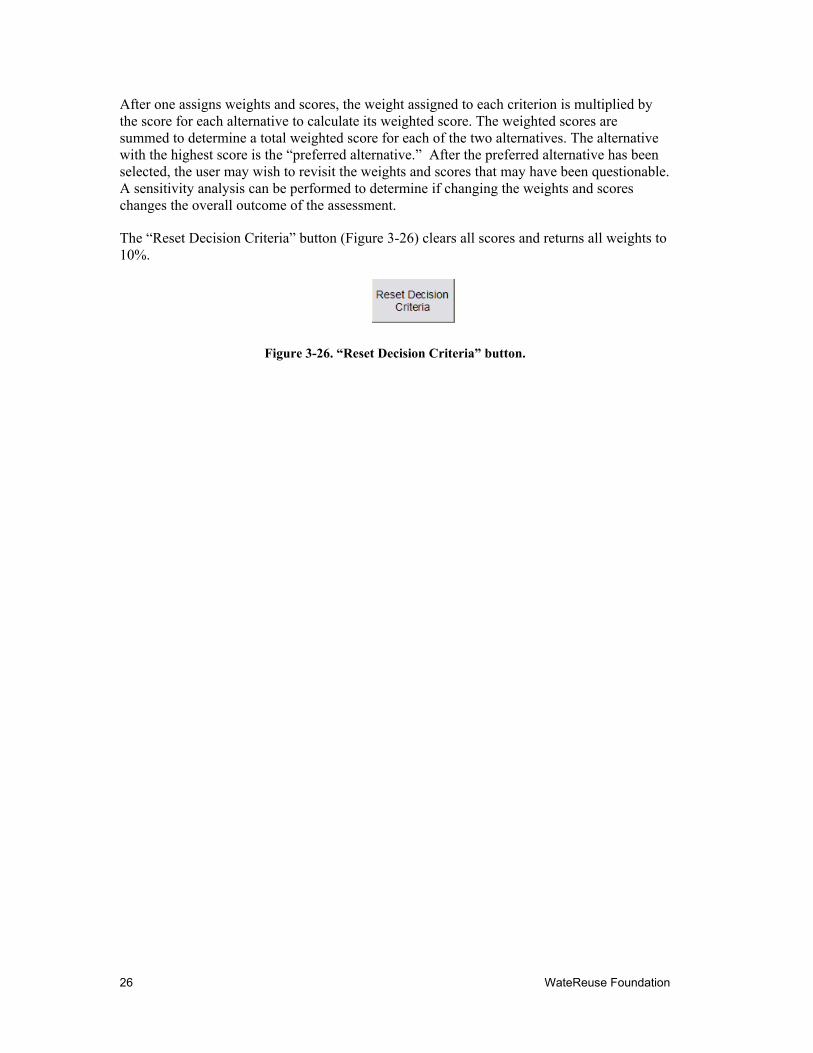
The “Reset Decision Criteria” button (Figure 3-26) clears all scores and returns all weights to 10%.
Figure 3-26. “Reset Decision Criteria” button.

WateReuse Foundation 27
CHAPTER 4
BASES OF DESIGNS AND COSTS FOR REUSE FACILITIES
This chapter discusses design criteria, assumptions, and the basis of cost for the facilities represented in the DSS.
4.1 SUMMARY OF COST ESTIMATION ASSUMPTIONS The cost estimates presented in the tool are based on available existing studies, recent projects with similar components, manufacturers’ budget estimates, standard construction cost-estimating manuals, and engineering judgment.
Some fundamental points about the cost estimates were previously mentioned in Chapter 2 (DSS Overview), but they are important enough to be repeated here along with additional details. The DSS presents costs only for purposes of comparing the satellite and regional alternatives. Costs produced by the DSS should not be taken to represent accurate estimates of probable construction or operational costs. The estimates exclude certain types of costs associated with wastewater treatment facilities. Costs for land acquisition, noise and odor control, concentrate and solid disposal are not included for either alternative, although the DSS does estimate the physical loads from the solids and concentrate that are returned to the regional collection system by the satellite plant for downstream processing. Costs do not take into account the location of construction, but users can adjust some default values provided by the tool to better reflect their geographical location, market, or regulatory or site conditions.
The level of accuracy for the cost estimates corresponds to a Class 4 estimate as defined by AACE. This level of engineering cost estimation is approximate and generally developed without detailed engineering data and site layouts but is appropriate for preliminary budget-level estimating. The accuracy range of a Class 4 estimate is −15 to +20% in the best case and −30 to +50% in the worst case (AACE, 2005).
All costs were originally estimated at December 2006 price levels, referenced to an Engineering News and Record Construction Cost Index (ENR CCI) value of 7888 (Engineering News Record, 2008). Estimated facility costs include a 20% factor for engineering and administration and a 30% scope-of-project contingency. The total present worth cost is a combination of capital costs and O&M costs. Present worth costs were calculated over a 20-year equipment life expectancy with a default discount rate of 8.0% (Appendix B).
4.2 WATER RECLAMATION FACILITIES This section summarizes the process selection criteria and sizing assumptions used to define, size, and cost wastewater treatment process facilities represented in the DSS. It addresses only liquid stream treatment of municipal wastewater.

28 WateReuse Foundation
Influent Flows and Water Quality Wastewater treatment process units were sized for the seven average daily flow scenarios listed in Table 4-1. In order to account for diurnal variations, peak hourly flow estimates were generated by applying industry standard peaking factors to the average daily flow rates. Wastewater treatment processes were sized to treat the average daily flows while accommodating peak hourly flows.
Table 4-1. Influent flow peaking relationships1
Avg Daily Flow (mgd) Peak Hourly Flow (mgd) Peaking Factor
0.5 1.95 3.9
1 3.6 3.6
2 6.6 3.3
5 15 3
10 27 2.7
15 37.5 2.5
20 48 2.4 1 Peaking factors based on Figure 5-1, “Hourly Peaking Factor for Domestic Wastewater Flowrates,” in Tchobanoglous, 1991.
Table 4-2 provides the assumed water quality of the satellite facility influent and the existing regional facility effluent, used to develop the process unit sizing. The tool assumes the regional facility already provides secondary treatment and disinfection and requires only the addition of filtration prior to disinfection to accommodate direct reuse. For Arizona end uses, the secondary treatment process also includes nitrogen removal. In cases where the regional treatment plant’s hydraulic capacity requires expansion, it is assumed that the new increment of reclaimed water will be produced through new side stream treatment process units.
WateReuse Foundation 29
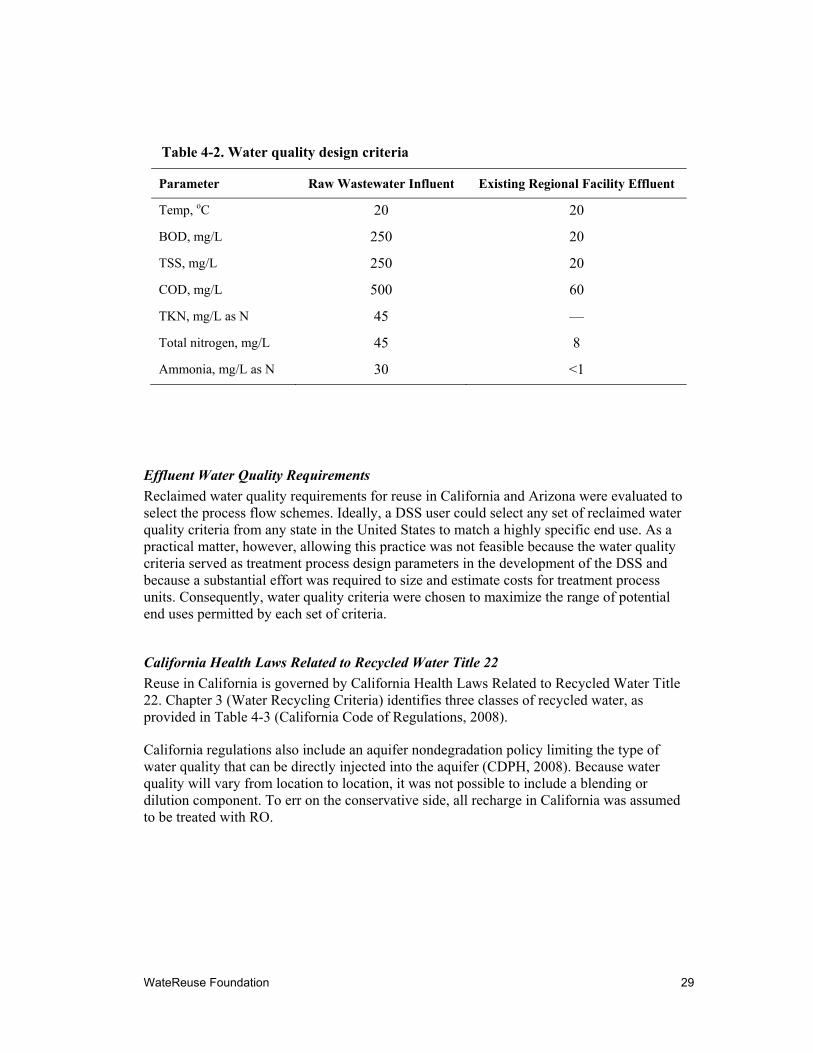
Table 4-2. Water quality design criteria
Parameter Raw Wastewater Influent Existing Regional Facility Effluent
Temp, oC 20 20
BOD, mg/L 250 20
TSS, mg/L 250 20
COD, mg/L 500 60
TKN, mg/L as N 45 —
Total nitrogen, mg/L 45 8
Ammonia, mg/L as N 30 <1
Effluent Water Quality Requirements Reclaimed water quality requirements for reuse in California and Arizona were evaluated to select the process flow schemes. Ideally, a DSS user could select any set of reclaimed water quality criteria from any state in the United States to match a highly specific end use. As a practical matter, however, allowing this practice was not feasible because the water quality criteria served as treatment process design parameters in the development of the DSS and because a substantial effort was required to size and estimate costs for treatment process units. Consequently, water quality criteria were chosen to maximize the range of potential end uses permitted by each set of criteria.
California Health Laws Related to Recycled Water Title 22 Reuse in California is governed by California Health Laws Related to Recycled Water Title 22. Chapter 3 (Water Recycling Criteria) identifies three classes of recycled water, as provided in Table 4-3 (California Code of Regulations, 2008).
California regulations also include an aquifer nondegradation policy limiting the type of water quality that can be directly injected into the aquifer (CDPH, 2008). Because water quality will vary from location to location, it was not possible to include a blending or dilution component. To err on the conservative side, all recharge in California was assumed to be treated with RO.
30 WateReuse Foundation
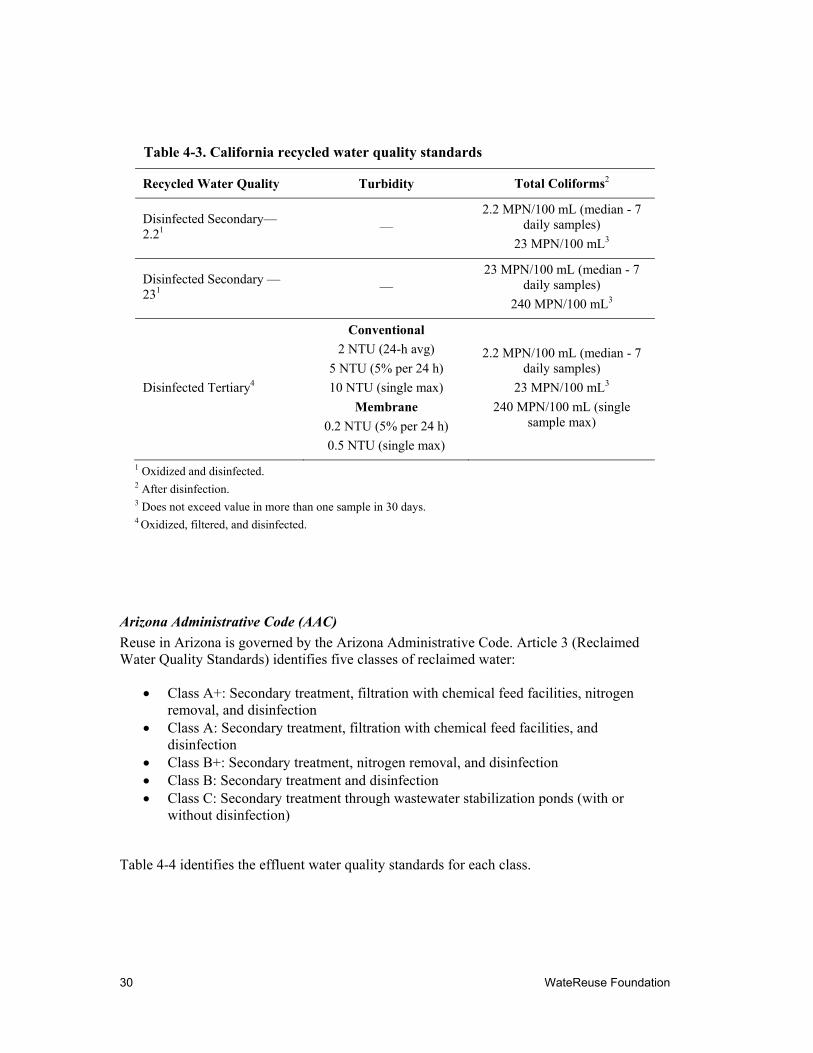
Table 4-3. California recycled water quality standards
Recycled Water Quality Turbidity Total Coliforms2
Disinfected Secondary—2.21 —
2.2 MPN/100 mL (median - 7 daily samples)
23 MPN/100 mL3
Disinfected Secondary —231 —
23 MPN/100 mL (median - 7 daily samples)
240 MPN/100 mL3
Disinfected Tertiary4
Conventional 2 NTU (24-h avg)
5 NTU (5% per 24 h) 10 NTU (single max)
Membrane 0.2 NTU (5% per 24 h) 0.5 NTU (single max)
2.2 MPN/100 mL (median - 7 daily samples)
23 MPN/100 mL3 240 MPN/100 mL (single
sample max)
1 Oxidized and disinfected. 2 After disinfection. 3 Does not exceed value in more than one sample in 30 days. 4 Oxidized, filtered, and disinfected.
Arizona Administrative Code (AAC) Reuse in Arizona is governed by the Arizona Administrative Code. Article 3 (Reclaimed Water Quality Standards) identifies five classes of reclaimed water:
• Class A+: Secondary treatment, filtration with chemical feed facilities, nitrogen removal, and disinfection
• Class A: Secondary treatment, filtration with chemical feed facilities, and disinfection
• Class B+: Secondary treatment, nitrogen removal, and disinfection • Class B: Secondary treatment and disinfection • Class C: Secondary treatment through wastewater stabilization ponds (with or
without disinfection)
Table 4-4 identifies the effluent water quality standards for each class.

WateReuse Foundation 31
Table 4-4. Arizona reclaimed water quality standards
Reclaimed Water
Quality Category Turbidity1 Fecal Coliforms2
Total Nitrogen3
Class A+ 2 NTU (24-h avg)
5 NTU (single max) Nondetect (4 of 7 daily samples)
<23/100 mL (single sample) <10 mg/L as N
Class A 2 NTU (24-h avg)
5 NTU (single max) Nondetect (4 of 7 daily samples)
<23/100 mL (single sample) —
Class B+ — <200/100 mL (4 of 7 daily samples)
<800/100 mL (single sample) <10 mg/L as N
Class B — <200/100 mL (4 of 7 daily samples)
<800/100 mL (single sample) —
Class C — <1000/100 mL (4 of 7 daily samples)
<4000/100 mL (single sample) —
1 After filtration. 2 After disinfection. 3 Five-sample geometric mean; alert level is 8 mg/L as N.
The classes identified for direct reuse of reclaimed water are Classes A, B, and C (Table 4-4, Arizona Administrative Code R18-11-309). Although nitrogen removal (Classes A+ and B+) is not required for any type of currently identified direct reuse, it is required for the Aquifer Protection Permit (APP) for discharges influencing an aquifer.
To maximize the allowable uses of the reclaimed water that would be produced, the most stringent classification in each state’s regulations was used as the basis for process unit sizing. This resulted in two wastewater treatment scenarios:
• Disinfected Tertiary Recycled Water (California—Reuse End Use) – secondary treatment, filtration with chemical feed facilities and disinfection
• Class A+ Reclaimed Water (Arizona—Recharge and Arizona—Reuse End Use) – secondary treatment with nitrogen removal, filtration with chemical feed facilities, and disinfection
For groundwater recharge in California (California—Recharge End Use), it was further assumed that recycled water had a total-dissolved-solids (TDS) concentration less than 500 mg/L, which would be achieved through RO.

32 WateReuse Foundation
Liquid Stream Treatment—Process Unit Sizing This subsection describes the selected treatment processes and the key assumptions made for sizing criterion development. The following assumptions were made in sizing the process facilities:
• Residuals from satellite facilities will be discharged to the sewer collection system; therefore, no residual-handling facilities have been included. For consistency of analysis, residuals from additional treatment processes at regional plants also were assumed to be handled by existing infrastructure at the regional facility.
• The need to control odor from process facilities will depend on the location of the wastewater treatment plant and its proximity to the community; therefore, no odor control facilities have been included.
• Because the level of redundancy selected for a wastewater treatment plant is based on both client preference and the criticality of equipment, the process unit sizing addresses only the process facilities required to meet effluent quality goals; therefore, no redundancy has been included.
The wastewater treatment strategy required to achieve the proposed effluent water quality goals include preliminary treatment for debris removal, secondary treatment using activated sludge for carbonaceous and/or nitrogen removal, advanced treatment through filtration, and disinfection. All processes must be included in the overall treatment design, though the configurations for the reclamation facility vary slightly based on the secondary treatment process selected. (MBR treatment, for example, combines secondary treatment and advanced treatment in a single process and does not require additional filtration.)
Preliminary Treatment Preliminary treatment facilities provide screening and grit removal from raw influent wastewater to protect downstream treatment processes. Debris removal may be achieved by using mechanically cleaned bar screens, which are categorized as coarse or fine according to the bar opening size. Coarse screens are effective for most conventional secondary treatment processes, though fine screens (2 mm) are required for the membrane process. Grit removal devices allow grit to settle from the influent for subsequent removal, while organic material remains in suspension.
Secondary Treatment Three secondary biological treatment alternatives employing the activated sludge process were included for sizing:
• Ox. Activated sludge technology that employs an elliptical basin. Both carbon removal and nitrogen removal can be achieved by alternating anoxic and aerobic environments. The Ox requires external clarification for the removal of biomass from the treated wastewater. A portion of the solids is recycled back to the Ox as return activated sludge, and the remainder is sent on for ultimate disposal.
• SBR. Activated sludge system that performs influent equalization, biological treatment, and clarification within a single basin by using a fill-and-draw technique for batch operation. Both carbon removal and nitrogen removal can be achieved in a

WateReuse Foundation 33
single reactor by providing alternating anoxic and aerobic cycles. External clarification is not required, and biomass is removed only through wasting, thereby eliminating the need to return activated sludge back to the reactor. Since treated wastewater is rapidly decanted from the basin at the end of each reaction cycle, an equalization basin is required downstream of the SBR to deliver effluent to filtration and disinfection facilities at an acceptable rate.
• MBR. Combines the activated sludge and UF membrane processes within a single bioreactor. Membranes are submersed in an activated sludge basin, and flow is drawn into the membrane under a vacuum, while solids are retained within the tank. The system operates at biomass concentrations significantly higher than those for conventional activated sludge systems, and sludge settleability is less of a concern. Both carbon and nitrogen removal can be achieved in a single reactor by providing separate anoxic and aerobic zones within the basin. The membrane process retains biomass within the reactor to discharge a solid-free effluent, thereby eliminating the need for external filtration and sludge recycle.
Filtration Filtration is designed to remove suspended solids from secondary effluent and produce a high quality effluent. Filtration is required to meet the average turbidity limit of 2 NTU for reuse water applications.
Disinfection Disinfection is designed to destroy microorganisms that generate disease in humans. Disinfection through the addition of sodium hypochlorite is able to achieve the fecal coliform limit of nondetect (four of seven daily samples) and the total coliform limit of 2.2 most probable number (MPN)/100 mL (median—seven daily samples).
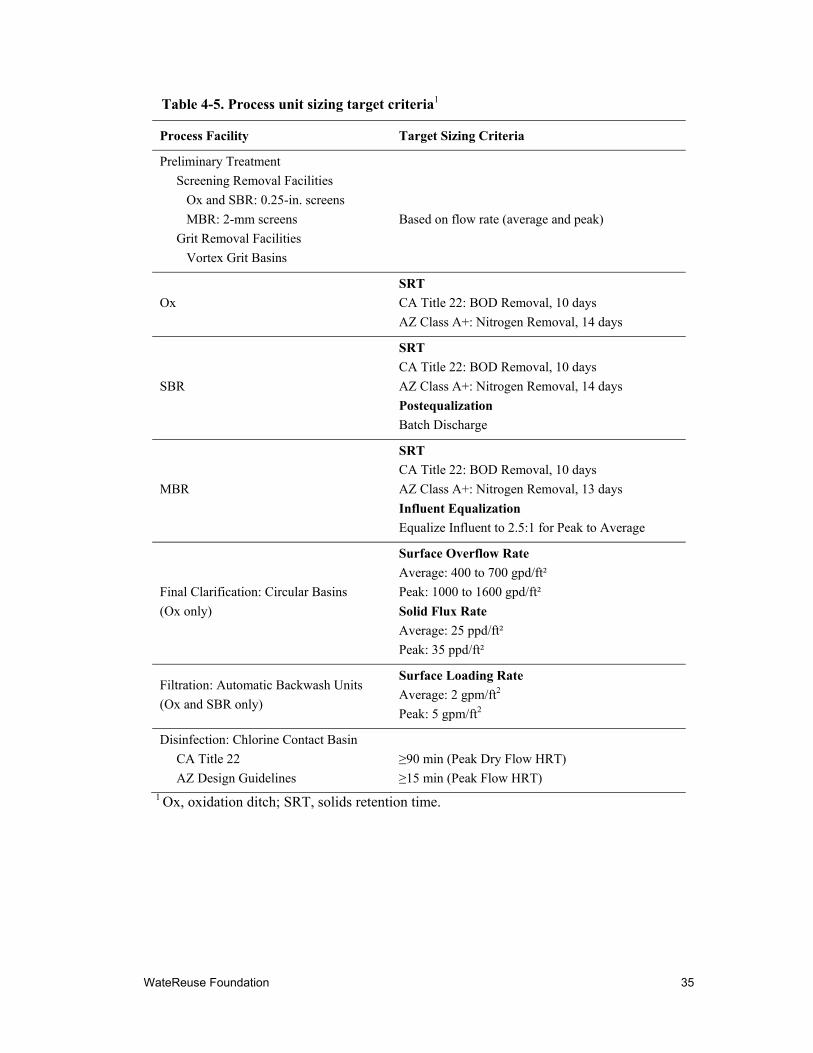
Flow diagrams incorporating Ox’s, sequencing batch reactors, and membrane bioreactors into overall wastewater treatment schemes are provided in Figures 4-1 through 4-3. Table 4-5 provides the target criteria used for sizing the selected process facilities.
Figure 4-1. Ox treatment train.
Preliminary Treatment Clarifier Filtration Disinfection
Return Activated Sludge
Effluent Oxidation DitchInfluent
Solids to Sewer

34 WateReuse Foundation
Figure 4-2. SBR treatment train.
Figure 4-3. MBR treatment train.
Liquid Stream Treatment—Cost Estimates Capital, O&M, and present worth cost estimates were prepared for the following unit components listed below. Ox’s, SBRs, MBRs, and disinfection unit processes were sized based on both California and Arizona requirements, because the differences in design criteria would have led to cost ranges in excess of AACE Level 4 estimates.
Preliminary
Treatment Biological
Treatment +Membrane
Disinfection
Solids to Sewer
Effluent Influent Flow
Equalization(if PF > 2)
PreliminaryTreatment
SequencingBatch
ReactorFiltration Disinfection Effluent
Solids to Sewer
FlowEqualization
Influent
WateReuse Foundation 35
Table 4-5. Process unit sizing target criteria1
Process Facility Target Sizing Criteria
Preliminary Treatment Screening Removal Facilities Ox and SBR: 0.25-in. screens MBR: 2-mm screens Grit Removal Facilities Vortex Grit Basins
Based on flow rate (average and peak)
Ox SRT CA Title 22: BOD Removal, 10 days AZ Class A+: Nitrogen Removal, 14 days
SBR
SRT CA Title 22: BOD Removal, 10 days AZ Class A+: Nitrogen Removal, 14 days Postequalization Batch Discharge
MBR
SRT CA Title 22: BOD Removal, 10 days AZ Class A+: Nitrogen Removal, 13 days Influent Equalization Equalize Influent to 2.5:1 for Peak to Average
Final Clarification: Circular Basins (Ox only)
Surface Overflow Rate Average: 400 to 700 gpd/ft² Peak: 1000 to 1600 gpd/ft² Solid Flux Rate Average: 25 ppd/ft² Peak: 35 ppd/ft²
Filtration: Automatic Backwash Units (Ox and SBR only)
Surface Loading Rate Average: 2 gpm/ft2 Peak: 5 gpm/ft2
Disinfection: Chlorine Contact Basin CA Title 22 AZ Design Guidelines
≥90 min (Peak Dry Flow HRT) ≥15 min (Peak Flow HRT)
1 Ox, oxidation ditch; SRT, solids retention time.

36 WateReuse Foundation
Although cost estimates for the admin/lab/shop building, headworks, and filtration unit will vary slightly depending on the location of the facility and ultimate end use, the degree of variation in the costs was assumed to be within the level of error associated with Level 4 cost estimating. For this reason, average costs were assumed for the following plant facilities and unit processes:
• Administration/Lab/Shop Building • Headworks • Arizona Ox, SBR, and MBR • California Ox, SBR, and MBR • Filtration • Disinfection (Arizona) • Disinfection (California)
Cost estimates for concrete, equipment, and housing were obtained from existing studies, recent projects with similar components, manufacturers’ budget estimates, standard construction cost-estimating manuals, and engineering judgment. These costs were multiplied by scaling factors to account for other construction costs, including excavation and backfill, installation, electricity, instrumentation, contractor overhead and profit, and a scope-of-project contingency. These factors were determined from previous construction projects and may vary depending on the complexity of design. A complete list of the scaling factors is included in Table 4-6. O&M costs were also approximated at 5% of the total construction costs, which is used by some vendors to estimate O&M costs when little to no water quality information is known. This value was similar to calculated O&M costs for the Glendale, Arizona, West Area Water Reclamation Facility (WRF). All approximations were expected to be within the level of accuracy for Class 4 cost opinions.
MF and RO This subsection discusses the basis for sizing and estimating costs for RO and associated pretreatment. Since RO feed water consisting of treated municipal wastewater will subject the RO process to significant solids loading, membrane filtration was included as robust pretreatment for RO. In cases where an MBR is used upstream of RO, however, pretreatment with MF or UF was not prescribed, since membrane filtration is already a fundamental component of the MBR process.
The objective of including RO as an option in the DSS was to provide a means of reducing TDS from approximately 800 mg/L to a goal of below 500 mg/L, representing a salt rejection of 37.5%. The very low salt rejection requirement would typically involve blending a bypass flow with the permeate to allow the size of the RO system to be minimized. The DSS, however, is designed to allow for maximum flexibility in end use applications.
Because of California’s aquifer protection regulations (California Code of Regulations, Title 22), all recharge water was assumed to be treated with RO. Consequently, when the DSS specifies RO is to be used for TDS reduction, all of the flow for each plant capacity analyzed is assumed to pass through RO membranes.

WateReuse Foundation 37
Table 4-6. Unit process cost-estimating factors and algorithm
Capital Cost Factor
Concrete
Excavation and Backfill (10%)
Miscellaneous Metals (4%)
Yard Piping (7%)
Total Concrete
Equipment (based on vendor quote)
Tax and Delivery (11%)
Installation (20%)
Manufacturer Services (4%)
Total Mechanical
Total Concrete + Total Mechanical
Protective Coating (7% where applicable)
Electricity (10%)
Instrumentation (10%)
Housing ($250/sq. ft, all inclusive)
Subtotal
Contractor Overhead and Profit (15%)
Scope-of-Project Contingency (30%)
Total Construction Cost
Engineering Design (10%)
TOTAL CAPITAL COST
In practice, performance and costs of RO are a function of the site-specific water quality in terms of the speciation of TDS. However, since the DSS is being developed for general use, membrane performance and RO costs have been developed without the benefit of knowledge of such water quality constituents, despite the application of RO to a relatively low quality (i.e., filtered wastewater) feed. Design criteria and key assumptions used to calculate cost estimates are described below:
• Ninety percent recovery was assumed for MF/UF pretreatment, while a recovery of 80% was assumed for the RO process.
• No accommodations were made for different wastewater sources (i.e., feed waters) that may have increased scaling potential due to the particular concentrations of dissolved solids present.
• Footprints for RO and MF/UF equipment are based on unpublished, general rules of thumb utilized by membrane practitioners: 1200 ft2/mgd of RO permeate for systems

38 WateReuse Foundation
to up 10 mgd of capacity; 1000 ft2/mgd of RO permeate for systems up to 10-million-gallon (10-MG) storage capacity, exceeding 10 mgd of capacity, and 1400 ft2/mgd of MF/UF filtrate capacity.
• For the purposes of cost and functionality in this application, MF and UF were considered to be interchangeable technologies. In addition, no distinction was made between encased (i.e., pressure-driven) and submerged (i.e., vacuum-driven) MF/UF membrane systems.
• The temperature of the feed water can have a notable impact on both capital and operating costs for RO and MF/UF processes. No particular temperature was assumed, such that treatment applied to unusually cold waters may result in higher costs and that in unusually warm waters may cost less.
Concentrate disposal was not included in this analysis, since it was assumed that the concentrate will be discharged to the sanitary sewer (satellite facilities) or to drying beds (regional facilities).
Capital and O&M costs were adapted from previous studies and presentations (Elarde and Bergman, 2003; Adham et al., 2005; Technologies and Costs, 2005). The capital costs for MF/UF and RO equipment include the membrane elements, pressure vessels, skid frame, piping, valves, and appurtenant cleaning facilities. Scaling factors similar to those described in Table 4-6 were also included.
Operating costs included labor, power, chemicals associated with the RO process, disposable cartridge filters, and membrane replacement.
Given the treatment approaches and assumptions identified above, the tool addresses the treatment option variations shown in Table 4-7.

WateReuse Foundation 39
Table 4-7. Treatment option matrix
Alternative Regulatory Framework Type of Use Treatment Train
Satellite California
Direct Use
Ox + Filtration + Disinfection
SBR + Filtration + Disinfection
MBR + Disinfection
Recharge (spreading
or injection)
Ox + MF + RO
SBR + MF + RO
MBR + RO
Arizona Direct Use or Recharge
Same trains as for California direct use, different design parameters for N removal
Regional (Expansion) Same as for Satellite (new side stream treatment)
Regional (No Expansion)
California Direct Use Filtration + Disinfection
Recharge MF + RO
Arizona Direct Use Filtration + Disinfection
Recharge None (assume N already removed)
Treatment Facility Area Requirements Facility footprints include the land area needed for the unit processes described above and any setbacks required by applicable regulations (based upon Arizona and California experience). Facility footprints were based on typical sizes for each unit process at given flow values. Facility footprints, both with and without noise or odor control, are shown in Table 4-8.

40 WateReuse Foundation
Table 4-8. Treatment facility footprints
Treatment Capacity
Acres Required
Noise/Odor Control1 No Noise/Odor Control2
Ox
(AZ & CA) SBR MBR +
RO Ox (AZ) Ox (CA) SBR MBR +
RO
0.5 2.0 1.5 1.0 2.0 2.0 2.0 2.0
1 6.5 5.5 4.0 55 55 50 45
2 15 14 12 115 110 100 90
5 18 16 14 117 112 102 91
10 24 19 15 120 115 104 93
15 30 22 17 125 120 106 94
20 36 25 19 130 125 108 95
1 Arizona and California regulations require a 350-ft setback. 2 Arizona and California regulations require a 1000-ft setback.
4.3 DISTRIBUTION SYSTEMS AND CONVEYANCE PIPELINES Distribution system and conveyance pipeline calculations in the DSS are based on the following design criteria and assumptions:
• All conveyance pipelines originating from or flowing to a satellite treatment plant were assumed to be flowing full under pressure. Similarly, all pipes originating from a regional treatment plant (i.e., reclaimed water distribution system) also were assumed to be flowing full under pressure. For the residual-return line from the satellite plant to the wastewater interceptor, the flow is assumed to be equal to 10% of the average flow capacity of the plant, plus any reject concentrate if MF/RO is used.

WateReuse Foundation 41
Table 4-9. Unit process recovery percentages
Reclamation
Plant Unit Process Description
Recovery
(%)
Satellite
Ox + Filtration 90
SBR + Filtration 90
MBR 90
MF 90
RO 80
Regional
Ox + Filtration 98
SBR + Filtration 98
MBR 98
MF 98
RO 80
• Average daily effluent flows were based on unit process and treatment train recovery percentages shown in Tables 4-9 and 4-10. Higher recovery percentages at regional facilities reflect the assumption that existing infrastructure (e.g., filter presses and digesters) will process residuals generated by new treatment units with recovered liquid being returned to the treatment plant.
• Force main pipe diameters were sized based on average flow conditions and a default design velocity of 5.0 fps. Reclaimed water distribution system or recharge pipelines were sized based on maximum day demands (1.7 times average daily reclaimed water available) and a design velocity of 5.0 fps. Pipe diameters were calculated simply by applying the continuity equation (i.e., conservation-of-mass principle for an incompressible fluid at steady flow) and rounding up to the nearest even whole number.
• Pumps were sized based on the sum of the elevation, pressure, and friction heads. Velocity head was neglected. Elevation and pressure heads are determined from user inputs. The friction head was calculated by using Manning’s equation (0.013 default roughness coefficient), which is appropriate for turbulent flow. It was assumed that reclaimed water customers served through the same node are similar; i.e., they receive similar flows through similar mains and are located at similar elevations and distances from the node, as illustrated in Figure 4-4. Default values for motor and pump efficiencies were set at 90 and 80%, respectively.

42 WateReuse Foundation
Table 4-10. Reclamation plant production ratios (fraction of inflow)
Treatment Train Reclaimed Water Production
Wastewater Flow Returned to the
Collection System
Satellite-CAuse and AZuse or recharge
Ox Ditch + Filtration 0.90 0.10
SBR + Filtration 0.90 0.10
MBR 0.90 0.10
Satellite-CArecharge
Ox + MF + RO 0.72 0.28
SBR + MF + RO 0.72 0.28
MBR + RO 0.72 0.28
Regional-CAuse and AZuse or recharge
Ox + Filtration 0.98 N/A1
SBR + Filtration 0.98 N/A1
MBR 0.98 N/A1
Filtration 0.98 N/A1
Regional Expansion-CArecharge
Ox + MF + RO 0.78 N/A1
SBR + MF + RO 0.78 N/A1
MBR + RO 0.78 N/A1
MF + RO 0.78 N/A1 1 N/A, not applicable.
• Maximum day storage (1.7 times the average daily reclaimed water production) was provided at satellite and regional facilities. Because peak hour demands will vary depending on the reclaimed water end use, it was assumed that peak hour storage would be provided by individual reclaimed water customers.
• Pipeline capital costs were estimated based on a default value of $15 per in. of diameter per linear ft. The default O&M cost for pipelines was set at $3,200/mi/year (Surface Water Treatment, 2007).
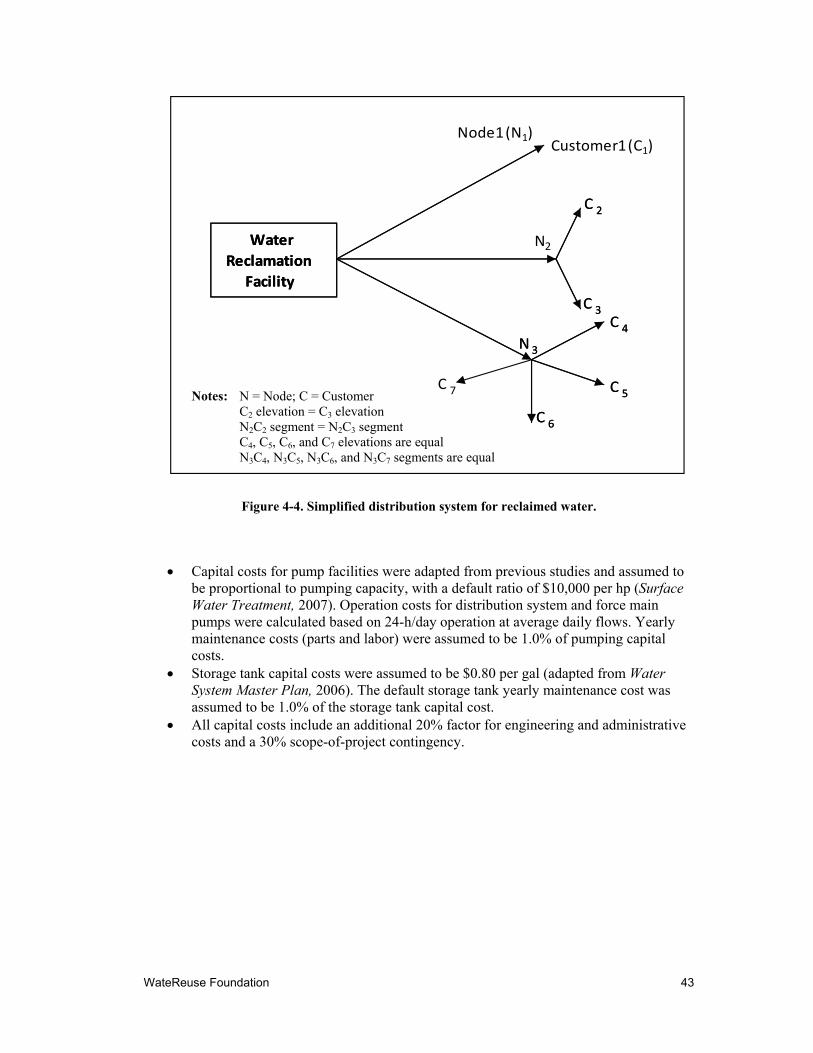
WateReuse Foundation 43
Notes: N = Node; C = Customer C2 elevation = C3 elevation N2C2 segment = N2C3 segment
C4, C5, C6, and C7 elevations are equal N3C4, N3C5, N3C6, and N3C7 segments are equal
Figure 4-4. Simplified distribution system for reclaimed water.
• Capital costs for pump facilities were adapted from previous studies and assumed to be proportional to pumping capacity, with a default ratio of $10,000 per hp (Surface Water Treatment, 2007). Operation costs for distribution system and force main pumps were calculated based on 24-h/day operation at average daily flows. Yearly maintenance costs (parts and labor) were assumed to be 1.0% of pumping capital costs.
• Storage tank capital costs were assumed to be $0.80 per gal (adapted from Water System Master Plan, 2006). The default storage tank yearly maintenance cost was assumed to be 1.0% of the storage tank capital cost.
• All capital costs include an additional 20% factor for engineering and administrative costs and a 30% scope-of-project contingency.
Water Reclamation
Facility
2
N3
C 2
C 3C 4
C 5
C 6
Water Reclamation
Facility
Node1 (N1)
N
N3
C 2
C 3C 4
C 5
C 6
C 7
Customer1 (C1)

WateReuse Foundation 45
REFERENCES
Adham, S.; Chiu, K.; Gramath, K.; Oppenheimer, J. Development of a Microfiltration and
Ultrafiltration Knowledge Base; AwwaRF: Denver, CO, 2005.
Arizona Administrative Code. http://www.azsos.gov/PUBLIC_SERVICES/Title_18/18-11.pdf (accessed Aug. 13, 2008).
Asano, T.; et al. Water Reuse: Issues, Technologies, and Applications; McGraw-Hill: New York, 2007; p 282.
Association for the Advancement of Cost Engineering (AACE) International. Cost Estimate Classification System—as Applied in Engineering, Procurement, and Construction for the Process Industries; AACE: Morgantown, WV, 2005.
California Code of Regulations. http://government.westlaw.com/linkedslice/default.asp? Action=TOC&RS=GVT1.0&VR=2.0&SP=CCR-1000 (accessed Aug. 13, 2008).
California Department of Public Health (CDPH). Groundwater recharge reuse DRAFT regulation; http://www.cdph.ca.gov/certlic/drinkingwater/Documents/Recharge/ DraftRechargeReg2008.pdf (accessed Aug. 13, 2008).
Cornell, P. Changing macro security settings in Office XP. http://office.microsoft.com/en-us/help/HA010429521033.aspx (accessed Aug. 12, 2008).
Elarde, J.; Bergman, R. The Cost of Membrane Softening and Desalting for Municipal Water Supplies; AwwaRF: Denver, CO, 2003.
Engineering News Record. Construction cost index history (1908–2008). http://enr.ecnext.com/comsite5/bin/comsite5.pl?page=enr_document&referid=3612&item_id=0271-52191&modperl=1&pub_code=ENR&free=0&article=fecosu0808-constIndexHist (accessed Aug. 12, 2008).
Guidelines for Water Reuse; U.S. Environmental Protection Agency, U.S. Government Printing Office: Washington, DC, 2004; p 87.
Microsoft. Macro security levels in Office 2003. http://office.microsoft.com/en-us/ork2003/HA011403071033.aspx (accessed Aug. 12, 2008).
Surface Water Treatment: Opportunities and Analyses; City of Avondale: Avondale, AZ, 2007.
Tchobanoglous, G. Wastewater Engineering: Treatment, Disposal, and Reuse, 3rd ed.; McGraw-Hill: New York, 1991.
Technologies and Costs Document for the Final Long Term 2 Enhanced Surface Water Treatment Rule and Final Stage 2 Disinfectants and Disinfection Byproducts Rule; Report No. 815-R-05-013; U.S. Environmental Protection Agency, U.S. Government Printing Office: Washington, DC, 2005.
Water System Master Plan; City of Phoenix: Phoenix, AZ, 2006.


WateReuse Foundation 47
APPENDIX A
DSS APPLICATION EXAMPLE
Municipality “XYZ” (XYZ), located within the Phoenix, Arizona, metropolitan area, needs to increase its wastewater treatment capacity by 5 mgd within the next 5 years to accommodate increased flows expected from its developing commercial area. While XYZ currently has a regional WRF in the southern portion of its service area, it is considering constructing a satellite facility north of its regional facility and using the reclaimed water to irrigate parks, a school, and xeriscape landscaping in a 6-sq.-mi residential development. XYZ decided to use the DSS to determine whether it should A) construct a satellite WRF near the residential development, serving the outdoor demands with reclaimed water, or B) expand the regional WRF, recharging the reclaimed water to the west of the WRF and serving the residential development’s outdoor demand with potable water via the potable water distribution system.
INFORMATION The analysis was performed in June 2008, corresponding to an Engineering News Record Construction Cost Index (20-city ENR CCI) of 8185. To reflect XYZ’s financial and operating conditions, the discount rate was changed to 8% and the electricity rate was changed to $0.06 per kWh. The motor and pump efficiencies were changed to 85 and 75%, respectively. Default values were used for all remaining inputs. The completed DSS information page is shown in Figure A-1.
SATELLITE ALTERNATIVE Because the reclaimed water produced from the satellite facility will be used for irrigation purposes, “Arizona – Direct Use” was selected. The capacity of the proposed facility was 5.0 mgd. With plenty of available land surrounding the residential development, XYZ entered “1,000” acres, reflecting the abundance of land available. The WRF treatment train was not important to XYZ. After initially favoring “Ox + Filt + Dis,” XYZ noticed that the total present worth of “SBR + Filt + Dis” was less than that of Ox, so it selected “SBR + Filt + Dis” instead.

48 WateReuse Foundation
Figure A-1. DSS information page.
The proposed satellite WRF, located directly above a large interceptor, was 1 mi (5280 feet) from the center of the residential development. In order to approximate the dual distribution system, XYZ assumed that 24 nodes would be located throughout the residential development, stemming from the center of the residential development. The average distance of these pipelines was estimated at 0.5 mi (2640 ft). The maximum elevation difference from the satellite WRF and the customers was 20 ft. XYZ assumed a supplied water pressure of 80 psi. The completed DSS satellite page is shown in Figure A-2.

WateReuse Foundation 49
Figure A-2. DSS satellite page.
REGIONAL ALTERNATIVE Instead of direct use, reclaimed water produced at the regional facility will be recharged. XYZ had to check “Select an end use different from the Satellite” in order to select “Arizona – Recharge.” Because the existing regional WRF was already operating at its design capacity, the regional WRF would have to be expanded to accommodate additional flows. While the existing facility had sufficient space for an additional 5.0-mgd capacity, reclaimed water produced from the proposed regional WRF had to be pumped 4 mi (21,120 ft) to the west, where additional land was available. In a decision similar to that for the satellite WRF, XYZ chose the “SBR + Filt + Dis” treatment technology. The elevation difference between the regional WRF and the proposed recharge location to the west is 50 ft. The minimum customer pressure was assumed to be 10 psi. The completed DSS regional page is shown in Figure A-3.

50 WateReuse Foundation
Figure A-3. DSS regional page.
DECISION XYZ held a stakeholders’ meeting in which the committee evaluated the satellite and regional facilities (Figure A-4). The weights and scores, along with justifications for each decision criterion, were determined by the committee as provided below:

WateReuse Foundation 51
Figure A-4. DSS decision page.
Affordability of Investment – The ability of XYZ to fund capital costs up front is more important than yearly O&M costs. Affordability of Investment was valued at 20% of the total decision. The capital costs for the regional and satellite facilities were approximately $35 million. Because the capital costs were similar to and cheaper than those for similar WRFs using Oxs or MBRs, both alternatives were assigned a score of 4.
Operational Affordability – The committee decided that Operational Affordability was not a key decision criterion because it believed that operational costs were sufficiently addressed in the Life Cycle Affordability. XYZ assigned Operational Affordability 0% and, subsequently, did not score the alternatives.
Life Cycle Affordability – Life Cycle Affordability (cost) was the most important criterion for the committee. The committee valued it at 30% of the evaluation. Because the total present worth costs for both alternatives were similar ($46 million to $48 million) within the AACE Level 4 cost opinion ranges, a score of 4 was given to both alternatives.
Land Availability – Because the service area is still in its infancy, there is an abundance of land available to XYZ. The committee determined that Land Availability was not an important criterion for evaluating the alternatives and gave the criterion a weight of 0%.

52 WateReuse Foundation
Ease of Development – The committee assigned a weight of 10% to Ease of Development. The committee believed that expanding the regional facility would be one of the easiest ways to increase capacity in its service area. The construction of a satellite facility would, similarly, be easy; however, the construction of a reclaimed water distribution system would require construction in a heavily populated area. A score of 5 was given to the regional facility alternative, and 2 was given to the satellite facility alternative.
Ease of Operation & Maintenance – The committee assigned a weight of 10% to Ease of Operation & Maintenance. Because the satellite facility would require XYZ to operate two facilities in addition to two distribution systems, it did not score the satellite facility favorably. The regional alternative was scored a 5, while the satellite alternative was scored a 2.
System Reliability – System Reliability was more important to XYZ than Ease of Development and Ease of Operation & Maintenance but not as important as Life Cycle Affordability. A weight of 20% was given to System Reliability. Both alternatives were considered to have the same reliability and were scored similarly (“3”).
Potable Supply Benefit – XYZ understood that serving reclaimed water to the residential community would reduce the demand on the potable water distribution system. As such, XYZ could reduce the number of potable wells by approximately two. The committee, however, believed there were no large advantages to either system on the potable supply side and, thus, did not include Potable Supply Benefit in the evaluation.
Avoided Costs – The committee tabulated a list of avoided costs that the satellite alternative would bring. Because the list included only a few pipelines and wells, the committee believed that capital costs for this infrastructure were small compared to the total alternative costs; it excluded Avoided Costs from the evaluation by giving it a weight of 0%.
Community Acceptance – Community Acceptance was important to XYZ because it was concerned that the residents in the service area might not view “reclaimed water” favorably if a significant public outreach program wasn’t initiated to increase the public’s awareness of utilizing reclaimed water for irrigation purposes. It assigned a score of 10% to Community Acceptance and gave the regional and satellite alternatives scores of 3 and 5, respectively.
Environmental Compatibility – XYZ gave Environmental Compatibility a score of 10%. Based on discussions within the group, the committee believed the satellite alternative was more environmentally responsible and gave it a score of 4 compared with the regional alternative’s score of 3.
Other – The committee did not consider any additional decision criterion.
Based on the scores and weights above, the regional alternative (weighted score of 4.0) was preferred over the satellite alternative (weighted score of 3.4). XYZ then reviewed the scores a second time and determined the weights and scores it originally assigned were satisfactory. Based on those scores, it recognized that the only way for the satellite facility to be preferable to the regional alternative was to weigh Environmental Compatibility 40% and reduce the weight of other categories. Using the DSS as a tool, XYZ determined it would plan and construct an expansion plant at the existing regional WRF.

WateReuse Foundation 53
APPENDIX B
CONCEPTUAL LEVEL COST OPINIONS

54
Wat
eReu
se F
ound
atio
n
Tab
le B
-1. A
dmin
/Lab
/Sho
p B
uild
ing
Exp
ense
Cos
t per
Am
ount
of F
low
(mgd
)
0.5
1.0
2.0
5.0
10
15
20
Con
cret
e $0
$0
$0
$0
$0
$0
$0
Ex
cava
tion
and
Bac
kfill
(10%
) $0
$0
$0
$0
$0
$0
$0
M
isce
llane
ous M
etal
s (4%
) $0
$0
$0
$0
$0
$0
$0
Y
ard
Pipi
ng (7
%)
$0
$0
$0
$0
$0
$0
$0
Tota
l Con
cret
e $0
$0
$0
$0
$0
$0
$0
Eq
uipm
ent
$0
$0
$0
$0
$0
$0
$0
Tax
and
Del
iver
y (1
1%)
$0
$0
$0
$0
$0
$0
$0
Inst
alla
tion
(20%
) $0
$0
$0
$0
$0
$0
$0
M
anuf
actu
rer S
ervi
ces (
4%)
$0
$0
$0
$0
$0
$0
$0
Tota
l Mec
hani
cal
$0
$0
$0
$0
$0
$0
$0
Prot
ectiv
e C
oatin
g (7
%)
$0
$0
$0
$0
$0
$0
$0
Elec
trici
ty (1
0%)
$0
$0
$0
$0
$0
$0
$0
Inst
rum
enta
tion
(10%
) $0
$0
$0
$0
$0
$0
$0
Hou
sing
1 $6
00,0
00
$600
,000
$7
50,0
00
$1,8
00,0
00
$3,0
00,0
00
$3,6
00,0
00
$4,2
00,0
00
Subt
otal
$6
00,0
00
$600
,000
$7
50,0
00
$1,8
00,0
00
$3,0
00,0
00
$3,6
00,0
00
$4,2
00,0
00
Con
tract
or O
verh
ead
& P
rofit
(15%
) $9
0,00
0 $9
0,00
0 $1
12,5
00
$270
,000
$4
50,0
00
$540
,000
$6
30,0
00
Scop
e-of
-Pro
ject
Con
tinge
ncy
(30%
) $1
80,0
00
$180
,000
$2
25,0
00
$540
,000
$9
00,0
00
$1,0
80,0
00
$1,2
60,0
00
Tota
l Con
stru
ctio
n C
ost
$870
,000
$8
70,0
00
$1,0
87,5
00
$2,6
10,0
00
$4,3
50,0
00
$5,2
20,0
00
$6,0
90,0
00
Engi
neer
ing
Des
ign
(10%
) $8
7,00
0 $8
7,00
0 $1
08,7
50
$261
,000
$4
35,0
00
$522
,000
$6
09,0
00
TOTA
L C
API
TAL
CO
ST
$957
,000
$9
57,0
00
$1,1
96,2
50
$2,8
71,0
00
$4,7
85,0
00
$5,7
42,0
00
$6,6
99,0
00
Cos
t per
gal
($)
$1.9
1 $0
.96
$0.6
0 $0
.57
$0.4
8 $0
.38
$0.3
3
O
&M
(5%
Con
stru
ctio
n C
ost)
$43,
500
$43,
500
$54,
375
$130
,500
$2
17,5
00
$261
,000
$3
04,5
00
1 Bas
ed o
n an
ass
umed
$30
0/ft²
use
d fo
r pla
nnin
g-le
vel e
stim
ates
.
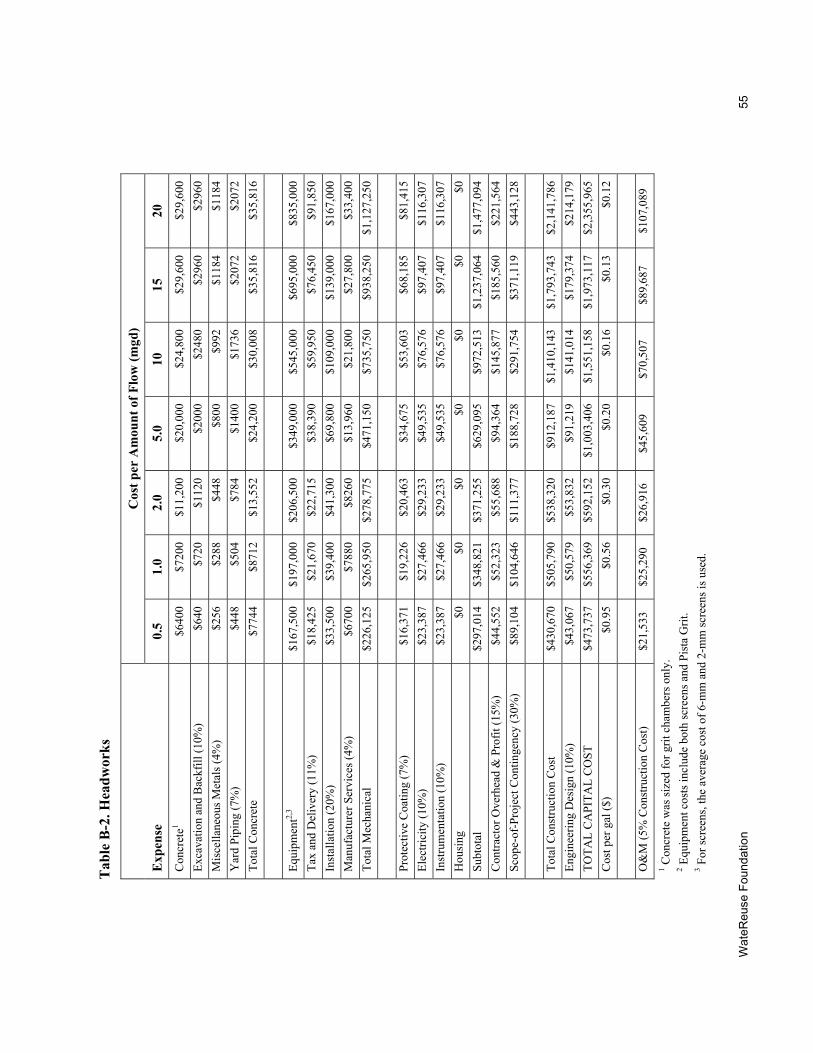
Wat
eReu
se F
ound
atio
n 55
Tab
le B
-2. H
eadw
orks
Exp
ense
Cos
t per
Am
ount
of F
low
(mgd
)
0.5
1.0
2.0
5.0
10
15
20
Con
cret
e1 $6
400
$720
0 $1
1,20
0 $2
0,00
0 $2
4,80
0 $2
9,60
0 $2
9,60
0 Ex
cava
tion
and
Bac
kfill
(10%
) $6
40
$720
$1
120
$200
0 $2
480
$296
0 $2
960
Mis
cella
neou
s Met
als (
4%)
$256
$2
88
$448
$8
00
$992
$1
184
$118
4 Y
ard
Pipi
ng (7
%)
$448
$5
04
$784
$1
400
$173
6 $2
072
$207
2 To
tal C
oncr
ete
$774
4 $8
712
$13,
552
$24,
200
$30,
008
$35,
816
$35,
816
Equi
pmen
t2,3
$167
,500
$1
97,0
00
$206
,500
$3
49,0
00
$545
,000
$6
95,0
00
$835
,000
Ta
x an
d D
eliv
ery
(11%
) $1
8,42
5 $2
1,67
0 $2
2,71
5 $3
8,39
0 $5
9,95
0 $7
6,45
0 $9
1,85
0 In
stal
latio
n (2
0%)
$33,
500
$39,
400
$41,
300
$69,
800
$109
,000
$1
39,0
00
$167
,000
M
anuf
actu
rer S
ervi
ces (
4%)
$670
0 $7
880
$826
0 $1
3,96
0 $2
1,80
0 $2
7,80
0 $3
3,40
0 To
tal M
echa
nica
l $2
26,1
25
$265
,950
$2
78,7
75
$471
,150
$7
35,7
50
$938
,250
$1
,127
,250
Pr
otec
tive
Coa
ting
(7%
) $1
6,37
1 $1
9,22
6 $2
0,46
3 $3
4,67
5 $5
3,60
3 $6
8,18
5 $8
1,41
5 El
ectri
city
(10%
) $2
3,38
7 $2
7,46
6 $2
9,23
3 $4
9,53
5 $7
6,57
6 $9
7,40
7 $1
16,3
07
Inst
rum
enta
tion
(10%
) $2
3,38
7 $2
7,46
6 $2
9,23
3 $4
9,53
5 $7
6,57
6 $9
7,40
7 $1
16,3
07
Hou
sing
$0
$0
$0
$0
$0
$0
$0
Su
btot
al
$297
,014
$3
48,8
21
$371
,255
$6
29,0
95
$972
,513
$1
,237
,064
$1
,477
,094
C
ontra
ctor
Ove
rhea
d &
Pro
fit (1
5%)
$44,
552
$52,
323
$55,
688
$94,
364
$145
,877
$1
85,5
60
$221
,564
Sc
ope-
of-P
roje
ct C
ontin
genc
y (3
0%)
$89,
104
$104
,646
$1
11,3
77
$188
,728
$2
91,7
54
$371
,119
$4
43,1
28
Tota
l Con
stru
ctio
n C
ost
$430
,670
$5
05,7
90
$538
,320
$9
12,1
87
$1,4
10,1
43
$1,7
93,7
43
$2,1
41,7
86
Engi
neer
ing
Des
ign
(10%
) $4
3,06
7 $5
0,57
9 $5
3,83
2 $9
1,21
9 $1
41,0
14
$179
,374
$2
14,1
79
TOTA
L C
API
TAL
CO
ST
$473
,737
$5
56,3
69
$592
,152
$1
,003
,406
$1
,551
,158
$1
,973
,117
$2
,355
,965
C
ost p
er g
al ($
) $0
.95
$0.5
6 $0
.30
$0.2
0 $0
.16
$0.1
3 $0
.12
O&
M (5
% C
onst
ruct
ion
Cos
t) $2
1,53
3 $2
5,29
0 $2
6,91
6 $4
5,60
9 $7
0,50
7 $8
9,68
7 $1
07,0
89
1 Con
cret
e w
as si
zed
for g
rit c
ham
bers
onl
y.
2 Equ
ipm
ent c
osts
incl
ude
both
scre
ens a
nd P
ista
Grit
. 3 F
or sc
reen
s, th
e av
erag
e co
st o
f 6-m
m a
nd 2
-mm
scre
ens i
s use
d.

56
Wat
eReu
se F
ound
atio
n
Tab
le B
-3. O
x (A
Z C
lass
A+)
Exp
ense
Cos
t per
Am
ount
of F
low
(mgd
)
0.5
1.0
2.0
5.0
10
15
20
Con
cret
e1 $8
80,8
00
$1,2
44,0
00
$2,3
00,0
00
$4,9
00,0
00
$9,6
37,6
00
$14,
659,
200
$21,
448,
000
Exca
vatio
n an
d B
ackf
ill (1
0%)
$88,
080
$124
,400
$2
30,0
00
$490
,000
$9
63,7
60
$1,4
65,9
20
$2,1
44,8
00
Mis
cella
neou
s Met
als (
4%)
$35,
232
$49,
760
$92,
000
$196
,000
$3
85,5
04
$586
,368
$8
57,9
20
Yar
d Pi
ping
(7%
) $6
1,65
6 $8
7,08
0 $1
61,0
00
$343
,000
$6
74,6
32
$1,0
26,1
44
$1,5
01,3
60
Tota
l Con
cret
e $1
,065
,768
$1
,505
,240
$2
,783
,000
$5
,929
,000
$1
1,66
1,49
6 $1
7,73
7,63
2 $2
5,95
2,08
0
Eq
uipm
ent2,
3
$548
,000
$5
98,0
00
$676
,000
$9
00,0
00
$1,8
00,0
00
$2,5
80,0
00
$3,3
60,0
00
Tax
and
Del
iver
y (1
1%)
$60,
280
$65,
780
$74,
360
$99,
000
$198
,000
$2
83,8
00
$369
,600
In
stal
latio
n (2
0%)
$109
,600
$1
19,6
00
$135
,200
$1
80,0
00
$360
,000
$5
16,0
00
$672
,000
M
anuf
actu
rer S
ervi
ces (
4%)
$21,
920
$23,
920
$27,
040
$36,
000
$72,
000
$103
,200
$1
34,4
00
Tota
l Mec
hani
cal
$739
,800
$8
07,3
00
$912
,600
$1
,215
,000
$2
,430
,000
$3
,483
,000
$4
,536
,000
Pr
otec
tive
Coa
ting
(7%
) $1
26,3
90
$161
,878
$2
58,6
92
$500
,080
$9
86,4
05
$1,4
85,4
44
$2,1
34,1
66
Elec
trica
l (10
%)
$180
,557
$2
31,2
54
$369
,560
$7
14,4
00
$1,4
09,1
50
$2,1
22,0
63
$3,0
48,8
08
Inst
rum
enta
tion
(10%
) $1
80,5
57
$231
,254
$3
69,5
60
$714
,400
$1
,409
,150
$2
,122
,063
$3
,048
,808
H
ousi
ng
$0
$0
$0
$0
$0
$0
$0
Subt
otal
$2
,293
,071
$2
,936
,926
$4
,693
,412
$9
,072
,880
$1
7,89
6,20
0 $2
6,95
0,20
3 $3
8,71
9,86
2 C
ontra
ctor
Ove
rhea
d &
Pro
fit (1
5%)
$343
,961
$4
40,5
39
$704
,012
$1
,360
,932
$2
,684
,430
$4
,042
,530
$5
,807
,979
Sc
ope-
of-P
roje
ct C
ontin
genc
y (3
0%)
$687
,921
$8
81,0
78
$1,4
08,0
24
$2,7
21,8
64
$5,3
68,8
60
$8,0
85,0
61
$11,
615,
958
Tota
l Con
stru
ctio
n C
ost
$3,3
24,9
53
$4,2
58,5
42
$6,8
05,4
47
$13,
155,
676
$25,
949,
490
$39,
077,
794
$56,
143,
799
Engi
neer
ing
Des
ign
(10%
) $3
32,4
95
$425
,854
$6
80,5
45
$1,3
15,5
68
$2,5
94,9
49
$3,9
07,7
79
$5,6
14,3
80
TOTA
L C
API
TAL
CO
ST
$3,6
57,4
49
$4,6
84,3
97
$7,4
85,9
92
$14,
471,
244
$28,
544,
439
$42,
985,
573
$61,
758,
179
Cos
t per
gal
($)
$7.3
1 $4
.68
$3.7
4 $2
.89
$2.8
5 $2
.87
$3.0
9
O
&M
(5%
Con
stru
ctio
n C
ost)
$166
,248
$2
12,9
27
$340
,272
$6
57,7
84
$1,2
97,4
74
$1,9
53,8
90
$2,8
07,1
90
1 Con
cret
e co
st is
onl
y fo
r grit
cha
mbe
rs.
2 Equ
ipm
ent c
osts
incl
ude
both
scre
ens a
nd P
ista
Grit
(Wes
tern
Env
ironm
enta
l Equ
ipm
ent C
o. a
nd S
iem
ens T
echn
olog
ies)
. 3 F
or sc
reen
s, th
e av
erag
e co
st o
f 6-m
m a
nd 2
-mm
scre
ens w
as u
sed.
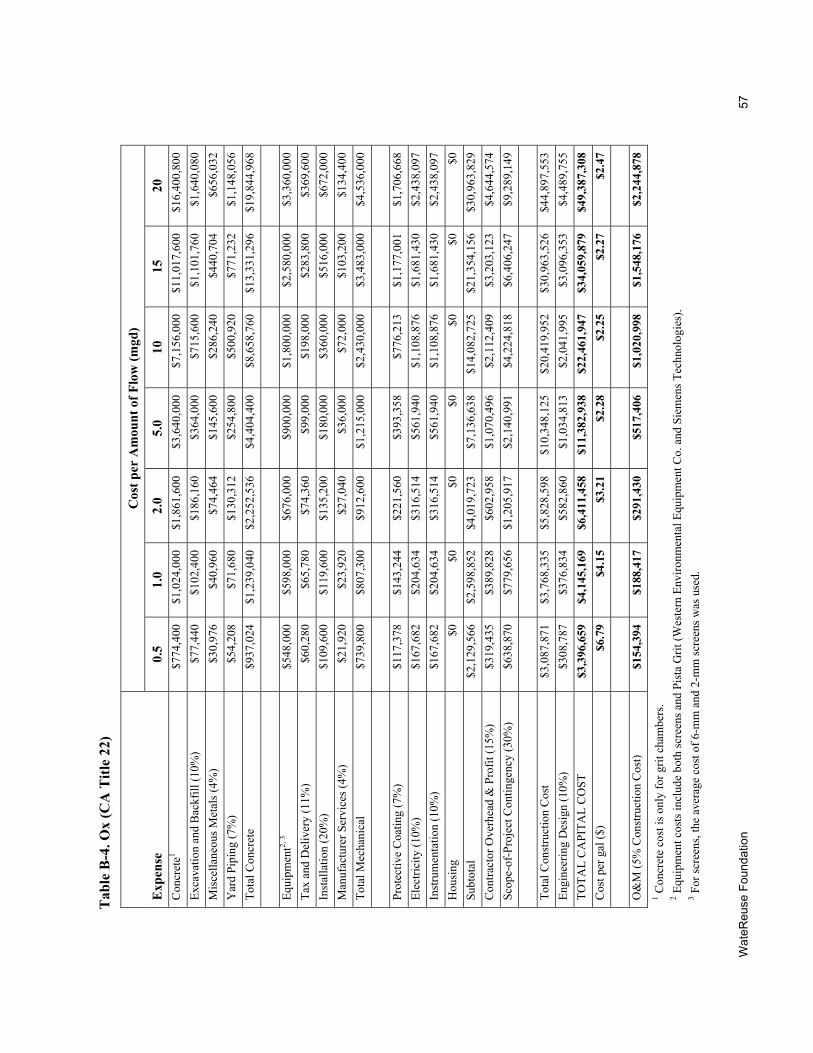
Wat
eReu
se F
ound
atio
n 57
Tab
le B
-4. O
x (C
A T
itle
22)
Exp
ense
Cos
t per
Am
ount
of F
low
(mgd
)
0.5
1.0
2.0
5.0
10
15
20
Con
cret
e1 $7
74,4
00
$1,0
24,0
00
$1,8
61,6
00
$3,6
40,0
00
$7,1
56,0
00
$11,
017,
600
$16,
400,
800
Exca
vatio
n an
d B
ackf
ill (1
0%)
$77,
440
$102
,400
$1
86,1
60
$364
,000
$7
15,6
00
$1,1
01,7
60
$1,6
40,0
80
Mis
cella
neou
s Met
als (
4%)
$30,
976
$40,
960
$74,
464
$145
,600
$2
86,2
40
$440
,704
$6
56,0
32
Yar
d Pi
ping
(7%
) $5
4,20
8 $7
1,68
0 $1
30,3
12
$254
,800
$5
00,9
20
$771
,232
$1
,148
,056
To
tal C
oncr
ete
$937
,024
$1
,239
,040
$2
,252
,536
$4
,404
,400
$8
,658
,760
$1
3,33
1,29
6 $1
9,84
4,96
8
Eq
uipm
ent2,
3
$548
,000
$5
98,0
00
$676
,000
$9
00,0
00
$1,8
00,0
00
$2,5
80,0
00
$3,3
60,0
00
Tax
and
Del
iver
y (1
1%)
$60,
280
$65,
780
$74,
360
$99,
000
$198
,000
$2
83,8
00
$369
,600
In
stal
latio
n (2
0%)
$109
,600
$1
19,6
00
$135
,200
$1
80,0
00
$360
,000
$5
16,0
00
$672
,000
M
anuf
actu
rer S
ervi
ces (
4%)
$21,
920
$23,
920
$27,
040
$36,
000
$72,
000
$103
,200
$1
34,4
00
Tota
l Mec
hani
cal
$739
,800
$8
07,3
00
$912
,600
$1
,215
,000
$2
,430
,000
$3
,483
,000
$4
,536
,000
Pr
otec
tive
Coa
ting
(7%
) $1
17,3
78
$143
,244
$2
21,5
60
$393
,358
$7
76,2
13
$1,1
77,0
01
$1,7
06,6
68
Elec
trici
ty (1
0%)
$167
,682
$2
04,6
34
$316
,514
$5
61,9
40
$1,1
08,8
76
$1,6
81,4
30
$2,4
38,0
97
Inst
rum
enta
tion
(10%
) $1
67,6
82
$204
,634
$3
16,5
14
$561
,940
$1
,108
,876
$1
,681
,430
$2
,438
,097
H
ousi
ng
$0
$0
$0
$0
$0
$0
$0
Subt
otal
$2
,129
,566
$2
,598
,852
$4
,019
,723
$7
,136
,638
$1
4,08
2,72
5 $2
1,35
4,15
6 $3
0,96
3,82
9 C
ontra
ctor
Ove
rhea
d &
Pro
fit (1
5%)
$319
,435
$3
89,8
28
$602
,958
$1
,070
,496
$2
,112
,409
$3
,203
,123
$4
,644
,574
Sc
ope-
of-P
roje
ct C
ontin
genc
y (3
0%)
$638
,870
$7
79,6
56
$1,2
05,9
17
$2,1
40,9
91
$4,2
24,8
18
$6,4
06,2
47
$9,2
89,1
49
Tota
l Con
stru
ctio
n C
ost
$3,0
87,8
71
$3,7
68,3
35
$5,8
28,5
98
$10,
348,
125
$20,
419,
952
$30,
963,
526
$44,
897,
553
Engi
neer
ing
Des
ign
(10%
) $3
08,7
87
$376
,834
$5
82,8
60
$1,0
34,8
13
$2,0
41,9
95
$3,0
96,3
53
$4,4
89,7
55
TOTA
L C
API
TAL
CO
ST
$3,3
96,6
59
$4,1
45,1
69
$6,4
11,4
58
$11,
382,
938
$22,
461,
947
$34,
059,
879
$49,
387,
308
Cos
t per
gal
($)
$6.7
9 $4
.15
$3.2
1 $2
.28
$2.2
5 $2
.27
$2.4
7
O
&M
(5%
Con
stru
ctio
n C
ost)
$154
,394
$1
88,4
17
$291
,430
$5
17,4
06
$1,0
20,9
98
$1,5
48,1
76
$2,2
44,8
78
1 Con
cret
e co
st is
onl
y fo
r grit
cha
mbe
rs.
2 Equ
ipm
ent c
osts
incl
ude
both
scre
ens a
nd P
ista
Grit
(Wes
tern
Env
ironm
enta
l Equ
ipm
ent C
o. a
nd S
iem
ens T
echn
olog
ies)
. 3 F
or sc
reen
s, th
e av
erag
e co
st o
f 6-m
m a
nd 2
-mm
scre
ens w
as u
sed.

58
Wat
eReu
se F
ound
atio
n
Tab
le B
-5. A
qua
Aer
obic
s SB
R (A
Z C
lass
A+)
Exp
ense
Cos
t per
Am
ount
of F
low
(mgd
)
0.5
1.0
2.0
5.0
10
15
20
Con
cret
e $1
,132
,000
$2
,064
,000
$2
,272
,800
$3
,079
,200
$3
,498
,400
$4
,332
,800
$4
,880
,800
Ex
cava
tion
and
Bac
kfill
(10%
) $1
13,2
00
$206
,400
$2
27,2
80
$307
,920
$3
49,8
40
$433
,280
$4
88,0
80
Mis
cella
neou
s Met
als (
4%)
$45,
280
$82,
560
$90,
912
$123
,168
$1
39,9
36
$173
,312
$1
95,2
32
Yar
d Pi
ping
(7%
) $7
9,24
0 $1
44,4
80
$159
,096
$2
15,5
44
$244
,888
$3
03,2
96
$341
,656
To
tal C
oncr
ete
$1,3
69,7
20
$2,4
97,4
40
$2,7
50,0
88
$3,7
25,8
32
$4,2
33,0
64
$5,2
42,6
88
$5,9
05,7
68
Equi
pmen
t1 $5
00,0
00
$625
,000
$8
75,0
00
$1,4
00,0
00
$1,9
00,0
00
$2,4
00,0
00
$2,6
50,0
00
Tax
and
Del
iver
y (1
1%)
$55,
000
$68,
750
$96,
250
$154
,000
$2
09,0
00
$264
,000
$2
91,5
00
Inst
alla
tion
(20%
) $1
00,0
00
$125
,000
$1
75,0
00
$280
,000
$3
80,0
00
$480
,000
$5
30,0
00
Man
ufac
ture
r Ser
vice
s (4%
) $2
0,00
0 $2
5,00
0 $3
5,00
0 $5
6,00
0 $7
6,00
0 $9
6,00
0 $1
06,0
00
Tota
l Mec
hani
cal
$675
,000
$8
43,7
50
$1,1
81,2
50
$1,8
90,0
00
$2,5
65,0
00
$3,2
40,0
00
$3,5
77,5
00
Prot
ectiv
e C
oatin
g (7
%)
$143
,130
$2
33,8
83
$275
,194
$3
93,1
08
$475
,864
$5
93,7
88
$663
,829
El
ectri
city
(10%
) $2
04,4
72
$334
,119
$3
93,1
34
$561
,583
$6
79,8
06
$848
,269
$9
48,3
27
Inst
rum
enta
tion
(10%
) $2
04,4
72
$334
,119
$3
93,1
34
$561
,583
$6
79,8
06
$848
,269
$9
48,3
27
Hou
sing
$0
$0
$0
$0
$0
$0
$0
Su
btot
al
$2,5
96,7
94
$4,2
43,3
11
$4,9
92,7
99
$7,1
32,1
07
$8,6
33,5
41
$10,
773,
014
$12,
043,
750
Con
tract
or O
verh
ead
& P
rofit
(15%
) $3
89,5
19
$636
,497
$7
48,9
20
$1,0
69,8
16
$1,2
95,0
31
$1,6
15,9
52
$1,8
06,5
63
Scop
e-of
-Pro
ject
Con
tinge
ncy
(30%
) $7
79,0
38
$1,2
72,9
93
$1,4
97,8
40
$2,1
39,6
32
$2,5
90,0
62
$3,2
31,9
04
$3,6
13,1
25
Tota
l Con
stru
ctio
n C
ost
$3,7
65,3
52
$6,1
52,8
01
$7,2
39,5
59
$10,
341,
555
$12,
518,
635
$15,
620,
870
$17,
463,
438
Engi
neer
ing
Des
ign
(10%
) $3
76,5
35
$615
,280
$7
23,9
56
$1,0
34,1
55
$1,2
51,8
63
$1,5
62,0
87
$1,7
46,3
44
TOTA
L C
API
TAL
CO
ST
$4,1
41,8
87
$6,7
68,0
82
$7,9
63,5
15
$11,
375,
710
$13,
770,
498
$17,
182,
957
$19,
209,
782
Cos
t per
gal
($)
$8.2
8 $6
.77
$3.9
8 $2
.28
$1.3
8 $1
.15
$0.9
6
O
&M
(5%
Con
stru
ctio
n C
ost)
$188
,268
$3
07,6
40
$361
,978
$5
17,0
78
$625
,932
$7
81,0
43
$873
,172
1 E
quip
men
t cos
ts p
rovi
ded
by A
qua
Aer
obic
s.
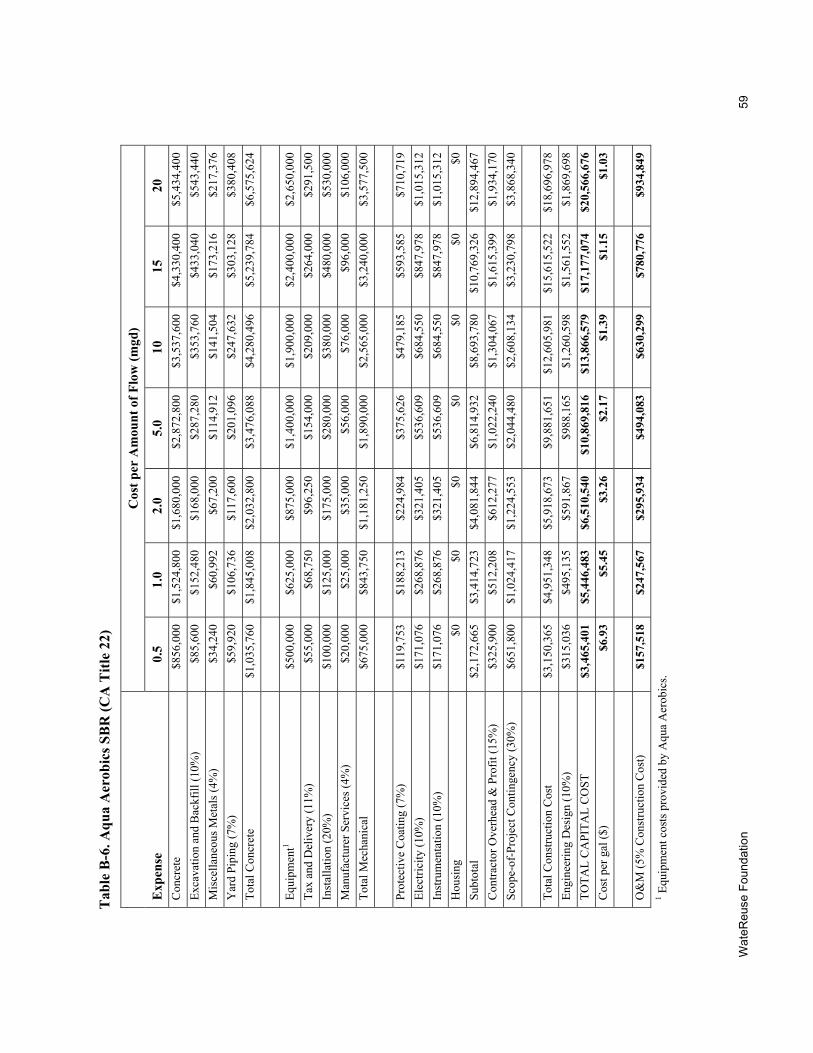
Wat
eReu
se F
ound
atio
n 59
Tab
le B
-6. A
qua
Aer
obic
s SB
R (C
A T
itle
22)
Exp
ense
Cos
t per
Am
ount
of F
low
(mgd
)
0.5
1.0
2.0
5.0
10
15
20
Con
cret
e $8
56,0
00
$1,5
24,8
00
$1,6
80,0
00
$2,8
72,8
00
$3,5
37,6
00
$4,3
30,4
00
$5,4
34,4
00
Exca
vatio
n an
d B
ackf
ill (1
0%)
$85,
600
$152
,480
$1
68,0
00
$287
,280
$3
53,7
60
$433
,040
$5
43,4
40
Mis
cella
neou
s Met
als (
4%)
$34,
240
$60,
992
$67,
200
$114
,912
$1
41,5
04
$173
,216
$2
17,3
76
Yar
d Pi
ping
(7%
) $5
9,92
0 $1
06,7
36
$117
,600
$2
01,0
96
$247
,632
$3
03,1
28
$380
,408
To
tal C
oncr
ete
$1,0
35,7
60
$1,8
45,0
08
$2,0
32,8
00
$3,4
76,0
88
$4,2
80,4
96
$5,2
39,7
84
$6,5
75,6
24
Equi
pmen
t1 $5
00,0
00
$625
,000
$8
75,0
00
$1,4
00,0
00
$1,9
00,0
00
$2,4
00,0
00
$2,6
50,0
00
Tax
and
Del
iver
y (1
1%)
$55,
000
$68,
750
$96,
250
$154
,000
$2
09,0
00
$264
,000
$2
91,5
00
Inst
alla
tion
(20%
) $1
00,0
00
$125
,000
$1
75,0
00
$280
,000
$3
80,0
00
$480
,000
$5
30,0
00
Man
ufac
ture
r Ser
vice
s (4%
) $2
0,00
0 $2
5,00
0 $3
5,00
0 $5
6,00
0 $7
6,00
0 $9
6,00
0 $1
06,0
00
Tota
l Mec
hani
cal
$675
,000
$8
43,7
50
$1,1
81,2
50
$1,8
90,0
00
$2,5
65,0
00
$3,2
40,0
00
$3,5
77,5
00
Prot
ectiv
e C
oatin
g (7
%)
$119
,753
$1
88,2
13
$224
,984
$3
75,6
26
$479
,185
$5
93,5
85
$710
,719
El
ectri
city
(10%
) $1
71,0
76
$268
,876
$3
21,4
05
$536
,609
$6
84,5
50
$847
,978
$1
,015
,312
In
stru
men
tatio
n (1
0%)
$171
,076
$2
68,8
76
$321
,405
$5
36,6
09
$684
,550
$8
47,9
78
$1,0
15,3
12
Hou
sing
$0
$0
$0
$0
$0
$0
$0
Su
btot
al
$2,1
72,6
65
$3,4
14,7
23
$4,0
81,8
44
$6,8
14,9
32
$8,6
93,7
80
$10,
769,
326
$12,
894,
467
Con
tract
or O
verh
ead
& P
rofit
(15%
) $3
25,9
00
$512
,208
$6
12,2
77
$1,0
22,2
40
$1,3
04,0
67
$1,6
15,3
99
$1,9
34,1
70
Scop
e-of
-Pro
ject
Con
tinge
ncy
(30%
) $6
51,8
00
$1,0
24,4
17
$1,2
24,5
53
$2,0
44,4
80
$2,6
08,1
34
$3,2
30,7
98
$3,8
68,3
40
Tota
l Con
stru
ctio
n C
ost
$3,1
50,3
65
$4,9
51,3
48
$5,9
18,6
73
$9,8
81,6
51
$12,
605,
981
$15,
615,
522
$18,
696,
978
Engi
neer
ing
Des
ign
(10%
) $3
15,0
36
$495
,135
$5
91,8
67
$988
,165
$1
,260
,598
$1
,561
,552
$1
,869
,698
TO
TAL
CA
PITA
L C
OST
$3
,465
,401
$5
,446
,483
$6
,510
,540
$1
0,86
9,81
6 $1
3,86
6,57
9 $1
7,17
7,07
4 $2
0,56
6,67
6 C
ost p
er g
al ($
) $6
.93
$5.4
5 $3
.26
$2.1
7 $1
.39
$1.1
5 $1
.03
O&
M (5
% C
onst
ruct
ion
Cos
t) $1
57,5
18
$247
,567
$2
95,9
34
$494
,083
$6
30,2
99
$780
,776
$9
34,8
49
1 Equ
ipm
ent c
osts
pro
vide
d by
Aqu
a A
erob
ics.

60
Wat
eReu
se F
ound
atio
n
Tab
le B
-7. Z
enon
MB
R (A
Z C
lass
A+)
Exp
ense
Cos
t per
Am
ount
of F
low
(mgd
)
0.5
1.0
2.0
5.0
10
15
20
Con
cret
e $7
60,8
00
$1,3
76,0
00
$2,5
35,2
00
$5,1
67,2
00
$10,
496,
000
$15,
132,
000
$20,
158,
400
Exca
vatio
n an
d B
ackf
ill (1
0%)
$76,
080
$137
,600
$2
53,5
20
$516
,720
$1
,049
,600
$1
,513
,200
$2
,015
,840
M
isce
llane
ous M
etal
s (4%
) $3
0,43
2 $5
5,04
0 $1
01,4
08
$206
,688
$4
19,8
40
$605
,280
$8
06,3
36
Yar
d Pi
ping
(7%
) $5
3,25
6 $9
6,32
0 $1
77,4
64
$361
,704
$7
34,7
20
$1,0
59,2
40
$1,4
11,0
88
Tota
l Con
cret
e $9
20,5
68
$1,6
64,9
60
$3,0
67,5
92
$6,2
52,3
12
$12,
700,
160
$18,
309,
720
$24,
391,
664
Equi
pmen
t1 $2
,963
,000
$3
,704
,000
$7
,037
,000
$1
4,81
5,00
0 $2
4,30
6,00
0 $2
7,77
8,00
0 $2
9,63
0,00
0 Ta
x an
d D
eliv
ery
(11%
) $3
25,9
30
$407
,440
$7
74,0
70
$1,6
29,6
50
$2,6
73,6
60
$3,0
55,5
80
$3,2
59,3
00
Inst
alla
tion
(20%
) $5
92,6
00
$740
,800
$1
,407
,400
$2
,963
,000
$4
,861
,200
$5
,555
,600
$5
,926
,000
M
anuf
actu
rer S
ervi
ces (
4%)
$118
,520
$1
48,1
60
$281
,480
$5
92,6
00
$972
,240
$1
,111
,120
$1
,185
,200
To
tal M
echa
nica
l $4
,000
,050
$5
,000
,400
$9
,499
,950
$2
0,00
0,25
0 $3
2,81
3,10
0 $3
7,50
0,30
0 $4
0,00
0,50
0
Pr
otec
tive
Coa
ting
(7%
) $3
44,4
43
$466
,575
$8
79,7
28
$1,8
37,6
79
$3,1
85,9
28
$3,9
06,7
01
$4,5
07,4
51
Elec
trici
ty (1
0%)
$492
,062
$6
66,5
36
$1,2
56,7
54
$2,6
25,2
56
$4,5
51,3
26
$5,5
81,0
02
$6,4
39,2
16
Inst
rum
enta
tion
(10%
) $4
92,0
62
$666
,536
$1
,256
,754
$2
,625
,256
$4
,551
,326
$5
,581
,002
$6
,439
,216
H
ousi
ng
$0
$0
$0
$0
$0
$0
$0
Subt
otal
$6
,249
,185
$8
,465
,007
$1
5,96
0,77
8 $3
3,34
0,75
4 $5
7,80
1,84
0 $7
0,87
8,72
5 $8
1,77
8,04
8 C
ontra
ctor
Ove
rhea
d &
Pro
fit (1
5%)
$937
,378
$1
,269
,751
$2
,394
,117
$5
,001
,113
$8
,670
,276
$1
0,63
1,80
9 $1
2,26
6,70
7 Sc
ope-
of-P
roje
ct C
ontin
genc
y (3
0%)
$1,8
74,7
55
$2,5
39,5
02
$4,7
88,2
34
$10,
002,
226
$17,
340,
552
$21,
263,
618
$24,
533,
414
Tota
l Con
stru
ctio
n C
ost
$9,0
61,3
18
$12,
274,
260
$23,
143,
129
$48,
344,
093
$83,
812,
668
$102
,774
,152
$1
18,5
78,1
70
Engi
neer
ing
Des
ign
(10%
) $9
06,1
32
$1,2
27,4
26
$2,3
14,3
13
$4,8
34,4
09
$8,3
81,2
67
$10,
277,
415
$11,
857,
817
TOTA
L C
API
TAL
CO
ST
$9,9
67,4
50
$13,
501,
686
$25,
457,
441
$53,
178,
502
$92,
193,
935
$113
,051
,567
$1
30,4
35,9
87
Cos
t per
gal
($)
$19.
93
$13.
50
$12.
73
$10.
64
$9.2
2 $7
.54
$6.5
2
O
&M
(5%
Con
stru
ctio
n C
ost)
$453
,066
$6
13,7
13
$1,1
57,1
56
$2,4
17,2
05
$4,1
90,6
33
$5,1
38,7
08
$5,9
28,9
09
1 Equ
ipm
ent c
osts
pro
vide
d by
Zen
on T
echn
olog
ies.

Wat
eReu
se F
ound
atio
n 61
Tab
le B
-8. Z
enon
MB
R (C
A T
itle
22)
Exp
ense
Cos
t per
Am
ount
of F
low
(mgd
)
0.5
1.0
2.0
5.0
10
15
20
Con
cret
e $6
10,4
00
$1,0
62,4
00
$2,0
12,0
00
$4,7
22,4
00
$9,6
84,8
00
$13,
448,
800
$19,
054,
400
Exca
vatio
n an
d B
ackf
ill (1
0%)
$61,
040
$106
,240
$2
01,2
00
$472
,240
$9
68,4
80
$1,3
44,8
80
$1,9
05,4
40
Mis
cella
neou
s Met
als (
4%)
$24,
416
$42,
496
$80,
480
$188
,896
$3
87,3
92
$537
,952
$7
62,1
76
Yar
d Pi
ping
(7%
) $4
2,72
8 $7
4,36
8 $1
40,8
40
$330
,568
$6
77,9
36
$941
,416
$1
,333
,808
To
tal C
oncr
ete
$738
,584
$1
,285
,504
$2
,434
,520
$5
,714
,104
$1
1,71
8,60
8 $1
6,27
3,04
8 $2
3,05
5,82
4
Eq
uipm
ent1
$2,9
63,0
00
$3,7
04,0
00
$7,0
37,0
00
$14,
815,
000
$24,
306,
000
$27,
778,
000
$29,
630,
000
Tax
and
Del
iver
y (1
1%)
$325
,930
$4
07,4
40
$774
,070
$1
,629
,650
$2
,673
,660
$3
,055
,580
$3
,259
,300
In
stal
latio
n (2
0%)
$592
,600
$7
40,8
00
$1,4
07,4
00
$2,9
63,0
00
$4,8
61,2
00
$5,5
55,6
00
$5,9
26,0
00
Man
ufac
ture
r Ser
vice
s (4%
) $1
18,5
20
$148
,160
$2
81,4
80
$592
,600
$9
72,2
40
$1,1
11,1
20
$1,1
85,2
00
Tota
l Mec
hani
cal
$4,0
00,0
50
$5,0
00,4
00
$9,4
99,9
50
$20,
000,
250
$32,
813,
100
$37,
500,
300
$40,
000,
500
Prot
ectiv
e C
oatin
g (7
%)
$331
,704
$4
40,0
13
$835
,413
$1
,800
,005
$3
,117
,220
$3
,764
,134
$4
,413
,943
El
ectri
city
(10%
) $4
73,8
63
$628
,590
$1
,193
,447
$2
,571
,435
$4
,453
,171
$5
,377
,335
$6
,305
,632
In
stru
men
tatio
n (1
0%)
$473
,863
$6
28,5
90
$1,1
93,4
47
$2,5
71,4
35
$4,4
53,1
71
$5,3
77,3
35
$6,3
05,6
32
Hou
sing
$0
$0
$0
$0
$0
$0
$0
Su
btot
al
$6,0
18,0
65
$7,9
83,0
98
$15,
156,
777
$32,
657,
230
$56,
555,
269
$68,
292,
152
$80,
081,
531
Con
tract
or O
verh
ead
& P
rofit
(15%
) $9
02,7
10
$1,1
97,4
65
$2,2
73,5
17
$4,8
98,5
84
$8,4
83,2
90
$10,
243,
823
$12,
012,
230
Scop
e-of
-Pro
ject
Con
tinge
ncy
(30%
) $1
,805
,420
$2
,394
,929
$4
,547
,033
$9
,797
,169
$1
6,96
6,58
1 $2
0,48
7,64
6 $2
4,02
4,45
9
To
tal C
onst
ruct
ion
Cos
t $8
,726
,195
$1
1,57
5,49
2 $2
1,97
7,32
7 $4
7,35
2,98
3 $8
2,00
5,14
0 $9
9,02
3,62
0 $1
16,1
18,2
21
Engi
neer
ing
Des
ign
(10%
) $8
72,6
19
$1,1
57,5
49
$2,1
97,7
33
$4,7
35,2
98
$8,2
00,5
14
$9,9
02,3
62
$11,
611,
822
TOTA
L C
API
TAL
CO
ST
$9,5
98,8
14
$12,
733,
041
$24,
175,
059
$52,
088,
281
$90,
205,
654
$108
,925
,982
$1
27,7
30,0
43
Cos
t per
gal
($)
$19.
20
$12.
73
$12.
09
$10.
42
$9.0
2 $7
.26
$6.3
9
O
&M
(5%
Con
stru
ctio
n C
ost)
$436
,310
$5
78,7
75
$1,0
98,8
66
$2,3
67,6
49
$4,1
00,2
57
$4,9
51,1
81
$5,8
05,9
11
1 Equ
ipm
ent c
osts
pro
vide
d by
Zen
on T
echn
olog
ies.

62
Wat
eReu
se F
ound
atio
n
Tab
le B
-9. A
qua
Aer
obic
s MB
R (A
Z C
lass
A+)
Exp
ense
Cos
t per
Am
ount
of F
low
(mgd
)
0.5
1.0
2.0
5.0
10
15
20
Con
cret
e $7
60,8
00
$1,3
76,0
00
$2,5
35,2
00
$5,1
67,2
00
$10,
496,
000
$15,
132,
000
$20,
158,
400
Exca
vatio
n an
d B
ackf
ill (1
0%)
$76,
080
$137
,600
$2
53,5
20
$516
,720
$1
,049
,600
$1
,513
,200
$2
,015
,840
M
isce
llane
ous M
etal
s (4%
) $3
0,43
2 $5
5,04
0 $1
01,4
08
$206
,688
$4
19,8
40
$605
,280
$8
06,3
36
Yar
d Pi
ping
(7%
) $5
3,25
6 $9
6,32
0 $1
77,4
64
$361
,704
$7
34,7
20
$1,0
59,2
40
$1,4
11,0
88
Tota
l Con
cret
e $9
20,5
68
$1,6
64,9
60
$3,0
67,5
92
$6,2
52,3
12
$12,
700,
160
$18,
309,
720
$24,
391,
664
Equi
pmen
t1 $1
,000
,000
$2
,000
,000
$2
,900
,000
$8
,000
,000
$1
4,50
0,00
0 $2
0,50
0,00
0 $2
6,00
0,00
0 Ta
x an
d D
eliv
ery
(11%
) $1
10,0
00
$220
,000
$3
19,0
00
$880
,000
$1
,595
,000
$2
,255
,000
$2
,860
,000
In
stal
latio
n (2
0%)
$200
,000
$4
00,0
00
$580
,000
$1
,600
,000
$2
,900
,000
$4
,100
,000
$5
,200
,000
M
anuf
actu
rer S
ervi
ces (
4%)
$40,
000
$80,
000
$116
,000
$3
20,0
00
$580
,000
$8
20,0
00
$1,0
40,0
00
Tota
l Mec
hani
cal
$1,3
50,0
00
$2,7
00,0
00
$3,9
15,0
00
$10,
800,
000
$19,
575,
000
$27,
675,
000
$35,
100,
000
Prot
ectiv
e C
oatin
g (7
%)
$158
,940
$3
05,5
47
$488
,781
$1
,193
,662
$2
,259
,261
$3
,218
,930
$4
,164
,416
El
ectri
city
(10%
) $2
27,0
57
$436
,496
$6
98,2
59
$1,7
05,2
31
$3,2
27,5
16
$4,5
98,4
72
$5,9
49,1
66
Inst
rum
enta
tion
(10%
) $2
27,0
57
$436
,496
$6
98,2
59
$1,7
05,2
31
$3,2
27,5
16
$4,5
98,4
72
$5,9
49,1
66
Hou
sing
$0
$0
$0
$0
$0
$0
$0
Su
btot
al
$2,8
83,6
21
$5,5
43,4
99
$8,8
67,8
92
$21,
656,
436
$40,
989,
453
$58,
400,
594
$75,
554,
413
Con
tract
or O
verh
ead
& P
rofit
(15%
) $4
32,5
43
$831
,525
$1
,330
,184
$3
,248
,465
$6
,148
,418
$8
,760
,089
$1
1,33
3,16
2 Sc
ope-
of-P
roje
ct C
ontin
genc
y (3
0%)
$865
,086
$1
,663
,050
$2
,660
,368
$6
,496
,931
$1
2,29
6,83
6 $1
7,52
0,17
8 $2
2,66
6,32
4
To
tal C
onst
ruct
ion
Cos
t $4
,181
,251
$8
,038
,074
$1
2,85
8,44
3 $3
1,40
1,83
3 $5
9,43
4,70
7 $8
4,68
0,86
2 $1
09,5
53,8
99
Engi
neer
ing
Des
ign
(10%
) $4
18,1
25
$803
,807
$1
,285
,844
$3
,140
,183
$5
,943
,471
$8
,468
,086
$1
0,95
5,39
0 TO
TAL
CA
PITA
L C
OST
$4
,599
,376
$8
,841
,881
$1
4,14
4,28
7 $3
4,54
2,01
6 $6
5,37
8,17
8 $9
3,14
8,94
8 $1
20,5
09,2
89
Cos
t per
gal
($)
$9.2
0 $8
.84
$7.0
7 $6
.91
$6.5
4 $6
.21
$6.0
3
O
&M
(5%
Con
stru
ctio
n C
ost)
$209
,063
$4
01,9
04
$642
,922
$1
,570
,092
$2
,971
,735
$4
,234
,043
$5
,477
,695
1 E
quip
men
t cos
ts p
rovi
ded
by A
qua
Aer
obic
s.

Wat
eReu
se F
ound
atio
n 63
Tab
le B
-10.
Aqu
a A
erob
ics M
BR
(CA
Titl
e 22
)
Exp
ense
Cos
t per
Am
ount
of F
low
(mgd
)
0.5
1.0
2.0
5.0
10
15
20
Con
cret
e $6
10,4
00
$1,0
62,4
00
$2,0
12,0
00
$4,7
22,4
00
$9,6
84,8
00
$13,
448,
800
$19,
054,
400
Exca
vatio
n an
d B
ackf
ill (1
0%)
$61,
040
$106
,240
$2
01,2
00
$472
,240
$9
68,4
80
$1,3
44,8
80
$1,9
05,4
40
Mis
cella
neou
s Met
als (
4%)
$24,
416
$42,
496
$80,
480
$188
,896
$3
87,3
92
$537
,952
$7
62,1
76
Yar
d Pi
ping
(7%
) $4
2,72
8 $7
4,36
8 $1
40,8
40
$330
,568
$6
77,9
36
$941
,416
$1
,333
,808
To
tal C
oncr
ete
$738
,584
$1
,285
,504
$2
,434
,520
$5
,714
,104
$1
1,71
8,60
8 $1
6,27
3,04
8 $2
3,05
5,82
4
Equi
pmen
t1 $1
,000
,000
$2
,000
,000
$2
,900
,000
$8
,000
,000
$1
4,50
0,00
0 $2
0,50
0,00
0 $2
6,00
0,00
0 Ta
x an
d D
eliv
ery
(11%
) $1
10,0
00
$220
,000
$3
19,0
00
$880
,000
$1
,595
,000
$2
,255
,000
$2
,860
,000
In
stal
latio
n (2
0%)
$200
,000
$4
00,0
00
$580
,000
$1
,600
,000
$2
,900
,000
$4
,100
,000
$5
,200
,000
M
anuf
actu
rer S
ervi
ces (
4%)
$40,
000
$80,
000
$116
,000
$3
20,0
00
$580
,000
$8
20,0
00
$1,0
40,0
00
Tota
l Mec
hani
cal
$1,3
50,0
00
$2,7
00,0
00
$3,9
15,0
00
$10,
800,
000
$19,
575,
000
$27,
675,
000
$35,
100,
000
Prot
ectiv
e C
oatin
g (7
%)
$146
,201
$2
78,9
85
$444
,466
$1
,155
,987
$2
,190
,553
$3
,076
,363
$4
,070
,908
El
ectri
city
(10%
) $2
08,8
58
$398
,550
$6
34,9
52
$1,6
51,4
10
$3,1
29,3
61
$4,3
94,8
05
$5,8
15,5
82
Inst
rum
enta
tion
(10%
) $2
08,8
58
$398
,550
$6
34,9
52
$1,6
51,4
10
$3,1
29,3
61
$4,3
94,8
05
$5,8
15,5
82
Hou
sing
$0
$0
$0
$0
$0
$0
$0
Su
btot
al
$2,6
52,5
02
$5,0
61,5
90
$8,0
63,8
90
$20,
972,
912
$39,
742,
882
$55,
814,
021
$73,
857,
896
Con
tract
or O
verh
ead
& P
rofit
(15%
) $3
97,8
75
$759
,239
$1
,209
,584
$3
,145
,937
$5
,961
,432
$8
,372
,103
$1
1,07
8,68
4 Sc
ope-
of-P
roje
ct C
ontin
genc
y (3
0%)
$795
,751
$1
,518
,477
$2
,419
,167
$6
,291
,874
$1
1,92
2,86
5 $1
6,74
4,20
6 $2
2,15
7,36
9
To
tal C
onst
ruct
ion
Cos
t $3
,846
,127
$7
,339
,306
$1
1,69
2,64
1 $3
0,41
0,72
3 $5
7,62
7,17
9 $8
0,93
0,33
0 $1
07,0
93,9
50
Engi
neer
ing
Des
ign
(10%
) $3
84,6
13
$733
,931
$1
,169
,264
$3
,041
,072
$5
,762
,718
$8
,093
,033
$1
0,70
9,39
5 TO
TAL
CA
PITA
L C
OST
$4
,230
,740
$8
,073
,236
$1
2,86
1,90
5 $3
3,45
1,79
5 $6
3,38
9,89
7 $8
9,02
3,36
3 $1
17,8
03,3
45
Cos
t per
gal
($)
$8.4
6 $8
.07
$6.4
3 $6
.69
$6.3
4 $5
.93
$5.8
9
O
&M
(5%
Con
stru
ctio
n C
ost)
$192
,306
$3
66,9
65
$584
,632
$1
,520
,536
$2
,881
,359
$4
,046
,517
$5
,354
,697
1 E
quip
men
t cos
ts p
rovi
ded
by A
qua
Aer
obic
s.
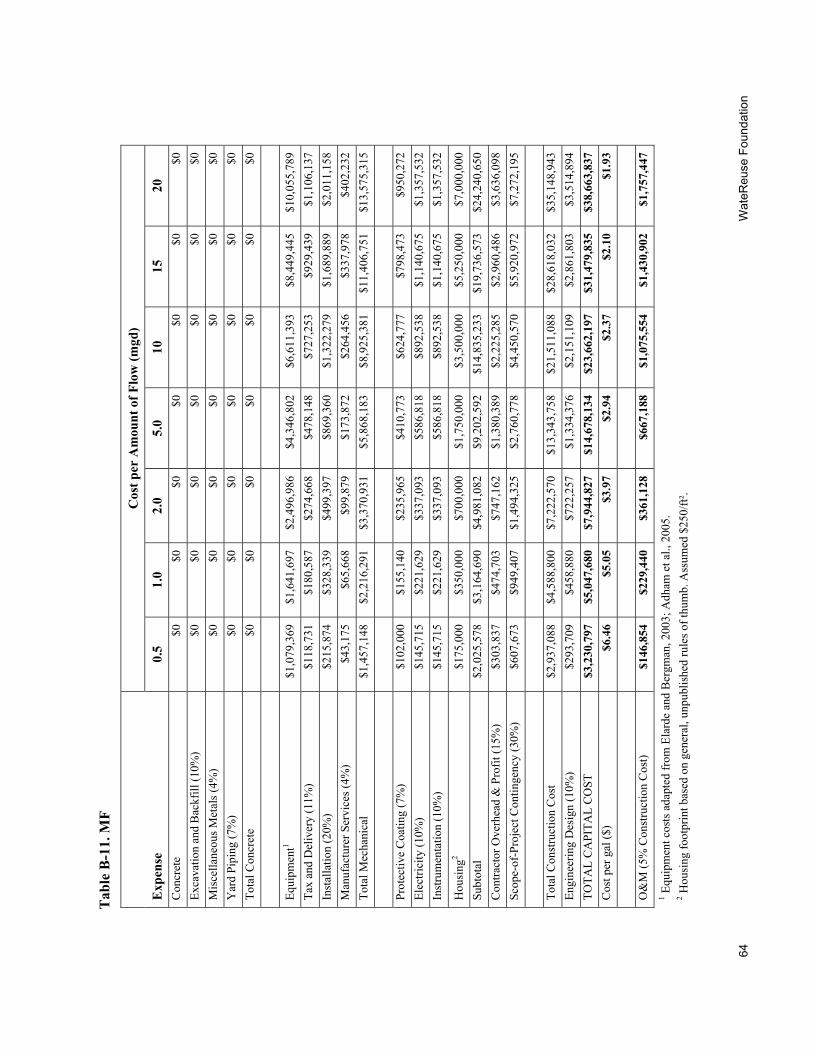
64
Wat
eReu
se F
ound
atio
n
Tab
le B
-11.
MF
Exp
ense
Cos
t per
Am
ount
of F
low
(mgd
)
0.5
1.0
2.0
5.0
10
15
20
Con
cret
e $0
$0
$0
$0
$0
$0
$0
Ex
cava
tion
and
Bac
kfill
(10%
) $0
$0
$0
$0
$0
$0
$0
M
isce
llane
ous M
etal
s (4%
) $0
$0
$0
$0
$0
$0
$0
Y
ard
Pipi
ng (7
%)
$0
$0
$0
$0
$0
$0
$0
Tota
l Con
cret
e $0
$0
$0
$0
$0
$0
$0
Equi
pmen
t1 $1
,079
,369
$1
,641
,697
$2
,496
,986
$4
,346
,802
$6
,611
,393
$8
,449
,445
$1
0,05
5,78
9 Ta
x an
d D
eliv
ery
(11%
) $1
18,7
31
$180
,587
$2
74,6
68
$478
,148
$7
27,2
53
$929
,439
$1
,106
,137
In
stal
latio
n (2
0%)
$215
,874
$3
28,3
39
$499
,397
$8
69,3
60
$1,3
22,2
79
$1,6
89,8
89
$2,0
11,1
58
Man
ufac
ture
r Ser
vice
s (4%
) $4
3,17
5 $6
5,66
8 $9
9,87
9 $1
73,8
72
$264
,456
$3
37,9
78
$402
,232
To
tal M
echa
nica
l $1
,457
,148
$2
,216
,291
$3
,370
,931
$5
,868
,183
$8
,925
,381
$1
1,40
6,75
1 $1
3,57
5,31
5
Pr
otec
tive
Coa
ting
(7%
) $1
02,0
00
$155
,140
$2
35,9
65
$410
,773
$6
24,7
77
$798
,473
$9
50,2
72
Elec
trici
ty (1
0%)
$145
,715
$2
21,6
29
$337
,093
$5
86,8
18
$892
,538
$1
,140
,675
$1
,357
,532
In
stru
men
tatio
n (1
0%)
$145
,715
$2
21,6
29
$337
,093
$5
86,8
18
$892
,538
$1
,140
,675
$1
,357
,532
Hou
sing
2 $1
75,0
00
$350
,000
$7
00,0
00
$1,7
50,0
00
$3,5
00,0
00
$5,2
50,0
00
$7,0
00,0
00
Subt
otal
$2
,025
,578
$3
,164
,690
$4
,981
,082
$9
,202
,592
$1
4,83
5,23
3 $1
9,73
6,57
3 $2
4,24
0,65
0 C
ontra
ctor
Ove
rhea
d &
Pro
fit (1
5%)
$303
,837
$4
74,7
03
$747
,162
$1
,380
,389
$2
,225
,285
$2
,960
,486
$3
,636
,098
Sc
ope-
of-P
roje
ct C
ontin
genc
y (3
0%)
$607
,673
$9
49,4
07
$1,4
94,3
25
$2,7
60,7
78
$4,4
50,5
70
$5,9
20,9
72
$7,2
72,1
95
Tota
l Con
stru
ctio
n C
ost
$2,9
37,0
88
$4,5
88,8
00
$7,2
22,5
70
$13,
343,
758
$21,
511,
088
$28,
618,
032
$35,
148,
943
Engi
neer
ing
Des
ign
(10%
) $2
93,7
09
$458
,880
$7
22,2
57
$1,3
34,3
76
$2,1
51,1
09
$2,8
61,8
03
$3,5
14,8
94
TOTA
L C
API
TAL
CO
ST
$3,2
30,7
97
$5,0
47,6
80
$7,9
44,8
27
$14,
678,
134
$23,
662,
197
$31,
479,
835
$38,
663,
837
Cos
t per
gal
($)
$6.4
6 $5
.05
$3.9
7 $2
.94
$2.3
7 $2
.10
$1.9
3
O
&M
(5%
Con
stru
ctio
n C
ost)
$146
,854
$2
29,4
40
$361
,128
$6
67,1
88
$1,0
75,5
54
$1,4
30,9
02
$1,7
57,4
47
1 Equ
ipm
ent c
osts
ada
pted
from
Ela
rde
and
Ber
gman
, 200
3; A
dham
et a
l., 2
005.
2 H
ousi
ng fo
otpr
int b
ased
on
gene
ral,
unpu
blis
hed
rule
s of t
hum
b. A
ssum
ed $
250/
ft².

Wat
eReu
se F
ound
atio
n 65
Tab
le B
-12.
RO
Exp
ense
Cos
t per
Am
ount
of F
low
(mgd
)
0.5
1.0
2.0
5.0
10
15
20
Con
cret
e $0
$0
$0
$0
$0
$0
$0
Ex
cava
tion
and
Bac
kfill
(10%
) $0
$0
$0
$0
$0
$0
$0
M
isce
llane
ous M
etal
s (4%
) $0
$0
$0
$0
$0
$0
$0
Y
ard
Pipi
ng (7
%)
$0
$0
$0
$0
$0
$0
$0
Tota
l Con
cret
e $0
$0
$0
$0
$0
$0
$0
Equi
pmen
t1 $7
70,0
00
$1,1
10,0
00
$1,6
10,0
00
$2,6
10,0
00
$3,7
80,0
00
$4,6
80,0
00
$5,4
50,0
00
Tax
and
Del
iver
y (1
1%)
$84,
700
$122
,100
$1
77,1
00
$287
,100
$4
15,8
00
$514
,800
$5
99,5
00
Inst
alla
tion
(20%
) $1
54,0
00
$222
,000
$3
22,0
00
$522
,000
$7
56,0
00
$936
,000
$1
,090
,000
M
anuf
actu
rer S
ervi
ces (
4%)
$30,
800
$44,
400
$64,
400
$104
,400
$1
51,2
00
$187
,200
$2
18,0
00
Tota
l Mec
hani
cal
$1,0
39,5
00
$1,4
98,5
00
$2,1
73,5
00
$3,5
23,5
00
$5,1
03,0
00
$6,3
18,0
00
$7,3
57,5
00
Prot
ectiv
e C
oatin
g (7
%)
$72,
765
$104
,895
$1
52,1
45
$246
,645
$3
57,2
10
$442
,260
$5
15,0
25
Elec
trici
ty (1
0%)
$103
,950
$1
49,8
50
$217
,350
$3
52,3
50
$510
,300
$6
31,8
00
$735
,750
In
stru
men
tatio
n (1
0%)
$103
,950
$1
49,8
50
$217
,350
$3
52,3
50
$510
,300
$6
31,8
00
$735
,750
Hou
sing
2 $2
10,0
00
$420
,000
$8
40,0
00
$2,1
00,0
00
$4,2
00,0
00
$6,3
00,0
00
$8,4
00,0
00
Subt
otal
$1
,530
,165
$2
,323
,095
$3
,600
,345
$6
,574
,845
$1
0,68
0,81
0 $1
4,32
3,86
0 $1
7,74
4,02
5 C
ontra
ctor
Ove
rhea
d &
Pro
fit (1
5%)
$229
,525
$3
48,4
64
$540
,052
$9
86,2
27
$1,6
02,1
22
$2,1
48,5
79
$2,6
61,6
04
Scop
e-of
-Pro
ject
Con
tinge
ncy
(30%
) $4
59,0
50
$696
,929
$1
,080
,104
$1
,972
,454
$3
,204
,243
$4
,297
,158
$5
,323
,208
To
tal C
onst
ruct
ion
Cos
t $2
,218
,739
$3
,368
,488
$5
,220
,500
$9
,533
,525
$1
5,48
7,17
5 $2
0,76
9,59
7 $2
5,72
8,83
6 En
gine
erin
g D
esig
n (1
0%)
$221
,874
$3
36,8
49
$522
,050
$9
53,3
53
$1,5
48,7
17
$2,0
76,9
60
$2,5
72,8
84
TOTA
L C
API
TAL
CO
ST
$2,4
40,6
13
$3,7
05,3
37
$5,7
42,5
50
$10,
486,
878
$17,
035,
892
$22,
846,
557
$28,
301,
720
Cos
t per
gal
($)
$4.8
8 $3
.71
$2.8
7 $2
.10
$1.7
0 $1
.52
$1.4
2
O
&M
(5%
Con
stru
ctio
n C
ost)
$110
,937
$1
68,4
24
$261
,025
$4
76,6
76
$774
,359
$1
,038
,480
$1
,286
,442
1 E
quip
men
t cos
ts a
dapt
ed fr
om E
lard
e an
d B
ergm
an, 2
003;
Adh
am e
t al.,
200
5.
2 Hou
sing
foot
prin
t bas
ed o
n ge
nera
l, un
publ
ishe
d ru
les o
f thu
mb.
Ass
umed
$25
0/ft²
.

66
Wat
eReu
se F
ound
atio
n
Tab
le B
-13.
Filt
ratio
n
Exp
ense
Cos
t per
Am
ount
of F
low
(mgd
)
0.5
1.0
2.0
5.0
10
15
20
Con
cret
e $8
8,80
0 $1
20,3
76
$171
,406
$2
82,6
43
$466
,206
$5
58,7
43
$743
,428
Ex
cava
tion
and
Bac
kfill
(10%
) $8
880
$12,
038
$17,
141
$28,
264
$46,
621
$55,
874
$74,
343
Mis
cella
neou
s Met
als (
4%)
$355
2 $4
815
$685
6 $1
1,30
6 $1
8,64
8 $2
2,35
0 $2
9,73
7 Y
ard
Pipi
ng (7
%)
$621
6 $8
426
$11,
998
$19,
785
$32,
634
$39,
112
$52,
040
Tota
l Con
cret
e $1
07,4
48
$145
,655
$2
07,4
01
$341
,998
$5
64,1
09
$676
,079
$8
99,5
48
Equi
pmen
t1, 2
$181
,303
$1
93,4
98
$214
,085
$2
63,8
76
$394
,212
$4
31,0
61
$565
,437
Ta
x an
d D
eliv
ery
(11%
) $1
9,94
3 $2
1,28
5 $2
3,54
9 $2
9,02
6 $4
3,36
3 $4
7,41
7 $6
2,19
8 In
stal
latio
n (2
0%)
$36,
261
$38,
700
$42,
817
$52,
775
$78,
842
$86,
212
$113
,087
M
anuf
actu
rer S
ervi
ces (
4%)
$725
2 $7
740
$856
3 $1
0,55
5 $1
5,76
8 $1
7,24
2 $2
2,61
7 To
tal M
echa
nica
l $2
44,7
59
$261
,222
$2
89,0
15
$356
,233
$5
32,1
86
$581
,932
$7
63,3
40
Prot
ectiv
e C
oatin
g (7
%)
$24,
654
$28,
481
$34,
749
$48,
876
$76,
741
$88,
061
$116
,402
El
ectri
city
(10%
) $3
5,22
1 $4
0,68
8 $4
9,64
2 $6
9,82
3 $1
09,6
30
$125
,801
$1
66,2
89
Inst
rum
enta
tion
(10%
) $3
5,22
1 $4
0,68
8 $4
9,64
2 $6
9,82
3 $1
09,6
30
$125
,801
$1
66,2
89
Hou
sing
$0
$0
$0
$0
$0
$0
$0
Su
btot
al
$447
,303
$5
16,7
34
$630
,448
$8
86,7
53
$1,3
92,2
95
$1,5
97,6
74
$2,1
11,8
68
Con
tract
or O
verh
ead
& P
rofit
(15%
) $6
7,09
5 $7
7,51
0 $9
4,56
7 $1
33,0
13
$208
,844
$2
39,6
51
$316
,780
Sc
ope-
of-P
roje
ct C
ontin
genc
y (3
0%)
$134
,191
$1
55,0
20
$189
,134
$2
66,0
26
$417
,689
$4
79,3
02
$633
,560
To
tal C
onst
ruct
ion
Cos
t $6
48,5
89
$749
,264
$9
14,1
50
$1,2
85,7
92
$2,0
18,8
28
$2,3
16,6
28
$3,0
62,2
08
Engi
neer
ing
Des
ign
(10%
) $6
4,85
9 $7
4,92
6 $9
1,41
5 $1
28,5
79
$201
,883
$2
31,6
63
$306
,221
TO
TAL
CA
PITA
L C
OST
$7
13,4
48
$824
,191
$1
,005
,565
$1
,414
,371
$2
,220
,711
$2
,548
,291
$3
,368
,429
C
ost p
er g
al ($
) $1
.43
$0.8
2 $0
.50
$0.2
8 $0
.22
$0.1
7 $0
.17
O&
M (5
% C
onst
ruct
ion
Cos
t) $3
2,42
9 $3
7,46
3 $4
5,70
8 $6
4,29
0 $1
00,9
41
$115
,831
$1
53,1
10
1 Ave
rage
cos
t use
d fo
r filt
ratio
n eq
uipm
ent [
Ox
and
SBR
for T
itle
22 (C
alifo
rnia
) and
Cla
ss A
+ (A
rizon
a) re
quire
men
ts].
2 Cos
t of e
quip
men
t inc
lude
d th
e co
st o
f fib
ergl
ass-
rein
forc
ed p
last
ic (F
RP)
tank
s and
met
erin
g pu
mp
skid
for a
lum
and
cat
ioni
c po
lym
er
(Aug
usta
Fib
ergl
ass b
udge
t).

Wat
eReu
se F
ound
atio
n 67
Tab
le B
-14.
Dis
infe
ctio
n (A
Z)
Exp
ense
Cos
t per
Am
ount
of F
low
(mgd
)
0.5
1.0
2.0
5.0
10
15
20
Con
cret
e1 $4
3,85
2 $7
1,94
1 $1
02,2
17
$184
,474
$2
78,4
00
$336
,593
$3
88,4
35
Exca
vatio
n an
d B
ackf
ill (1
0%)
$438
5 $7
194
$10,
222
$18,
447
$27,
840
$33,
659
$38,
843
Mis
cella
neou
s Met
als (
4%)
$175
4 $2
878
$408
9 $7
379
$11,
136
$13,
464
$15,
537
Yar
d Pi
ping
(7%
) $3
070
$503
6 $7
155
$12,
913
$19,
488
$23,
561
$27,
190
Tota
l Con
cret
e $5
3,06
1 $8
7,04
8 $1
23,6
83
$223
,214
$3
36,8
64
$407
,277
$4
70,0
06
Equi
pmen
t2 $1
4,97
9 $1
5,68
2 $1
7,03
4 $1
9,88
7 $2
3,12
6 $2
8,34
7 $4
4,11
8 Ta
x an
d D
eliv
ery
(11%
) $1
648
$172
5 $1
874
$218
8 $2
544
$311
8 $4
853
Inst
alla
tion
(20%
) $2
996
$313
6 $3
407
$397
7 $4
625
$566
9 $8
824
Man
ufac
ture
r Ser
vice
s (4%
) $5
99
$627
$6
81
$795
$9
25
$113
4 $1
765
Tota
l Mec
hani
cal
$20,
222
$21,
171
$22,
996
$26,
847
$31,
220
$38,
268
$59,
559
Prot
ectiv
e C
oatin
g (7
%)
$513
0 $7
575
$10,
268
$17,
504
$25,
766
$31,
188
$37,
070
Elec
trici
ty (1
0%)
$732
8 $1
0,82
2 $1
4,66
8 $2
5,00
6 $3
6,80
8 $4
4,55
5 $5
2,95
7 In
stru
men
tatio
n (1
0%)
$732
8 $1
0,82
2 $1
4,66
8 $2
5,00
6 $3
6,80
8 $4
4,55
5 $5
2,95
7 H
ousi
ng
$0
$0
$0
$0
$0
$0
$0
Subt
otal
$9
3,06
9 $1
37,4
38
$186
,282
$3
17,5
78
$467
,467
$5
65,8
43
$672
,548
C
ontra
ctor
Ove
rhea
d &
Pro
fit (1
5%)
$13,
960
$20,
616
$27,
942
$47,
637
$70,
120
$84,
876
$100
,882
Sc
ope-
of-P
roje
ct C
ontin
genc
y (3
0%)
$27,
921
$41,
231
$55,
885
$95,
273
$140
,240
$1
69,7
53
$201
,764
To
tal C
onst
ruct
ion
Cos
t $1
34,9
50
$199
,285
$2
70,1
09
$460
,487
$6
77,8
27
$820
,472
$9
75,1
94
Engi
neer
ing
Des
ign
(10%
) $1
3,49
5 $1
9,92
9 $2
7,01
1 $4
6,04
9 $6
7,78
3 $8
2,04
7 $9
7,51
9 TO
TAL
CA
PITA
L C
OST
$1
48,4
44
$219
,214
$2
97,1
20
$506
,536
$7
45,6
10
$902
,519
$1
,072
,714
C
ost p
er g
al ($
) $0
.30
$0.2
2 $0
.15
$0.1
0 $0
.07
$0.0
6 $0
.05
O&
M (5
% C
onst
ruct
ion
Cos
t) $6
747
$996
4 $1
3,50
5 $2
3,02
4 $3
3,89
1 $4
1,02
4 $4
8,76
0 1 C
oncr
ete
cost
is b
ased
on
aver
age
cont
act t
ime
for A
rizon
a an
d C
alifo
rnia
SB
R, O
x, a
nd M
BR
. 2 E
quip
men
t cos
t inc
lude
s the
cos
t of t
he c
hem
ical
syst
em in
whi
ch o
nly
FRP
tank
s and
met
erin
g pu
mp
skid
syst
em a
re e
stim
ated
for
Ariz
ona
and
Cal
iforn
ia (A
ugus
ta F
iber
glas
s).

68
Wat
eReu
se F
ound
atio
n
Tab
le B
-15.
Dis
infe
ctio
n (C
A)
Exp
ense
Cos
t per
Am
ount
of F
low
(mgd
)
0.5
1.0
2.0
5.0
10
15
20
Con
cret
e1 $1
19,8
72
$227
,916
$2
95,2
00
$491
,674
$7
72,0
30
$856
,583
$9
55,5
31
Exca
vatio
n an
d B
ackf
ill (1
0%)
$11,
987
$22,
792
$29,
520
$49,
167
$77,
203
$85,
658
$95,
553
Mis
cella
neou
s Met
als (
4%)
$479
5 $9
117
$11,
808
$19,
667
$30,
881
$34,
263
$38,
221
Yar
d Pi
ping
(7%
) $8
391
$15,
954
$20,
664
$34,
417
$54,
042
$59,
961
$66,
887
Tota
l Con
cret
e $1
45,0
45
$275
,778
$3
57,1
92
$594
,926
$9
34,1
56
$1,0
36,4
65
$1,1
56,1
92
Equi
pmen
t2 $1
4,97
9 $1
5,68
2 $1
7,03
4 $1
9,88
7 $2
3,12
6 $2
8,34
7 $4
4,11
8 Ta
x an
d D
eliv
ery
(11%
) $1
648
$172
5 $1
874
$218
8 $2
544
$311
8 $4
853
Inst
alla
tion
(20%
) $2
996
$313
6 $3
407
$397
7 $4
625
$566
9 $8
824
Man
ufac
ture
r Ser
vice
s (4%
) $5
99
$627
$6
81
$795
$9
25
$113
4 $1
765
Tota
l Mec
hani
cal
$20,
222
$21,
171
$22,
996
$26,
847
$31,
220
$38,
268
$59,
559
Prot
ectiv
e C
oatin
g (7
%)
$11,
569
$20,
786
$26,
613
$43,
524
$67,
576
$75,
231
$85,
103
Elec
trici
ty (1
0%)
$16,
527
$29,
695
$38,
019
$62,
177
$96,
538
$107
,473
$1
21,5
75
Inst
rum
enta
tion
(10%
) $1
6,52
7 $2
9,69
5 $3
8,01
9 $6
2,17
7 $9
6,53
8 $1
07,4
73
$121
,575
H
ousi
ng
$0
$0
$0
$0
$0
$0
$0
Subt
otal
$2
09,8
88
$377
,125
$4
82,8
39
$789
,652
$1
,226
,027
$1
,364
,912
$1
,544
,005
C
ontra
ctor
Ove
rhea
d &
Pro
fit (1
5%)
$31,
483
$56,
569
$72,
426
$118
,448
$1
83,9
04
$204
,737
$2
31,6
01
Scop
e-of
-Pro
ject
Con
tinge
ncy
(30%
) $6
2,96
6 $1
13,1
38
$144
,852
$2
36,8
96
$367
,808
$4
09,4
73
$463
,201
To
tal C
onst
ruct
ion
Cos
t $3
04,3
38
$546
,832
$7
00,1
16
$1,1
44,9
95
$1,7
77,7
40
$1,9
79,1
22
$2,2
38,8
07
Engi
neer
ing
Des
ign
(10%
) $3
0,43
4 $5
4,68
3 $7
0,01
2 $1
14,5
00
$177
,774
$1
97,9
12
$223
,881
TO
TAL
CA
PITA
L C
OST
$3
34,7
72
$601
,515
$7
70,1
28
$1,2
59,4
95
$1,9
55,5
14
$2,1
77,0
34
$2,4
62,6
87
Cos
t per
gal
($)
$0.6
7 $0
.60
$0.3
9 $0
.25
$0.2
0 $0
.15
$0.1
2
O
&M
(5%
Con
stru
ctio
n C
ost)
$15,
217
$27,
342
$35,
006
$57,
250
$88,
887
$98,
956
$111
,940
1 C
oncr
ete
cost
is b
ased
on
aver
age
cont
act t
ime
for A
rizon
a an
d C
alifo
rnia
SB
R, O
x, a
nd M
BR
. 2 E
quip
men
t cos
t inc
lude
s the
cos
t of t
he c
hem
ical
syst
em in
whi
ch o
nly
FRP
tank
s and
met
erin
g pu
mp
skid
syst
em a
re e
stim
ated
for A
rizon
a an
d C
alifo
rnia
(Aug
usta
Fib
ergl
ass)
.

1199 North Fairfax Street, Suite 410
Alexandria, VA 22314 USA
(703) 548-0880
Fax (703) 548-5085
E-mail: [email protected]
www.WateReuse.org/Foundation
Advancing the Science ofWater Reuse and Desalination
![hey my web app is slow wheres the problemcarehart.org/presentations/hey_my_web_app_is_slow_wheres_the_problem.pdf, Z>/ Z , Zd U Z , Zd , Z>/ Z , Zd XKZ' } µ Z o ] Z , Z>/ Z , Zd U](https://img.pdfslide.us/doc/110x75/5f8b29c49f15817f370a5fc5/hey-my-web-app-is-slow-wheres-the-z-z-zd-u-z-zd-z-z-zd-xkz.jpg)


![patriotic hygiene 2013 Cosponsored by UNC's - [email protected]](https://img.pdfslide.us/doc/110x75/620495b54b1be21e4726f6d2/patriotic-hygiene-2013-cosponsored-by-uncs-emailprotected.jpg)