Embed Size (px)
Citation preview
© 2006 University of New Hampshire InterOperability Laboratory
DSL Consortium
ADSL2 Electrical Characteristics Conformance Test Suite
(A2EC) Version 1.6.5
Last Updated: December 06, 2007
DSL Consortium 121 Technology Drive, Suite 2 University of New Hampshire Durham, NH 03824 InterOperability Laboratory Phone: +1-603-862-2911 Fax: +1-603-862-4181
www.iol.unh.edu
The University of New Hampshire InterOperability Laboratory
DSL Consortium ADSL2 Electrical Characteristics
Conformance Test Suite v 1.6.4 ii
Modification Report Version Date Editor(s) Comments 1.6.5 December 6, 2007 Tyler Clark Changed Table 1 of Group 3 1.6.4 November 21, 2006 Tyler Clark Changed Test Setup 3 Figure.
1.6.3 November 7, 2006 Jonathan Tefft Removed all references to “Research Computing Center.”
1.6.2 October 23, 2006 Tyler Clark
Modified Group 3, Input Impedance test • Capacitance range test metric now
mandatory • End of frequency range input
impedance test metric removed
1.6.1 September 8, 2006 Tim Clark
Changed high stop frequencies in Tables A-1 through A-3 to 11.04 MHz for G.992.3 and G.992.4 and 12 MHz for G.992.5; Corrected PSD procedure to generalize the measurement frequencies
1.6.0 August 14, 2006 Tim Clark
Add mask number info to Appendix C for Annex J & M masks; Changed Appendix B dealing with longitudinal balance hardware; Added info to Appendix A regarding measurement frequencies and filters used for PSD test for all annexes; Updated test setup figures; Removed background section
1.5.0 July 26, 2006 Tim Clark
Added Annex B input impedance test; changed input impedance metric for other annexes in accordance with changes to standard
1.4.1 March 29, 2006 Matthew Langlois Editorial updates 1.4 March 1, 2006 Tim Clark Removed Test 4
1.3 October 4, 2005 Tim Clark Changed ADSL consortium to DSL consortium
1.2 February 24, 2005 Tim Clark Added PSD masks for annexes JL&M; removed tests that call for injection of DC current
1.1 February 23, 2005 Lincoln Lavoie Minor corrections, added PSD mask for G.992.3 Annex M.
1.0 February 22, 2005 Tim Clark Creation of document.
The University of New Hampshire InterOperability Laboratory
DSL Consortium ADSL2 Electrical Characteristics
Conformance Test Suite v 1.6.4 iii
Acknowledgments The University of New Hampshire would like to acknowledge the efforts of the following individuals in the development of this test suite. Tim Clark University of New Hampshire Lincoln Lavoie University of New Hampshire Matthew Langlois University of New Hampshire
The University of New Hampshire InterOperability Laboratory
DSL Consortium ADSL2 Electrical Characteristics
Conformance Test Suite v 1.6.4 iv
Table of Contents
Modification Report....................................................................................................................................... ii Acknowledgments ......................................................................................................................................... iii Table of Contents...........................................................................................................................................iv Introduction ....................................................................................................................................................v References.....................................................................................................................................................vii Terms, Definitions and Abbreviations ....................................................................................................... viii Test Setups ..................................................................................................................................................... x Test Applicability ......................................................................................................................................... xii Group 1: Transmit Power Tests ................................................................................................................... 1
Group A2EC.1: Transmit Power Tests................................................................................................. 2 Group 2: Longitudinal Balance Tests.......................................................................................................... 4
Group A2EC.2: Longitudinal Balance Tests......................................................................................... 5 Group 3: Input Impedance Tests ................................................................................................................. 7
Group A2EC.3: Input Impedance Tests ................................................................................................ 8 Appendix A: PSD Measurement Hardware................................................................................................ 10 Appendix A: PSD Measurement Hardware................................................................................................ 10 Appendix B: Longitudinal Balance Measurement Hardware ................................................................... 14 Appendix C: PSD Masks ............................................................................................................................. 15
The University of New Hampshire InterOperability Laboratory
DSL Consortium ADSL2 Electrical Characteristics
Conformance Test Suite v 1.6.4 v
Introduction Overview
The University of New Hampshire’s InterOperability Laboratory (UNH-IOL) is an institution designed to improve the interoperability of standards based products by providing an environment where a product can be tested against other implementations of a standard. This suite of tests has been developed to help implementers evaluate the functioning of their ADSL implementations.
The tests do not determine if a product conforms to the specifications, nor are they purely interoperability tests. Rather, they provide a method to isolate problems within a device. Successful completion of all tests contained in this suite does not guarantee that the tested device will operate with other devices. However, these tests provide a reasonable level of confidence that the device under test will function well in most multi-vendor environments.
Organization of Tests: Each test contains an identification section that describes the test and provides cross-reference information. The discussion section covers background information and specifies why the test is to be performed. Tests are grouped in order to reduce setup time in the lab environment. Each test contains the following information:
Test number The Test Number associated with each test follows a simple grouping structure. Listed first is the Test Group Number followed by the test's number within the group. This allows for the addition of future tests to the appropriate groups of the test suite without requiring the renumbering of the subsequent tests. Purpose The purpose is a brief statement outlining what the test attempts to achieve. This also includes background information on why one needs to perform such a test to show that the device complies with the standard. References The references section lists standards and other documentation that might be helpful in understanding and evaluating the test and results. Resource requirements The requirements section specifies the hardware, and test equipment that will be needed to perform the test. The items contained in this section are special test devices or other facilities, which may not be available on all devices. Last modification This specifies the date of the last modification to this test. Test setup The setup section describes the configuration of the test environment. Small changes in the configuration should be included in the test procedure. Discussion The discussion section is optional. It is a general discussion of the test and relevant section of the specification, including any assumptions made in the design or implementation of the test as well as known limitations. Procedure The procedure section of the test description contains the step-by-step instructions for carrying out the test. It provides a cookbook approach to testing, and may be interspersed with test metrics.
The University of New Hampshire InterOperability Laboratory
DSL Consortium ADSL2 Electrical Characteristics
Conformance Test Suite v 1.6.4 vi
Test metrics The test metrics section lists occurring events that can be examined by the tester to verify that the DUT is operating properly. When multiple values are possible for a specific event, this section provides a short discussion on how to interpret them. The determination of passing or failing a certain test is often based on the successful (or unsuccessful) detection of a certain predetermined event.
The University of New Hampshire InterOperability Laboratory
DSL Consortium ADSL2 Electrical Characteristics
Conformance Test Suite v 1.6.4 vii
References
[1] International Telecommunication Union Standardization Sector (ITU-T). Series G: Transmission Systems and Media, Digital Systems and Networks: Digital section and digital line system – Access networks. Asymmetric digital subscriber line (ADSL) transceivers – 2 (ADSL2), ITU-T Recommendation G.992.3, July 2002.
[2] International Telecommunication Union Standardization Sector (ITU-T). Series G: Transmission
Systems and Media, Digital Systems and Networks: Digital section and digital line system – Access networks. Asymmetric digital subscriber line (ADSL) transceivers – 2 (splitterless ADSL2), ITU-T Recommendation G.992.4, July 2002.
[3] International Telecommunication Union Standardization Sector (ITU-T). Series G: Transmission
Systems and Media, Digital Systems and Networks: Digital section and digital line system – Access networks. Asymmetric digital subscriber line (ADSL) transceivers – 2 (ADSL2+), ITU-T Recommendation G.992.5, May 2003.
[4] American National Standards Institute (ANSI). American National Standard for
Telecommunications: Spectrum Management for Loop Transmission Systems, ANSI specification T1.417-2001, January 2001.
[5] Walsh, Peter (Paradyne). Telecommunications Industry Association Committee. “Proposed
Appendix to TSB-31C to Facilitate ADSL Signal Power and PSD Testing.” TR41.9-01-05-021, May 2001.
[6] Agilent 4395A Network/Spectrum/Impedance Analyzer Operation Manual. Agilent Technologies,
March 2000.
[7] Liang Chi Shen and Jin Au Kong, Applied Electromagnetism, Third Edition. PWS Publishing, 1987.
[8] International Telecommunication Union Standardization Sector (ITU-T). Series G: Transmission
Systems and Media, Digital Systems and Networks: Digital section and digital line system – Access networks. Asymmetric digital subscriber line (ADSL) transceivers – 2 (ADSL2), ITU-T Recommendation G.992.3 Amendment 2, March 2006.
The University of New Hampshire InterOperability Laboratory
DSL Consortium ADSL2 Electrical Characteristics
Conformance Test Suite v 1.6.4 viii
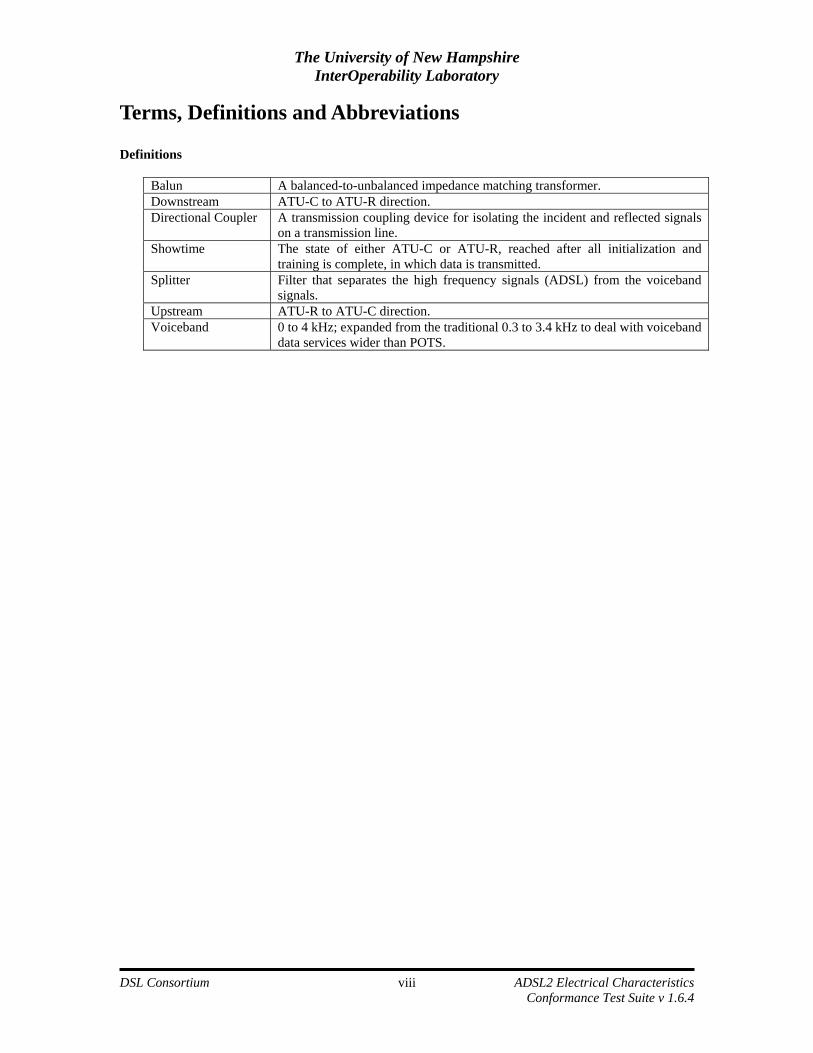
Terms, Definitions and Abbreviations Definitions
Balun A balanced-to-unbalanced impedance matching transformer. Downstream ATU-C to ATU-R direction. Directional Coupler A transmission coupling device for isolating the incident and reflected signals
on a transmission line. Showtime The state of either ATU-C or ATU-R, reached after all initialization and
training is complete, in which data is transmitted. Splitter Filter that separates the high frequency signals (ADSL) from the voiceband
signals. Upstream ATU-R to ATU-C direction. Voiceband 0 to 4 kHz; expanded from the traditional 0.3 to 3.4 kHz to deal with voiceband
data services wider than POTS.
The University of New Hampshire InterOperability Laboratory
DSL Consortium ADSL2 Electrical Characteristics
Conformance Test Suite v 1.6.4 ix
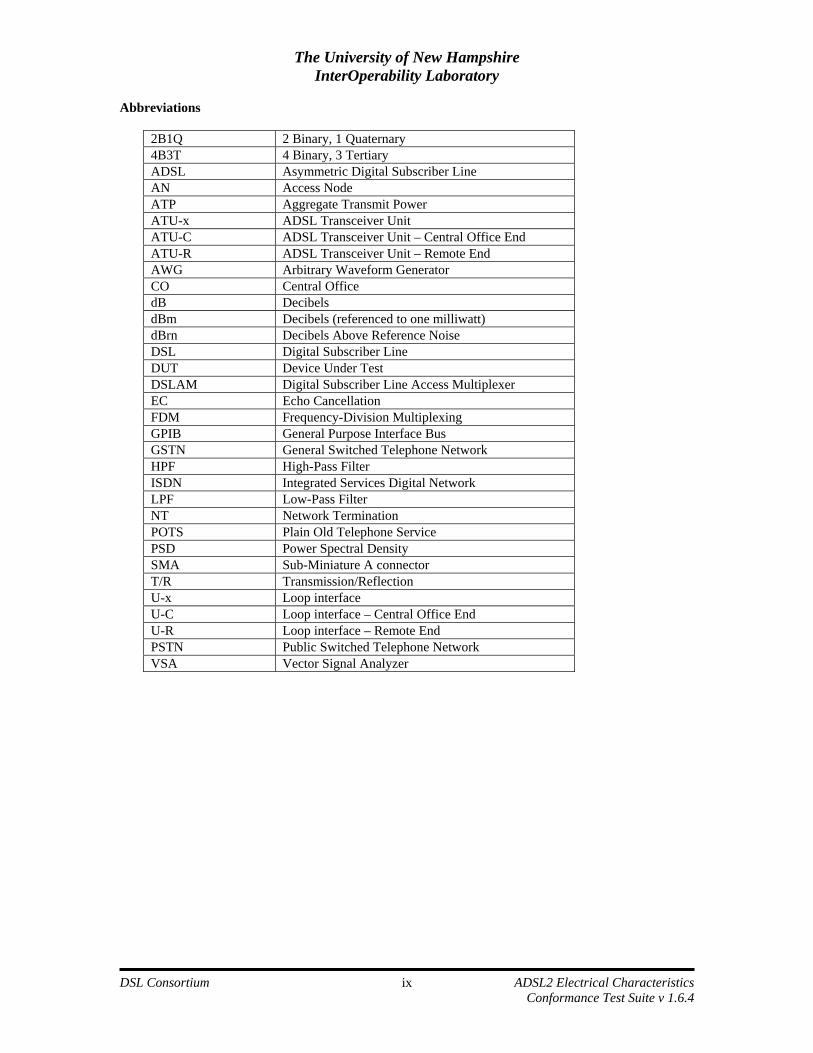
Abbreviations
2B1Q 2 Binary, 1 Quaternary 4B3T 4 Binary, 3 Tertiary ADSL Asymmetric Digital Subscriber Line AN Access Node ATP Aggregate Transmit Power ATU-x ADSL Transceiver Unit ATU-C ADSL Transceiver Unit – Central Office End ATU-R ADSL Transceiver Unit – Remote End AWG Arbitrary Waveform Generator CO Central Office dB Decibels dBm Decibels (referenced to one milliwatt) dBrn Decibels Above Reference Noise DSL Digital Subscriber Line DUT Device Under Test DSLAM Digital Subscriber Line Access Multiplexer EC Echo Cancellation FDM Frequency-Division Multiplexing GPIB General Purpose Interface Bus GSTN General Switched Telephone Network HPF High-Pass Filter ISDN Integrated Services Digital Network LPF Low-Pass Filter NT Network Termination POTS Plain Old Telephone Service PSD Power Spectral Density SMA Sub-Miniature A connector T/R Transmission/Reflection U-x Loop interface U-C Loop interface – Central Office End U-R Loop interface – Remote End PSTN Public Switched Telephone Network VSA Vector Signal Analyzer
The University of New Hampshire InterOperability Laboratory
DSL Consortium ADSL2 Electrical Characteristics
Conformance Test Suite v 1.6.4 x
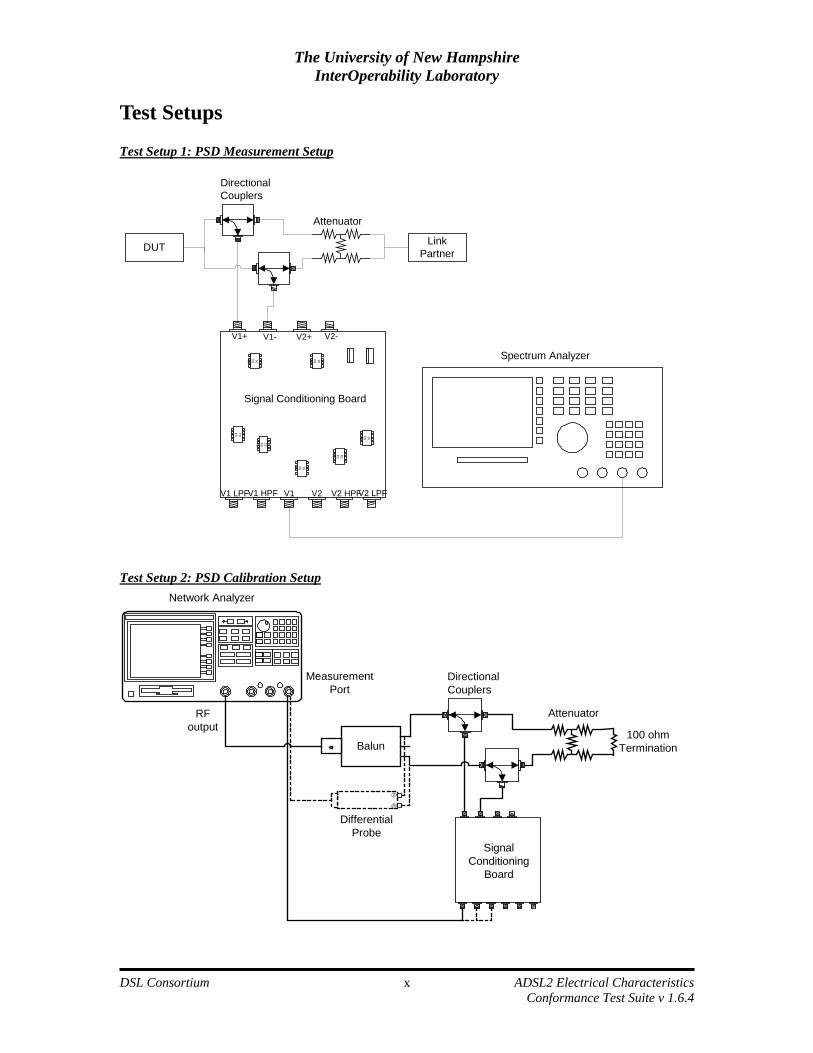
Test Setups Test Setup 1: PSD Measurement Setup
V1+ V1- V2+ V2-
V1 LPFV1 HPF V1 V2 LPFV2 HPFV2
TH S4 01 2 TH S4 01 2
TH S4 01 2
TH S4 01 2
TH S4 01 2
TH S4 01 2
TH S4 01 2
DirectionalCouplers
Attenuator
Signal Conditioning Board
Spectrum Analyzer
DUT LinkPartner
Test Setup 2: PSD Calibration Setup
DirectionalCouplers
Attenuator
100 ohmTermination
SignalConditioning
Board
Network Analyzer
Balun
RFoutput
MeasurementPort
DifferentialProbe
The University of New Hampshire InterOperability Laboratory
DSL Consortium ADSL2 Electrical Characteristics
Conformance Test Suite v 1.6.4 xi
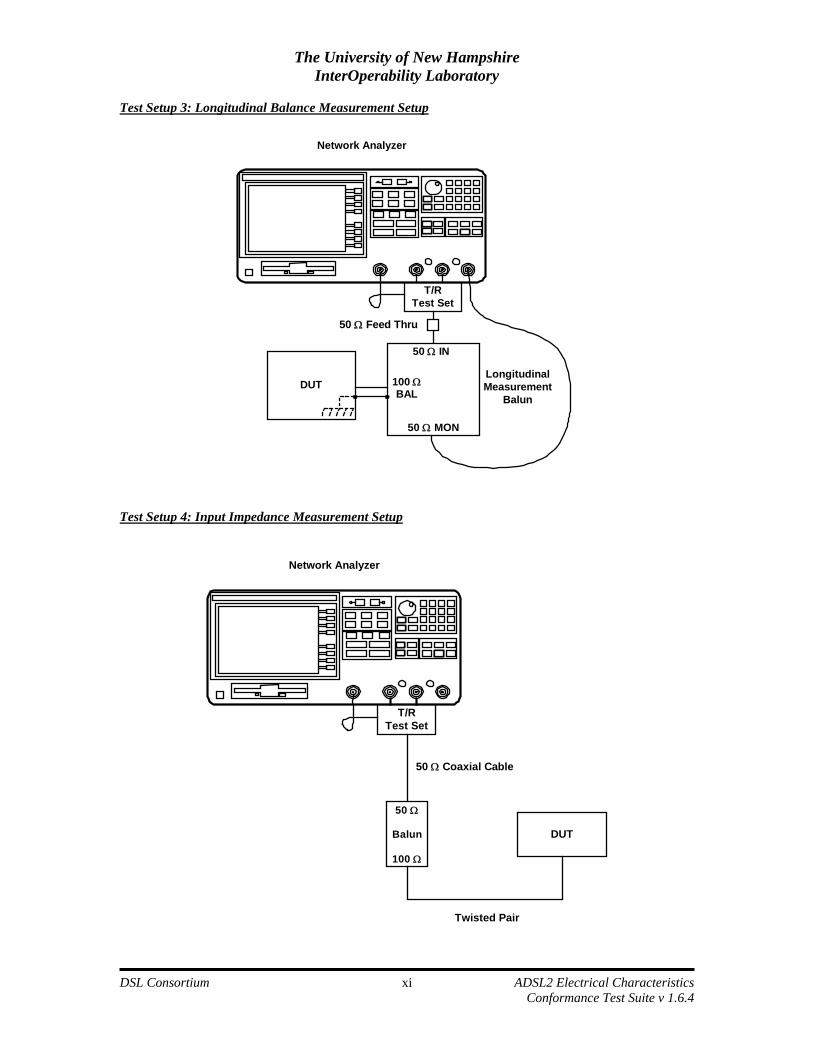
Test Setup 3: Longitudinal Balance Measurement Setup
T/RTest Set
Network Analyzer
DUT
50 Ω IN
50 Ω MON
100 ΩBAL
LongitudinalMeasurement
Balun
50 Ω Feed Thru
Test Setup 4: Input Impedance Measurement Setup
T/RTest Set
Network Analyzer
DUT
50 Ω Coaxial Cable
50 Ω
Balun
100 Ω
Twisted Pair
The University of New Hampshire InterOperability Laboratory
DSL Consortium ADSL2 Electrical Characteristics
Conformance Test Suite v 1.6.4 xii
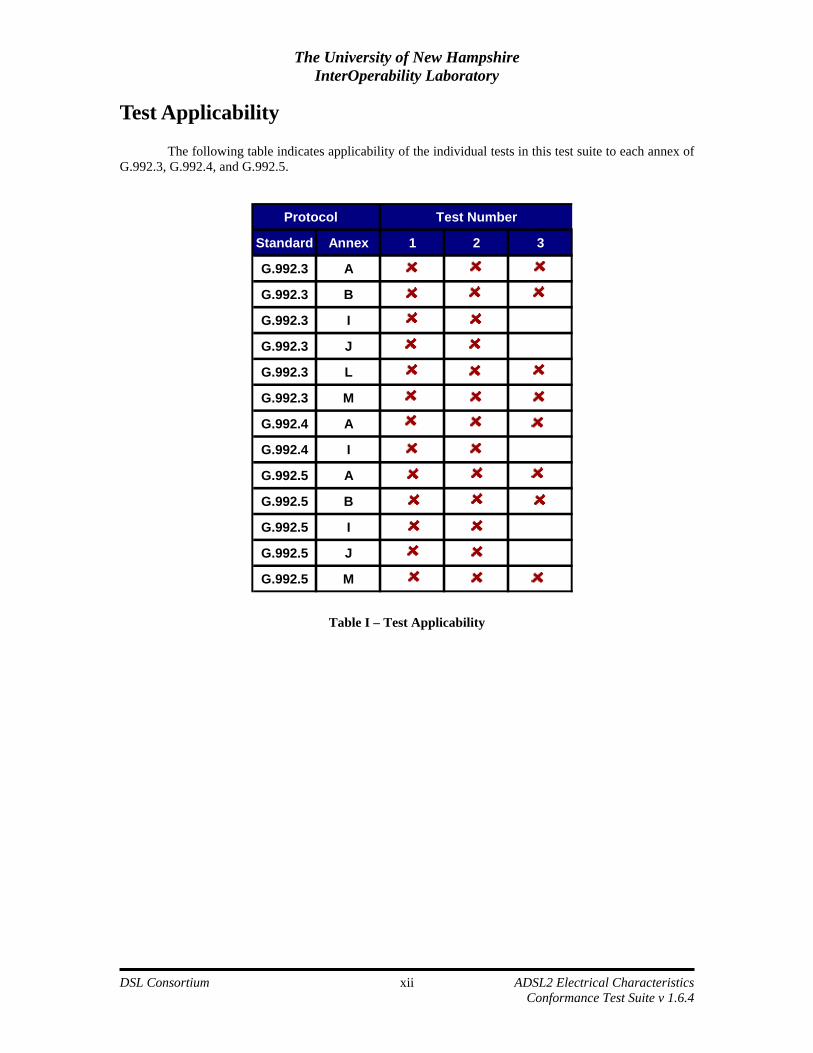
Test Applicability
The following table indicates applicability of the individual tests in this test suite to each annex of G.992.3, G.992.4, and G.992.5.
Table I – Test Applicability
Protocol Test Number
Standard Annex 1 2 3
G.992.3 A
G.992.3 B
G.992.3 I
G.992.3 J
G.992.3 L
G.992.3 M
G.992.4 A
G.992.4 I
G.992.5 A
G.992.5 B
G.992.5 I
G.992.5 J
G.992.5 M
The University of New Hampshire InterOperability Laboratory
DSL Consortium ADSL2 Electrical Characteristics
Conformance Test Suite v 1.6.4 1
Group 1: Transmit Power Tests Scope:
The Transmit Power Tests are designed to test the conformance of ADSL2 transceivers to transmit power specifications in G.992.3, G.992.4, and G.992.5. The test metrics applicable to each ATU-x implementation are given in Table 1. The Transmit Power Test is applicable to ADSL2 devices conforming to the following protocols:
• G.992.3 (all annexes) • G.992.4 (all annexes) • G.992.5 (all annexes)
The University of New Hampshire InterOperability Laboratory
DSL Consortium ADSL2 Electrical Characteristics
Conformance Test Suite v 1.6.4 2
Group A2EC.1: Transmit Power Tests Purpose: The purpose of this test is to verify the power spectral density and aggregate transmit power of an ADSL2 transceiver does not exceed the limitations set in the relevant annex of [1], [2], or [3]. References:
[1] ITU-T G.992.3 (2002) [2] ITU-T G.992.4 (2002) [3] ITU-T G.992.5 (2003) [4] ANSI T1.417-2001 [5] “Proposed Appendix to TSB-31C to Facilitate ADSL Signal Power & PSD Testing.”
Resource requirements:
• ATU-C • ATU-R • Spectrum Analyzer with GPIB interface • Network Analyzer with GPIB interface • Directional Couplers (2) • Balanced Attenuator • PSD Measurement Board • PC with GPIB interface
Last modification: September 7, 2005 Test setup:
• Test Setups 1 and 2 Discussion: In order for devices complying to [1], [2], or [3], to coexist with other telecommunication devices, the total amount of transmitted power must be limited. This is intended to help prevent devices from causing unwanted crosstalk, which may interfere with or impede the operation of other telecommunication devices. Plots of the PSD masks are provided in Appendix C.
The University of New Hampshire InterOperability Laboratory
DSL Consortium ADSL2 Electrical Characteristics
Conformance Test Suite v 1.6.4 3
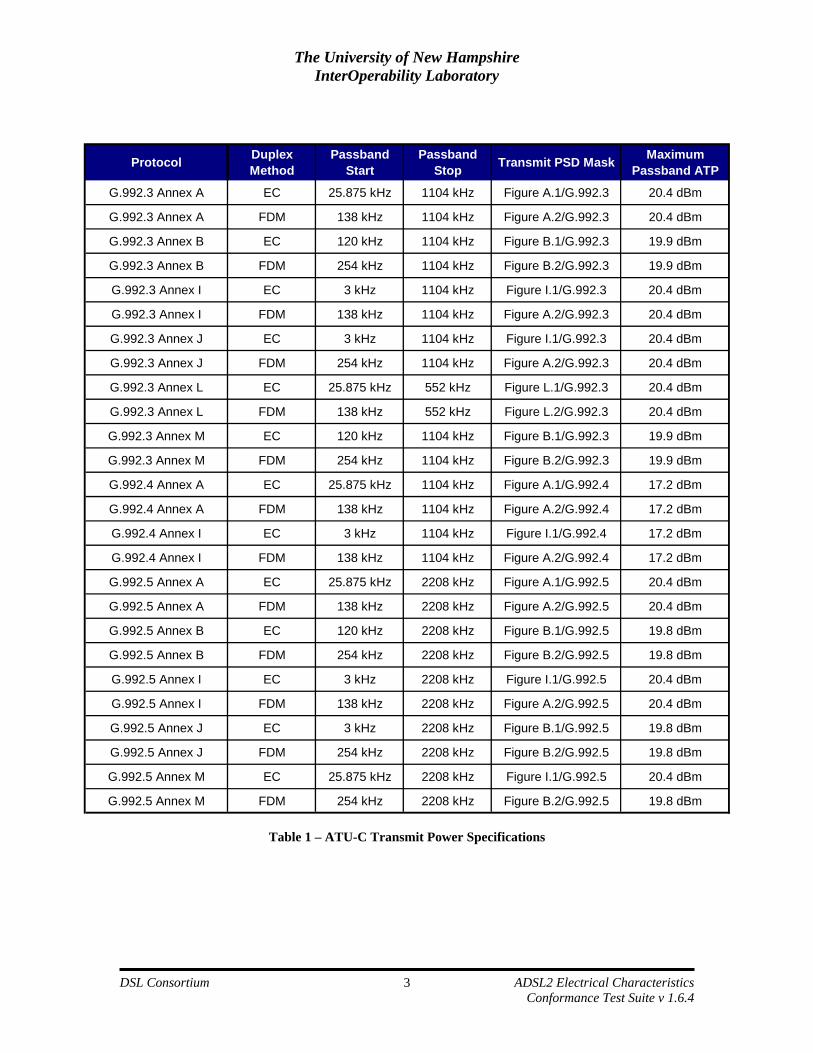
Table 1 – ATU-C Transmit Power Specifications
Protocol Duplex Method
Passband Start
Passband Stop Transmit PSD Mask Maximum
Passband ATP
G.992.3 Annex A EC 25.875 kHz 1104 kHz Figure A.1/G.992.3 20.4 dBm
G.992.3 Annex A FDM 138 kHz 1104 kHz Figure A.2/G.992.3 20.4 dBm
G.992.3 Annex B EC 120 kHz 1104 kHz Figure B.1/G.992.3 19.9 dBm
G.992.3 Annex B FDM 254 kHz 1104 kHz Figure B.2/G.992.3 19.9 dBm
G.992.3 Annex I EC 3 kHz 1104 kHz Figure I.1/G.992.3 20.4 dBm
G.992.3 Annex I FDM 138 kHz 1104 kHz Figure A.2/G.992.3 20.4 dBm
G.992.3 Annex J EC 3 kHz 1104 kHz Figure I.1/G.992.3 20.4 dBm
G.992.3 Annex J FDM 254 kHz 1104 kHz Figure A.2/G.992.3 20.4 dBm
G.992.3 Annex L EC 25.875 kHz 552 kHz Figure L.1/G.992.3 20.4 dBm
G.992.3 Annex L FDM 138 kHz 552 kHz Figure L.2/G.992.3 20.4 dBm
G.992.3 Annex M EC 120 kHz 1104 kHz Figure B.1/G.992.3 19.9 dBm
G.992.3 Annex M FDM 254 kHz 1104 kHz Figure B.2/G.992.3 19.9 dBm
G.992.4 Annex A EC 25.875 kHz 1104 kHz Figure A.1/G.992.4 17.2 dBm
G.992.4 Annex A FDM 138 kHz 1104 kHz Figure A.2/G.992.4 17.2 dBm
G.992.4 Annex I EC 3 kHz 1104 kHz Figure I.1/G.992.4 17.2 dBm
G.992.4 Annex I FDM 138 kHz 1104 kHz Figure A.2/G.992.4 17.2 dBm
G.992.5 Annex A EC 25.875 kHz 2208 kHz Figure A.1/G.992.5 20.4 dBm
G.992.5 Annex A FDM 138 kHz 2208 kHz Figure A.2/G.992.5 20.4 dBm
G.992.5 Annex B EC 120 kHz 2208 kHz Figure B.1/G.992.5 19.8 dBm
G.992.5 Annex B FDM 254 kHz 2208 kHz Figure B.2/G.992.5 19.8 dBm
G.992.5 Annex I EC 3 kHz 2208 kHz Figure I.1/G.992.5 20.4 dBm
G.992.5 Annex I FDM 138 kHz 2208 kHz Figure A.2/G.992.5 20.4 dBm
G.992.5 Annex J EC 3 kHz 2208 kHz Figure B.1/G.992.5 19.8 dBm
G.992.5 Annex J FDM 254 kHz 2208 kHz Figure B.2/G.992.5 19.8 dBm
G.992.5 Annex M EC 25.875 kHz 2208 kHz Figure I.1/G.992.5 20.4 dBm
G.992.5 Annex M FDM 254 kHz 2208 kHz Figure B.2/G.992.5 19.8 dBm
The University of New Hampshire InterOperability Laboratory
DSL Consortium ADSL2 Electrical Characteristics
Conformance Test Suite v 1.6.4 4
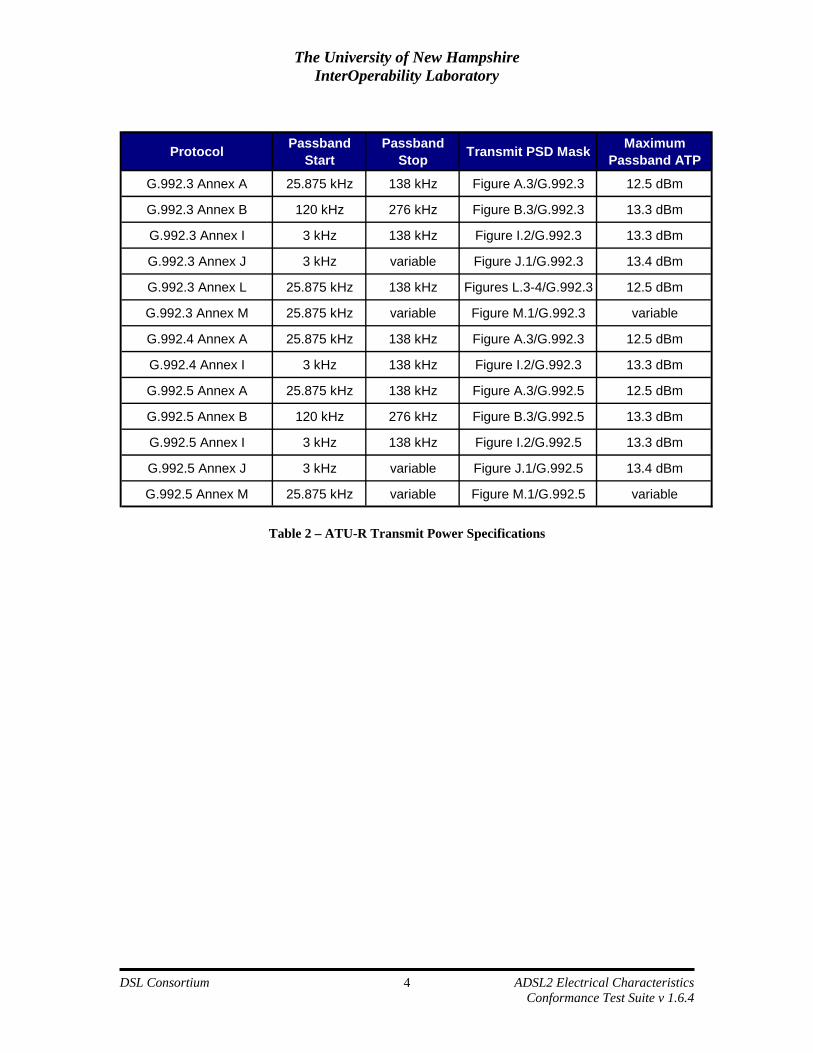
Table 2 – ATU-R Transmit Power Specifications
Protocol Passband Start
Passband Stop Transmit PSD Mask Maximum
Passband ATP
G.992.3 Annex A 25.875 kHz 138 kHz Figure A.3/G.992.3 12.5 dBm
G.992.3 Annex B 120 kHz 276 kHz Figure B.3/G.992.3 13.3 dBm
G.992.3 Annex I 3 kHz 138 kHz Figure I.2/G.992.3 13.3 dBm
G.992.3 Annex J 3 kHz variable Figure J.1/G.992.3 13.4 dBm
G.992.3 Annex L 25.875 kHz 138 kHz Figures L.3-4/G.992.3 12.5 dBm
G.992.3 Annex M 25.875 kHz variable Figure M.1/G.992.3 variable
G.992.4 Annex A 25.875 kHz 138 kHz Figure A.3/G.992.3 12.5 dBm
G.992.4 Annex I 3 kHz 138 kHz Figure I.2/G.992.3 13.3 dBm
G.992.5 Annex A 25.875 kHz 138 kHz Figure A.3/G.992.5 12.5 dBm
G.992.5 Annex B 120 kHz 276 kHz Figure B.3/G.992.5 13.3 dBm
G.992.5 Annex I 3 kHz 138 kHz Figure I.2/G.992.5 13.3 dBm
G.992.5 Annex J 3 kHz variable Figure J.1/G.992.5 13.4 dBm
G.992.5 Annex M 25.875 kHz variable Figure M.1/G.992.5 variable
The University of New Hampshire InterOperability Laboratory
DSL Consortium ADSL2 Electrical Characteristics
Conformance Test Suite v 1.6.4 5
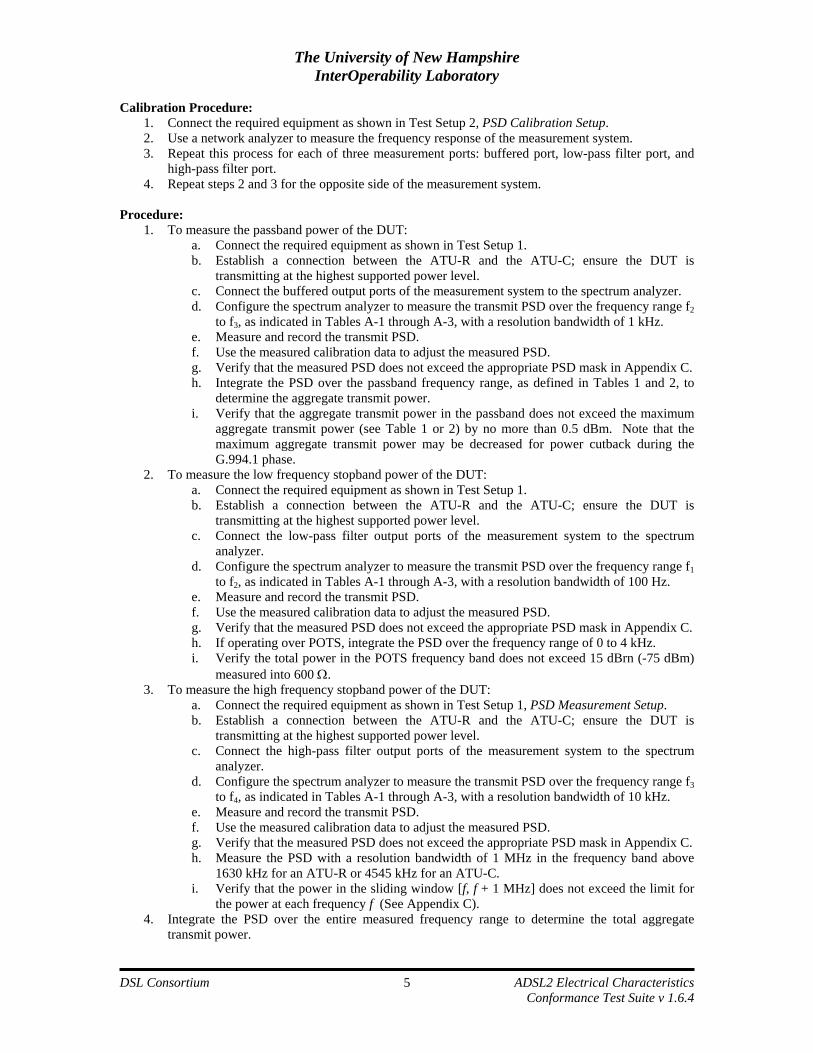
Calibration Procedure: 1. Connect the required equipment as shown in Test Setup 2, PSD Calibration Setup. 2. Use a network analyzer to measure the frequency response of the measurement system. 3. Repeat this process for each of three measurement ports: buffered port, low-pass filter port, and
high-pass filter port. 4. Repeat steps 2 and 3 for the opposite side of the measurement system.
Procedure: 1. To measure the passband power of the DUT:
a. Connect the required equipment as shown in Test Setup 1. b. Establish a connection between the ATU-R and the ATU-C; ensure the DUT is
transmitting at the highest supported power level. c. Connect the buffered output ports of the measurement system to the spectrum analyzer. d. Configure the spectrum analyzer to measure the transmit PSD over the frequency range f2
to f3, as indicated in Tables A-1 through A-3, with a resolution bandwidth of 1 kHz. e. Measure and record the transmit PSD. f. Use the measured calibration data to adjust the measured PSD. g. Verify that the measured PSD does not exceed the appropriate PSD mask in Appendix C. h. Integrate the PSD over the passband frequency range, as defined in Tables 1 and 2, to
determine the aggregate transmit power. i. Verify that the aggregate transmit power in the passband does not exceed the maximum
aggregate transmit power (see Table 1 or 2) by no more than 0.5 dBm. Note that the maximum aggregate transmit power may be decreased for power cutback during the G.994.1 phase.
2. To measure the low frequency stopband power of the DUT: a. Connect the required equipment as shown in Test Setup 1. b. Establish a connection between the ATU-R and the ATU-C; ensure the DUT is
transmitting at the highest supported power level. c. Connect the low-pass filter output ports of the measurement system to the spectrum
analyzer. d. Configure the spectrum analyzer to measure the transmit PSD over the frequency range f1
to f2, as indicated in Tables A-1 through A-3, with a resolution bandwidth of 100 Hz. e. Measure and record the transmit PSD. f. Use the measured calibration data to adjust the measured PSD. g. Verify that the measured PSD does not exceed the appropriate PSD mask in Appendix C. h. If operating over POTS, integrate the PSD over the frequency range of 0 to 4 kHz. i. Verify the total power in the POTS frequency band does not exceed 15 dBrn (-75 dBm)
measured into 600 Ω. 3. To measure the high frequency stopband power of the DUT:
a. Connect the required equipment as shown in Test Setup 1, PSD Measurement Setup. b. Establish a connection between the ATU-R and the ATU-C; ensure the DUT is
transmitting at the highest supported power level. c. Connect the high-pass filter output ports of the measurement system to the spectrum
analyzer. d. Configure the spectrum analyzer to measure the transmit PSD over the frequency range f3
to f4, as indicated in Tables A-1 through A-3, with a resolution bandwidth of 10 kHz. e. Measure and record the transmit PSD. f. Use the measured calibration data to adjust the measured PSD. g. Verify that the measured PSD does not exceed the appropriate PSD mask in Appendix C. h. Measure the PSD with a resolution bandwidth of 1 MHz in the frequency band above
1630 kHz for an ATU-R or 4545 kHz for an ATU-C. i. Verify that the power in the sliding window [f, f + 1 MHz] does not exceed the limit for
the power at each frequency f (See Appendix C). 4. Integrate the PSD over the entire measured frequency range to determine the total aggregate
transmit power.
The University of New Hampshire InterOperability Laboratory
DSL Consortium ADSL2 Electrical Characteristics
Conformance Test Suite v 1.6.4 6
5. Verify that the total aggregate transmit power does not exceed the maximum aggregate transmit power (see Table 1 or 2) by no more than 0.9 dBm for an ATU-C, or by no more than 0.8 dBm for an ATU-R. Note that the maximum aggregate transmit power may be decreased for power cutback during the G.994.1 phase.
Test metrics:
1. The measured PSD should fall under the appropriate PSD mask (see Appendix C). 2. Above the passband, the power in a 1 MHz sliding window should be less than the specified limit
(see Appendix C). 3. The total power in the passband should not exceed the limit specified in Tables 1 and 2 by more
than 0.5 dBm. 4. The total power measured power should not exceed the allowable power in the passband by 0.9
dBm (ATU-C) or 0.8 dBm (ATU-R). 5. For a DUT designed to operate over POTS, the total power in the voiceband (0-4kHz) should not
exceed –75 dBm.
The University of New Hampshire InterOperability Laboratory
DSL Consortium ADSL2 Electrical Characteristics
Conformance Test Suite v 1.6.4 4
Group 2: Longitudinal Balance Tests Scope:
The Longitudinal Balance Tests are designed to test the balance about earth of the ATU-x metallic interface for ADSL transceivers conforming to the following protocols:
• G.992.3 (all annexes) • G.992.4 (all annexes) • G.992.5 (all annexes)
The DUT must be capable of being set to a quiet state while active and powered.
The University of New Hampshire InterOperability Laboratory
DSL Consortium ADSL2 Electrical Characteristics
Conformance Test Suite v 1.6.4 5
Group A2EC.2: Longitudinal Balance Tests Purpose: The purpose of this test is to verify the longitudinal balance of the DUT exceeds the minimum balance as prescribed in G.992.3, G.992.4, or G.992.5.
References:
[1] ITU-T G.992.3 (2002) [2] ITU-T G.992.4 (2002) [3] ITU-T G.992.5 (2003) [6] Agilent 4395A Network/Spectrum/Impedance Analyzer Operation Manual
Resource requirements: • ATU-x (DUT) • Network Analyzer • Transmission/Reflection Test Set • Longitudinal Measurement Balun • SMA 50 Ω Load Calibration Standards (2) • SMA Short Calibration Standard • BNC 50 Ω Feed Thru Termination
Last modification: January 20, 2005 Test setup:
• Test Setup 3 Discussion:
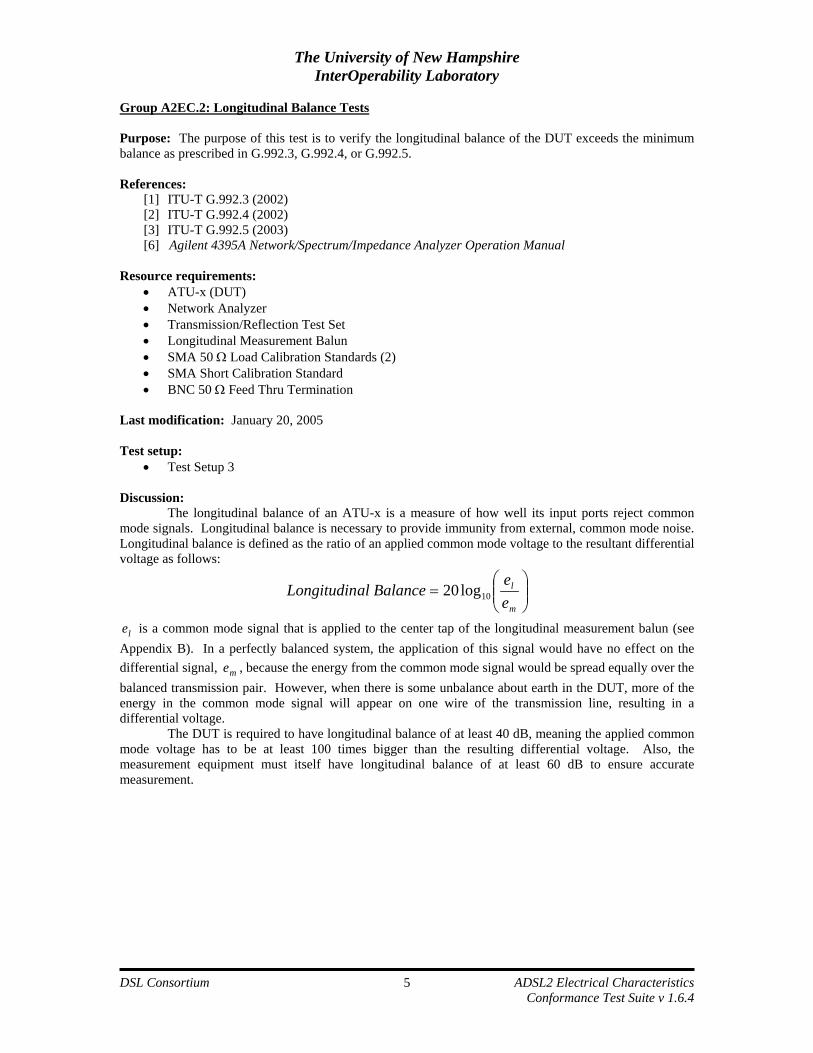
The longitudinal balance of an ATU-x is a measure of how well its input ports reject common mode signals. Longitudinal balance is necessary to provide immunity from external, common mode noise. Longitudinal balance is defined as the ratio of an applied common mode voltage to the resultant differential voltage as follows:
⎟⎟⎠
⎞⎜⎜⎝
⎛=
m
l
ee
al BalanceLongitudin 10log20
le is a common mode signal that is applied to the center tap of the longitudinal measurement balun (see Appendix B). In a perfectly balanced system, the application of this signal would have no effect on the differential signal, me , because the energy from the common mode signal would be spread equally over the balanced transmission pair. However, when there is some unbalance about earth in the DUT, more of the energy in the common mode signal will appear on one wire of the transmission line, resulting in a differential voltage. The DUT is required to have longitudinal balance of at least 40 dB, meaning the applied common mode voltage has to be at least 100 times bigger than the resulting differential voltage. Also, the measurement equipment must itself have longitudinal balance of at least 60 dB to ensure accurate measurement.
The University of New Hampshire InterOperability Laboratory
DSL Consortium ADSL2 Electrical Characteristics
Conformance Test Suite v 1.6.4 6
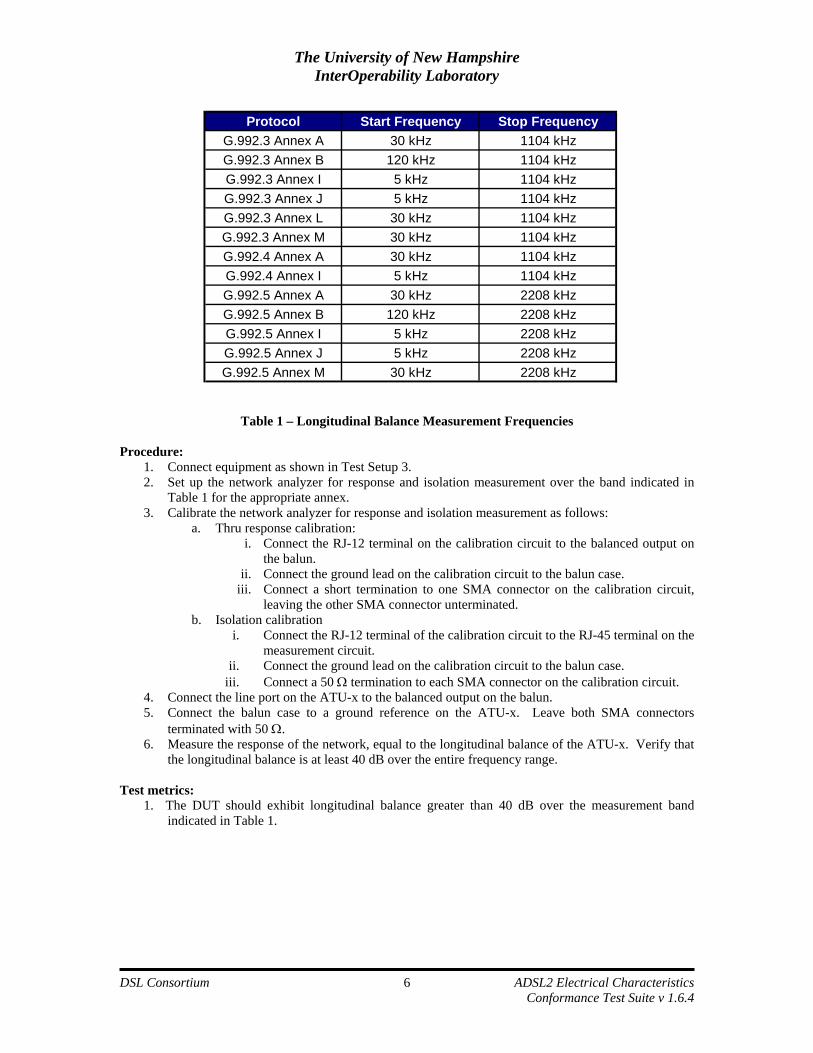
Table 1 – Longitudinal Balance Measurement Frequencies
Procedure: 1. Connect equipment as shown in Test Setup 3. 2. Set up the network analyzer for response and isolation measurement over the band indicated in
Table 1 for the appropriate annex. 3. Calibrate the network analyzer for response and isolation measurement as follows:
a. Thru response calibration: i. Connect the RJ-12 terminal on the calibration circuit to the balanced output on
the balun. ii. Connect the ground lead on the calibration circuit to the balun case.
iii. Connect a short termination to one SMA connector on the calibration circuit, leaving the other SMA connector unterminated.
b. Isolation calibration i. Connect the RJ-12 terminal of the calibration circuit to the RJ-45 terminal on the
measurement circuit. ii. Connect the ground lead on the calibration circuit to the balun case.
iii. Connect a 50 Ω termination to each SMA connector on the calibration circuit. 4. Connect the line port on the ATU-x to the balanced output on the balun. 5. Connect the balun case to a ground reference on the ATU-x. Leave both SMA connectors
terminated with 50 Ω. 6. Measure the response of the network, equal to the longitudinal balance of the ATU-x. Verify that
the longitudinal balance is at least 40 dB over the entire frequency range. Test metrics:
1. The DUT should exhibit longitudinal balance greater than 40 dB over the measurement band indicated in Table 1.
Protocol Start Frequency Stop FrequencyG.992.3 Annex A 30 kHz 1104 kHzG.992.3 Annex B 120 kHz 1104 kHzG.992.3 Annex I 5 kHz 1104 kHzG.992.3 Annex J 5 kHz 1104 kHzG.992.3 Annex L 30 kHz 1104 kHzG.992.3 Annex M 30 kHz 1104 kHzG.992.4 Annex A 30 kHz 1104 kHzG.992.4 Annex I 5 kHz 1104 kHzG.992.5 Annex A 30 kHz 2208 kHzG.992.5 Annex B 120 kHz 2208 kHzG.992.5 Annex I 5 kHz 2208 kHzG.992.5 Annex J 5 kHz 2208 kHzG.992.5 Annex M 30 kHz 2208 kHz
The University of New Hampshire InterOperability Laboratory
DSL Consortium ADSL2 Electrical Characteristics
Conformance Test Suite v 1.6.4 7
Group 3: Input Impedance Tests Scope:
The Input Impedance Tests are designed to test the input impedance of an ATU-x designed for coexistence with POTS or ISDN to requirements in the following protocols:
• G.992.3 Annexes A, B, L, and M • G.992.4 Annex A • G.992.5 Annexes A, B, and M
The DUT must be capable of being set to a quiet state while active and powered.
The University of New Hampshire InterOperability Laboratory
DSL Consortium ADSL2 Electrical Characteristics
Conformance Test Suite v 1.6.4 8
Group A2EC.3: Input Impedance Tests Purpose: The purpose of this test is to measure the imaginary component of the input impedance of the DUT for conformance with G.992.3, G.992.4, or G.992.5.
References:
[1] ITU-T G.992.3 (2002) [6] Agilent 4395A Network/Spectrum/Impedance Analyzer Operation Manual [7] Applied Electromagnetism [8] ITU-T G.992.3 Amendment 2 (2006)
Resource requirements: • ATU-x (DUT) • Network Analyzer with GPIB interface • Transmission/Reflection Test Set • PC with GPIB interface • Balun (50 Ω unbalanced to 100 Ω balanced) • 50 Ω Load Calibration Standard • Short Calibration Standard
Last modification: January 20, 2005 Test setup:
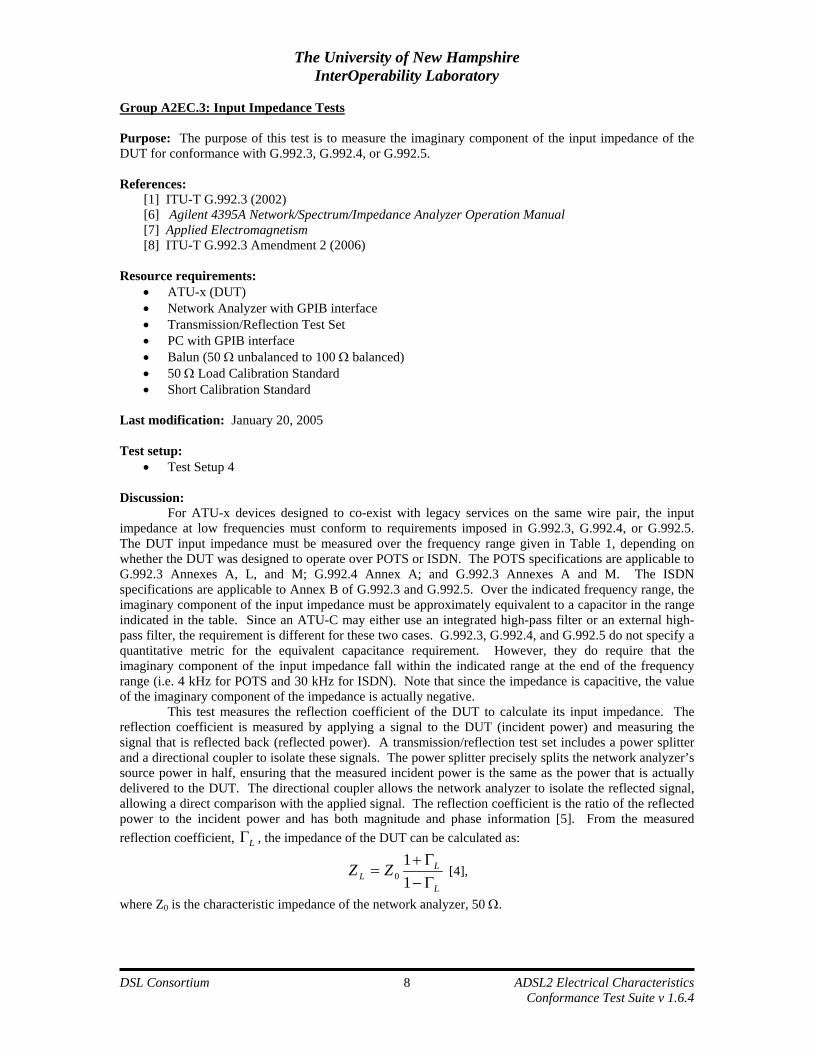
• Test Setup 4 Discussion: For ATU-x devices designed to co-exist with legacy services on the same wire pair, the input impedance at low frequencies must conform to requirements imposed in G.992.3, G.992.4, or G.992.5. The DUT input impedance must be measured over the frequency range given in Table 1, depending on whether the DUT was designed to operate over POTS or ISDN. The POTS specifications are applicable to G.992.3 Annexes A, L, and M; G.992.4 Annex A; and G.992.3 Annexes A and M. The ISDN specifications are applicable to Annex B of G.992.3 and G.992.5. Over the indicated frequency range, the imaginary component of the input impedance must be approximately equivalent to a capacitor in the range indicated in the table. Since an ATU-C may either use an integrated high-pass filter or an external high-pass filter, the requirement is different for these two cases. G.992.3, G.992.4, and G.992.5 do not specify a quantitative metric for the equivalent capacitance requirement. However, they do require that the imaginary component of the input impedance fall within the indicated range at the end of the frequency range (i.e. 4 kHz for POTS and 30 kHz for ISDN). Note that since the impedance is capacitive, the value of the imaginary component of the impedance is actually negative. This test measures the reflection coefficient of the DUT to calculate its input impedance. The reflection coefficient is measured by applying a signal to the DUT (incident power) and measuring the signal that is reflected back (reflected power). A transmission/reflection test set includes a power splitter and a directional coupler to isolate these signals. The power splitter precisely splits the network analyzer’s source power in half, ensuring that the measured incident power is the same as the power that is actually delivered to the DUT. The directional coupler allows the network analyzer to isolate the reflected signal, allowing a direct comparison with the applied signal. The reflection coefficient is the ratio of the reflected power to the incident power and has both magnitude and phase information [5]. From the measured reflection coefficient, LΓ , the impedance of the DUT can be calculated as:
L
LL ZZ
Γ−Γ+
=11
0 [4],
where Z0 is the characteristic impedance of the network analyzer, 50 Ω.
The University of New Hampshire InterOperability Laboratory
DSL Consortium ADSL2 Electrical Characteristics
Conformance Test Suite v 1.6.4 9
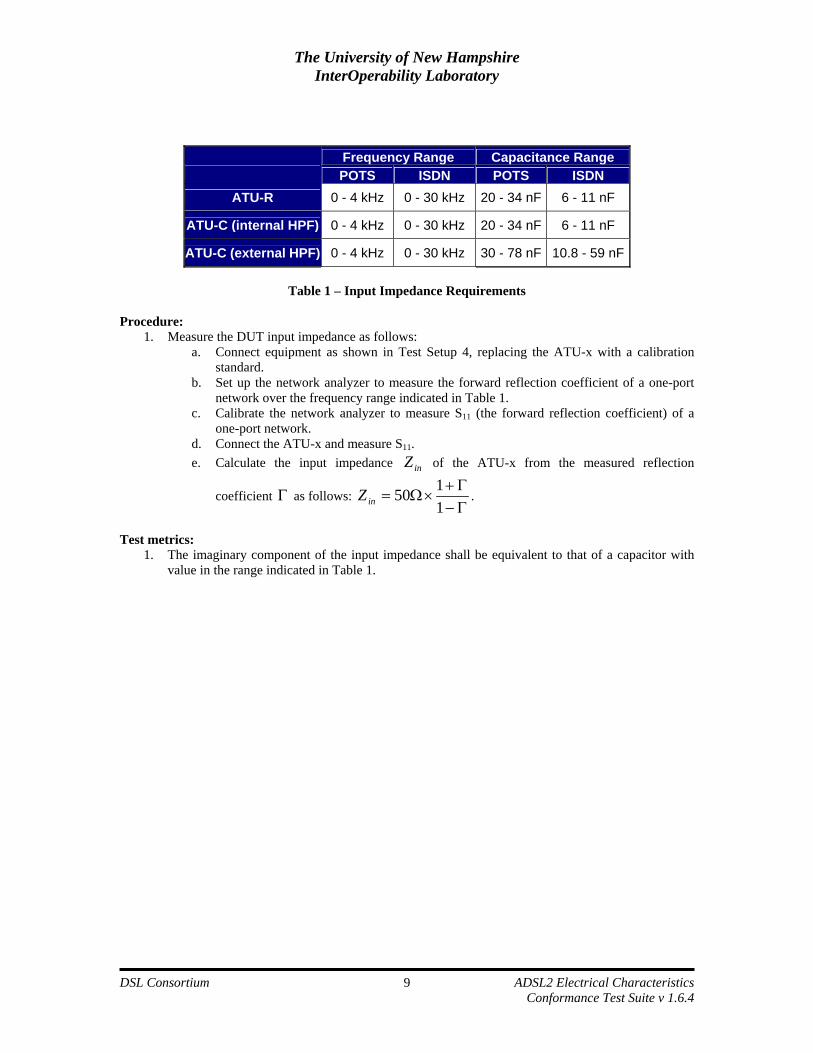
Frequency Range Capacitance Range
POTS ISDN POTS ISDN ATU-R 0 - 4 kHz 0 - 30 kHz 20 - 34 nF 6 - 11 nF
ATU-C (internal HPF) 0 - 4 kHz 0 - 30 kHz 20 - 34 nF 6 - 11 nF
ATU-C (external HPF) 0 - 4 kHz 0 - 30 kHz 30 - 78 nF 10.8 - 59 nF
Table 1 – Input Impedance Requirements
Procedure:
1. Measure the DUT input impedance as follows: a. Connect equipment as shown in Test Setup 4, replacing the ATU-x with a calibration
standard. b. Set up the network analyzer to measure the forward reflection coefficient of a one-port
network over the frequency range indicated in Table 1. c. Calibrate the network analyzer to measure S11 (the forward reflection coefficient) of a
one-port network. d. Connect the ATU-x and measure S11. e. Calculate the input impedance inZ of the ATU-x from the measured reflection
coefficient Γ as follows: Γ−Γ+
×Ω=1150inZ .
Test metrics:
1. The imaginary component of the input impedance shall be equivalent to that of a capacitor with value in the range indicated in Table 1.
The University of New Hampshire InterOperability Laboratory
DSL Consortium ADSL2 Electrical Characteristics
Conformance Test Suite v 1.6.4 10
Appendix A: PSD Measurement Hardware Background:
Traditionally, it has been necessary for the DUT to support a special mode of operation in which it is required to continuously transmit maximum power while disconnected from the companion ATU-x. If this mode of operation is not supported, it is nearly impossible to accurately measure the power transmitted by the DUT due to the power present from the companion ATU-x. Another popular method for measuring power is to place a flat attenuator between the DUT and the companion ATU-x. This is not ideal because the total amount of attenuation required to eliminate the companion ATU-x power would actually prevent the devices from establishing a link. The measurement technique described here attempts to solve this problem by using directional couplers in addition to a flat attenuator to further isolate the DUT from the companion ATU-x. Discussion:
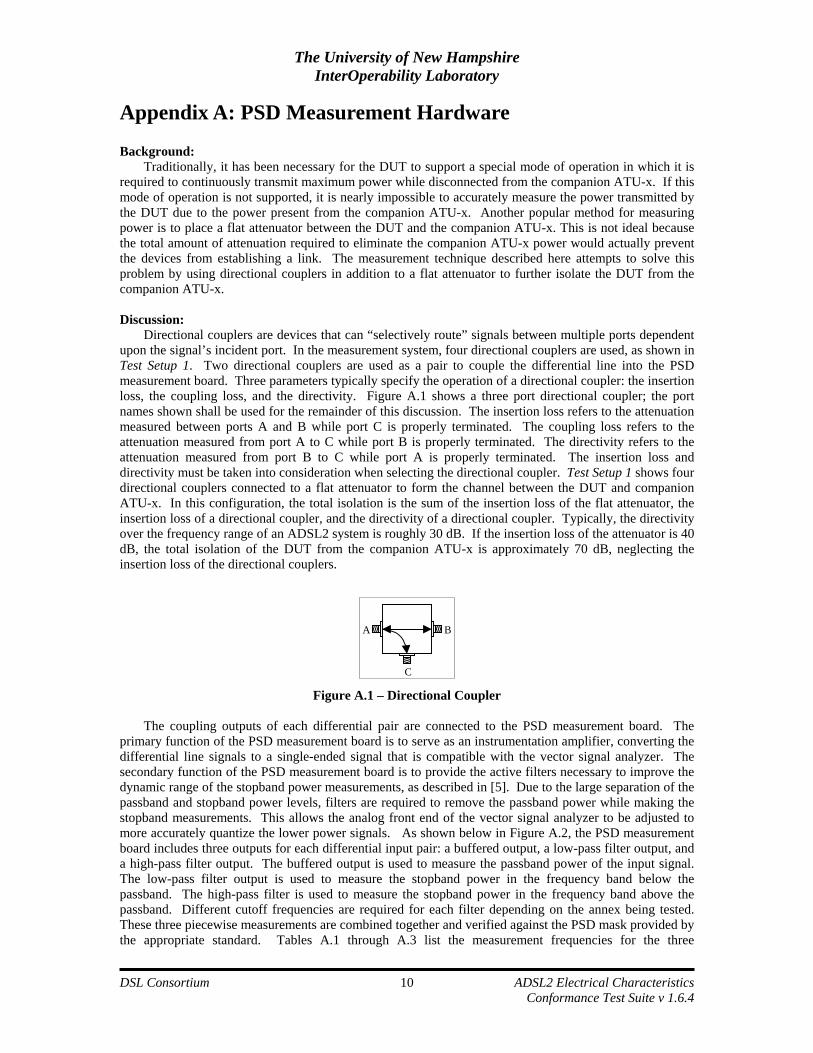
Directional couplers are devices that can “selectively route” signals between multiple ports dependent upon the signal’s incident port. In the measurement system, four directional couplers are used, as shown in Test Setup 1. Two directional couplers are used as a pair to couple the differential line into the PSD measurement board. Three parameters typically specify the operation of a directional coupler: the insertion loss, the coupling loss, and the directivity. Figure A.1 shows a three port directional coupler; the port names shown shall be used for the remainder of this discussion. The insertion loss refers to the attenuation measured between ports A and B while port C is properly terminated. The coupling loss refers to the attenuation measured from port A to C while port B is properly terminated. The directivity refers to the attenuation measured from port B to C while port A is properly terminated. The insertion loss and directivity must be taken into consideration when selecting the directional coupler. Test Setup 1 shows four directional couplers connected to a flat attenuator to form the channel between the DUT and companion ATU-x. In this configuration, the total isolation is the sum of the insertion loss of the flat attenuator, the insertion loss of a directional coupler, and the directivity of a directional coupler. Typically, the directivity over the frequency range of an ADSL2 system is roughly 30 dB. If the insertion loss of the attenuator is 40 dB, the total isolation of the DUT from the companion ATU-x is approximately 70 dB, neglecting the insertion loss of the directional couplers.
A B
C
Figure A.1 – Directional Coupler
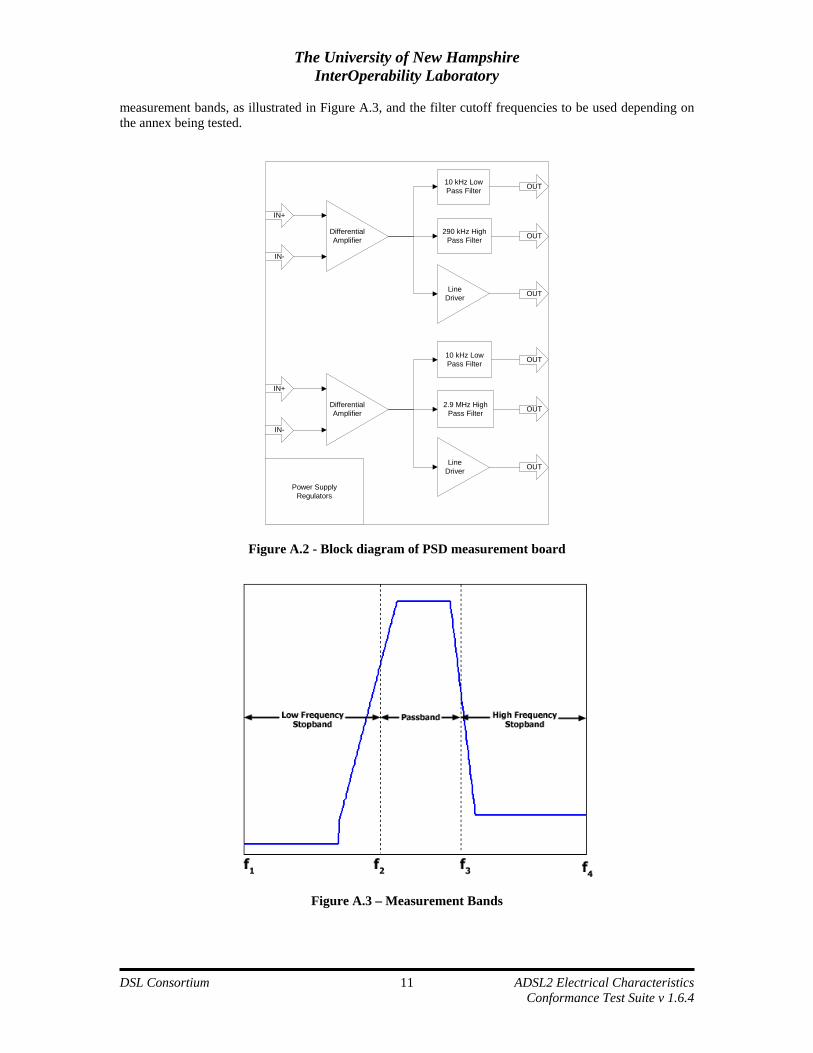
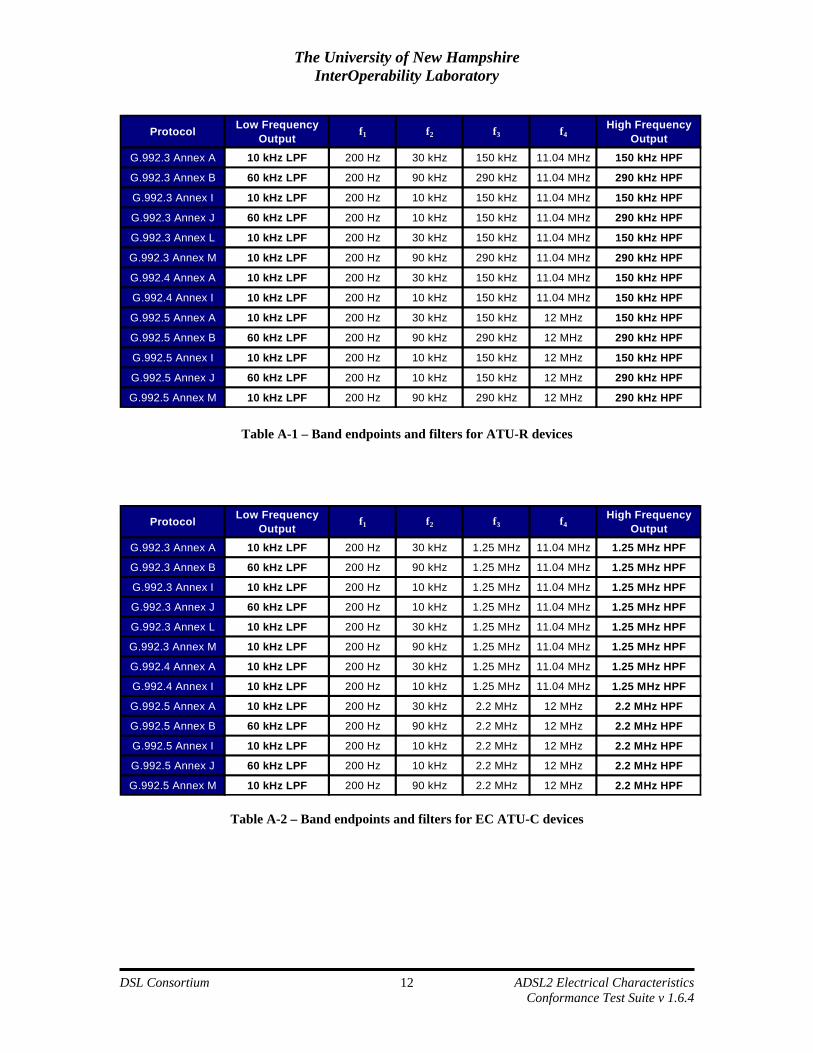
The coupling outputs of each differential pair are connected to the PSD measurement board. The primary function of the PSD measurement board is to serve as an instrumentation amplifier, converting the differential line signals to a single-ended signal that is compatible with the vector signal analyzer. The secondary function of the PSD measurement board is to provide the active filters necessary to improve the dynamic range of the stopband power measurements, as described in [5]. Due to the large separation of the passband and stopband power levels, filters are required to remove the passband power while making the stopband measurements. This allows the analog front end of the vector signal analyzer to be adjusted to more accurately quantize the lower power signals. As shown below in Figure A.2, the PSD measurement board includes three outputs for each differential input pair: a buffered output, a low-pass filter output, and a high-pass filter output. The buffered output is used to measure the passband power of the input signal. The low-pass filter output is used to measure the stopband power in the frequency band below the passband. The high-pass filter is used to measure the stopband power in the frequency band above the passband. Different cutoff frequencies are required for each filter depending on the annex being tested. These three piecewise measurements are combined together and verified against the PSD mask provided by the appropriate standard. Tables A.1 through A.3 list the measurement frequencies for the three
The University of New Hampshire InterOperability Laboratory
DSL Consortium ADSL2 Electrical Characteristics
Conformance Test Suite v 1.6.4 11
measurement bands, as illustrated in Figure A.3, and the filter cutoff frequencies to be used depending on the annex being tested.
DifferentialAmplifier
10 kHz LowPass Filter
10 kHz LowPass Filter
290 kHz HighPass Filter
2.9 MHz HighPass Filter
LineDriver
Power SupplyRegulators
IN-
IN+
DifferentialAmplifier
IN-
IN+
LineDriver
OUT
OUT
OUT
OUT
OUT
OUT
Figure A.2 - Block diagram of PSD measurement board
Figure A.3 – Measurement Bands
The University of New Hampshire InterOperability Laboratory
DSL Consortium ADSL2 Electrical Characteristics
Conformance Test Suite v 1.6.4 12
Protocol Low Frequency Output
f1 f2 f3 f4High Frequency
OutputG.992.3 Annex A 10 kHz LPF 200 Hz 30 kHz 150 kHz 11.04 MHz 150 kHz HPF
G.992.3 Annex B 60 kHz LPF 200 Hz 90 kHz 290 kHz 11.04 MHz 290 kHz HPF
G.992.3 Annex I 10 kHz LPF 200 Hz 10 kHz 150 kHz 11.04 MHz 150 kHz HPF
G.992.3 Annex J 60 kHz LPF 200 Hz 10 kHz 150 kHz 11.04 MHz 290 kHz HPF
G.992.3 Annex L 10 kHz LPF 200 Hz 30 kHz 150 kHz 11.04 MHz 150 kHz HPF
G.992.3 Annex M 10 kHz LPF 200 Hz 90 kHz 290 kHz 11.04 MHz 290 kHz HPF
G.992.4 Annex A 10 kHz LPF 200 Hz 30 kHz 150 kHz 11.04 MHz 150 kHz HPF
G.992.4 Annex I 10 kHz LPF 200 Hz 10 kHz 150 kHz 11.04 MHz 150 kHz HPF
G.992.5 Annex A 10 kHz LPF 200 Hz 30 kHz 150 kHz 12 MHz 150 kHz HPF
G.992.5 Annex B 60 kHz LPF 200 Hz 90 kHz 290 kHz 12 MHz 290 kHz HPF
G.992.5 Annex I 10 kHz LPF 200 Hz 10 kHz 150 kHz 12 MHz 150 kHz HPF
G.992.5 Annex J 60 kHz LPF 200 Hz 10 kHz 150 kHz 12 MHz 290 kHz HPF
G.992.5 Annex M 10 kHz LPF 200 Hz 90 kHz 290 kHz 12 MHz 290 kHz HPF
Table A-1 – Band endpoints and filters for ATU-R devices
Protocol Low Frequency Output
f1 f2 f3 f4High Frequency
OutputG.992.3 Annex A 10 kHz LPF 200 Hz 30 kHz 1.25 MHz 11.04 MHz 1.25 MHz HPF
G.992.3 Annex B 60 kHz LPF 200 Hz 90 kHz 1.25 MHz 11.04 MHz 1.25 MHz HPF
G.992.3 Annex I 10 kHz LPF 200 Hz 10 kHz 1.25 MHz 11.04 MHz 1.25 MHz HPF
G.992.3 Annex J 60 kHz LPF 200 Hz 10 kHz 1.25 MHz 11.04 MHz 1.25 MHz HPF
G.992.3 Annex L 10 kHz LPF 200 Hz 30 kHz 1.25 MHz 11.04 MHz 1.25 MHz HPF
G.992.3 Annex M 10 kHz LPF 200 Hz 90 kHz 1.25 MHz 11.04 MHz 1.25 MHz HPF
G.992.4 Annex A 10 kHz LPF 200 Hz 30 kHz 1.25 MHz 11.04 MHz 1.25 MHz HPF
G.992.4 Annex I 10 kHz LPF 200 Hz 10 kHz 1.25 MHz 11.04 MHz 1.25 MHz HPF
G.992.5 Annex A 10 kHz LPF 200 Hz 30 kHz 2.2 MHz 12 MHz 2.2 MHz HPF
G.992.5 Annex B 60 kHz LPF 200 Hz 90 kHz 2.2 MHz 12 MHz 2.2 MHz HPF
G.992.5 Annex I 10 kHz LPF 200 Hz 10 kHz 2.2 MHz 12 MHz 2.2 MHz HPF
G.992.5 Annex J 60 kHz LPF 200 Hz 10 kHz 2.2 MHz 12 MHz 2.2 MHz HPF
G.992.5 Annex M 10 kHz LPF 200 Hz 90 kHz 2.2 MHz 12 MHz 2.2 MHz HPF
Table A-2 – Band endpoints and filters for EC ATU-C devices
The University of New Hampshire InterOperability Laboratory
DSL Consortium ADSL2 Electrical Characteristics
Conformance Test Suite v 1.6.4 13
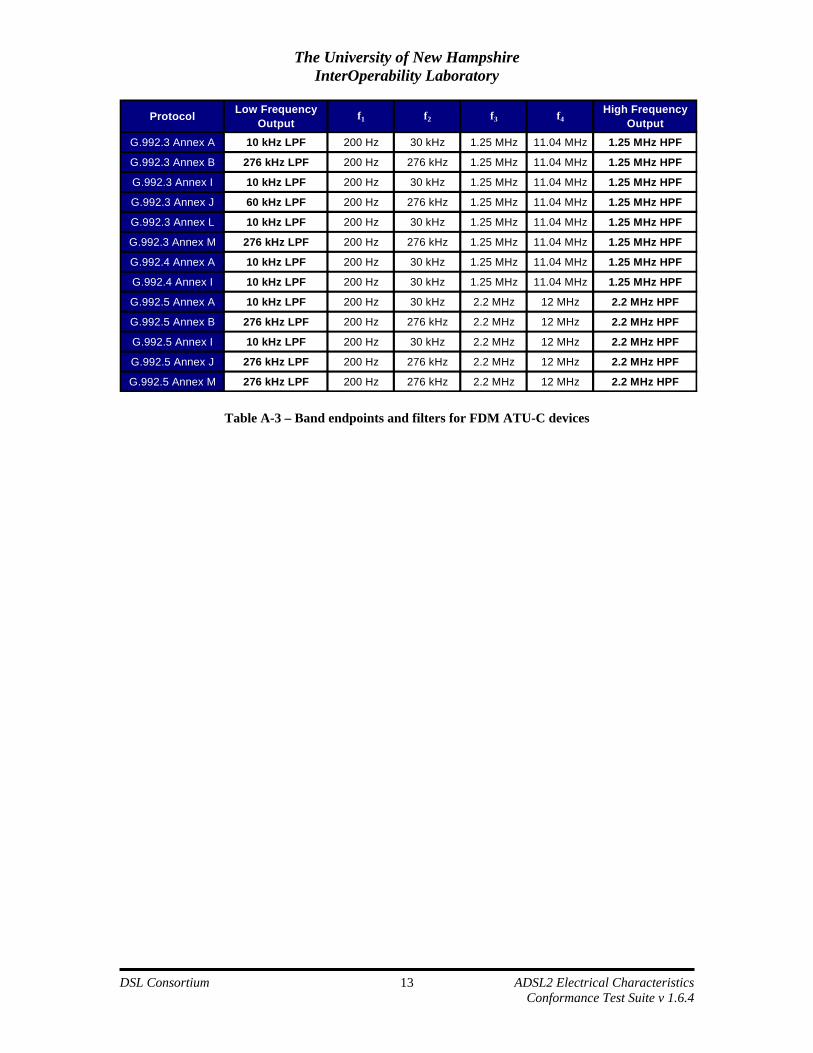
Protocol Low Frequency Output
f1 f2 f3 f4High Frequency
OutputG.992.3 Annex A 10 kHz LPF 200 Hz 30 kHz 1.25 MHz 11.04 MHz 1.25 MHz HPF
G.992.3 Annex B 276 kHz LPF 200 Hz 276 kHz 1.25 MHz 11.04 MHz 1.25 MHz HPF
G.992.3 Annex I 10 kHz LPF 200 Hz 30 kHz 1.25 MHz 11.04 MHz 1.25 MHz HPF
G.992.3 Annex J 60 kHz LPF 200 Hz 276 kHz 1.25 MHz 11.04 MHz 1.25 MHz HPF
G.992.3 Annex L 10 kHz LPF 200 Hz 30 kHz 1.25 MHz 11.04 MHz 1.25 MHz HPF
G.992.3 Annex M 276 kHz LPF 200 Hz 276 kHz 1.25 MHz 11.04 MHz 1.25 MHz HPF
G.992.4 Annex A 10 kHz LPF 200 Hz 30 kHz 1.25 MHz 11.04 MHz 1.25 MHz HPF
G.992.4 Annex I 10 kHz LPF 200 Hz 30 kHz 1.25 MHz 11.04 MHz 1.25 MHz HPF
G.992.5 Annex A 10 kHz LPF 200 Hz 30 kHz 2.2 MHz 12 MHz 2.2 MHz HPF
G.992.5 Annex B 276 kHz LPF 200 Hz 276 kHz 2.2 MHz 12 MHz 2.2 MHz HPF
G.992.5 Annex I 10 kHz LPF 200 Hz 30 kHz 2.2 MHz 12 MHz 2.2 MHz HPF
G.992.5 Annex J 276 kHz LPF 200 Hz 276 kHz 2.2 MHz 12 MHz 2.2 MHz HPF
G.992.5 Annex M 276 kHz LPF 200 Hz 276 kHz 2.2 MHz 12 MHz 2.2 MHz HPF
Table A-3 – Band endpoints and filters for FDM ATU-C devices
The University of New Hampshire InterOperability Laboratory
DSL Consortium ADSL2 Electrical Characteristics
Conformance Test Suite v 1.6.4 14
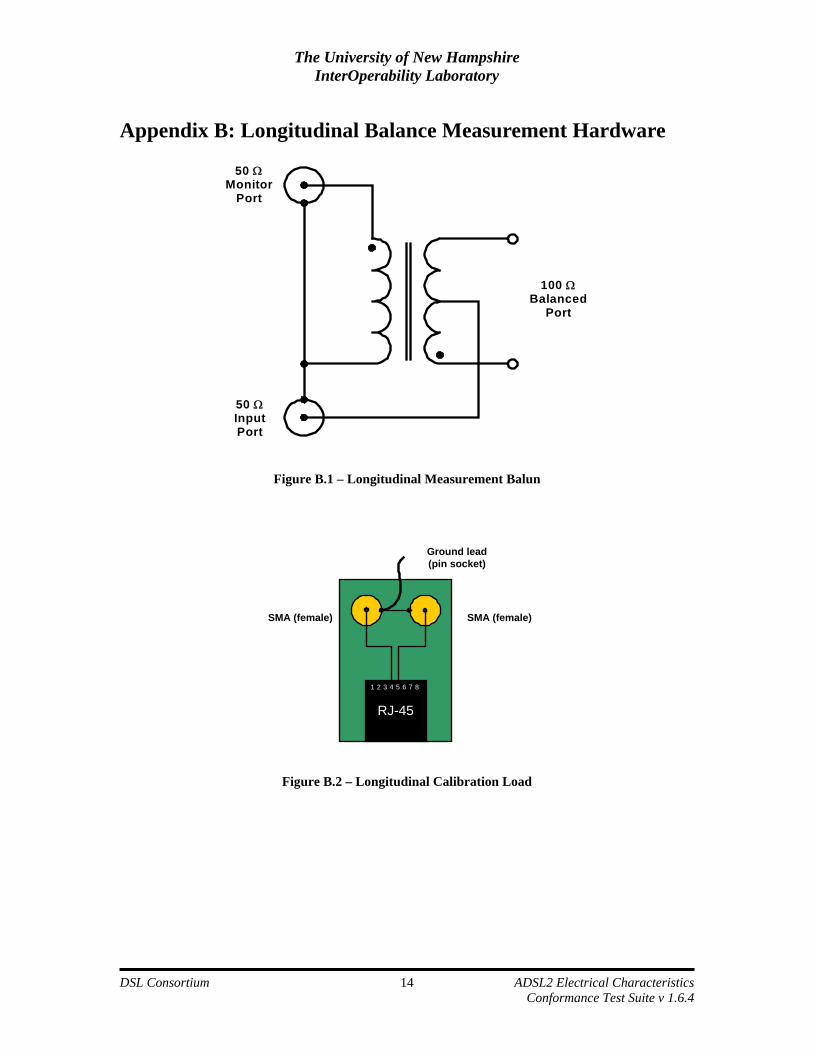
Appendix B: Longitudinal Balance Measurement Hardware
50 Ω Input Port
50 Ω Monitor
Port
100 Ω Balanced
Port
Figure B.1 – Longitudinal Measurement Balun
RJ-45
1 2 3 4 5 6 7 8
SMA (female)SMA (female)
Ground lead(pin socket)
Figure B.2 – Longitudinal Calibration Load
The University of New Hampshire InterOperability Laboratory
DSL Consortium ADSL2 Electrical Characteristics
Conformance Test Suite v 1.6.4 15
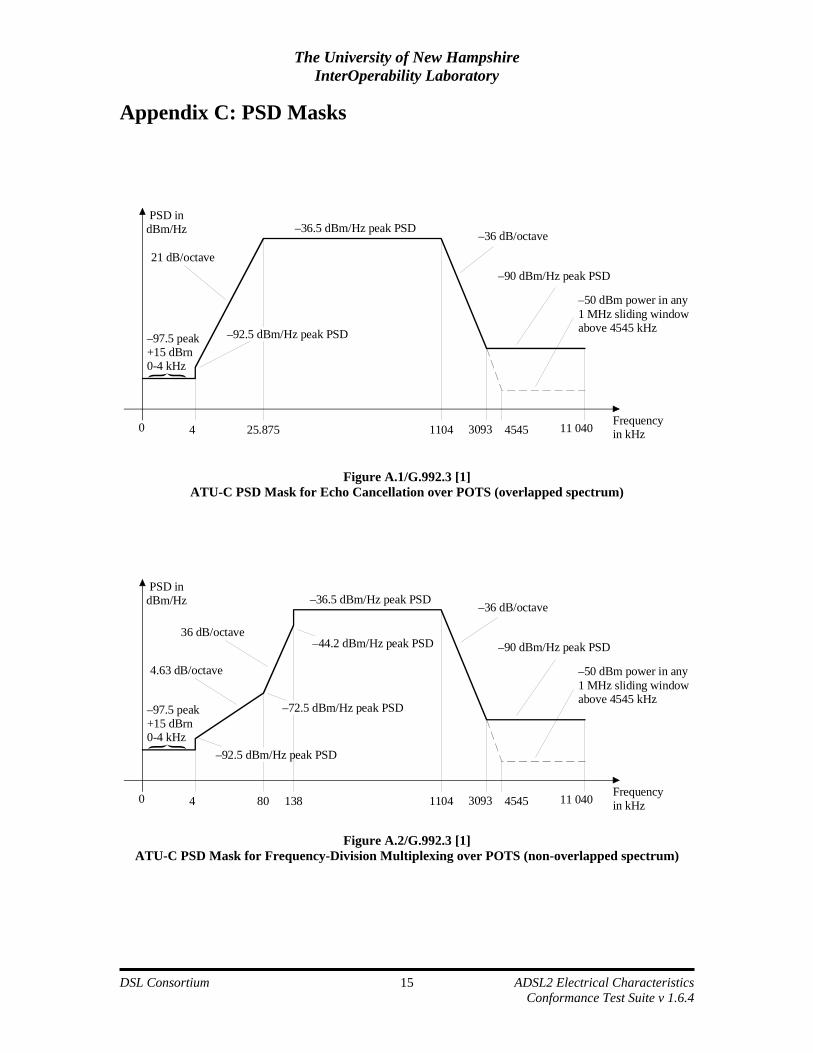
Appendix C: PSD Masks
PSD indBm/Hz
21 dB/octave
–97.5 peak+15 dBrn0-4 kHz
–92.5 dBm/Hz peak PSD
–36.5 dBm/Hz peak PSD –36 dB/octave
–90 dBm/Hz peak PSD
–50 dBm power in any1 MHz sliding windowabove 4545 kHz
0 4 25.875 1104 3093 4545 11 040 Frequencyin kHz
Figure A.1/G.992.3 [1] ATU-C PSD Mask for Echo Cancellation over POTS (overlapped spectrum)
PSD indBm/Hz
4.63 dB/octave
–97.5 peak+15 dBrn0-4 kHz
–92.5 dBm/Hz peak PSD
–36.5 dBm/Hz peak PSD –36 dB/octave
–90 dBm/Hz peak PSD
–50 dBm power in any1 MHz sliding windowabove 4545 kHz
0 4 80 1104 3093 4545 11 040 Frequencyin kHz138
–72.5 dBm/Hz peak PSD
36 dB/octave–44.2 dBm/Hz peak PSD
Figure A.2/G.992.3 [1]
ATU-C PSD Mask for Frequency-Division Multiplexing over POTS (non-overlapped spectrum)
The University of New Hampshire InterOperability Laboratory
DSL Consortium ADSL2 Electrical Characteristics
Conformance Test Suite v 1.6.4 16
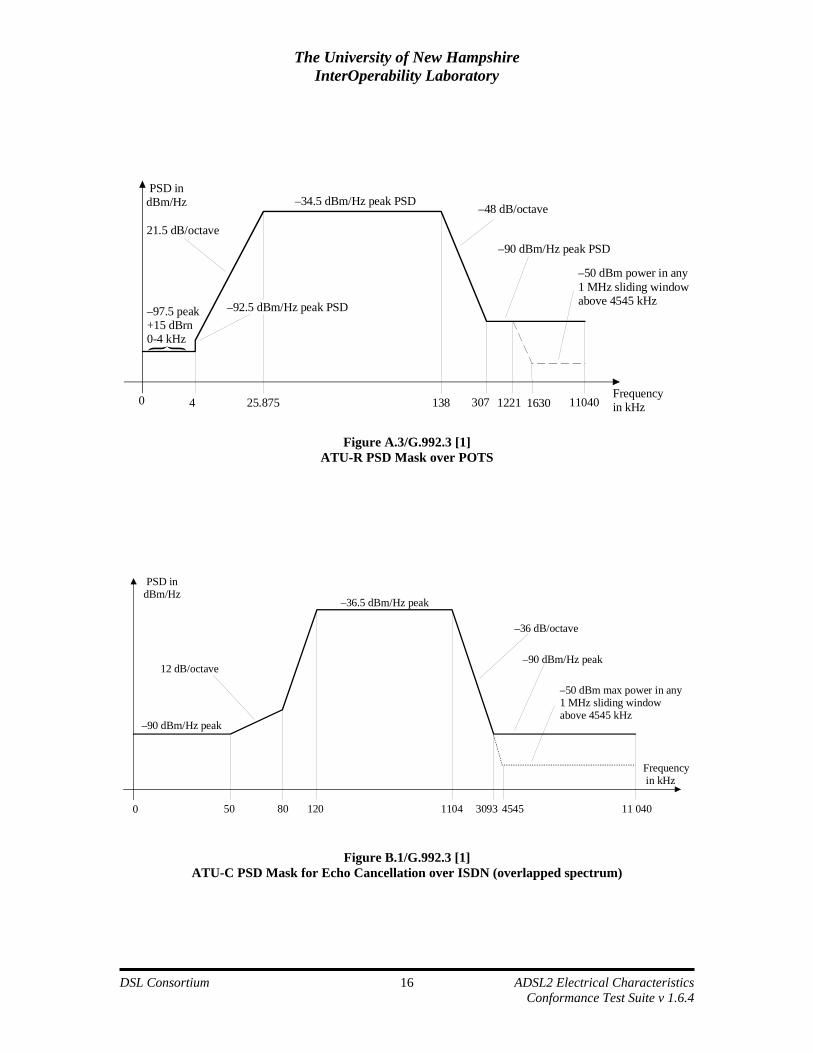
PSD indBm/Hz
21.5 dB/octave
–97.5 peak+15 dBrn0-4 kHz
–92.5 dBm/Hz peak PSD
–34.5 dBm/Hz peak PSD –48 dB/octave
–90 dBm/Hz peak PSD
–50 dBm power in any1 MHz sliding windowabove 4545 kHz
0 4 25.875 138 307 1221 11040Frequencyin kHz1630
Figure A.3/G.992.3 [1]
ATU-R PSD Mask over POTS
PSD indBm/Hz
–90 dBm/Hz peak
–36.5 dBm/Hz peak
–36 dB/octave
–90 dBm/Hz peak
–50 dBm max power in any1 MHz sliding windowabove 4545 kHz
50 1104 3093 4545 11 040
Frequency in kHz
0 80 120
12 dB/octave
Figure B.1/G.992.3 [1] ATU-C PSD Mask for Echo Cancellation over ISDN (overlapped spectrum)
The University of New Hampshire InterOperability Laboratory
DSL Consortium ADSL2 Electrical Characteristics
Conformance Test Suite v 1.6.4 17
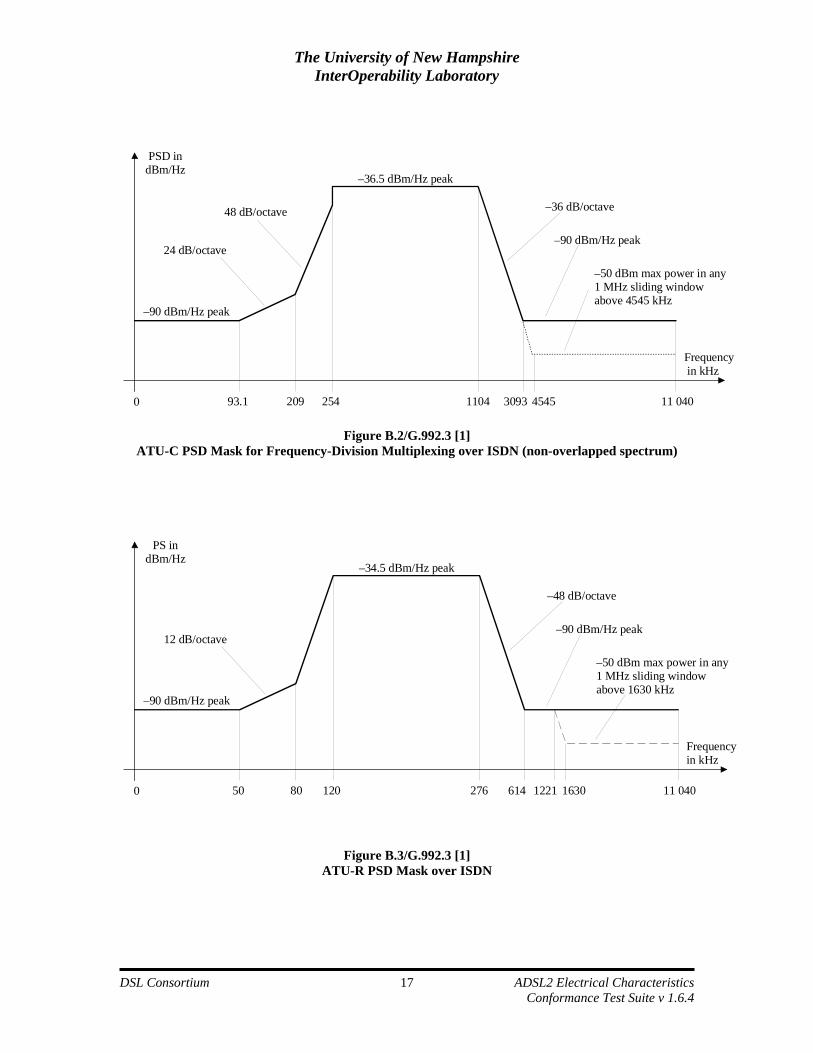
PSD indBm/Hz
–90 dBm/Hz peak
–36.5 dBm/Hz peak
–36 dB/octave
–90 dBm/Hz peak
–50 dBm max power in any1 MHz sliding windowabove 4545 kHz
93.1 1104 3093 4545 11 040
Frequency in kHz
0 209 254
24 dB/octave
48 dB/octave
Figure B.2/G.992.3 [1]
ATU-C PSD Mask for Frequency-Division Multiplexing over ISDN (non-overlapped spectrum)
PS indBm/Hz
–90 dBm/Hz peak
–34.5 dBm/Hz peak
–48 dB/octave
–90 dBm/Hz peak
–50 dBm max power in any1 MHz sliding windowabove 1630 kHz
50 276 614 1221 11 040
Frequencyin kHz
0 80 120
12 dB/octave
1630
Figure B.3/G.992.3 [1] ATU-R PSD Mask over ISDN
The University of New Hampshire InterOperability Laboratory
DSL Consortium ADSL2 Electrical Characteristics
Conformance Test Suite v 1.6.4 18
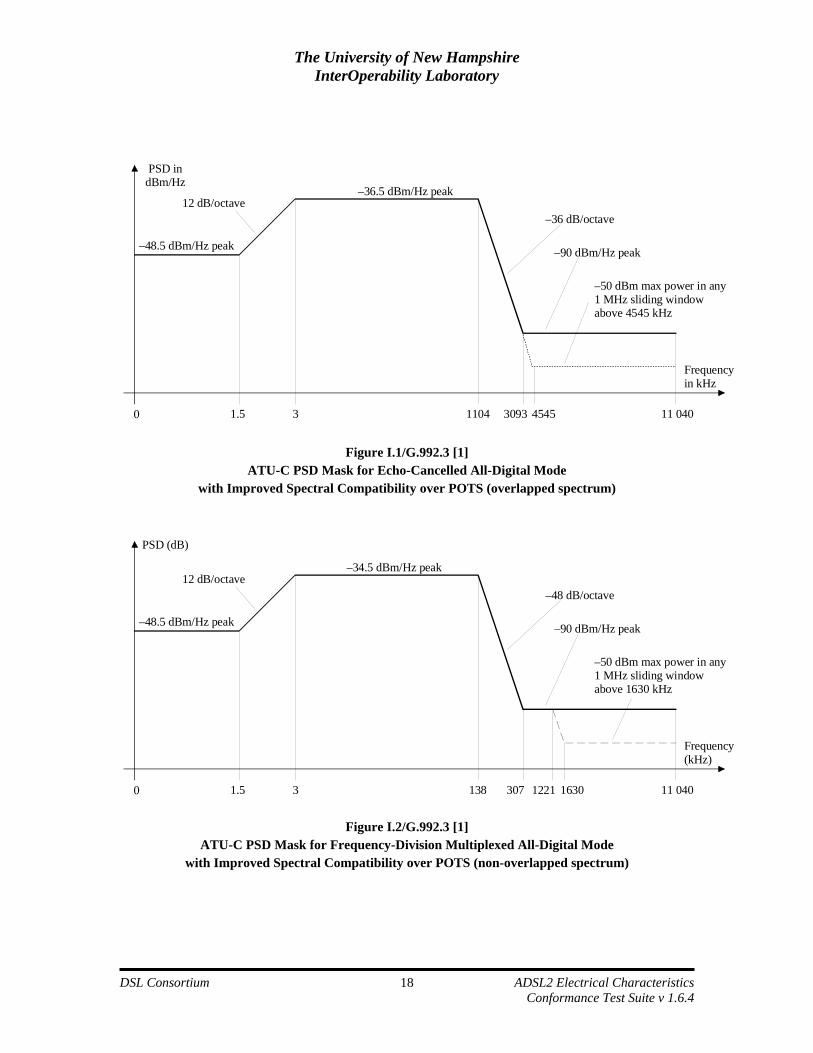
PSD indBm/Hz
–48.5 dBm/Hz peak
–36.5 dBm/Hz peak
–36 dB/octave
–90 dBm/Hz peak
–50 dBm max power in any1 MHz sliding windowabove 4545 kHz
1.5 1104 3093 4545 11 040
Frequencyin kHz
0 3
12 dB/octave
Figure I.1/G.992.3 [1]
ATU-C PSD Mask for Echo-Cancelled All-Digital Mode with Improved Spectral Compatibility over POTS (overlapped spectrum)
PSD (dB)
–48.5 dBm/Hz peak
–34.5 dBm/Hz peak
–48 dB/octave
–90 dBm/Hz peak
–50 dBm max power in any1 MHz sliding windowabove 1630 kHz
1.5 138 307 1221 11 040
Frequency(kHz)
0 3
12 dB/octave
1630
Figure I.2/G.992.3 [1] ATU-C PSD Mask for Frequency-Division Multiplexed All-Digital Mode
with Improved Spectral Compatibility over POTS (non-overlapped spectrum)
The University of New Hampshire InterOperability Laboratory
DSL Consortium ADSL2 Electrical Characteristics
Conformance Test Suite v 1.6.4 19
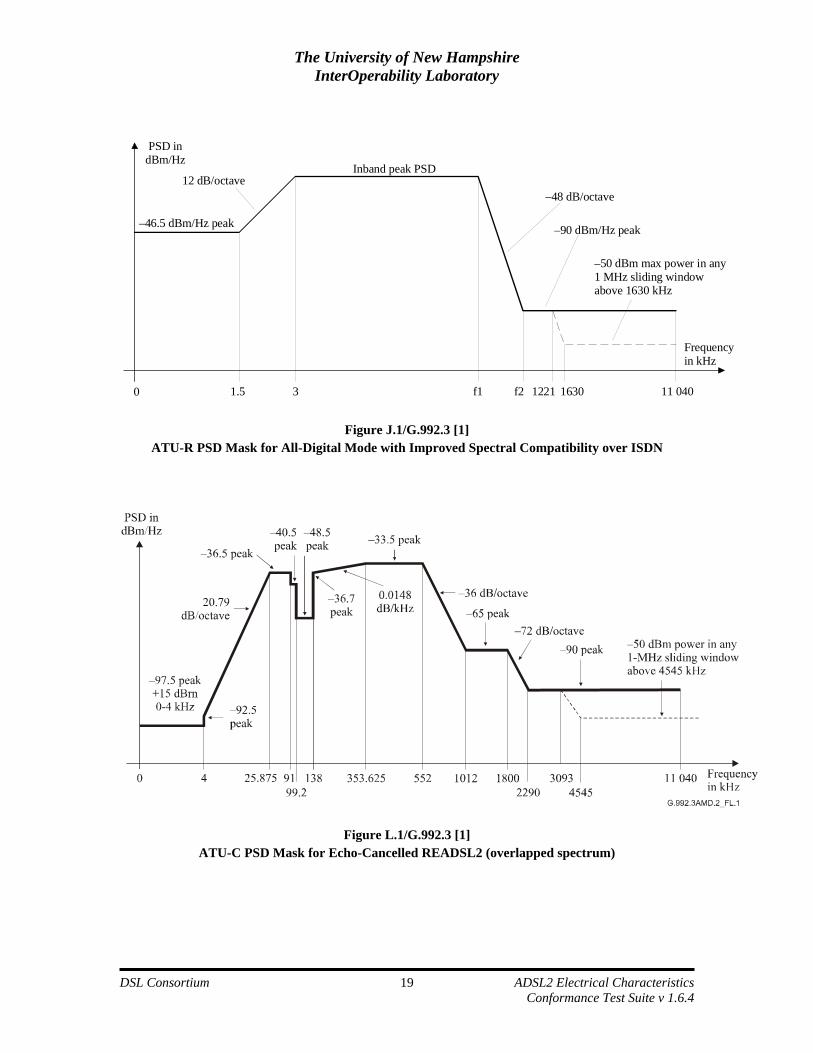
PSD indBm/Hz
–46.5 dBm/Hz peak
Inband peak PSD
–48 dB/octave
–90 dBm/Hz peak
–50 dBm max power in any1 MHz sliding windowabove 1630 kHz
1.5 f1 f2 1221 11 040
Frequencyin kHz
0 3
12 dB/octave
1630
Figure J.1/G.992.3 [1]
ATU-R PSD Mask for All-Digital Mode with Improved Spectral Compatibility over ISDN
Figure L.1/G.992.3 [1]
ATU-C PSD Mask for Echo-Cancelled READSL2 (overlapped spectrum)
The University of New Hampshire InterOperability Laboratory
DSL Consortium ADSL2 Electrical Characteristics
Conformance Test Suite v 1.6.4 20
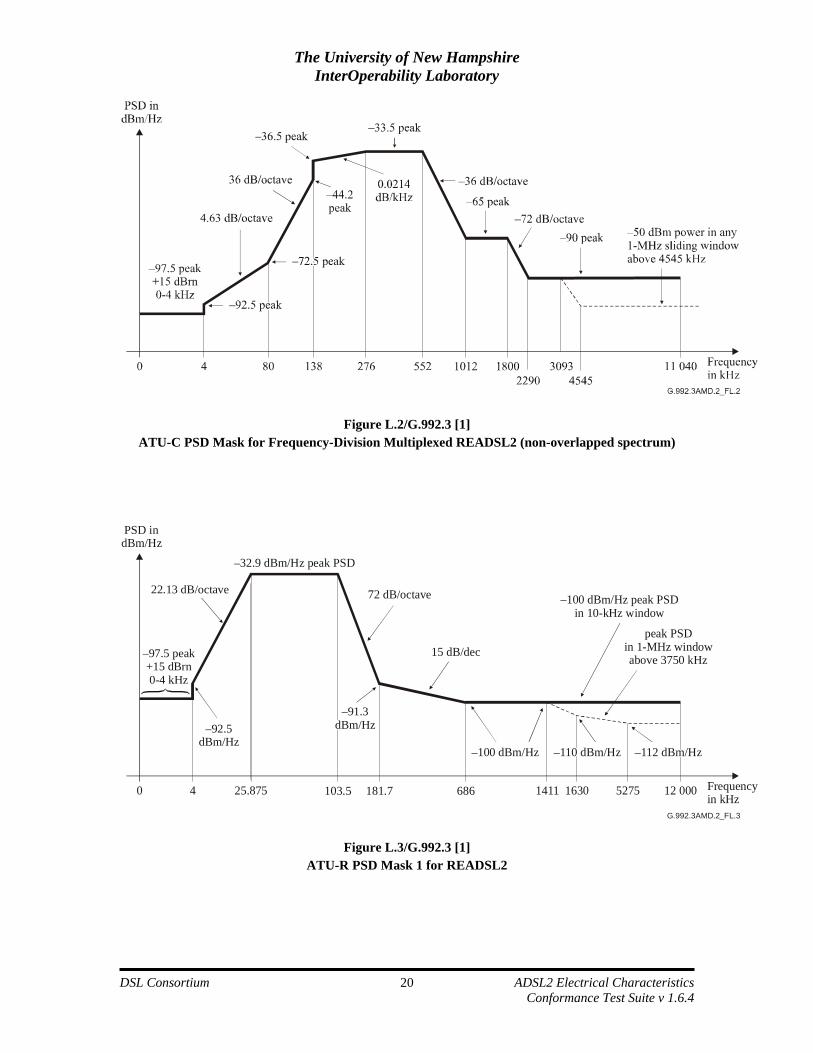
Figure L.2/G.992.3 [1]
ATU-C PSD Mask for Frequency-Division Multiplexed READSL2 (non-overlapped spectrum)
G.992.3AMD.2_FL.3
PSD indBm/Hz
–32.9 dBm/Hz peak PSD
72 dB/octave –100 dBm/Hz peak PSDin 10-kHz window
peak PSDin 1-MHz windowabove 3750 kHz
0 4 25.875 686181.7103.5 12 000 Frequencyin kHz
52751411 1630
15 dB/dec
–110 dBm/Hz –112 dBm/Hz–100 dBm/Hz
22.13 dB/octave
–97.5 peak+15 dBrn0-4 kHz
–92.5dBm/Hz
–91.3dBm/Hz
Figure L.3/G.992.3 [1]
ATU-R PSD Mask 1 for READSL2
The University of New Hampshire InterOperability Laboratory
DSL Consortium ADSL2 Electrical Characteristics
Conformance Test Suite v 1.6.4 21
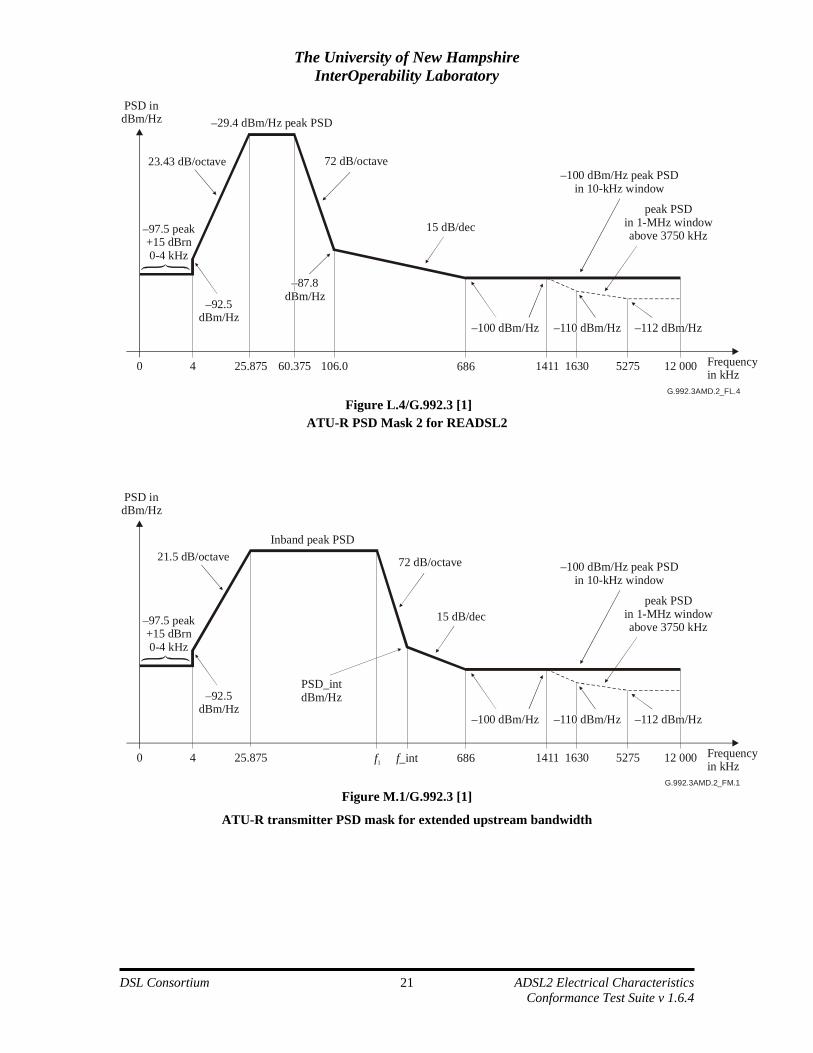
G.992.3AMD.2_FL.4
PSD indBm/Hz –29.4 dBm/Hz peak PSD
72 dB/octave–100 dBm/Hz peak PSD
in 10-kHz window
peak PSDin 1-MHz windowabove 3750 kHz
0 4 25.875 60.375 106.0 686 12 000 Frequencyin kHz
52751411 1630
15 dB/dec
–110 dBm/Hz –112 dBm/Hz–100 dBm/Hz
23.43 dB/octave
–97.5 peak+15 dBrn0-4 kHz
–92.5dBm/Hz
–87.8dBm/Hz
Figure L.4/G.992.3 [1] ATU-R PSD Mask 2 for READSL2
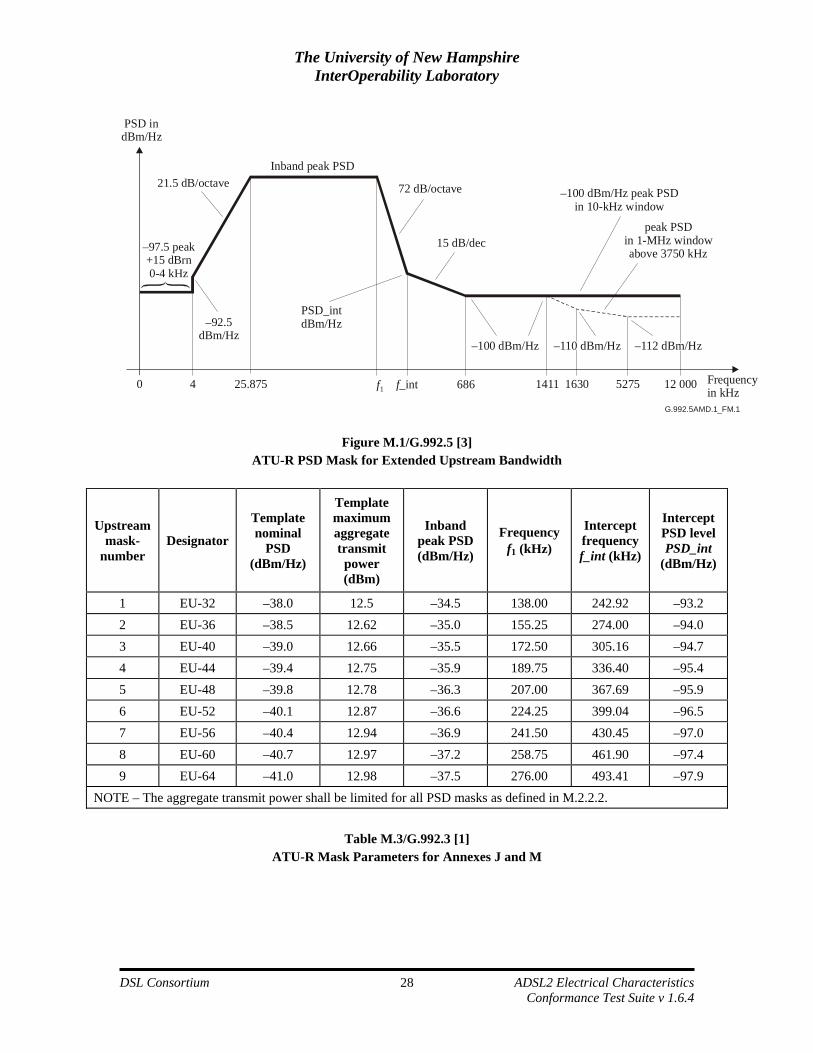
G.992.3AMD.2_FM.1
PSD indBm/Hz
Inband peak PSD
72 dB/octave –100 dBm/Hz peak PSDin 10-kHz window
peak PSDin 1-MHz windowabove 3750 kHz
0 4 25.875 f1 686 12 000 Frequencyin kHz
52751411 1630
15 dB/dec
PSD_intdBm/Hz
–110 dBm/Hz –112 dBm/Hz–100 dBm/Hz
f_int
21.5 dB/octave
–97.5 peak+15 dBrn0-4 kHz
–92.5dBm/Hz
Figure M.1/G.992.3 [1]
ATU-R transmitter PSD mask for extended upstream bandwidth
The University of New Hampshire InterOperability Laboratory
DSL Consortium ADSL2 Electrical Characteristics
Conformance Test Suite v 1.6.4 22
25.875
PSD indBm/Hz
21 dB/octave
–92.5peak
–36.5 peak
–36 dB/octave–65 peak
–72 dB/octave–90 peak
–50 dBm power in any1 MHz sliding windowabove 4545 kHz
Frequencyin kHz0 4 3093 11 040
4545552 956 1800
2290
–97.5 peak+15 dBrn0-4 kHz
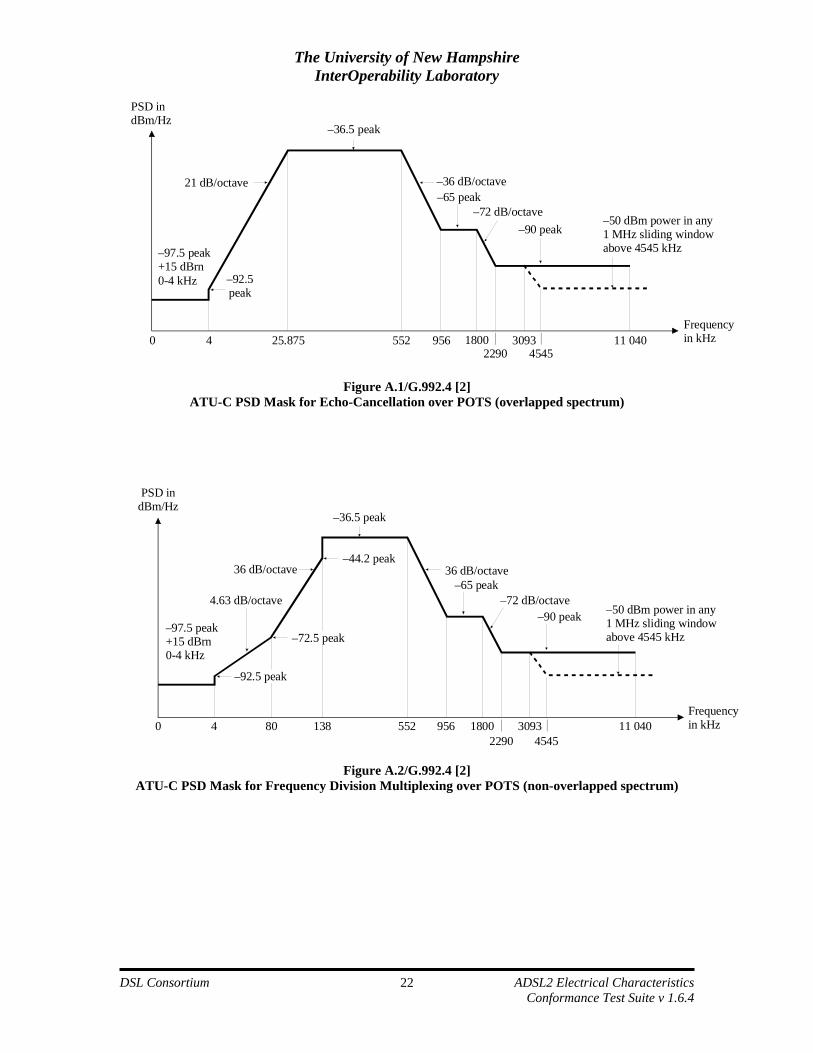
Figure A.1/G.992.4 [2] ATU-C PSD Mask for Echo-Cancellation over POTS (overlapped spectrum)
PSD indBm/Hz
36 dB/octave
4.63 dB/octave
36 dB/octave
–72 dB/octave
–44.2 peak
–72.5 peak
–92.5 peak
–36.5 peak
–65 peak
–90 peak –50 dBm power in any1 MHz sliding windowabove 4545 kHz
Frequencyin kHz0 4 138 3093 11 040
454580 552 956 1800
2290
–97.5 peak+15 dBrn0-4 kHz
Figure A.2/G.992.4 [2] ATU-C PSD Mask for Frequency Division Multiplexing over POTS (non-overlapped spectrum)
The University of New Hampshire InterOperability Laboratory
DSL Consortium ADSL2 Electrical Characteristics
Conformance Test Suite v 1.6.4 23
3
PSD indBm/Hz
21 dB/octave –36.5 peak
–36 dB/octave–65 peak
–72 dB/octave–90 peak
–50 dBm power in any1 MHz sliding windowabove 4545 kHz
Frequencyin kHz0 1.5 3093 11 040552 956 1800
45452290
–48.5 peak
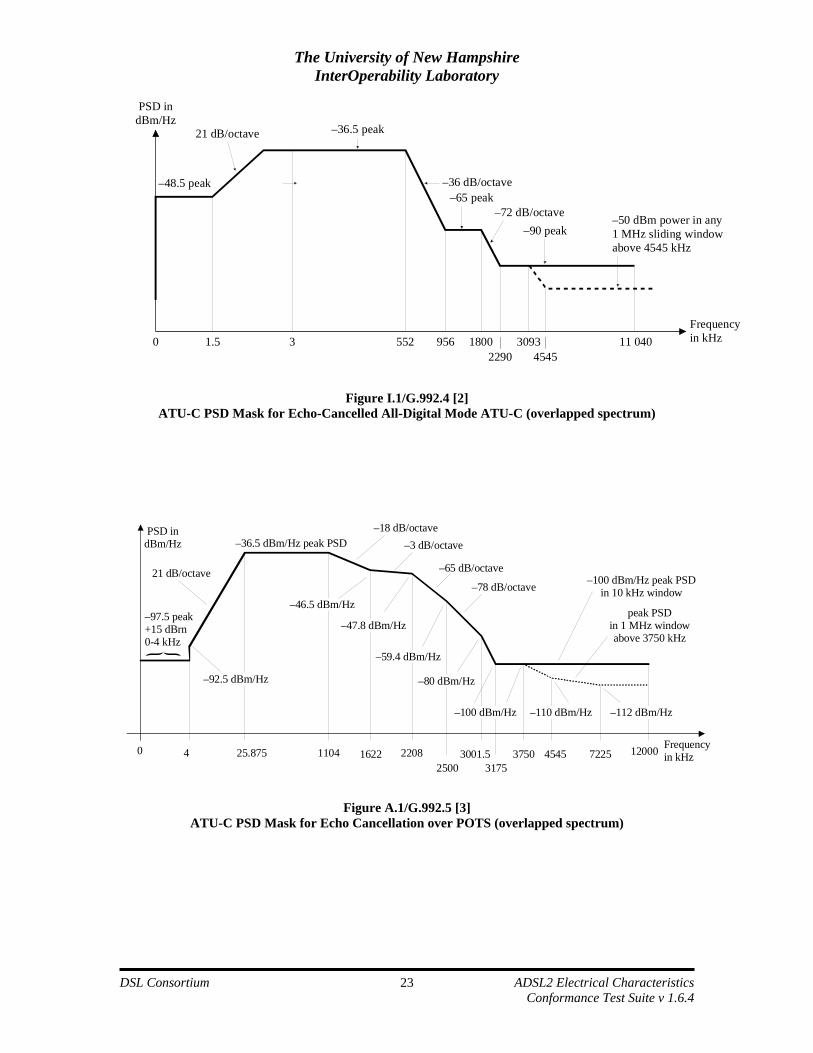
Figure I.1/G.992.4 [2] ATU-C PSD Mask for Echo-Cancelled All-Digital Mode ATU-C (overlapped spectrum)
PSD indBm/Hz
21 dB/octave
–97.5 peak+15 dBrn0-4 kHz
–36.5 dBm/Hz peak PSD
–65 dB/octave–100 dBm/Hz peak PSD
in 10 kHz window
peak PSDin 1 MHz windowabove 3750 kHz
0 4 25.875 1104 2208 12000 Frequencyin kHz
31751622 3001.5
250072253750 4545
–18 dB/octave–3 dB/octave
–78 dB/octave–46.5 dBm/Hz
–92.5 dBm/Hz
–47.8 dBm/Hz
–59.4 dBm/Hz
–80 dBm/Hz
–110 dBm/Hz –112 dBm/Hz–100 dBm/Hz
Figure A.1/G.992.5 [3]
ATU-C PSD Mask for Echo Cancellation over POTS (overlapped spectrum)
The University of New Hampshire InterOperability Laboratory
DSL Consortium ADSL2 Electrical Characteristics
Conformance Test Suite v 1.6.4 24
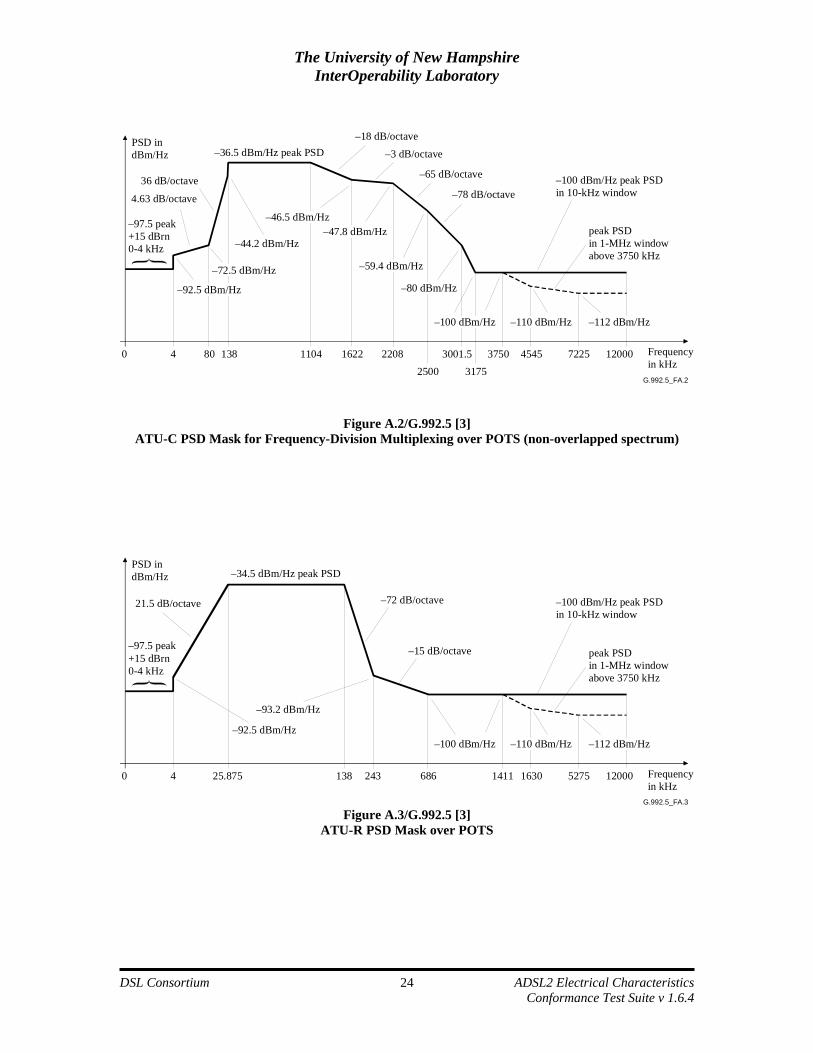
G.992.5_FA.2
36 dB/octave
–36.5 dBm/Hz peak PSD
–65 dB/octave
0 4 1104 2208 120003175
1622 3001.52500
72253750 4545
–18 dB/octave
–3 dB/octave
–78 dB/octave
–46.5 dBm/Hz
–92.5 dBm/Hz
–47.8 dBm/Hz
–59.4 dBm/Hz
–80 dBm/Hz
–110 dBm/Hz –112 dBm/Hz–100 dBm/Hz
PSD indBm/Hz
–97.5 peak+15 dBrn0-4 kHz
–100 dBm/Hz peak PSDin 10-kHz window
peak PSDin 1-MHz windowabove 3750 kHz
Frequencyin kHz
–72.5 dBm/Hz
–44.2 dBm/Hz
4.63 dB/octave
80 138
Figure A.2/G.992.5 [3] ATU-C PSD Mask for Frequency-Division Multiplexing over POTS (non-overlapped spectrum)
G.992.5_FA.3
21.5 dB/octave
–34.5 dBm/Hz peak PSD
0 4 25.875 243 12000138 52751411 1630
–72 dB/octave
–15 dB/octave
–93.2 dBm/Hz
–92.5 dBm/Hz–110 dBm/Hz –112 dBm/Hz–100 dBm/Hz
PSD indBm/Hz
–97.5 peak+15 dBrn0-4 kHz
–100 dBm/Hz peak PSDin 10-kHz window
peak PSDin 1-MHz windowabove 3750 kHz
Frequencyin kHz
686
Figure A.3/G.992.5 [3]
ATU-R PSD Mask over POTS
The University of New Hampshire InterOperability Laboratory
DSL Consortium ADSL2 Electrical Characteristics
Conformance Test Suite v 1.6.4 25
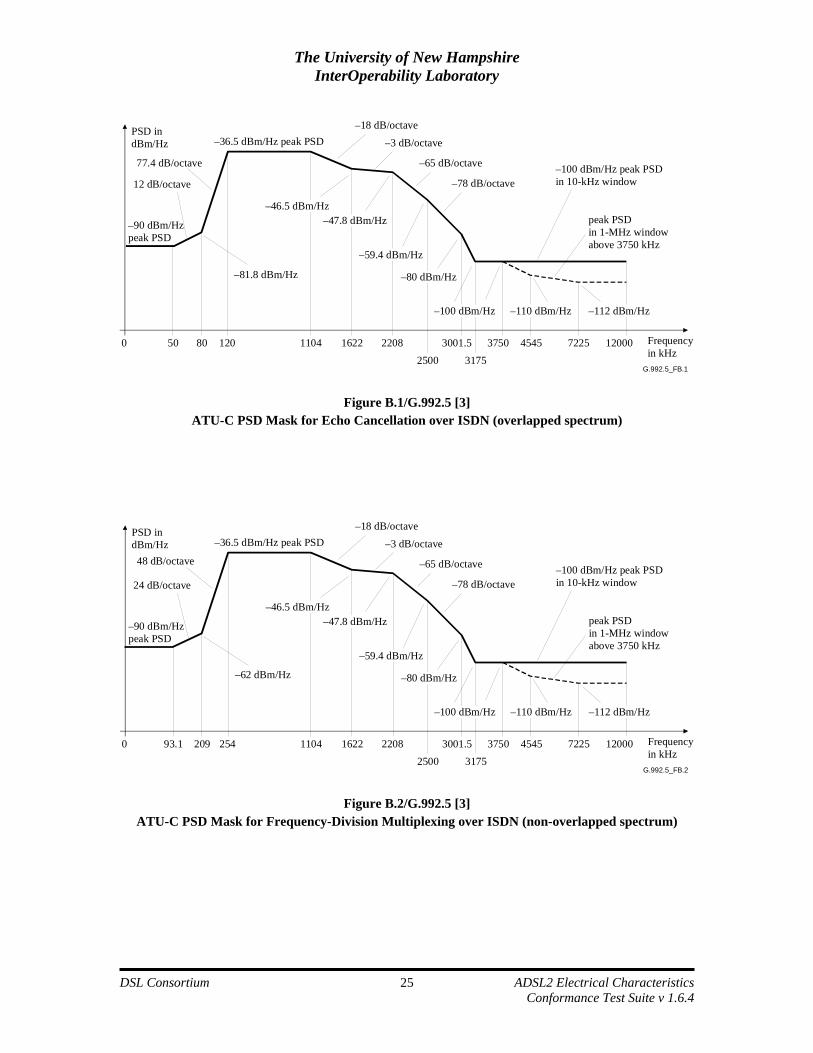
G.992.5_FB.1
77.4 dB/octave
–36.5 dBm/Hz peak PSD
–65 dB/octave
0 50 120 1104 2208 120003175
1622 3001.52500
72253750 4545
–18 dB/octave
–3 dB/octave
–78 dB/octave
–46.5 dBm/Hz
–81.8 dBm/Hz
–47.8 dBm/Hz
–59.4 dBm/Hz
–80 dBm/Hz
–110 dBm/Hz –112 dBm/Hz–100 dBm/Hz
PSD indBm/Hz
–90 dBm/Hzpeak PSD
–100 dBm/Hz peak PSDin 10-kHz window
peak PSDin 1-MHz windowabove 3750 kHz
Frequencyin kHz
12 dB/octave
80
Figure B.1/G.992.5 [3] ATU-C PSD Mask for Echo Cancellation over ISDN (overlapped spectrum)
G.992.5_FB.2
48 dB/octave
–36.5 dBm/Hz peak PSD
–65 dB/octave
0 93.1 254 1104 2208 120003175
1622 3001.52500
72253750 4545
–18 dB/octave
–3 dB/octave
–78 dB/octave
–46.5 dBm/Hz
–62 dBm/Hz
–47.8 dBm/Hz
–59.4 dBm/Hz
–80 dBm/Hz
–110 dBm/Hz –112 dBm/Hz–100 dBm/Hz
PSD indBm/Hz
–90 dBm/Hzpeak PSD
–100 dBm/Hz peak PSDin 10-kHz window
peak PSDin 1-MHz windowabove 3750 kHz
Frequencyin kHz
24 dB/octave
209
Figure B.2/G.992.5 [3] ATU-C PSD Mask for Frequency-Division Multiplexing over ISDN (non-overlapped spectrum)
The University of New Hampshire InterOperability Laboratory
DSL Consortium ADSL2 Electrical Characteristics
Conformance Test Suite v 1.6.4 26
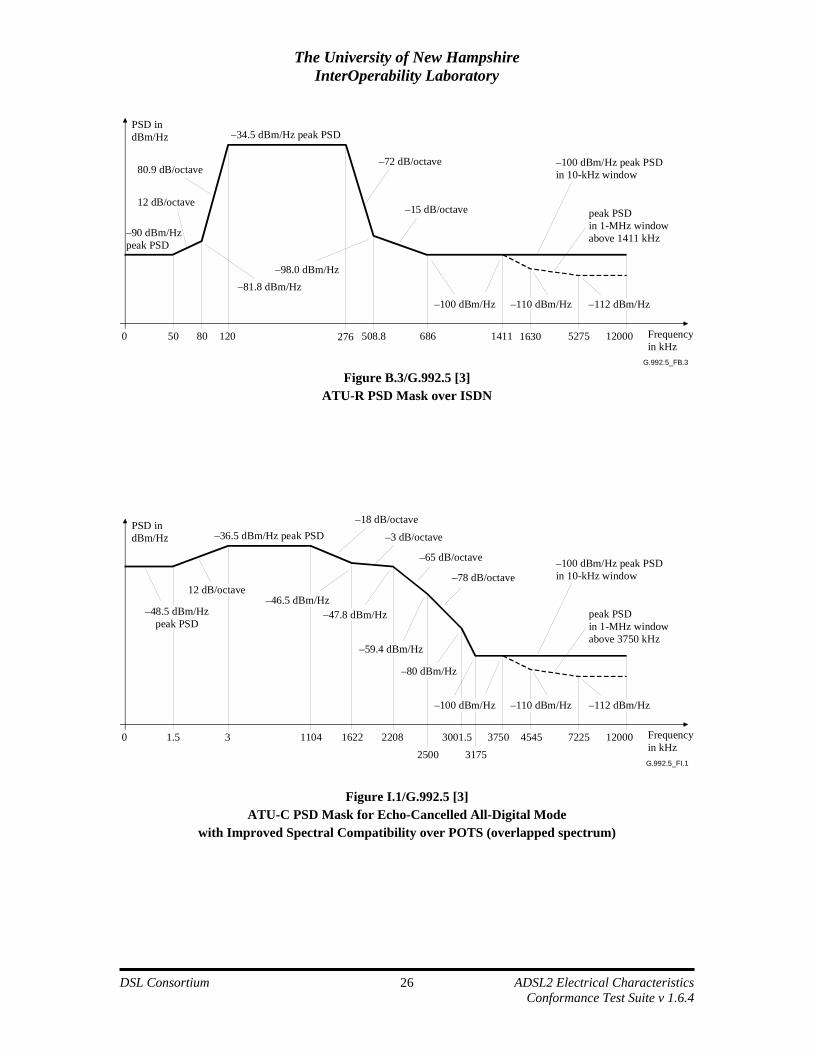
G.992.5_FB.3
80.9 dB/octave
–34.5 dBm/Hz peak PSD
–15 dB/octave
0 50 120 276 12000508.8 52751411 1630
–72 dB/octave
–98.0 dBm/Hz–81.8 dBm/Hz
–110 dBm/Hz –112 dBm/Hz–100 dBm/Hz
PSD indBm/Hz
–90 dBm/Hzpeak PSD
–100 dBm/Hz peak PSDin 10-kHz window
peak PSDin 1-MHz windowabove 1411 kHz
Frequencyin kHz
12 dB/octave
80 686
Figure B.3/G.992.5 [3]
ATU-R PSD Mask over ISDN
G.992.5_FI.1
–36.5 dBm/Hz peak PSD
–65 dB/octave
0 1.5 3 1104 2208 120003175
1622 3001.52500
72253750 4545
–18 dB/octave
–3 dB/octave
–78 dB/octave
–46.5 dBm/Hz–48.5 dBm/Hz
peak PSD–47.8 dBm/Hz
–59.4 dBm/Hz
–80 dBm/Hz
–110 dBm/Hz –112 dBm/Hz–100 dBm/Hz
PSD indBm/Hz
–100 dBm/Hz peak PSDin 10-kHz window
peak PSDin 1-MHz windowabove 3750 kHz
Frequencyin kHz
12 dB/octave
Figure I.1/G.992.5 [3] ATU-C PSD Mask for Echo-Cancelled All-Digital Mode
with Improved Spectral Compatibility over POTS (overlapped spectrum)
The University of New Hampshire InterOperability Laboratory
DSL Consortium ADSL2 Electrical Characteristics
Conformance Test Suite v 1.6.4 27
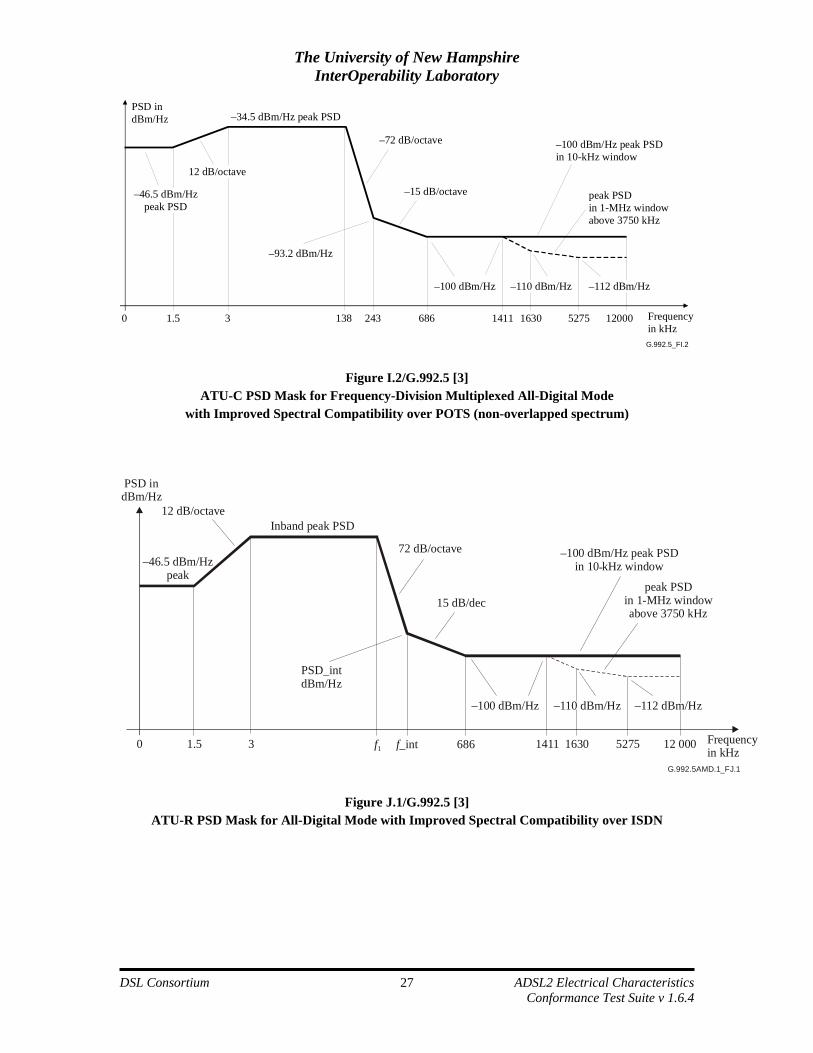
G.992.5_FI.2
–34.5 dBm/Hz peak PSD
–72 dB/octave
0 1.5 3 12000138 52751411 1630
–15 dB/octave
–93.2 dBm/Hz
–46.5 dBm/Hzpeak PSD
–110 dBm/Hz –112 dBm/Hz–100 dBm/Hz
PSD indBm/Hz
–100 dBm/Hz peak PSDin 10-kHz window
peak PSDin 1-MHz windowabove 3750 kHz
Frequencyin kHz
12 dB/octave
243 686
Figure I.2/G.992.5 [3] ATU-C PSD Mask for Frequency-Division Multiplexed All-Digital Mode
with Improved Spectral Compatibility over POTS (non-overlapped spectrum)
G.992.5AMD.1_FJ.1
PSD indBm/Hz
Inband peak PSD
72 dB/octave –100 dBm/Hz peak PSDin 10 kHz window
peak PSDin 1-MHz windowabove 3750 kHz
0 1.5 3 f1 686 12 000 Frequencyin kHz
52751411 1630
15 dB/dec
PSD_intdBm/Hz
–110 dBm/Hz –112 dBm/Hz–100 dBm/Hz
f_int
–46.5 dBm/Hzpeak
12 dB/octave
-
Figure J.1/G.992.5 [3]
ATU-R PSD Mask for All-Digital Mode with Improved Spectral Compatibility over ISDN
The University of New Hampshire InterOperability Laboratory
DSL Consortium ADSL2 Electrical Characteristics
Conformance Test Suite v 1.6.4 28
G.992.5AMD.1_FM.1
PSD indBm/Hz
Inband peak PSD
72 dB/octave –100 dBm/Hz peak PSDin 10-kHz window
peak PSDin 1-MHz windowabove 3750 kHz
0 4 25.875 f1 686 12 000 Frequencyin kHz
52751411 1630
15 dB/dec
PSD_intdBm/Hz
–110 dBm/Hz –112 dBm/Hz–100 dBm/Hz
f_int
21.5 dB/octave
–97.5 peak+15 dBrn0-4 kHz
–92.5dBm/Hz
Figure M.1/G.992.5 [3]
ATU-R PSD Mask for Extended Upstream Bandwidth
Upstream mask-
number Designator
Template nominal
PSD (dBm/Hz)
Template maximum aggregate transmit
power (dBm)
Inband peak PSD (dBm/Hz)
Frequency f1 (kHz)
Intercept frequency f_int (kHz)
Intercept PSD level PSD_int
(dBm/Hz)
1 EU-32 –38.0 12.5 –34.5 138.00 242.92 –93.2 2 EU-36 –38.5 12.62 –35.0 155.25 274.00 –94.0 3 EU-40 –39.0 12.66 –35.5 172.50 305.16 –94.7 4 EU-44 –39.4 12.75 –35.9 189.75 336.40 –95.4 5 EU-48 –39.8 12.78 –36.3 207.00 367.69 –95.9 6 EU-52 –40.1 12.87 –36.6 224.25 399.04 –96.5 7 EU-56 –40.4 12.94 –36.9 241.50 430.45 –97.0 8 EU-60 –40.7 12.97 –37.2 258.75 461.90 –97.4 9 EU-64 –41.0 12.98 –37.5 276.00 493.41 –97.9
NOTE – The aggregate transmit power shall be limited for all PSD masks as defined in M.2.2.2.
Table M.3/G.992.3 [1]
ATU-R Mask Parameters for Annexes J and M


![1.6.4 Vulnerability Scanning Service (VSS) [C.2.10.3]€¦ · 01/12/2018 · 1.6.4 Vulnerability Scanning Service (VSS) [C.2.10.3] Vulnerability scanning is a major component of](https://img.pdfslide.us/doc/110x75/5f53e424f8b2f461df2e920d/164-vulnerability-scanning-service-vss-c2103-01122018-164-vulnerability.jpg)