Embed Size (px)
Citation preview

DSC 201: Data Analysis & Visualization
Visualization Tools
Dr. David Koop
D. Koop, DSC 201, Fall 2016
Visualization for Exploration
2D. Koop, DSC 201, Fall 2016

MTA Fare Data Exploration
3D. Koop, DSC 201, Fall 2016

MTA Fare Data Exploration
4D. Koop, DSC 201, Fall 2016
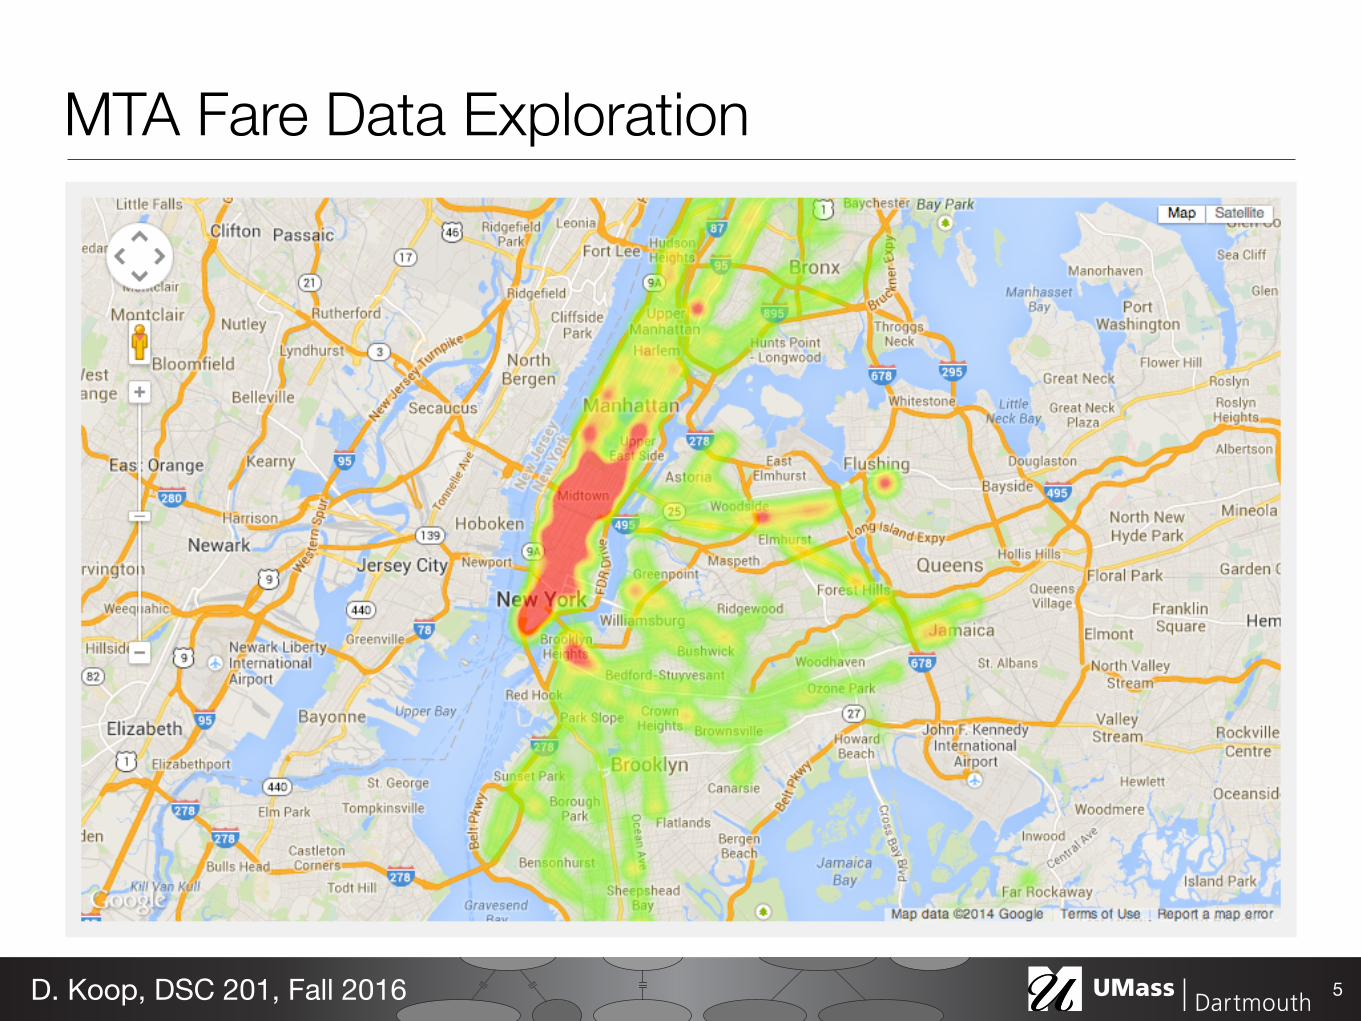
MTA Fare Data Exploration
5D. Koop, DSC 201, Fall 2016

MTA Fare Data Exploration
5D. Koop, DSC 201, Fall 2016

MTA Fare Data Exploration
6D. Koop, DSC 201, Fall 2016

MTA Fare Data Exploration
7D. Koop, DSC 201, Fall 2016

MTA Fare Data Exploration
7D. Koop, DSC 201, Fall 2016
A U G U S TS U N M O N T U E W E D T H U F R I S A T
2 3
10
17
24
31
9
16
23
30
SD SDHOU DETDETT OR DET
DET DETCHW COLCHWSD CHW
BOS BOSLAA LAALAADET LAA
TB TBTOR TORTORBOS TOR
BAL BALTOR TORTORTB TOR
1
8
15
22
29
1
7
14
21
28
3
6
13
20
27
2
5
12
19
26
1
4
11
18
25
1:10 1:10 10:10 8:40
8:104:10 8:10 8:10 1:10 7:05 1:05
7:05TBA 7:05
7:071:40 7:07 7:077:07 7:05 1:05
7:05 1:05 7:10 4:05
1:10TBA 7:05 7:05 1:05 7:10 7:10
YES YES YES
YES YES MY9 YES YES YES YES
TBA YES YES YES YES MY9 FOX
TBA YES MY9 YES YES MY9 YES
YES YES YES YES YES YES YES
S E P T E M B E RS U N M O N T U E W E D T H U F R I S A T
6 7
14
21
28
30
13
20
27
29
BOS BOSCHW BOSCHWBAL CHW
BOS BOSBAL BALBALBOS BAL
SF SFTORTOR TOR TORBOS
HOU HOUTB TBTBSF TB
T OR T ORCHW CHWHOUHOU HOU
5
12
19
26
28
4
11
18
25
27
3
10
17
24
30
2
9
16
23
30
1
8
15
22
29ALL GAMES ARE EASTERN TIME.
1:051:05 7:05 7:05 7:05 7:05 1:05
7:05TBA 7:05 7:05 7:05 7:10 1:05
1:10TBA 7:07
1:102:10 1:10
7:07 7:07 7:05 TBA
1:101:05 7:05 7:05 7:05 8:10 TBA
TBA YES MY9 YES YES MY9 FOX
YES YES YES YES YES YES FOX
TBA YES MY9 YES YES YES TBA
YES YES
YES YES
MY9 YES YES YES TBA
2 013 R E G U L A R S E A S O N S C H E D U L E

Visualization for Explanation
8D. Koop, DSC 201, Fall 2016

Design Iteration
9D. Koop, DSC 201, Fall 2016
http://kpq.github.io/chartsnthings/2013/09/19-sketches-of-quarterback-timelines.html

Definition
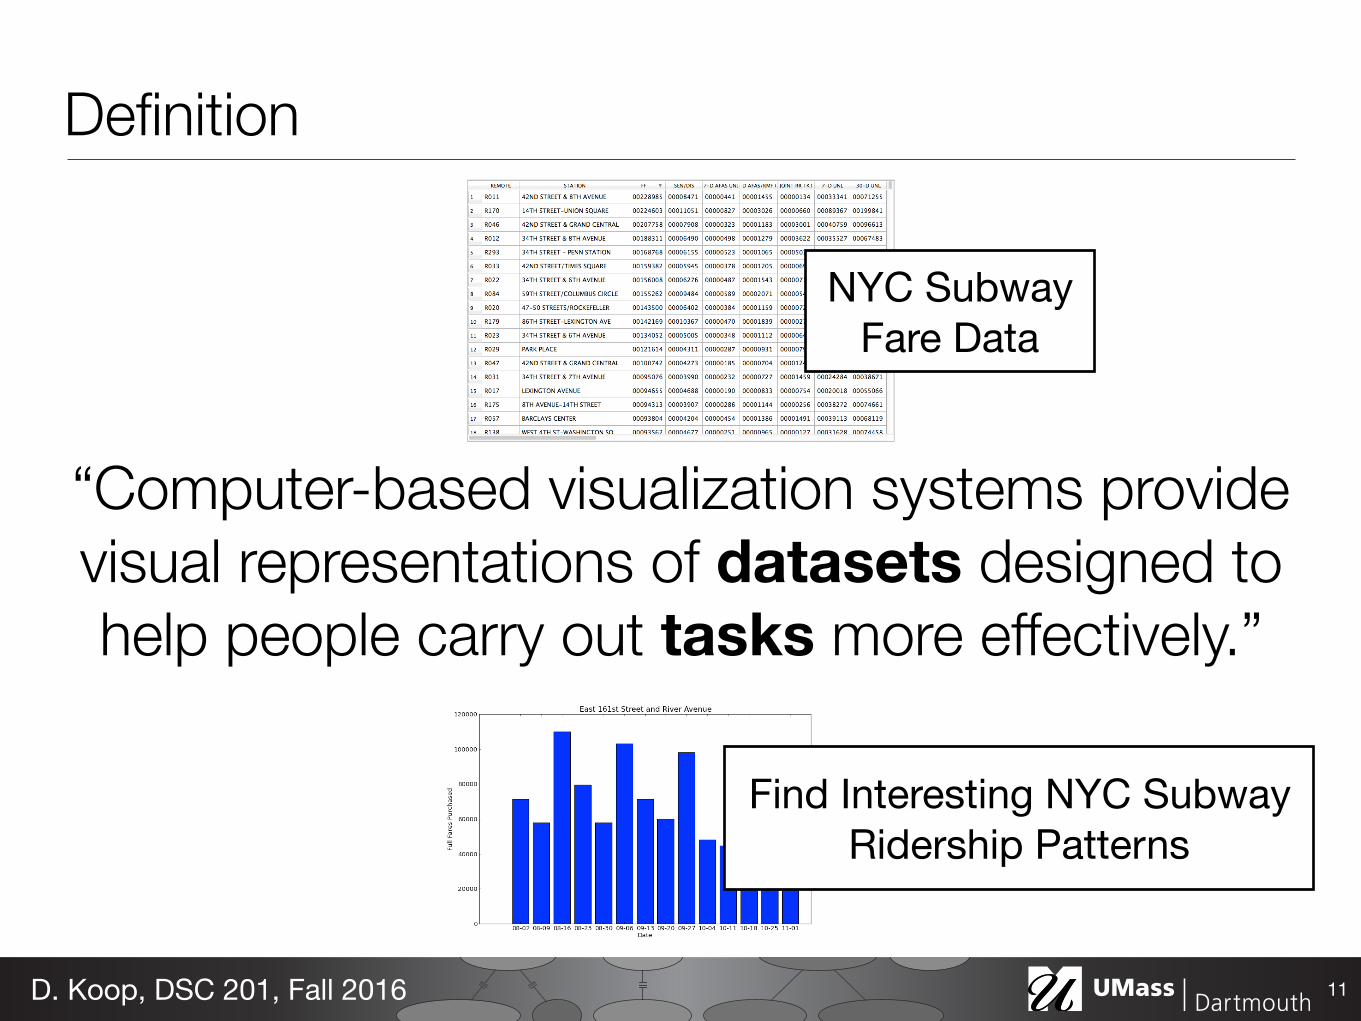
“Computer-based visualization systems provide visual representations of datasets designed to help people carry out tasks more effectively.”
— T. Munzner
10D. Koop, DSC 201, Fall 2016

Definition
“Computer-based visualization systems provide visual representations of datasets designed to help people carry out tasks more effectively.”
11D. Koop, DSC 201, Fall 2016

Definition
“Computer-based visualization systems provide visual representations of datasets designed to help people carry out tasks more effectively.”
11D. Koop, DSC 201, Fall 2016
NYC Subway Fare Data
Definition
“Computer-based visualization systems provide visual representations of datasets designed to help people carry out tasks more effectively.”
11D. Koop, DSC 201, Fall 2016
Find Interesting NYC Subway Ridership Patterns
NYC Subway Fare Data

Definition
“Computer-based visualization systems provide visual representations of datasets designed to help people carry out tasks more effectively.”
12D. Koop, DSC 201, Fall 2016
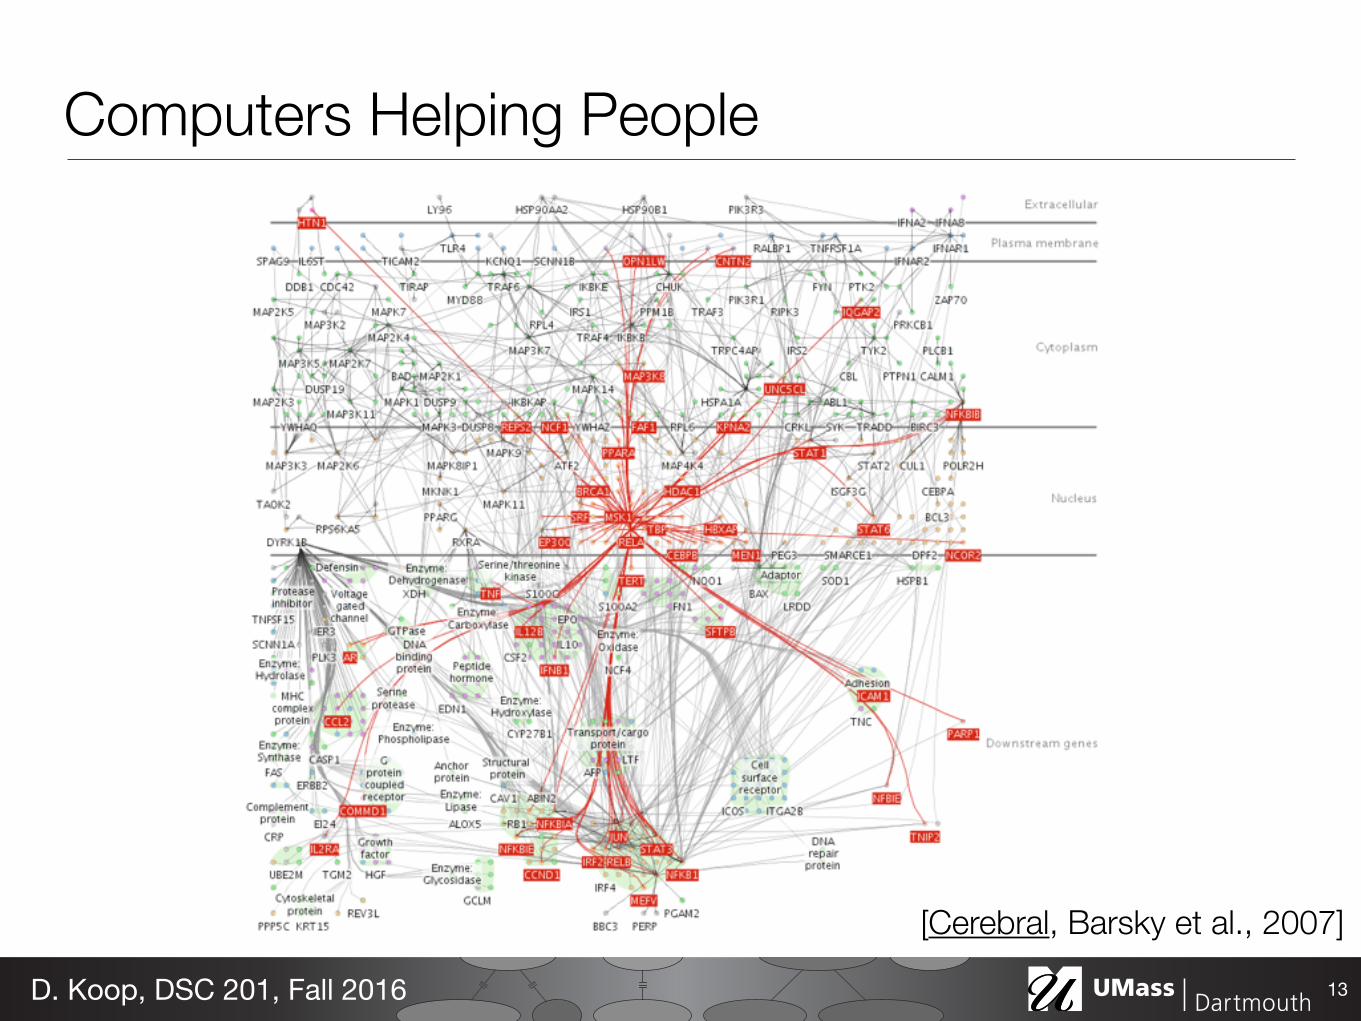
Computers Helping People
13D. Koop, DSC 201, Fall 2016
[Cerebral, Barsky et al., 2007]

Definition
“Computer-based visualization systems provide visual representations of datasets designed to help people carry out tasks more effectively”
14D. Koop, DSC 201, Fall 2016

●
●●
●●
●
●
●
●
●●
4 6 8 10 12 14 16 18
4
6
8
10
12
x1
y 1
●●
●●●
●
●
●
●
●
●
4 6 8 10 12 14 16 18
4
6
8
10
12
x2
y 2●
●
●
●●
●
●●
●
●●
4 6 8 10 12 14 16 18
4
6
8
10
12
x3
y 3
●●
●
●●
●
●
●
●
●
●
4 6 8 10 12 14 16 18
4
6
8
10
12
x4
y 4
Why Visual?
15D. Koop, DSC 201, Fall 2016
[F. J. Anscombe]

Definition
“Computer-based visualization systems provide visual representations of datasets designed to help people carry out tasks more effectively”
16D. Koop, DSC 201, Fall 2016

Design Iteration
17D. Koop, DSC 201, Fall 2016
http://chartsnthings.tumblr.com/post/62679766588/19-sketches-of-quarterback-timelines

Definition
“Computer-based visualization systems provide visual representations of datasets designed to help people carry out tasks more effectively”
18D. Koop, DSC 201, Fall 2016

Effectiveness
19D. Koop, DSC 201, Fall 2016
[S. Hayward, 2015]
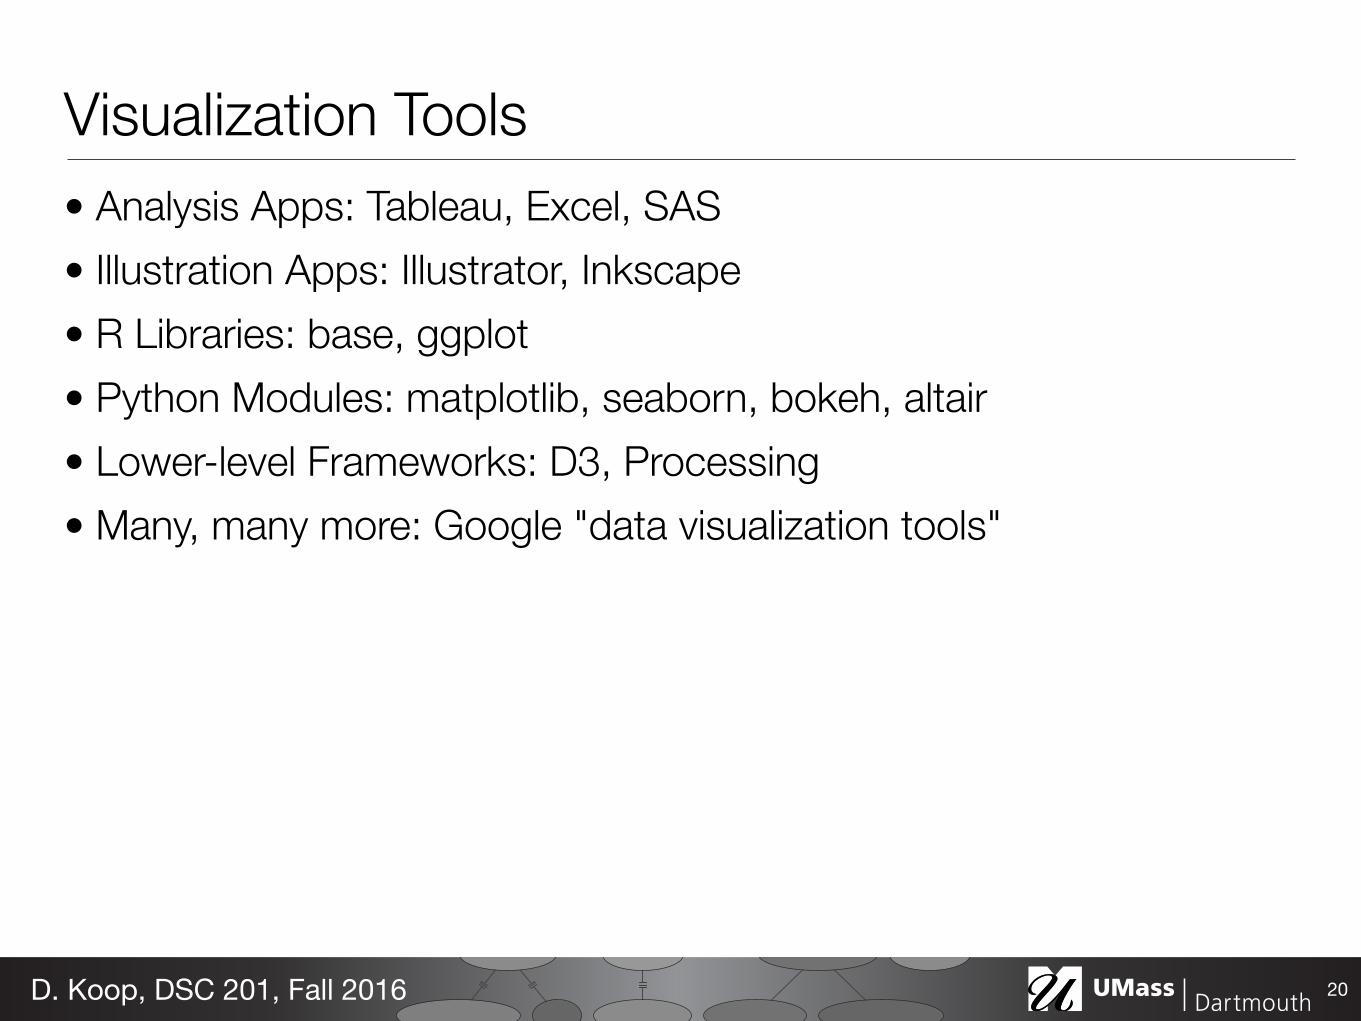
Visualization Tools• Analysis Apps: Tableau, Excel, SAS • Illustration Apps: Illustrator, Inkscape • R Libraries: base, ggplot • Python Modules: matplotlib, seaborn, bokeh, altair • Lower-level Frameworks: D3, Processing • Many, many more: Google "data visualization tools"
20D. Koop, DSC 201, Fall 2016

This Class• Tableau • Python modules: matplotlib, bokeh
21D. Koop, DSC 201, Fall 2016

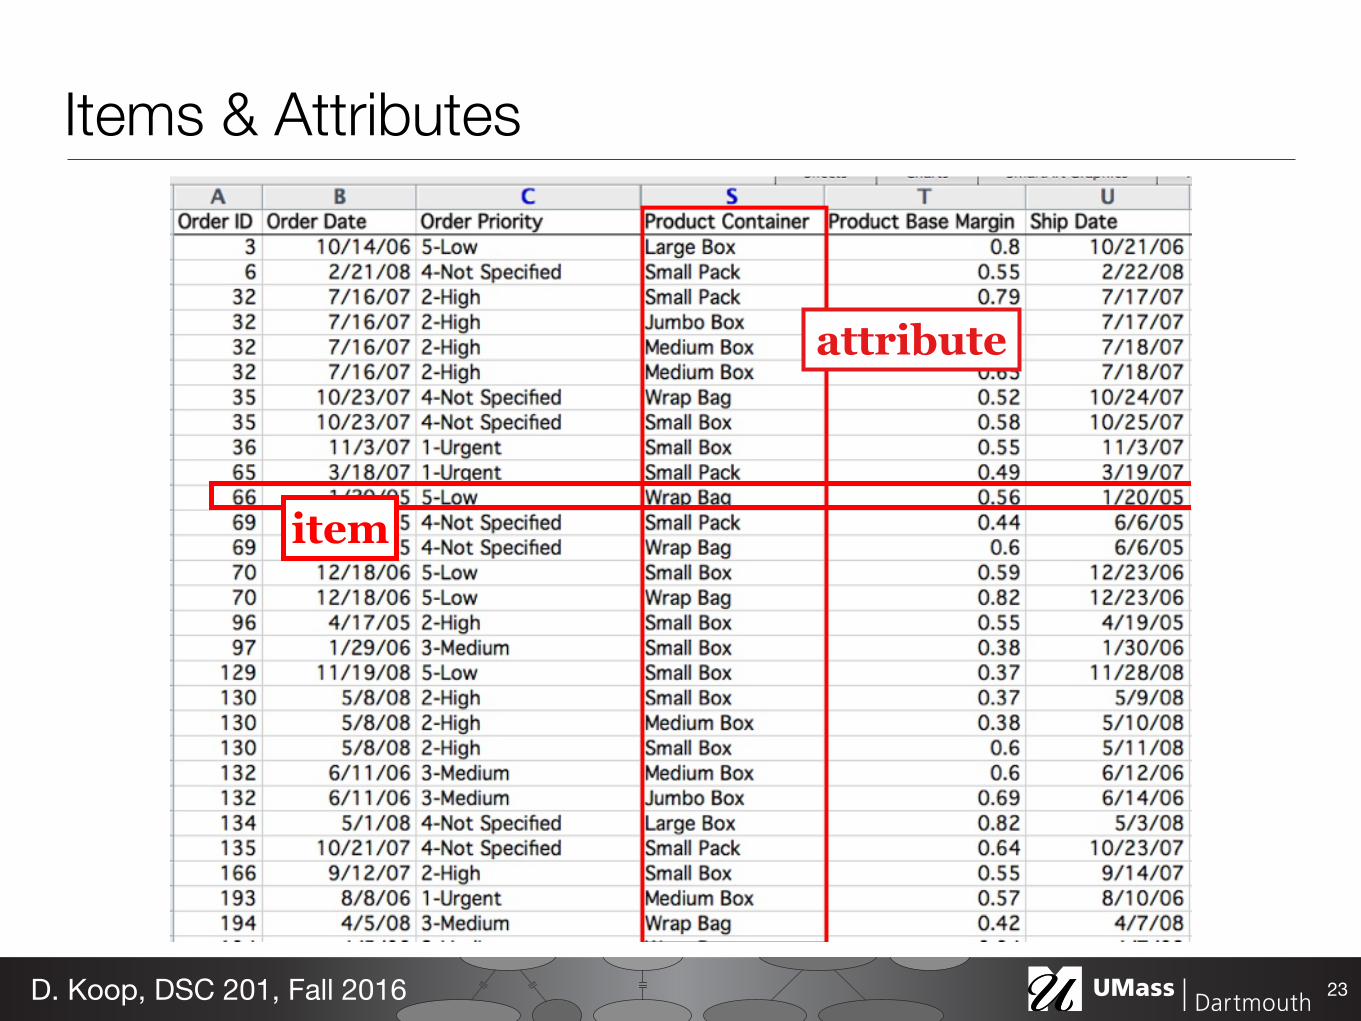
Data Types• Items
- An item is an individual discrete entity - e.g. row in a table, node in a network
• Attributes - An attribute is some specific property that can be measured,
observed, or logged - a.k.a. variable, (data) dimension, column in a table
22D. Koop, DSC 201, Fall 2016
22
Fieldattribute
item
Items & Attributes
23D. Koop, DSC 201, Fall 2016

Dataset Types
24D. Koop, DSC 201, Fall 2016
Tables
Attributes (columns)
Items (rows)
Cell containing value
Networks
Link
Node (item)
Trees
Fields (Continuous)
Attributes (columns)
Value in cell
Cell
Multidimensional Table
Value in cell
Grid of positions
Geometry (Spatial)
Position
Dataset Types
[Munzner (ill. Maguire), 2014]

Attribute Types
25D. Koop, DSC 201, Fall 2016
Attribute Types
Ordering Direction
Categorical Ordered
Ordinal Quantitative
Sequential Diverging Cyclic
[Munzner (ill. Maguire), 2014]
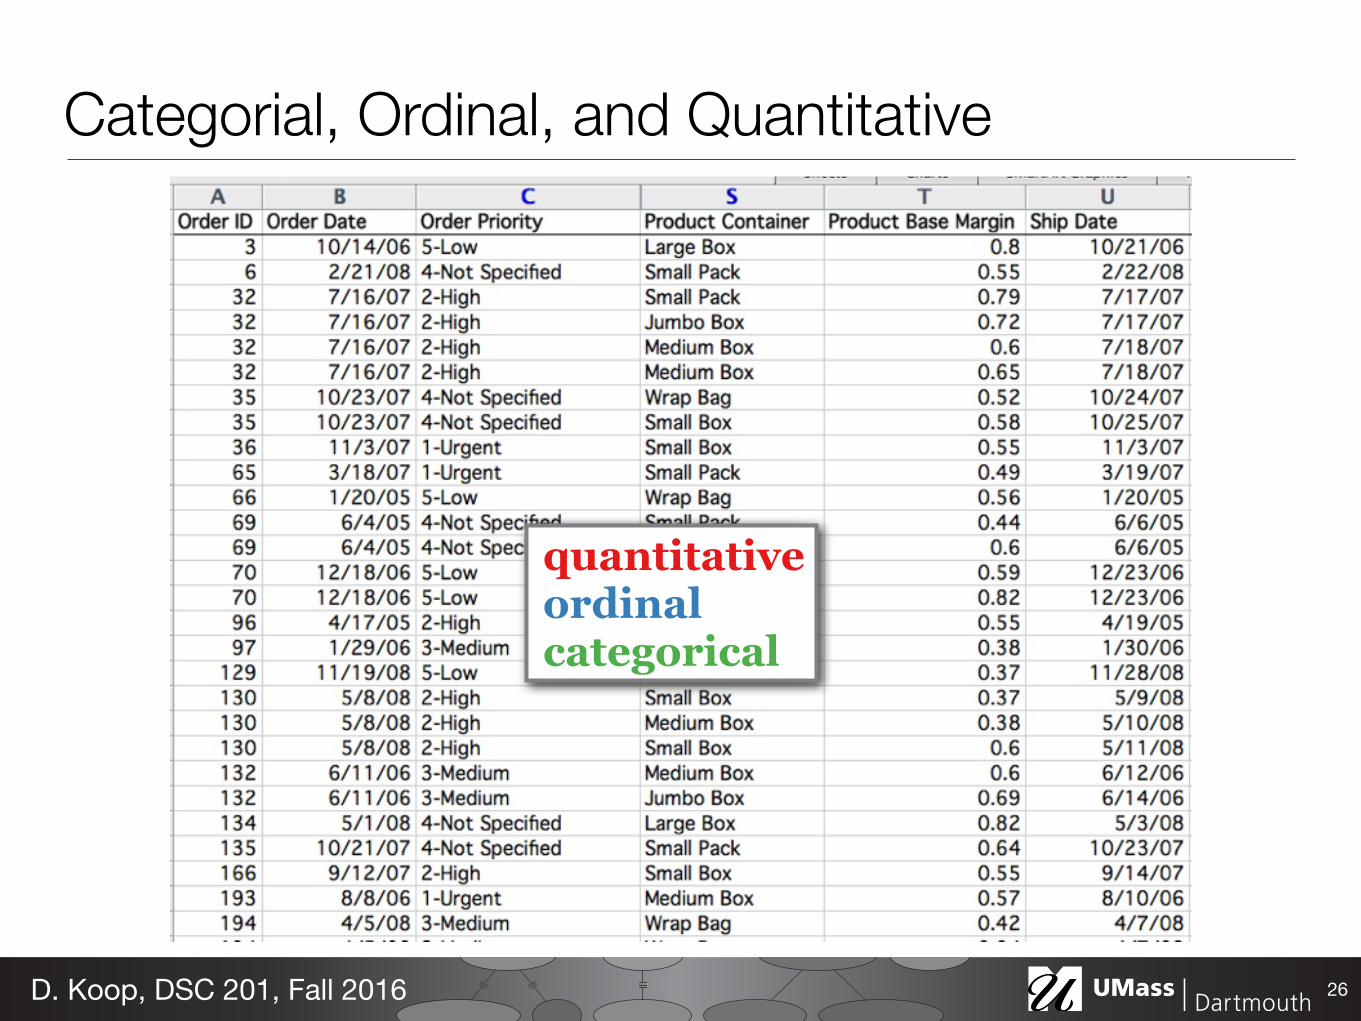
231 = Quantitative2 = Nominal3 = Ordinal
quantitative ordinal categorical
Categorial, Ordinal, and Quantitative
26D. Koop, DSC 201, Fall 2016
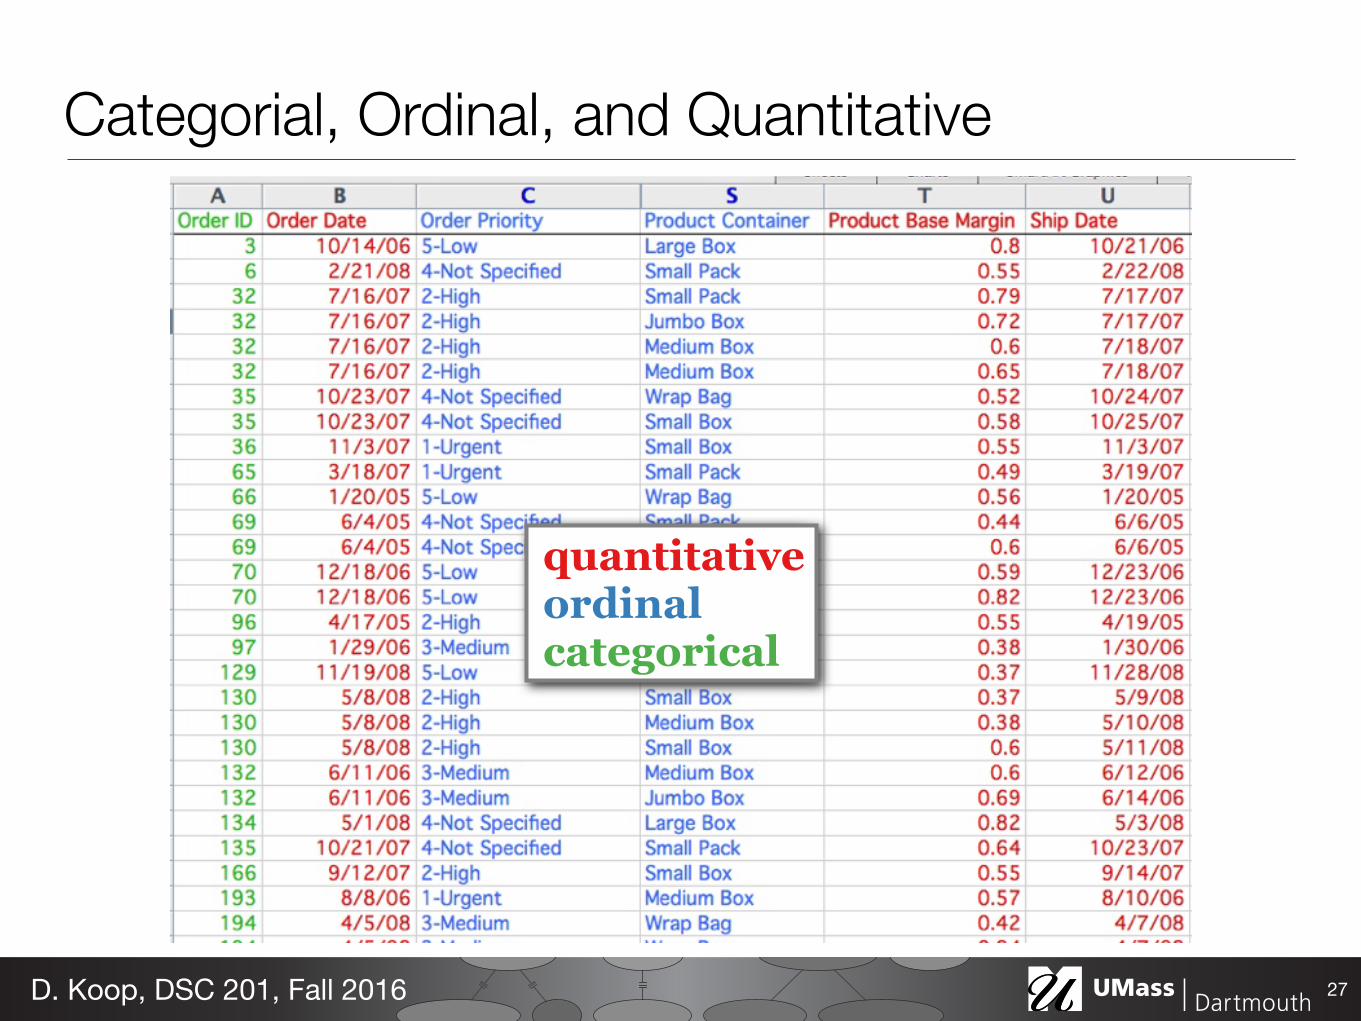
241 = Quantitative2 = Nominal3 = Ordinal
quantitative ordinal categorical
Categorial, Ordinal, and Quantitative
27D. Koop, DSC 201, Fall 2016
Tableau Overview• Grew out of research at Stanford University on how to explore
multidimensional datasets & relational databases • Tableau Desktop: standalone (free trial, student license) • Tableau Public: cloud-based system (free) • Tableau Vizable: mobile app • Tableau's Introduction Videos • https://www.youtube.com/watch?v=6py0jyZc7K4
28D. Koop, DSC 201, Fall 2016

Tableau• High-level GUI that connects to data, helps organize it, and
provides intuitive routines for visualizing it plus customization • Lots of possibilities • Great for exploration
29D. Koop, DSC 201, Fall 2016

Tableau Example
30D. Koop, DSC 201, Fall 2016

Data In Tableau• Categorical data = Dimension • Quantitative data = Measures
31D. Koop, DSC 201, Fall 2016
matplotlib• The workhorse of python visualization • seaborn builds on top of matplotlib • Many new kids on the block: bokeh, altair
32D. Koop, DSC 201, Fall 2016
matplotlib• %matplotlib inline (show plots in the notebook!) • Always create a figure first, then draw plots • Lots of high-level plotting types (line plots, scatterplots, histograms) • Lots of customizability
33D. Koop, DSC 201, Fall 2016

Shortcuts in pandas• Connect directly to pandas data frames
- df.plot • http://pandas.pydata.org/pandas-docs/stable/generated/
pandas.DataFrame.plot.html
34D. Koop, DSC 201, Fall 2016