Embed Size (px)
Citation preview
0
Dryport Project
Report from SEStran
The South East of Scotland Transport Partnership
June 2012
1
Contents
1.0 Introduction……………………………………………………………. page 3
2.0 SEStran Freight Routing Study…………………………………….. page 6
3.0 Location of a Dryport ………………………………………………… page 10
Driver Rest Facilities…………………………………………………..page 15
Advisory Freight Route Map………………………………………… page 15
Freight Signing Strategy………………………..…………….………page 16
4.0 Rail Freight Development and Marketing Study ………………... page 17
Existing Rail Capacity………………………………………………… page 17
Rail Freight investment Plans ……………………………………… page 25
Network Effects of the Planned Improvements …………………. page 31
Future rail freight Demand……………………………………………page 33
Rail Freight Dryport Operations……………………………………. page 38
5.0 Freight Consolidation Study ………………………………............. page 40
Locations identified………………………………………….……….. page 42
Potential method of operation……………………………………… page 47
Operators ………………………………………………………………. page 52
Funding …………………………………………………………..…….. page 53
Potential locations for Dryport including consolidation……….. page 55
6.0 The Sustainable Distribution Study……………………………….. page 59
Logistics Decisions…………………………………………………… page 61
2
Modeling Potential Locations……………………………..………… page 67
Conclusion…………………………………………………..…………. page 72
Dryport at Coatbridge and Distribution at Bathgate……………. page 72
Overview of Economic appraisal …………………………...….….. page 73
Appraisal results……………………………………………..……….. page 76
Commentary on the Emerging appraisal results………..………. page 77
7.0 Port Infrastructure Studies………………………………………….. page 78
Improved road access to Grangemouth………………………….. page 78
Clackmannanshire-Fife-Edinburgh STAG study………….......... page 79
Levenmouth Sustainable Transport study……………………….. page 80
8.0 Discussion of Outcomes………………………………………......... page 80
9.0 Summary…………………………………………………………......... page 82
Acknowledgements………………………………………………………. page 83
3
Dryport Project - Report from SEStran
1. Introduction
1.1 The Dryport project is part funded by Europe through the Interreg IVB North Sea Region
Programme.
1.2 The Scottish partners in this project are TRI and SEStran, bringing together the expertise
of logistics research and analysis through TRI with the practical network analysis of the
East of Scotland and project feasibility through SEStran.
1.3 The development of a Dryport in Scotland has to be envisaged in terms of reducing the
amount of freight being transferred to and from Scotland through English ports and the
consequential reduction of long distance road movement of goods to and from Scotland.
This will require the increased development of Scottish ports and infrastructure to cope
with the anticipated increase in levels of container movements through Scottish ports. A
Dryport would play an important role in improving the efficiency and sustainability of the
movement of international trade to and from Scotland.
1.4 Although there are numerous definitions of a Dryport the definition we think is the most descriptive of its potential role is:
“A dry port is an inland intermodal terminal directly connected to seaport(s) with high capacity transport mean(s), where customers can leave/pick up their standardised units as if directly to a seaport” (Leveque and Roso 2002)
1.5 The concept is that a Dryport will improve the capacity and efficiency of the seaport(s)
and ensure improved access to and from the hinterland, reducing congestion in and
around the seaport. The ability to include customs and potentially consolidation facilities
could improve the efficiency of the operation. One of the key aims of a Dryport is to
encourage a modal shift of freight from road onto to more environmentally sustainable rail
and sea/ inland water options.
1.6 Not only is Scotland considered peripheral in the United Kingdom but also peripheral to
Europe in terms of the movement of freight. To address this concept there is a need to
encourage the direct movement of freight between the continent and Scotland through
Scottish ports. A Dryport will help to ensure that this option is an attractive proposition.
4
1.7 From a Scottish viewpoint we need to establish if there is a requirement for a Dryport
and if so where the best location would be, the benefits and viability of developing a
Dryport. The potential additional benefits of combining the operation with a consolidation
/distribution centre needs to be explored. From the definition it can be seen that efficient
freight transport accessibility is a key issue, especially in the Scottish context where port
capacity is currently not a pressing issue but could be in the future.
1.8 In developing the case for a Dryport in Scotland, SEStran focused in on the location and
infrastructure elements of the project through various studies outlined below;
• The Freight Routing Study
This study examined the levels and movement of road freight in south east Scotland,
looking at freight routing to major origins and destinations within or just outside the
SEStran area. Also the availability of dedicated driver rest facilities and appropriate route
signing were considered.
• The Rail Freight Development and Marketing Study
One of the main concepts of an efficient Dryport operation is the need for efficient rail
connections between the sea port and the Dryport. It would therefore be optimum to
maximise the onward movement of freight by rail. The study looked at the constraints
and potential of the existing rail network and where improvements should be made to
maximize the potential of rail movement. The study not only looked at the physical
constraints but also the management and operational constraints.
• The Freight Consolidation Study
The operation and management of a Dryport presents the opportunity for the
consolidation of freight heading for various locations. The study examines the operation
and benefits of combining these operations within the Dryport locations and the potential
optimum location for such facilities.
• The Sustainable Freight Distribution Study
This study looks at the operation of a Distribution Centre and the potential for Dryports to
be combined with Distribution Centers. Also how the operation could have overall
operational and environmental benefits.
5
1.9 Therefore, these studies look at the operational and locational aspects of a potential
Dryport(s) but there is also a requirement to look at the potential improvements to
accessibility of existing sea ports in the SEStran area in order to improve the efficiency of
the role they play in the movement of freight in this area of Scotland.
Rosyth – (Rail Links Study)
This study looks at the potential for increased usage of the Alloa - Dunfermline rail line
with a direct link into the port of Rosyth. The rail link into the port already exists but
requires upgraded and a new direct link onto the Alloa line. An upgraded line between
Alloa and Dumfermline would allow a direct freight rail link from the port of Rosyth to
central and west of Scotland.
Methil (Rail Links Study)
The Levenmouth Sustainable Transport study looks at restoring the rail link to Methil and
the potential benefits of reopening the line. The line will provide improved rail access
from Methil port to the rest of Scotland. Although initially considered as a potential site
for a Dryport, Methil has more potential to act as a feeder port to Grangemouth and
Rosyth.
Road Access to Grangemouth
Grangemouth is currently the busiest port in the SEStran area and has good rail and
east/west road connections. The study develops the economic case for the improving
the main road link from Grangemouth to the south at the Avon Gorge. This section of the
road is substandard for HGVs but provides an important link from Grangemouth to the
Livingston area and the M8. Over the years this route has been upgraded and the
bridging of the Avon Gorge is the final link required to bring this route up a suitable
standard to be used by large freight vehicles.
1.10 All the above pieces of work are now summarised in more detail indicating how they can
add to the overall picture of the potential benefits a Dryport could bring to Scotland. This
summary is not intended to repeat the above reports, but to draw out all the relevant
issues and facts on which decisions can be made.
6
2.0 SEStran Freight Routing Study
2.1 Even with emphasis in the Dryport concept of maximizing the shipment of freight by rail, it is recognized that in Scotland a high proportion of freight movement will use the road network for the transfer of freight to its final destination. It is therefore important that any proposed Dryport and associated facilities have good road linkages to the main road freight network in this area of Scotland.
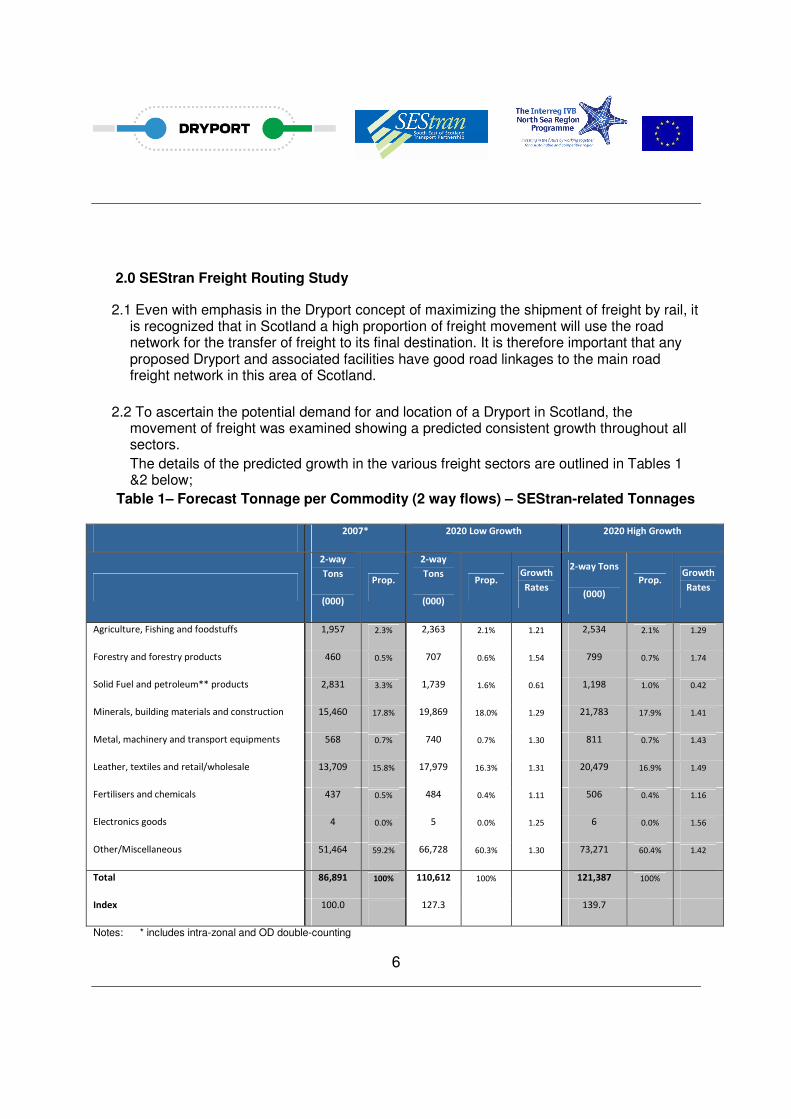
2.2 To ascertain the potential demand for and location of a Dryport in Scotland, the movement of freight was examined showing a predicted consistent growth throughout all sectors.
The details of the predicted growth in the various freight sectors are outlined in Tables 1 &2 below;
Table 1– Forecast Tonnage per Commodity (2 way flows) – SEStran-related Tonnages
2007* 2020 Low Growth 2020 High Growth
2-way
Tons
(000)
Prop.
2-way
Tons
(000)
Prop. Growth
Rates
2-way Tons
(000)
Prop. Growth
Rates
Agriculture, Fishing and foodstuffs 1,957 2.3% 2,363 2.1% 1.21 2,534 2.1% 1.29
Forestry and forestry products 460 0.5% 707 0.6% 1.54 799 0.7% 1.74
Solid Fuel and petroleum** products 2,831 3.3% 1,739 1.6% 0.61 1,198 1.0% 0.42
Minerals, building materials and construction 15,460 17.8% 19,869 18.0% 1.29 21,783 17.9% 1.41
Metal, machinery and transport equipments 568 0.7% 740 0.7% 1.30 811 0.7% 1.43
Leather, textiles and retail/wholesale 13,709 15.8% 17,979 16.3% 1.31 20,479 16.9% 1.49
Fertilisers and chemicals 437 0.5% 484 0.4% 1.11 506 0.4% 1.16
Electronics goods 4 0.0% 5 0.0% 1.25 6 0.0% 1.56
Other/Miscellaneous 51,464 59.2% 66,728 60.3% 1.30 73,271 60.4% 1.42
Total 86,891 100% 110,612 100% 121,387 100%
Index 100.0 127.3 139.7
Notes: * includes intra-zonal and OD double-counting
7
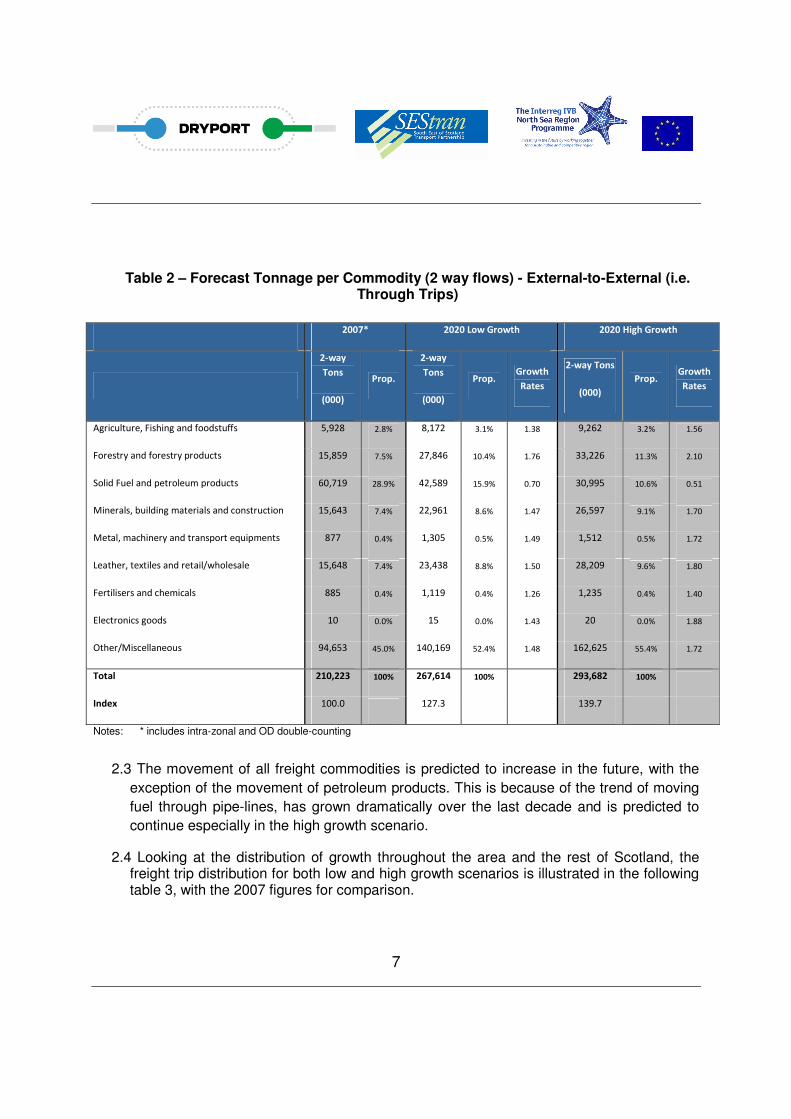
Table 2 – Forecast Tonnage per Commodity (2 way flows) - External-to-External (i.e. Through Trips)
2007* 2020 Low Growth 2020 High Growth
2-way
Tons
(000)
Prop.
2-way
Tons
(000)
Prop. Growth
Rates
2-way Tons
(000)
Prop. Growth
Rates
Agriculture, Fishing and foodstuffs 5,928 2.8% 8,172 3.1% 1.38 9,262 3.2% 1.56
Forestry and forestry products 15,859 7.5% 27,846 10.4% 1.76 33,226 11.3% 2.10
Solid Fuel and petroleum products 60,719 28.9% 42,589 15.9% 0.70 30,995 10.6% 0.51
Minerals, building materials and construction 15,643 7.4% 22,961 8.6% 1.47 26,597 9.1% 1.70
Metal, machinery and transport equipments 877 0.4% 1,305 0.5% 1.49 1,512 0.5% 1.72
Leather, textiles and retail/wholesale 15,648 7.4% 23,438 8.8% 1.50 28,209 9.6% 1.80
Fertilisers and chemicals 885 0.4% 1,119 0.4% 1.26 1,235 0.4% 1.40
Electronics goods 10 0.0% 15 0.0% 1.43 20 0.0% 1.88
Other/Miscellaneous 94,653 45.0% 140,169 52.4% 1.48 162,625 55.4% 1.72
Total 210,223 100% 267,614 100% 293,682 100%
Index 100.0 127.3 139.7
Notes: * includes intra-zonal and OD double-counting
2.3 The movement of all freight commodities is predicted to increase in the future, with the
exception of the movement of petroleum products. This is because of the trend of moving
fuel through pipe-lines, has grown dramatically over the last decade and is predicted to
continue especially in the high growth scenario.
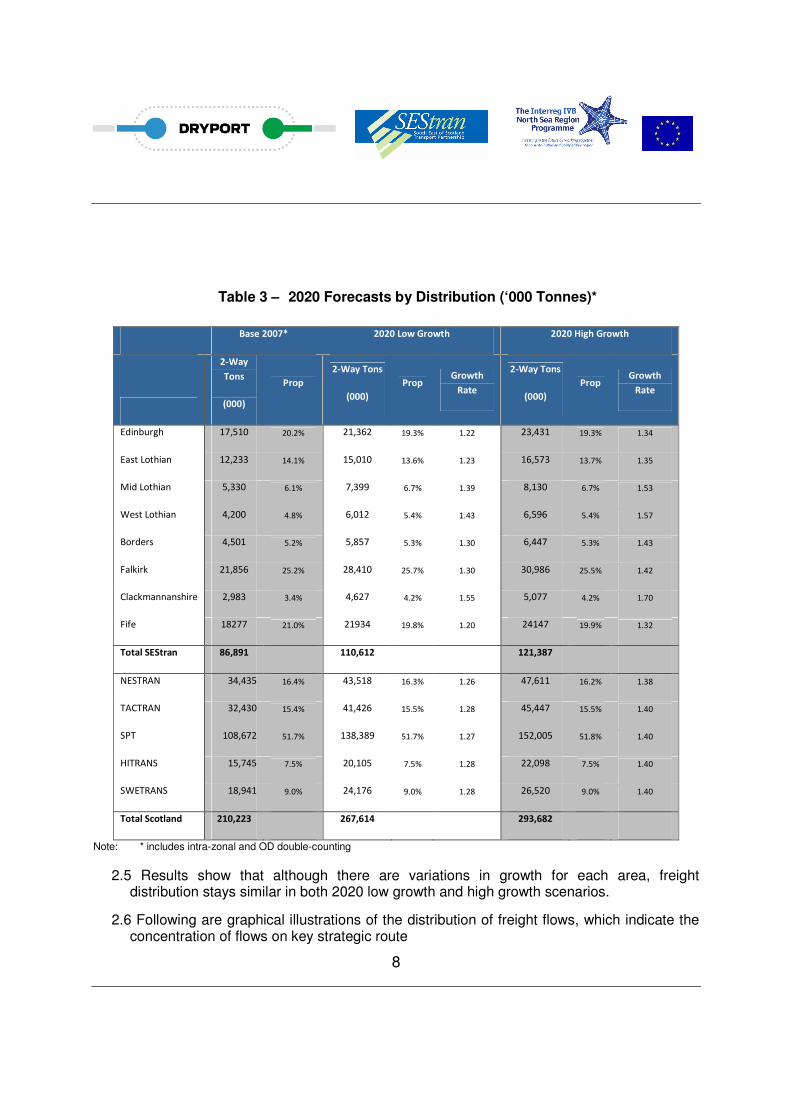
2.4 Looking at the distribution of growth throughout the area and the rest of Scotland, the freight trip distribution for both low and high growth scenarios is illustrated in the following table 3, with the 2007 figures for comparison.
8
Table 3 – 2020 Forecasts by Distribution (‘000 Tonnes)*
Base 2007* 2020 Low Growth 2020 High Growth
2-Way
Tons
(000)
Prop
2-Way Tons
(000)
Prop Growth
Rate
2-Way Tons
(000)
Prop Growth
Rate
Edinburgh 17,510 20.2% 21,362 19.3% 1.22 23,431 19.3% 1.34
East Lothian 12,233 14.1% 15,010 13.6% 1.23 16,573 13.7% 1.35
Mid Lothian 5,330 6.1% 7,399 6.7% 1.39 8,130 6.7% 1.53
West Lothian 4,200 4.8% 6,012 5.4% 1.43 6,596 5.4% 1.57
Borders 4,501 5.2% 5,857 5.3% 1.30 6,447 5.3% 1.43
Falkirk 21,856 25.2% 28,410 25.7% 1.30 30,986 25.5% 1.42
Clackmannanshire 2,983 3.4% 4,627 4.2% 1.55 5,077 4.2% 1.70
Fife 18277 21.0% 21934 19.8% 1.20 24147 19.9% 1.32
Total SEStran 86,891 110,612 121,387
NESTRAN 34,435 16.4% 43,518 16.3% 1.26 47,611 16.2% 1.38
TACTRAN 32,430 15.4% 41,426 15.5% 1.28 45,447 15.5% 1.40
SPT 108,672 51.7% 138,389 51.7% 1.27 152,005 51.8% 1.40
HITRANS 15,745 7.5% 20,105 7.5% 1.28 22,098 7.5% 1.40
SWETRANS 18,941 9.0% 24,176 9.0% 1.28 26,520 9.0% 1.40
Total Scotland 210,223 267,614 293,682
Note: * includes intra-zonal and OD double-counting
2.5 Results show that although there are variations in growth for each area, freight distribution stays similar in both 2020 low growth and high growth scenarios.
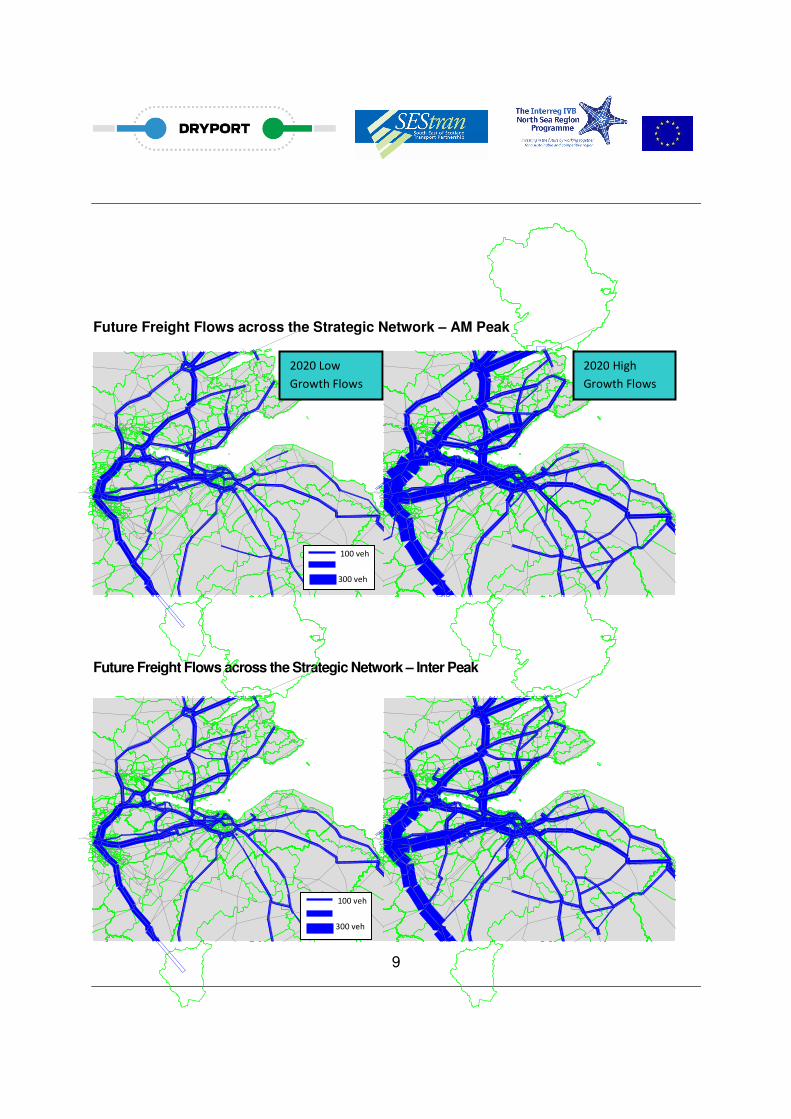
2.6 Following are graphical illustrations of the distribution of freight flows, which indicate the concentration of flows on key strategic route
9
Future Freight Flows across the Strategic Network – AM Peak
Future Freight Flows across the Strategic Network – Inter Peak
2020 Low
Growth Flows
2020 High
Growth Flows
100 veh
300 veh
100 veh
300 veh
10
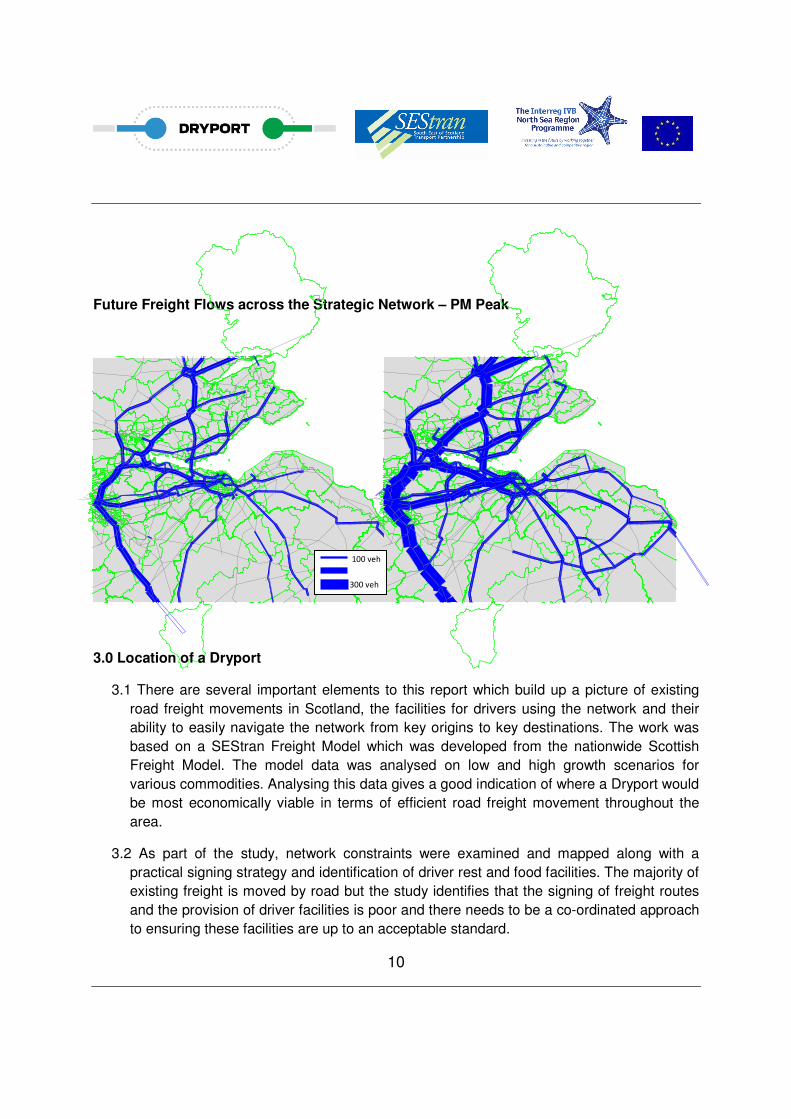
Future Freight Flows across the Strategic Network – PM Peak
3.0 Location of a Dryport
3.1 There are several important elements to this report which build up a picture of existing
road freight movements in Scotland, the facilities for drivers using the network and their
ability to easily navigate the network from key origins to key destinations. The work was
based on a SEStran Freight Model which was developed from the nationwide Scottish
Freight Model. The model data was analysed on low and high growth scenarios for
various commodities. Analysing this data gives a good indication of where a Dryport would
be most economically viable in terms of efficient road freight movement throughout the
area.
3.2 As part of the study, network constraints were examined and mapped along with a
practical signing strategy and identification of driver rest and food facilities. The majority of
existing freight is moved by road but the study identifies that the signing of freight routes
and the provision of driver facilities is poor and there needs to be a co-ordinated approach
to ensuring these facilities are up to an acceptable standard.
100 veh
300 veh
11
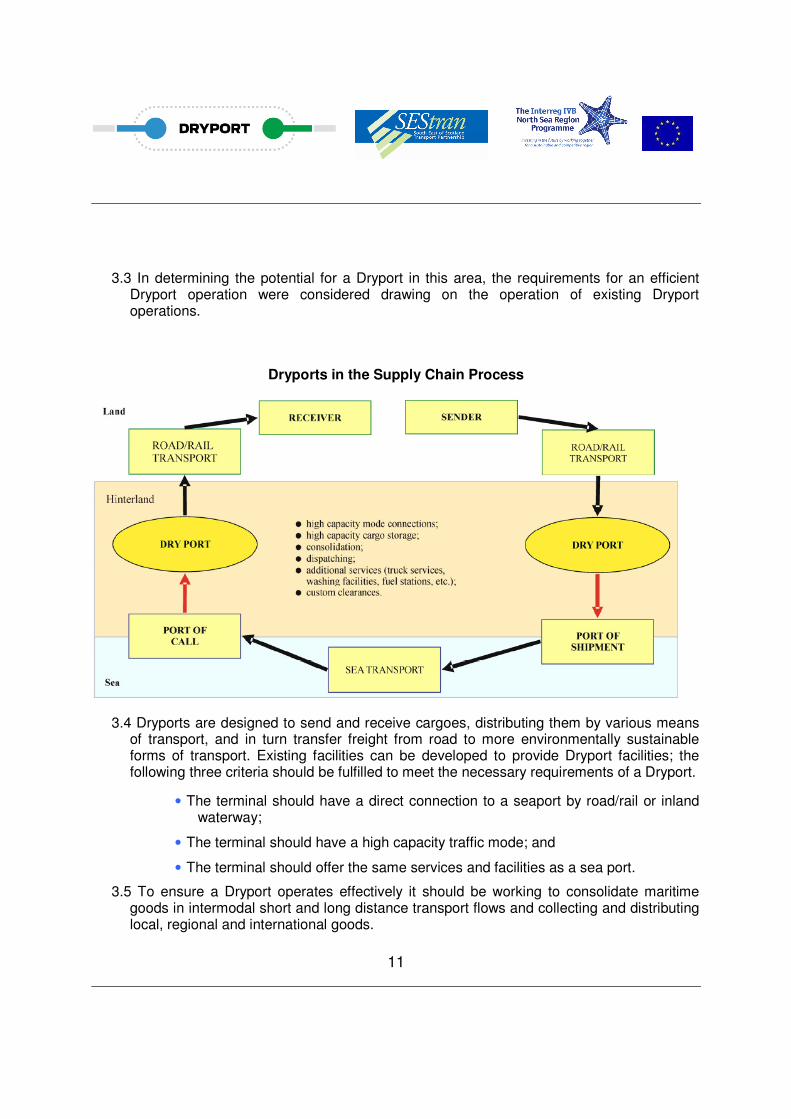
3.3 In determining the potential for a Dryport in this area, the requirements for an efficient Dryport operation were considered drawing on the operation of existing Dryport operations.
Dryports in the Supply Chain Process
3.4 Dryports are designed to send and receive cargoes, distributing them by various means of transport, and in turn transfer freight from road to more environmentally sustainable forms of transport. Existing facilities can be developed to provide Dryport facilities; the following three criteria should be fulfilled to meet the necessary requirements of a Dryport.
• The terminal should have a direct connection to a seaport by road/rail or inland waterway;
• The terminal should have a high capacity traffic mode; and
• The terminal should offer the same services and facilities as a sea port.
3.5 To ensure a Dryport operates effectively it should be working to consolidate maritime goods in intermodal short and long distance transport flows and collecting and distributing local, regional and international goods.
12
3.6 For the purposes of the Dryport assessment the average size of a Dryport was determined, based on the current operations at Madrid, Lyon and Sao Paulo ranging from 120,000m² to 1,840,000m² and also Santo Andre at 92,000m². If an average of these ranges was used this would mean a Dryport size of 913,000m² which is clearly too large for available space within the SEStran area. Hence, to err on the side of caution we have assumed a size comparable to the lower range of sizes and used 120,000m² as per the facilities at Madrid. This has been incorporated into the demand modelling to test the potential network-wide impacts of introducing such a facility in the area. The modes assumed to operate at the new Dryport site and tested in the modelling were rail and road based on fixed rail timetable accessing existing port facilities.
3.7 Clearly, there are a number of potential permutations to the operation and layout of a Dryport. Therefore, Dryports should be set up to cater for regional circumstances. For example, a Dryport could be configured to serve more than one sea port or more than one Dryport serving the same sea port, depending upon the geography of the region and associated freight flows. This appraisal has assumed one Dryport serving one sea port, although the results can be interpolated for other assumptions.
3.8 As indicated, the modelling of freight movements in the SEStran area was based on a regional freight model developed from the Scottish Multi-Modal Freight Locations Study. This was a national freight study which has identified a number of locations/options across Scotland for providing multi-modal freight hubs. A number of these locations were examined as potential locations for a Dryport in and around the SEStran area. Consequently, from a review of the emerging multi-modal freight hubs strategy the Scottish Freight Study has developed, we have identified potential locations for a Dryport facility, either within the SEStran boundary or adjacent to the area.
3.9 The most promising locations for a Dryport based on generalised time savings and
connectivity were:
a) Coatbridge
Although not located in the SEStran area, the proposed site at Coatbridge is located
relatively close to the area boundary. Coatbridge is well placed to intercept the freight
movements on the A8/M8 trunk roads, and via the A8, the M73/M74 and A80/M80 strategic
roads, which are identified as high use freight routes in the routing strategy. Furthermore,
Coatbridge is a well developed rail facility with access to both the central rail network and
West Coast Main Line The completion of the M74 will give improved motorway connections
to Glasgow and the west. This location would not only serve the SEStran area but all of
Central Scotland
13
b) Grangemouth
Grangemouth Harbour is situated near the centre of the Central Belt of Scotland, close to the industrial heartland, with good links to road and rail networks in every direction. Grangemouth is well served by the motorway system, particularly by the M9 motorway which passes close by. The area also has rapid connections to the rest of Scotland via the A80/M80 and the UK via the M73/M74. Other links include the M9/A9 for northern destinations and the A801 for southern destinations. Bringing the A801 up to a suitably high standard is also one of the Dryport Study projects. The A904 and A905 provide direct access to the port from the south east and north west respectively. All of these roads are currently included in the advisory freight network and the presence of the motorways close by makes it a very appealing site. With regards to rail, Grangemouth is connected to the main east–west rail line which provides good rail links with rest of Scotland and beyond.
Optimum Location of a new Dryport
3.10 The examination of existing and potential future movements of freight highlighted the
importance of the M74 and the central Scotland motorway network to the movement of
freight within and to and from Scotland. Other major road routes along the east coast from
the south and to the north are also important. The analysis of the type of goods moved by
road indicated a wide range of goods being moved and a potential increased requirement
for container movement. The most important freight origins and destinations in the
SEStran area are Falkirk/Grangemouth, the Fife area and Edinburgh. This background
information provides the basis for assessing the location and the economic benefits of a
Dryport.
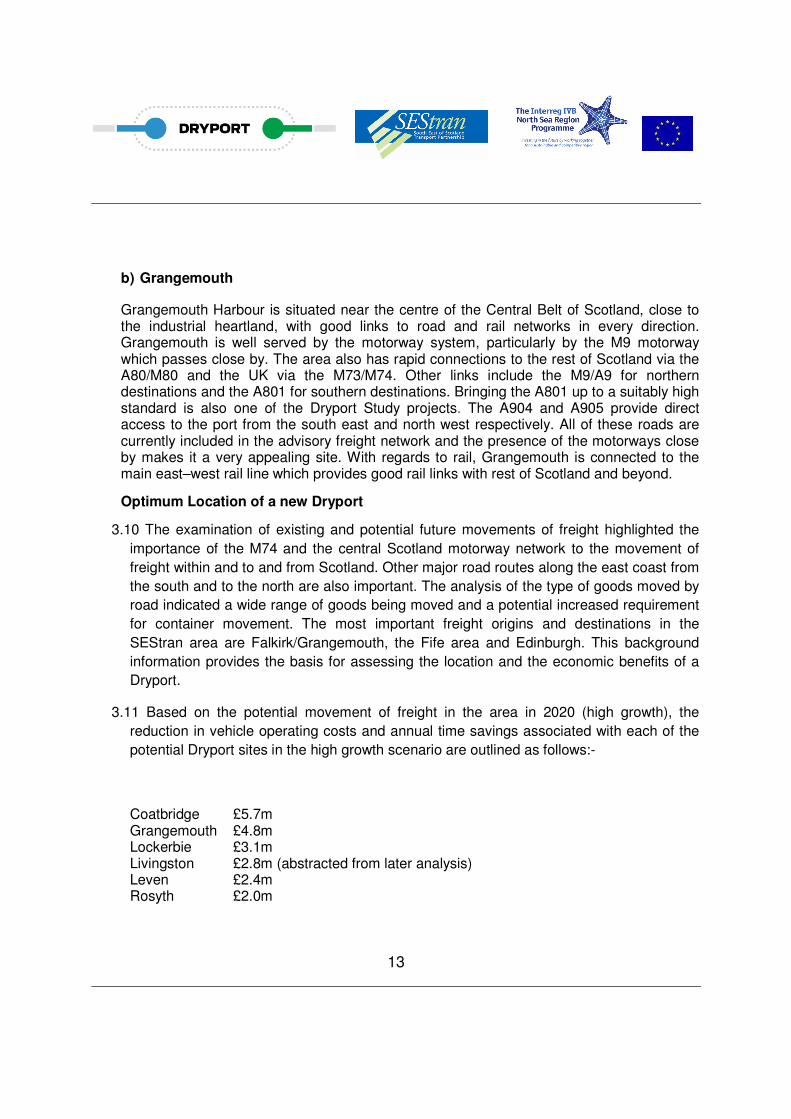
3.11 Based on the potential movement of freight in the area in 2020 (high growth), the
reduction in vehicle operating costs and annual time savings associated with each of the
potential Dryport sites in the high growth scenario are outlined as follows:-
Coatbridge £5.7m Grangemouth £4.8m Lockerbie £3.1m Livingston £2.8m (abstracted from later analysis) Leven £2.4m Rosyth £2.0m
14
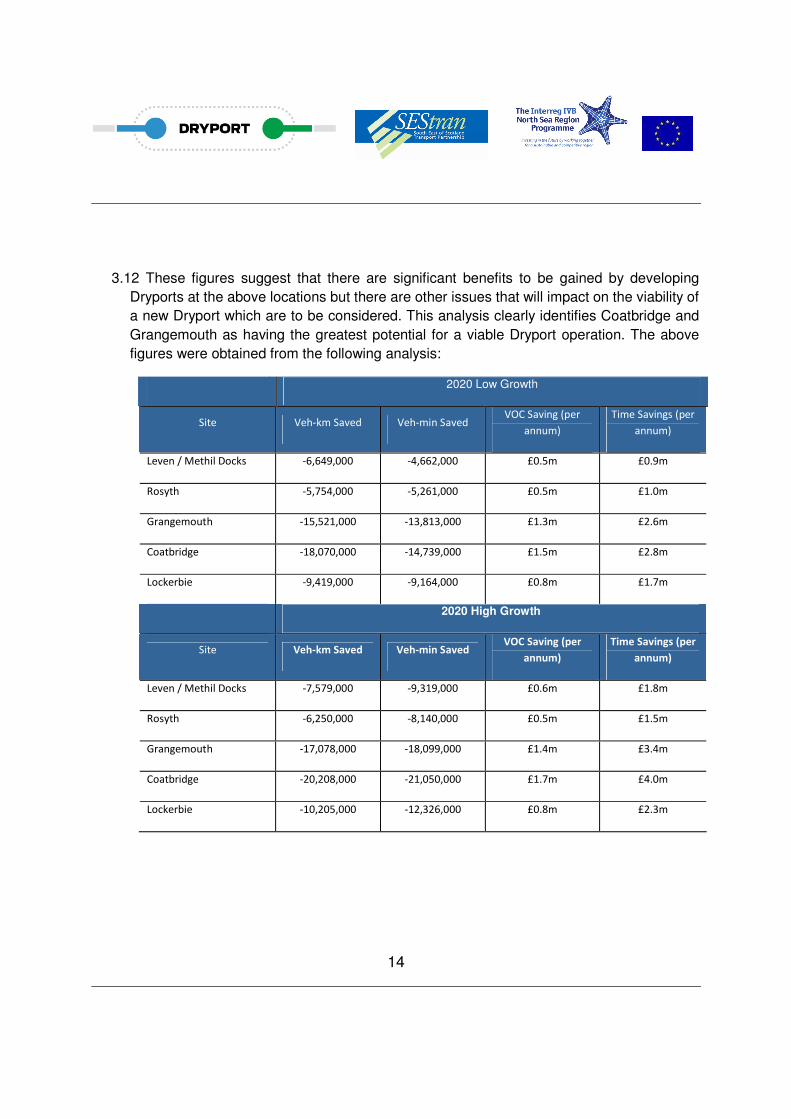
3.12 These figures suggest that there are significant benefits to be gained by developing
Dryports at the above locations but there are other issues that will impact on the viability of
a new Dryport which are to be considered. This analysis clearly identifies Coatbridge and
Grangemouth as having the greatest potential for a viable Dryport operation. The above
figures were obtained from the following analysis:
2020 Low Growth
Site Veh-km Saved Veh-min Saved VOC Saving (per
annum)
Time Savings (per
annum)
Leven / Methil Docks -6,649,000 -4,662,000 £0.5m £0.9m
Rosyth -5,754,000 -5,261,000 £0.5m £1.0m
Grangemouth -15,521,000 -13,813,000 £1.3m £2.6m
Coatbridge -18,070,000 -14,739,000 £1.5m £2.8m
Lockerbie -9,419,000 -9,164,000 £0.8m £1.7m
2020 High Growth
Site Veh-km Saved Veh-min Saved VOC Saving (per
annum)
Time Savings (per
annum)
Leven / Methil Docks -7,579,000 -9,319,000 £0.6m £1.8m
Rosyth -6,250,000 -8,140,000 £0.5m £1.5m
Grangemouth -17,078,000 -18,099,000 £1.4m £3.4m
Coatbridge -20,208,000 -21,050,000 £1.7m £4.0m
Lockerbie -10,205,000 -12,326,000 £0.8m £2.3m
15
Driver Rest Facilities
3.13 As an integral part of this study, the availability of rest and food facilities for drivers was
also considered. Drivers require these facilities to ensure compliance to driver time
requirements and to assist in the timing of deliveries.
3.14 A truck stop analysis was carried out by examining the parking facilities in the SEStran
area. This identified seven sites, with five basic and two intermediate sites as classified
using the recommended guidance on such facilities.
3.15 All the sites were compared to the recommended guidance1 along with a case study of
the minimum standards for suitable lorry parking. From the appraisal it was clear that most
of the facilities in SEStran would benefit from upgrading. The exception to this was the site
at Portobello which, at the time of the study, was run as a secure coach and lorry park.
3.16 As well as enhancing existing lorry parking sites, the study has found there is sufficient overnight demand for new truck stops in the Falkirk, Fife and West Lothian areas. The possible areas identified were:
• Site 1 : Falkirk Town Centre and Grangemouth;
• Site 2 : South East Fife; and
• Site 3 : Livingston / Bathgate area.
These recommendations have been passed onto the relevant Local Authorities to identify suitable sites and encourage the development of suitable driver facilities.
The Development of an Advisory Freight Route Map
3.17 The results from the route analysis defined a series of roads which made up an initial
strategic advisory freight road network based on current and future demand for
movement. These were then cross-referenced against the identified physical constraints
and issues raised during a consultation process with the relevant local authorities, to
select the preferred lorry routes in the area.
3.18 Armed with the outputs from the above study elements, an advisory lorry map was
developed. This classified the routes in a hierarchy of preferred routes, namely:
motorways and dual carriageway; main roads and local roads.
1 Good practice Guide on Urban Freight Transport, EU Best Urban Freight Solutions Programme, 2007
16
3.19 The above road hierarchy was used to encourage vehicle drivers to use the strategic roads first and only using local roads when no other option was possible, thereby hopefully avoiding any environmentally sensitive areas.
3.20 The resultant map has been distributed to haulage operators and to locations where
lorry drivers are known to frequent.
3.21 The proposed advisory network was tested in the model, and the environmental benefits were estimated using the Department for Transport’s process for estimating reduced Sensitive Lorry Miles (SLMs). The results of the SLM analysis, suggested the benefits range from £1.9m to £2.3m per annum depending on Low and High Growth Scenarios.
3.22 The map is attached to this report and will be updated on a regular basis to ensure the
information is up to date.
Freight Signing Strategy
3.23 The level of existing freight directional signing in SEStran was also considered. In particular, opportunities for improving the level of signage from the strategic roads, as described on the Advisory Lorry Map, to the local freight destinations were appraised against Government guidance.
3.24 The appraisal has highlighted variations in the standard of signing and locations which could be improved. Some appropriate conclusions include:
• there is a lack of signing for HGVs on some main roads at key junctions;
• there are a few locations where signs are set back from the road or are obscured by trees etc. making them hard to read;
• some retail parks lack direction signs to HGV loading/unloading areas, and some industrial estates have no signs until the actual entrance, making it hard for drivers to anticipate turning in advance; and
• the information on entry to industrial areas varies, with many sites having no directory signs.
3.25 The mapping and signing of major freight origins and destinations were examined to
improve the efficiency of freight movement especially on the approaches to ports and
industrial areas.
17
3.26 This information was passed on to the relevant roads authorities to take on board when
they considered their signing requirements for their area.
4.0 Rail Freight Development and Marketing Study
4.1 Efficient rail freight movement is considered an essential element of an effective Dryport,
especially for the transfer of containers from and to the “wet port”. To build on these
efficiencies, the potential rail distribution of goods from and to a Dryport was assessed.
4.2 First to be examined was the existing physical capacity constraints on the potential
increased demand for rail freight movement looking at elements such as route capacity,
line infrastructure, speed limits, loading gauge and loading units.
4.3 The study identifies the limited capability of the existing rail network to provide additional
freight capacity although it is noted that in some cases only 60% of the allocated freight
paths are currently being fully used. On the positive side many of the constraints have
been identified within the governments “Strategic Transport Projects Review” and
“Scottish Route Utilisation Study” and resources have been programmed to address these
issues. These issues are now discussed in greater detail.
Existing rail capacity
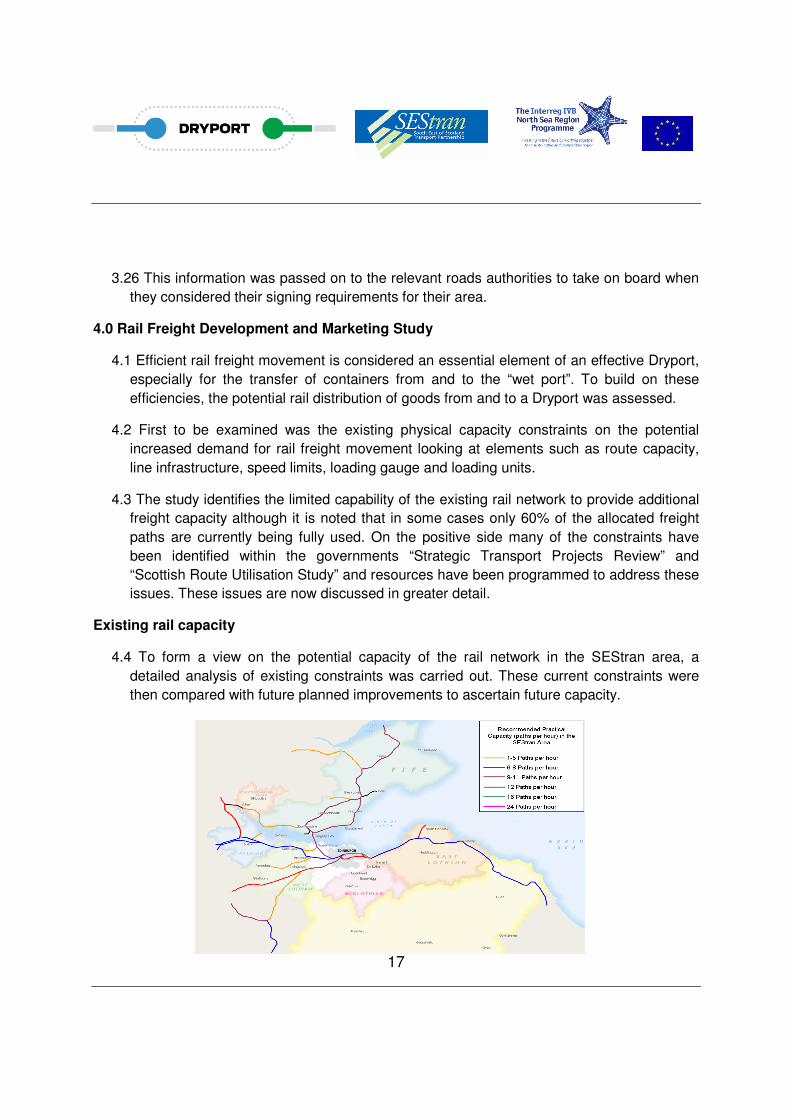
4.4 To form a view on the potential capacity of the rail network in the SEStran area, a
detailed analysis of existing constraints was carried out. These current constraints were
then compared with future planned improvements to ascertain future capacity.
18
The above diagram shows a variable picture of current capacity but the greatest capacity is on the main strategic rail routes.
4.5 For the Suburban Edinburgh lines, which are currently shown as 6-8 paths per hour, there are slight variations at key junctions such as Millerhill to Niddrie 9 paths per hour, Millerhill to Monktonhall 4 paths per hour and Niddrie to Portobello 3 paths per hour.
Route Availability
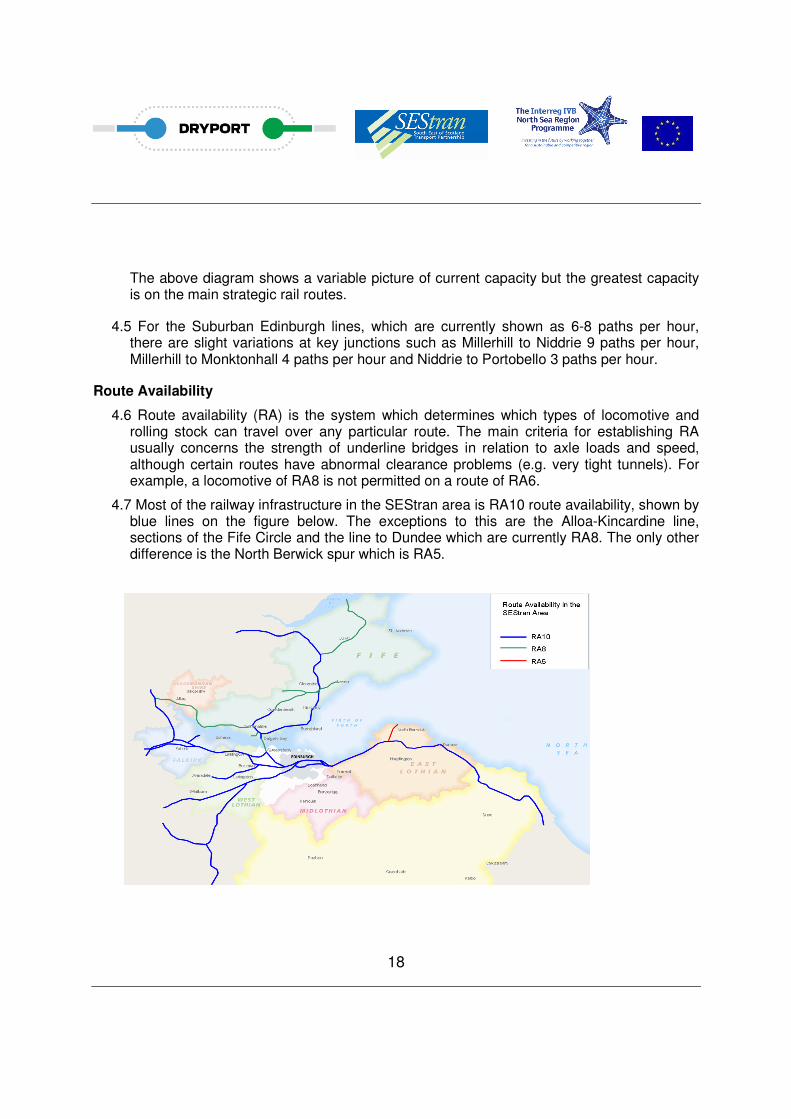
4.6 Route availability (RA) is the system which determines which types of locomotive and rolling stock can travel over any particular route. The main criteria for establishing RA usually concerns the strength of underline bridges in relation to axle loads and speed, although certain routes have abnormal clearance problems (e.g. very tight tunnels). For example, a locomotive of RA8 is not permitted on a route of RA6.
4.7 Most of the railway infrastructure in the SEStran area is RA10 route availability, shown by blue lines on the figure below. The exceptions to this are the Alloa-Kincardine line, sections of the Fife Circle and the line to Dundee which are currently RA8. The only other difference is the North Berwick spur which is RA5.
19
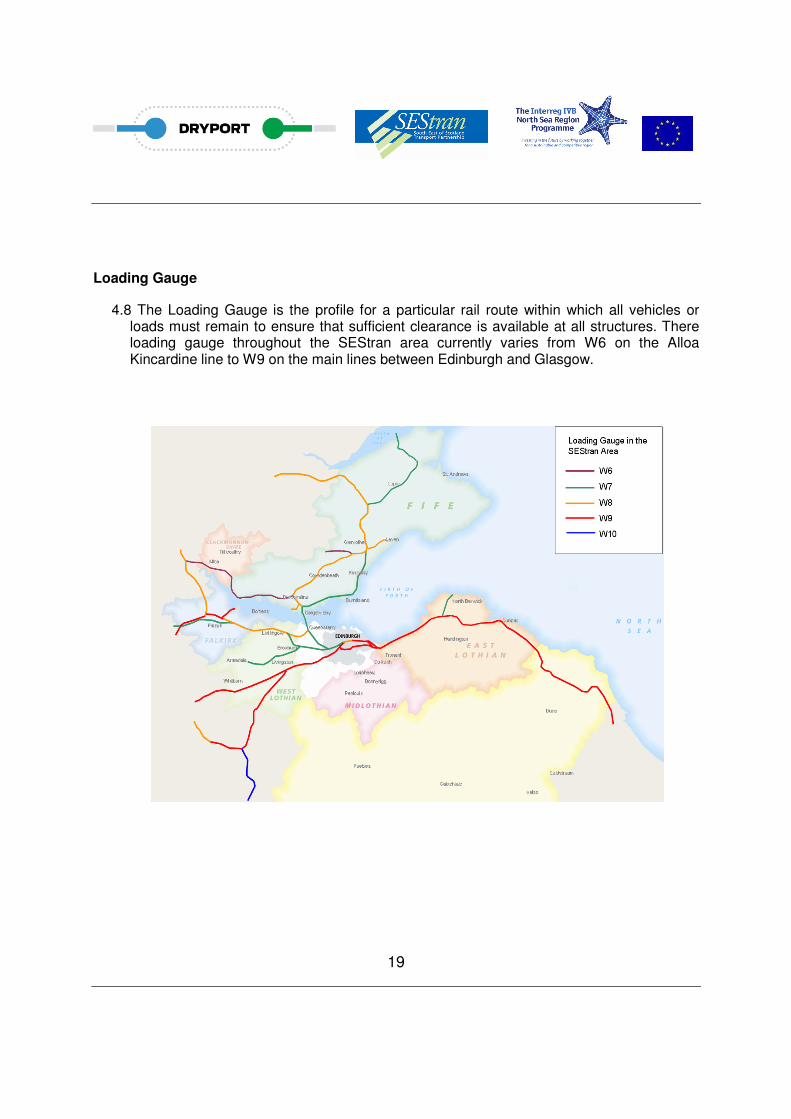
Loading Gauge
4.8 The Loading Gauge is the profile for a particular rail route within which all vehicles or loads must remain to ensure that sufficient clearance is available at all structures. There loading gauge throughout the SEStran area currently varies from W6 on the Alloa Kincardine line to W9 on the main lines between Edinburgh and Glasgow.
20
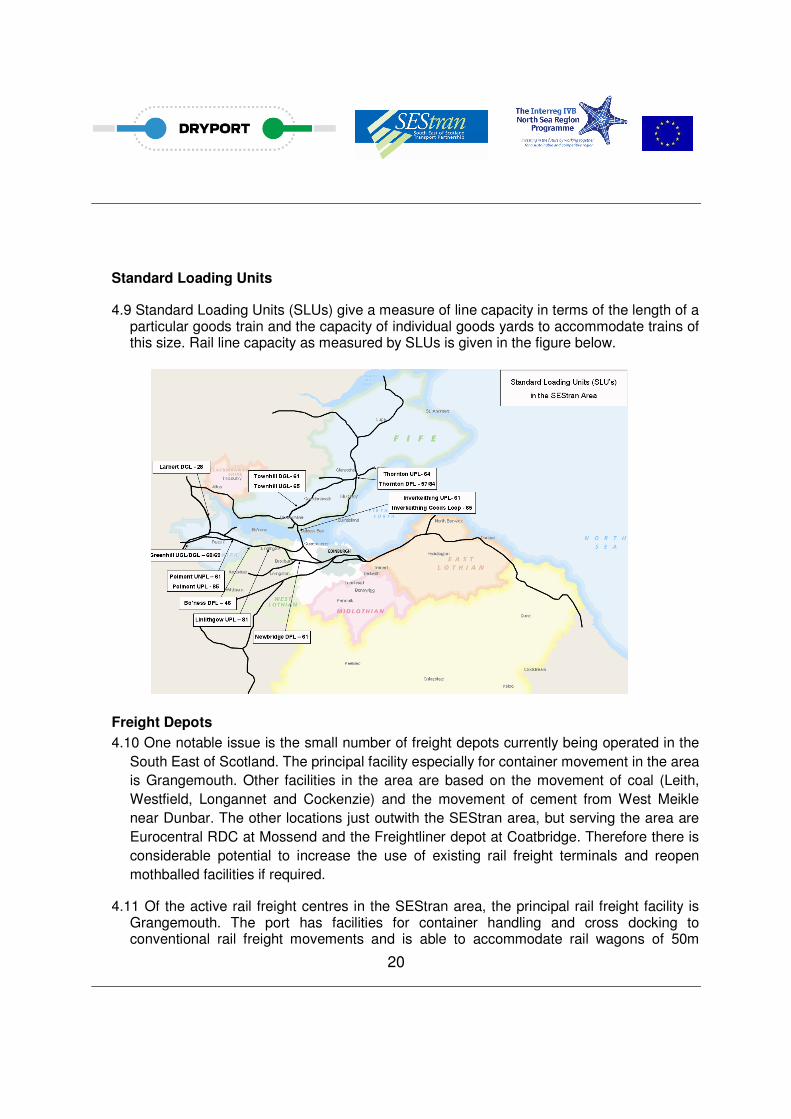
Standard Loading Units
4.9 Standard Loading Units (SLUs) give a measure of line capacity in terms of the length of a particular goods train and the capacity of individual goods yards to accommodate trains of this size. Rail line capacity as measured by SLUs is given in the figure below.
Freight Depots
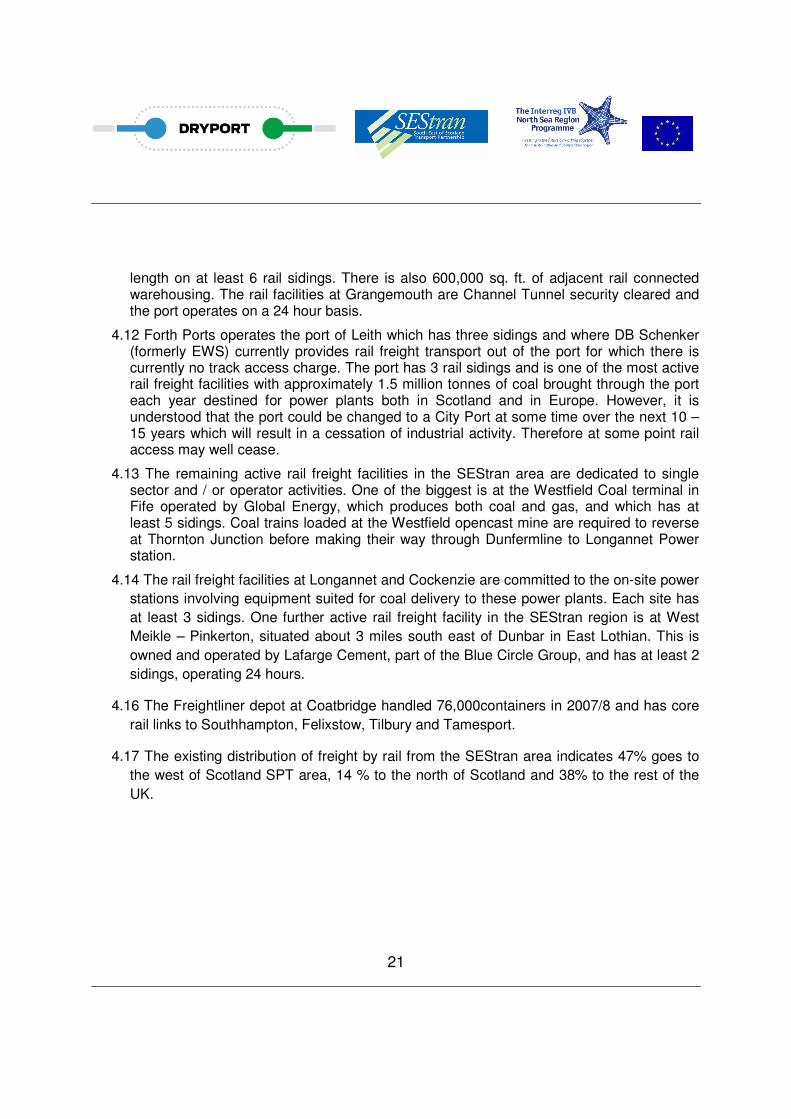
4.10 One notable issue is the small number of freight depots currently being operated in the
South East of Scotland. The principal facility especially for container movement in the area
is Grangemouth. Other facilities in the area are based on the movement of coal (Leith,
Westfield, Longannet and Cockenzie) and the movement of cement from West Meikle
near Dunbar. The other locations just outwith the SEStran area, but serving the area are
Eurocentral RDC at Mossend and the Freightliner depot at Coatbridge. Therefore there is
considerable potential to increase the use of existing rail freight terminals and reopen
mothballed facilities if required.
4.11 Of the active rail freight centres in the SEStran area, the principal rail freight facility is Grangemouth. The port has facilities for container handling and cross docking to conventional rail freight movements and is able to accommodate rail wagons of 50m
21
length on at least 6 rail sidings. There is also 600,000 sq. ft. of adjacent rail connected warehousing. The rail facilities at Grangemouth are Channel Tunnel security cleared and the port operates on a 24 hour basis.
4.12 Forth Ports operates the port of Leith which has three sidings and where DB Schenker (formerly EWS) currently provides rail freight transport out of the port for which there is currently no track access charge. The port has 3 rail sidings and is one of the most active rail freight facilities with approximately 1.5 million tonnes of coal brought through the port each year destined for power plants both in Scotland and in Europe. However, it is understood that the port could be changed to a City Port at some time over the next 10 – 15 years which will result in a cessation of industrial activity. Therefore at some point rail access may well cease.
4.13 The remaining active rail freight facilities in the SEStran area are dedicated to single sector and / or operator activities. One of the biggest is at the Westfield Coal terminal in Fife operated by Global Energy, which produces both coal and gas, and which has at least 5 sidings. Coal trains loaded at the Westfield opencast mine are required to reverse at Thornton Junction before making their way through Dunfermline to Longannet Power station.
4.14 The rail freight facilities at Longannet and Cockenzie are committed to the on-site power
stations involving equipment suited for coal delivery to these power plants. Each site has
at least 3 sidings. One further active rail freight facility in the SEStran region is at West
Meikle – Pinkerton, situated about 3 miles south east of Dunbar in East Lothian. This is
owned and operated by Lafarge Cement, part of the Blue Circle Group, and has at least 2
sidings, operating 24 hours.
4.16 The Freightliner depot at Coatbridge handled 76,000containers in 2007/8 and has core
rail links to Southhampton, Felixstow, Tilbury and Tamesport.
4.17 The existing distribution of freight by rail from the SEStran area indicates 47% goes to
the west of Scotland SPT area, 14 % to the north of Scotland and 38% to the rest of the
UK.
22
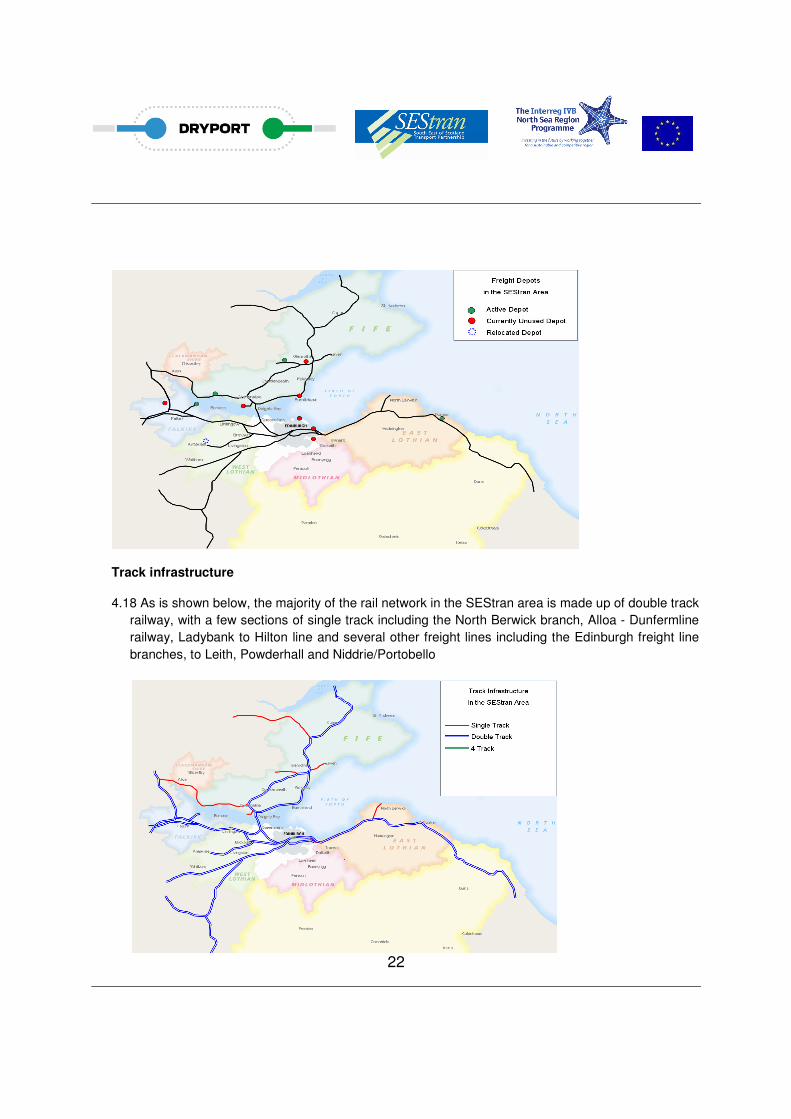
Track infrastructure
4.18 As is shown below, the majority of the rail network in the SEStran area is made up of double track
railway, with a few sections of single track including the North Berwick branch, Alloa - Dunfermline
railway, Ladybank to Hilton line and several other freight lines including the Edinburgh freight line
branches, to Leith, Powderhall and Niddrie/Portobello
23
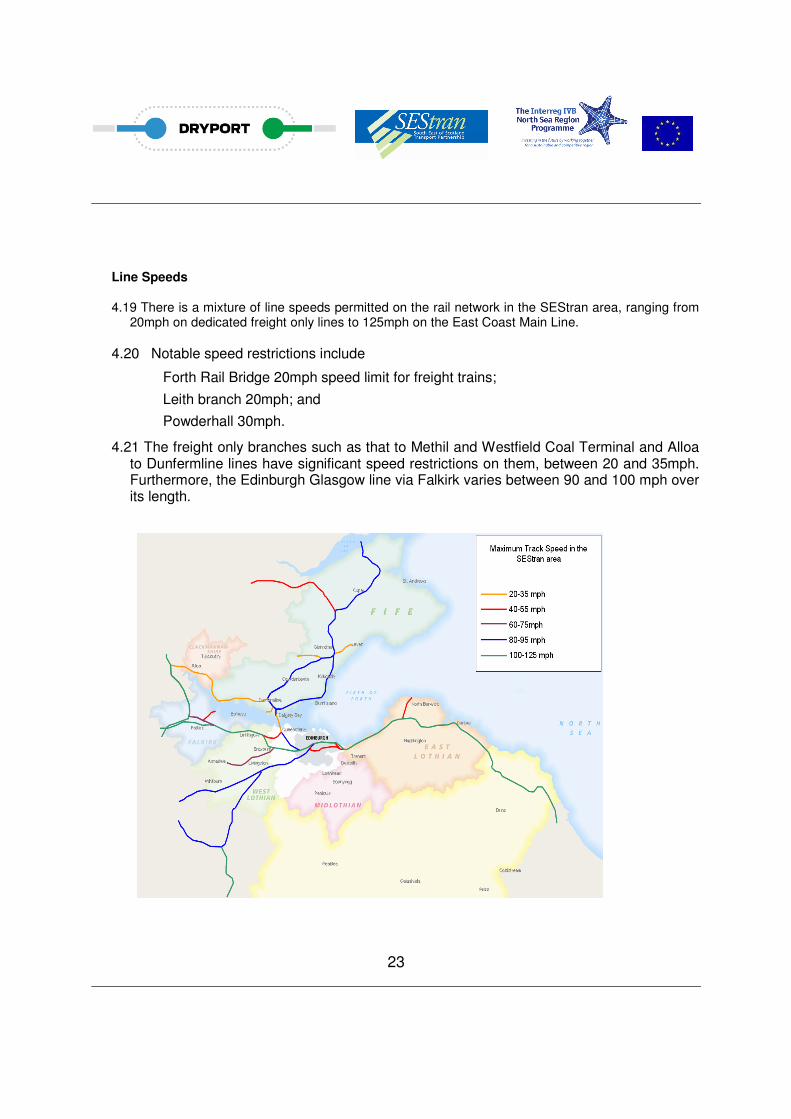
Line Speeds
4.19 There is a mixture of line speeds permitted on the rail network in the SEStran area, ranging from 20mph on dedicated freight only lines to 125mph on the East Coast Main Line.
4.20 Notable speed restrictions include
Forth Rail Bridge 20mph speed limit for freight trains;
Leith branch 20mph; and
Powderhall 30mph.
4.21 The freight only branches such as that to Methil and Westfield Coal Terminal and Alloa to Dunfermline lines have significant speed restrictions on them, between 20 and 35mph. Furthermore, the Edinburgh Glasgow line via Falkirk varies between 90 and 100 mph over its length.
24
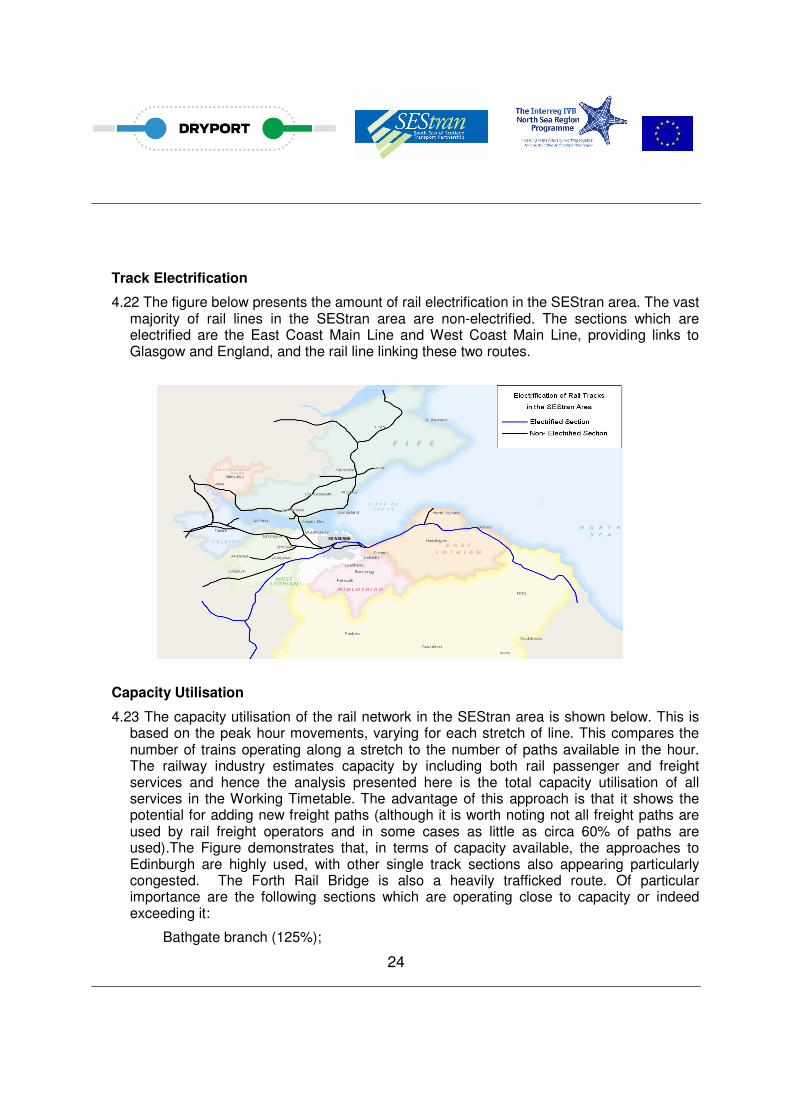
Track Electrification
4.22 The figure below presents the amount of rail electrification in the SEStran area. The vast majority of rail lines in the SEStran area are non-electrified. The sections which are electrified are the East Coast Main Line and West Coast Main Line, providing links to Glasgow and England, and the rail line linking these two routes.
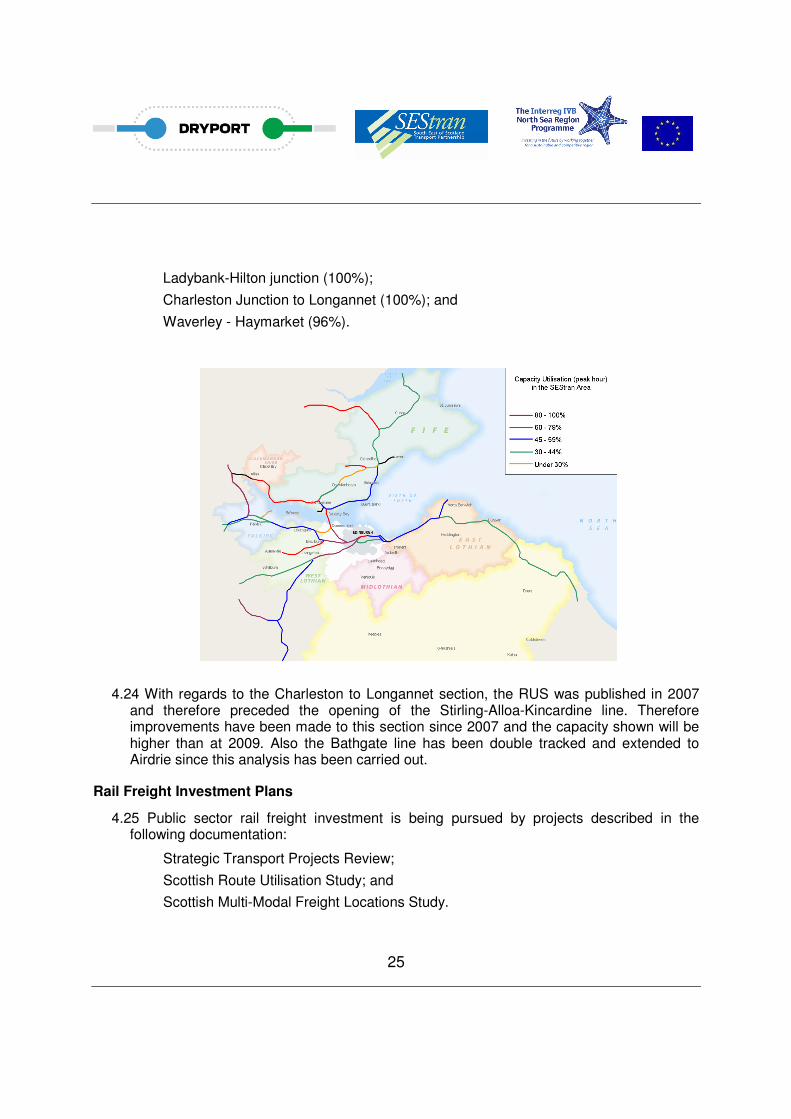
Capacity Utilisation
4.23 The capacity utilisation of the rail network in the SEStran area is shown below. This is based on the peak hour movements, varying for each stretch of line. This compares the number of trains operating along a stretch to the number of paths available in the hour. The railway industry estimates capacity by including both rail passenger and freight services and hence the analysis presented here is the total capacity utilisation of all services in the Working Timetable. The advantage of this approach is that it shows the potential for adding new freight paths (although it is worth noting not all freight paths are used by rail freight operators and in some cases as little as circa 60% of paths are used).The Figure demonstrates that, in terms of capacity available, the approaches to Edinburgh are highly used, with other single track sections also appearing particularly congested. The Forth Rail Bridge is also a heavily trafficked route. Of particular importance are the following sections which are operating close to capacity or indeed exceeding it:
Bathgate branch (125%);
25
Ladybank-Hilton junction (100%);
Charleston Junction to Longannet (100%); and
Waverley - Haymarket (96%).
4.24 With regards to the Charleston to Longannet section, the RUS was published in 2007 and therefore preceded the opening of the Stirling-Alloa-Kincardine line. Therefore improvements have been made to this section since 2007 and the capacity shown will be higher than at 2009. Also the Bathgate line has been double tracked and extended to Airdrie since this analysis has been carried out.
Rail Freight Investment Plans
4.25 Public sector rail freight investment is being pursued by projects described in the following documentation:
Strategic Transport Projects Review;
Scottish Route Utilisation Study; and
Scottish Multi-Modal Freight Locations Study.
26
4.26 Each of these documents represents a national approach to rail investment. However, rail investment on one part of the national network will often have an effect on other parts, and it is not unreasonable to state that the performance of the network in its entirety tends to be limited by its weakest link, whether this is loading gauge, freight path availability or track capacity. Therefore steps to improve a constraint in one part of the rail network may well release a greater capability in another part of the network. This is as true of rail freight performance in the SEStran area as in other parts of Scotland.
Strategic Transport Projects Review
4.27 The Strategic Transport Projects Review (STPR) is the Scottish Government’s flagship document for reviewing transport investment requirements. It sets out a series of interventions required to develop the transport network in Scotland beyond 2012, primarily between 2012 and 2022.
4.28 Several of these proposed interventions have a direct impact on the rail network in the SEStran area. Those which will potentially affect rail freight are described below.
• Intervention 6 – Further Electrification of the Strategic Rail Network
4.29 This intervention works towards an electrified rail network across the strategic routes in Scotland. Although primarily focused on environmental benefits, there are operational benefits compared with diesel powered trains both in terms of reduced journey times and operating costs. This intervention would take the form of a phased approach as follows:
Phase 1 - Committed improvements as part of the Edinburgh to Glasgow
improvements, comprising the Edinburgh to Glasgow via Falkirk route, Diversion
Routes 1 (Haymarket) and 2 (Falkirk Grahamston), and electrification on the
route via Cumbernauld and to Dunblane / Alloa;
Phase 2 - Electrification of the remaining routes in the Central Belt (Shotts, Whifflet,
Paisley Canal, Glasgow North Suburban, East Kilbride and Kilmarnock);
Phase 3 - Electrification of routes between Edinburgh, Perth and Dundee including
the Fife Circle;
Phase 4 - Electrification from Dunblane to Aberdeen; and
Phase 5 – Electrification from Perth to Inverness.
4.30 Initially Phases 1 and 2 would be implemented with Phases 3-5 taking place in the longer term. This intervention would also allow a greater flexibility of operations for services across the network, giving opportunities for new routes and through services.
27
• Intervention 12 – Enhancing Rail System Capacity through Targeted Improvements
4.31 This intervention would target parts of the rail network that are operating close to or at capacity during peak periods, with limited or no opportunity for additional services to be operated. This intervention would cover operational and relatively small scale infrastructure measures such as:
o provision of additional signal blocks in heavily used parts of the network;
o replacement of two-aspect signals with three or four aspect signals in heavily used
parts of the network;
o replacement of single lead junctions with double lead junctions as appropriate to
improve efficiency; and
o replacement of low speed junctions and crossovers as appropriate to improve
efficiency.
4.32 This intervention provides upgrades for rail signaling, as well as track and junction layouts to reduce headways and allow more trains to use the network. This intervention would have the effect of improving operational performance and would also lead to reduced journey times where train times are currently constrained by limited capacity and a mix of train speeds.
4.33 Some parts of this intervention have been developed as part of proposals in Network Rail’s Scottish Route Utilisation Strategy which is discussed later.
• Intervention 13 – Rail Enhancements in the East of Scotland
4.34 This intervention includes an increase in service frequency on rail services across the east of Scotland. Although primarily aimed at increasing passenger train services to Edinburgh the associated remodelling of various parts of the network to enhance capacity for these services, such as Portobello Junction to Newcraighall and Dunbar station and additional capacity enhancements such as resignalling and loops, would provide additional benefits for freight trains also using these sections.
• Intervention 15 – Edinburgh to Glasgow (Rail) Improvements Programme
4.35 Intervention 15 focuses on improvements to the rail corridors between Glasgow and Edinburgh, with some elements of the infrastructure upgrading benefitting freight including diversion routes. This would allow freight trains to be operated from the West Coast Main Line by faster electric locomotives.
• Intervention 20 – Grangemouth Road and Rail Access Upgrades
4.36 Intervention 20 comprises upgrades to both road and rail access to Grangemouth. The rail access improvements would focus on increasing the numbers of freight trains able to run into Grangemouth terminal. This would be enabled through capacity enhancements at
28
and around Grangemouth Junction, electrification between Coatbridge and Grangemouth as well as increasing loading gauge to allow access for larger containers. Furthermore, track modifications are proposed to provide improved access from the west and a new curve to permit direct access from the east. These rail improvements would tie in with Intervention 15 (Edinburgh to Glasgow Rail Improvements Programme) and allow freight trains to be operated from the West Coast Main Line by faster electric locomotives.
4.37 These proposals would reduce journey times and increase capacity on the rail networks for freight transport.
• Intervention 23 – Rail Service Enhancements between Aberdeen and Central Belt
4.38 Intervention 23 will help improve rail connections between Aberdeen and the Central Belt. Implemented in two phases the first would involve:
o provision of bi-directional signalling along the route to reduce the impact of
engineering works on the route (permitting the route to remain open for
freight throughout the day and week);
o increased length of freight loops (allowing longer freight trains); and
o removal of speed limits that are below 75mph for freight trains.
4.39 The second phase would involve the removal of the single track at Usan, including a new bridge over Montrose Basin.
4.40 This intervention would allow the use of low floor wagons permitting standard containers to be carried on existing infrastructure with minimal physical works (e.g. targeted gauge enhancements at appropriate structures). Currently designated as a ‘Tier 3’ intervention in the Scottish Ministers’ High Level Output Specification, development of the option is continuing for possible implementation between 2009 and 2014.
• Intervention 28 – Inverkeithing to Halbeath Rail Line
4.41 Intervention 28 proposes the idea of a new rail link between Inverkeithing and Halbeath taking the form of a double track rail link. This would improve access to the port of Rosyth and also reduce journey times.
Scottish Route Utilisation Strategy
4.42 The Scottish Route Utilisation Strategy (RUS) prepared by Network Rail sets out the priorities for improvements to the rail network in Scotland. The aim of the RUS programme is to identify a strategy for the railway to meet expected future requirements in a way that is deliverable, affordable and consistent with performance and safety improvements. The Scotland Route is divided into three Strategic Routes, and the SEStran area is covered by Route 24 (East of Scotland), and also part of the East Coast Main Line (ECML).
29
4.43 A series of gaps where the railway network is insufficient, or is predicted to be in the future, have been identified. Those relevant to this study are:
o Larbert – Stirling. This gap arises as a result of the re-routeing of the existing coal
flows to Longannet via Stirling following the reopening of the
Stirling/Alloa/Kincardine line;
o Airdrie to Bathgate rail link. There is potential demand from West Lothian towards
Glasgow and from North Lanarkshire towards Edinburgh that had no direct rail
service; and
o Shotts Line: Capacity and service - Additional capacity will be required on this route.
4.44 The strategy is set out over three control periods, detailing the proposed timescales for implementation of improvements to address the gaps. These are:
Short Term (2007-2009);
Medium Term (2009-2014); and
Long Term (2014-2019).
4.45 The following sets out a summary of the plans for these control periods.
• Short Term (implemented)
The following measures were proposed in the short term to address the current gaps on the network in the east of Scotland:
o Longer trains with increased capacity between Dunblane and Glasgow are
recommended; and
o three aspect signalling will be implemented between Larbert and Stirling; and
Stirling Middle Junction to be re-modelled.
• Medium Term (currently being implemented)
The following measures are to be implemented in the medium term to upgrade the network in the east of Scotland:
o following the short-term timetable recast on the Edinburgh – Fife passenger
services, benefits can be gained which can also assist freight from the
implementation of additional signalling to reduce headways between
Haymarket and Inverkeithing;
o when the area around the Tay Bridge is re-signalled, the renewal will seek to
modify the current operating restrictions that prevent any two trains from
passing on the high girders;
30
o re-double Portobello Junction and the single line through Brunstane to
Niddrie to improve the operation of the Scottish Borders Railway towards
Tweedbank; and
o in line with Scottish Ministers’ aspirations, the Airdrie to Bathgate Railway,
and the Scottish Borders Railway will be progressed.
• Long Term
The following measures are being considered in the long term to upgrade the railway infrastructure in Scotland:
o increased capacity, particularly on inter-urban routes, are aspirations
which will need to be addressed in the longer term. The eastern end of
the route into Edinburgh could be developed in a number of radically
different ways, but these have not been specified in the RUS.
Scottish Multi-Modal Freight Locations Study
4.46 The study examined the potential development of Scotland’s key freight locations in terms of their economic competitiveness and contribution to other issues such as promoting modal shift and providing wider benefits. As a multi-modal freight location study, the focus was on locations where two or more modes for freight transport (e.g. air, water, rail or road) are able to transfer freight between each other.
4.47 In terms of the SEStran area, rail freight is forecast to increase at a greater rate than other freight modes, albeit from a very low base, and is projected to double in volume by 2020 under the high growth scenario adopted in the study.
4.48 The consultation exercise carried out for this study identified three potential multi-modal freight locations in the SEStran area, which were:
o Leven / Cameron Bridge;
o Grangemouth; and
o Rosyth.
4.49 Each of these locations has either an existing rail link (Grangemouth) or could be potentially linked to the national rail network (Rosyth and Leven / Cameron Bridge - both of which have an existing decommissioned line). The rail links are still in place at Rosyth and were used until fairly recently. It should be noted that although Rosyth already has a rail station of that name it serves the local settlement rather than the freight transport movements through Rosyth Harbour.
31
Other Infrastructure Provision
4.50 The above has described in some depth the current rail freight infrastructure in terms of track performance and capacity. However there are two major rail freight regional distribution centres, both of which are in the SPT area, but are reasonably close to the SEStran area and could be used. These are:
o Eurocentral RDC at Mossend; and
o Freightliner depot at Coatbridge.
4.51 Both these locations have substantial rail links to England and southern Scotland via the
West Coast Mainline and via the Glasgow and South Western line.
4.52 The intermodal terminal at Eurocentral, ‘Euroterminal’, serves both non rail-connected
warehousing in the Eurocentral and the wider region with rail borne freight traffic. It also
has the capability to handle rail borne automotive traffic and a vehicle distribution
company, fed by rail, operates from Eurocentral.
4.53 Along with the Eurocentral facility at Mossend, Coatbridge is also largely perceived as a
railhead terminus. The site is operated by Freightliner, covering 35 acres and shipped
approximately 76,000 containers in 2007/8. Freightliner moves more maritime containers
than any other haulier with some 22% of the deep-sea container market. The core
services are to Southampton, Felixstowe, Tilbury and Thamesport via the West Coast
Main Line, although there are sometimes diversions via the East Coast Main Line.
Network Effects of the Planned Improvements
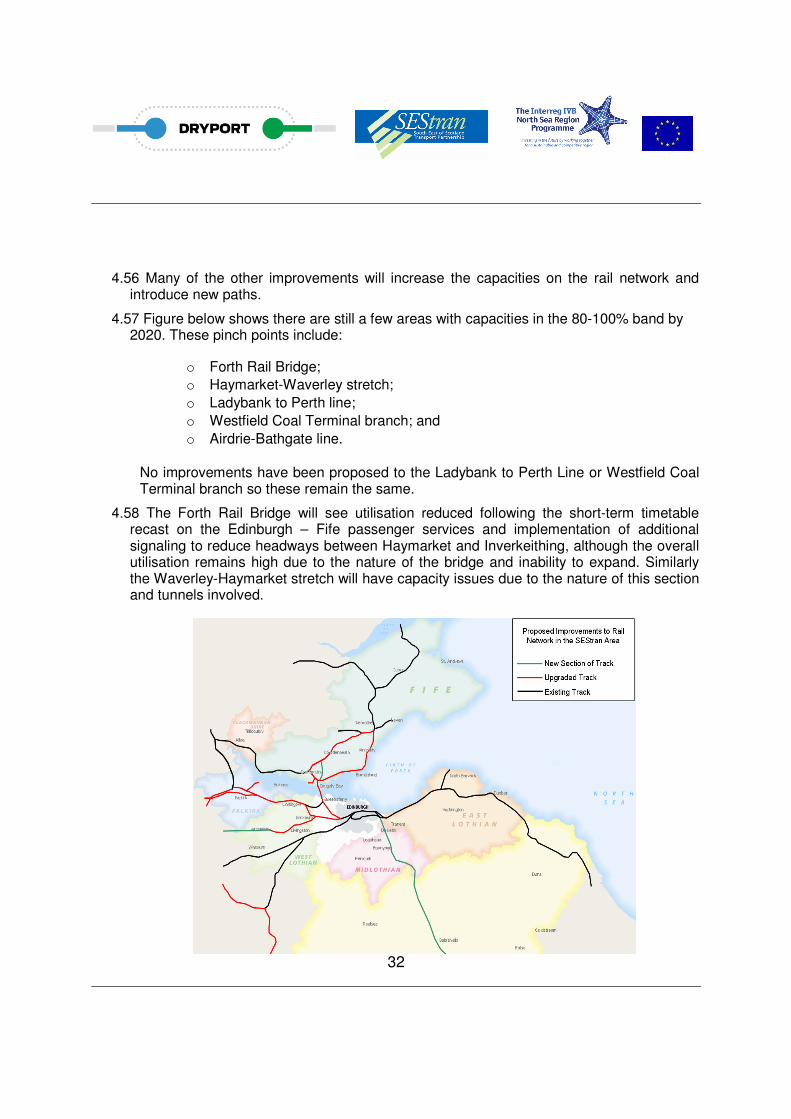
4.54 For the purposes of this assessment a future planning year of 2020 has been used. This planning year is consistent with that used for the Strategic Transport Projects Review, Route Utilisation Strategy and Scottish Multi-Modal Freight Locations Study and will therefore ensure continuity with these plans. By the planning year of 2020, assuming all the proposed improvements from the identified strategies are taken forward and implemented, the network infrastructure should be upgraded or constructed, as seen in the figure below.
4.55 The main areas to note the changes in capacity utilisation are the Stirling – Alloa Kincardine line where the capacity will be improved to 45-59% due to remodelling of Stirling Middle Junction and introduction of three aspect signaling between Larbert and Stirling, making this line easier to access. There will also be an improvement on the Newbridge-Winchburgh section of the Edinburgh-Glasgow line to 45-59% as a result of the Edinburgh-Glasgow improvements programme.
32
4.56 Many of the other improvements will increase the capacities on the rail network and introduce new paths.
4.57 Figure below shows there are still a few areas with capacities in the 80-100% band by 2020. These pinch points include:
o Forth Rail Bridge;
o Haymarket-Waverley stretch;
o Ladybank to Perth line;
o Westfield Coal Terminal branch; and
o Airdrie-Bathgate line.
No improvements have been proposed to the Ladybank to Perth Line or Westfield Coal Terminal branch so these remain the same.
4.58 The Forth Rail Bridge will see utilisation reduced following the short-term timetable recast on the Edinburgh – Fife passenger services and implementation of additional signaling to reduce headways between Haymarket and Inverkeithing, although the overall utilisation remains high due to the nature of the bridge and inability to expand. Similarly the Waverley-Haymarket stretch will have capacity issues due to the nature of this section and tunnels involved.
33
4.59 The Airdrie-Bathgate line involved doubling of the tracks and allow services to run between Edinburgh and Glasgow. However although this will effectively double the number of train paths available, the number of passenger services per hour is also doubling, therefore the utilisation of the line reduces from 125% to around 80-90%.
4.60 The above map represents the Do-Minimum scenario which will be taken forward and used as the base for the rest of this study.
Future Rail Freight Demand
4.61 The data collected was disaggregated into 6 types of commodities, to take into account specifics of the SEStran region and variations across the country and the different economic sectors. To balance against the key priority industries, the freight data was therefore cross-referenced with the following economic sector groupings [based on the Standard Index Classifications (SIC) codes]:
o Agriculture, Fishing and Foodstuffs;
o Forestry and Forestry Products (timber/furniture/paper);
o Solid Fuels and Petroleum Products;
o Minerals, Building Materials and Construction;
o Fertilizers and Chemicals; and
o Other/Miscellaneous.
Data was processed and analysed separately for each of the above freight commodities, allowing for a more refined analysis of future freight demand.
4.62 Freight demand was established for a 2007 base scenario. In order to assess the changes of rail freight movements in the future, a horizon year of 2020 was estimated as being a suitable future modelling year. In particular, two different scenarios were appraised:
2020 with low level of freight growth; and
2020 with high level of freight growth.
4.63 These two scenarios were modelled under a series of assumptions discussed and agreed during the study. These represent low and high growth assumptions of how the economy will develop over time, how background road traffic flows increase, the increase in the value of fuel prices over time, and other relevant factors affecting freight transport.
34
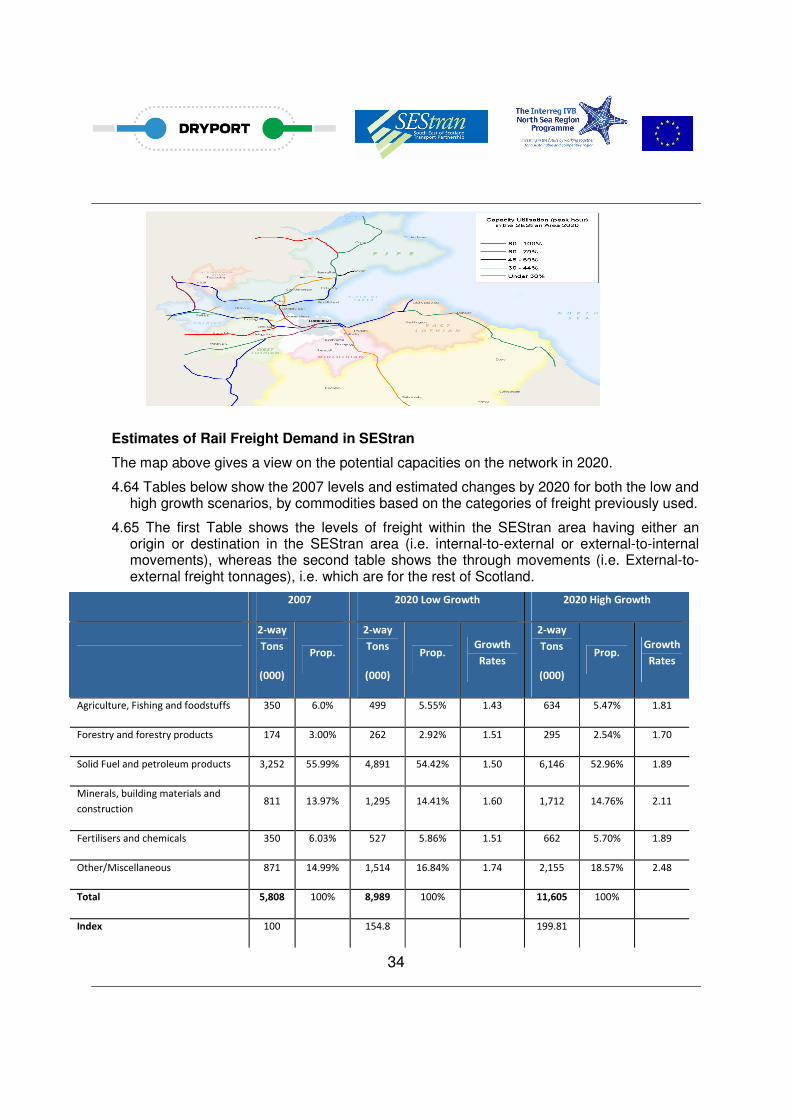
Estimates of Rail Freight Demand in SEStran
The map above gives a view on the potential capacities on the network in 2020.
4.64 Tables below show the 2007 levels and estimated changes by 2020 for both the low and high growth scenarios, by commodities based on the categories of freight previously used.
4.65 The first Table shows the levels of freight within the SEStran area having either an origin or destination in the SEStran area (i.e. internal-to-external or external-to-internal movements), whereas the second table shows the through movements (i.e. External-to-external freight tonnages), i.e. which are for the rest of Scotland.
2007 2020 Low Growth 2020 High Growth
2-way
Tons
(000)
Prop.
2-way
Tons
(000)
Prop. Growth
Rates
2-way
Tons
(000)
Prop. Growth
Rates
Agriculture, Fishing and foodstuffs 350 6.0% 499 5.55% 1.43 634 5.47% 1.81
Forestry and forestry products 174 3.00% 262 2.92% 1.51 295 2.54% 1.70
Solid Fuel and petroleum products 3,252 55.99% 4,891 54.42% 1.50 6,146 52.96% 1.89
Minerals, building materials and
construction 811 13.97% 1,295 14.41% 1.60 1,712 14.76% 2.11
Fertilisers and chemicals 350 6.03% 527 5.86% 1.51 662 5.70% 1.89
Other/Miscellaneous 871 14.99% 1,514 16.84% 1.74 2,155 18.57% 2.48
Total 5,808 100% 8,989 100% 11,605 100%
Index 100 154.8 199.81
35
2007 2020 Low Growth 2020 High Growth
2-way
Tons
(000)
Prop.
2-way
Tons
(000)
Prop. Growth
Rates
2-way
Tons
(000)
Prop. Growth
Rates
Agriculture, Fishing and foodstuffs 22 6.0% 31 5.55% 1.43 39 5.46% 1.81
Forestry and forestry products 11 2.98% 16 2.91% 1.51 18 2.52% 1.69
Solid Fuel and petroleum products 201 56.05
% 302 54.45% 1.50 380 53.02% 1.89
Minerals, building materials and
construction 50
13.89
% 80 14.36% 1.60 105 14.69% 2.11
Fertilisers and chemicals 22 6.02% 33 5.88% 1.51 41 5.69% 1.89
Other/Miscellaneous 54 15.03
% 94 16.85% 1.74 134 18.62% 2.48
Total 359 100% 556 100% 717 100%
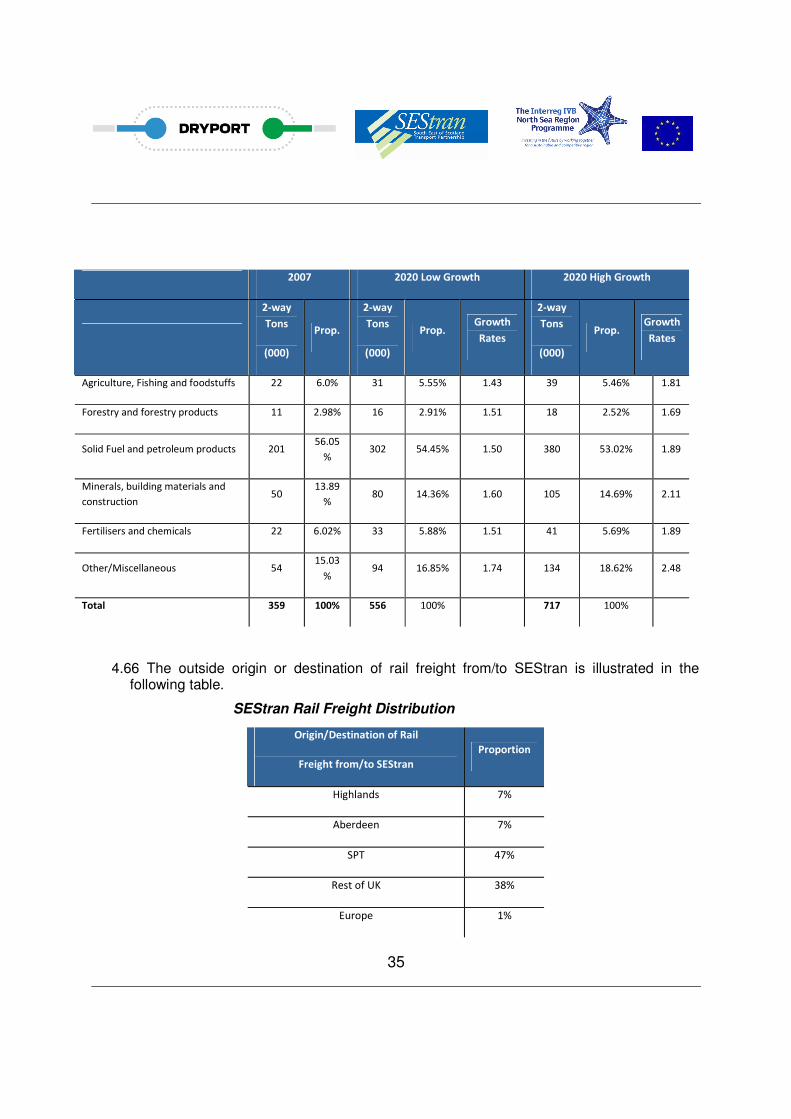
4.66 The outside origin or destination of rail freight from/to SEStran is illustrated in the following table.
SEStran Rail Freight Distribution
Origin/Destination of Rail
Freight from/to SEStran
Proportion
Highlands 7%
Aberdeen 7%
SPT 47%
Rest of UK 38%
Europe 1%
36
4.67 Close to 50% of rail freight either originating in or travelling to SEStran is between SEStran and the SPT area, and a further 38% occurs between SEStran and England and Wales. The north of Scotland accounts for the remaining 14%, with freight from/to Europe being marginal.
4.68 From these future forecast volumes of rail freight we can then calculate the projected increase in the number of trains on the network based on standard formula. Assuming a split of incoming/outgoing traffic of 32%/68% from Scottish Transport Statistics, and a train length of 40 TEUs, a conversion from tonnage to trains can be performed as follows:
o the total tonnage increase of rail freight by 2020 was converted to containers
by dividing by 15 (representing the capacity in tons per TEU);
o the number of containers were then split between imports and exports based
on the above data giving the total flows in and out of the area;
o the number of trains per week required to carry these containers was then
calculated based on the number of containers. This number was divided by
40 (the assumed length of the train) to give the number of trains per annum;
and
o finally the number of trains per day was calculated by dividing the figure by a
standard annualisation factor.
4.69 The number of incoming trains is normally approximately the same, taking into account the empty containers required for loading.
4.70 Having calculated the additional number of trains on the network in 2020, these can then be assigned to the rail network based on the distribution splits previously indicated.
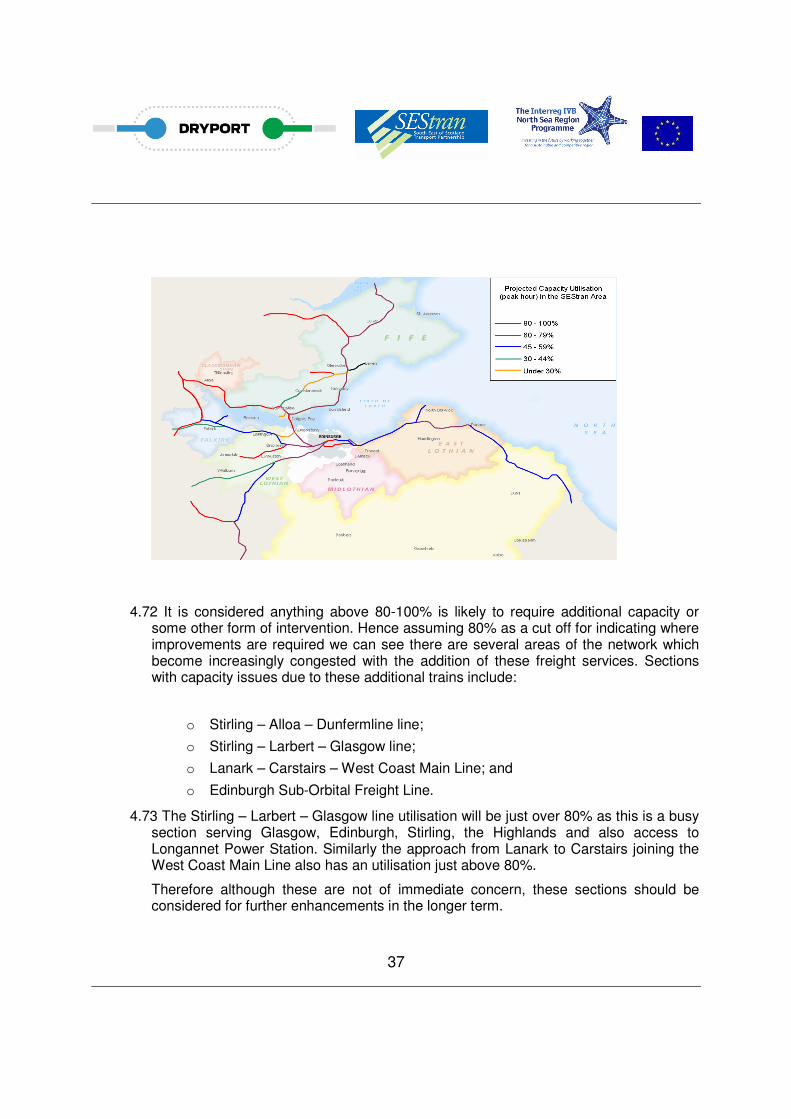
4.71 The extra trains on the network by 2020 were added to the baseline capacity utilisation map prepared and the impacts assessed. Figure below shows the resultant impacts. Again, as per industry procedures, the capacity utilisation is based on the Working Timetable which includes both passenger and freight services.
37
4.72 It is considered anything above 80-100% is likely to require additional capacity or some other form of intervention. Hence assuming 80% as a cut off for indicating where improvements are required we can see there are several areas of the network which become increasingly congested with the addition of these freight services. Sections with capacity issues due to these additional trains include:
o Stirling – Alloa – Dunfermline line;
o Stirling – Larbert – Glasgow line;
o Lanark – Carstairs – West Coast Main Line; and
o Edinburgh Sub-Orbital Freight Line.
4.73 The Stirling – Larbert – Glasgow line utilisation will be just over 80% as this is a busy section serving Glasgow, Edinburgh, Stirling, the Highlands and also access to Longannet Power Station. Similarly the approach from Lanark to Carstairs joining the West Coast Main Line also has an utilisation just above 80%.
Therefore although these are not of immediate concern, these sections should be considered for further enhancements in the longer term.
38
4.74Both the Stirling – Alloa – Dunfermline line and Edinburgh Sub-Orbital Freight Line would be operating close to 100% utilisation with the addition of these new services. However this is from a low base, with 4 paths per hour on the Stirling – Dunfermline line and 3 paths per hour on the Edinburgh Freight Line. Therefore there would be potential to increase these paths significantly. This should be considered and investigated further to cater for growth up to and beyond 2020.
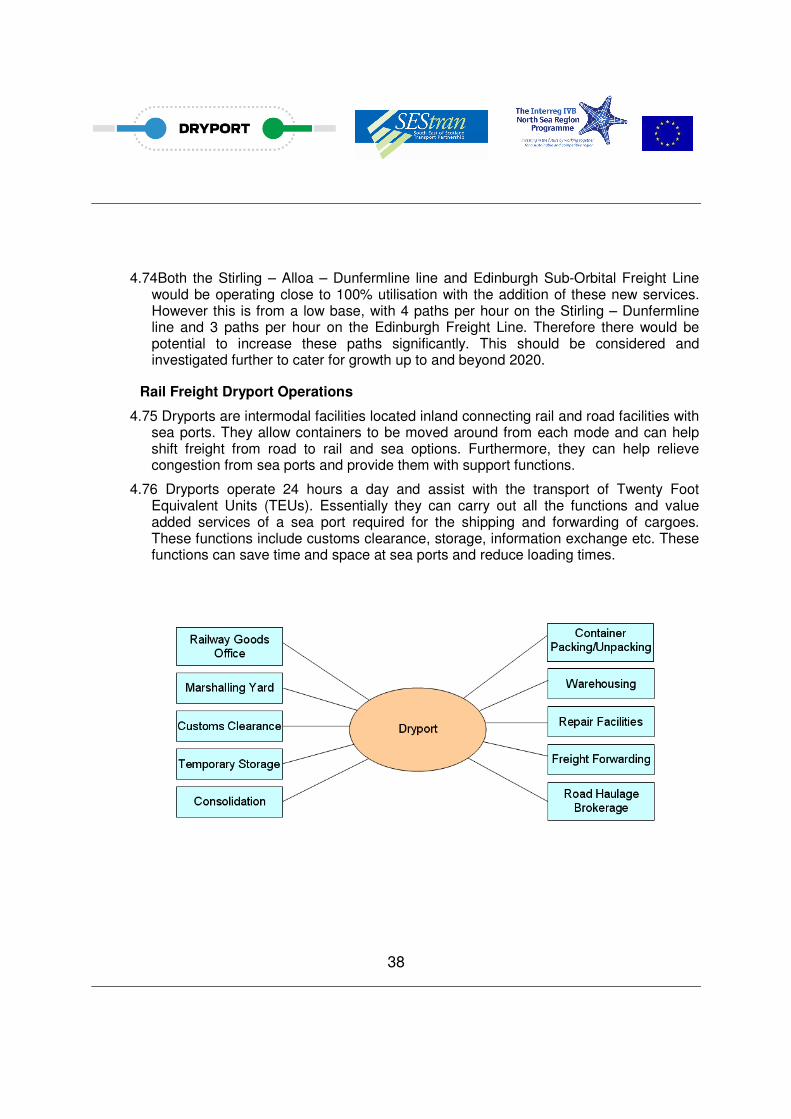
Rail Freight Dryport Operations
4.75 Dryports are intermodal facilities located inland connecting rail and road facilities with sea ports. They allow containers to be moved around from each mode and can help shift freight from road to rail and sea options. Furthermore, they can help relieve congestion from sea ports and provide them with support functions.
4.76 Dryports operate 24 hours a day and assist with the transport of Twenty Foot Equivalent Units (TEUs). Essentially they can carry out all the functions and value added services of a sea port required for the shipping and forwarding of cargoes. These functions include customs clearance, storage, information exchange etc. These functions can save time and space at sea ports and reduce loading times.

39
4.77 With regards to the actual design and layout of a Dryport, these are specific to each
individual location depending on several factors, including traffic volume, traffic pattern,
special trade requirements and conditions. In the absence of a definitive Dryport layout
design, several assumptions have been made as to the actual layout, based on best
practice elsewhere in Europe.
4.78 The layout of a Dryport as presented in this example means minimising and possibly eliminating the amount of time required for freight vehicles to operate within the stacking and loading area of the Dryport. All movements of containers and of other freight cargos within the Dryport can be undertaken by dedicated handling vehicles such as forklifts, mobile cranes and in the case of the rail line, gantry cranes. This layout adds to the efficiency and safety of the operation of a Dryport, and these properties would be extended to other activities such as aggregating loads that may be undertaken within the facility.
4.79 The rail freight based Dryport specifications would be assessed covering the infrastructural requirements such as sidings, warehousing and the total storage area of the facility. The assessment would be based on the estimated rail freight demand as expressed as containerised rail freight volumes transiting through the area. The rail freight flows were obtained from the SEStran Freight Model.
4.80 Having estimated the number of potential trains serving each Dryport per day this would indicate the number of sidings required to handle the rail traffic.
GATE
GATE
CONTAIN
ER
TRANSFER
ROAD/R
AIL
ADMIN. BUILDING &
CONTROL CENTRE
GATEVEHICLE
WAITING AREA
WORKSHOP & CONTAINER
REPAIR AREA
CFSCUSTOMS
EMPTY CONTAINER STORAGE AREA
SPECIALISED CONTAINERS
LOADED CONTAINER STORAGE AREA
TRAIN LOADING/UNLOADING AREA
CONSOLIDATION CENTRE
40
4.81 Finally, the area requirement per container would be calculated taking into account floor area, space required for handling equipment and a peak load factor, normally giving an average value of 40 square metres per container.
5.0 Freight Consolidation Centre Study
5.1 Although the Freight Routing Study indicated the potential viability and benefits of a
Dryport at various locations, there was a need to examine the potential impact of
combining Dryports with consolidation centre activity.
5.2 The potential main benefits of a consolidation centre associated with a Dryport are:
o More efficient and sustainable onward movement of goods
o Deliveries more aligned to customers requirements
o Reducing costs of transport and associated staff costs
o Synergies with the operation of a Dryport through availability of staff, storage and
intermodal transfer facilities.
5.3 The study looked at the operation of existing consolidation centres and identified that
financially these centres tended to require an operating subsidy. The study also indicates
that existing consolidation centres can be regional or fairly close to their destination and
can act as an intermodal facility.
Emerging Key Issues Affecting Consolidation Centres
5.4 There are a variety of different types of consolidation centre and the factors affecting those centres differ depending on the individual aims. The following key factors seem to influence the success of a consolidation centre:
• objectives – consolidation centres can have single or multiple objectives, from meeting environmental targets to modal shift in the type of transport used;
• financial viability – in spite of efforts to encourage financial self sufficiency, in most cases consolidation centres require operating subsidy. However introducing value added services can reduce a scheme’s dependence on public support;
• location – consolidation centres vary in terms of their proximity to the area served, type of location and proximity to the transport network;
41
• spatial coverage – some consolidation centres are purposely developed to serve a single site whereas others may be regional hubs serving a much larger hinterland;
• range of goods handled – examples of the types of goods handled at consolidation centres range from high street retail goods to construction materials;
• transport modes – many consolidation centres utilise road transport, but increasing importance is being attached to initiatives introducing intermodal facilities between road and rail, where the location permits;
• flexibility of operations – while some consolidation centres operate on fixed schedules, others may be geared towards on-demand operations;
• ownership – consolidation centres may be privately or publicly owned and involve either a single operator or a joint venture, such as a Freight Quality Partnership; and
• compulsory/voluntary – some schemes can be operated on a voluntary basis or through compulsion.
5.5 There is a challenge therefore to identify the right set of circumstances where a
consolidation centre scheme would be appropriate in delivering the benefits that these
facilities can achieve One of the most substantive parts of this challenge is to find the
formula where the facility is able to operate successfully commercially with the least
requirement for on-going financial support.
5.6 In terms of a preferred location for a facility for the construction industry, this is, as noted above, dependent on where the major construction sites are (one of the biggest at the time was the M74 extension) and the client requirements associated with these. However, there is a distinction made by one large construction firm between major construction sites and ‘civils’, or on-going civil engineering works, which relate largely to on-going maintenance contracts. For major construction projects, Grangemouth was the preferred location as being as central to the region as possible with the added bonus of being close to a major port that can potentially be used for importing materials. In the case of ‘civils’, different construction companies often have different contract terms, so it is unlikely that any one site suits all major construction companies simultaneously.
42
Locations Identified
5.7 In the SEStran Freight Routing Study a number of sites were identified as potential locations for multi-modal freight hubs. This study linked directly back to the Scottish Multi-Modal Freight Locations Study, undertaken for the Scottish Government, Transport Scotland and Scottish Enterprise. This was a national freight study which has identified a number of locations/options across Scotland for providing multi-modal freight facilities.
5.8 A number of these sites could be used as potential locations for a Consolidation Centre in and around the SEStran area. Consequently, from a review of the emerging multi-modal freight hubs strategy the Scottish Multi-Modal Freight Locations Study developed, the FRS identified 5 potential locations for a new facility, either within the SEStran boundary or adjacent to the area. These were:
• Option 1 – Leven/Methil Dock;
• Option 2 – Rosyth;
• Option 3 – Grangemouth/Falkirk;
• Option 4 – Coatbridge; and
• Option 5 – Lockerbie.
5.9 The first three options above are within SEStran while the other two are adjacent to the area. There are also synergies with some of the interventions from the Scottish Transport Projects Review (STPR). It was considered appropriate to include all of the above in an initial long-list of potential options/locations.
5.10 Including sites identified from the stakeholder consultation and some from previous studies, a total list of six sites were taken forward to the analysis:
• Livingston;
• Grangemouth/Falkirk;
• Rosyth;
• Coatbridge;
• Leven/Methil Dock; and
• Lockerbie.
5.11 Of the above, Livingston is the only new location which was suggested from the consultations while the others were previously identified in the FRS.
5.12 However, not all sites might have enough demand for freight consolidation and this needs to be considered. Hence, in order to objectively look at those sites which realistically have enough demand, the observed freight flows for each potential site are examined to determine which have sufficient demand for a consolidation centre.
43
5.13 The analysis of viability was examined with regards to two key markets, retail and
construction materials, looking at the potential Dryport sites identified in the previous study
work. The inclusion of Livingston as a potential location was based on industry
consultations carried out as part of the study and the fact that there are several large
supermarket distribution/consolidation centres in that area.
5.14 The results produced an overall 20% increase in BCR but gave a mixed message in
terms of location in the SEStran area, with Livingston being identified as the best location
for a consolidation centre but from the previous assessment, not for a Dryport.
Grangemouth produced significant benefits of combining consolidation activities mainly
through decreasing overall operating costs. However consolidation facilities at Coatbridge
did not produce sufficient benefits to consider this as a viable combined option. The main
factor being the site’s (Coatbridge) peripheral location to the main markets in the SEStran
area, but the facility will potentially be able to serve the west of Scotland and provide a
more nationwide primary consolidation function.
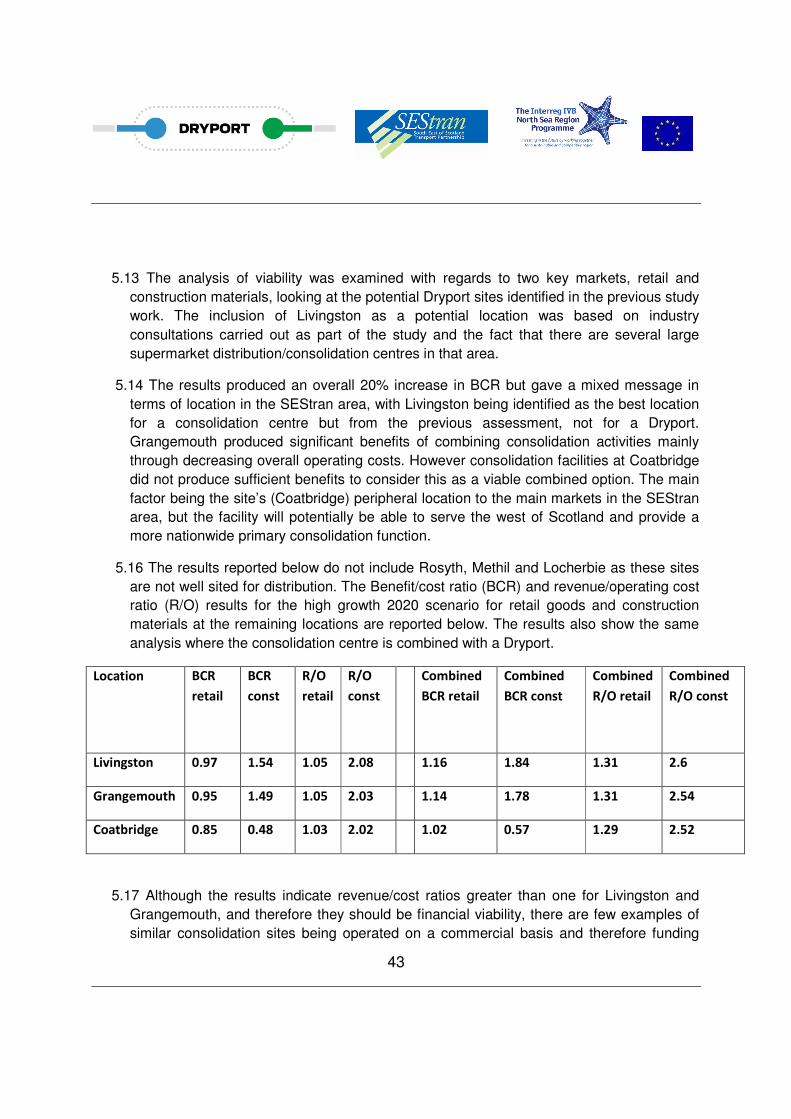
5.16 The results reported below do not include Rosyth, Methil and Locherbie as these sites
are not well sited for distribution. The Benefit/cost ratio (BCR) and revenue/operating cost
ratio (R/O) results for the high growth 2020 scenario for retail goods and construction
materials at the remaining locations are reported below. The results also show the same
analysis where the consolidation centre is combined with a Dryport.
Location BCR
retail
BCR
const
R/O
retail
R/O
const
Combined
BCR retail
Combined
BCR const
Combined
R/O retail
Combined
R/O const
Livingston 0.97 1.54 1.05 2.08 1.16 1.84 1.31 2.6
Grangemouth 0.95 1.49 1.05 2.03 1.14 1.78 1.31 2.54
Coatbridge 0.85 0.48 1.03 2.02 1.02 0.57 1.29 2.52
5.17 Although the results indicate revenue/cost ratios greater than one for Livingston and
Grangemouth, and therefore they should be financial viability, there are few examples of
similar consolidation sites being operated on a commercial basis and therefore funding
44
assistance is likely to be required especially in terms of piloting the project. The results
also indicate greater viability of a consolidation centre combined with a Dryport, showing
benefits of combined working although in terms of layout both activities could not be
carried out within the same part of the premise to allow proper custom checks etc. to be
carried out before distribution.
5.18 The above results were obtained by the following detailed economic analysis;
• The economic appraisal method adopted is based on a Restricted Cost / Benefit Analysis (RCBA). The evaluation involves comparing estimated revenues and some other benefits (time savings, VOC reduction, reduction in sensitive lorry miles and carbon savings) against capital and operating costs. The aim is to identify those location options which support sustainable economic activity and return good value-for-money.
• The central principle of the RCBA is to estimate the welfare gain from the transport investment, as measured by the “willingness to pay” for these improvements and the financial impact on the private sector transport operators. The RCBA does not include financial costs and benefits to the Government as these are quantified separately, and are outwith this study remit.
5.19 It should be noted that the emphasis on this appraisal is not to provide an exact, detailed, estimate but to allow for a comparison of the differences between the different options / locations. This helps us to understand which options are likely to perform better than others and hence are potentially worthy of taking forward for further, more detailed, study.
Capital and Operating Costs
5.20 The capital and operating costs associated with a consolidation centre were calculated, based on case studies of similar developments. A capital cost of £0.95m was estimated for a consolidation centre (all costs are in 2008 undiscounted price).
5.21 There has been a consistent bias in the calculation of capital costs for projects seeking Government funding resulting in a systematic under-reporting of the full costs. To compensate for this, an element of additional costs, estimated at 44% of the capital costs for standard Civil Engineering works was applied to the investment (sourced from HM Treasury Guidance), leading to a total capital cost of £1.37m.
5.22 Regarding operating expenditure, a total annual cost of £0.25m was estimated, again based on relevant case studies.
45
Assumptions
5.23 As previously noted, some uncertainty surrounding forecast background economic growth which would affect the performance of the proposed consolidation centre has meant that high and low growth rate scenarios have been assessed in the appraisal.
5.24 The above calculations were incorporated into a spreadsheet-based RCBA which was used the following economic assumptions:
• a 60-year appraisal period, with a discount base year of 2002;
• an annual discount rate of 3.5% over the first 30 years falling to 3% for the remainder;
• an assumed opening year of 2014; and
• construction costs are assumed to be spread over 2 years, 2012 (40%) and 2013 (60%).
5.25 Clearly, if any option is taken forward for a more detailed study, then more information should be sourced and a full TEE Appraisal would need to be carried out. However, for the purposes of this appraisal the above assumptions are considered to be suitable ‘order-of-magnitude’ estimates. The analysis has been carried out testing costs (capital and operating) against revenue plus area-wide benefits (vehicle operating costs savings, time savings, reduction in sensitive lorry miles and carbon savings).
Summary of Appraisal Results
5.26 The results of the RCBA appraisal on monetised benefits and costs are summarised below. From these, it will be possible to gain an insight into the relative economic efficiency of the options.
46
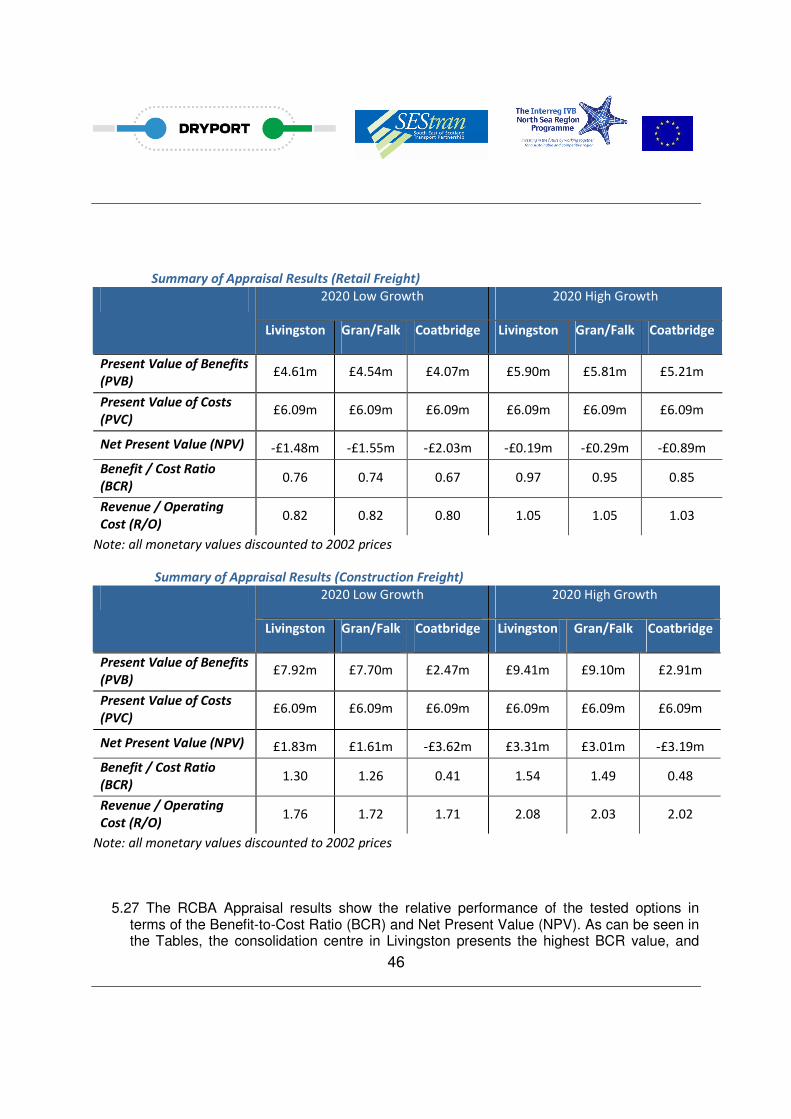
Summary of Appraisal Results (Retail Freight)
2020 Low Growth 2020 High Growth
Livingston Gran/Falk Coatbridge Livingston Gran/Falk Coatbridge
Present Value of Benefits
(PVB) £4.61m £4.54m £4.07m £5.90m £5.81m £5.21m
Present Value of Costs
(PVC) £6.09m £6.09m £6.09m £6.09m £6.09m £6.09m
Net Present Value (NPV) -£1.48m -£1.55m -£2.03m -£0.19m -£0.29m -£0.89m
Benefit / Cost Ratio
(BCR) 0.76 0.74 0.67 0.97 0.95 0.85
Revenue / Operating
Cost (R/O) 0.82 0.82 0.80 1.05 1.05 1.03
Note: all monetary values discounted to 2002 prices
Summary of Appraisal Results (Construction Freight)
2020 Low Growth 2020 High Growth
Livingston Gran/Falk Coatbridge Livingston Gran/Falk Coatbridge
Present Value of Benefits
(PVB) £7.92m £7.70m £2.47m £9.41m £9.10m £2.91m
Present Value of Costs
(PVC) £6.09m £6.09m £6.09m £6.09m £6.09m £6.09m
Net Present Value (NPV) £1.83m £1.61m -£3.62m £3.31m £3.01m -£3.19m
Benefit / Cost Ratio
(BCR) 1.30 1.26 0.41 1.54 1.49 0.48
Revenue / Operating
Cost (R/O) 1.76 1.72 1.71 2.08 2.03 2.02
Note: all monetary values discounted to 2002 prices
5.27 The RCBA Appraisal results show the relative performance of the tested options in terms of the Benefit-to-Cost Ratio (BCR) and Net Present Value (NPV). As can be seen in the Tables, the consolidation centre in Livingston presents the highest BCR value, and
47
offers the best returns to investment for both retail and construction freight, although the BCR for retail is just below 1. The results for the Grangemouth/Falkirk consolidation centre are slightly lower, and the Coatbridge consolidation centre returns the lowest BCR, due to the fact that it leads to significant increases in journey distances and times.
5.28 For both Livingston and Grangemouth/Falkirk, NPVs and BCRs are higher for construction freight than retail freight. For Coatbridge, retail freight leads to higher results than construction freight, but both return a negative NPV. This seems to confirm that consolidation centres for the retail market are more likely to necessitate public subsidies.
5.29 This is further confirmed by the revenue / operating cost ratio (R/O) which are below 1 or only slightly above 1 for the retail market, whereas the construction market returns much higher values.
Potential Method of Operations
5.30 Although there will be synergies between a consolidation centre and a Dryport, they are in fact two separate operations. A consolidation centre largely serves the retail and/or construction industries, by aggregating client deliveries into different types of loads and using its own vehicles to distribute goods and materials to relatively local destinations on a frequent basis. On the other hand a Dryport will process container traffic much in the same way as a normal port, where each container is stored, checked and released for onward transportation, which is likely to be by a mixture of sea, rail or HGV, usually using a franchised transport operator or transport provided by the shipping company itself.
5.31 It is possible for a Dryport and a consolidation centre to operate on the same site. A Dryport generally includes a Container Freight Station (CFS), where more than one consignment are assembled or separated for onward transit. This CFS in effect operates similarly to a consolidation centre, albeit only for freight transiting through the Dryport. This would suggest that there may be an opportunity to combine both facilities, with either the consolidation centre being included within the Dryport as part of the CFS, or with some level of segregation but with shared resources (staff and/or equipment).
5.32 One of the requirements for a Dryport is that it is placed under customs control and is subject to a security cordon, as most of the containerised freight passing through the facility is likely to be import/export. On the other hand, a consolidation centre is not subject to this regulation, as it is generally aimed at serving the domestic freight market. As a result, mixing import and export consignments with cargo using the consolidation centre can raise some customs and security issues, as well as being a potential source of confusion and delay. For this reason, it is suggested that the consolidation centre should be included within the grounds of the Dryport compound but partly segregated, for example with a gate separating the domestic freight handling by the consolidation centre from the freight transiting through the Dryport which is under customs regulation. An example of possible layout is shown in the figure below.
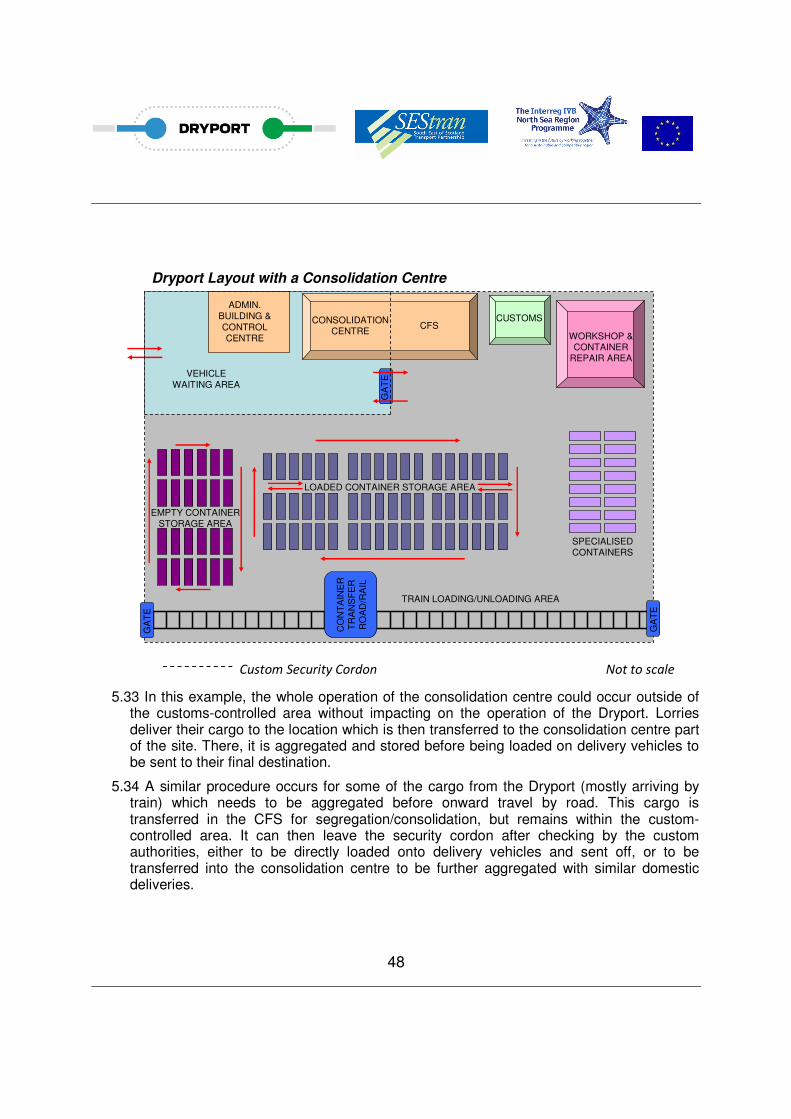
48
Dryport Layout with a Consolidation Centre
GA
TE
GA
TE
CO
NT
AIN
ER
TR
AN
SF
ER
RO
AD
/RA
IL
ADMIN.
BUILDING &
CONTROL CENTRE
GA
TEVEHICLE
WAITING AREA
WORKSHOP & CONTAINER
REPAIR AREA
CFSCUSTOMS
EMPTY CONTAINER STORAGE AREA
SPECIALISED CONTAINERS
LOADED CONTAINER STORAGE AREA
TRAIN LOADING/UNLOADING AREA
CONSOLIDATION CENTRE
Custom Security Cordon Not to scale
5.33 In this example, the whole operation of the consolidation centre could occur outside of the customs-controlled area without impacting on the operation of the Dryport. Lorries deliver their cargo to the location which is then transferred to the consolidation centre part of the site. There, it is aggregated and stored before being loaded on delivery vehicles to be sent to their final destination.
5.34 A similar procedure occurs for some of the cargo from the Dryport (mostly arriving by train) which needs to be aggregated before onward travel by road. This cargo is transferred in the CFS for segregation/consolidation, but remains within the custom-controlled area. It can then leave the security cordon after checking by the custom authorities, either to be directly loaded onto delivery vehicles and sent off, or to be transferred into the consolidation centre to be further aggregated with similar domestic deliveries.
49
Synergies between a Dryport and a Consolidation Centre
5.35 As noted in the previous section, there is a possibility to generate some synergies by establishing a Dryport and a consolidation centre on the same site, thereby potentially decreasing costs and augmenting benefits.
5.36 A clear gain from having both facilities operating jointly would be the sharing of the management structure which can be vertically integrated with the consolidation centre under management of the Dryport administration.
5.37 Moreover, both the CFS within the Dryport and the consolidation centre could be managed by the same staff, which would lead to a reduction in operating costs. These savings could be significant given the fact that both facilities may experience peak workloads at different times of the day (i.e. early morning deliveries for the consolidation centre, and train arrival/departure throughout the day for the Dryport, synchronised with the scheduled shipping at the sea port). Sharing staff would therefore spread the workload more evenly during the day, avoiding the succession of peak periods and intervals of low activity.
5.38 In addition to sharing staff, the consolidation centre and the CFS can also share equipment (such as fork-lift trucks), which would further decrease the operating costs.
5.39 Compared with a purely road-based consolidation centre, cargo transiting through the Dryport / consolidation centre combined facility can utilise both rail and sea modes in addition to road. This could open the potential demand of a consolidation centre to wider markets, including long-distance and international freight.
5.40 Another consequence is that the combination of both facilities could lead to a reduction in vehicles-kilometers, as cargo from the Dryport that needs aggregating before onward travel could be aggregated directly with freight from the consolidation centre if they share a similar destination.
5.41 The combined Dryport / consolidation centre could also benefit from joint marketing, with advertising aimed at targeted customers such as retailers and the construction industry. Emphasis should be made on its status as a modern, multimodal facility offering complementary services to various types of freight, including domestic and international.
Network Impact of Dryport Sites
5.42 The analysis undertaken in this study has shown that the locations which do show sufficient demand for a consolidation centre are the following:
• Livingston;
• Grangemouth/Falkirk; and
• Coatbridge.
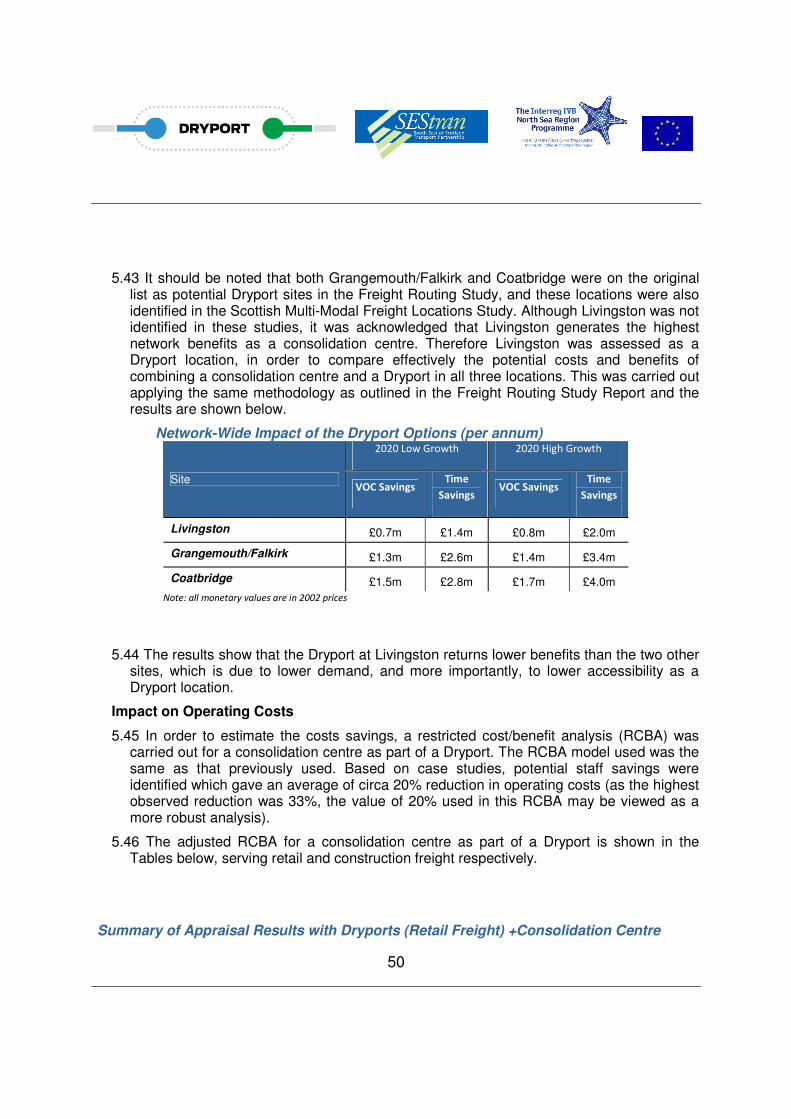
50
5.43 It should be noted that both Grangemouth/Falkirk and Coatbridge were on the original list as potential Dryport sites in the Freight Routing Study, and these locations were also identified in the Scottish Multi-Modal Freight Locations Study. Although Livingston was not identified in these studies, it was acknowledged that Livingston generates the highest network benefits as a consolidation centre. Therefore Livingston was assessed as a Dryport location, in order to compare effectively the potential costs and benefits of combining a consolidation centre and a Dryport in all three locations. This was carried out applying the same methodology as outlined in the Freight Routing Study Report and the results are shown below.
Network-Wide Impact of the Dryport Options (per annum) 2020 Low Growth 2020 High Growth
Site VOC Savings
Time
Savings VOC Savings
Time
Savings
Livingston £0.7m £1.4m £0.8m £2.0m
Grangemouth/Falkirk £1.3m £2.6m £1.4m £3.4m
Coatbridge £1.5m £2.8m £1.7m £4.0m
Note: all monetary values are in 2002 prices
5.44 The results show that the Dryport at Livingston returns lower benefits than the two other sites, which is due to lower demand, and more importantly, to lower accessibility as a Dryport location.
Impact on Operating Costs
5.45 In order to estimate the costs savings, a restricted cost/benefit analysis (RCBA) was carried out for a consolidation centre as part of a Dryport. The RCBA model used was the same as that previously used. Based on case studies, potential staff savings were identified which gave an average of circa 20% reduction in operating costs (as the highest observed reduction was 33%, the value of 20% used in this RCBA may be viewed as a more robust analysis).
5.46 The adjusted RCBA for a consolidation centre as part of a Dryport is shown in the Tables below, serving retail and construction freight respectively.
Summary of Appraisal Results with Dryports (Retail Freight) +Consolidation Centre
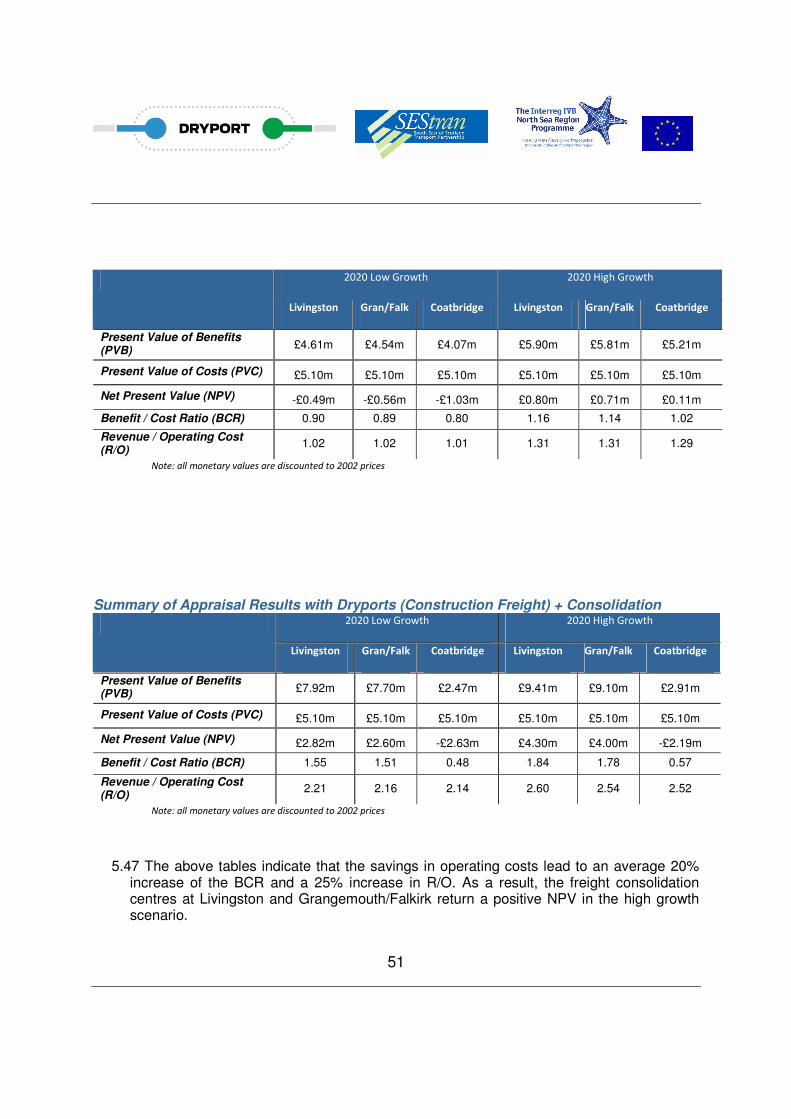
51
2020 Low Growth 2020 High Growth
Livingston Gran/Falk Coatbridge Livingston Gran/Falk Coatbridge
Present Value of Benefits (PVB)
£4.61m £4.54m £4.07m £5.90m £5.81m £5.21m
Present Value of Costs (PVC) £5.10m £5.10m £5.10m £5.10m £5.10m £5.10m
Net Present Value (NPV) -£0.49m -£0.56m -£1.03m £0.80m £0.71m £0.11m
Benefit / Cost Ratio (BCR) 0.90 0.89 0.80 1.16 1.14 1.02
Revenue / Operating Cost (R/O)
1.02 1.02 1.01 1.31 1.31 1.29
Note: all monetary values are discounted to 2002 prices
Summary of Appraisal Results with Dryports (Construction Freight) + Consolidation 2020 Low Growth 2020 High Growth
Livingston Gran/Falk Coatbridge Livingston Gran/Falk Coatbridge
Present Value of Benefits (PVB) £7.92m £7.70m £2.47m £9.41m £9.10m £2.91m
Present Value of Costs (PVC) £5.10m £5.10m £5.10m £5.10m £5.10m £5.10m
Net Present Value (NPV) £2.82m £2.60m -£2.63m £4.30m £4.00m -£2.19m
Benefit / Cost Ratio (BCR) 1.55 1.51 0.48 1.84 1.78 0.57
Revenue / Operating Cost (R/O)
2.21 2.16 2.14 2.60 2.54 2.52
Note: all monetary values are discounted to 2002 prices
5.47 The above tables indicate that the savings in operating costs lead to an average 20% increase of the BCR and a 25% increase in R/O. As a result, the freight consolidation centres at Livingston and Grangemouth/Falkirk return a positive NPV in the high growth scenario.
52
5.48 Based on the Dryport network benefits and the Dryport/consolidation centre RCBA, for all three sites, the following can be observed:
• Livingston returns the best results for a consolidation centre, particularly for construction freight, as a result of its key location in the SEStran area and its proximity to the Edinburgh conurbation. However, it is less than ideal for a Dryport due to its insufficient demand and lower accessibility to rail freight;
• Coatbridge appears to be the best location for a Dryport because of its good connections to the rest of Scotland and its status as a major rail facility. However, its location outside the SEStran area makes it less suitable for a consolidation centre servicing SEStran as it leads to significant increases in journey times and distances on road, particularly for construction freight; and
• Grangemouth/Falkirk returns a slightly lower NPV than Livingston for a consolidation centre, but results are still positive. It comes second as a Dryport site as well, due to its proximity to the port of Grangemouth and its good accessibility by rail.
Operators
5.49 From the case study review, there would appear to be several different organisations involved in the operation of a Dryport. Depending on the set up, these can include:
• Freight Operating Companies;
• Port Authorities;
• Rail infrastructure companies;
• Goods distribution companies; and
• Local/Regional Authorities/Government.
5.50 However, to ensure a seamless operation it would be necessary to appoint one body for the overall management and operation of the site. To enable the development of a Dryport within the SEStran area, the different possibilities for both operators and sources of funding must be considered. In previous examples these have differed from site-to-site depending on the various business interests involved.
5.51 Within and adjacent to the SEStran area, possible operators of a Consolidation Centre within a Dryport could include:
• Forth Ports who operate both Rosyth and Grangemouth ports;
• freight operating companies such as Freightliner who already operate a depot at Coatbridge; and
53
• distribution companies such as DHL (which have a distribution centre at Eurocentral, Mossend) or Exel who also have a large operation is Scotland on behalf of the large supermarket chain, J. Sainsbury.
5.52 From the above it is worth noting that DHL and Exel already have significant experience operating existing consolidation centres at Bristol, Meadowhall and Heathrow Airport. In addition to the private sector there are also examples of public sector involvement in the operation of consolidation centres (e.g. Transport for London and the Principality of Monaco). However, the regulatory arrangements for these examples are different from those in Scotland.
5.53 The marketing of the facility would be very important in order to ensure its full capability was realised and potential for revenues maximised. In this regard the role of the operator would be crucial in ensuring the site was promoted to as wide a range of customers as possible.
5.54 Therefore it would be prudent to appoint an operator who has had previous experience of marketing freight services and who has knowledge of the type of customers who would use the facility. It would appear that commercial companies, or ‘arms-length’ public entities that operate commercially, such as DHL, Exel or Forth Ports, who have had previous freight and marketing experience, might be best placed to do this.
Funding
5.55 In establishing a Dryport, whether building a dedicated new facility or adapting an existing facility, it may be possible that some sort of funding may be obtainable to cover or supplement the capital costs required, and this should certainly be investigated. The process of application and assessment of the grants might be similar to that required for the Freight Facilities Grants that are currently available from the Government, and which are aimed at encouraging modal shift to more sustainable modes of freight transport. This is of particular relevance to the Dryport / Consolidation Centre sector.
5.56 For the operation of the Consolidation Centre within a Dryport, there are several ways which it could be funded. The most common methods include:
• operate on a fully commercial (self-funding) basis;
• operations partly commercial and partly subsidised by public sector; or
• possible grants / funding from central Government / EU to cover all recurrent costs.
5.57 As ascertained from the case studies there are very few examples of Consolidation Centres which have successfully operated on a commercial basis, requiring no external funding. Nevertheless, previous appraisal results show that the Revenue / Operating Cost (R/O) ratios are greater than one for all sites. This implies that the facilities would be able
54
to sustain themselves commercially, requiring little or no subsidy. However, these results are dependent on the assumptions made in the modeling and appraisal process.
5.58 There may also be opportunities for funding assistance (e.g. from the EU) in the future to support an initial pilot project. Such pilot projects have been evident from the case study review.
Case Study Review
5.59 A case study review was undertaken to identify lessons learned from operating consolidation centres elsewhere. Six examples were reviewed, focusing on their efficiency, sustainability and effect on freight transport and the supply chain. This review showed that there is a great variety of consolidation centres with different types of location and spatial coverage, and with various modes of operation and ownership, all serve either the retail or the construction market.
5.60 Nevertheless, the concept of a consolidation centre has been shown to work operationally in a number of different scenarios, with customers having a positive appreciation of the services provided and the enhancements to their supply chain performance. However, the main issue was the financial viability of consolidation centres which generally require public funding, despite the promotion of value-added services provided, by, for example, one of the facilities serving the retail market.
5.61 There is therefore a challenge to identify the right set of circumstances where a consolidation centre would be able to deliver the benefits that these facilities have achieved, while operating successfully from a commercial point of view, and with the least requirement for financial support.
Stakeholder Consultation
5.62 A stakeholder consultation exercise was carried out by interviewing businesses and organisations from a wide geographical area. This considered responses in terms of the requirement for a consolidation centre, potential locations and markets which can be served, and what facilities and functions a consolidation centre can or should be able to undertake.
5.63 From this, it appeared that the largest retail companies have little need for a separate consolidation centre as they already have sophisticated distribution networks in place. However, smaller retailers in urban areas may benefit more from such a scheme, with preferences for either overnight or very early morning deliveries.
5.64 On the other hand, all construction companies interviewed indicated a consolidation centre would be useful at some undefined period in the future. The construction sector favours a just-in time (on demand) approach to synchronise building operations with the delivery of materials.
55
5.65 From the point of view of freight operators, the major benefit of a consolidation centre was the ability to fully utilise vehicle capacity, resulting in significant increase in financial performance.
5.66 However, freight operating companies that are rail based tend to be locked into a rail-lorry structure hub-and-spoke system, using independent hauliers for the final delivery leg to the final destination, mainly using containers. This would restrict the ability of a consolidation centre from operating as a Dryport, but does not preclude the possibility of both facilities operating separately on the same site.
5.67 Regarding the location for a consolidation centre, the apparent preferred locus was formed by a triangle linking the Coatbridge area in the south west to the Grangemouth/Falkirk region in the north, and the western fringes of Edinburgh itself. In particular, for the retail sector and freight operating companies, the favoured location would be an area in close proximity to Livingston, while construction companies favoured a site at Grangemouth/Falkirk, central to the region and close to a major port.
5.68 In order to estimate the potential demand for a consolidation centre, an Incremental Elasticity Model was used, with data from the SEStran Freight Model as input. The model suggested that all three sites return similar results in terms of demand, but results differ in terms of network savings, with Livingston performing the best.
5.69 For all options, the consolidation centre is much more attractive for construction freight activity
than retail freight activity, with freight transfers involving the construction sector occurring almost
three times as often.
Potential Locations for Dryport including consolidation
5.70 Having identified the layout and operations of a Dryport, potential locations for a Dryport/\Consolidation Centres can now be considered. Three sources have been used to consider the optimal location for such a facility.
5.71 Firstly, the consultation feedback and the views from key stakeholders allows market conditions to be taken into account (i.e. how a Dryport would fit in to the SEStran area and how the market would react). From the consultation, the location suggested within the SEStran area which appeared to meet most of the requirements required of a Dryport, was in the vicinity of Grangemouth. It would be close to the main rail freight facilities at the port of Grangemouth itself where there is ample storage capacity and it would be well positioned with respect to both the national rail and road network. It would also be well placed to integrate with the principal rail freight flows in the region and would be well connected (by rail) to other multimodal freight facilities such as those at Coatbridge and Mossend, which serve both Scotland and the rest of the UK.
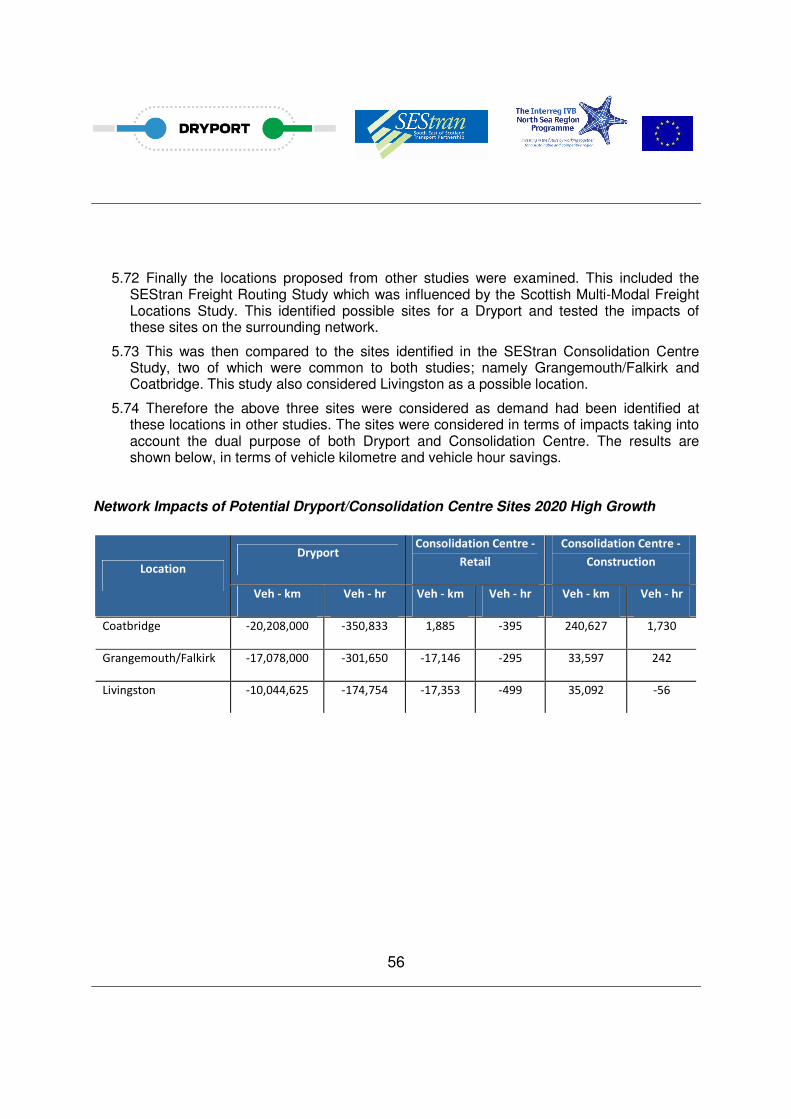
56
5.72 Finally the locations proposed from other studies were examined. This included the SEStran Freight Routing Study which was influenced by the Scottish Multi-Modal Freight Locations Study. This identified possible sites for a Dryport and tested the impacts of these sites on the surrounding network.
5.73 This was then compared to the sites identified in the SEStran Consolidation Centre Study, two of which were common to both studies; namely Grangemouth/Falkirk and Coatbridge. This study also considered Livingston as a possible location.
5.74 Therefore the above three sites were considered as demand had been identified at these locations in other studies. The sites were considered in terms of impacts taking into account the dual purpose of both Dryport and Consolidation Centre. The results are shown below, in terms of vehicle kilometre and vehicle hour savings.
Network Impacts of Potential Dryport/Consolidation Centre Sites 2020 High Growth
Dryport Consolidation Centre -
Retail
Consolidation Centre -
Construction Location
Veh - km Veh - hr Veh - km Veh - hr Veh - km Veh - hr
Coatbridge -20,208,000 -350,833 1,885 -395 240,627 1,730
Grangemouth/Falkirk -17,078,000 -301,650 -17,146 -295 33,597 242
Livingston -10,044,625 -174,754 -17,353 -499 35,092 -56
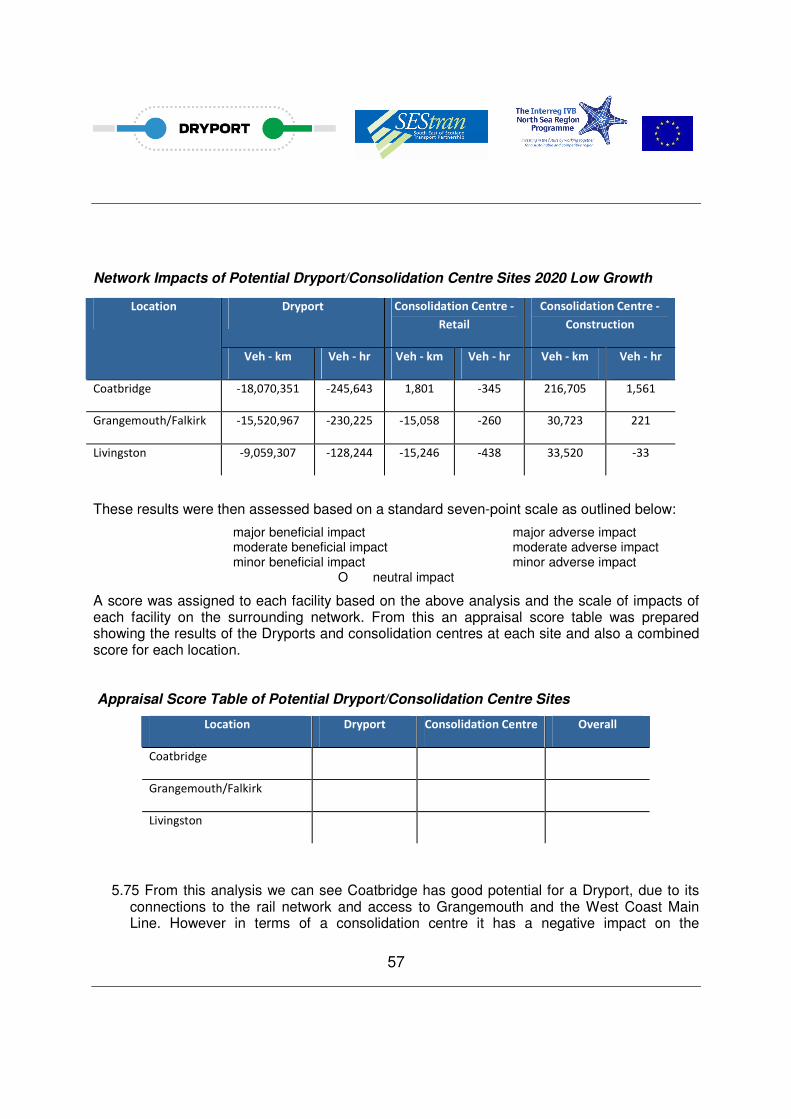
57
Network Impacts of Potential Dryport/Consolidation Centre Sites 2020 Low Growth
These results were then assessed based on a standard seven-point scale as outlined below:
��� major beneficial impact ��� major adverse impact �� moderate beneficial impact �� moderate adverse impact � minor beneficial impact � minor adverse impact
O neutral impact
A score was assigned to each facility based on the above analysis and the scale of impacts of each facility on the surrounding network. From this an appraisal score table was prepared showing the results of the Dryports and consolidation centres at each site and also a combined score for each location.
Appraisal Score Table of Potential Dryport/Consolidation Centre Sites
5.75 From this analysis we can see Coatbridge has good potential for a Dryport, due to its connections to the rail network and access to Grangemouth and the West Coast Main Line. However in terms of a consolidation centre it has a negative impact on the
Dryport Consolidation Centre -
Retail
Consolidation Centre -
Construction
Location
Veh - km Veh - hr Veh - km Veh - hr Veh - km Veh - hr
Coatbridge -18,070,351 -245,643 1,801 -345 216,705 1,561
Grangemouth/Falkirk -15,520,967 -230,225 -15,058 -260 30,723 221
Livingston -9,059,307 -128,244 -15,246 -438 33,520 -33
Location Dryport Consolidation Centre Overall
Coatbridge ��� � ��
Grangemouth/Falkirk �� � ���
Livingston � �� ���
58
surrounding area, increasing both vehicle kilometres and vehicle hours. This is as a result of the site being further from the SEStran area.
5.76 Grangemouth has slightly less demand for a Dryport than Coatbridge but still has good potential due to its proximity to Grangemouth port and connections to railway lines. The site also has good potential for a consolidation centre as it is close to Edinburgh city.
5.77 Livingston currently has the smallest potential for a Dryport of all the sites, mainly due to the fact it does not have a direct connection to any port. To address this issue would require the construction of a new railway line which would involve considerable cost. Livingston does however have the best potential for a consolidation centre due to its proximity to the M8, providing direct connections to both Glasgow and Edinburgh.
Additional Site Considerations
5.78 There are a number of additional site specific criteria which must be considered when deciding upon the actual location of a Dryport. These relate to the rail infrastructure and also the ongoing operations of a Dryport. For a successful rail freight terminal / Dryport the following characteristics must be considered:
• large size and scale – in order to accommodate large distribution
warehousing, intermodal handling facilities and internal railway sidings on the
same site. Therefore the selected site must have sufficient land for
development;
• suitable rail access – in terms of loading gauge, track capacity and
operational flexibility;
• good road access – located close to strategic roads allowing HGVs easy
access to the terminal;
• proximity to markets and market need – a significant regional need to justify
the development will provide a better commercial basis for a rail freight
facility;
• proximity to a workforce – distribution activity is labour intensive, therefore
there must be a suitable level of workforce in the area, with the right level of
capability to service the facility;
• located away from residential areas – distribution needs to be able to operate
at various times, often during late night/overnight periods. Ideally, a facility
should be flexible enough to accommodate operating 24 hours/day, 7 days
per week. This could lead to noise issues if located close to residential areas;
and
59
• the site must be developed at a reasonable cost – this is especially the case
in terms of installing the railway infrastructure and land rental/purchase costs.
If capital and/or land costs are overly high the facility may not be able to
operate successfully on a commercial basis.
Conclusions
5.79 From the above analysis we can see there are effectively two different markets, with Dryports and consolidation centres operating separately from each other. Both facilities have different sets of customers and individual needs. Therefore the introduction of such facilities will have different network impacts and benefits.
5.80 The best performing Dryport site, Coatbridge, is the lowest performing location for a consolidation centre as a result of the increased network kilometres and hours.
5.81 The best performing consolidation location, Livingston, is one of the least beneficial site for a Dryport, providing the lowest network kilometre and hour savings.
5.82 Grangemouth/Falkirk has the second best results for both a Dryport site and a consolidation centre location, but when the two functions are combined, the overall rating suggests this site produces the highest overall benefits.
6.0 The Sustainable Distribution Study
6.1 This study examined the economic and environmental benefits of sustainable distribution
and the potential role of electric powered vehicles. The distribution of goods is the final
step in the movement of goods and is focused on providing the customer with the goods
they require, when they require them in an economic and sustainable way. By definition
this requires the distribution centre to be as close to its main destinations as possible, yet
have good links to, or be a part of the Dryport. However in practice the analysis of the
benefits of a distribution centre are much more reliant on the type of goods being
transferred, customer requirements and service, to define the benefits rather than the bulk
transfer of goods. Therefore the analysis required some detailed assessment of market
requirements and benefits to the relevant customers.
Alternative Fuels
6.2 The increased use of alternative fuels sources, such as biofuels, electricity and hydrogen,
will contribute towards reduced CO2 emissions while improving air quality. Some of these
60
alternative fuels involve relatively new and complex technologies, which require further
research and development before their uptake can be accelerated.
6.3 Decarbonising freight and logistics is a key part of the UK Government’s long-term
strategy. The aim is to help industry move to lower carbon technologies for HGVs as well
as vans and explore other technologies to improve fuel efficiency. The CO2 benefits from
any lower carbon HGV technology need to be balanced with other considerations such as
infrastructure requirements, costs of the technology, safety implications and any
limitations with respect to applicability across the range of HGVs and load types.
6.4 The use of alternatively fuelled vehicles at an urban distribution centre provides a further
opportunity to reduce vehicle emissions to an urban area. There are various types of
alternative fuels that could be considered.
6.5 Biofuels are fuels produced from a range of feedstock including animal waste (tallow) and
energy crops such as wheat, maize, rapeseed, and sugar cane. The main fuels produced
are either bio-ethanol or bio-diesel. Some opportunities also exist with the emergence of
viable technologies, to convert commonly available mixed or segregated waste into
biofuels.
6.6 The use of hydrogen as a fuel for vehicles also has the potential to offer reductions in
CO2 emissions, as the only significant emission is water vapour. However, hydrogen
powered vehicles are not currently available on the mass market, and significant
development is likely to be required before market emergence. 6.6The use of hydrogen as
a fuel for vehicles also has the potential to offer reductions in CO2 emissions, as the only
significant emission is water vapour. However, hydrogen powered vehicles are not
currently available on the mass market, and significant development is likely to be
required before market emergence.
6.7 Electric - urban vehicles can now be powered by electricity, which, although it relies
mainly on fossil fuels to recharge the batteries, is completely emission-free at the tailpipe.
Battery electric vehicles have a range of up to 150 miles, making them suitable for use in
urban distribution where they can be recharged overnight. The fuel cost is around 20% of
the diesel equivalent and they are quiet running, reducing noise pollution. They are
suitable for use in urban areas because of their fast acceleration and zero emissions
which are suited to start-stop situations.
61
6.8 There is growing consensus that electric vehicles are the best near-to-market low-
emission vehicular technology. They have no emissions at point of use and ‘well-to-wheel’
carbon dioxide emissions 30-40% lower than comparable petrol or diesel-fuelled vehicles.
Logistics Decisions
6.9 The Transport, Trade and Strategic Locations Research Report, 2004, done for Scottish Enterprise Dumfries and Galloway found that of the 55 companies interviewed in detail about their logistics operations, 73% said that they purchase on a delivered cost basis – the supplier was responsible for the supply of goods. Interestingly, 26% also said that they left the shipment of outbound deliveries to customers – i.e. they largely operated on a customer collection basis.
6.10 Whose Supply Chain?
� Although the larger retail multiples are increasingly turning to factory gate pricing (FGP), having recognized that a ‘delivered price’ from a supplier can hide a healthy profit margin from the transport element, and that their own large secondary distribution vehicle fleets are often returning empty past a supplier location on the way back to the Distribution Centre, as the research above indicates, the most common point of logistics decision making is at the supplier or contracted supply chain partner.
� Once the strategic structure of a network is determined, many companies then contract out the physical and day-to-day operational decisions to a contracted specialist. For international movements, this may be one of the larger forwarding groups.
6.11 The major international forwarders operating in Scotland include:
o DHL providing Road & air services Head Quarters in Germany o K+N All modes, Road, Rail, Air & Sea Head Quarters in Switzerland o UTI based in Glasgow Road & Air Head Quarters US o Geodis Calberson French Group o Ceva Logistics based in the UK o DB Schenker German Group all modes o Panaalpina Swiss Group
6.12 By managing his outbound operation, the supplier can find efficiencies in vehicle utilization and routing of his own fleet, and where there is lower volume requirements, has the ability to outsource to a subcontractor or pallet-network who may have other traffic going to a similar destination.
62
6.13The shift in procurement patterns from fewer, bulk deliveries to a model that creates a pipeline of supply – smaller and more frequent deliveries to minimize the need for stockholding and risk of stock obsolescence – has led to a large increase in part-load freight. The resulting emergence of pallet-load networks enables business to move single pallets nationwide at costs and efficiencies that compare well with moving full-loads.
Just in Time
6.14 Just-in-time is a concept that is often talked about in terms being critical to modern logistics and sometimes cited as an excuse for not considering alternative solutions. Just-in-time (at the point of delivery) is perhaps a better description and its implementation requires predictability and reliability to achieve consistent journey times to plan against. These are the characteristics that a mode such as rail, which operates on a highly planned and timetabled basis has.
6.15 In reality, orders to suppliers often allow several days before delivery, and further up the supply chain, shipments from manufacturers can work on lead-time of weeks and months. When a shipment is at sea for several weeks and can be sat in the port environment for days waiting to be called off, it could be considered that a lack of forward planning in trying to get a shipment closer to its eventual destination is a greater reason for needing a just-in-time response on a primary distribution leg than actual customer demand.
6.16 It is found that each of these freight operations place a differing impact on the transport network and are influenced by a different range of factors. ‘Flow owners’ - those who make the management decisions on how freight moves – tend to be on the supplier side of any origin – destination flow. Transport structures have generally emerged from market driven demands where the seller of goods looks around for the best option that suits their business purpose. Alternatively they go along with proposals presented by an aggressive and competitive transport industry to carry their goods at a set price and agreed transit time.
6.17 Shippers are driven by cheapest cost and a predictable delivery window and transport companies by the need to fully utilize their equipment with a satisfactory margin. From a transport planning perspective, you have a range of formal and informal structures that have emerged over time. These solutions have been tested by time and continue to operate, therefore, they can be termed sustainable.
6.18 Where shippers have smaller volumes to move, the transport industry has responded by developing its own consolidation arrangements to find efficiencies, such as pallet and parcel networks.
6.19 In modern supply chains, the flow of information is critical to managing delivery performance. Outsourced distribution contracts are also increasingly short-term and measured against performance related KPIs. Flow owners can easily switch from one transport provider to another, given the availability of a highly competitive supplier base. The ultimate goal is to satisfy the needs of shippers and receivers from an economic and
63
service perspective. Transport firms may deploy different solutions using alternative networks, equipment and modes but the goal is the same – on time & cheapest cost.
6.20 Freight distribution centres appear in a variety of forms, some which adopt an intermodal approach, and others which seek to consolidate the various stages of the supply chain. These include road and rail based distribution centres, airports and ports.
Distribution Centre
6.21 A Distribution Centre is a warehouse or other specialised building which is stocked with products (goods) to be re-distributed to retailers, wholesalers or directly to consumers. Distribution centres are the foundation of a supply network as they allow a single location to stock a vast number of products.
Consolidation Centre
6.22 A Consolidation Centre is a freight holding area which is operated by a management structure independent from those using its services. Users of the consolidation centre, such as retailers and contractors, place orders for their goods and materials with their suppliers, but instruct that the delivery is made to the Consolidation Centre. Orders are subsequently assembled at the consolidation centre, consolidated into a single load where appropriate, and decanted onto a smaller vehicle, usually belonging to the consolidation centre, which is used to deliver the load to the site.
6.23 Consolidation Centres are less concerned with the modal shift from road to rail or water, and instead aim to reduce the number of road miles by ‘consolidating’ the various phases of the supply chain in one location. The main purpose of a consolidation centre is to avoid transfer of goods between various stages of the supply chain process and instead promote the efficient flow of goods from a logistical hub direct to the shop, supermarket or construction site for example.
6.24 The consolidation centre concept is one that aims to reduce the social and transport network impact of freight movements by aggregating all the final deliveries for a given area onto a common vehicle (or vehicles), that serve all the locations in that area, as shown below.
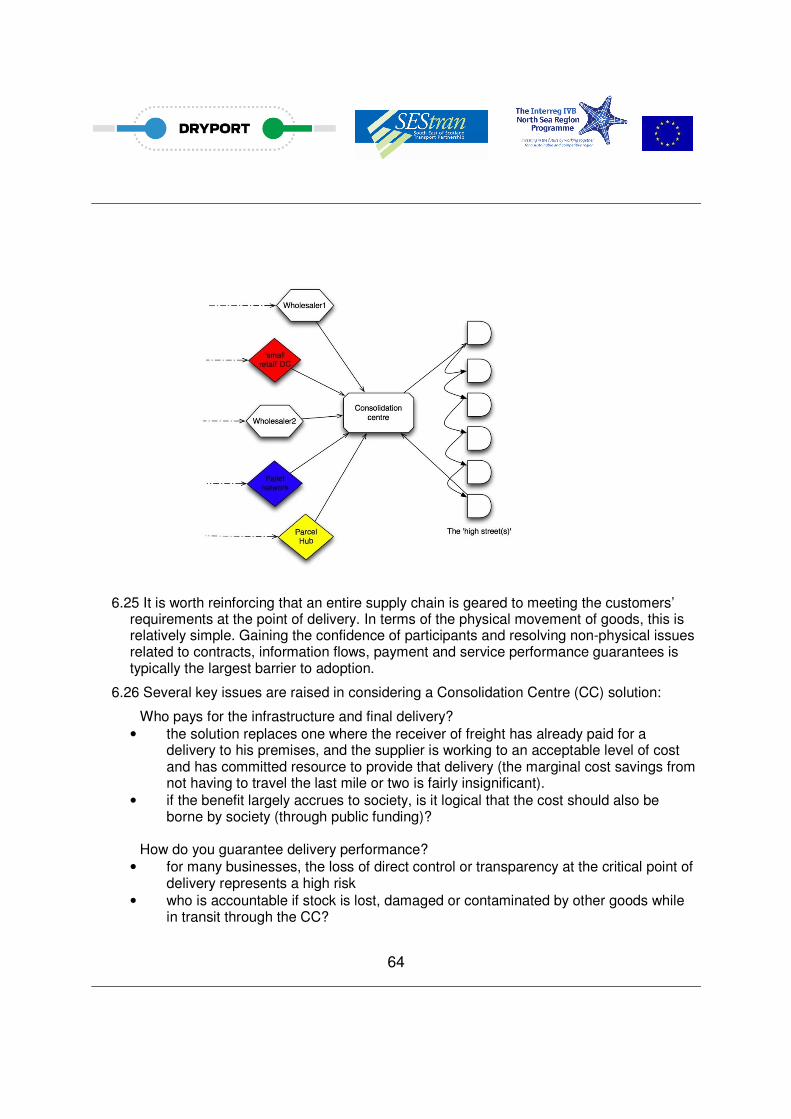
64
6.25 It is worth reinforcing that an entire supply chain is geared to meeting the customers’ requirements at the point of delivery. In terms of the physical movement of goods, this is relatively simple. Gaining the confidence of participants and resolving non-physical issues related to contracts, information flows, payment and service performance guarantees is typically the largest barrier to adoption.
6.26 Several key issues are raised in considering a Consolidation Centre (CC) solution:
Who pays for the infrastructure and final delivery?
• the solution replaces one where the receiver of freight has already paid for a delivery to his premises, and the supplier is working to an acceptable level of cost and has committed resource to provide that delivery (the marginal cost savings from not having to travel the last mile or two is fairly insignificant).
• if the benefit largely accrues to society, is it logical that the cost should also be borne by society (through public funding)?
How do you guarantee delivery performance?
• for many businesses, the loss of direct control or transparency at the critical point of delivery represents a high risk
• who is accountable if stock is lost, damaged or contaminated by other goods while in transit through the CC?
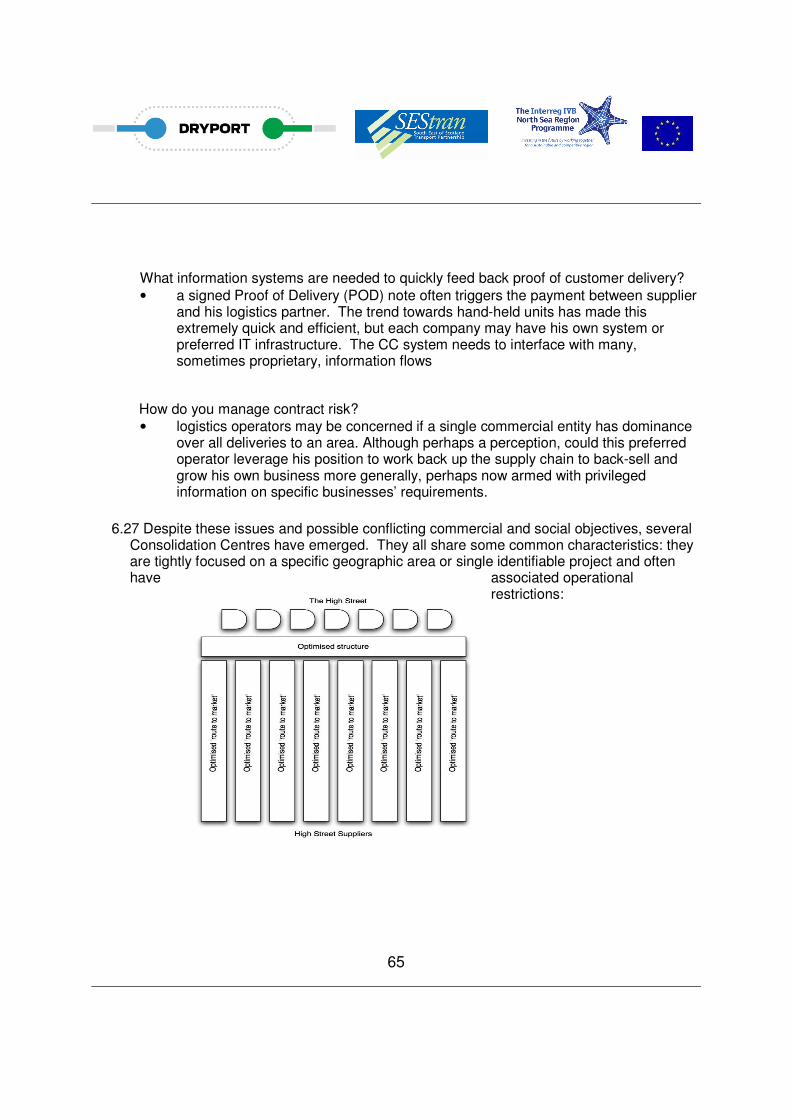
65
What information systems are needed to quickly feed back proof of customer delivery?
• a signed Proof of Delivery (POD) note often triggers the payment between supplier and his logistics partner. The trend towards hand-held units has made this extremely quick and efficient, but each company may have his own system or preferred IT infrastructure. The CC system needs to interface with many, sometimes proprietary, information flows
How do you manage contract risk?
• logistics operators may be concerned if a single commercial entity has dominance over all deliveries to an area. Although perhaps a perception, could this preferred operator leverage his position to work back up the supply chain to back-sell and grow his own business more generally, perhaps now armed with privileged information on specific businesses’ requirements.
6.27 Despite these issues and possible conflicting commercial and social objectives, several Consolidation Centres have emerged. They all share some common characteristics: they are tightly focused on a specific geographic area or single identifiable project and often have associated operational
restrictions:
66
6.28 Examples of existing Centres
The Heathrow Consolidation Centre
• all businesses have to comply with security requirements for air-side deliveries.
The London Construction Consolidation Centre
• construction often occurs in tight urban areas with difficult access for large vehicles and have noise related restrictions on the hours available to work.
• The Broadmead Project in Bristol
• access restrictions for freight were steadily increased and retail developers encouraged to design the environment to make access challenging, while simultaneously allowing concession for vehicles coming from the CC.
6.29 Identification of opportunities for Consolidation Centre solutions within the SEStran area should therefore consider the likely logistics structures in play in a given area, the operational restrictions already existing, or that can be implemented in parallel with providing a commercially attractive alternative and identifying what commercial (cost or service) advantages could be extracted for both receiver and sender of freight from using a CC.
6.30The SEStran Regional transport Strategy outlines the following locations which support
sustainable development:
• Grangemouth Docks – Scotland’s largest container port
• Rosyth Docks – Scotland’s gateway to Europe with intermodal handling facilities, a deep water port and regular ferry service to mainland Europe
• Rail intermodal facilities – improved capacity and connection to rail freight intermodal depots situated between Grangemouth and Falkirk
• Edinburgh Airport – the expansion of the airport with improved links to both road and rail networks which will allow expansion of air freight capability
• Forth crossing – strategic important commercial link from Edinburgh and the Lothians to Fife and North of the Forth Road and Rail bridge, plus from Falkirk to Fife/Clackmannanshire using the Kincardine crossing
• The M8 corridor is popular for distribution centres as sites near the motorway offer good
accessibility to companies as well as the ability for a 24/7 operation. Many of the large
supermarkets have regional distribution centres in the area:
Asda – Grangemouth
67
Somerfield – Pitrievie, Dunfermline Tesco – Livingston Booker – Livingston Farmfoods – Livingston Others such as Lidl, Spar, Mace, Co-op are located in the M8 corridor
Modelling the Potential Locations
6.31 For the purposes of this Study, the SEStran area and the rest of the UK is sub-divided
into 71 Zones. This zoning system has allowed us to look in sufficient detail to provide an
indication, appropriate to this stage of analysis, of the areas where Sustainable
Distribution Centres could be sited.
6.32 In terms of the commodity classifications we are of the view that we should concentrate
at this stage on three broad categories of freight goods:
Retail – Food Retail – Non-Food Construction materials
6.33 It is these categories that would provide the most fertile areas for the development of
distribution centres. We anticipate that subsequent development will look in more detail at
the precise composition of the goods transported and the requirements and specifications
for any centre that may be developed. While there are many other goods in the freight
classification system these, in the main, do not lend themselves to the concept of the
advantages that could accrue from the use of a distribution centre.
Output of Modelled Locations
6.34 In terms of our methodology of using the Freight Transport Model for the SEStran area
this has allowed us to narrow in on potential zones where, by having a distribution centre
located somewhere in that zone, it is more efficient in terms of tonne-kilometres. We have
reasoned that through our analysis methodology this benefit can be converted to CO2
reductions because of the use of sustainable modes of transport i.e. electric powered
vehicles of the type investigated in this report.
6.35 From an overview of the total matrix of freight flows (which provides flows between each
zone and all the others) it is readily apparent that some zone pairs have significantly more
flows than others. The flows provide a picture of origin and destination zones and thus by

68
analysing these pairings we were able to rationalise the search to a manageable number
of zones i.e. it was not necessary to use our analysis on all zone pairs.
6.36 In consideration of our overview we have therefore focused on the zones.
Zones used for analysis
Primary Locations Alternative Locations
Zone Description Zone Description
6 Granton 5 Leith
9 Newbridge 7 Airport 8 Ratho 13 Houstoun Ind Est
16 Whitehill Ind Est 17 Bathgate 18 Armadale 19 Whitburn 23 Dalkeith 3 Cameron Toll 24 Tranent
40 Grangemouth 41 Bankside Ind Est 43 Alloa 46 Cowdenbeath 45 Dunfermline 49 Rosyth
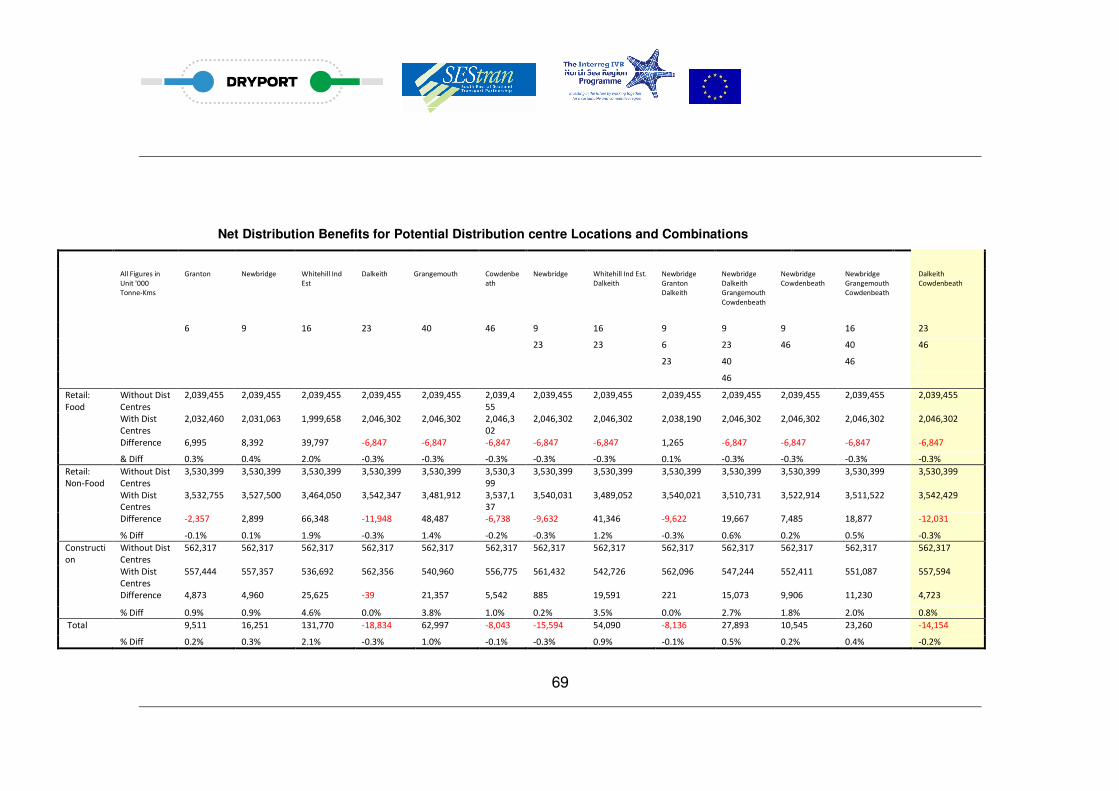
69
Net Distribution Benefits for Potential Distribution centre Locations and Combinations
All Figures in
Unit '000
Tonne-Kms
Granton Newbridge Whitehill Ind
Est
Dalkeith Grangemouth Cowdenbe
ath
Newbridge Whitehill Ind Est.
Dalkeith
Newbridge
Granton
Dalkeith
Newbridge
Dalkeith
Grangemouth
Cowdenbeath
Newbridge
Cowdenbeath
Newbridge
Grangemouth
Cowdenbeath
Dalkeith
Cowdenbeath
6 9 16 23 40 46 9 16 9 9 9 16 23
23 23 6 23 46 40 46
23 40 46
46
Retail:
Food
Without Dist
Centres
2,039,455 2,039,455 2,039,455 2,039,455 2,039,455 2,039,4
55
2,039,455 2,039,455 2,039,455 2,039,455 2,039,455 2,039,455 2,039,455
With Dist
Centres
2,032,460 2,031,063 1,999,658 2,046,302 2,046,302 2,046,3
02
2,046,302 2,046,302 2,038,190 2,046,302 2,046,302 2,046,302 2,046,302
Difference 6,995 8,392 39,797 -6,847 -6,847 -6,847 -6,847 -6,847 1,265 -6,847 -6,847 -6,847 -6,847
& Diff 0.3% 0.4% 2.0% -0.3% -0.3% -0.3% -0.3% -0.3% 0.1% -0.3% -0.3% -0.3% -0.3%
Retail:
Non-Food
Without Dist
Centres
3,530,399 3,530,399 3,530,399 3,530,399 3,530,399 3,530,3
99
3,530,399 3,530,399 3,530,399 3,530,399 3,530,399 3,530,399 3,530,399
With Dist
Centres
3,532,755 3,527,500 3,464,050 3,542,347 3,481,912 3,537,1
37
3,540,031 3,489,052 3,540,021 3,510,731 3,522,914 3,511,522 3,542,429
Difference -2,357 2,899 66,348 -11,948 48,487 -6,738 -9,632 41,346 -9,622 19,667 7,485 18,877 -12,031
% Diff -0.1% 0.1% 1.9% -0.3% 1.4% -0.2% -0.3% 1.2% -0.3% 0.6% 0.2% 0.5% -0.3%
Constructi
on
Without Dist
Centres
562,317 562,317 562,317 562,317 562,317 562,317 562,317 562,317 562,317 562,317 562,317 562,317 562,317
With Dist
Centres
557,444 557,357 536,692 562,356 540,960 556,775 561,432 542,726 562,096 547,244 552,411 551,087 557,594
Difference 4,873 4,960 25,625 -39 21,357 5,542 885 19,591 221 15,073 9,906 11,230 4,723
% Diff 0.9% 0.9% 4.6% 0.0% 3.8% 1.0% 0.2% 3.5% 0.0% 2.7% 1.8% 2.0% 0.8%
Total 9,511 16,251 131,770 -18,834 62,997 -8,043 -15,594 54,090 -8,136 27,893 10,545 23,260 -14,154
% Diff 0.2% 0.3% 2.1% -0.3% 1.0% -0.1% -0.3% 0.9% -0.1% 0.5% 0.2% 0.4% -0.2%
70
6.37 The key output from this stage of the study is to identify those zones or combination of
zones that offer benefits in terms of a reduction in tonne kilometres of freight moved for
each commodity group.
6.38 From our analysis we can see that there are relatively few locations that provide a net
benefit in terms of the unit cost of freight goods (food and construction) movement (in unit
thousand tonne kilometres) by sustainable methods. The analysis uses unit costs and
thus we can convert such unit costs into any conventional measurements e.g. CO2 . What
is important here is that our analysis establishes those zones that offer a net benefit in
terms of net sustainable transport.
6.39 The model assumes that if the cost of transporting freight goods by sustainable means
is half that of conventional means and although the introduction of a distribution centre(s)
would increase the total movement of freight the cost, in terms of sustainable transport
e.g. the use of electric vehicles, a net benefit may accrue if the distribution centre is
appropriately located.
6.40 We can summarise our findings thus:
o Beneficial zone locations
Food, Retail
• a) Whitehill Industrial Estate
• Reduction of 39,797 unit thousand tonne kilometres
• 2% reduction
Food, Non-retail
• a) Whitehill Industrial Estate
• Reduction of 66,648 unit thousand tonne kilometres
• 1.9% reduction
• b) Whitehill Industrial Estate & Dalkeith
• Reduction of 41,346 unit thousand tonne kilometres
• 1.2% reduction
• c) Grangemouth
• Reduction of 48,487 thousand tonne kilometres
• 1.4% reduction
71
Construction
• a) Whitehill Industrial Estate
• Reduction of 25,625 unit thousand tonne kilometres
• 4.6% reduction
• b) Whitehill Industrial Estate & Dalkeith
• Reduction of 19,591 unit thousand tonne kilometres
• 3.5% reduction
•
Total Freight (Food and Construction)
• a) Whitehill Industrial Estate
• Reduction of 131,770 unit thousand tonne kilometres
• 2.1% reduction
• b) Whitehill Industrial Estate & Dalkeith
• Reduction of 62,997 unit thousand tonne kilometres
• 1.0% reduction
• c) Grangemouth
• Reduction of 54,090 unit thousand tonne kilometres
• 0.9% reduction
6.41 The conclusions drawn from this analysis are that:
• A distribution centre located around the Whitehill/ Bathgate/ Armadale/ Whitburn
area i.e. west of Livingston would appear to be the best location to offer net
benefits from a sustainable approach. It is interesting to note that from our analysis
locating distribution centres closer to Edinburgh along the M8 corridor does not
appear to offer added benefits. On their own or in combination they perform less
well than the west of Livingston location.
• The Whitehill Industrial Estate location performs well across all three of our freight
classifications i.e. Retail Food and Non-Food as well as Construction goods, and it
is the only site to perform strongly in the Retail Food sector.
• The next best option would appear to be a centre located at Grangemouth for the
non-Food and Construction sectors. However we note that in overall terms this
performs less well that the Whitehill Industrial Estate location on its own.
72
6.42 A number of different combinations were tested i.e. multi centre distribution centres and
most did not perform well. However a combination of Whitehill and Dalkeith would appear
to perform positively although we note that it does not perform as well as either of the
single site options.
Conclusion
6.43 The delivery of goods to the retailer/end user can be complex depending on the product
being transported, the size of load, whether the goods are perishable or not and the
requirement for just-in-time delivery along with other detailed customer requirements.
6.44 The study revealed that the synergies with Dryport operations were minimal and good
location was of paramount importance. Whitehill near Bathgate is identified as a prime
location for a distribution centre, with a potential site near Bathgate with existing rail
sidings providing a possible site and good links onto the M8. Looking at the various
potential sites, a site in the vicinity of Whitehill was most beneficial in relation to all three
categories of the type of goods likely to be transported, food, non food and construction.
This is reinforced by the presence of major supermarket distribution centres in the area
e.g. Tesco, Booker, Farmfoods, Lidl, Spar, Mace and the Co-op.
6.45 Although some benefits were identified of combining a distribution centre with a Dryport
at Grangemouth, they were considerably less than the level of benefits of a more
centralised distribution facility near Bathgate. This conclusion replicates the conclusions
found on the siting and synergies of a consolidation centre, where Livingston (close to
Bathgate) was identified as a prime location.
Dryport at Coatbridge and Distribution at Bathgate
6.46 From the above analysis there appears to be a case for a Dryport at Coatbridge, taking
advantage of its centralized location and excellent road and rail links, and a
Consolidation/Distribution Centre in the Bathgate area, to serve the SEStran area.
6.47 There are obvious disadvantages in having the two separate sites in that there is a cost
for moving freight between the two sites and the limited opportunities to share facilitities.
So an additional analysis was undertaken to test whether the locational benefits of the
separate facilities were greater than any of the potential disbenefits and also a combined
site at Grangemouth. The disbenefits are minimized by the ability to have a direct rail link
between the two sites using the recently built Airdrie – Bathgate line.
73
6.48 In order to assess this on a comparable basis, the three locations were assessed as a
Dryport taking into consideration the potential cost of development of a Dryport at
Coatbridge, Grangemouth and Bathgate taking into account the relevant available
infrastructure at those locations.
Overview of Economic Appraisal
6.49 This appraisal has used the methodology developed in the SEStran Freight Routing Study previously referred to. The network-wide estimated impacts of introducing a Dryport at each of the three location options were based on the previously assumed Dryport scenario:
• multi-modal facilities for road and rail freight;
• connection to sea port via a segregated rail link with fixed timetable;
• market is international/long-distance freight including deep sea containers;
• and the storage capacity of the facility is assumed to be 120,000 m2.
6.50 This analysis followed the same restricted cost/benefit analysis (RCBA) as applied during the Consolidation Centre Study. The RCBA included a quantification of the standard network-based headline indicators of vehicle-kms and vehicle-hrs saved per annum. This allows for the estimation of suitable freight benefits in terms of vehicle operating costs (VOC) gains, time reductions, sensitive lorry miles (SLM) savings, other carbon benefits and revenues.
6.51 The network-wide benefits were estimated using the identified changes in veh-kms travelled by HGVs and veh-hrs saved by HGVs across the road network. The monetised values of these benefits were estimated, allowing for an indication of the potential monetary worth of some of the transport society benefits (only those included in this high-level RCBA). VOC was estimated using the calculated annual veh-kms saved from the road network. Using values from WebTAG2 and average default data, a monetised value of £0.08 per HGV-km was used to derive VOC benefits. Time benefits were estimated using an average value-of-time of £12.08 per HGV-hour, also sourced from WebTAG, and applied to the estimates of the veh-hrs saved. SLM and carbon benefits were estimated from the SLM Values Table3 as approximately £0.81 per HGV-km and £0.04 per HGV-km, respectively. The monetised transport benefits are shown at 2002 prices as per WebTAG.
6.52 While there would be other benefits and costs than those mentioned above, these would be captured within a full Transport Economic Efficiency (TEE) analysis which is not considered suitable for this high level analysis. Nonetheless, the above transport benefits
2 Web-based Transport Appraisal Guidance, Department for Transport
3 Incremental Economic Model, Appendix C, Freight Consolidation Centre Study, URS (formerly Scott Wilson) for South East of
Scotland Transport Partnership, April 2010
74
and costs are useful in helping to gauge the potential economic impacts of the various options.
6.53 The parameters outlined above were incorporated into a spreadsheet-based RCBA which used the following economic assumptions:
• a 60-year appraisal period, with a discount base year of 2002;
• an annual discount rate of 3.5% over the first 30 years falling to 3% for the remainder;
• an assumed opening year of 2014; and
• construction costs are spread over 2 years, 2012 (60%) and 2013 (40%).
6.54To maintain consistency with the previous economic appraisals of the Dryport and Consolidation Centres, a forecast planning horizon of 2020 has been assumed. This is necessary to add the previous economic results with this new appraisal, otherwise it would not be comparing like-for-like. However, the previous economic appraisals anticipated the uncertainty surrounding forecasting background economic growth which would affect the performance of the proposals by estimating both low and high growth economic scenarios in the appraisal. Hence, this new appraisal has also forecast benefits at 2020 for both low and high growth economic scenarios, where the low growth scenario accounts for the current protracted recession period This allows the addition of all the benefits together in a common manner, and for comparisons with previous findings.
6.55 Given the recent and current sluggish performance of economy, the use of both low and high growth scenarios allows for any lag-effects due to the economic downturn. Even if the economic recovery is not likely to materialise for some time, it is considered reasonable to assume that the economic performance results estimated in this study will occur at a future date (i.e. the results should be similar but the timing of when they occur may be after 2020).
6.56 The appraisal gives the results for both an exclusive Dryport facility and a Dryport facility at one location and a Consolidation Centre at another. Clearly if the full benefits of both a freestanding Consolidation Centre and Dryport facility were accredited to the combined scenario, there would be an element of double counting of some of the identified benefits. In order to neutralise this potential double counting, an assessment was made of those benefits which are common to both facilities. As the Dryport demonstrated a complete set of these benefits, and where these were also achieved by the Consolidation Centre, they were deducted from the Dryport benefits. In effect, this was equivalent of adjusting the Dryport benefits, other than revenues, to a level of circa 80% of the total estimates to remove those benefits already captured in the Consolidation Centre results.
75
Capital and Operating Costs
Dryport Only
6.57 While capital and operating costs were estimated during the Consolidation Centre Study, they do not exist as part of a Dryport business case analysis. Hence, in order to allow for a like-for-like appraisal, URS have assumed a high-level estimate of the potential costs of a new Dryport based on case studies elsewhere. This assumed an average implementation rate applied to the area for all construction and associated machinery, access links, etc. It also assumed a standard 10% factor for annual operations, maintenance and renewal costs. Because these assumptions are high-level they are only intended to provide order-of-magnitude values for the RCBA, and if the project was to progress further then clearly more detailed cost analysis would need to be undertaken.
6.58 The characteristics of the three potential Dryport sites also had to be taken into account. In particular, some site options already had a significant amount of transport facilities (e.g. good road/heavy rail links, etc) which are needed for Dryport operations while others had little facilities and therefore needed more investment. This represents in effect, a “sunk” cost which mitigates the capital costs that would otherwise have been associated with a completely greenfield site. Based on discussions with SEStran the assumed proportions of additional infrastructure required associated with each of these sites under consideration are as follows:
• Coatbridge – 45%;
• Grangemouth – 65%; and
• Bathgate – 55%.
6.59 It has been assumed that Grangemouth requires the most new investment due to the known capacity constraints and the built-up nature of the area around the existing port operations. Bathgate was assumed to require less investment due to the recently opened Airdrie-Bathgate Railway Line. Finally, Coatbridge needed the least investment since it already had significant facilities due to the Freightliner operations based there.
Consolidation Centres
6.60 The capital and operating costs of the respective Consolidation Centres used in this analysis are those already presented in the Consolidation Centre Study Report. It should be noted that the emphasis on this appraisal is not to provide an exact, detailed, estimate but to allow for a comparison of the differences between the different options / locations. This helps to understand which options are likely to perform better than others and hence are potentially worthy of taking forward for further, more detailed, study.
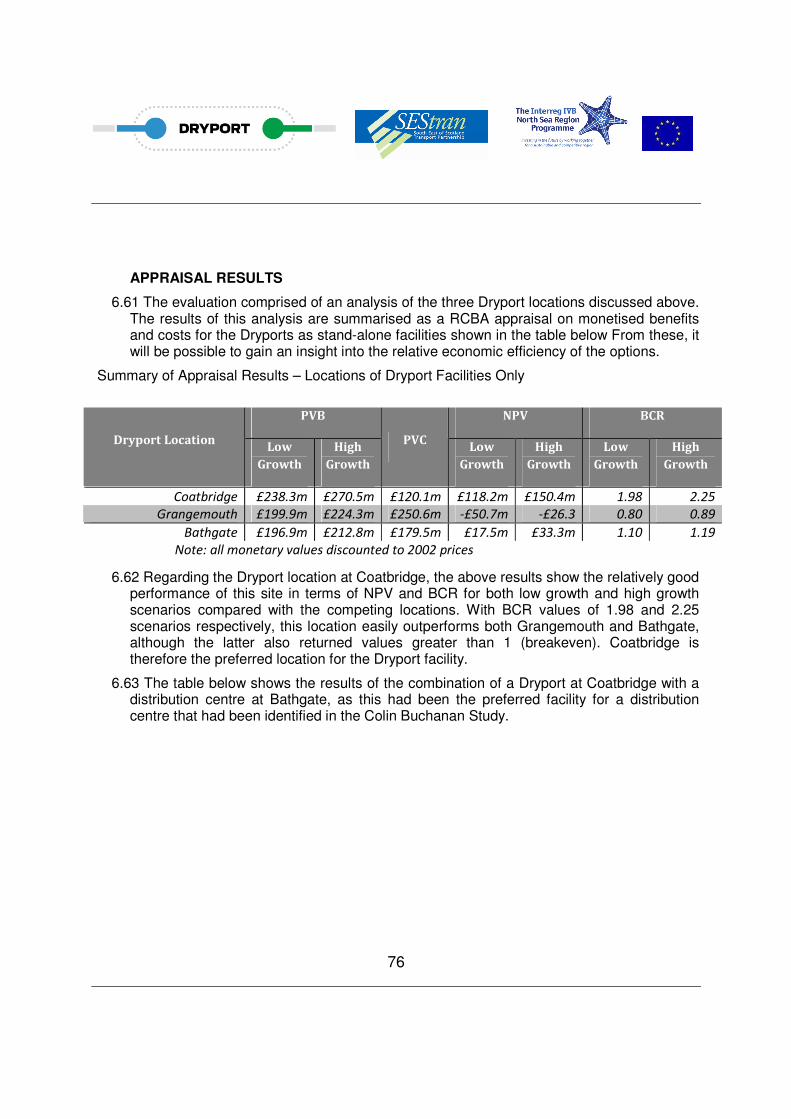
76
APPRAISAL RESULTS
6.61 The evaluation comprised of an analysis of the three Dryport locations discussed above. The results of this analysis are summarised as a RCBA appraisal on monetised benefits and costs for the Dryports as stand-alone facilities shown in the table below From these, it will be possible to gain an insight into the relative economic efficiency of the options.
Summary of Appraisal Results – Locations of Dryport Facilities Only
PVB NPV BCR
Dryport Location Low
Growth
High
Growth
PVC Low
Growth
High
Growth
Low
Growth
High
Growth
Coatbridge £238.3m £270.5m £120.1m £118.2m £150.4m 1.98 2.25
Grangemouth £199.9m £224.3m £250.6m -£50.7m -£26.3 0.80 0.89
Bathgate £196.9m £212.8m £179.5m £17.5m £33.3m 1.10 1.19
Note: all monetary values discounted to 2002 prices
6.62 Regarding the Dryport location at Coatbridge, the above results show the relatively good performance of this site in terms of NPV and BCR for both low growth and high growth scenarios compared with the competing locations. With BCR values of 1.98 and 2.25 scenarios respectively, this location easily outperforms both Grangemouth and Bathgate, although the latter also returned values greater than 1 (breakeven). Coatbridge is therefore the preferred location for the Dryport facility.
6.63 The table below shows the results of the combination of a Dryport at Coatbridge with a distribution centre at Bathgate, as this had been the preferred facility for a distribution centre that had been identified in the Colin Buchanan Study.
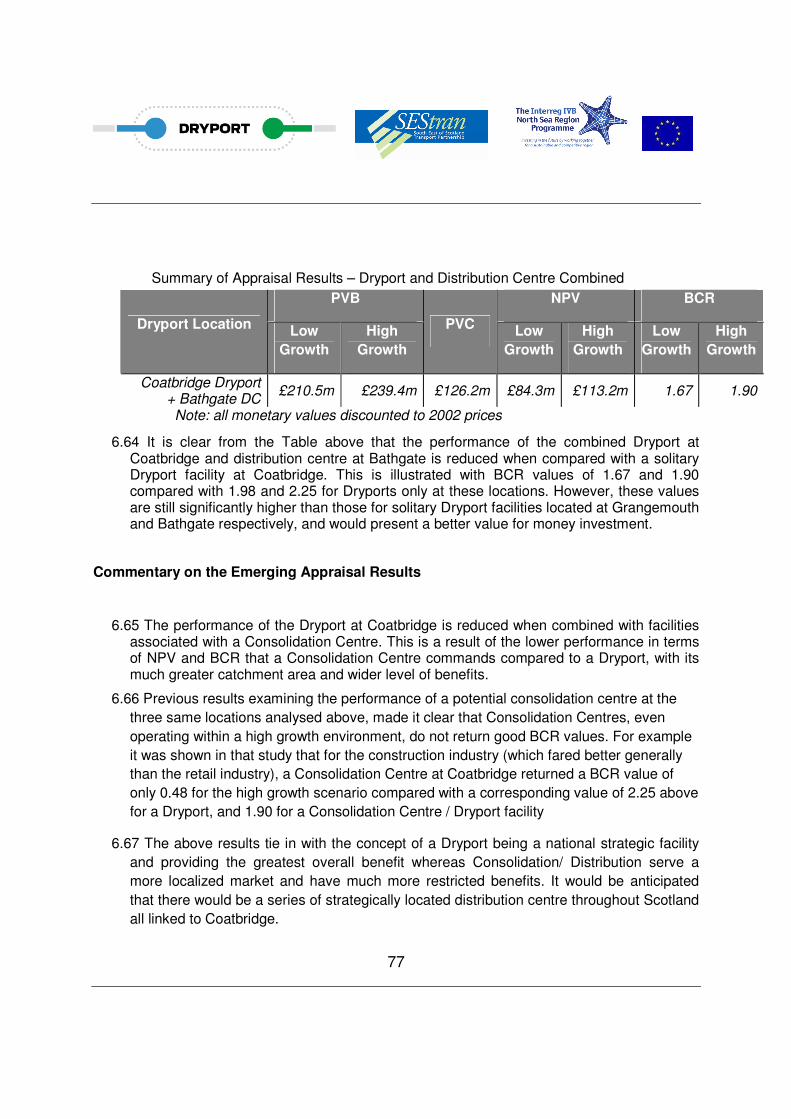
77
Summary of Appraisal Results – Dryport and Distribution Centre Combined
PVB NPV BCR
Dryport Location Low
Growth
High
Growth
PVC Low
Growth
High
Growth
Low
Growth
High
Growth
Coatbridge Dryport + Bathgate DC
£210.5m £239.4m £126.2m £84.3m £113.2m 1.67 1.90
Note: all monetary values discounted to 2002 prices
6.64 It is clear from the Table above that the performance of the combined Dryport at Coatbridge and distribution centre at Bathgate is reduced when compared with a solitary Dryport facility at Coatbridge. This is illustrated with BCR values of 1.67 and 1.90 compared with 1.98 and 2.25 for Dryports only at these locations. However, these values are still significantly higher than those for solitary Dryport facilities located at Grangemouth and Bathgate respectively, and would present a better value for money investment.
Commentary on the Emerging Appraisal Results
6.65 The performance of the Dryport at Coatbridge is reduced when combined with facilities associated with a Consolidation Centre. This is a result of the lower performance in terms of NPV and BCR that a Consolidation Centre commands compared to a Dryport, with its much greater catchment area and wider level of benefits.
6.66 Previous results examining the performance of a potential consolidation centre at the
three same locations analysed above, made it clear that Consolidation Centres, even
operating within a high growth environment, do not return good BCR values. For example
it was shown in that study that for the construction industry (which fared better generally
than the retail industry), a Consolidation Centre at Coatbridge returned a BCR value of
only 0.48 for the high growth scenario compared with a corresponding value of 2.25 above
for a Dryport, and 1.90 for a Consolidation Centre / Dryport facility
6.67 The above results tie in with the concept of a Dryport being a national strategic facility
and providing the greatest overall benefit whereas Consolidation/ Distribution serve a
more localized market and have much more restricted benefits. It would be anticipated
that there would be a series of strategically located distribution centre throughout Scotland
all linked to Coatbridge.
78
7.0 Port Infrastructure Studies
7.1 The three studies looked at improving rail access to Methil and Rosyth and road access
to Grangemouth as a requirement for the expansion of the general movement freight by
sea to and from Scotland. There are obvious implications in terms of better access to the
proposed Dryport from these ports which can only improve the viability of these ports in
the future.
7.2 The three studies carried out STAG assessments of the proposals and all indicated
positive benefits in investing in the infrastructure even without the additional benefits of
linking to a Dryport. It is therefore proposed to promote these projects in any further
spending on improving freight infrastructure.
Improved Road access to Grangemouth
7.3 Over the last 40yrs the A801 has been incrementally improved. This is the main road link
from Grangemouth to the M8 and major locations in central Scotland. The remaining link
which requires improvement is at the Avon Gorge. Currently the road descends into the
gorge on steep gradients and crosses the river on a narrow stone built bridge involving the
negotiation of several tight bends. There have been several bad accidents with heavy
goods vehicles losing control in the gorge.
7.4 Grangemouth was identified in Scotland’s National Planning Framework 2 as a nationally
important freight hub
“The Grangemouth area contains Scotland’s largest container port, with important European, Baltic and global connections. Approximately 9 million tons of cargo is handled through its docks each year and there is scope for further expansion.”
The document also identifies the need for improvements to the transport infrastructure in the area ”Improvements to strategic road and rail infrastructure will allow the area to function to its full potential as an intermodal freight hub”.
7.5 The proposal is to bridge the gorge with a high level bridge to complete the route
improvement. This will potentially cost £18m and required a fully costed STAG4
4 Scottish transport appraisals Guidance
79
assessment in order that the proposal could be submitted to Transport Scotland for
funding.
7.6 The importance of this link to the future development of Grangemouth was recognized
within the remit of this study and therefore the STAG assessment was completed and
submitted to Transport Scotland for funding consideration, as part of this study.
Clackmannanshire – Fife – Edinburgh STAG study.
7.7 This Study looked at the various options to improve freight and introduce passenger
services on this line and the potential viability of improving services on this line.
7.8 Rosyth area was identified in Scotland’s National Planning Framework 2 as a nationally
potentially important freight hub for container movement in the East of Scotland.
7.9 One of the key elements of this study was looking at the benefits of providing a rail chord
at Charlestown which would provide a direct rail link from Rosyth onto the Alloa line. This
would allow rail freight from the port of Rosyth direct access to central Scotland via the
Alloa line, without being hampered by the restrictions on the Forth Rail Bridge and the
need to reverse onto the Alloa line.
7.10 Four options were examined looking at various ways of improving connectivity along this
corridor. The most favorable option was improvement of the rail infrastructure and
services.
7.11 The cost to upgrade the line for both freight and passenger services would be in the
order of £94m and produce a benefit to cost ratio of 1.48, including wider economic
benefits. A major element of these benefits was obtained from improved freight access to
the area, including Rosyth.
7.12 The results of this study have been forwarded to Transport Scotland for inclusion in their
future plans and are supported by Fife and Clackmannanshire Councils.
Levenmouth Sustainable Transport Study
7.13 Methyl was formerly an important port for the shipping of coal from Scotland, but as the
coal industry has declined, so has the use of this port. There has been considerable
economic development in the area but it relies heavily on road transport. The disused rail
80
line has the potential to provide improved linkages of the area to the rest of Scotland and
link to the port facilities.
7.14 The study looks at six options to improve transport links to the area, and through the
STAG process identified the favoured option of re-opening the existing rail link to Leven
with a BCR of 1.5 and an NPV of £20.9m.
7.15 The results of this study have been forwarded to Transport Scotland for funding
consideration and approval.
8.0 Discussion of outcomes
There are some clear messages emanating from these studies:
1. Although in terms of on-site synergies, there appears to be some benefits in combining
Dryports with consolidation and distribution activities but in overall economic terms the
performance of the Dryport is not significantly improved.
2. The best locations for Dryports do not align with the best locations for consolidation and
distribution centres. Dryports tend to serve a national market whereas Consolidation/
Distribution centres serve a more local market.
3. The best combination in terms of site location would be a Dryport facility at Coatbridge
(or Eurocentral) with a Consolidation/Distribution centre near Bathgate, thus forming a
triangle within east-central Scotland of Grangemouth – Coatbridge – Bathgate.
4. In terms of a Dryport, Coatbridge/Eurocentral has been assessed and identified as the
prime location for the SEStran area because of its rail links to ports with the rest of
Scotland and the existing rail terminal facilities. A Dryport at this site also will serve the
whole of central Scotland and be able to service both east and west coast ports.
5. The best location for consolidation/distribution for the SEStran area appears to be
Livingston/Bathgate mainly due to its location in the centre of the SEStran area and
good road links to all major freight destinations. The presence of major supermarket
distribution centres in the area seems to reinforce this concept. Results indicate that
locating a Dryport at Livingston/Bathgate would not be as viable as Coatbridge and
Grangemouth, mainly due to its poorer direct rail linkages to the ports.
81
6. Grangemouth provides the best location for combined activities but overall benefits are
less when compared with the dedicated facilities as specified above. Any new facility
would probably have to be established on a Greenfield site along with providing new
infrastructure at a considerable cost. There are limited existing opportunities for
expansion within the existing port in the long term. Specific site issues have not been
fully examined at any of the locations.
7. The cost of providing new infrastructure for a Dryport and associated transport links will
have a significant impact on the viability of providing the facility. Therefore sites at
Coatbridge/Eurocentral that already have potentially suitable facilities and well
established road and rail links make these sites ideal in this context, as well as have the
best benefit/costs ratio in terms of location.
8. The further analysis to look at the viability of a Dryport at Coatbridge and a separate
Consolidation/Distribution Centre at Bathgate indicates that this appears to be the most
viable combination of facilities.
9. Looking at the location of consolidation/distribution centres, the ideal site to serve the
SEStran area would be in the Livingston/Bathgate area. A site near Bathgate with
sidings off the new electrified Airdrie - Bathgate line has been identified, which links
directly to Coatbridge and Eurocentral. Adjacent road links onto the M8 provide the
required road links to make this site an ideal location for such a facility.
10. However, the viability of such a centre is much more reliant on customer requirements
and therefore has to prove its case locally in terms of reduced costs and improved
efficiency to the market it is serving. It is recognized that many of the large retailers,
especially supermarket chains, have their own distribution centres in this area and are
unlikely to make use of a new facility. The economics of such a centre are also more
marginal and therefore it has to be assumed that there would have to be some support
for such a centre especially during the start up period.
11. Having established the overall potential and benefits of a Dryport serving the South East
of Scotland and its potential location using mainly existing facilities, further more detailed
work is required on the business case and operation of an associated
consolidation/distribution centre based at Bathgate, looking in detail the rail and road
links to Coatbridge/Eurocentral, the ports and potential customers.
82
12. The infrastructure studies have indicated that there are viable improvements to the
access of ports in the SEStran area which will improve the viability of these ports to cater
for increased freight movements.
13. Also the analysis of the rail network concludes that the proposed rail infrastructure
proposed by Network Rail and Transport Scotland will greatly improve the capability of
rail network to cater for increased rail freight movements.
14. With a Distribution Centre at Bathgate there is the opportunity to improve the
sustainability of freight movement by the use of electric powered vehicles for delivery to
customers.
9.0 Summary
9.1 These key studies identified the viability of a Dryport in Scotland located centrally at a site
either at Coatbridge or Eurocentral. These sites have excellent rail links to the major
Scottish ports and the national rail links to the rest of the UK. The links the national
motorway network are also very good.
9.2 However when it comes to considering consolidation and distribution, the criteria change
with the emphasis more on the needs of and access to the final customer. More detailed
work is required to identify potential user needs and requirements to ensure a viable
facility is provided. However the study identifies a potential site near Bathgate as the site
most likely to be viable and centrally placed for distribution around the SEStran area.
9.3 These conclusions have to be viewed in the context of the overall trends in the movement
of freight, especially container freight, on a European and world wide basis to ensure
Scotland is part of the international movement of freight and not just a peripheral link to
England.
83
Acknowledgements
The above report was prepared using input and abstracts from the following reports prepared
for SEStran as part of this project;
1. Freight Routing Study - Scott Wilson
Completed June 2009
2. Levenmouth Sustainable Transport Study - Scott Wilson
Completed November 2008
3. A801 River Avon Gorge – Economic Assessment - MVA Consultancy
Completed December 2009
4. Clackmannanshire – Fife – Edinburgh STAG Study - Scott Wilson
Published February 2010
5. Rail Freight Development and Marketing Study - Scott Wilson
Completed April 2010
6. Freight Consolidation Centre Study - Scott Wilson
Completed April 2010
7. Sustainable Urban Distribution Study - Colin Buchanan and Partners
Completed July 2010
8. Dryport High Transport Economic Appraisal - URS Infrastructure & Environment UK Ltd
Completed February 2012