Embed Size (px)
Citation preview
KN
OW
LE
DG
E
Land
scap
es &
Indu
strie
s
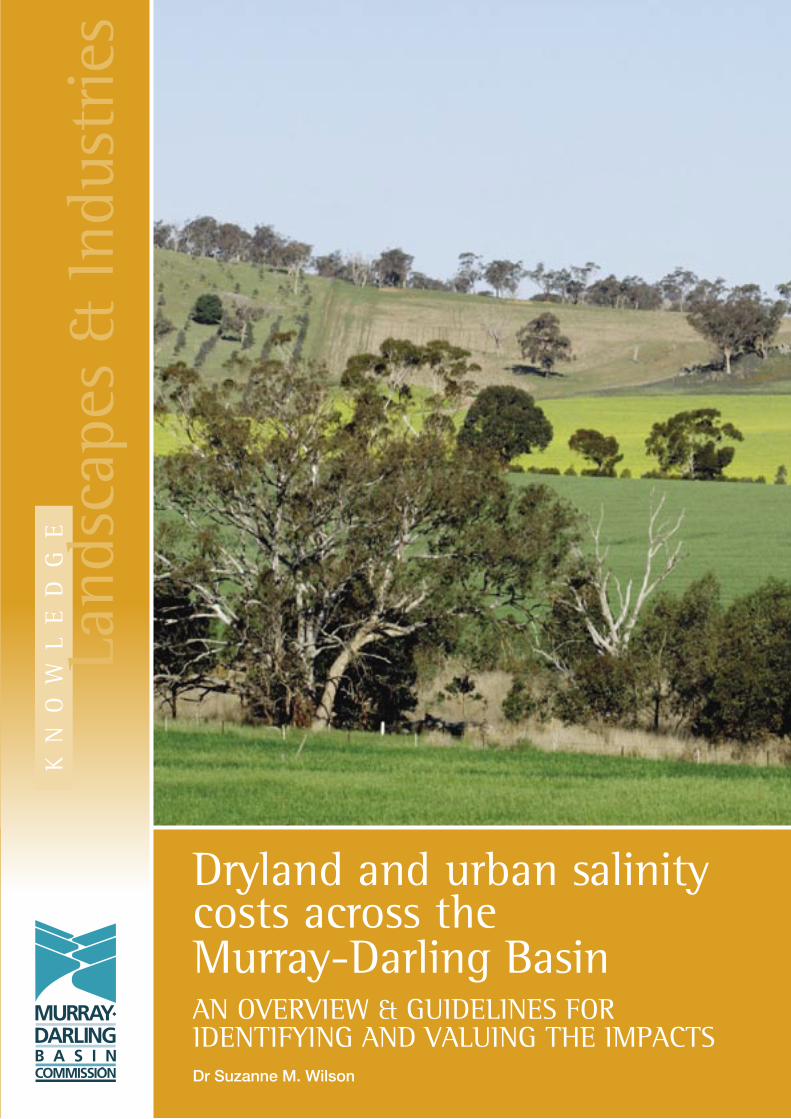
Dryland and urban salinity costs across the Murray-Darling Basin
Dr Suzanne M. Wilson
AN OVERVIEW & GUIDELINES FOR IDENTIFYING AND VALUING THE IMPACTS
Dry
land
and
urb
an s
alin
ity c
osts
acr
oss
the
Mur
ray-
Dar
ling
Basi
n
AN O
VERV
IEW
& G
UID
ELIN
ES F
OR
IDEN
TIFY
ING
AN
D V
ALU
ING
TH
E IM
PACT
S
Author: Dr. Suzanne M. Wilson
Published by: Murray-Darling Basin Commission
Postal Address: GPO Box 409, Canberra ACT 2601
Office location: Level 5, 15 Moore Street, Canberra City
Australian Capital Territory
Telephone: (02) 6279 0100
International + 61 2 6279 0100
Facsimile: (02) 6248 8053
International + 61 2 6248 8053
E-mail: [email protected]
Internet: http://www.mdbc.gov.au
For further information contact the Murray-Darling Basin Commission office on (02) 6279 0100.
This report may be cited as:
Wilson, S.M. 2004 Dryland and urban salinity costs across the Murray-Darling Basin. An overview & guidelines
for identifying and valuing the impacts, Murray-Darling Basin Commission, Canberra.
ISBN 1 876830 883
© Copyright Murray-Darling Basin Commission 2004
This work is copyright. Graphical and textual information in the work (with the exception of photographs and the
MDBC logo) may be stored, retrieved and reproduced in whole or in part, provided the information is not sold or used
for commercial benefit and its source Dryland and urban salinity costs across the Murray-Darling Basin. An overview
& guidelines for identifying and valuing the impacts, is acknowledged. Such reproduction includes fair dealing for the
purpose of private study, research, criticism or review as permitted under the Copyright Act 1968. Reproduction for other
purposes is prohibited without prior permission of the Murray-Darling Basin Commission or the individual photographers
and artists with whom copyright applies.
To the extent permitted by law, the copyright holders (including its employees and consultants) exclude all liability
to any person for any consequences, including but not limited to all losses, damages, costs, expenses and any other
compensation, arising directly or indirectly from using this report (in part or in whole) and any information or material
contained in it.
The contents of this publication do not purport to represent the position of the Murray-Darling Basin Commission.
They are presented to inform discussion for improvement of the Basin’s natural resources.
Cover photo: Arthur Mostead, Dryland Salinity reclamation, Galong NSW.
MDBC Publication 34/04
Integrated catchment management in the Murray-Darling BasinA process through which people can develop a vision, agree on shared values and behaviours, make informed decisions and act together to manage the natural resources of their catchment: their decisions on the use of land, water and other environmental resources are made by considering the effect of that use on all those resources and on all people within the catchment.
Our valuesWe agree to work together, and ensure that our behaviour reflects the following values.
Courage• We will take a visionary approach, provide
leadership and be prepared to make difficult decisions.
Inclusiveness• We will build relationships based on trust
and sharing, considering the needs of future generations, and working together in a true partnership.
• We will engage all partners, including Indigenous communities, and ensure that partners have the capacity to be fully engaged.
Commitment• We will act with passion and decisiveness, taking
the long-term view and aiming for stability in decision-making.
• We will take a Basin perspective and a non-partisan approach to Basin management.
Respect and honesty• We will respect different views, respect each
other and acknowledge the reality of each other’s situation.
• We will act with integrity, openness and honesty, be fair and credible, and share knowledge and information.
• We will use resources equitably and respect the environment.
Flexibility• We will accept reform where it is needed, be
willing to change, and continuously improve our actions through a learning approach.
Practicability• We will choose practicable, long-term
outcomes and select viable solutions to achieve these outcomes.
Mutual obligation• We will share responsibility and accountability, and
act responsibly with fairness and justice.
• We will support each other through the necessary change.
Our principlesWe agree, in a spirit of partnership, to use the following principles to guide our actions.
Integration• We will manage catchments holistically; that is,
decisions on the use of land, water and other environmental resources are made by considering the effect of that use on all those resources and on all people within the catchment.
Accountability• We will assign responsibilities and accountabilities.
• We will manage resources wisely, being accountable and reporting to our partners.
Transparency • We will clarify the outcomes sought.
• We will be open about how to achieve outcomes and what is expected from each partner.
Effectiveness• We will act to achieve agreed outcomes.
• We will learn from our successes and failures and continuously improve our actions.
Efficiency • We will maximise the benefits and minimise the
costs of actions.
Full accounting • We will take account of the full range of costs and
benefits, including economic, environmental, social and off-site costs and benefits.
Informed decision-making• We will make decisions at the most
appropriate scale.
• We will make decisions on the best available information, and continuously improve knowledge.
• We will support the involvement of Indigenous people in decision-making, understanding the value of this involvement and respecting the living knowledge of Indigenous people.
Learning approach• We will learn from our failures and successes.
• We will learn from each other.
iii
ForewordThroughout the 1980s, the prevailing view was that the main impacts of dryland salinity in the Basin were lost
agricultural production due to salinised land, and declining river health due to increased salt concentration in
river water.
Investigations in the early 1990s suggested that off-farm costs are larger than previously anticipated, and
include not only damage to rural and regional assets such as roads, railways, bridges and culverts, but also
damage to urban assets such as street paving and guttering, parks and gardens, and domestic and commercial
buildings. Environmental assets such as floodplain wetlands are also being damaged.
In 1998 the Murray-Darling Basin Commission initiated the Determining the full cost of dryland and urban
salinity across the Murray-Darling Basin project to develop and apply a method to estimate the full range
of dryland salinity impact costs across the Basin. In particular, the method needed to enable comparisons
of salinity impact costs on agriculture with off-farm costs on rural and regional infrastructure and urban
infrastructure. These guidelines introduce and describe the methods developed through this project.
The guidelines have been prepared as one document with two parts. Part 1 of the guidelines gives a
catchment scale overview of the costs related to the impacts of salinity in urban and dryland rural areas,
excluding costs to irrigators, the environment and cultural heritage. Part 2 of the guidelines provide the
detailed instructions and tools of this approach for specialist natural resource economists to assess the costs
related to the impacts of urban and dryland salinity. In combination, these guidelines should be a valuable
resource to assist in local and catchment planning processes.
I commend these guidelines and tools to any person considering investment in dryland salinity management.
Recent research, including the work initiated by the Murray-Darling Basin Commission, suggests that focus
should be on protecting future damage to higher value assets, and that close attention should be paid to
analysing costs and benefits before making such decisions.
Kevin Goss
Acting Chief Executive
iv v
How these guidelines are structuredThese guidelines have been prepared in two separate parts to meet the needs of different stakeholders involved in local action planning
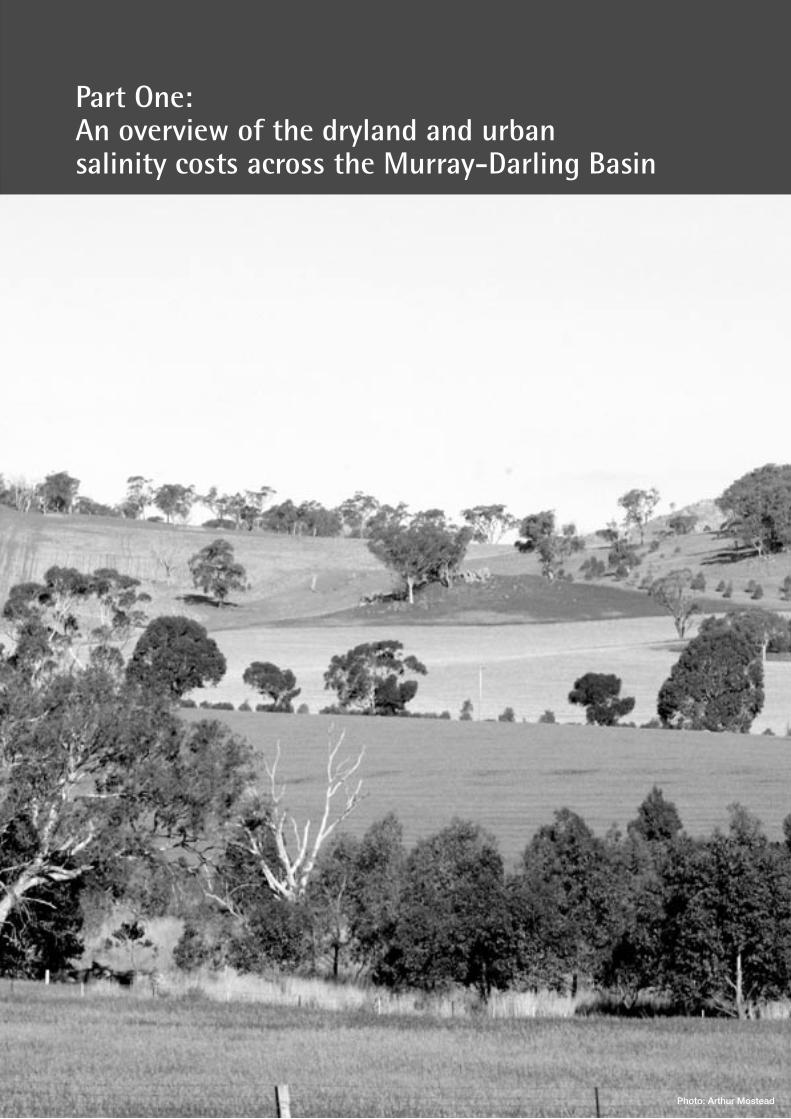
Part 1: An overview of the dryland and urban salinity costs across the Murray-Darling Basin.
This part introduces this project, presents an overview of the nature and costs of salinity in urban and
dryland rural areas, and demonstrates how this information fits into the bigger picture of preparing a
local action plan and cost-sharing arrangements. It is suggested that readers are conversant with the
material presented in Part 1 before working through Part 2.
Part 2: Guidelines for identifying and valuing the impacts.
This part provides the detailed instructions, tools and questionnaire forms a skilled natural resource
economist will need to assess the nature and impact costs of dryland and urban salinity to various
agricultural and non-agricultural stakeholders, the environment and cultural heritage in a particular
catchment or area.
iv v
ContentsForeword . . . . . . . . . . . . . . . . . . . . . . . . . . . . . . . . . . . . . . . . . . . . . . . . . . . . . . . . . . . . . . . . . . . . . . . . . . . . . . . . iii
How these guidelines are structured . . . . . . . . . . . . . . . . . . . . . . . . . . . . . . . . . . . . . . . . . . . . . . . . . . . . . . . . . . iv
Summary . . . . . . . . . . . . . . . . . . . . . . . . . . . . . . . . . . . . . . . . . . . . . . . . . . . . . . . . . . . . . . . . . . . . . . . . . . . . . . . . . 1
Part One: An overview of the dryland and urban salinity costs across the Murray-Darling Basin . . . 3
1 Introduction . . . . . . . . . . . . . . . . . . . . . . . . . . . . . . . . . . . . . . . . . . . . . . . . . . . . . . . . . . . . . . . . . . . . . . . . . . . . . 4
1.1 Why have these guidelines been produced? . . . . . . . . . . . . . . . . . . . . . . . . . . . . . . . . . . . . . . . . . . . 4
1.2 Who are these guidelines for?. . . . . . . . . . . . . . . . . . . . . . . . . . . . . . . . . . . . . . . . . . . . . . . . . . . . . . 5
1.3 What information is (and is not) provided? . . . . . . . . . . . . . . . . . . . . . . . . . . . . . . . . . . . . . . . . . . . . 5
1.4 How were these guidelines produced? . . . . . . . . . . . . . . . . . . . . . . . . . . . . . . . . . . . . . . . . . . . . . . . 6
2 What is dryland and urban salinity and how is it caused? . . . . . . . . . . . . . . . . . . . . . . . . . . . . . . . . . . . . . . . . . . 7
3 Where does dryland and urban salinity occur? . . . . . . . . . . . . . . . . . . . . . . . . . . . . . . . . . . . . . . . . . . . . . . . . . . 8
4 What are the impacts of dryland and urban salinity and who bears them?. . . . . . . . . . . . . . . . . . . . . . . . . . . . 11
4.1 Dryland agriculture . . . . . . . . . . . . . . . . . . . . . . . . . . . . . . . . . . . . . . . . . . . . . . . . . . . . . . . . . . . . . 11
4.2 Infrastructure . . . . . . . . . . . . . . . . . . . . . . . . . . . . . . . . . . . . . . . . . . . . . . . . . . . . . . . . . . . . . . . . . 13
4.3 Environment . . . . . . . . . . . . . . . . . . . . . . . . . . . . . . . . . . . . . . . . . . . . . . . . . . . . . . . . . . . . . . . . . . 17
4.5 Flow-on social impacts . . . . . . . . . . . . . . . . . . . . . . . . . . . . . . . . . . . . . . . . . . . . . . . . . . . . . . . . . . 22
4.6 Are there any benefits from dryland salinity? . . . . . . . . . . . . . . . . . . . . . . . . . . . . . . . . . . . . . . . . . . 22
5 What are the costs? . . . . . . . . . . . . . . . . . . . . . . . . . . . . . . . . . . . . . . . . . . . . . . . . . . . . . . . . . . . . . . . . . . . . . . 23
6 Why value the costs of dryland and urban salinity? . . . . . . . . . . . . . . . . . . . . . . . . . . . . . . . . . . . . . . . . . . . . . . 24
7 How do these guidelines assist local action planning? . . . . . . . . . . . . . . . . . . . . . . . . . . . . . . . . . . . . . . . . . . . 26
8 References . . . . . . . . . . . . . . . . . . . . . . . . . . . . . . . . . . . . . . . . . . . . . . . . . . . . . . . . . . . . . . . . . . . . . . . . . . . . . 29
Part Two: Guidelines for identifying and valuing the impacts . . . . . . . . . . . . . . . . . . . . . . . . . . . . . . . 33
1 Introduction . . . . . . . . . . . . . . . . . . . . . . . . . . . . . . . . . . . . . . . . . . . . . . . . . . . . . . . . . . . . . . . . . . . . . . . . . . . . 35
2 Identifying the nature of the salinity problem . . . . . . . . . . . . . . . . . . . . . . . . . . . . . . . . . . . . . . . . . . . . . . . . . . 36
3 Identifying the affected stakeholders. . . . . . . . . . . . . . . . . . . . . . . . . . . . . . . . . . . . . . . . . . . . . . . . . . . . . . . . . 37
3.1 Introduction . . . . . . . . . . . . . . . . . . . . . . . . . . . . . . . . . . . . . . . . . . . . . . . . . . . . . . . . . . . . . . . . . 37
3.2 Proforma for identifying the stakeholders affected by dryland and urban salinity . . . . . . . . . . . . . . . 38
3.3 Unsure whether urban salinity is a problem in your LAP area? . . . . . . . . . . . . . . . . . . . . . . . . . . . . 39
4 Valuing the costs of dryland and urban salinity . . . . . . . . . . . . . . . . . . . . . . . . . . . . . . . . . . . . . . . . . . . . . . . . . 40
4.1 Introduction . . . . . . . . . . . . . . . . . . . . . . . . . . . . . . . . . . . . . . . . . . . . . . . . . . . . . . . . . . . . . . . . . 40
4.2 Dryland agricultural producers . . . . . . . . . . . . . . . . . . . . . . . . . . . . . . . . . . . . . . . . . . . . . . . . . . . . 40
4.3 Rural and urban households. . . . . . . . . . . . . . . . . . . . . . . . . . . . . . . . . . . . . . . . . . . . . . . . . . . . . . 48
4.4 Commerce and industry. . . . . . . . . . . . . . . . . . . . . . . . . . . . . . . . . . . . . . . . . . . . . . . . . . . . . . . . . . 53
4.5 Saline town water supplies . . . . . . . . . . . . . . . . . . . . . . . . . . . . . . . . . . . . . . . . . . . . . . . . . . . . . . . 57
4.6 Local governments . . . . . . . . . . . . . . . . . . . . . . . . . . . . . . . . . . . . . . . . . . . . . . . . . . . . . . . . . . . . . 61
4.7 State government agencies and public utilities . . . . . . . . . . . . . . . . . . . . . . . . . . . . . . . . . . . . . . . . . 68
4.8 Natural environment . . . . . . . . . . . . . . . . . . . . . . . . . . . . . . . . . . . . . . . . . . . . . . . . . . . . . . . . . . . . 74
4.9 Cultural heritage . . . . . . . . . . . . . . . . . . . . . . . . . . . . . . . . . . . . . . . . . . . . . . . . . . . . . . . . . . . . . . . 78
4.10 Costs to downstream water users . . . . . . . . . . . . . . . . . . . . . . . . . . . . . . . . . . . . . . . . . . . . . . . . . . 80
4.11 Flow-on social costs . . . . . . . . . . . . . . . . . . . . . . . . . . . . . . . . . . . . . . . . . . . . . . . . . . . . . . . . . . . 81
vi vii
5 Conducting a survey or census of stakeholders . . . . . . . . . . . . . . . . . . . . . . . . . . . . . . . . . . . . . . . . . . . . . . . . 82
5.1 Overview . . . . . . . . . . . . . . . . . . . . . . . . . . . . . . . . . . . . . . . . . . . . . . . . . . . . . . . . . . . . . . . . . . . . 82
5.2 Preparation of a questionnaire form. . . . . . . . . . . . . . . . . . . . . . . . . . . . . . . . . . . . . . . . . . . . . . . . . 82
5.4 Implementing a survey or census. . . . . . . . . . . . . . . . . . . . . . . . . . . . . . . . . . . . . . . . . . . . . . . . . . . 84
5.5 Data analysis. . . . . . . . . . . . . . . . . . . . . . . . . . . . . . . . . . . . . . . . . . . . . . . . . . . . . . . . . . . . . . . . . . 85
5.6 Publicity . . . . . . . . . . . . . . . . . . . . . . . . . . . . . . . . . . . . . . . . . . . . . . . . . . . . . . . . . . . . . . . . . . . . . 85
6 Compilation of salinity cost data . . . . . . . . . . . . . . . . . . . . . . . . . . . . . . . . . . . . . . . . . . . . . . . . . . . . . . . . . . . . 86
7 Analysing the data . . . . . . . . . . . . . . . . . . . . . . . . . . . . . . . . . . . . . . . . . . . . . . . . . . . . . . . . . . . . . . . . . . . . . . . 88
8 References . . . . . . . . . . . . . . . . . . . . . . . . . . . . . . . . . . . . . . . . . . . . . . . . . . . . . . . . . . . . . . . . . . . . . . . . . . . . . 89
Attachment A: Extent and severity of urban salinity in the Murray-Darling Basin . . . . . . . . . . . . . . . . . . . . . . . . . 90
Attachment B: Example dryland agricultural producer questionnaire . . . . . . . . . . . . . . . . . . . . . . . . . . . . . . . . . 98
Attachment C: Example local government questionnaire . . . . . . . . . . . . . . . . . . . . . . . . . . . . . . . . . . . . . . . . . . 107
Attachment D: Example state government and utility questionnaire . . . . . . . . . . . . . . . . . . . . . . . . . . . . . . . . . 112
Attachment E: Example state governments and utilities to be considered for survey . . . . . . . . . . . . . . . . . . . . 117
PART ONE
Tables
1 Towns subject to urban salinity in the Murray-Darling Basin. . . . . . . . . . . . . . . . . . . . . . . . . . . . . . . . . . . 9
2 Median stream EC (dates various) and flow weighted average river salinity
at selected gauging stations (Source: MDBC 1997 and MDBMC 1999).. . . . . . . . . . . . . . . . . . . . . . . . . . . 19
3 Total current annual impact costs of dryland and urban salinity to key
stakeholders in the Murray-Darling Basin. . . . . . . . . . . . . . . . . . . . . . . . . . . . . . . . . . . . . . . . . . . . . . . . 25
Figures
1 Cause of dryland salinity in rural areas . . . . . . . . . . . . . . . . . . . . . . . . . . . . . . . . . . . . . . . . . . . . . . . . . . 7
2 Key MDBC dryland projects and how they assist with Local action planning . . . . . . . . . . . . . . . . . . . . . . 27
Boxes
1 Common impacts of dryland salinity on farms . . . . . . . . . . . . . . . . . . . . . . . . . . . . . . . . . . . . . . . . . . . . 12
PART TWO
Tables
1 Breakdown of dryland agricultural impact and preventative work cost categories . . . . . . . . . . . . . . . . . . 44
2 Salinity cost functions for dryland agricultural producers . . . . . . . . . . . . . . . . . . . . . . . . . . . . . . . . . . . . 47
3 Household salinity damage cost functions . . . . . . . . . . . . . . . . . . . . . . . . . . . . . . . . . . . . . . . . . . . . . . . 49
4 Typical no. of commercial and retail buildings in towns of varying size . . . . . . . . . . . . . . . . . . . . . . . . . 54
5 Salinity damage cost functions to commercial and industrial buildings . . . . . . . . . . . . . . . . . . . . . . . . . . 55
6 Marginal salinity cost functions: Households and businesses. . . . . . . . . . . . . . . . . . . . . . . . . . . . . . . . . . 56
7 Marginal saline water cost functions: Households. . . . . . . . . . . . . . . . . . . . . . . . . . . . . . . . . . . . . . . . . . 57
8 Marginal saline water cost functions: Commercial water users. . . . . . . . . . . . . . . . . . . . . . . . . . . . . . . . . 59
9 Marginal saline water cost functions: Industrial water users . . . . . . . . . . . . . . . . . . . . . . . . . . . . . . . . . . 59
10 Marginal saline water cost functions: Combined commercial and industrial water users . . . . . . . . . . . . . 59
11 Salinity damage cost functions for local rural roads: Increased repair and maintenance (R&M) expenditure . . 63
12 Salinity damage cost functions for local rural roads: Cost from shortened expected lifespans . . . . . . . . . 63
13 Salinity damage cost functions: Local rural bridges . . . . . . . . . . . . . . . . . . . . . . . . . . . . . . . . . . . . . . . . 64

vi vii
14 Relationship between town size and length of urban roads. . . . . . . . . . . . . . . . . . . . . . . . . . . . . . . . . . 65
15 Salinity damage cost functions: Urban roads. . . . . . . . . . . . . . . . . . . . . . . . . . . . . . . . . . . . . . . . . . . . . 65
16 Cost of salinity to local government per head of population . . . . . . . . . . . . . . . . . . . . . . . . . . . . . . . . . 67
17 Marginal salinity cost functions: Local government . . . . . . . . . . . . . . . . . . . . . . . . . . . . . . . . . . . . . . . . 67
18 Salinity cost functions: Highways, freeways and main sealed roads . . . . . . . . . . . . . . . . . . . . . . . . . . . . 70
19 Salinity cost functions: State and national bridges . . . . . . . . . . . . . . . . . . . . . . . . . . . . . . . . . . . . . . . . . 71
20 Salinity cost functions: Railways. . . . . . . . . . . . . . . . . . . . . . . . . . . . . . . . . . . . . . . . . . . . . . . . . . . . . . 71
21 Salinity cost functions: Infrastructure (excl. roads, bridges and rail) . . . . . . . . . . . . . . . . . . . . . . . . . . . . 72
22 Salinity cost functions: ‘Other’ salinity costs . . . . . . . . . . . . . . . . . . . . . . . . . . . . . . . . . . . . . . . . . . . . . 72
23 Marginal salinity cost functions: Government agencies and utilities . . . . . . . . . . . . . . . . . . . . . . . . . . . . 73
24 Valuation techniques and their applicability to natural resources . . . . . . . . . . . . . . . . . . . . . . . . . . . . . . 77
25 Proforma for recording estimated costs of dryland and urban salinity . . . . . . . . . . . . . . . . . . . . . . . . . . 87

viii
viii
Summary
Despite the worsening problem of salinity across
many rural and urban areas of the Murray-Darling
Basin, catchment communities have previously
lacked the tools to confidently answer the questions
What are the impacts of dryland and urban salinity
in our catchment, who are affected, and what are
the costs?
To address this information gap, the Murray-Darling
Basin Commission and the National Dryland Salinity
Program contracted Ivey ATP and Wilson Land
Management Services Pty Ltd to undertake a 3-
year research project entitled ‘Determining the
full nature and costs of dryland salinity across the
Murray-Darling Basin’ (MDBC Project No. D9008).
These guidelines are an important outcome from this
project and describe how to identify and value the
current impact costs of dryland and urban salinity at
the catchment level.
These guidelines are produced in two separate parts
to meet the needs of different stakeholders involved
in local action planning.
Part 1 describes the impacts and costs of salinity in
urban and dryland rural areas and outlines how this
information can help improve the rigour of local
action plans and cost-sharing arrangements.
Part 2 provides detailed technical guidance and tools
for assessing the impacts and costs of dryland and
urban salinity in a catchment.
How is salinity caused?Most dryland and urban salinity outbreaks in
the Murray-Darling Basin have been caused by
widespread land use changes since European
settlement. In rural areas, these changes have
included the clearing of deep-rooted trees, shrubs
and perennial grasses, and their replacement with
shallow-rooted annual crops and pastures. In urban
areas, these changes have included tree clearing,
over-irrigation of parks and gardens, disruption of
natural drainage lines, over-flowing septic tanks
and sullage pits, and leaking water, sewerage and
drainage pipes.
Where does dryland and urban salinity occur?Dryland salinity is a significant problem across many
rural areas of the Murray-Darling Basin, with at least
2.5 million hectares currently affected by salt. What
has been less well known however, is the extent
and severity of salinity outbreaks in rural towns
and cities.
Detailed research conducted as part of the
Determining the full cost of dryland and urban
salinity across the Murray-Darling Basin project
has shown that there are also at least 220 rural towns
and cities located throughout the Murray-Darling
Basin currently experiencing an urban salinity
problem caused by high saline watertables. There
are also likely to be many other rural towns where
the current salinity problems are less well known,
or that are likely to develop serious problems in
future years.
What are the impacts of dryland and urban salinity and who bears them?The impacts of salinity in both urban and dryland
rural areas fall into two main classes. Those caused
by saline water supplies, and those caused by
high saline watertables. The impacts of saline
water supplies include damage to household water
appliances, commercial water appliances and
increased production costs for irrigators.
The impacts of high saline watertables include
reduced dryland agricultural production, structural
damage to buildings, deterioration of parks and
gardens, and damage to other infrastructure such
as roads & sewerage supply systems.
There are a number of stakeholders in a catchment
who may be affected by dryland and urban
salinity. These include urban householders,
farmers, commercial and industrial businesses,
State government agencies and utilities, and local
councils. Dryland and urban salinity may also have
adverse impacts on the natural environment and
cultural heritage.
1
The broader Australian community may also be
affected by dryland and urban salinity occurring in
a catchment. This is because of flow-on regional
economic impacts, costs imposed on downstream
irrigation, household and industrial water users, and
damage to the downstream environment.
Presented in this report is a description of the
potential impacts of dryland and urban salinity in
the Murray-Darling Basin on dryland agriculture,
infrastructure, the environment, and cultural heritage.
A brief overview of the possible flow-on social
impacts and benefits from dryland and urban salinity
is then presented.
What are the costs of dryland and urban salinity?The costs of dryland and urban salinity may be
grouped into six categories:
1 Repair and maintenance costs.
2 Costs from the reduced lifespan of infrastructure.
3 Costs of taking preventative action.
4 Increased operating costs.
5 The ‘value of income foregone’.
6 Environmental costs.
In many cases, these costs will not occur
independently. For example, a high saline watertable
under a particular stretch of road may reduce the
time before major reconstruction is required, as well
as increase the ongoing funds needed to maintain
the road in an acceptable condition.
Why value the costs of dryland and urban salinity?The last decade has seen considerable improvements
in knowledge of the extent, severity and cost of
dryland salinity in rural areas. In contrast, despite
significant salinity problems now emerging in our
urban towns and cities, knowledge of the extent,
severity and cost of the problem in these areas is in
its infancy. Improving knowledge of the full nature
and costs of salinity in both rural and urban areas
will therefore serve three main purposes.
• Collecting this information at the sub-catchment
level will help catchment communities more
accurately gauge the importance of salinity in their
urban and rural areas, prepare or refine their local
action plans, and enhance their case for funding
from various programs.
• Collecting this information at the regional-level
will help catchment communities prepare or refine
their regional strategies.
• Collecting this information at the Basin-wide
level will help all tiers of government take a more
strategic approach to policy development and on-
ground investment on a broad or Basin-wide scale.
Furthermore, improving knowledge of the extent,
severity and cost of salinity in urban areas will
dramatically enhance the case for boosting total
funding available for urban salinity management.
Dryland salinity is often considered to be primarily
a ‘farm-level’ problem, resulting in a loss of farm
income and capital value of farmland. However,
as the results show, it is the non-agricultural
stakeholders, and not the dryland agricultural
producers, who bear the greatest costs from dryland
and urban salinity across the Basin. Specifically, the
results indicate that the total current impact cost
across the Basin is approximately $304.73 million
per annum, of which only 33 per cent is incurred
by dryland agricultural producers. Current impact
costs are greatest on households, commerce and
industry, at around $142.78 million per annum
or 46 per cent of the total. This significant cost is
primarily due to the magnitude of costs imposed
on these stakeholders from their use of saline town
water supplies. The results also confirm that in the
majority of Basin catchments (20/26), it is the non-
agricultural stakeholders in rural and urban areas,
and not dryland agricultural stakeholders, that make
the greatest contribution to total ‘$ per ha per annum’
impact costs.
2
Part One: An overview of the dryland and urban salinity costs across the Murray-Darling Basin
Photo: Arthur Mostead
4 PART ONE
1-1
PART ONE 5
Introduction1.1 Why have these guidelines
been produced?
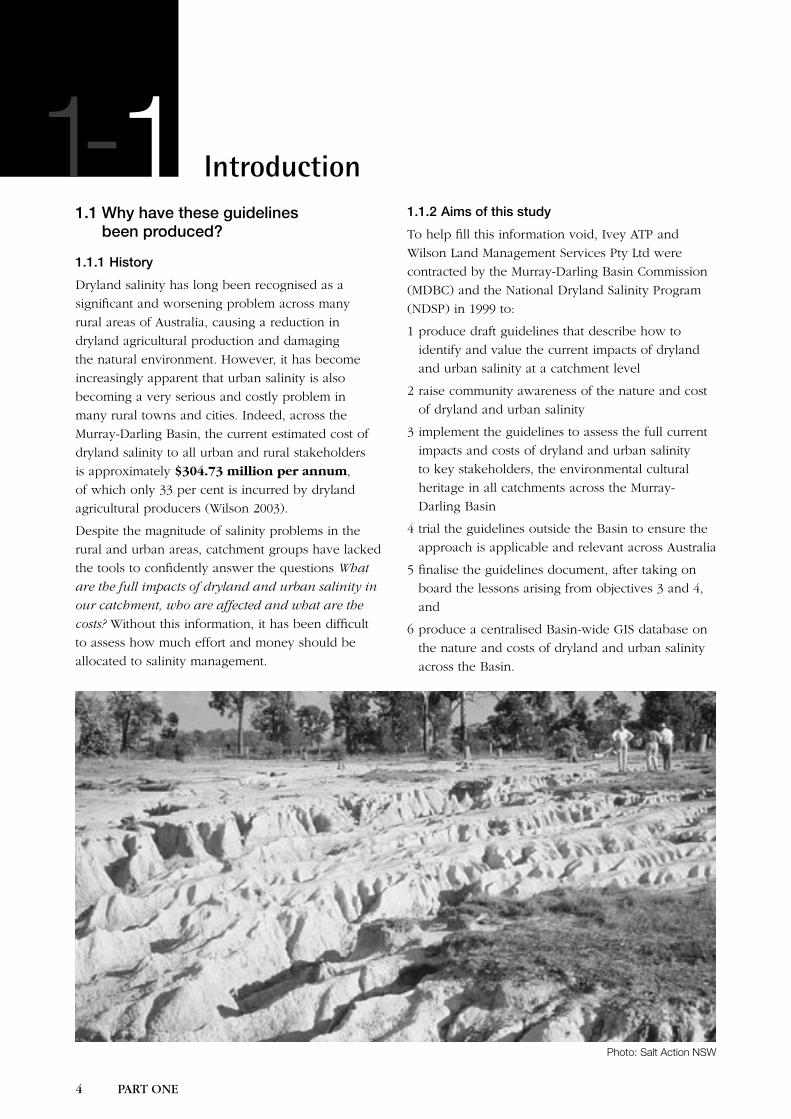
1.1.1 History
Dryland salinity has long been recognised as a
significant and worsening problem across many
rural areas of Australia, causing a reduction in
dryland agricultural production and damaging
the natural environment. However, it has become
increasingly apparent that urban salinity is also
becoming a very serious and costly problem in
many rural towns and cities. Indeed, across the
Murray-Darling Basin, the current estimated cost of
dryland salinity to all urban and rural stakeholders
is approximately $304.73 million per annum,
of which only 33 per cent is incurred by dryland
agricultural producers (Wilson 2003).
Despite the magnitude of salinity problems in the
rural and urban areas, catchment groups have lacked
the tools to confidently answer the questions What
are the full impacts of dryland and urban salinity in
our catchment, who are affected and what are the
costs? Without this information, it has been difficult
to assess how much effort and money should be
allocated to salinity management.
1.1.2 Aims of this study
To help fill this information void, Ivey ATP and
Wilson Land Management Services Pty Ltd were
contracted by the Murray-Darling Basin Commission
(MDBC) and the National Dryland Salinity Program
(NDSP) in 1999 to:
1 produce draft guidelines that describe how to
identify and value the current impacts of dryland
and urban salinity at a catchment level
2 raise community awareness of the nature and cost
of dryland and urban salinity
3 implement the guidelines to assess the full current
impacts and costs of dryland and urban salinity
to key stakeholders, the environmental cultural
heritage in all catchments across the Murray-
Darling Basin
4 trial the guidelines outside the Basin to ensure the
approach is applicable and relevant across Australia
5 finalise the guidelines document, after taking on
board the lessons arising from objectives 3 and 4,
and
6 produce a centralised Basin-wide GIS database on
the nature and costs of dryland and urban salinity
across the Basin.
1
Photo: Salt Action NSW
1-
4 PART ONE
1-1
PART ONE 5
The production of this Version 2 of the guidelines
represents the completion of the fifth objective of this
larger project (version 1 was published in 1999). Full
details of the approach used to complete all project
objectives, together with the final project results,
appear in the final project report by Wilson (2004).
A complete list of all reports arising from this project
also appears in the ‘Reference’ section of this Part 1.
1.2 Who are these guidelines for?Part 1 has been prepared mainly for catchment
management groups guiding the development of
local action plans. The aim is to provide an overview
of dryland and urban salinity across the Murray-
Darling Basin, and to demonstrate how obtaining this
information will enhance the rigour of local action
plans prepared for a catchment or sub-catchment.
Part 2 has been prepared mainly for natural resource
economists advising catchment management groups
on the nature and costs of dryland and urban salinity
in their area. Its aim is to provide the information
and tools needed to actually identify and value the
costs of dryland and urban salinity in a catchment.
Some of the information presented may also be of
interest to catchment management groups.
In addition to catchment management groups and
natural resource economists, there are several
other groups who may find these guidelines useful,
particularly Part 1. While not exhaustive, these may
include:
• State government agencies wanting to develop
state level dryland and urban salinity policies or
programs
• local governments, financial institutions and
companies with large infrastructure investments
wanting to better understand their potential
exposure to dryland and urban salinity problems
• other interested members of the community such
as students studying natural resource management
related subjects
• Landcare and other farming groups.
1.3 What information is (and is not) provided?
The aim of these guidelines is to provide the
following information:
• the cause and symptoms of dryland and urban
salinity
• locations where dryland and urban salinity occurs
• the potential impacts of dryland and urban
salinity on dryland agriculture, infrastructure, the
environment and cultural heritage in the Murray-
Darling Basin
• the various agricultural and non-agricultural
stakeholders that may be affected by dryland and
urban salinity
• the types of dryland and urban salinity costs
• the importance of salinity cost information
• guidance on how to identify and value the impact
costs of dryland and urban salinity on agricultural
and non-agricultural stakeholders, the environment
and cultural heritage in each catchment
• case studies and examples of how these techniques
can be used
• guidance on how to prepare for, and run, surveys
or censuses of stakeholder groups
• references for obtaining further information.
In these guidelines, the term ‘dryland and urban
salinity’ refers to all salinity problems that occur in
dryland rural (irrigation areas excluded) and urban
areas of the Murray-Darling Basin. It includes the
problems directly attributable to saline surface and
groundwater supplies, rising saline watertables, and
where soil erosion has exposed a naturally saline
sub-soil.
The guidelines are not designed to help establish
the cause of specific salinity problems, identify
or evaluate the costs and benefits of possible
management options, or to prepare a full local action
plan. Rather, the focus is to show how to assess the
nature and impact costs of dryland and urban salinity
problems that are occurring in any given dryland or
urban area — regardless of the underlying cause.
Where appropriate however, the reader is referred to
other reports where this information is presented.
Finally, these guidelines only discuss dryland and
urban salinity. However, salinity is not a ‘stand-
alone’ issue, and catchment management groups
will still need to at least consider the other important
natural resource issues facing their community
when developing their local action plans or
6 PART ONE
1-2
PART ONE 7
regional strategies. However, many of the issues
and instructions included in these guidelines will be
equally applicable when assessing various other land
degradation issues, such as soil acidity, soil sodicity,
and tree decline.
1.4 How were these guidelines produced?These guidelines were produced after an extensive
review process. The key steps involved:
• a detailed literature review of Australian studies
reporting on the impacts and costs of dryland and
urban salinity to catchment stakeholders and the
wider Australian community
• extensive liaison with key individuals across
Australia at the national, state and catchment levels
• compiling the information during these
two previous steps to prepare a draft
guidelines document
• a panel of prominent natural resource economists
to formally review this draft document
• refining the draft document in response to the
comments provided by this panel
• convening a National Workshop to receive further
state agency, catchment community and local
government feedback on the revised document
• finalising the draft guidelines in response to the
comments provided by the Workshop participants
• working with state agency staff, catchment
representatives and others to apply the methods
described in the guidelines across the Murray-
Darling Basin and in two case study areas outside
the Murray-Darling Basin, and
• using the lessons learnt during this implementation
stage to finalise these guidelines.
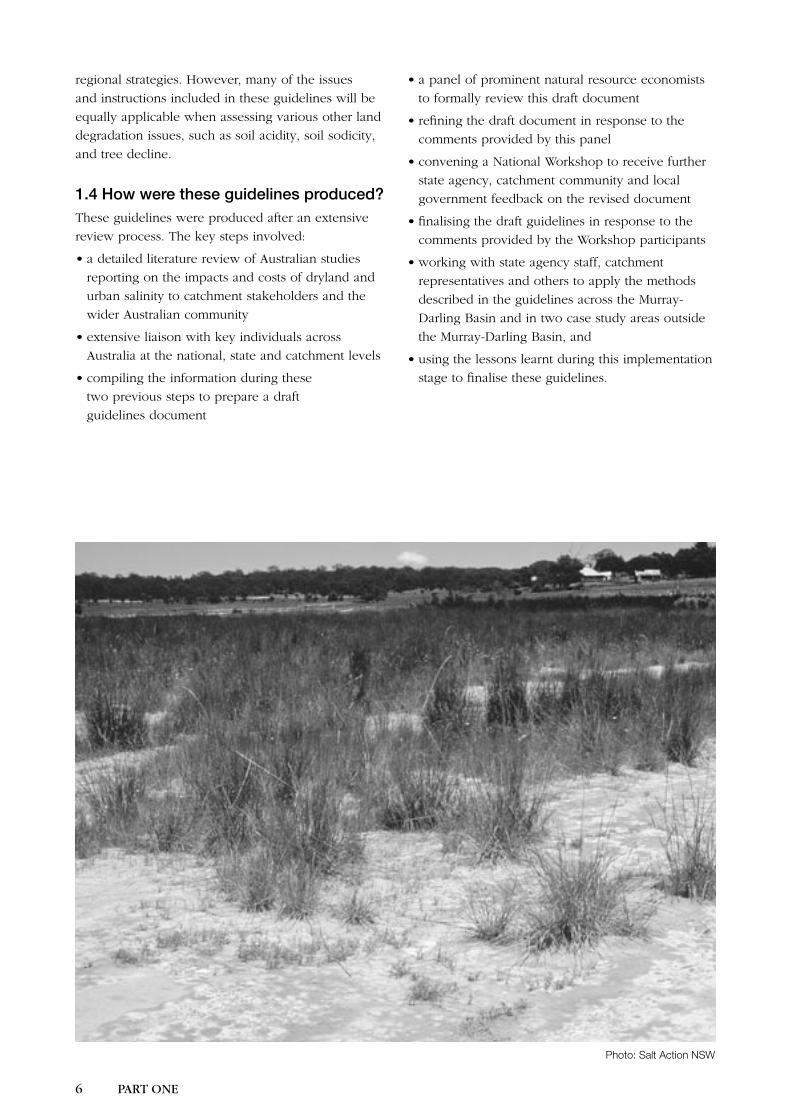
Photo: Salt Action NSW
6 PART ONE
1-2
PART ONE 7
What is dryland and urban salinity and how is it caused?
Salinity is a degradation problem that may occur in
both dryland rural and urban areas. In most cases, it
is caused by a rising watertable or sub-surface water
flow that brings dissolved salts to within 1–2 metres
of the soil surface1. These salts can then enter the
nearby streams and rivers, causing stream salinity.
Dryland and urban salinity associated with a high
watertable has generally been caused by widespread
land use changes since European settlement that
increase rates of groundwater recharge. In rural
areas, these changes have included the clearing of
deep-rooted perennial trees, shrubs and grasses,
and their replacement with shallow-rooted annual
crops and grasses (see Figure 1). In urban areas,
salinity problems may result from increased rates
of groundwater recharge in the surrounding rural
areas. However, there are several local factors that
may worsen, or even directly cause an urban salinity
problem. These include:
• over-watering of parks, gardens and sporting
grounds
• disruption to surface runoff and infiltration
• inefficient drainage systems
• overflowing sullage pits and septic tanks, and
• leakage from water and sewerage pipes.
2
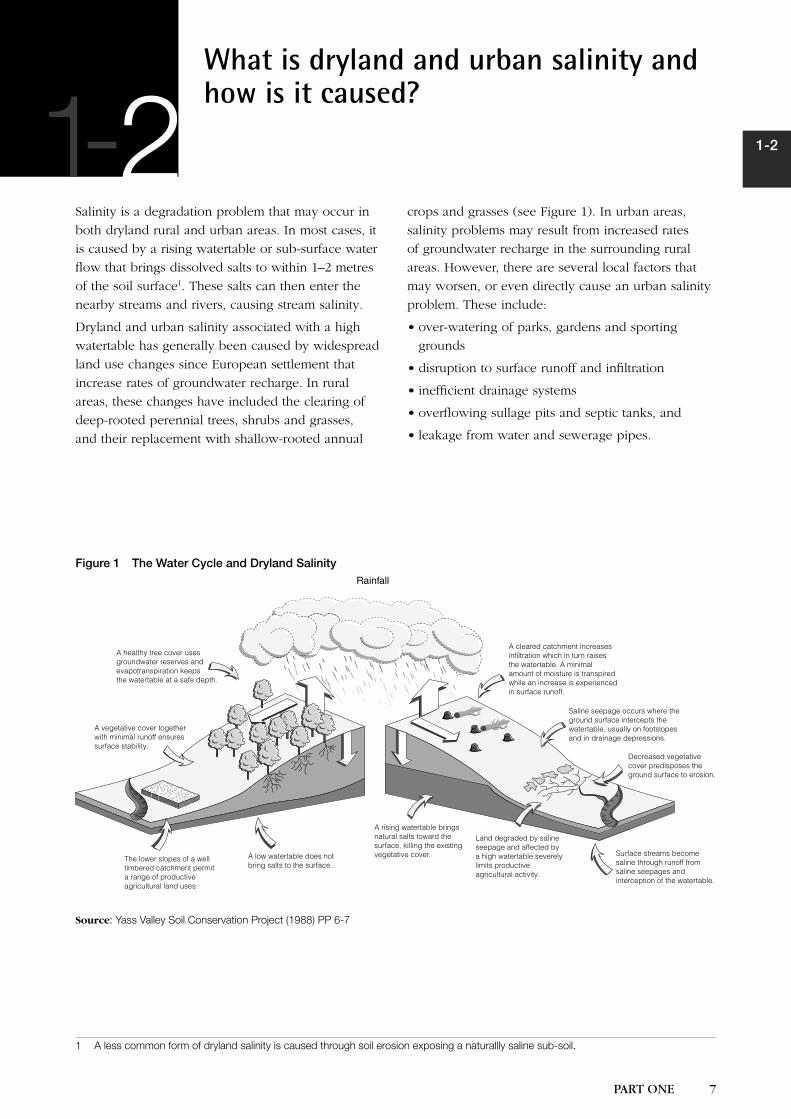
Figure 1 The Water Cycle and Dryland Salinity
1 A less common form of dryland salinity is caused through soil erosion exposing a naturallly saline sub-soil.
Rainfall
A healthy tree cover uses groundwater reserves and evapotranspiration keeps the watertable at a safe depth.
A cleared catchment increases infiltration which in turn raises the watertable. A minimal amount of moisture is transpired while an increase is experienced in surface runoff.
Saline seepage occurs where the ground surface intercepts the watertable, usually on footslopes and in drainage depressions.
Decreased vegetative cover predisposes the ground surface to erosion.
Surface streams become saline through runoff from saline seepages and interception of the watertable.
Land degraded by saline seepage and affected by a high watertable severely limits productive agricultural activity.
A rising watertable brings natural salts toward the surface, killing the existing vegetative cover.A low watertable does not
bring salts to the surface.The lower slopes of a well timbered catchment permit a range of productive agricultural land uses.
A vegetative cover together with minimal runoff ensures surface stability.
Source: Yass Valley Soil Conservation Project (1988) PP 6-7
1-
8 PART ONE
1-3
PART ONE 9
Where does dryland and urban salinity occur?
Dryland salinity is a significant problem across
many rural areas of the Murray-Darling Basin, with
at least 2.5 million hectares currently affected by
salt. Research conducted as part of this project has
shown that there are also at least 220 rural towns
and cities located in the Murray-Darling Basin
currently experiencing some degree of urban salinity
problem caused by high saline watertables. There are
also likely to be many other rural towns where the
current salinity problems are less well known, or that
are likely to develop serious problems in the future.
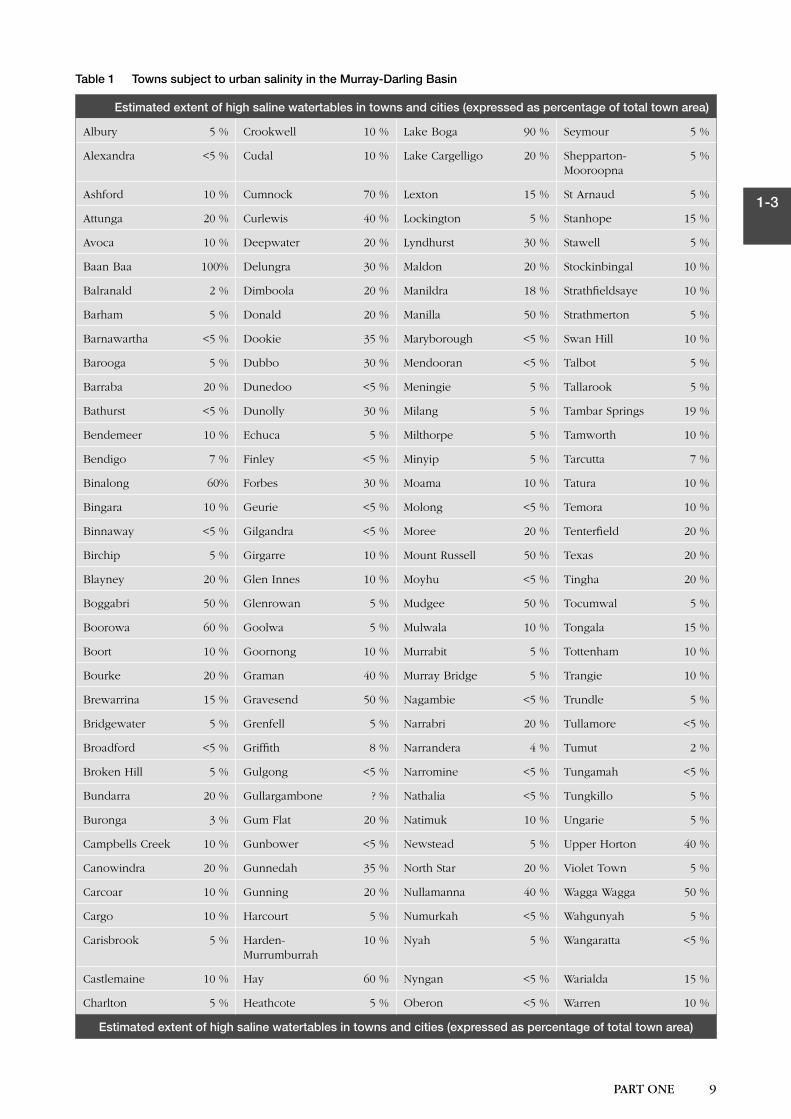
Table 1 shows a summary of the latest information
on the towns affected, and the percentage of
each town affected to some degree. More detailed
tables displaying a breakdown of the percentage
of each town currently experiencing very slight,
slight, moderate and severe urban salinity problems
appear in the regional-level project reports listed
in the ‘Reference’ Section and available on-line at
www.ndsp.gov.au. These reports were generated
when the methods described in Part 2 of these
guidelines were implemented across the Basin.
The database on urban salinity was compiled with
the assistance of numerous state agency staff and
catchment representatives across the Basin, and
through on-ground inspections of over eighty
Victorian towns. The number of salinity affected
urban town centres is substantially higher than ever
previously documented and has a major impact
on total estimated dryland and urban salinity costs
across the Basin.
In each of the towns inspected, the key visible
indicators used were salt scalding, bare patches,
and the presence of spiny rush both in the drainage
lines as well on the higher ground. Other indicators
were visible damage to building structures and
foundations, damage to sports grounds and other
open spaces, and damage to other infrastructure
(including roads, bridges, kerbs, footpaths and
drainage lines).
Every effort has been taken to compile the best available information on the extent and severity of
urban salinity. Despite this effort, the information must be regarded as indicative only until more
definitive hydrogeological studies and on-ground inspections of towns and cities in the Basin can
be undertaken.
3
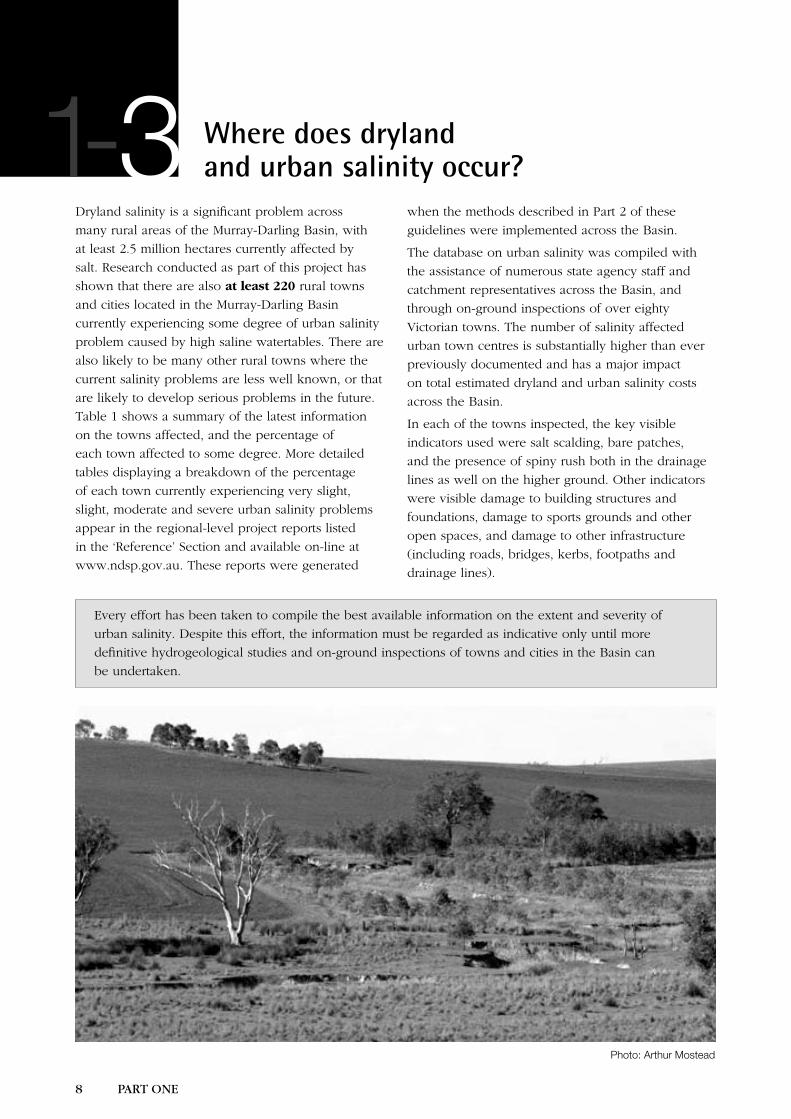
Photo: Arthur Mostead
1-
8 PART ONE
1-3
PART ONE 9
Table 1 Towns subject to urban salinity in the Murray-Darling Basin
Estimated extent of high saline watertables in towns and cities (expressed as percentage of total town area)
Albury 5 % Crookwell 10 % Lake Boga 90 % Seymour 5 %
Alexandra <5 % Cudal 10 % Lake Cargelligo 20 % Shepparton-Mooroopna
5 %
Ashford 10 % Cumnock 70 % Lexton 15 % St Arnaud 5 %
Attunga 20 % Curlewis 40 % Lockington 5 % Stanhope 15 %
Avoca 10 % Deepwater 20 % Lyndhurst 30 % Stawell 5 %
Baan Baa 100% Delungra 30 % Maldon 20 % Stockinbingal 10 %
Balranald 2 % Dimboola 20 % Manildra 18 % Strathfieldsaye 10 %
Barham 5 % Donald 20 % Manilla 50 % Strathmerton 5 %
Barnawartha <5 % Dookie 35 % Maryborough <5 % Swan Hill 10 %
Barooga 5 % Dubbo 30 % Mendooran <5 % Talbot 5 %
Barraba 20 % Dunedoo <5 % Meningie 5 % Tallarook 5 %
Bathurst <5 % Dunolly 30 % Milang 5 % Tambar Springs 19 %
Bendemeer 10 % Echuca 5 % Milthorpe 5 % Tamworth 10 %
Bendigo 7 % Finley <5 % Minyip 5 % Tarcutta 7 %
Binalong 60% Forbes 30 % Moama 10 % Tatura 10 %
Bingara 10 % Geurie <5 % Molong <5 % Temora 10 %
Binnaway <5 % Gilgandra <5 % Moree 20 % Tenterfield 20 %
Birchip 5 % Girgarre 10 % Mount Russell 50 % Texas 20 %
Blayney 20 % Glen Innes 10 % Moyhu <5 % Tingha 20 %
Boggabri 50 % Glenrowan 5 % Mudgee 50 % Tocumwal 5 %
Boorowa 60 % Goolwa 5 % Mulwala 10 % Tongala 15 %
Boort 10 % Goornong 10 % Murrabit 5 % Tottenham 10 %
Bourke 20 % Graman 40 % Murray Bridge 5 % Trangie 10 %
Brewarrina 15 % Gravesend 50 % Nagambie <5 % Trundle 5 %
Bridgewater 5 % Grenfell 5 % Narrabri 20 % Tullamore <5 %
Broadford <5 % Griffith 8 % Narrandera 4 % Tumut 2 %
Broken Hill 5 % Gulgong <5 % Narromine <5 % Tungamah <5 %
Bundarra 20 % Gullargambone ? % Nathalia <5 % Tungkillo 5 %
Buronga 3 % Gum Flat 20 % Natimuk 10 % Ungarie 5 %
Campbells Creek 10 % Gunbower <5 % Newstead 5 % Upper Horton 40 %
Canowindra 20 % Gunnedah 35 % North Star 20 % Violet Town 5 %
Carcoar 10 % Gunning 20 % Nullamanna 40 % Wagga Wagga 50 %
Cargo 10 % Harcourt 5 % Numurkah <5 % Wahgunyah 5 %
Carisbrook 5 % Harden-Murrumburrah
10 % Nyah 5 % Wangaratta <5 %
Castlemaine 10 % Hay 60 % Nyngan <5 % Warialda 15 %
Charlton 5 % Heathcote 5 % Oberon <5 % Warren 10 %
Estimated extent of high saline watertables in towns and cities (expressed as percentage of total town area)
10 PART ONE
1-4
PART ONE 11
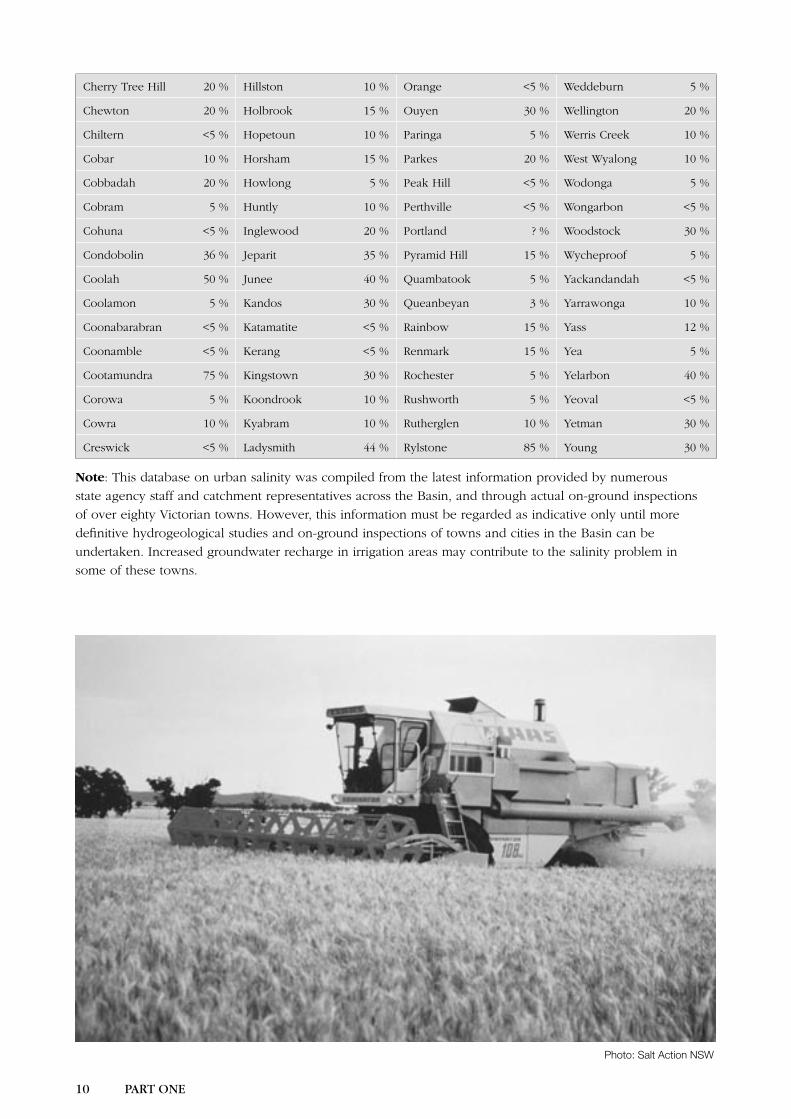
Cherry Tree Hill 20 % Hillston 10 % Orange <5 % Weddeburn 5 %
Chewton 20 % Holbrook 15 % Ouyen 30 % Wellington 20 %
Chiltern <5 % Hopetoun 10 % Paringa 5 % Werris Creek 10 %
Cobar 10 % Horsham 15 % Parkes 20 % West Wyalong 10 %
Cobbadah 20 % Howlong 5 % Peak Hill <5 % Wodonga 5 %
Cobram 5 % Huntly 10 % Perthville <5 % Wongarbon <5 %
Cohuna <5 % Inglewood 20 % Portland ? % Woodstock 30 %
Condobolin 36 % Jeparit 35 % Pyramid Hill 15 % Wycheproof 5 %
Coolah 50 % Junee 40 % Quambatook 5 % Yackandandah <5 %
Coolamon 5 % Kandos 30 % Queanbeyan 3 % Yarrawonga 10 %
Coonabarabran <5 % Katamatite <5 % Rainbow 15 % Yass 12 %
Coonamble <5 % Kerang <5 % Renmark 15 % Yea 5 %
Cootamundra 75 % Kingstown 30 % Rochester 5 % Yelarbon 40 %
Corowa 5 % Koondrook 10 % Rushworth 5 % Yeoval <5 %
Cowra 10 % Kyabram 10 % Rutherglen 10 % Yetman 30 %
Creswick <5 % Ladysmith 44 % Rylstone 85 % Young 30 %
Note: This database on urban salinity was compiled from the latest information provided by numerous
state agency staff and catchment representatives across the Basin, and through actual on-ground inspections
of over eighty Victorian towns. However, this information must be regarded as indicative only until more
definitive hydrogeological studies and on-ground inspections of towns and cities in the Basin can be
undertaken. Increased groundwater recharge in irrigation areas may contribute to the salinity problem in
some of these towns.
Photo: Salt Action NSW
10 PART ONE
1-4
PART ONE 11
What are the impacts of dryland and urban salinity and who bears them?
The impacts of salinity both within urban and
dryland rural areas of a catchment fall into two main
classes, namely:
• saline water supplies, and
• high saline watertables.
The impacts of saline water supplies include
increased production costs for urban businesses,
damage to household water appliances and
reticulation systems, and damage to the natural
environment.
The impacts of high saline watertables include
reduced farm productivity, structural damage to
buildings such as urban households and commercial
premises, damage to other infrastructure such as
roads, bridges, underground telephone, water,
electricity and sewerage systems, and remnant
vegetation.
There are several stakeholders in a catchment who
may be affected by saline water supplies and high
saline watertables in the urban and rural areas.
These include:
• dryland agricultural producers
• urban and rural householders
• commercial and industrial businesses
• state government agencies
• road and rail authorities
• water, gas, electricity suppliers, and
• local governments.
Dryland and urban salinity can also affect:
• remnant vegetation, threatened fauna and flora
species, wetlands, rivers and streams, and aquatic
ecology, and
• historic buildings and other areas with cultural,
historical or natural significance. These include
Aboriginal sacred sites and other archaeological
sites that contain buried pottery, quartz and metal
artefacts that are particularly prone to damage from
high watertables.
The purpose of this section is to elaborate on the
adverse impacts that saline town water supplies
and high saline watertables may have on dryland
agricultural and non-agricultural stakeholders, the
environment and cultural heritage across the Basin.
4.1 Dryland agricultureOne of the first symptoms of dryland salinity on
farms is that yields of crops and pastures growing in
the saline environment declines. This reduction may
be followed by the death of less salt tolerant species
including trees, and the appearance of bare patches
of soil or plant species that are more tolerant of
the saline conditions such as sea barley grass (PDP
Australia Pty Ltd 1992). These changes may result
in decreased agricultural production, an increase in
production costs, or both.
Different crops and pastures vary in their tolerance
to salinity. The yield of each pasture or crop species
only begins to decline once the salinity level
increases beyond
a threshold that is unique to that species.
The cost of agricultural production foregone is often
thought to be the largest cost of salinity to farmers.
However, dryland salinity may also have a range of
other impacts on a farm business.
41-
12 PART ONE
1-4
PART ONE 13
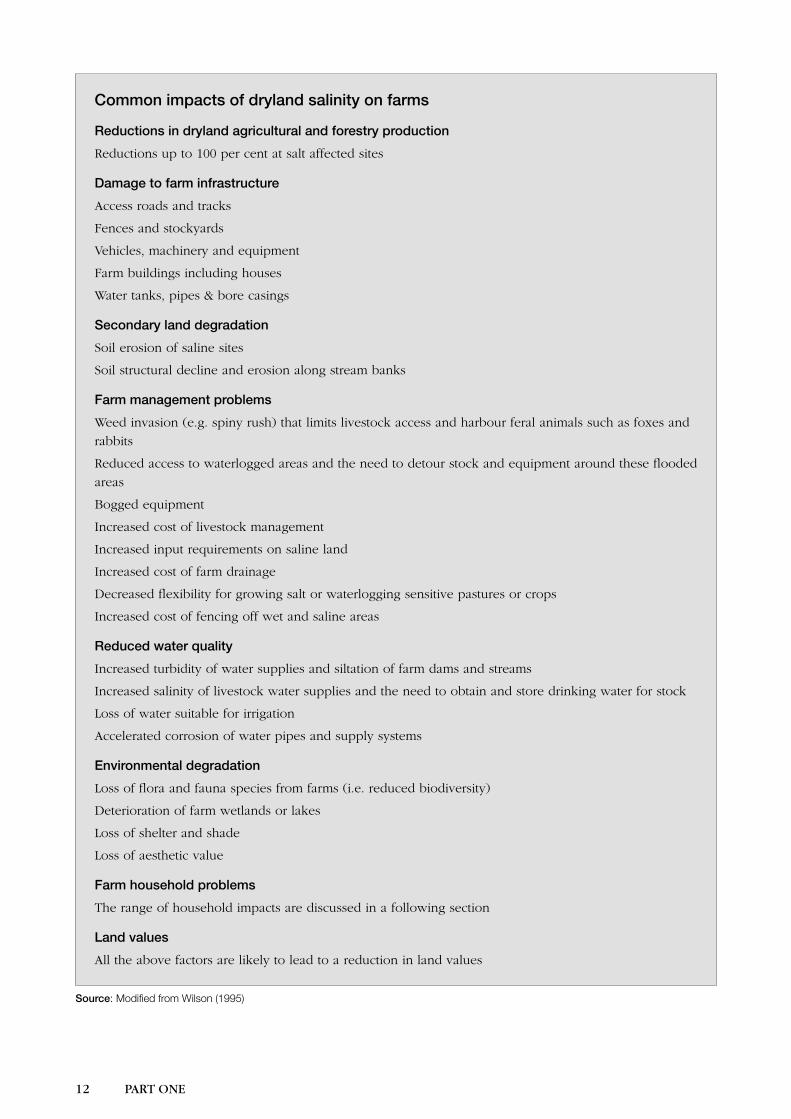
Common impacts of dryland salinity on farms
Reductions in dryland agricultural and forestry production
Reductions up to 100 per cent at salt affected sites
Damage to farm infrastructure
Access roads and tracks
Fences and stockyards
Vehicles, machinery and equipment
Farm buildings including houses
Water tanks, pipes & bore casings
Secondary land degradation
Soil erosion of saline sites
Soil structural decline and erosion along stream banks
Farm management problems
Weed invasion (e.g. spiny rush) that limits livestock access and harbour feral animals such as foxes and
rabbits
Reduced access to waterlogged areas and the need to detour stock and equipment around these flooded
areas
Bogged equipment
Increased cost of livestock management
Increased input requirements on saline land
Increased cost of farm drainage
Decreased flexibility for growing salt or waterlogging sensitive pastures or crops
Increased cost of fencing off wet and saline areas
Reduced water quality
Increased turbidity of water supplies and siltation of farm dams and streams
Increased salinity of livestock water supplies and the need to obtain and store drinking water for stock
Loss of water suitable for irrigation
Accelerated corrosion of water pipes and supply systems
Environmental degradation
Loss of flora and fauna species from farms (i.e. reduced biodiversity)
Deterioration of farm wetlands or lakes
Loss of shelter and shade
Loss of aesthetic value
Farm household problems
The range of household impacts are discussed in a following section
Land values
All the above factors are likely to lead to a reduction in land values
Source: Modified from Wilson (1995)
12 PART ONE
1-4
PART ONE 13
4.2 InfrastructureThe purpose of this section is to describe the various
impacts of saline town water supplies and high saline
watertables on non-agricultural infrastructure. The
section on saline water supplies draws extensively
on the report by Gutteridge Haskins and Davey
(GHD) (1999) and the latest report by Wilson and
Laurie (2002) entitled Cost functions to estimate the
cost of saline town water supplies to households,
commerce and industry which is available on-line
at www.ndsp.gov.au
4.2.1 Saline water supplies
There are two main non-agricultural
stakeholders affected by saline water supplies:
• Household water users
• Industrial/Commercial water users
This section begins with a brief description of the
key factors that influence water quality. This is
followed by a review of the range of saline water
related impacts that may be imposed on the two
groups listed above.
Factors affecting water quality
Water contains both suspended substances (silts,
clays and vegetable matter) and dissolved substances
(salts, metal ions and vegetable decomposition
products). The level and type of suspended and
dissolved substances influence the taste, colour,
hardness, odour and salinity level of the water.
Hence, when investigating the cost of saline water to
households, commerce and industry, it is desirable
to isolate, as far as possible, the costs attributable to
salinity from the other components.
The term total dissolved solids (TDS) is sometimes
used to define ‘salinity’ or the total level of dissolved
salts in water. However, TDS is a simple measure
of the amount of total dissolved solids in water,
irrespective of the type of solids present. Therefore
water samples with similar TDS levels may have
different water quality characteristics, reflecting the
different types / proportions of solids present in the
water. For example, where two water samples have
equal TDS levels, one may be characterised as ‘Hard’
and the other characterised as ‘Saline’.
‘Hardness’ is a measure of the concentration of
particular ions in water such as magnesium and
calcium. The presence of excessive quantities of
these elements in water supplies can cause scale
build up on water pipes and fixtures.
‘Salinity’ is a measure of the concentration of
dissolved salts in water and is associated with
corrosion. Salinity is more commonly measured
using the units of Electrical Conductivity (EC) or
microSiemens per centimetre (µS/cm).
As the impacts of saline and hard water may be
different, it may be advantageous to distinguish
between the impacts of salinity and hardness,
where possible. However, there is a strong
correlation between hardness and salinity, and in
practice it will be difficult to differentiate impacts
associated with each.
Household water users
Soap and detergent use
Early research suggested that saline or hard
water supplies could lead to increased domestic
consumption of soaps and detergents (Cox and
Dillon 1982). However, GHD (1999) suggest that
there is no significant relationship between soap or
detergent consumption and TDS (within the range of
salinity levels recorded for the River Murray).
Plumbing corrosion
Water pipes and fixtures (including shower rosettes
and taps) come in a variety of materials, including
copper, galvanised iron, PVC and other plastics,
brass and stainless steel. Wilson and Laurie (2002)
has demonstrated that there is a direct relationship
between the TDS of town water supplies and the
expected lifespan and maintenance cost of these
items in towns and cities located across the Murray-
Darling Basin.
• Saline corrosion results when saline water causes
rust to form on iron and steel pipes and fittings.
• Scaling results when hard water causes deposits
of calcium, magnesium and other soluble ions to
build up on the internal surfaces of water pipes
and fixtures. These deposits eventually restrict the
flow of water and can reduce the expected lifespan
of the affected materials. Generally, the rate of
scale formation increases with the hardness, and
hence the TDS, of the water (GHD 1999).
Over time, the extent of damage to water pipes
and fixtures caused by saline corrosion is likely to
decline. This is because plumbers are increasingly
using alternative materials in new houses such as
plastic piping and other materials that are corrosion
resistant. This change is being made for sound
economic reasons, and a side benefit is reduced
salinity impacts (GHD 1999).
14 PART ONE
1-4
PART ONE 15
Hot water systems
Hot water systems come in a variety of forms,
including electric, gas and solar. Wilson and Laurie
(2002) have shown that there is a direct relationship
between the TDS of the water supply and the
expected lifespan and maintenance cost of hot water
services in towns and cities across the Basin. This
impact is due to an increase in scale build-up on
the heating elements and pressure relief valves, and
accelerated corrosion of the lining (GHD 1999).
The cost associated with accelerated corrosion
and scale formation will decline over time as
manufacturers sell more units supplied with
corrosion resistant vitreous enamel or glass linings,
and as new water treatment plants that extract scale
forming impurities from water supplies are built
(GHD 1999).
Bottled water
Early research suggests that saline or hard water
supplies could lead to an increase in domestic
consumption of bottled water (Cox and Dillon
1982). However GHD (1999) rejected this claim,
and concluded that no significant relationship exists
between bottled water consumption and TDS at the
various salinity levels recorded for the River Murray.
This situation may be different, however, in rural
towns that periodically experience very saline town
water supplies.
Domestic filters
Wilson and Laurie (2002) demonstrate that there is
a direct relationship between the average annual
cost of installing and operating domestic water
filters and the TDS level of water supplies across the
Basin. However, as noted by GHD (1999), the use
of domestic water filters, like the consumption of
bottled water, enjoy greater popularity in cities than
in country areas.
Rainwater tanks
Wilson and Laurie (2002) also demonstrate that
there is a direct relationship between the TDS
level of town water supplies and the proportion of
households installing rainwater tanks.
Water softeners
Wilson and Laurie (2002) demonstrate that there is
a direct relationship between the TDS level of town
water supplies and average household expenditure
on purchasing, installing and maintaining water
softening units.
Industrial/Commercial water users
There are five key areas where saline water supplies
may impact on industrial/commercial water users.
Cooling towers
Cooling towers are commonly used in commercial
buildings, hospitals, schools and industrial premises
to provide air conditioning. As all cooling towers
rely on water in their operation, they are affected
to varying degrees by the quality of the water used
(GHD 1999).
The main impact of saline water on cooling towers
is increased operating costs. This is because
operators need to flush out the water contained in
these cooling towers once the salinity of the water
reaches a critical level (the salinity level of the water
increases over time as the stored water evaporates).
Typically, flushing is carried out before the salinity
of cooling towers reaches a maximum level of 4,000
EC. While there is a direct cost from replacing the
flushed water, the main cost arises from replacing the
chemicals added to the water to control corrosion,
scaling and microbial activity (GH&D 1999).
Saline water supplies generally do not increase
the cost of purchasing cooling towers or decrease
their expected lifespan. This is because the
majority of these units are manufactured out of
timber or fibreglass which are corrosion resistant
(GH&D 1999).
Evaporative coolers may also be found in commercial
buildings and industrial premises. However, as these
units are generally made with corrosion resistant
materials and do not require chemicals in their water
supply, the impact of saline water supplies on these
units is only considered to be negligible at salinity
levels below 1,600 EC (GH&D 1999).
Water supply infrastructure
It is generally thought that saline water supplies
increase the rate of corrosion in water pipes and
reticulation systems. However, it is the salinity level
of the surrounding soils, rather than the salinity level
of the water itself, that is the critical factor affecting
the rate of corrosion and hence the expected life of
water supply infrastructure (GHD 1999).
The GHD report concludes the following:
• The occurrence of salinity induced corrosion in
water supply pipes and reticulation systems is
likely to decline over time as towns replace their
infrastructure with corrosion resistant plastic or
cement-lined ductile iron components. This change
14 PART ONE
1-4
PART ONE 15
is already being made for sound economic reasons,
and a side benefit is reduced salinity impacts.
• Rural towns that retain their old cast iron pipes
may continue to experience corrosion. However,
as a number of complex factors affect the rate
and severity of corrosion (including the presence
of free chlorine ions, temperature, pH, and
hardness), it is extremely difficult to derive a
relationship between the salinity level of the water
and corrosion.
Boiler operation
Boilers are used to supply steam under pressure for
various commercial and industrial purposes. Saline
water supplies do not generally impact on the boilers
themselves. Rather, they have an impact on the
frequency with which the water must be flushed,
and hence on the chemical, water and energy losses
involved. As the salinity level of the water supplies
increase, so too does the frequency with which
the stored water must be flushed. Under an ideal
regime, the water stored in a medium pressure boiler
would be flushed when the salinity (TDS) reached
a maximum level of 3,200 EC (GHD 1999).
Municipal water treatment costs
Most towns have built water treatment plants
to improve the quality of town water supplies.
Typically, these plants remove contaminants from the
water or modify the physical characteristics (such as
the hardness and pH levels).
A commonly held belief is that salinity (TDS) levels
have an impact on municipal water treatment
processes and hence costs. However, the research
conducted by GHD (1999) has shown that most
treatment processes are designed to address daily
fluctuations in water turbidity, colour and microbial
activity, and that they are relatively independent
of salinity levels. Some form of reverse osmosis
treatment may be needed if the salinity level
consistently exceeds 1,600 EC (GHD 1999).
Industrial water treatment
Water is a key input into many industrial processes,
including:
• food and beverage preparation
• paper production
• electroplating, and
• automotive painting (GHD 1999).
As the quality of water used in these processes is
critical, commercial businesses and industry often
make significant investments to purchase and operate
water treatment equipment to improve the quality
of the water prior to its use (including ion exchange
and reverse osmosis equipment) (GHD 1999).
4.2.2 High saline watertables
High saline watertables can cause adverse impacts on
public and private infrastructure located in urban and
rural areas including:
• roads (including gutters and culverts) and bridges
• stone and brick buildings
• footpaths, driveways and other concrete structures
• water, stormwater and sewerage systems
• powerlines, fences and other steel structures, and
• railway lines.
Roads and bridges
Most roads and bridges have been designed for sites
with a dry sub-soil and a low frequency/duration of
soil saturation. Where groundwater saturates the soil
within 2 metres of the surface, the foundation often
deteriorates rapidly causing a breakdown of the base
and deterioration of the surface (Hamilton 1995).
This deterioration in the road surface occurs because
the downward pressure applied to the surfaces,
especially those subject to frequent truck use,
penetrates to a depth of 1.5 m or more. When the
subsoil at this depth is saturated, there can often be
considerable movement of the sub-soil, especially
if this sub-soil has a high clay content. This sub-soil
movement is frequently transmitted upwards through
the road base, and eventually results in localised
‘heaving’ of the road surface, followed by cracking
of the bitumen surface, complete break-up of the
road itself, and further penetration of surface water
into the road foundation (ACTEW 1997; Wooldridge
1998). The end result is premature road failure, more
frequent and costly maintenance, or a combination
of both.
However, there are numerous factors that ultimately
influence the impact of high saline watertables on
roads and bridges, including the:
• intensity of use
• rainfall
• groundwater level and salinity concentration
• soil type
• method and material used during construction
• quality of the road drainage
16 PART ONE
1-4
PART ONE 17
• elevation of the road above the surrounding area,
and
• condition of the bitumen seal (Hill 1999).
Buildings and other concrete structures
High watertables can often bring moisture and
salts close to the foundations of houses and other
buildings. This periodic wetting of the foundations
may cause rising damp where the groundwater is
drawn into the brick, stone or cement by capillary
action (Salt Action 1997).
The extent and severity of a rising damp problem
will depend on the materials used, the amount of
moisture and salt present, the amount of evaporation,
and the effectiveness of any damp-proof barrier
(these barriers are designed to prevent moisture
moving from the foundations to the walls of the
buildings).
Salinity and rising damp damage to houses and other
buildings is most noticeable when the damp-proof
course is absent (common in older houses), broken
(common in houses with renovations), or bypassed.
Bypassing the damp proof course is the most
common, and can be caused by:
• adding new floors
• rendering the outside of the building
• installing raised paths next to walls, and
• accumulation of topsoil or garden mulch against
walls (Salt Action 1997).
As the building materials undergo periodic wetting
and drying cycles, salt crystals often grow within the
confined pore spaces. In severe cases, these crystals
can cause deterioration of the brick, stone and
cement, and can result in:
• cracked bricks or stone
• mortar turning to dust, and
• cement render flaking off internal and external
walls (Spennemann 1997).
While salinity damage to houses and buildings
is often a very visible impact of salinity, other
brick and concrete structures found extensively
in urban areas can also be affected. These include
footpaths and bicycle paths, paved or cemented
areas, and driveways.
Underground water, sewerage and septic systems
As noted in the previous section, rising saline
watertables are the main cause of corrosion to
underground concrete, cast iron, brass, copper and
galvanised iron water pipes and fixtures. When any
such corrosion occurs, it can substantially increase
the maintenance costs and reduce their useful
operating life. Any leakage of water from rusted
pipes can also substantially increase the amount
of recharge to groundwater in the urban areas,
hence exacerbating the problem. In the urban city
of Wagga Wagga, for example, it is estimated that
approximately 47 per cent of total groundwater
recharge originates from leaking water pipes
(Slinger 1998). In many cases, however, these leaks
go undetected.
When the watertable rises, groundwater can often
flow into underground sewerage systems. The end
result is that additional, and often saline, water
drains into sewerage treatment plants, resulting
in increased plant operating costs, a decrease in
treatment efficiency, and less opportunity for re-
using the treated water for other purposes such as
irrigating urban parks (Hamilton 1995, Wilson and
Laurie 2002).
High watertables can also lead to a failure of septic
systems. Failures can result from groundwater
entering septic systems and/or poor function of
‘rubble pits’ which accept the processed outflows
from the septic systems. The end result may be raw
sewerage overflowing from septic tanks.
Railways, powerlines and other steel structures
There are a number of metal structures present in
urban and rural areas that are prone to corrosion
from high saline watertables. These include:
• railway tracks
• surface mounted steel water storage tanks
• underground steel fuel storage tanks
• concrete power poles with internal steel reinforcing
• underground cast iron gas supply lines and
telephone cable casings
• reinforced concrete structures and tower footings
• underground power cables
• steel lattice towers and hollow or concrete filled
steel poles, and
• nuts, bolts, screws and flange plates (Electricity
Association of NSW 1997).
16 PART ONE
1-4
PART ONE 17
Corrosion of metal structures can cause an increase
in operating costs, an increase in maintenance costs,
a reduction in expected lifespans, or a combination
of all three. More importantly, system safety and
reliability can be compromised, and the local
environment can be contaminated if any spill of toxic
chemicals occurs because of a corrosion-induced
leak (Electricity Association of NSW 1997).
Miscellaneous
While not strictly infrastructure, high saline
watertables can also have an adverse impact on
urban lawns, gardens, street trees, sporting fields and
parklands. The symptoms are often the same as for
agricultural production, and can include the decline
or death of the salt-sensitive turf, shrub and tree
species, and waterlogged playing areas. Depending
on the severity of the impacts, some areas may no
longer be suitable for their intended use and may be
either downgraded or abandoned. Soggy backyards
can also be found where rubble pits associated with
septic tanks are no longer functioning effectively.
To address this problem, households, businesses,
and local governments often apply higher rates of
fertiliser and seed in an attempt to mask the adverse
impacts of ‘sick’ lawns, replace salt-sensitive shrubs
and trees with more salt tolerant species, or install
sub-surface drainage to lower the watertable. In
worst-case scenarios, the affected areas are simply
covered up by landscaping such as concrete or brick
and clay pavers.
Similarly, high watertables can cause problems with
cellars and grain silo loading hoppers located below
ground level. These structures frequently fill with
water and require continuous pumping.
4.3 EnvironmentThe Murray-Darling Basin is home to significant
biodiversity on both public and private land, and
in rivers, streams and wetlands. Dryland salinity is
impacting on some of these areas, and is increasing
pressures on endangered species and ecological
communities.
The purpose of this section is to draw on published
and unpublished information, GIS analysis of
environmental datasets and recent output from the
National Land and Water Resources Audit to highlight
how salinity is adversely affecting the natural
environment across the Basin. Much of the text
draws from the 1997 ABARE report entitled ‘Loddon
and Campaspe catchments: Costs of salinity and
high watertables to the environment’ and the final
report on this ‘Cost of dryland salinity’ project by
Wilson (2003).
A more detailed discussion on the environmental
impacts of salinity in each catchment across the
Basin is presented in the regional-level project
reports listed in Section 9 and available on-line at
www.ndsp.gov.au. Further information can also
be obtained from the biodiversity reports by the
Standing Committee on Conservation Task Force
(2001) and the National Land and Water Resources
Audit (2002).
4.3.1 Terrestrial impacts
Naturally occurring saline soils and salt pans
have always been a feature of the Murray-Darling
Basin. However, widespread clearing of the native
vegetation and its replacement with shallow-
rooted crop and pastures species has contributed
to groundwater rises and a substantial increase in
the extent and severity of dryland salting across
the Basin.
Apart from the obvious direct economic costs
associated with large areas of land either affected
by high saline watertables or at risk, there is the
less obvious impact on the remnant vegetation in
these areas.
A large proportion of remnant vegetation remaining
in catchments occurs on public land in blocks or
along roadsides and railway lines. These remaining
sites provide refuge for plants and animals and act
as corridors to permit wildlife to travel between
habitats. In addition, large areas of remnant
vegetation are used for recreational and commercial
activities such as bush walking, bird watching,
and timber, honey and wildflower harvesting. The
impacts of salinity are magnified as little regeneration
of native vegetation occurs in most catchments.
Following the widespread clearing of native
woodlands and grasslands that has occurred in the
Gwydir, Namoi and NSW Border River catchments
for example, many of the remaining areas are now
home to a wide variety of shrubs and groundcovers
that are listed in urgent need of conservation
and protection. Many of these remaining areas
correspond to those same areas that are currently
subject to high watertables or at risk from developing
high watertables and salinity over the next 30 years
(Wilson 2003).
Similarly along the South Australian Murray
floodplain, an estimated 25,000 hectares (or 25
18 PART ONE
1-4
PART ONE 19
per cent of the total area) are visibly salt affected
(MDBMC 1999). This vegetation provides a critical
habitat for many of the region’s remaining flora and
fauna of important conservation value, as well as
important movement corridors for other species.
The predicted expansion of dryland and urban
salinity across most areas of the Basin over the
next 100 years will only exacerbate the extent and
severity of salinity impacts on remnant vegetation
in the region.
4.3.2 Threatened fauna and flora impacts
Individual floral species vary in their tolerance to
salinity. While some species are remarkably tolerant,
many are adversely affected by salinity to varying
degrees. At sufficiently high levels, salt-sensitive
vegetation may disappear completely from affected
areas, which may in turn have direct implications
on the biodiversity value of affected landscapes
(Wilson 2003).
Recent research conducted as part of the National
Land and Water Resources Audit suggests that the
current impact of salinity on fauna and flora in the
Victorian catchments may be significant. Specifically,
following an assessment of the recorded sightings of
Victorian rare or threatened fauna and flora species,
it was observed that many species have been
recorded at locations subject to high watertables.
In the Victorian Mallee for example, 42 of Victoria’s
rare or threatened fauna species (including the
Malleefowl, Mallee emu-wren and Regent Parrot)
and 27 rare or endangered flora species have been
sighted at locations where the watertable is less
than two metres from the soil surface (Wilson 2003).
Similarly, in the Goulburn-Broken Region, 40 species
of fauna and 16 species of fauna listed as rare and
endangered have been recorded at sites with shallow
watertables (Wilson 2001).
4.3.3 River and stream salinity impacts
Rivers and streams have a critical environmental
value by providing a habitat for various in-stream
fauna and riparian vegetation. They also provide
important commercial, recreational and educational
values. Salinity is increasingly expressed in riparian
environments because of increased salt loads in
the Basin’s waterways and because they frequently
intersect saline groundwater discharge points (due
to their location in catchments).
The environmental impact of saline rivers and
streams will vary from one site to another, and
will be influenced by several factors including the
duration of raised salinity levels, the magnitude
of salinity peaks, the diversity of species using
the site, and the nutrient status of the water. In
general, however, increasing salinity levels will
often be associated with a decline in the numbers
and diversity of species present (Wilson, 2002). On
the whole, these impacts are likely to be greater
than the corresponding impacts in the dryland parts
of catchments due to diverse nature of riparian
environments.
At present, the quality of water flowing through the
Basin’s main rivers is fair to moderate, with median
and flow weighted average stream salinity levels
generally falling below 550 EC (Table 2). Despite
this, very high salinity levels continue to be an issue
in many of the smaller sub-catchment tributaries,
particularly during the summer and autumn months.
In the 17 smaller tributaries above Wagga Wagga, for
example, some are contributing the highest salt loads
per unit area found in the NSW component of the
Murray-Darling Basin.
Photo: Salt Action NSW
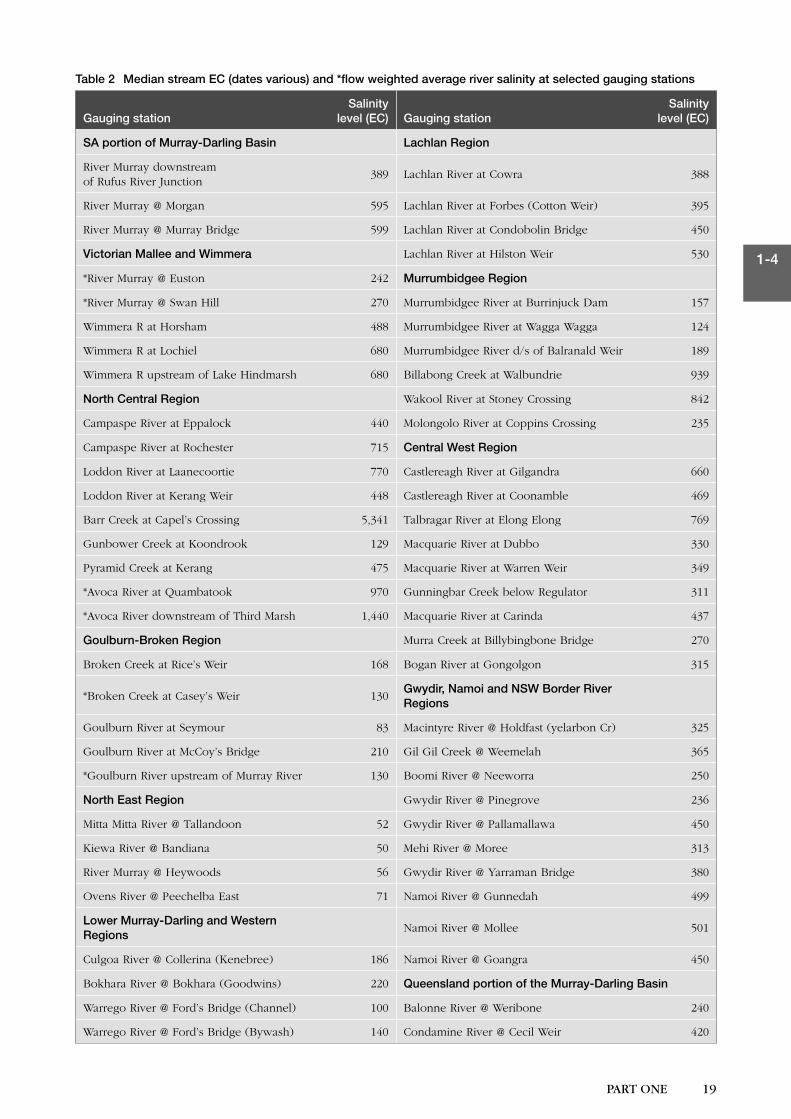
18 PART ONE
1-4
PART ONE 19
Table 2 Median stream EC (dates various) and *flow weighted average river salinity at selected gauging stations
Gauging stationSalinity
level (EC) Gauging stationSalinity
level (EC)
SA portion of Murray-Darling Basin Lachlan Region
River Murray downstream of Rufus River Junction
389 Lachlan River at Cowra 388
River Murray @ Morgan 595 Lachlan River at Forbes (Cotton Weir) 395
River Murray @ Murray Bridge 599 Lachlan River at Condobolin Bridge 450
Victorian Mallee and Wimmera Lachlan River at Hilston Weir 530
*River Murray @ Euston 242 Murrumbidgee Region
*River Murray @ Swan Hill 270 Murrumbidgee River at Burrinjuck Dam 157
Wimmera R at Horsham 488 Murrumbidgee River at Wagga Wagga 124
Wimmera R at Lochiel 680 Murrumbidgee River d/s of Balranald Weir 189
Wimmera R upstream of Lake Hindmarsh 680 Billabong Creek at Walbundrie 939
North Central Region Wakool River at Stoney Crossing 842
Campaspe River at Eppalock 440 Molongolo River at Coppins Crossing 235
Campaspe River at Rochester 715 Central West Region
Loddon River at Laanecoortie 770 Castlereagh River at Gilgandra 660
Loddon River at Kerang Weir 448 Castlereagh River at Coonamble 469
Barr Creek at Capel’s Crossing 5,341 Talbragar River at Elong Elong 769
Gunbower Creek at Koondrook 129 Macquarie River at Dubbo 330
Pyramid Creek at Kerang 475 Macquarie River at Warren Weir 349
*Avoca River at Quambatook 970 Gunningbar Creek below Regulator 311
*Avoca River downstream of Third Marsh 1,440 Macquarie River at Carinda 437
Goulburn-Broken Region Murra Creek at Billybingbone Bridge 270
Broken Creek at Rice’s Weir 168 Bogan River at Gongolgon 315
*Broken Creek at Casey’s Weir 130Gwydir, Namoi and NSW Border River Regions
Goulburn River at Seymour 83 Macintyre River @ Holdfast (yelarbon Cr) 325
Goulburn River at McCoy’s Bridge 210 Gil Gil Creek @ Weemelah 365
*Goulburn River upstream of Murray River 130 Boomi River @ Neeworra 250
North East Region Gwydir River @ Pinegrove 236
Mitta Mitta River @ Tallandoon 52 Gwydir River @ Pallamallawa 450
Kiewa River @ Bandiana 50 Mehi River @ Moree 313
River Murray @ Heywoods 56 Gwydir River @ Yarraman Bridge 380
Ovens River @ Peechelba East 71 Namoi River @ Gunnedah 499
Lower Murray-Darling and Western Regions
Namoi River @ Mollee 501
Culgoa River @ Collerina (Kenebree) 186 Namoi River @ Goangra 450
Bokhara River @ Bokhara (Goodwins) 220 Queensland portion of the Murray-Darling Basin
Warrego River @ Ford’s Bridge (Channel) 100 Balonne River @ Weribone 240
Warrego River @ Ford’s Bridge (Bywash) 140 Condamine River @ Cecil Weir 420
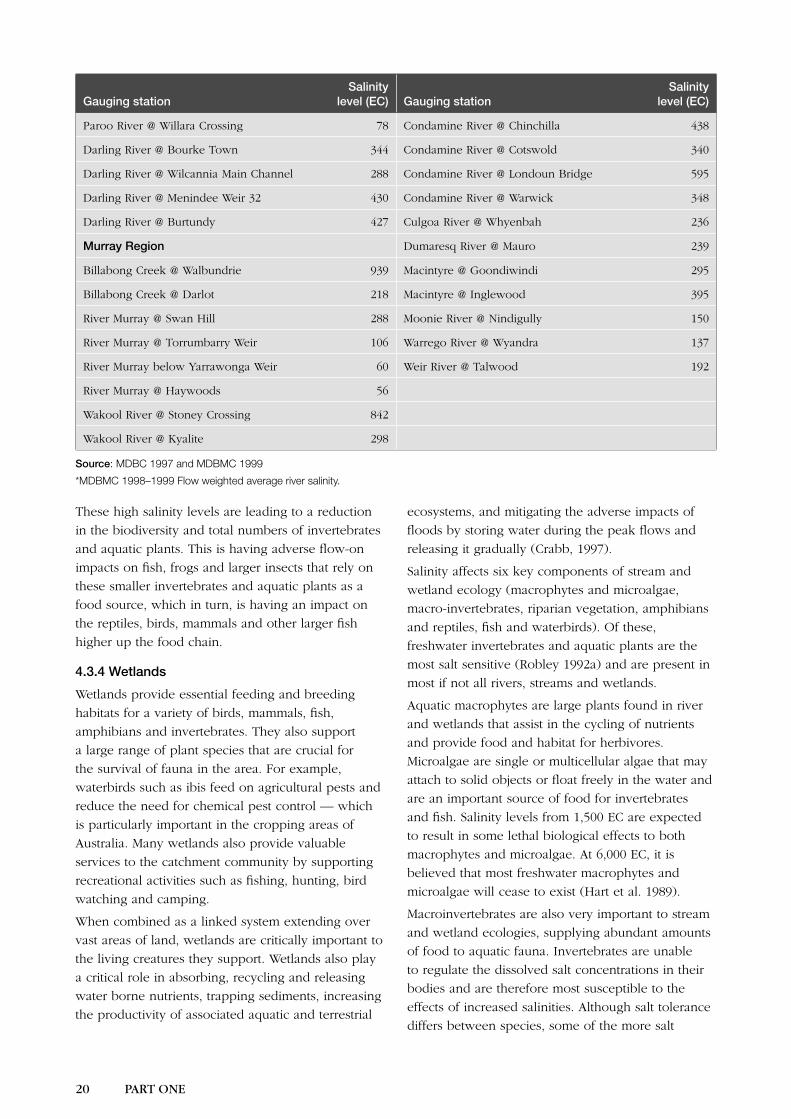
20 PART ONE
1-4
PART ONE 21
Gauging stationSalinity
level (EC) Gauging stationSalinity
level (EC)
Paroo River @ Willara Crossing 78 Condamine River @ Chinchilla 438
Darling River @ Bourke Town 344 Condamine River @ Cotswold 340
Darling River @ Wilcannia Main Channel 288 Condamine River @ Londoun Bridge 595
Darling River @ Menindee Weir 32 430 Condamine River @ Warwick 348
Darling River @ Burtundy 427 Culgoa River @ Whyenbah 236
Murray Region Dumaresq River @ Mauro 239
Billabong Creek @ Walbundrie 939 Macintyre @ Goondiwindi 295
Billabong Creek @ Darlot 218 Macintyre @ Inglewood 395
River Murray @ Swan Hill 288 Moonie River @ Nindigully 150
River Murray @ Torrumbarry Weir 106 Warrego River @ Wyandra 137
River Murray below Yarrawonga Weir 60 Weir River @ Talwood 192
River Murray @ Haywoods 56
Wakool River @ Stoney Crossing 842
Wakool River @ Kyalite 298
Source: MDBC 1997 and MDBMC 1999
*MDBMC 1998–1999 Flow weighted average river salinity.
These high salinity levels are leading to a reduction
in the biodiversity and total numbers of invertebrates
and aquatic plants. This is having adverse flow-on
impacts on fish, frogs and larger insects that rely on
these smaller invertebrates and aquatic plants as a
food source, which in turn, is having an impact on
the reptiles, birds, mammals and other larger fish
higher up the food chain.
4.3.4 Wetlands
Wetlands provide essential feeding and breeding
habitats for a variety of birds, mammals, fish,
amphibians and invertebrates. They also support
a large range of plant species that are crucial for
the survival of fauna in the area. For example,
waterbirds such as ibis feed on agricultural pests and
reduce the need for chemical pest control — which
is particularly important in the cropping areas of
Australia. Many wetlands also provide valuable
services to the catchment community by supporting
recreational activities such as fishing, hunting, bird
watching and camping.
When combined as a linked system extending over
vast areas of land, wetlands are critically important to
the living creatures they support. Wetlands also play
a critical role in absorbing, recycling and releasing
water borne nutrients, trapping sediments, increasing
the productivity of associated aquatic and terrestrial
ecosystems, and mitigating the adverse impacts of
floods by storing water during the peak flows and
releasing it gradually (Crabb, 1997).
Salinity affects six key components of stream and
wetland ecology (macrophytes and microalgae,
macro-invertebrates, riparian vegetation, amphibians
and reptiles, fish and waterbirds). Of these,
freshwater invertebrates and aquatic plants are the
most salt sensitive (Robley 1992a) and are present in
most if not all rivers, streams and wetlands.
Aquatic macrophytes are large plants found in river
and wetlands that assist in the cycling of nutrients
and provide food and habitat for herbivores.
Microalgae are single or multicellular algae that may
attach to solid objects or float freely in the water and
are an important source of food for invertebrates
and fish. Salinity levels from 1,500 EC are expected
to result in some lethal biological effects to both
macrophytes and microalgae. At 6,000 EC, it is
believed that most freshwater macrophytes and
microalgae will cease to exist (Hart et al. 1989).
Macroinvertebrates are also very important to stream
and wetland ecologies, supplying abundant amounts
of food to aquatic fauna. Invertebrates are unable
to regulate the dissolved salt concentrations in their
bodies and are therefore most susceptible to the
effects of increased salinities. Although salt tolerance
differs between species, some of the more salt
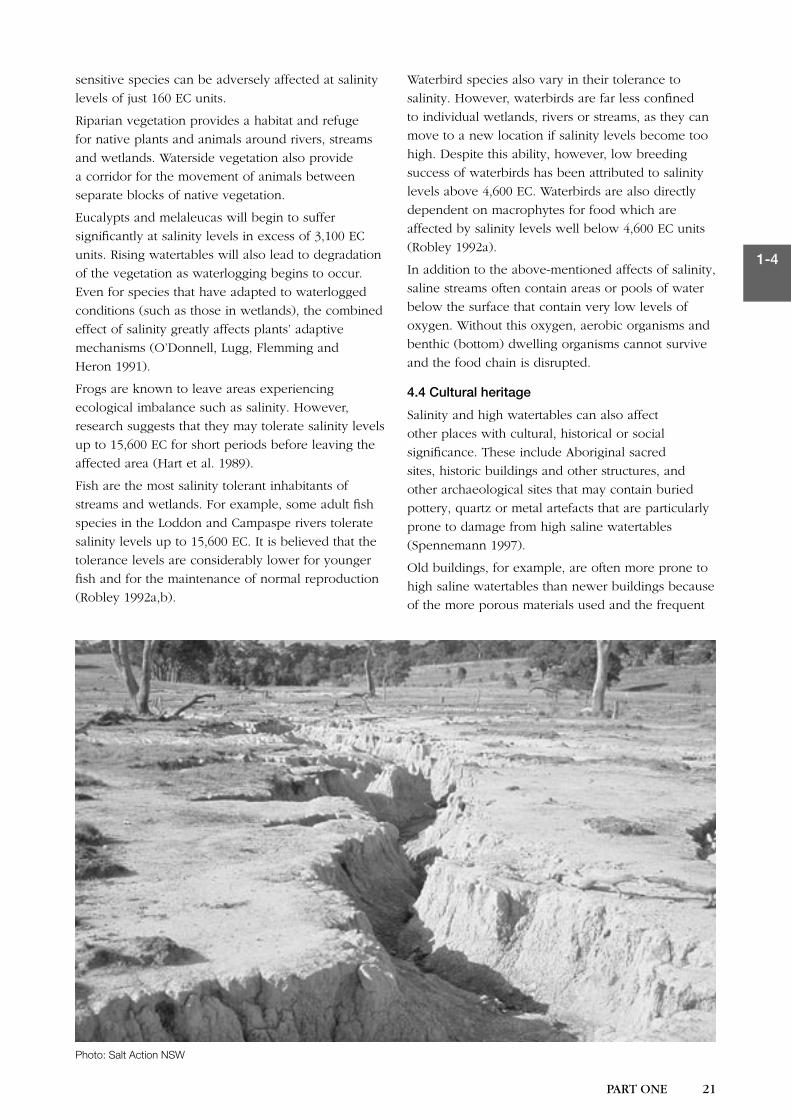
20 PART ONE
1-4
PART ONE 21
sensitive species can be adversely affected at salinity
levels of just 160 EC units.
Riparian vegetation provides a habitat and refuge
for native plants and animals around rivers, streams
and wetlands. Waterside vegetation also provide
a corridor for the movement of animals between
separate blocks of native vegetation.
Eucalypts and melaleucas will begin to suffer
significantly at salinity levels in excess of 3,100 EC
units. Rising watertables will also lead to degradation
of the vegetation as waterlogging begins to occur.
Even for species that have adapted to waterlogged
conditions (such as those in wetlands), the combined
effect of salinity greatly affects plants’ adaptive
mechanisms (O’Donnell, Lugg, Flemming and
Heron 1991).
Frogs are known to leave areas experiencing
ecological imbalance such as salinity. However,
research suggests that they may tolerate salinity levels
up to 15,600 EC for short periods before leaving the
affected area (Hart et al. 1989).
Fish are the most salinity tolerant inhabitants of
streams and wetlands. For example, some adult fish
species in the Loddon and Campaspe rivers tolerate
salinity levels up to 15,600 EC. It is believed that the
tolerance levels are considerably lower for younger
fish and for the maintenance of normal reproduction
(Robley 1992a,b).
Waterbird species also vary in their tolerance to
salinity. However, waterbirds are far less confined
to individual wetlands, rivers or streams, as they can
move to a new location if salinity levels become too
high. Despite this ability, however, low breeding
success of waterbirds has been attributed to salinity
levels above 4,600 EC. Waterbirds are also directly
dependent on macrophytes for food which are
affected by salinity levels well below 4,600 EC units
(Robley 1992a).
In addition to the above-mentioned affects of salinity,
saline streams often contain areas or pools of water
below the surface that contain very low levels of
oxygen. Without this oxygen, aerobic organisms and
benthic (bottom) dwelling organisms cannot survive
and the food chain is disrupted.
4.4 Cultural heritage
Salinity and high watertables can also affect
other places with cultural, historical or social
significance. These include Aboriginal sacred
sites, historic buildings and other structures, and
other archaeological sites that may contain buried
pottery, quartz or metal artefacts that are particularly
prone to damage from high saline watertables
(Spennemann 1997).
Old buildings, for example, are often more prone to
high saline watertables than newer buildings because
of the more porous materials used and the frequent
Photo: Salt Action NSW
22 PART ONE
1-5
PART ONE 23
absence of effective damp proof barriers between the
foundations and the walls. These heritage buildings
are often associated with significant grounds and
gardens that can be damaged or destroyed by
high saline watertables. The loss or damage to
these gardens can further diminish the cultural
value of the properties and should not be ignored
(Salt Action 1997).
A more detailed discussion of the impacts of dryland
and urban salinity on cultural heritage in the Basin
can be found in the regional-level reports listed in
the ‘Reference’ section of this report and available
on-line at www.ndsp.gov.au.
4.5 Flow-on social impactsIn many areas of Australia, it is thought that salinity
is having flow-on social impacts on catchment
communities.
In saline areas, marginally profitable farmers may sell
up or supplement their income with off-farm work.
The opportunities for such work, however, will be
reduced if the region becomes more adversely
affected. Remaining farmers may be required
to expand their scale of operation to maintain
their financial status, or experience declining net
incomes. They may also be required to adopt
more conservative land management practices and
enterprises to minimise fluctuations in net farm
incomes, and to spend less on goods and services
(Tragowel Plains Sub-Regional Working Group 1989).
The loss of dryland agricultural income may also
generate flow-on effects on the outputs, incomes
and workforce of rural towns. Businesses supplying
agricultural goods or services may suffer declining
incomes due to a lower demand for their goods and
services, and this may result in job losses, business
closures, and population declines. Due to the lower
population, government authorities and banks may
then subsequently reduce (or remove completely)
the services provided to these rural centres, such as
public schools, post offices, libraries and hospitals
(Dumsday, Peglar and Oram 1989; Salinity Pilot
Program Advisory Council 1989). The cycle may
then continue with declines in population then
placing further pressure on the viability of businesses
supplying non-agricultural goods and services.
4.6 Are there any benefits from dryland salinity?
In some instances, there may be some benefits
to stakeholders from dryland salinity or high
watertables, namely:
• a reduction of pest populations (for example, some
environmental weeds have lower salinity thresholds
than indigenous vegetation)
• natural ‘irrigation’ of pastures and crops (this
is evident as patches of green grass during dry
summer periods)
• the conversion from unsustainable cropping to
sustainable grazing (for example using deep rooted
perennial pastures)
• production of aquaculture, betacarotene products,
and salt
• production of salt tolerant seeds, and
• reduced production of subsidised commodities
(this is uncommon in Australia, but it is not
impossible—for example, some dairying).
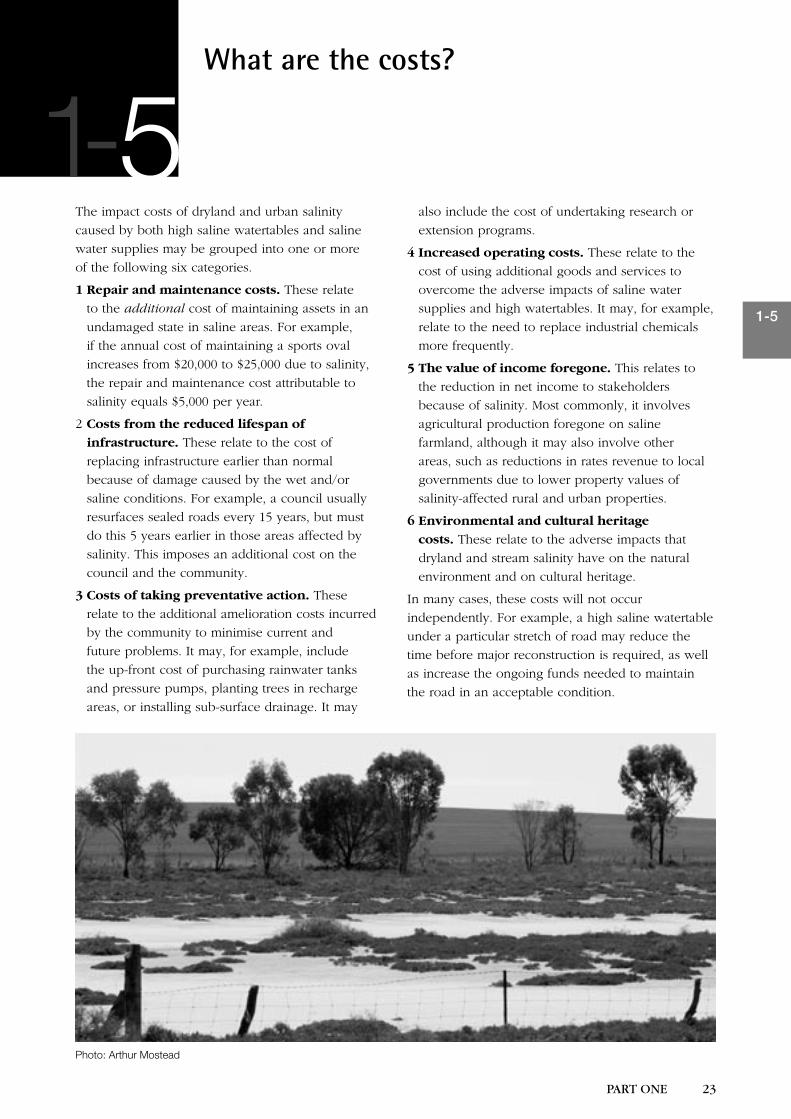
22 PART ONE
1-5
PART ONE 23
What are the costs?
The impact costs of dryland and urban salinity
caused by both high saline watertables and saline
water supplies may be grouped into one or more
of the following six categories.
1 Repair and maintenance costs. These relate
to the additional cost of maintaining assets in an
undamaged state in saline areas. For example,
if the annual cost of maintaining a sports oval
increases from $20,000 to $25,000 due to salinity,
the repair and maintenance cost attributable to
salinity equals $5,000 per year.
2 Costs from the reduced lifespan of
infrastructure. These relate to the cost of
replacing infrastructure earlier than normal
because of damage caused by the wet and/or
saline conditions. For example, a council usually
resurfaces sealed roads every 15 years, but must
do this 5 years earlier in those areas affected by
salinity. This imposes an additional cost on the
council and the community.
3 Costs of taking preventative action. These
relate to the additional amelioration costs incurred
by the community to minimise current and
future problems. It may, for example, include
the up-front cost of purchasing rainwater tanks
and pressure pumps, planting trees in recharge
areas, or installing sub-surface drainage. It may
also include the cost of undertaking research or
extension programs.
4 Increased operating costs. These relate to the
cost of using additional goods and services to
overcome the adverse impacts of saline water
supplies and high watertables. It may, for example,
relate to the need to replace industrial chemicals
more frequently.
5 The value of income foregone. This relates to
the reduction in net income to stakeholders
because of salinity. Most commonly, it involves
agricultural production foregone on saline
farmland, although it may also involve other
areas, such as reductions in rates revenue to local
governments due to lower property values of
salinity-affected rural and urban properties.
6 Environmental and cultural heritage
costs. These relate to the adverse impacts that
dryland and stream salinity have on the natural
environment and on cultural heritage.
In many cases, these costs will not occur
independently. For example, a high saline watertable
under a particular stretch of road may reduce the
time before major reconstruction is required, as well
as increase the ongoing funds needed to maintain
the road in an acceptable condition.
5
Photo: Arthur Mostead
1-
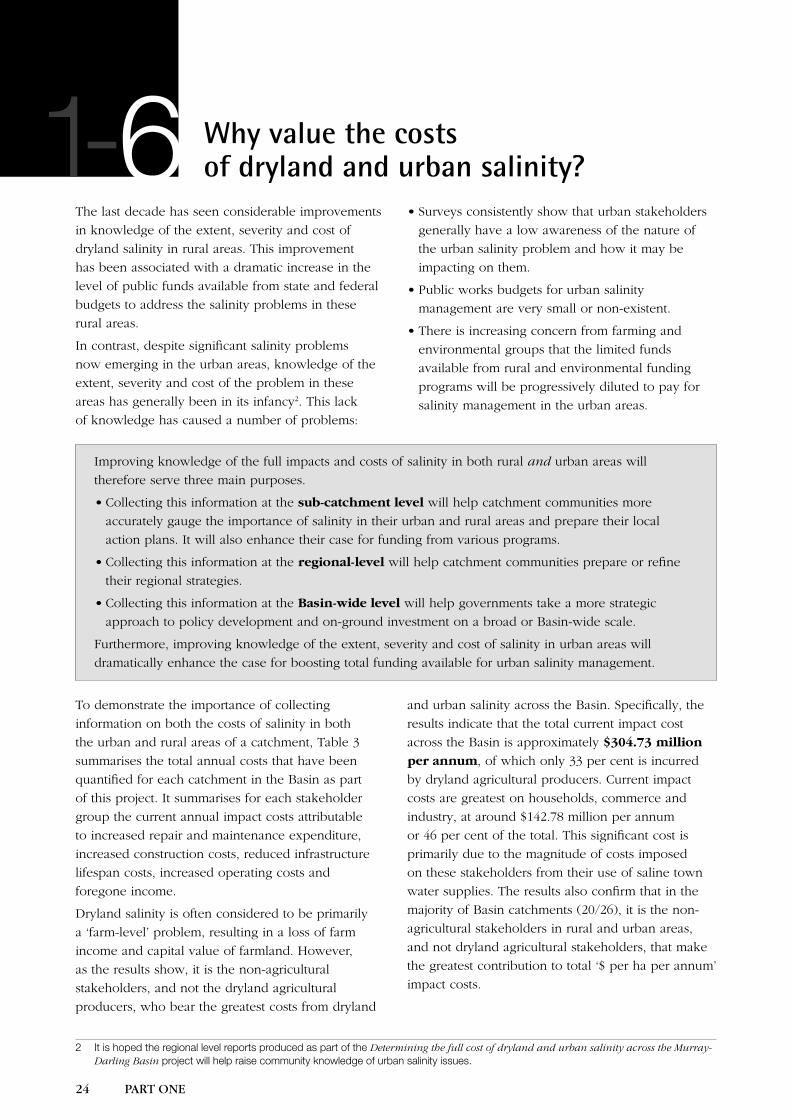
24 PART ONE
1-6
PART ONE 25
Why value the costs of dryland and urban salinity?
The last decade has seen considerable improvements
in knowledge of the extent, severity and cost of
dryland salinity in rural areas. This improvement
has been associated with a dramatic increase in the
level of public funds available from state and federal
budgets to address the salinity problems in these
rural areas.
In contrast, despite significant salinity problems
now emerging in the urban areas, knowledge of the
extent, severity and cost of the problem in these
areas has generally been in its infancy2. This lack
of knowledge has caused a number of problems:
• Surveys consistently show that urban stakeholders
generally have a low awareness of the nature of
the urban salinity problem and how it may be
impacting on them.
• Public works budgets for urban salinity
management are very small or non-existent.
• There is increasing concern from farming and
environmental groups that the limited funds
available from rural and environmental funding
programs will be progressively diluted to pay for
salinity management in the urban areas.
Improving knowledge of the full impacts and costs of salinity in both rural and urban areas will
therefore serve three main purposes.
• Collecting this information at the sub-catchment level will help catchment communities more
accurately gauge the importance of salinity in their urban and rural areas and prepare their local
action plans. It will also enhance their case for funding from various programs.
• Collecting this information at the regional-level will help catchment communities prepare or refine
their regional strategies.
• Collecting this information at the Basin-wide level will help governments take a more strategic
approach to policy development and on-ground investment on a broad or Basin-wide scale.
Furthermore, improving knowledge of the extent, severity and cost of salinity in urban areas will
dramatically enhance the case for boosting total funding available for urban salinity management.
To demonstrate the importance of collecting
information on both the costs of salinity in both
the urban and rural areas of a catchment, Table 3
summarises the total annual costs that have been
quantified for each catchment in the Basin as part
of this project. It summarises for each stakeholder
group the current annual impact costs attributable
to increased repair and maintenance expenditure,
increased construction costs, reduced infrastructure
lifespan costs, increased operating costs and
foregone income.
Dryland salinity is often considered to be primarily
a ‘farm-level’ problem, resulting in a loss of farm
income and capital value of farmland. However,
as the results show, it is the non-agricultural
stakeholders, and not the dryland agricultural
producers, who bear the greatest costs from dryland
and urban salinity across the Basin. Specifically, the
results indicate that the total current impact cost
across the Basin is approximately $304.73 million
per annum, of which only 33 per cent is incurred
by dryland agricultural producers. Current impact
costs are greatest on households, commerce and
industry, at around $142.78 million per annum
or 46 per cent of the total. This significant cost is
primarily due to the magnitude of costs imposed
on these stakeholders from their use of saline town
water supplies. The results also confirm that in the
majority of Basin catchments (20/26), it is the non-
agricultural stakeholders in rural and urban areas,
and not dryland agricultural stakeholders, that make
the greatest contribution to total ‘$ per ha per annum’
impact costs.
2 It is hoped the regional level reports produced as part of the Determining the full cost of dryland and urban salinity across the Murray-Darling Basin project will help raise community knowledge of urban salinity issues.
61-
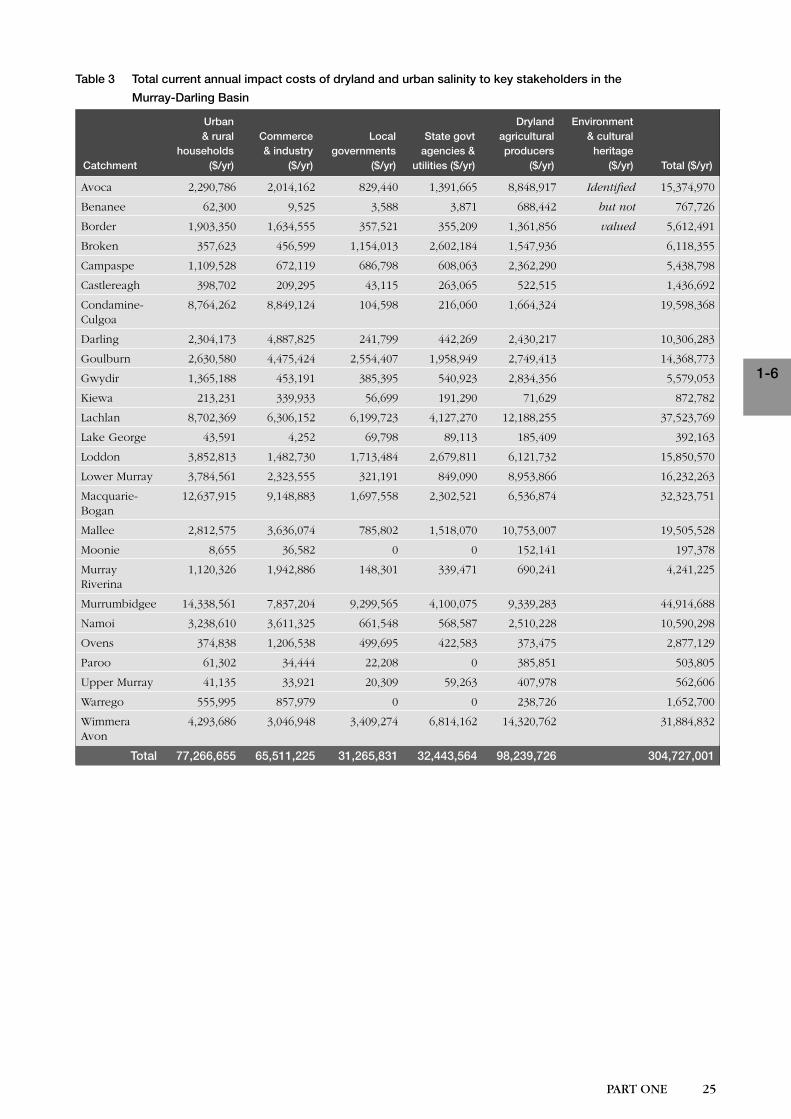
24 PART ONE
1-6
PART ONE 25
Table 3 Total current annual impact costs of dryland and urban salinity to key stakeholders in the
Murray-Darling Basin
Catchment
Urban & rural
households ($/yr)
Commerce & industry
($/yr)
Local governments
($/yr)
State govt agencies &
utilities ($/yr)
Dryland agricultural producers
($/yr)
Environment & cultural
heritage ($/yr) Total ($/yr)
Avoca 2,290,786 2,014,162 829,440 1,391,665 8,848,917 Identified 15,374,970
Benanee 62,300 9,525 3,588 3,871 688,442 but not 767,726
Border 1,903,350 1,634,555 357,521 355,209 1,361,856 valued 5,612,491
Broken 357,623 456,599 1,154,013 2,602,184 1,547,936 6,118,355
Campaspe 1,109,528 672,119 686,798 608,063 2,362,290 5,438,798
Castlereagh 398,702 209,295 43,115 263,065 522,515 1,436,692
Condamine-Culgoa
8,764,262 8,849,124 104,598 216,060 1,664,324 19,598,368
Darling 2,304,173 4,887,825 241,799 442,269 2,430,217 10,306,283
Goulburn 2,630,580 4,475,424 2,554,407 1,958,949 2,749,413 14,368,773
Gwydir 1,365,188 453,191 385,395 540,923 2,834,356 5,579,053
Kiewa 213,231 339,933 56,699 191,290 71,629 872,782
Lachlan 8,702,369 6,306,152 6,199,723 4,127,270 12,188,255 37,523,769
Lake George 43,591 4,252 69,798 89,113 185,409 392,163
Loddon 3,852,813 1,482,730 1,713,484 2,679,811 6,121,732 15,850,570
Lower Murray 3,784,561 2,323,555 321,191 849,090 8,953,866 16,232,263
Macquarie-Bogan
12,637,915 9,148,883 1,697,558 2,302,521 6,536,874 32,323,751
Mallee 2,812,575 3,636,074 785,802 1,518,070 10,753,007 19,505,528
Moonie 8,655 36,582 0 0 152,141 197,378
Murray Riverina
1,120,326 1,942,886 148,301 339,471 690,241 4,241,225
Murrumbidgee 14,338,561 7,837,204 9,299,565 4,100,075 9,339,283 44,914,688
Namoi 3,238,610 3,611,325 661,548 568,587 2,510,228 10,590,298
Ovens 374,838 1,206,538 499,695 422,583 373,475 2,877,129
Paroo 61,302 34,444 22,208 0 385,851 503,805
Upper Murray 41,135 33,921 20,309 59,263 407,978 562,606
Warrego 555,995 857,979 0 0 238,726 1,652,700
Wimmera Avon
4,293,686 3,046,948 3,409,274 6,814,162 14,320,762 31,884,832
Total 77,266,655 65,511,225 31,265,831 32,443,564 98,239,726 304,727,001
26 PART ONE
1-7
PART ONE 27
How do these guidelines assist local action planning?
Local action plans are prepared at a catchment or
sub-catchment level to help catchment communities
understand the major biophysical and socio-
economic processes occurring in the area, and to
identify the best solutions for addressing the natural
resource management issues confronting them. These
plans may cover an area from 10,000 hectares to over
2,000,000 hectares in the case of the Murray Mallee
Local Action Planning area in South Australia.
There are several key steps involved in the local
action planning process and these are summarised
in Figure 2. Also shown in this diagram is how these
guidelines (prepared as part of the Determining
the full cost of dryland and urban salinity across
the Murray-Darling Basin project), and three
other MDBC funded projects, provide the tools to
help catchment communities work through this
planning process.
7
Readers interested in learning more about the related ‘Tools’ and ‘Catchment Classification’ projects
should refer to www.ndsp.gov.au Similarly, the MDBC Discussion Paper entitled ‘Cost Sharing for On-
Ground Works’ (1996) can be obtained from the Murray-Darling Basin Commission ([email protected]).
Readers interested in learning more about preparing natural resource management and local action plans
at the sub-catchment, catchment or regional scale should consider reading the following documents:
• Guide to Catchment Management Committees and Assessment Panels for preparing and assessing
submissions for funding from the Natural Resources Management Strategy (MDBC 2001).
• Natural resource management planning framework for the Murrumbidgee River catchment (see
insert in the Murrumbidgee Catchment Action Plan) (Murrumbidgee Catchment Management
Committee 1998).
• Guidelines for review and renewal of action plans/sub-strategies to the regional catchment strategy
(Victorian Dept of Natural Resources and Environment 2002).
• Local action planning resource folder (South Australian Community Action for the Rural Environment
Program 1997).
• Guidelines for the preparation of salinity management plans (Victorian State Salinity Program 1988).
• National Action Plan for Salinity and Water Quality (2002).
• Commonwealth-State Bilateral Agreements for the National Action Plan for Salinity and Water Quality.
A fully worked example of how the information
arising from the ‘Tools’, ‘Catchment Classification’,
‘Cost sharing’ and Determining the full cost of
dryland and urban salinity across the Murray-
Darling Basin projects can be brought together
to help work through the steps outlined in Figure
2 appear in a recent report by Wilson Land
Management Services and Ivey ATP (2002b).
This report to the Glenelg-Hopkins Catchment
Management Authority presents:
• a full economic assessment of the impacts and
costs of salinity across the Glenelg-Hopkins
catchment over a 30-year ‘No-Plan’ scenario
• the likely public and private benefits and costs
of implementing a detailed 30-year program of
on-ground works to address this problem
• a discussion of the sensitivity of the final
recommendations to changes in the underlying
assumptions, and
• a discussion of implementation priorities and
appropriate cost sharing arrangements.
1-
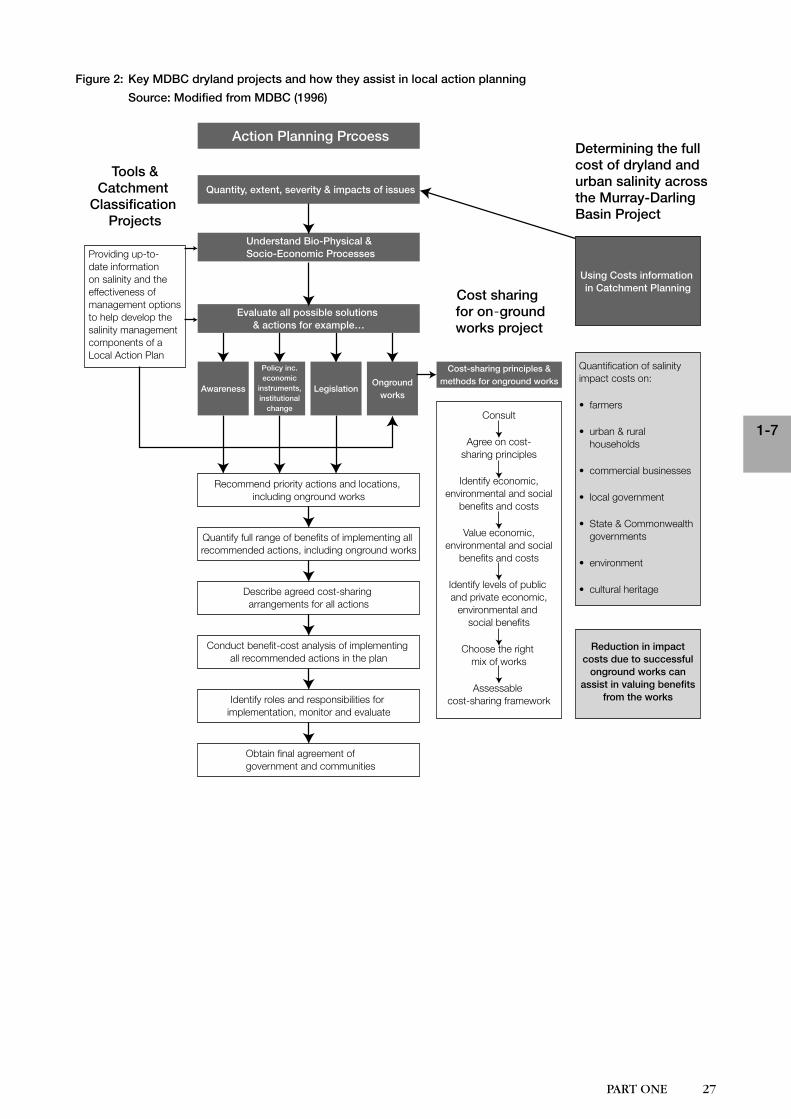
26 PART ONE
1-7
PART ONE 27
Figure 2: Key MDBC dryland projects and how they assist in local action planning
Source: Modified from MDBC (1996)
28 PART ONE
1-9
PART ONE 29
How do you assess the costs of dryland and urban salinity?
This section introduces the issues involved in assessing the impacts and costs of dryland and urban
salinity in a particular catchment. Full details on the range of techniques available to value the costs of
dryland and urban salinity in a catchment appear in Part 2 of these guidelines.
There are a variety of approaches that can be used
to assess the impacts and costs of dryland and urban
salinity, and each is associated with different levels of
accuracy (and hence cost). When deciding what mix
is most suitable, however, the catchment community
must first work through the following check-list:
1 What information do you actually need?
For example, do you need information on the
impact costs of dryland to feed into a ‘No-Plan’
scenario, do you need information on the costs and
benefits of implementing a range of ‘abatement’
options as part of a ‘With-Plan’ scenario, or do you
need information on both?
2 What level of detail will meet your needs?
For example, do you only need an ‘order of
magnitude’ estimate of the cost of dryland and
urban salinity in your catchment to help assess the
relative importance of dryland and urban salinity
to your community, or do you need more detailed
information to make a specific investment decision?
3 What relevant information is already available
and what are the gaps?
Before launching into a study of the costs of
dryland and urban salinity, it will be important to:
• compile all relevant existing information
• assess how useful the information is
(i.e. is it accurate and up-to-date), and
• identify what information still needs to
be collected.
4 What other useful information is available?
In many instances, access to supporting
information will help identify those areas where
efforts need to be focussed, or to improve the
accuracy of information previously compiled.
While not an exhaustive list, the information
that may be particularly useful includes GIS
datasets or other maps showing the location
and distribution of:
• the catchment and sub-catchment boundaries
• local government boundaries
• current areas of dryland and urban
salinity outbreaks
• current areas of high watertables
• areas at risk of rising high watertables
• land use (dryland agricultural and urban/
industrial)
• land capability
• current and predicted population
• urban centres and localities
• dryland agricultural productivity
• public utilities such as roads, bridges, railway
lines and power lines
• houses
• wetlands, streams and rivers
• areas of high natural, historic or aboriginal
significance.
81-
28 PART ONE
1-9
PART ONE 29
ReferencesKey ‘Determining the full cost of dryland and urban salinity across the Murray-Darling Basin’ project reportsAs part of the Determining the full cost of dryland
and urban salinity across the Murray-Darling Basin
project, many of the recommended methodologies
contained in Part 2 of these guidelines have been
implemented. The end result is numerous regional-
level reports that describe the current impacts
and costs of dryland and urban salinity to various
stakeholders, the environment and cultural heritage
across all 26 catchments in the Murray-Darling Basin.
Two other reports have also been prepared that
present ‘costs’ data for two trial catchments located
outside the Basin.
These reports are listed below. If you would like to
access these reports, they are available on the NDSP
website (www.ndsp.gov.au).
All reports were prepared in four distinct batches:
• Batch 1 reports present results for 10 catchments in
NSW and Victoria
• Batch 2 reports present results for the 2 trial
catchments located outside the Murray-Darling
Basin
• Batch 3 reports present results for the South
Australian catchments as well as the remaining
Victorian catchments that were not analysed in
Batch 1
• Batch 4 reports present results for the Queensland
catchments as well as the remaining NSW
catchments that were not analysed in Batch 1.
Batch 1: Study of dryland and urban salinity in the Murrumbidgee, Lachlan, Central West, Goulburn-Broken and North Central Catchment Management Regions
Ivey ATP 2001, The cost of dryland salinity to
agricultural landholders in selected NSW and
Victorian catchments, Report to the Murray-Darling
Basin Commission and National Dryland Salinity
Program, Wellington, NSW.
Wilson, S.M. 2000, Assessing the cost of dryland
salinity to non-agricultural stakeholders across
selected Victorian and NSW catchments: A
methodology report, Report to the Murray-Darling
Basin Commission and National Dryland Salinity
Program, Canberra.
Wilson, S.M. 2001a, Dryland salinity: What are
the costs to non-agricultural stakeholders?: North
Central Region, Report to the Murray-Darling Basin
Commission and National Dryland Salinity Program,
Canberra.
Wilson, S.M. 2001b, Dryland salinity: What are the
costs to non-agricultural stakeholders?: Goulburn-
Broken Region, Report to the Murray-Darling Basin
Commission and National Dryland Salinity Program,
Canberra.
Wilson, S.M. 2001c, Dryland salinity: What are
the costs to non-agricultural stakeholders?: Central
West Region, Report to the Murray-Darling Basin
Commission and National Dryland Salinity Program,
Canberra.
Wilson, S.M. 2001d, Dryland salinity: What
are the costs to non-agricultural stakeholders?:
Murrumbidgee Region, Report to the Murray-Darling
Basin Commission and National Dryland Salinity
Program, Canberra.
Wilson, S.M, 2001e, Dryland salinity: What are the
costs to non-agricultural stakeholders?: Lachlan
Region, Report to the Murray-Darling Basin
Commission and National Dryland Salinity Program,
Canberra.
Pelikan, M.R.P. 2000. Cost of dryland salinity: GIS
Methodology Paper, Report to the Murray-Darling
Basin Commission.
Batch 2: Trials outside Basin
Wilson Land Management Services and Ivey ATP
2001a, Dryland salinity—What are the current
impacts & costs in the Mount Pleasant sub-catchment
of the River Torrens (SA)?, Report to the Murray-
Darling Basin Commission and National Dryland
Salinity Program, Canberra.
Wilson Land Management Services and Ivey ATP
2001b, Dryland salinity—What are the current
impacts & costs in the Lower Fitzroy catchment?,
91-
30 PART ONE
1-9
PART ONE 31
Report to the Murray-Darling Basin Commission and
National Dryland Salinity Program, Canberra.
Batch 3: Study of dryland and urban salinity in the
remaining South Australian and Victorian
catchments
Ivey ATP 2002a, The current cost of dryland salinity
to agricultural landholders: Upper Murray, Ovens,
Kiewa, Mallee, Wimmera-Avon, Murray-Riverina,
and Lower Murray catchments, Report to the Murray-
Darling Basin Commission and National Dryland
Salinity Program, Wellington, NSW.
Wilson S.M. 2002b, Assessing the costs of dryland
salinity to non-agricultural stakeholders, the
environment and cultural heritage in selected
catchments across the Murray-Darling Basin—
Methodology report 2, Report to the Murray-Darling
Basin Commission and the National Dryland Salinity
Program, Canberra.
Wilson, S.M. 2002c, Dryland salinity—What are the
impacts & costs to non-agricultural stakeholders, the
environment and cultural heritage: SA portion of the
Murray-Darling Basin, Report to the Murray-Darling
Basin Commission and the National Dryland Salinity
Program, Canberra.
Wilson, S.M. 2002d, Dryland salinity—What are the
impacts & costs to non-agricultural stakeholders, the
environment and cultural heritage: Victorian Mallee
and Wimmera-Avon River catchments, Report to the
Murray-Darling Basin Commission and the National
Dryland Salinity Program, Canberra.
Wilson, S.M. 2002e, Dryland salinity —The current
impacts & costs to non-agricultural stakeholders,
the environment and cultural heritage: North East
Region of Victoria, Report to the Murray-Darling
Basin Commission and the National Dryland Salinity
Program, Canberra.
Batch 4: Study of dryland and urban salinity in the remaining New South Wales and Queensland catchments
Ivey ATP, 2002b, The current cost of dryland salinity
to agricultural landholders: Benanee, Border,
Condamine-Culgoa, Darling, Gwydir, Lake George,
Moonie, Paroo and Warrego River Catchments,
Report to the Murray-Darling Basin Commission and
National Dryland Salinity Program, Wellington, NSW.
Wilson, S.M. 2002f, Dryland salinity—The current
impacts & costs to non-agricultural stakeholders, the
environment and cultural heritage: Lower Murray-
Darling and Western Regions, Report to the Murray-
Darling Basin Commission and the National Dryland
Salinity Program, Canberra.
Wilson, S.M. 2002g, Dryland salinity—The current
impacts & costs to non-agricultural stakeholders, the
environment and cultural heritage: Murray Region,
Report to the Murray-Darling Basin Commission and
the National Dryland Salinity Program, Canberra.
Wilson, S.M. 2002h, Dryland salinity—The current
impacts & costs to non-agricultural stakeholders,
the environment and cultural heritage: Gwydir,
Namoi and NSW Border Rivers Regions, Report to the
Murray-Darling Basin Commission and the National
Dryland Salinity Program, Canberra.
Photo: Arthur Mostead
30 PART ONE
1-9
PART ONE 31
Wilson, S.M. 2002i, Dryland salinity—The current
impacts & costs to non-agricultural stakeholders,
the environment and cultural heritage: Queensland
Portion of the Murray-Darling Basin, Report to the
Murray-Darling Basin Commission and the National
Dryland Salinity Program, Canberra.
Saline water cost function study
Wilson S.M. and Ivey-ATP 2002, Validation and
refinement of the Gutteridge, Haskins and Davey
saline water cost functions, Report to the Murray-
Darling Basin Commission, Canberra.
Final project report
Wilson S.M. 2003, Determining the full costs of
dryland and urban salinity across the Murray-
Darling Basin, MDBC Project D9008, Final project
report, A Wilson Land Management Services Pty Ltd
report to the Murray-Darling Basin Commission and
National Dryland Salinity Program, Canberra.
MDBC dryland salinity report
Murray-Darling Basin Commission 2003, Dryland and
urban salinity: An assessment of current impacts and
costs across the Murray-Darling Basin, Canberra.
Other sourcesAACM 1996, Guide to cost-sharing for on-ground
works, Report the Murray-Darling Basin Commission,
Adelaide.
ABARE 1997, Guidelines for quantifying the costs of
dryland salinity and high watertables, In-Confidence
ABARE report to the Murray-Darling Basin
Commission, Canberra.
Cox, S.A. and Dillon, B.I. 1982, Summary on effects
of salinity on municipal and industrial consumers in
respect to the Murray River, South Australia. Stage II.
The effect of salinity on domestic consumers, AMDEL
Progress Report No. 2.
Crabb, P. 1997, Murray-Darling Basin Resources,
Murray-Darling Basin Commission, Canberra.
Hall, N. and Watson, B. 1998, On-farm impacts of
acid, sodic and saline soils in the Loddon-Campaspe
catchment, Report to the Cooperative Research
Centre for Soil and Land Management, Canberra.
Hill, C.M. 1998, Assessing economic impacts of
salinity in rural and urban areas, In: Managing
saltland into the 21st Century: Dollars and sense from
salt, Proceedings, 5th National PUR$L Conference,
Tamworth, NSW, 9–13th March, 1998 pp. 110–13.
Ivey-ATP 1998a, Determining the costs of dryland
salinity: Dryland salinity survey of the Talbragar and
Little River catchments—Central West NSW: Volume
1 of 5: Methodology, Report to the Murray-Darling
Basin Commission, Wellington NSW.
Ivey-ATP 1998b, Determining the costs of dryland
salinity: Dryland salinity survey of the Talbragar and
Little River catchments—Central West NSW: Volume 3
of 5: Costs to the Little River catchment, Report to the
Murray-Darling Basin Commission, Wellington NSW.
Ivey-ATP 1998c, Determining the costs of dryland
salinity: Dryland salinity survey of the Talbragar and
Little River catchments—Central West NSW: Volume
5 of 5: Detailed data for Background Report, Report
to the Murray-Darling Basin Commission, Wellington
NSW.
Ivey-ATP 1998d, Determining the costs of dryland
salinity: Dryland salinity survey of the Talbragar and
Little River catchments—Central West NSW: Volume
4 of 5: Background Report, Report to the Murray-
Darling Basin Commission, Wellington NSW.
Ivey-ATP 1998e, Determining the costs of dryland
salinity: Dryland salinity survey of the Talbragar and
Little River catchments—Central West NSW: Volume 2
of 5: Costs to the Talbragar catchment, Report to the
Murray-Darling Basin Commission, Wellington NSW.
Ivey-ATP 1998f, Determining the costs of dryland
salinity: Dryland salinity survey of the Troy Creek
catchment—Central West NSW, Report to Salt Action
New South Wales, Wellington NSW.
Lubulwa, M. 1997, Salinity and High Watertables
in the Loddon and Campaspe catchments: Costs to
urban households, ABARE report to the Murray-
Darling Basin Commission, Canberra.
Murray-Darling Basin Commission, 1996, Cost-sharing
for on-ground works: A discussion paper, Murray-
Darling Basin Commission, Canberra.
Murray-Darling Basin Commission 1997, Salt trends:
Historic trend in salt concentration and saltload of
streamflow in the Murray-Darling Drainage Division,
Dryland Technical Report No. 1, Canberra.
Murray-Darling Basin Ministerial Council, 1999,
The salinity audit of the Murray-Darling Basin—A
100-year perspective, 1999, Murray-Darling Basin
Commission, Canberra.
Powell, J. 1998, A principled approach to cost sharing
for urban salinity, paper presented at the Urban
Salinity Conference, Charles Sturt University, Wagga
Wagga, 11th August.
32 PART ONE
Salt Action 1997, Urban salinity—a threat to cultural
heritage places, Dryland Salinity Information Sheet
SSC 03/97.
Spennemann, D. 1997, Urban salinity as a threat to
cultural heritage places, A primer on the processes
and effects of chloridation, Charles Sturt University,
Johnstone Centre of Parks, Recreation and Heritage,
Albury NSW.
Standing Committee on Conservation Task Force,
2001, Implications of salinity for biodiversity
conservation and management, report prepared for
ANZECC.
Streeting, M. and Hamilton, C. 1991, An economic
analysis of the forests of south-eastern Australia,
Resource Assessment Commission Research Paper
no. 5, AGPS, Canberra.
Wilson, S.M. 1995, Draft guidelines for quantifying
the full range of costs of dryland salinity, ABARE
paper presented at a National Workshop on Dryland
Salinity, Convened by ABARE and the Victorian
Department of Conservation and Natural Resources,
Bendigo, Victoria, 21–23 June.
Wilson Land Management Services and Ivey ATP
2002, Cost of dryland salinity to the Glenelg-Hopkins
Region, Report to the Glenelg-Hopkins Catchment
Management Authority.
Van Hilst, R. and Schuele, M. 1997, Salinity and high
watertables in the Loddon and Campaspe catchments:
Costs to the environment, ABARE report to the
Murray-Darling Basin Commission, Canberra.
Whish-Wilson, P. and Lubulwa, M. 1997, Salinity
and high watertables in the Loddon and Campaspe
catchments: Costs to local councils, government
agencies and public utilities, ABARE report to the
Murray-Darling Basin Commission, Canberra.
Whish-Wilson, P. and Shafron, W. 1997, Salinity
and high watertables in the Loddon and Campaspe
catchments: Costs to farms and other businesses,
ABARE report to the Murray-Darling Basin
Commission, Canberra.
Young, D. and Mues, C, 1993, An evaluation of
water management strategies in the Barmah-Millewa
Forest, ABARE paper presented at the 37th Annual
Conference of the Australian Agricultural Economics
Society, University
of Sydney, 9–11 February.
Photo: Arthur Mostead
32 PART ONE
Part Two:Guidelines for identifying and valuing the impacts
Photo: Arthur Mostead

2-1
PART TWO 35
0
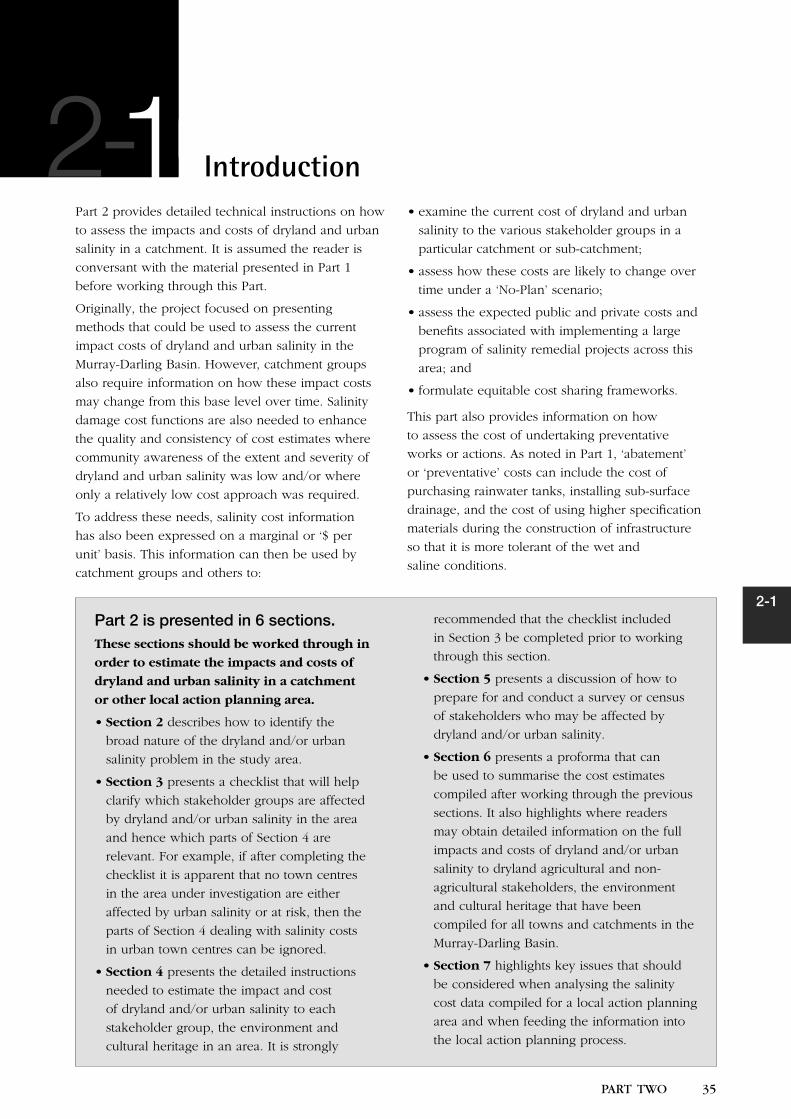
2-1
PART TWO 35
0 IntroductionPart 2 provides detailed technical instructions on how
to assess the impacts and costs of dryland and urban
salinity in a catchment. It is assumed the reader is
conversant with the material presented in Part 1
before working through this Part.
Originally, the project focused on presenting
methods that could be used to assess the current
impact costs of dryland and urban salinity in the
Murray-Darling Basin. However, catchment groups
also require information on how these impact costs
may change from this base level over time. Salinity
damage cost functions are also needed to enhance
the quality and consistency of cost estimates where
community awareness of the extent and severity of
dryland and urban salinity was low and/or where
only a relatively low cost approach was required.
To address these needs, salinity cost information
has also been expressed on a marginal or ‘$ per
unit’ basis. This information can then be used by
catchment groups and others to:
• examine the current cost of dryland and urban
salinity to the various stakeholder groups in a
particular catchment or sub-catchment;
• assess how these costs are likely to change over
time under a ‘No-Plan’ scenario;
• assess the expected public and private costs and
benefits associated with implementing a large
program of salinity remedial projects across this
area; and
• formulate equitable cost sharing frameworks.
This part also provides information on how
to assess the cost of undertaking preventative
works or actions. As noted in Part 1, ‘abatement’
or ‘preventative’ costs can include the cost of
purchasing rainwater tanks, installing sub-surface
drainage, and the cost of using higher specification
materials during the construction of infrastructure
so that it is more tolerant of the wet and
saline conditions.
Part 2 is presented in 6 sections.These sections should be worked through in
order to estimate the impacts and costs of
dryland and urban salinity in a catchment
or other local action planning area.
• Section 2 describes how to identify the
broad nature of the dryland and/or urban
salinity problem in the study area.
• Section 3 presents a checklist that will help
clarify which stakeholder groups are affected
by dryland and/or urban salinity in the area
and hence which parts of Section 4 are
relevant. For example, if after completing the
checklist it is apparent that no town centres
in the area under investigation are either
affected by urban salinity or at risk, then the
parts of Section 4 dealing with salinity costs
in urban town centres can be ignored.
• Section 4 presents the detailed instructions
needed to estimate the impact and cost
of dryland and/or urban salinity to each
stakeholder group, the environment and
cultural heritage in an area. It is strongly
recommended that the checklist included
in Section 3 be completed prior to working
through this section.
• Section 5 presents a discussion of how to
prepare for and conduct a survey or census
of stakeholders who may be affected by
dryland and/or urban salinity.
• Section 6 presents a proforma that can
be used to summarise the cost estimates
compiled after working through the previous
sections. It also highlights where readers
may obtain detailed information on the full
impacts and costs of dryland and/or urban
salinity to dryland agricultural and non-
agricultural stakeholders, the environment
and cultural heritage that have been
compiled for all towns and catchments in the
Murray-Darling Basin.
• Section 7 highlights key issues that should
be considered when analysing the salinity
cost data compiled for a local action planning
area and when feeding the information into
the local action planning process.
12-
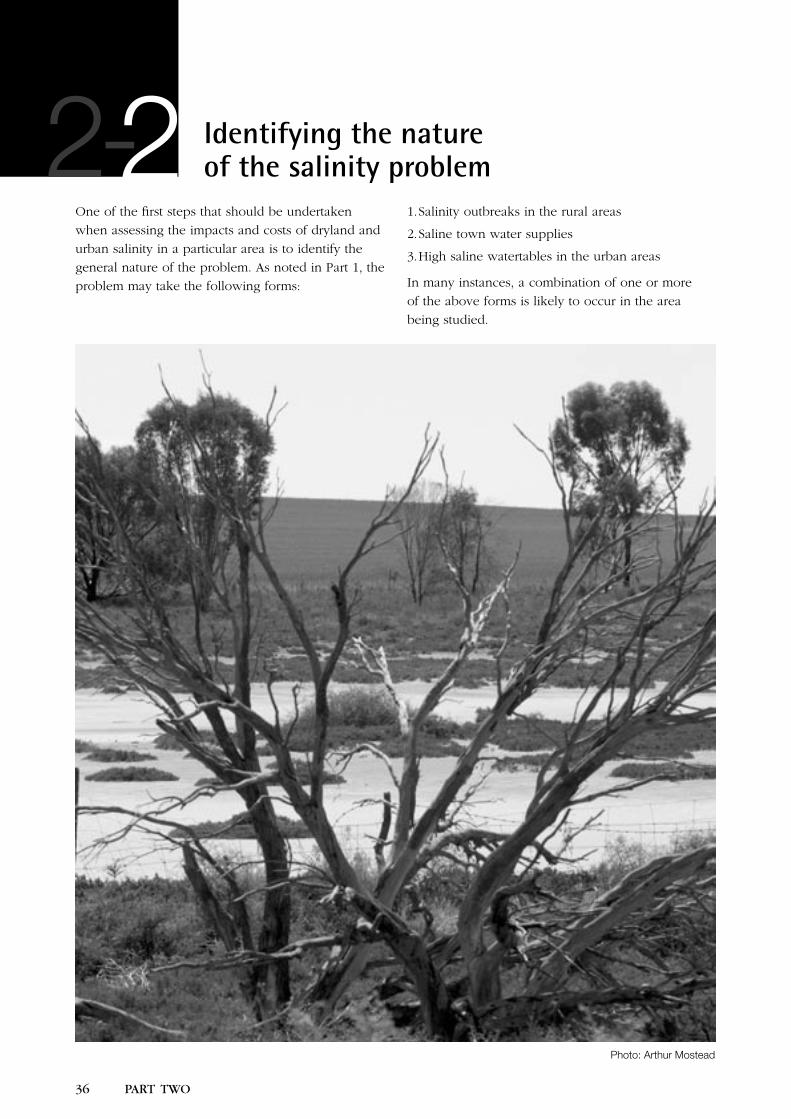
36 PART TWO
2-3
PART TWO 37
0Identifying the nature of the salinity problem
One of the first steps that should be undertaken
when assessing the impacts and costs of dryland and
urban salinity in a particular area is to identify the
general nature of the problem. As noted in Part 1, the
problem may take the following forms:
1. Salinity outbreaks in the rural areas
2. Saline town water supplies
3. High saline watertables in the urban areas
In many instances, a combination of one or more
of the above forms is likely to occur in the area
being studied.
2
Photo: Arthur Mostead
2-
36 PART TWO
2-3
PART TWO 37
0 Identifying the affected stakeholders3.1 IntroductionAs noted in Part 1, the three forms of dryland
and urban salinity summarised above may impose a
variety of impacts on various dryland agricultural and
non-agricultural stakeholder groups, the environment
and cultural heritage across an area. These adverse
impacts may be incurred within the local action
plan area being investigated, or downstream from
the area.
When preparing a local action plan, it will rarely be
practical or economically viable to identify and value
all impacts on the various stakeholder groups. At
some point, it is likely that the cost of obtaining the
detailed information will exceed the benefits gained
for the purposes of decision-making. Rather, what
will be more important will be to first identify the
main stakeholders either currently affected, or likely
to become affected, by the various forms of dryland
and urban salinity listed above. For example:
• Is it just the stakeholders located in the rural
areas of the catchment (e.g. rural householders,
local governments, farmers, state agencies and
utilities with infrastructure in the rural areas,
the natural environment and any rural sites of
cultural significance)?
• Is it just the stakeholders in the urban town
centres (e.g. urban households, urban commercial,
retail and industrial businesses, local governments,
state agencies and utilities with infrastructure in
the urban areas, and any urban sites of cultural
significance)?
• Is it just the downstream agricultural, industrial
and/or domestic water users?
• Is it a combination of two or more of
these options?
The next step as described in Part 1 is to identify
the likely change in salinity costs to each of
these stakeholder groups over time under a ‘No-
Plan’ scenario.
The proforma on the next page can help to identify the main impacts of dryland and urban salinity on
stakeholders. Once completed, the information will:
• act as a checklist for the main impacts that should be assessed (or at least considered) as part of the
local action planning process (see section 4), and
• help identify the likely beneficiaries arising from the implementation of a local action plan. These
beneficiaries can then be accounted for when transparent cost-sharing arrangements based on a
‘Beneficiary Pays’ principle are being developed.
32-
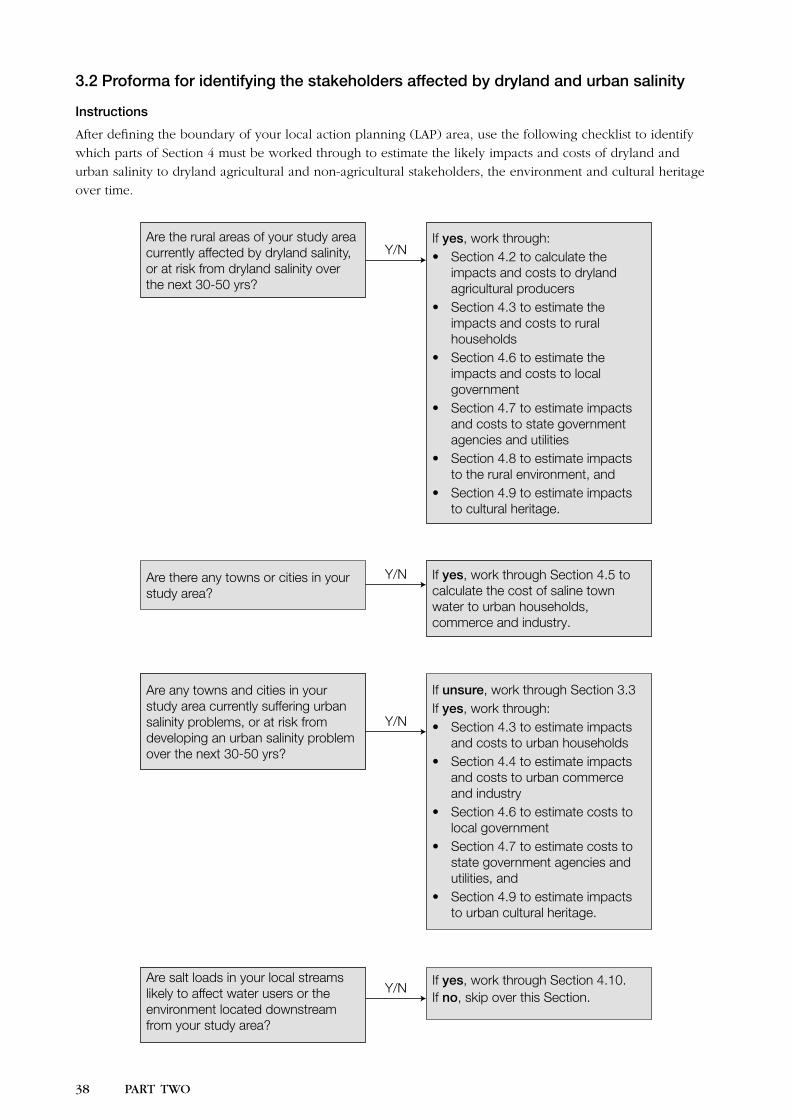
38 PART TWO
2-3
PART TWO 39
3.2 Proforma for identifying the stakeholders affected by dryland and urban salinity
Instructions
After defining the boundary of your local action planning (LAP) area, use the following checklist to identify
which parts of Section 4 must be worked through to estimate the likely impacts and costs of dryland and
urban salinity to dryland agricultural and non-agricultural stakeholders, the environment and cultural heritage
over time.
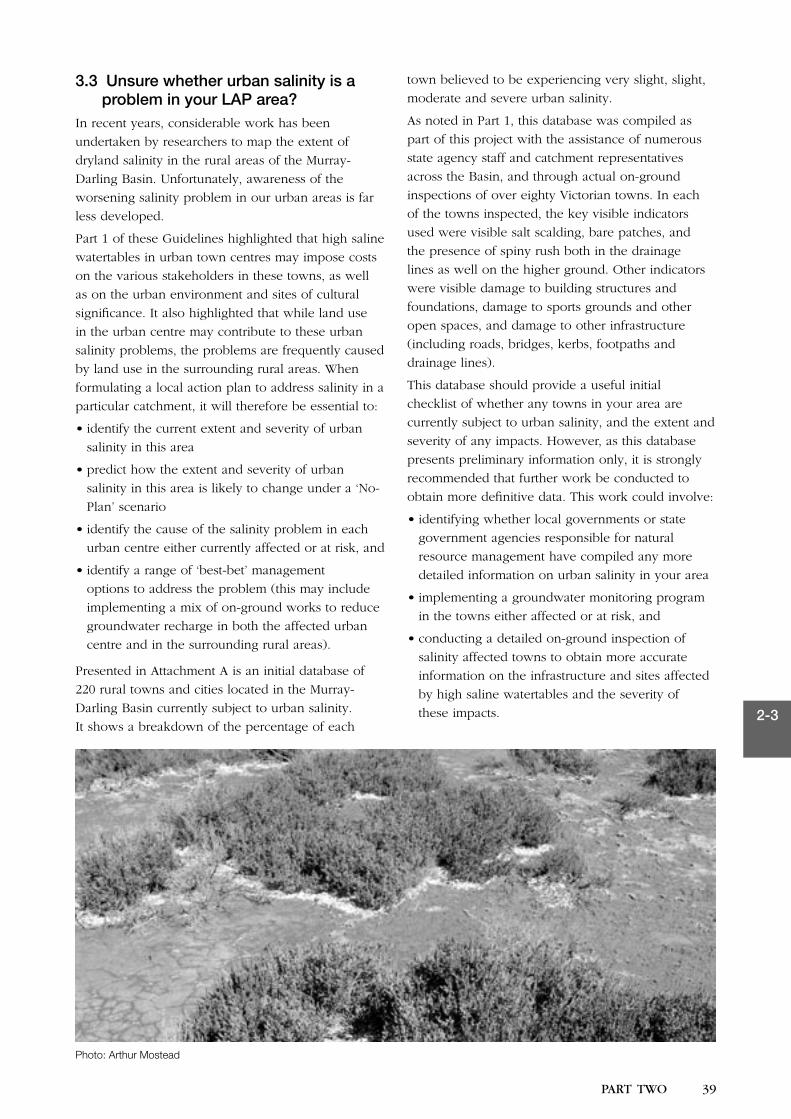
38 PART TWO
2-3
PART TWO 39
3.3 Unsure whether urban salinity is a problem in your LAP area?
In recent years, considerable work has been
undertaken by researchers to map the extent of
dryland salinity in the rural areas of the Murray-
Darling Basin. Unfortunately, awareness of the
worsening salinity problem in our urban areas is far
less developed.
Part 1 of these Guidelines highlighted that high saline
watertables in urban town centres may impose costs
on the various stakeholders in these towns, as well
as on the urban environment and sites of cultural
significance. It also highlighted that while land use
in the urban centre may contribute to these urban
salinity problems, the problems are frequently caused
by land use in the surrounding rural areas. When
formulating a local action plan to address salinity in a
particular catchment, it will therefore be essential to:
• identify the current extent and severity of urban
salinity in this area
• predict how the extent and severity of urban
salinity in this area is likely to change under a ‘No-
Plan’ scenario
• identify the cause of the salinity problem in each
urban centre either currently affected or at risk, and
• identify a range of ‘best-bet’ management
options to address the problem (this may include
implementing a mix of on-ground works to reduce
groundwater recharge in both the affected urban
centre and in the surrounding rural areas).
Presented in Attachment A is an initial database of
220 rural towns and cities located in the Murray-
Darling Basin currently subject to urban salinity.
It shows a breakdown of the percentage of each
town believed to be experiencing very slight, slight,
moderate and severe urban salinity.
As noted in Part 1, this database was compiled as
part of this project with the assistance of numerous
state agency staff and catchment representatives
across the Basin, and through actual on-ground
inspections of over eighty Victorian towns. In each
of the towns inspected, the key visible indicators
used were visible salt scalding, bare patches, and
the presence of spiny rush both in the drainage
lines as well on the higher ground. Other indicators
were visible damage to building structures and
foundations, damage to sports grounds and other
open spaces, and damage to other infrastructure
(including roads, bridges, kerbs, footpaths and
drainage lines).
This database should provide a useful initial
checklist of whether any towns in your area are
currently subject to urban salinity, and the extent and
severity of any impacts. However, as this database
presents preliminary information only, it is strongly
recommended that further work be conducted to
obtain more definitive data. This work could involve:
• identifying whether local governments or state
government agencies responsible for natural
resource management have compiled any more
detailed information on urban salinity in your area
• implementing a groundwater monitoring program
in the towns either affected or at risk, and
• conducting a detailed on-ground inspection of
salinity affected towns to obtain more accurate
information on the infrastructure and sites affected
by high saline watertables and the severity of
these impacts.
Photo: Arthur Mostead
40 PART TWO
2-4
PART TWO 41
Valuing the costs of dryland and urban salinity
4.1 IntroductionThe purpose of this Section is to provide guidance
on how to assess the impacts and costs of dryland
and urban salinity to the various stakeholder
groups identified in the previous checklist. It is
not intended to represent an inflexible set of ‘how
to do it’ instructions. Rather, it describes a range
of approaches for assessing these costs — each
of which are associated with different levels of
detail and accuracy. As noted in Part 1, catchment
communities will need to work through the following
checklist before deciding what approach, or level
of detail, may best meet their needs when assessing
these impacts and costs:
1 What information do we actually need?
2 What level of detail will meet our needs?
3 What information is already available and
what are the gaps?
4 What other useful information is available?
Note: Once any costs of salinity have been
quantified, any information published or
disseminated should not enable the reader to identify
costs specific to any one individual or individual
organisation (including individual local councils).
Rather, costs should be presented at an aggregated
level that ensures confidentiality.
4.2 Dryland agricultural producersDryland salinity can affect dryland agricultural
producers in several ways. High saline watertables
may reduce crop and pasture production and cause
damage to fences, yards, buildings and roads. Saline
water supplies may cause damage to water pumps,
water tanks and supply systems, water troughs, and
irrigated pasture or crops.
• Work through this Section if you noted in your
checklist in Section 3.2 that there are rural areas
in your study area currently affected by dryland
salinity, or are at risk.
4.2.1 Background
The impact of dryland salinity and saline water
supplies on dryland agricultural producers may
include productivity losses resulting in foregone
income, increased repairs and maintenance to
infrastructure, increased cost of new infrastructure,
reduced lifespan of infrastructure, and increased
operating costs.
Dryland agricultural producers may also experience
significant costs implementing preventative works
to minimise current and future salinity problems.
This may, for example, include the up-front cost of
purchasing rainwater tanks and pressure pumps,
planting trees or deep-rooted perennial pasture in
recharge areas, or installing sub-surface drainage to
minimise damage.
Climatic conditions and dryland agricultural
production throughout the Murray-Darling Basin
varies significantly, as does the resulting dryland
salinity impacts in a given region. Therefore,
considerable groundwork may be necessary to assess
the impacts and costs of high saline watertables and
saline water supplies across a catchment or region.
The purpose of this Section is to present methods for
estimating these costs at a catchment level.
4.2.2 Conduct a survey of dryland agricultural producers
Conducting a survey of dryland agricultural
producers within the catchment being studied is a
very effective method of obtaining information. This
approach may involve surveying every producer,
or a random number of producers, depending on
the size of the area being considered, the depth of
information required, and the resources available.
Combined with knowledge from local experts,
producer surveys also provide an excellent view
of producer perceptions and awareness of dryland
salinity and associated costs in the area.
The survey method, while relying on each individual
producer’s perception of the problem, is effective
in estimating salinity costs to dryland agricultural
producers, if conducted correctly.
42-
40 PART TWO
2-4
PART TWO 41
An example questionnaire that can be used to assess
the current nature and costs of salinity to dryland
agricultural producers is presented in Attachment B.
This questionnaire helps to collect information on
each producer’s perception of:
• the area of dryland salinity and high watertables on
their property
• the severity of dryland salinity and high watertables
on their property
• the type of land affected
• reductions in crop and pasture production and
hence foregone income
• components of their farm, household and other
property affected
• the impact on both stock and domestic supplies
• structural damage to houses
• damage to farm roads and tracks
• additional expenditure on repair and
maintenance activities
• increased construction costs
• amount spent on salinity-related preventative
works, and
• the cost of shortened lifespan of salinity-affected
infrastructure.
This type of survey requires a reasonable level
of detail. To achieve a good response rate, a
meeting with either individual producer or group of
producers is usually necessary.
The individual interview ensures accurate completion
of surveys, with the interviewer being able to clarify
sections of the survey where necessary. Time and
expense is the main drawback for conducting
individual surveys, compared with a group meeting,
where many surveys can be filled in accurately
at once.
Group meetings are more difficult to organise,
and require greater explanation on the type of
information required. There is also a likelihood that
some surveys, or sections of surveys will not be filled
in correctly. It is easier to conduct a meeting of this
nature if producers receive the survey in advance, in
order to think about their answers.
A more detailed description of how to conduct a
census or survey of producers and other stakeholder
groups is presented in Section 5.
4.2.3 Enhance accuracy of survey results
It is difficult for producers to distinguish the
proportion of total costs attributable to dryland
salinity, and is one of the main limitations of using
surveys to collect this information. Every producer
varies in their understanding and awareness of
dryland salinity impacts and associated costs. While
many producers are aware that salinity is causing
damage to some of their infrastructure, many cannot
accurately quantify these additional costs. Where
possible, surveys should encourage producers to
determine the increase in costs due to dryland
salinity as a percentage or component of total costs.
For example: a property has 5 km of road, of which
four kilometres are unaffected by salinity and cost
$150 per kilometre to maintain. One kilometre
is affected by dryland salinity and costs $200 to
maintain. Therefore, the increased repair and
maintenance cost of roads as a result of dryland
salinity is $50 per annum, not the total maintenance
cost of $200 per annum.
Another problem is that dryland salinity damage to
infrastructure and land is often insidious in nature,
and either not recognised, or attributed to other
causes. This problem is multiplied when salinity is
only an emerging problem or community awareness
is low. For example, many factors may contribute to
poor pasture establishment in an area of a paddock,
making it difficult for the producer to recognise that
high, saline watertables is a factor, unless electrical
conductivity readings or soil testing are undertaken.
Once a survey of affected producers is complete, it
will be highly beneficial to enhance the accuracy of
the results by combining the survey information with
more reliable and objective information obtained
from other sources. GIS information showing the
current (and predicted future) areas subject to
dryland salinity is particularly useful for validating
producer perceptions of the location of salinity
outbreaks in the study area.
As the cost of salinity is normally calculated on
an annual basis, the majority of cost information
collected should be for an average 12-month period.
However, preventative works costs and other
increased infrastructure costs that result from dryland
salinity or saline water supplies are often intermittent,
such as tree planting or water tank installation.
Hence surveys should request information on costs
experienced over a three or five year period, which
are then averaged to give an annual figure.
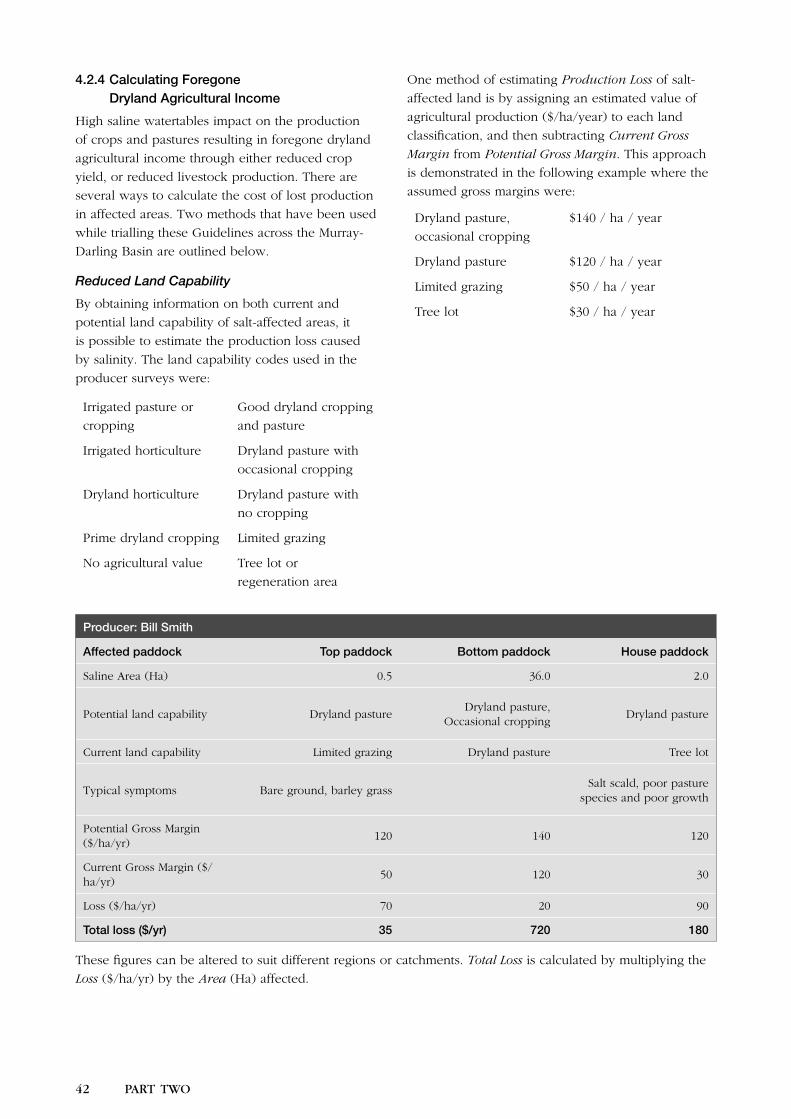
42 PART TWO
2-4
PART TWO 43
4.2.4 Calculating Foregone Dryland Agricultural Income
High saline watertables impact on the production
of crops and pastures resulting in foregone dryland
agricultural income through either reduced crop
yield, or reduced livestock production. There are
several ways to calculate the cost of lost production
in affected areas. Two methods that have been used
while trialling these Guidelines across the Murray-
Darling Basin are outlined below.
Reduced Land Capability
By obtaining information on both current and
potential land capability of salt-affected areas, it
is possible to estimate the production loss caused
by salinity. The land capability codes used in the
producer surveys were:
Irrigated pasture or
cropping
Good dryland cropping
and pasture
Irrigated horticulture Dryland pasture with
occasional cropping
Dryland horticulture Dryland pasture with
no cropping
Prime dryland cropping Limited grazing
No agricultural value Tree lot or
regeneration area
One method of estimating Production Loss of salt-
affected land is by assigning an estimated value of
agricultural production ($/ha/year) to each land
classification, and then subtracting Current Gross
Margin from Potential Gross Margin. This approach
is demonstrated in the following example where the
assumed gross margins were:
Dryland pasture,
occasional cropping
$140 / ha / year
Dryland pasture $120 / ha / year
Limited grazing $50 / ha / year
Tree lot $30 / ha / year
Producer: Bill Smith
Affected paddock Top paddock Bottom paddock House paddock
Saline Area (Ha) 0.5 36.0 2.0
Potential land capability Dryland pastureDryland pasture,
Occasional croppingDryland pasture
Current land capability Limited grazing Dryland pasture Tree lot
Typical symptoms Bare ground, barley grassSalt scald, poor pasture
species and poor growth
Potential Gross Margin ($/ha/yr)
120 140 120
Current Gross Margin ($/ha/yr)
50 120 30
Loss ($/ha/yr) 70 20 90
Total loss ($/yr) 35 720 180
These figures can be altered to suit different regions or catchments. Total Loss is calculated by multiplying the
Loss ($/ha/yr) by the Area (Ha) affected.
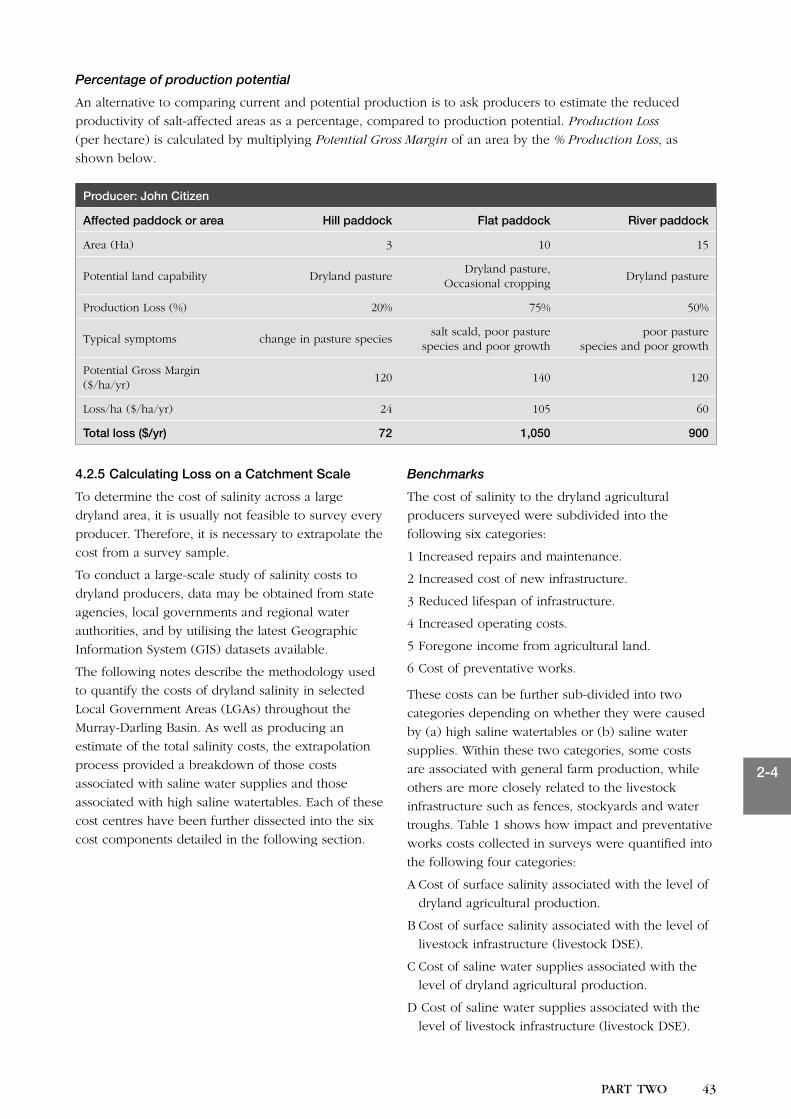
42 PART TWO
2-4
PART TWO 43
Percentage of production potential
An alternative to comparing current and potential production is to ask producers to estimate the reduced
productivity of salt-affected areas as a percentage, compared to production potential. Production Loss
(per hectare) is calculated by multiplying Potential Gross Margin of an area by the % Production Loss, as
shown below.
Producer: John Citizen
Affected paddock or area Hill paddock Flat paddock River paddock
Area (Ha) 3 10 15
Potential land capability Dryland pastureDryland pasture,
Occasional croppingDryland pasture
Production Loss (%) 20% 75% 50%
Typical symptoms change in pasture speciessalt scald, poor pasture
species and poor growthpoor pasture
species and poor growth
Potential Gross Margin ($/ha/yr)
120 140 120
Loss/ha ($/ha/yr) 24 105 60
Total loss ($/yr) 72 1,050 900
4.2.5 Calculating Loss on a Catchment Scale
To determine the cost of salinity across a large
dryland area, it is usually not feasible to survey every
producer. Therefore, it is necessary to extrapolate the
cost from a survey sample.
To conduct a large-scale study of salinity costs to
dryland producers, data may be obtained from state
agencies, local governments and regional water
authorities, and by utilising the latest Geographic
Information System (GIS) datasets available.
The following notes describe the methodology used
to quantify the costs of dryland salinity in selected
Local Government Areas (LGAs) throughout the
Murray-Darling Basin. As well as producing an
estimate of the total salinity costs, the extrapolation
process provided a breakdown of those costs
associated with saline water supplies and those
associated with high saline watertables. Each of these
cost centres have been further dissected into the six
cost components detailed in the following section.
Benchmarks
The cost of salinity to the dryland agricultural
producers surveyed were subdivided into the
following six categories:
1 Increased repairs and maintenance.
2 Increased cost of new infrastructure.
3 Reduced lifespan of infrastructure.
4 Increased operating costs.
5 Foregone income from agricultural land.
6 Cost of preventative works.
These costs can be further sub-divided into two
categories depending on whether they were caused
by (a) high saline watertables or (b) saline water
supplies. Within these two categories, some costs
are associated with general farm production, while
others are more closely related to the livestock
infrastructure such as fences, stockyards and water
troughs. Table 1 shows how impact and preventative
works costs collected in surveys were quantified into
the following four categories:
A Cost of surface salinity associated with the level of
dryland agricultural production.
B Cost of surface salinity associated with the level of
livestock infrastructure (livestock DSE).
C Cost of saline water supplies associated with the
level of dryland agricultural production.
D Cost of saline water supplies associated with the
level of livestock infrastructure (livestock DSE).
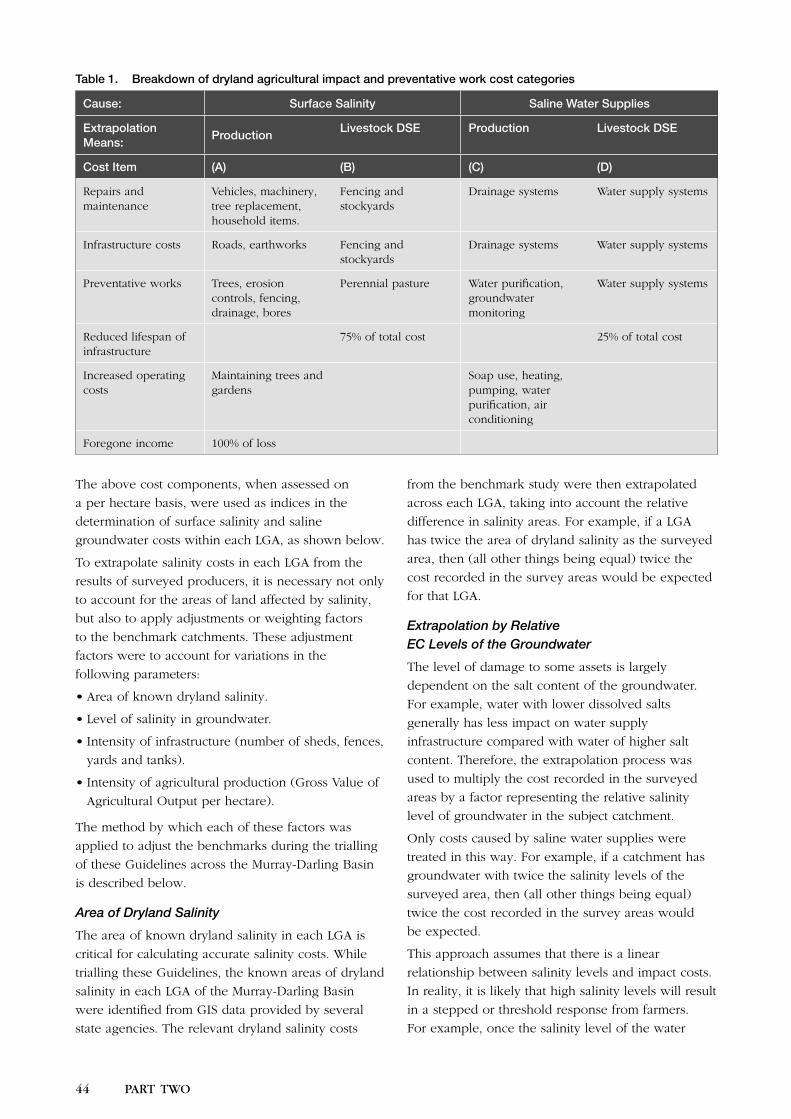
44 PART TWO
2-4
PART TWO 45
Table 1. Breakdown of dryland agricultural impact and preventative work cost categories
Cause: Surface Salinity Saline Water Supplies
Extrapolation Means:
ProductionLivestock DSE Production Livestock DSE
Cost Item (A) (B) (C) (D)
Repairs and maintenance
Vehicles, machinery, tree replacement, household items.
Fencing and stockyards
Drainage systems Water supply systems
Infrastructure costs Roads, earthworks Fencing and stockyards
Drainage systems Water supply systems
Preventative works Trees, erosion controls, fencing, drainage, bores
Perennial pasture Water purification, groundwater monitoring
Water supply systems
Reduced lifespan of infrastructure
75% of total cost 25% of total cost
Increased operating costs
Maintaining trees and gardens
Soap use, heating, pumping, water purification, air conditioning
Foregone income 100% of loss
The above cost components, when assessed on
a per hectare basis, were used as indices in the
determination of surface salinity and saline
groundwater costs within each LGA, as shown below.
To extrapolate salinity costs in each LGA from the
results of surveyed producers, it is necessary not only
to account for the areas of land affected by salinity,
but also to apply adjustments or weighting factors
to the benchmark catchments. These adjustment
factors were to account for variations in the
following parameters:
• Area of known dryland salinity.
• Level of salinity in groundwater.
• Intensity of infrastructure (number of sheds, fences,
yards and tanks).
• Intensity of agricultural production (Gross Value of
Agricultural Output per hectare).
The method by which each of these factors was
applied to adjust the benchmarks during the trialling
of these Guidelines across the Murray-Darling Basin
is described below.
Area of Dryland Salinity
The area of known dryland salinity in each LGA is
critical for calculating accurate salinity costs. While
trialling these Guidelines, the known areas of dryland
salinity in each LGA of the Murray-Darling Basin
were identified from GIS data provided by several
state agencies. The relevant dryland salinity costs
from the benchmark study were then extrapolated
across each LGA, taking into account the relative
difference in salinity areas. For example, if a LGA
has twice the area of dryland salinity as the surveyed
area, then (all other things being equal) twice the
cost recorded in the survey areas would be expected
for that LGA.
Extrapolation by RelativeEC Levels of the Groundwater
The level of damage to some assets is largely
dependent on the salt content of the groundwater.
For example, water with lower dissolved salts
generally has less impact on water supply
infrastructure compared with water of higher salt
content. Therefore, the extrapolation process was
used to multiply the cost recorded in the surveyed
areas by a factor representing the relative salinity
level of groundwater in the subject catchment.
Only costs caused by saline water supplies were
treated in this way. For example, if a catchment has
groundwater with twice the salinity levels of the
surveyed area, then (all other things being equal)
twice the cost recorded in the survey areas would
be expected.
This approach assumes that there is a linear
relationship between salinity levels and impact costs.
In reality, it is likely that high salinity levels will result
in a stepped or threshold response from farmers.
For example, once the salinity level of the water
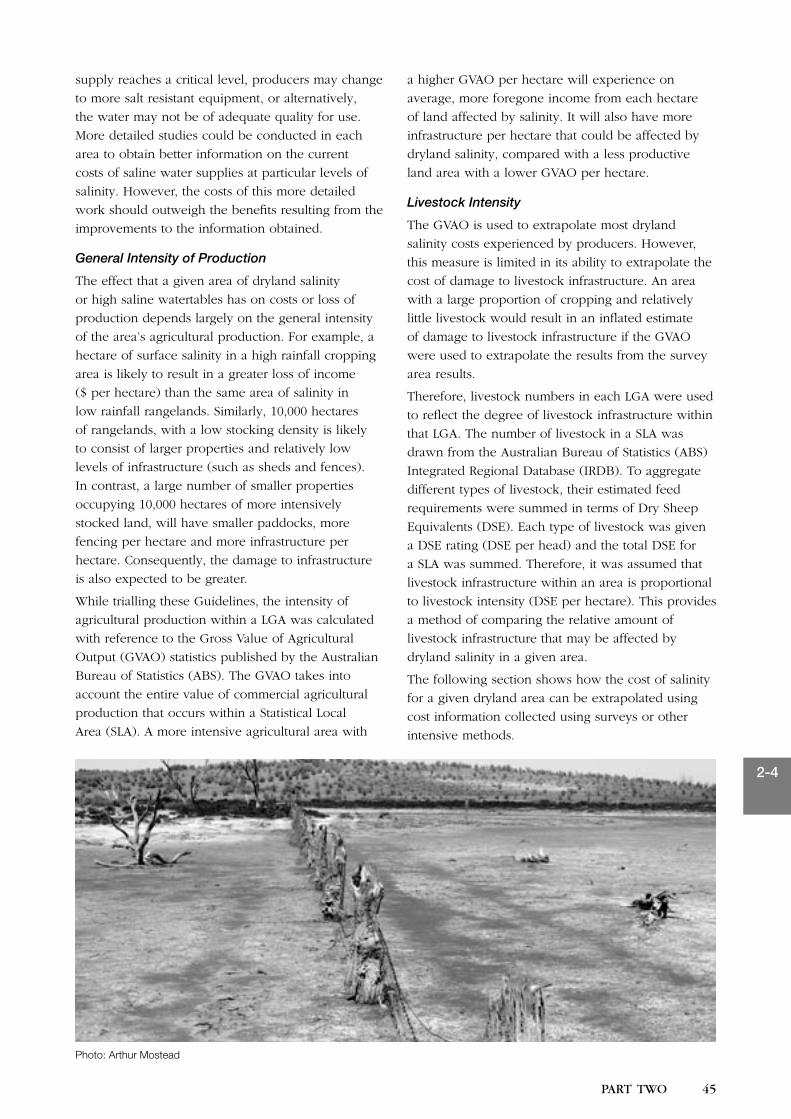
44 PART TWO
2-4
PART TWO 45
supply reaches a critical level, producers may change
to more salt resistant equipment, or alternatively,
the water may not be of adequate quality for use.
More detailed studies could be conducted in each
area to obtain better information on the current
costs of saline water supplies at particular levels of
salinity. However, the costs of this more detailed
work should outweigh the benefits resulting from the
improvements to the information obtained.
General Intensity of Production
The effect that a given area of dryland salinity
or high saline watertables has on costs or loss of
production depends largely on the general intensity
of the area’s agricultural production. For example, a
hectare of surface salinity in a high rainfall cropping
area is likely to result in a greater loss of income
($ per hectare) than the same area of salinity in
low rainfall rangelands. Similarly, 10,000 hectares
of rangelands, with a low stocking density is likely
to consist of larger properties and relatively low
levels of infrastructure (such as sheds and fences).
In contrast, a large number of smaller properties
occupying 10,000 hectares of more intensively
stocked land, will have smaller paddocks, more
fencing per hectare and more infrastructure per
hectare. Consequently, the damage to infrastructure
is also expected to be greater.
While trialling these Guidelines, the intensity of
agricultural production within a LGA was calculated
with reference to the Gross Value of Agricultural
Output (GVAO) statistics published by the Australian
Bureau of Statistics (ABS). The GVAO takes into
account the entire value of commercial agricultural
production that occurs within a Statistical Local
Area (SLA). A more intensive agricultural area with
a higher GVAO per hectare will experience on
average, more foregone income from each hectare
of land affected by salinity. It will also have more
infrastructure per hectare that could be affected by
dryland salinity, compared with a less productive
land area with a lower GVAO per hectare.
Livestock Intensity
The GVAO is used to extrapolate most dryland
salinity costs experienced by producers. However,
this measure is limited in its ability to extrapolate the
cost of damage to livestock infrastructure. An area
with a large proportion of cropping and relatively
little livestock would result in an inflated estimate
of damage to livestock infrastructure if the GVAO
were used to extrapolate the results from the survey
area results.
Therefore, livestock numbers in each LGA were used
to reflect the degree of livestock infrastructure within
that LGA. The number of livestock in a SLA was
drawn from the Australian Bureau of Statistics (ABS)
Integrated Regional Database (IRDB). To aggregate
different types of livestock, their estimated feed
requirements were summed in terms of Dry Sheep
Equivalents (DSE). Each type of livestock was given
a DSE rating (DSE per head) and the total DSE for
a SLA was summed. Therefore, it was assumed that
livestock infrastructure within an area is proportional
to livestock intensity (DSE per hectare). This provides
a method of comparing the relative amount of
livestock infrastructure that may be affected by
dryland salinity in a given area.
The following section shows how the cost of salinity
for a given dryland area can be extrapolated using
cost information collected using surveys or other
intensive methods.
Photo: Arthur Mostead
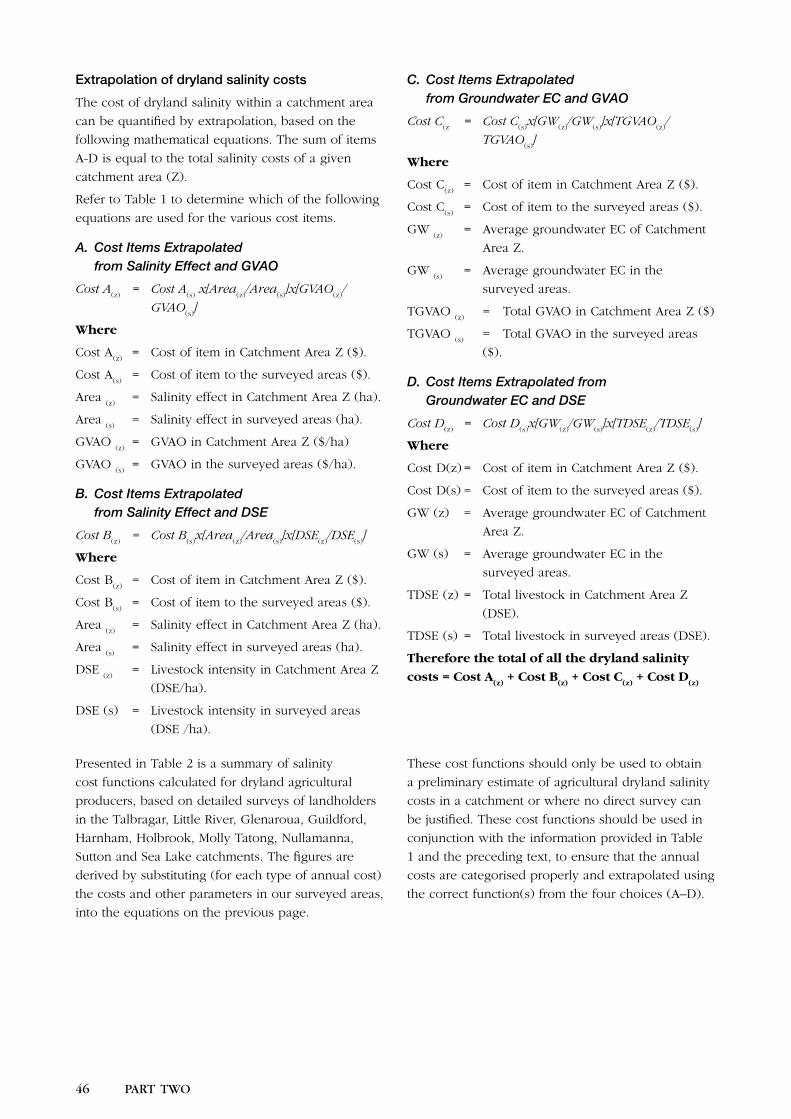
46 PART TWO
2-4
PART TWO 47
Extrapolation of dryland salinity costs
The cost of dryland salinity within a catchment area
can be quantified by extrapolation, based on the
following mathematical equations. The sum of items
A-D is equal to the total salinity costs of a given
catchment area (Z).
Refer to Table 1 to determine which of the following
equations are used for the various cost items.
A. Cost Items Extrapolated from Salinity Effect and GVAO
Cost A(z)
= Cost A(s)
x[Area(z)
/Area(s)
]x[GVAO(z)
/
GVAO(s)
]
Where
Cost A(z)
= Cost of item in Catchment Area Z ($).
Cost A(s)
= Cost of item to the surveyed areas ($).
Area (z)
= Salinity effect in Catchment Area Z (ha).
Area (s)
= Salinity effect in surveyed areas (ha).
GVAO (z)
= GVAO in Catchment Area Z ($/ha)
GVAO (s)
= GVAO in the surveyed areas ($/ha).
B. Cost Items Extrapolated from Salinity Effect and DSE
Cost B(z)
= Cost B(s)
x[Area(z)
/Area(s)
]x[DSE(z)
/DSE(s)
]
Where
Cost B(z)
= Cost of item in Catchment Area Z ($).
Cost B(s)
= Cost of item to the surveyed areas ($).
Area (z)
= Salinity effect in Catchment Area Z (ha).
Area (s)
= Salinity effect in surveyed areas (ha).
DSE (z)
= Livestock intensity in Catchment Area Z
(DSE/ha).
DSE (s) = Livestock intensity in surveyed areas
(DSE /ha).
C. Cost Items Extrapolated from Groundwater EC and GVAO
Cost C(z
= Cost C(s)
x[GW(z)
/GW(s)
]x[TGVAO(z)
/
TGVAO(s)
]
Where
Cost C(z)
= Cost of item in Catchment Area Z ($).
Cost C(s)
= Cost of item to the surveyed areas ($).
GW (z)
= Average groundwater EC of Catchment
Area Z.
GW (s)
= Average groundwater EC in the
surveyed areas.
TGVAO (z)
= Total GVAO in Catchment Area Z ($)
TGVAO (s)
= Total GVAO in the surveyed areas
($).
D. Cost Items Extrapolated from Groundwater EC and DSE
Cost D(z)
= Cost D(s)
x[GW(z)
/GW(s)
]x[TDSE(z)
/TDSE(s)
]
Where
Cost D(z) = Cost of item in Catchment Area Z ($).
Cost D(s) = Cost of item to the surveyed areas ($).
GW (z) = Average groundwater EC of Catchment
Area Z.
GW (s) = Average groundwater EC in the
surveyed areas.
TDSE (z) = Total livestock in Catchment Area Z
(DSE).
TDSE (s) = Total livestock in surveyed areas (DSE).
Therefore the total of all the dryland salinity
costs = Cost A(z)
+ Cost B(z)
+ Cost C(z)
+ Cost D(z)
Presented in Table 2 is a summary of salinity
cost functions calculated for dryland agricultural
producers, based on detailed surveys of landholders
in the Talbragar, Little River, Glenaroua, Guildford,
Harnham, Holbrook, Molly Tatong, Nullamanna,
Sutton and Sea Lake catchments. The figures are
derived by substituting (for each type of annual cost)
the costs and other parameters in our surveyed areas,
into the equations on the previous page.
These cost functions should only be used to obtain
a preliminary estimate of agricultural dryland salinity
costs in a catchment or where no direct survey can
be justified. These cost functions should be used in
conjunction with the information provided in Table
1 and the preceding text, to ensure that the annual
costs are categorised properly and extrapolated using
the correct function(s) from the four choices (A–D).
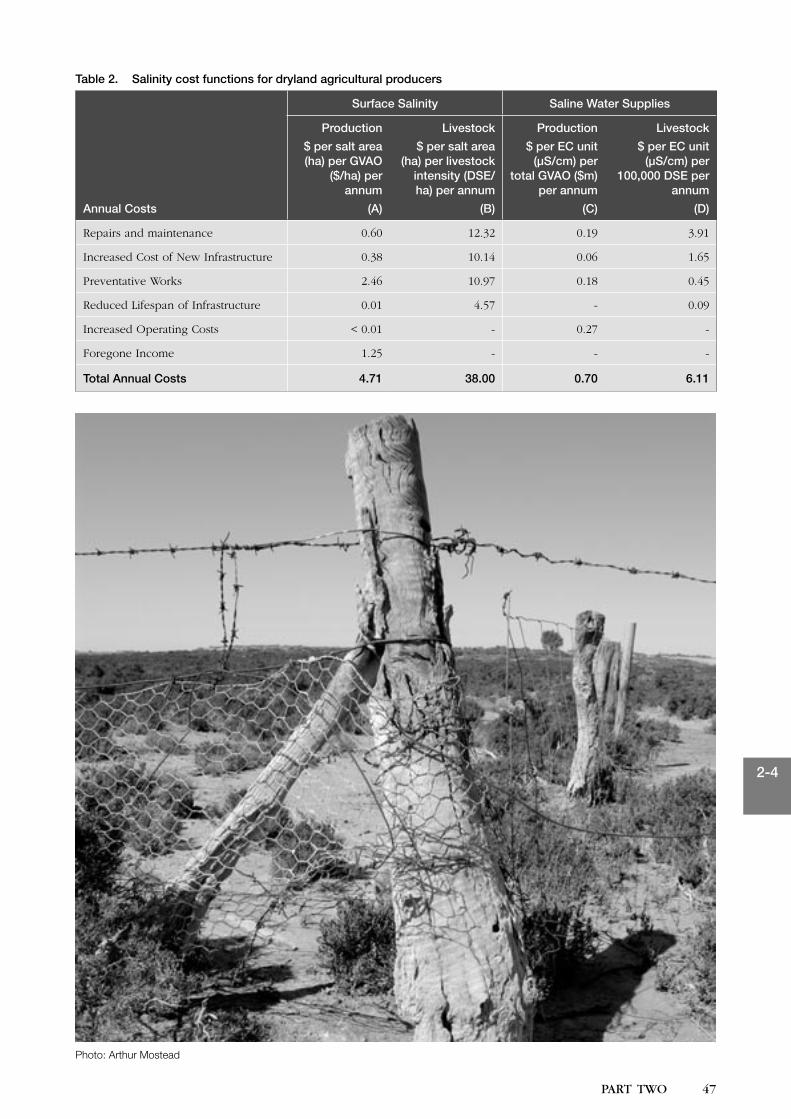
46 PART TWO
2-4
PART TWO 47
Table 2. Salinity cost functions for dryland agricultural producers
Annual Costs
Surface Salinity Saline Water Supplies
Production
$ per salt area (ha) per GVAO
($/ha) per annum
(A)
Livestock
$ per salt area (ha) per livestock
intensity (DSE/ha) per annum
(B)
Production
$ per EC unit (µS/cm) per
total GVAO ($m) per annum
(C)
Livestock
$ per EC unit (µS/cm) per
100,000 DSE per annum
(D)
Repairs and maintenance 0.60 12.32 0.19 3.91
Increased Cost of New Infrastructure 0.38 10.14 0.06 1.65
Preventative Works 2.46 10.97 0.18 0.45
Reduced Lifespan of Infrastructure 0.01 4.57 - 0.09
Increased Operating Costs < 0.01 - 0.27 -
Foregone Income 1.25 - - -
Total Annual Costs 4.71 38.00 0.70 6.11
Photo: Arthur Mostead
48 PART TWO
2-4
PART TWO 49
Worked example 1
In order to calculate the costs of surface salinity (Parts A & B) to a particular cost category (for example
Repairs and Maintenance) in a given area using the cost functions in Table 2, it is necessary to know the
salt area (ha), the GVAO ($/ha) and the livestock intensity (dse/ha). To calculate the costs arising from
saline water supplies (Parts C & D) it is necessary to know the EC units (µS/cm), the total GVAO ($m)
and the total DSE (in 100,000’s).
In the case of the Severn LGA located in the Basin, our survey showed that the salt area was
approximately 355ha, the GVAO per hectare $106, the livestock intensity 7.71 dse/ha, the EC of the
water 770µS/cm, the total GVAO $28 million and the total DSE approximately 2,030,000.
Therefore the annual total costs to dryland agricultural producers for repairs and maintenance in the
Severn LGA was estimated by summing each of the components below:
A. Cost Function: $0.60 per salt area (ha) per GVAO ($/ha)
Salt Area: 355 ha GVAO: $106/ha
Cost: 0.60 x 355 x 106 = $22,580
B. Cost Function: $12.32 per salt area (ha) per livestock intensity (DSE/ha)
Salt Area: 355 ha livestock intensity: 7.71 dse/ha
Cost: 12.32 x 355 x 7.71 = $33,720
C. Cost Function: $0.19 per EC unit (µS/cm) per total GVAO ($m)
EC of water: 770 µS/cm TGVAO: $28m
Cost: 0.19 x 770 x 28 = $4,100
D. Cost Function: $3.91 per EC unit (µS/cm) per total 100,000 DSE
EC of water: 770 (µS/cm) Total DSE: 2,030,000
Cost: 3.91 x 770 x 20.3 = $61,120
Therefore the total annual cost for repairs and maintenance to dryland agricultural producers in the
Severn LGA was estimated equal to:
$22,580 + $33,720 + $4,100 + $61,120 = $121,520
To calculate the overall annual costs to dryland agricultural producers in the LGA the same steps should
be repeated, but using the total cost functions on the bottom line of Table 2.
4.3 Rural and urban households
4.3.1 Background
Survey-based approaches generally provide
unreliable estimates of the cost of high saline
watertables to urban and rural households for two
main reasons:
• Most householders have a low awareness of the
nature and cost of salinity impacts.
• Most householders demonstrate a poor ability
to separate costs caused by salinity and high
watertables from those caused by other factors
(Ivey 1988).
With these limitations in mind, the suggested
approach for estimating the cost of high saline
watertables to rural and urban households is outlined
below (Details for estimating saline water costs
appears in Section 4.4).
• Work through Section 4.3.2 if you noted in
your checklist that there are rural areas in
your study area currently affected by dryland
salinity, or are at risk.
• Work through Section 4.3.3 if you noted
in your checklist that there are towns or
cities in your study area suffering urban
salinity problems, or are at risk (refer back
to section 3.3 if you are unsure).
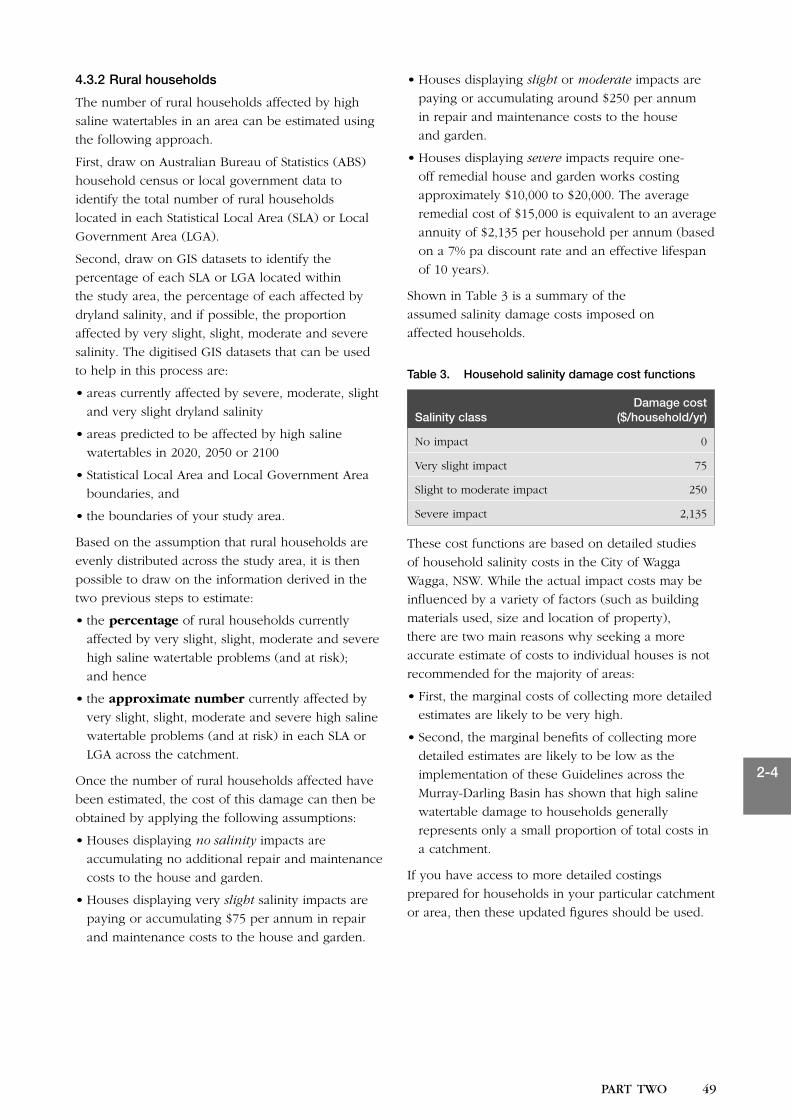
48 PART TWO
2-4
PART TWO 49
4.3.2 Rural households
The number of rural households affected by high
saline watertables in an area can be estimated using
the following approach.
First, draw on Australian Bureau of Statistics (ABS)
household census or local government data to
identify the total number of rural households
located in each Statistical Local Area (SLA) or Local
Government Area (LGA).
Second, draw on GIS datasets to identify the
percentage of each SLA or LGA located within
the study area, the percentage of each affected by
dryland salinity, and if possible, the proportion
affected by very slight, slight, moderate and severe
salinity. The digitised GIS datasets that can be used
to help in this process are:
• areas currently affected by severe, moderate, slight
and very slight dryland salinity
• areas predicted to be affected by high saline
watertables in 2020, 2050 or 2100
• Statistical Local Area and Local Government Area
boundaries, and
• the boundaries of your study area.
Based on the assumption that rural households are
evenly distributed across the study area, it is then
possible to draw on the information derived in the
two previous steps to estimate:
• the percentage of rural households currently
affected by very slight, slight, moderate and severe
high saline watertable problems (and at risk);
and hence
• the approximate number currently affected by
very slight, slight, moderate and severe high saline
watertable problems (and at risk) in each SLA or
LGA across the catchment.
Once the number of rural households affected have
been estimated, the cost of this damage can then be
obtained by applying the following assumptions:
• Houses displaying no salinity impacts are
accumulating no additional repair and maintenance
costs to the house and garden.
• Houses displaying very slight salinity impacts are
paying or accumulating $75 per annum in repair
and maintenance costs to the house and garden.
• Houses displaying slight or moderate impacts are
paying or accumulating around $250 per annum
in repair and maintenance costs to the house
and garden.
• Houses displaying severe impacts require one-
off remedial house and garden works costing
approximately $10,000 to $20,000. The average
remedial cost of $15,000 is equivalent to an average
annuity of $2,135 per household per annum (based
on a 7% pa discount rate and an effective lifespan
of 10 years).
Shown in Table 3 is a summary of the
assumed salinity damage costs imposed on
affected households.
Table 3. Household salinity damage cost functions
Salinity classDamage cost
($/household/yr)
No impact 0
Very slight impact 75
Slight to moderate impact 250
Severe impact 2,135
These cost functions are based on detailed studies
of household salinity costs in the City of Wagga
Wagga, NSW. While the actual impact costs may be
influenced by a variety of factors (such as building
materials used, size and location of property),
there are two main reasons why seeking a more
accurate estimate of costs to individual houses is not
recommended for the majority of areas:
• First, the marginal costs of collecting more detailed
estimates are likely to be very high.
• Second, the marginal benefits of collecting more
detailed estimates are likely to be low as the
implementation of these Guidelines across the
Murray-Darling Basin has shown that high saline
watertable damage to households generally
represents only a small proportion of total costs in
a catchment.
If you have access to more detailed costings
prepared for households in your particular catchment
or area, then these updated figures should be used.
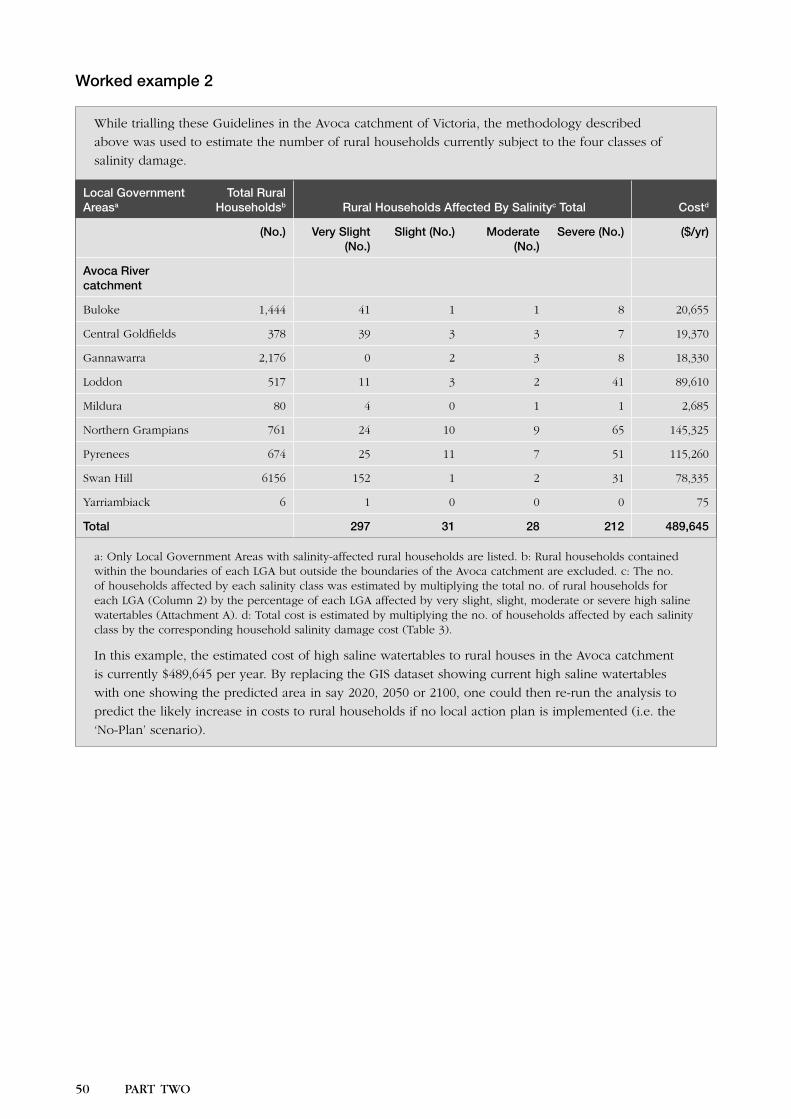
50 PART TWO
2-4
PART TWO 51
Worked example 2
While trialling these Guidelines in the Avoca catchment of Victoria, the methodology described
above was used to estimate the number of rural households currently subject to the four classes of
salinity damage.
Local Government Areasa
Total Rural Householdsb Rural Households Affected By Salinityc Total Costd
(No.) Very Slight (No.)
Slight (No.) Moderate (No.)
Severe (No.) ($/yr)
Avoca River catchment
Buloke 1,444 41 1 1 8 20,655
Central Goldfields 378 39 3 3 7 19,370
Gannawarra 2,176 0 2 3 8 18,330
Loddon 517 11 3 2 41 89,610
Mildura 80 4 0 1 1 2,685
Northern Grampians 761 24 10 9 65 145,325
Pyrenees 674 25 11 7 51 115,260
Swan Hill 6156 152 1 2 31 78,335
Yarriambiack 6 1 0 0 0 75
Total 297 31 28 212 489,645
a: Only Local Government Areas with salinity-affected rural households are listed. b: Rural households contained within the boundaries of each LGA but outside the boundaries of the Avoca catchment are excluded. c: The no. of households affected by each salinity class was estimated by multiplying the total no. of rural households for each LGA (Column 2) by the percentage of each LGA affected by very slight, slight, moderate or severe high saline watertables (Attachment A). d: Total cost is estimated by multiplying the no. of households affected by each salinity class by the corresponding household salinity damage cost (Table 3).
In this example, the estimated cost of high saline watertables to rural houses in the Avoca catchment
is currently $489,645 per year. By replacing the GIS dataset showing current high saline watertables
with one showing the predicted area in say 2020, 2050 or 2100, one could then re-run the analysis to
predict the likely increase in costs to rural households if no local action plan is implemented (i.e. the
‘No-Plan’ scenario).
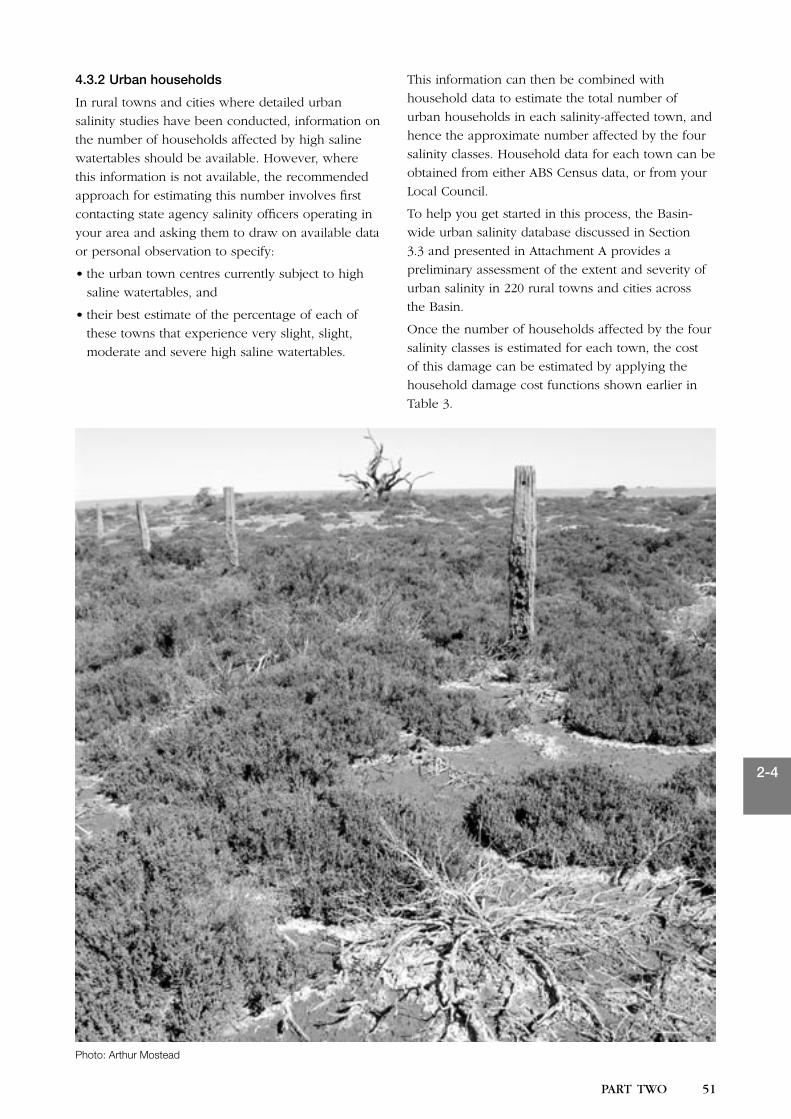
50 PART TWO
2-4
PART TWO 51
4.3.2 Urban households
In rural towns and cities where detailed urban
salinity studies have been conducted, information on
the number of households affected by high saline
watertables should be available. However, where
this information is not available, the recommended
approach for estimating this number involves first
contacting state agency salinity officers operating in
your area and asking them to draw on available data
or personal observation to specify:
• the urban town centres currently subject to high
saline watertables, and
• their best estimate of the percentage of each of
these towns that experience very slight, slight,
moderate and severe high saline watertables.
This information can then be combined with
household data to estimate the total number of
urban households in each salinity-affected town, and
hence the approximate number affected by the four
salinity classes. Household data for each town can be
obtained from either ABS Census data, or from your
Local Council.
To help you get started in this process, the Basin-
wide urban salinity database discussed in Section
3.3 and presented in Attachment A provides a
preliminary assessment of the extent and severity of
urban salinity in 220 rural towns and cities across
the Basin.
Once the number of households affected by the four
salinity classes is estimated for each town, the cost
of this damage can be estimated by applying the
household damage cost functions shown earlier in
Table 3.
Photo: Arthur Mostead
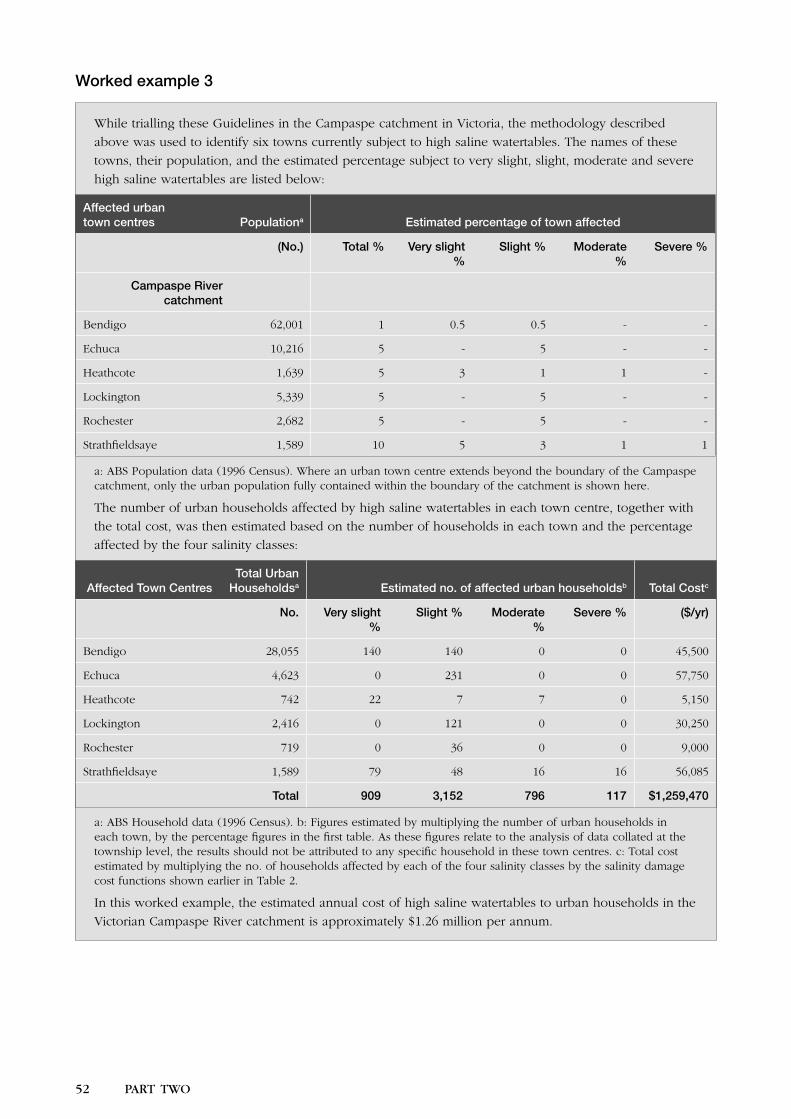
52 PART TWO
2-4
PART TWO 53
Worked example 3
While trialling these Guidelines in the Campaspe catchment in Victoria, the methodology described
above was used to identify six towns currently subject to high saline watertables. The names of these
towns, their population, and the estimated percentage subject to very slight, slight, moderate and severe
high saline watertables are listed below:
Affected urban town centres Populationa Estimated percentage of town affected
(No.) Total % Very slight %
Slight % Moderate %
Severe %
Campaspe River catchment
Bendigo 62,001 1 0.5 0.5 - -
Echuca 10,216 5 - 5 - -
Heathcote 1,639 5 3 1 1 -
Lockington 5,339 5 - 5 - -
Rochester 2,682 5 - 5 - -
Strathfieldsaye 1,589 10 5 3 1 1
a: ABS Population data (1996 Census). Where an urban town centre extends beyond the boundary of the Campaspe catchment, only the urban population fully contained within the boundary of the catchment is shown here.
The number of urban households affected by high saline watertables in each town centre, together with
the total cost, was then estimated based on the number of households in each town and the percentage
affected by the four salinity classes:
Affected Town Centres Total Urban
Householdsa Estimated no. of affected urban householdsb Total Costc
No. Very slight %
Slight % Moderate %
Severe % ($/yr)
Bendigo 28,055 140 140 0 0 45,500
Echuca 4,623 0 231 0 0 57,750
Heathcote 742 22 7 7 0 5,150
Lockington 2,416 0 121 0 0 30,250
Rochester 719 0 36 0 0 9,000
Strathfieldsaye 1,589 79 48 16 16 56,085
Total 909 3,152 796 117 $1,259,470
a: ABS Household data (1996 Census). b: Figures estimated by multiplying the number of urban households in each town, by the percentage figures in the first table. As these figures relate to the analysis of data collated at the township level, the results should not be attributed to any specific household in these town centres. c: Total cost estimated by multiplying the no. of households affected by each of the four salinity classes by the salinity damage cost functions shown earlier in Table 2.
In this worked example, the estimated annual cost of high saline watertables to urban households in the
Victorian Campaspe River catchment is approximately $1.26 million per annum.
52 PART TWO
2-4
PART TWO 53
4.4 Commerce and industry
4.3.1 Background
There are a variety of commercial, retail and
industrial businesses that may incur costs from high
saline watertables. These include:
• retail outlets (e.g. plant nurseries, clothing stores
and take away food shops)
• hospitality businesses (e.g. hotels, clubs, motels
and restaurants)
• service centres (e.g. banks, hospitals, nursing
homes, accountancy firms and stock agents), and
• manufacturing premises (e.g. printing works and
food processors).
Survey-based approaches generally give unreliable
estimates of the current costs of high saline
watertables
to urban businesses for two main reasons:
• Most business staff have a low awareness of the
nature and cost of salinity impacts.
• Most business staff demonstrate a poor ability to
separate costs caused by high saline watertables
from those caused by other factors.
Earlier trialling of the Guidelines also demonstrated
that the cost of high saline watertables to businesses
was relatively low compared to the costs imposed on
the other stakeholder groups.
With these issues in mind, two complementary
approaches for estimating the cost of high saline
watertables to commercial, retail and industrial
businesses are outlined below.
• Work through this section only if you noted in your
checklist that there are towns or cities in your
study area are currently suffering urban salinity
problems, or are at risk (refer back to Section 3.3 if
you are unsure).
4.4.1 Low cost approach
The following approach provides a particularly useful
low-cost method to estimate of the cost of high
saline watertables to commercial, retail and industrial
businesses in towns or cities with an urban salinity
problem.
In rural towns and cities where detailed urban
salinity studies have been conducted, information on
the number of commercial and industrial buildings
affected by high saline watertables (or at risk) should
be available. However, where this information is not
available, the following three-stepped approach can
be used.
Step 1 involves drawing on the information compiled
on the current and predicted future extent and
severity of urban salinity in the study area (after
working through section 4.3) to identify:
• the urban town centres affected by high
saline watertables
• their population, and
• the percentage of each town affected by very
slight, slight, moderate and severe salinity.
Step 2 then involves identifying the number of
commercial, retail and industrial buildings located in
each salinity-affected town. This information may be
obtained from your local government, Chamber of
Commerce or regional water authority. Alternatively,
the numbers can be estimated using the formulas
shown in Box 1. These formulas describe the
relationship between the size of an urban centre
and the typical number of commercial, retail and
industrial buildings. Full details of the methods
used to generate these formulas appear in an earlier
project report Wilson (2002).
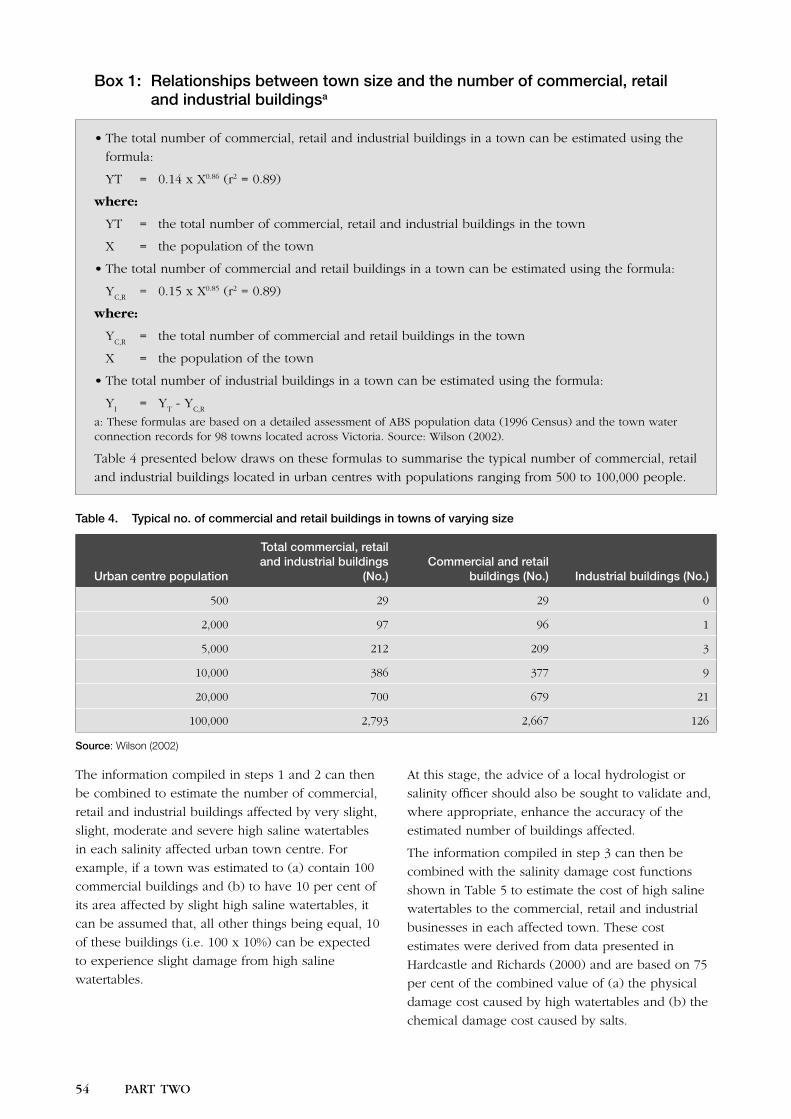
54 PART TWO
2-4
PART TWO 55
Box 1: Relationships between town size and the number of commercial, retail and industrial buildingsa
• The total number of commercial, retail and industrial buildings in a town can be estimated using the
formula:
YT = 0.14 x X0.86 (r2 = 0.89)
where:
YT = the total number of commercial, retail and industrial buildings in the town
X = the population of the town
• The total number of commercial and retail buildings in a town can be estimated using the formula:
YC,R
= 0.15 x X0.85 (r2 = 0.89)
where:
YC,R
= the total number of commercial and retail buildings in the town
X = the population of the town
• The total number of industrial buildings in a town can be estimated using the formula:
YI = Y
T - Y
C,R
a: These formulas are based on a detailed assessment of ABS population data (1996 Census) and the town water connection records for 98 towns located across Victoria. Source: Wilson (2002).
Table 4 presented below draws on these formulas to summarise the typical number of commercial, retail
and industrial buildings located in urban centres with populations ranging from 500 to 100,000 people.
Table 4. Typical no. of commercial and retail buildings in towns of varying size
Urban centre population
Total commercial, retail and industrial buildings
(No.)Commercial and retail
buildings (No.) Industrial buildings (No.)
500 29 29 0
2,000 97 96 1
5,000 212 209 3
10,000 386 377 9
20,000 700 679 21
100,000 2,793 2,667 126
Source: Wilson (2002)
The information compiled in steps 1 and 2 can then
be combined to estimate the number of commercial,
retail and industrial buildings affected by very slight,
slight, moderate and severe high saline watertables
in each salinity affected urban town centre. For
example, if a town was estimated to (a) contain 100
commercial buildings and (b) to have 10 per cent of
its area affected by slight high saline watertables, it
can be assumed that, all other things being equal, 10
of these buildings (i.e. 100 x 10%) can be expected
to experience slight damage from high saline
watertables.
At this stage, the advice of a local hydrologist or
salinity officer should also be sought to validate and,
where appropriate, enhance the accuracy of the
estimated number of buildings affected.
The information compiled in step 3 can then be
combined with the salinity damage cost functions
shown in Table 5 to estimate the cost of high saline
watertables to the commercial, retail and industrial
businesses in each affected town. These cost
estimates were derived from data presented in
Hardcastle and Richards (2000) and are based on 75
per cent of the combined value of (a) the physical
damage cost caused by high watertables and (b) the
chemical damage cost caused by salts.
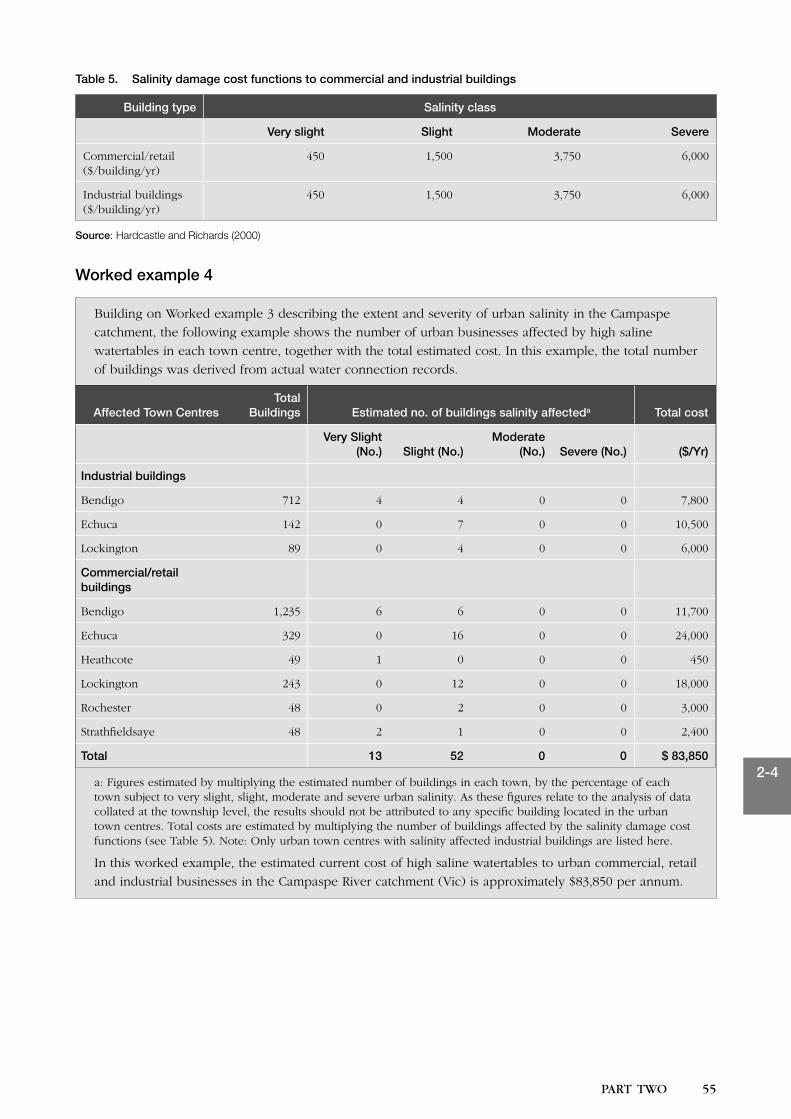
54 PART TWO
2-4
PART TWO 55
Table 5. Salinity damage cost functions to commercial and industrial buildings
Building type Salinity class
Very slight Slight Moderate Severe
Commercial/retail ($/building/yr)
450 1,500 3,750 6,000
Industrial buildings ($/building/yr)
450 1,500 3,750 6,000
Source: Hardcastle and Richards (2000)
Worked example 4
Building on Worked example 3 describing the extent and severity of urban salinity in the Campaspe
catchment, the following example shows the number of urban businesses affected by high saline
watertables in each town centre, together with the total estimated cost. In this example, the total number
of buildings was derived from actual water connection records.
Affected Town CentresTotal
Buildings Estimated no. of buildings salinity affecteda Total cost
Very Slight (No.) Slight (No.)
Moderate (No.) Severe (No.) ($/Yr)
Industrial buildings
Bendigo 712 4 4 0 0 7,800
Echuca 142 0 7 0 0 10,500
Lockington 89 0 4 0 0 6,000
Commercial/retail buildings
Bendigo 1,235 6 6 0 0 11,700
Echuca 329 0 16 0 0 24,000
Heathcote 49 1 0 0 0 450
Lockington 243 0 12 0 0 18,000
Rochester 48 0 2 0 0 3,000
Strathfieldsaye 48 2 1 0 0 2,400
Total 13 52 0 0 $ 83,850
a: Figures estimated by multiplying the estimated number of buildings in each town, by the percentage of each town subject to very slight, slight, moderate and severe urban salinity. As these figures relate to the analysis of data collated at the township level, the results should not be attributed to any specific building located in the urban town centres. Total costs are estimated by multiplying the number of buildings affected by the salinity damage cost functions (see Table 5). Note: Only urban town centres with salinity affected industrial buildings are listed here.
In this worked example, the estimated current cost of high saline watertables to urban commercial, retail
and industrial businesses in the Campaspe River catchment (Vic) is approximately $83,850 per annum.
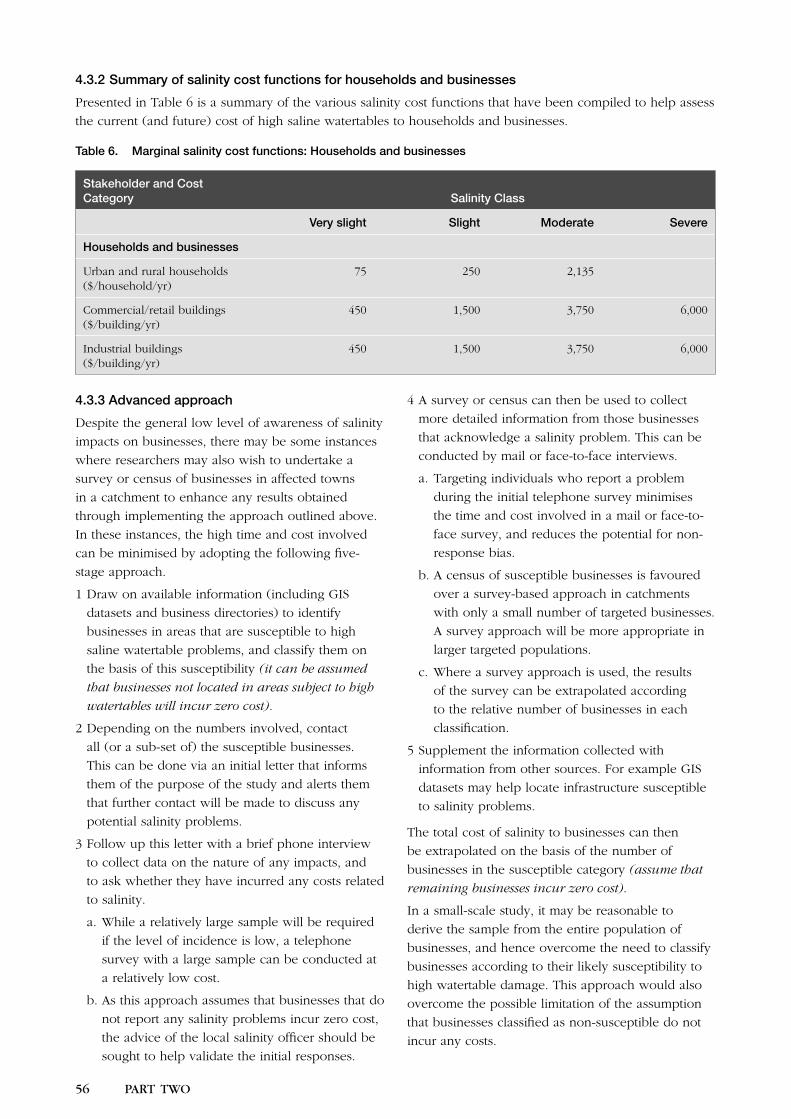
56 PART TWO
2-4
PART TWO 57
4.3.2 Summary of salinity cost functions for households and businesses
Presented in Table 6 is a summary of the various salinity cost functions that have been compiled to help assess
the current (and future) cost of high saline watertables to households and businesses.
Table 6. Marginal salinity cost functions: Households and businesses
Stakeholder and Cost Category Salinity Class
Very slight Slight Moderate Severe
Households and businesses
Urban and rural households ($/household/yr)
75 250 2,135
Commercial/retail buildings ($/building/yr)
450 1,500 3,750 6,000
Industrial buildings ($/building/yr)
450 1,500 3,750 6,000
4.3.3 Advanced approach
Despite the general low level of awareness of salinity
impacts on businesses, there may be some instances
where researchers may also wish to undertake a
survey or census of businesses in affected towns
in a catchment to enhance any results obtained
through implementing the approach outlined above.
In these instances, the high time and cost involved
can be minimised by adopting the following five-
stage approach.
1 Draw on available information (including GIS
datasets and business directories) to identify
businesses in areas that are susceptible to high
saline watertable problems, and classify them on
the basis of this susceptibility (it can be assumed
that businesses not located in areas subject to high
watertables will incur zero cost).
2 Depending on the numbers involved, contact
all (or a sub-set of) the susceptible businesses.
This can be done via an initial letter that informs
them of the purpose of the study and alerts them
that further contact will be made to discuss any
potential salinity problems.
3 Follow up this letter with a brief phone interview
to collect data on the nature of any impacts, and
to ask whether they have incurred any costs related
to salinity.
a. While a relatively large sample will be required
if the level of incidence is low, a telephone
survey with a large sample can be conducted at
a relatively low cost.
b. As this approach assumes that businesses that do
not report any salinity problems incur zero cost,
the advice of the local salinity officer should be
sought to help validate the initial responses.
4 A survey or census can then be used to collect
more detailed information from those businesses
that acknowledge a salinity problem. This can be
conducted by mail or face-to-face interviews.
a. Targeting individuals who report a problem
during the initial telephone survey minimises
the time and cost involved in a mail or face-to-
face survey, and reduces the potential for non-
response bias.
b. A census of susceptible businesses is favoured
over a survey-based approach in catchments
with only a small number of targeted businesses.
A survey approach will be more appropriate in
larger targeted populations.
c. Where a survey approach is used, the results
of the survey can be extrapolated according
to the relative number of businesses in each
classification.
5 Supplement the information collected with
information from other sources. For example GIS
datasets may help locate infrastructure susceptible
to salinity problems.
The total cost of salinity to businesses can then
be extrapolated on the basis of the number of
businesses in the susceptible category (assume that
remaining businesses incur zero cost).
In a small-scale study, it may be reasonable to
derive the sample from the entire population of
businesses, and hence overcome the need to classify
businesses according to their likely susceptibility to
high watertable damage. This approach would also
overcome the possible limitation of the assumption
that businesses classified as non-susceptible do not
incur any costs.
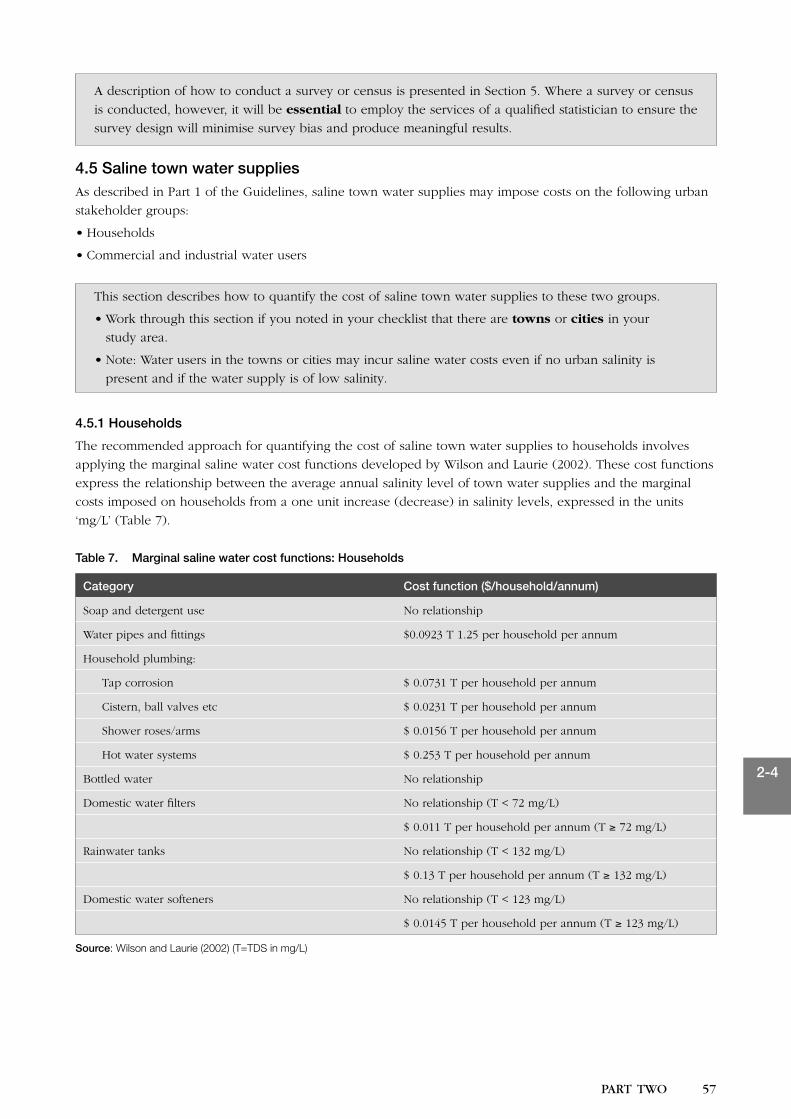
56 PART TWO
2-4
PART TWO 57
A description of how to conduct a survey or census is presented in Section 5. Where a survey or census
is conducted, however, it will be essential to employ the services of a qualified statistician to ensure the
survey design will minimise survey bias and produce meaningful results.
4.5 Saline town water suppliesAs described in Part 1 of the Guidelines, saline town water supplies may impose costs on the following urban
stakeholder groups:
• Households
• Commercial and industrial water users
This section describes how to quantify the cost of saline town water supplies to these two groups.
• Work through this section if you noted in your checklist that there are towns or cities in your
study area.
• Note: Water users in the towns or cities may incur saline water costs even if no urban salinity is
present and if the water supply is of low salinity.
4.5.1 Households
The recommended approach for quantifying the cost of saline town water supplies to households involves
applying the marginal saline water cost functions developed by Wilson and Laurie (2002). These cost functions
express the relationship between the average annual salinity level of town water supplies and the marginal
costs imposed on households from a one unit increase (decrease) in salinity levels, expressed in the units
‘mg/L’ (Table 7).
Table 7. Marginal saline water cost functions: Households
Category Cost function ($/household/annum)
Soap and detergent use No relationship
Water pipes and fittings $0.0923 T 1.25 per household per annum
Household plumbing:
Tap corrosion $ 0.0731 T per household per annum
Cistern, ball valves etc $ 0.0231 T per household per annum
Shower roses/arms $ 0.0156 T per household per annum
Hot water systems $ 0.253 T per household per annum
Bottled water No relationship
Domestic water filters No relationship (T < 72 mg/L)
$ 0.011 T per household per annum (T ≥ 72 mg/L)
Rainwater tanks No relationship (T < 132 mg/L)
$ 0.13 T per household per annum (T ≥ 132 mg/L)
Domestic water softeners No relationship (T < 123 mg/L)
$ 0.0145 T per household per annum (T ≥ 123 mg/L)
Source: Wilson and Laurie (2002) (T=TDS in mg/L)
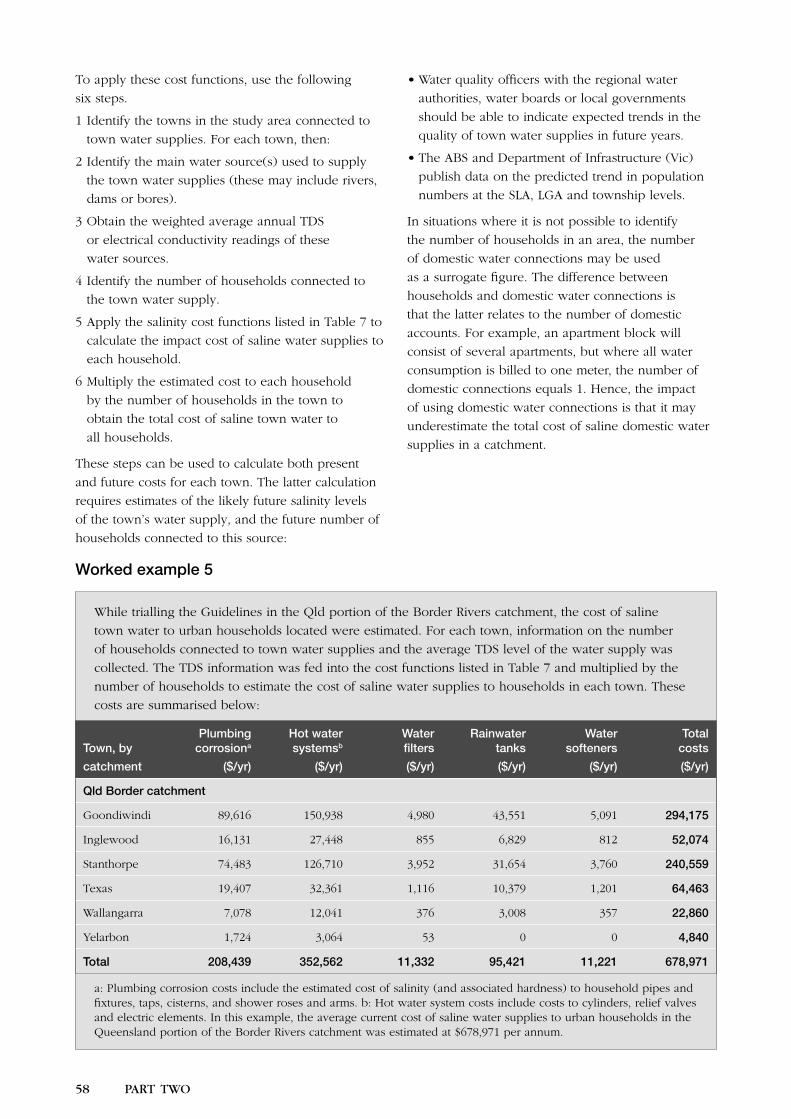
58 PART TWO
2-4
PART TWO 59
To apply these cost functions, use the following
six steps.
1 Identify the towns in the study area connected to
town water supplies. For each town, then:
2 Identify the main water source(s) used to supply
the town water supplies (these may include rivers,
dams or bores).
3 Obtain the weighted average annual TDS
or electrical conductivity readings of these
water sources.
4 Identify the number of households connected to
the town water supply.
5 Apply the salinity cost functions listed in Table 7 to
calculate the impact cost of saline water supplies to
each household.
6 Multiply the estimated cost to each household
by the number of households in the town to
obtain the total cost of saline town water to
all households.
These steps can be used to calculate both present
and future costs for each town. The latter calculation
requires estimates of the likely future salinity levels
of the town’s water supply, and the future number of
households connected to this source:
• Water quality officers with the regional water
authorities, water boards or local governments
should be able to indicate expected trends in the
quality of town water supplies in future years.
• The ABS and Department of Infrastructure (Vic)
publish data on the predicted trend in population
numbers at the SLA, LGA and township levels.
In situations where it is not possible to identify
the number of households in an area, the number
of domestic water connections may be used
as a surrogate figure. The difference between
households and domestic water connections is
that the latter relates to the number of domestic
accounts. For example, an apartment block will
consist of several apartments, but where all water
consumption is billed to one meter, the number of
domestic connections equals 1. Hence, the impact
of using domestic water connections is that it may
underestimate the total cost of saline domestic water
supplies in a catchment.
Worked example 5
While trialling the Guidelines in the Qld portion of the Border Rivers catchment, the cost of saline
town water to urban households located were estimated. For each town, information on the number
of households connected to town water supplies and the average TDS level of the water supply was
collected. The TDS information was fed into the cost functions listed in Table 7 and multiplied by the
number of households to estimate the cost of saline water supplies to households in each town. These
costs are summarised below:
Town, by
catchment
Plumbingcorrosiona
($/yr)
Hot watersystemsb
($/yr)
Waterfilters
($/yr)
Rainwatertanks
($/yr)
Watersofteners
($/yr)
Totalcosts
($/yr)
Qld Border catchment
Goondiwindi 89,616 150,938 4,980 43,551 5,091 294,175
Inglewood 16,131 27,448 855 6,829 812 52,074
Stanthorpe 74,483 126,710 3,952 31,654 3,760 240,559
Texas 19,407 32,361 1,116 10,379 1,201 64,463
Wallangarra 7,078 12,041 376 3,008 357 22,860
Yelarbon 1,724 3,064 53 0 0 4,840
Total 208,439 352,562 11,332 95,421 11,221 678,971
a: Plumbing corrosion costs include the estimated cost of salinity (and associated hardness) to household pipes and fixtures, taps, cisterns, and shower roses and arms. b: Hot water system costs include costs to cylinders, relief valves and electric elements. In this example, the average current cost of saline water supplies to urban households in the Queensland portion of the Border Rivers catchment was estimated at $678,971 per annum.
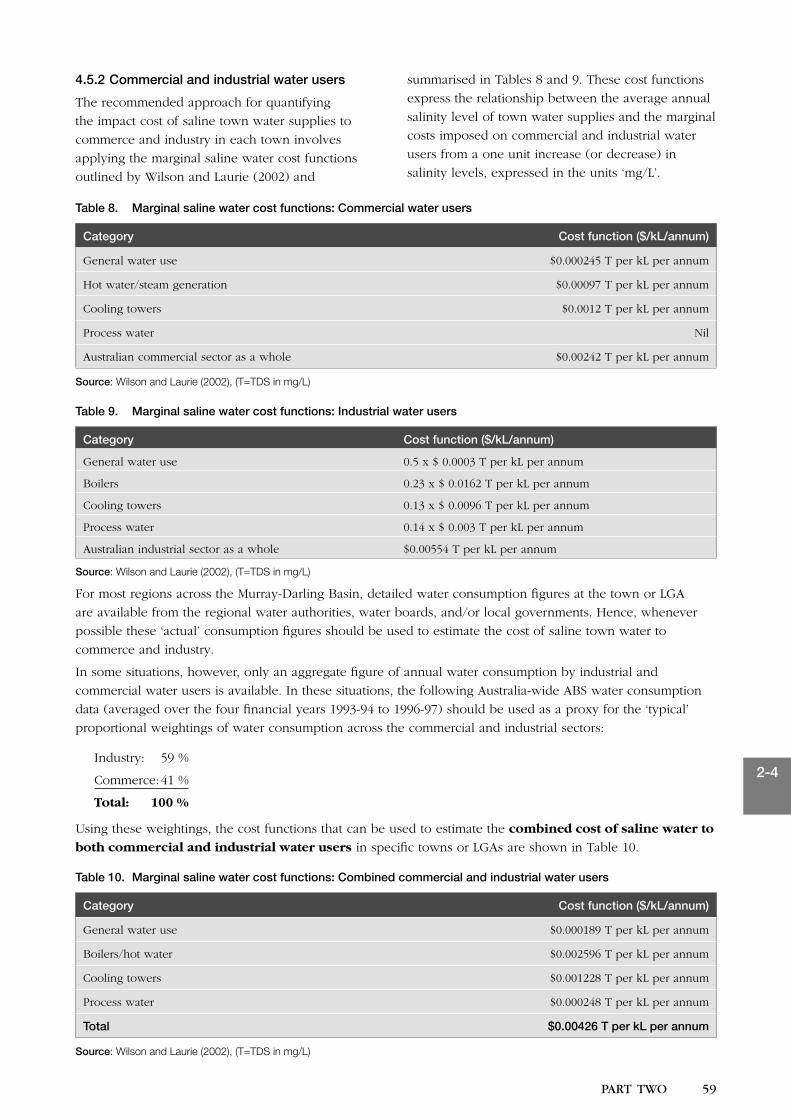
58 PART TWO
2-4
PART TWO 59
4.5.2 Commercial and industrial water users
The recommended approach for quantifying
the impact cost of saline town water supplies to
commerce and industry in each town involves
applying the marginal saline water cost functions
outlined by Wilson and Laurie (2002) and
summarised in Tables 8 and 9. These cost functions
express the relationship between the average annual
salinity level of town water supplies and the marginal
costs imposed on commercial and industrial water
users from a one unit increase (or decrease) in
salinity levels, expressed in the units ‘mg/L’.
Table 8. Marginal saline water cost functions: Commercial water users
Category Cost function ($/kL/annum)
General water use $0.000245 T per kL per annum
Hot water/steam generation $0.00097 T per kL per annum
Cooling towers $0.0012 T per kL per annum
Process water Nil
Australian commercial sector as a whole $0.00242 T per kL per annum
Source: Wilson and Laurie (2002), (T=TDS in mg/L)
Table 9. Marginal saline water cost functions: Industrial water users
Category Cost function ($/kL/annum)
General water use 0.5 x $ 0.0003 T per kL per annum
Boilers 0.23 x $ 0.0162 T per kL per annum
Cooling towers 0.13 x $ 0.0096 T per kL per annum
Process water 0.14 x $ 0.003 T per kL per annum
Australian industrial sector as a whole $0.00554 T per kL per annum
Source: Wilson and Laurie (2002), (T=TDS in mg/L)
For most regions across the Murray-Darling Basin, detailed water consumption figures at the town or LGA
are available from the regional water authorities, water boards, and/or local governments. Hence, whenever
possible these ‘actual’ consumption figures should be used to estimate the cost of saline town water to
commerce and industry.
In some situations, however, only an aggregate figure of annual water consumption by industrial and
commercial water users is available. In these situations, the following Australia-wide ABS water consumption
data (averaged over the four financial years 1993-94 to 1996-97) should be used as a proxy for the ‘typical’
proportional weightings of water consumption across the commercial and industrial sectors:
Industry: 59 %
Commerce: 41 %
Total: 100 %
Using these weightings, the cost functions that can be used to estimate the combined cost of saline water to
both commercial and industrial water users in specific towns or LGAs are shown in Table 10.
Table 10. Marginal saline water cost functions: Combined commercial and industrial water users
Category Cost function ($/kL/annum)
General water use $0.000189 T per kL per annum
Boilers/hot water $0.002596 T per kL per annum
Cooling towers $0.001228 T per kL per annum
Process water $0.000248 T per kL per annum
Total $0.00426 T per kL per annum
Source: Wilson and Laurie (2002), (T=TDS in mg/L)
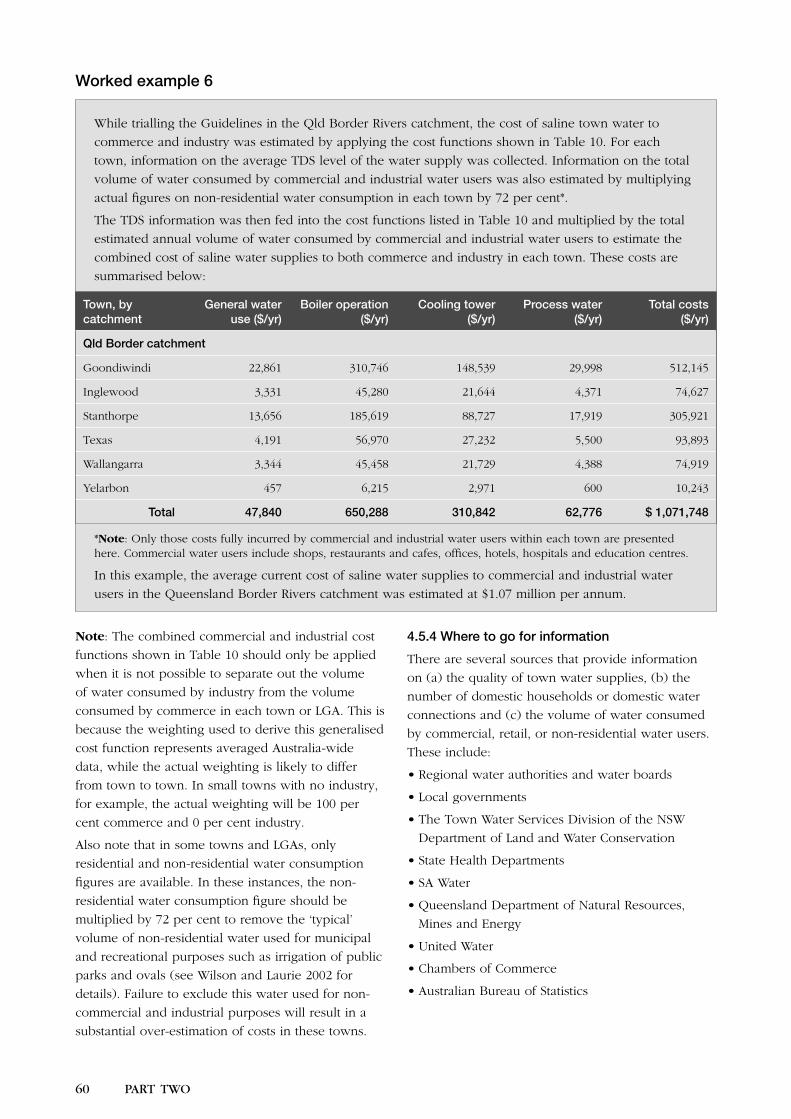
60 PART TWO
2-4
PART TWO 61
Worked example 6
While trialling the Guidelines in the Qld Border Rivers catchment, the cost of saline town water to
commerce and industry was estimated by applying the cost functions shown in Table 10. For each
town, information on the average TDS level of the water supply was collected. Information on the total
volume of water consumed by commercial and industrial water users was also estimated by multiplying
actual figures on non-residential water consumption in each town by 72 per cent*.
The TDS information was then fed into the cost functions listed in Table 10 and multiplied by the total
estimated annual volume of water consumed by commercial and industrial water users to estimate the
combined cost of saline water supplies to both commerce and industry in each town. These costs are
summarised below:
Town, by catchment
General water use ($/yr)
Boiler operation ($/yr)
Cooling tower ($/yr)
Process water ($/yr)
Total costs ($/yr)
Qld Border catchment
Goondiwindi 22,861 310,746 148,539 29,998 512,145
Inglewood 3,331 45,280 21,644 4,371 74,627
Stanthorpe 13,656 185,619 88,727 17,919 305,921
Texas 4,191 56,970 27,232 5,500 93,893
Wallangarra 3,344 45,458 21,729 4,388 74,919
Yelarbon 457 6,215 2,971 600 10,243
Total 47,840 650,288 310,842 62,776 $ 1,071,748
*Note: Only those costs fully incurred by commercial and industrial water users within each town are presented here. Commercial water users include shops, restaurants and cafes, offices, hotels, hospitals and education centres.
In this example, the average current cost of saline water supplies to commercial and industrial water
users in the Queensland Border Rivers catchment was estimated at $1.07 million per annum.
Note: The combined commercial and industrial cost
functions shown in Table 10 should only be applied
when it is not possible to separate out the volume
of water consumed by industry from the volume
consumed by commerce in each town or LGA. This is
because the weighting used to derive this generalised
cost function represents averaged Australia-wide
data, while the actual weighting is likely to differ
from town to town. In small towns with no industry,
for example, the actual weighting will be 100 per
cent commerce and 0 per cent industry.
Also note that in some towns and LGAs, only
residential and non-residential water consumption
figures are available. In these instances, the non-
residential water consumption figure should be
multiplied by 72 per cent to remove the ‘typical’
volume of non-residential water used for municipal
and recreational purposes such as irrigation of public
parks and ovals (see Wilson and Laurie 2002 for
details). Failure to exclude this water used for non-
commercial and industrial purposes will result in a
substantial over-estimation of costs in these towns.
4.5.4 Where to go for information
There are several sources that provide information
on (a) the quality of town water supplies, (b) the
number of domestic households or domestic water
connections and (c) the volume of water consumed
by commercial, retail, or non-residential water users.
These include:
• Regional water authorities and water boards
• Local governments
• The Town Water Services Division of the NSW
Department of Land and Water Conservation
• State Health Departments
• SA Water
• Queensland Department of Natural Resources,
Mines and Energy
• United Water
• Chambers of Commerce
• Australian Bureau of Statistics
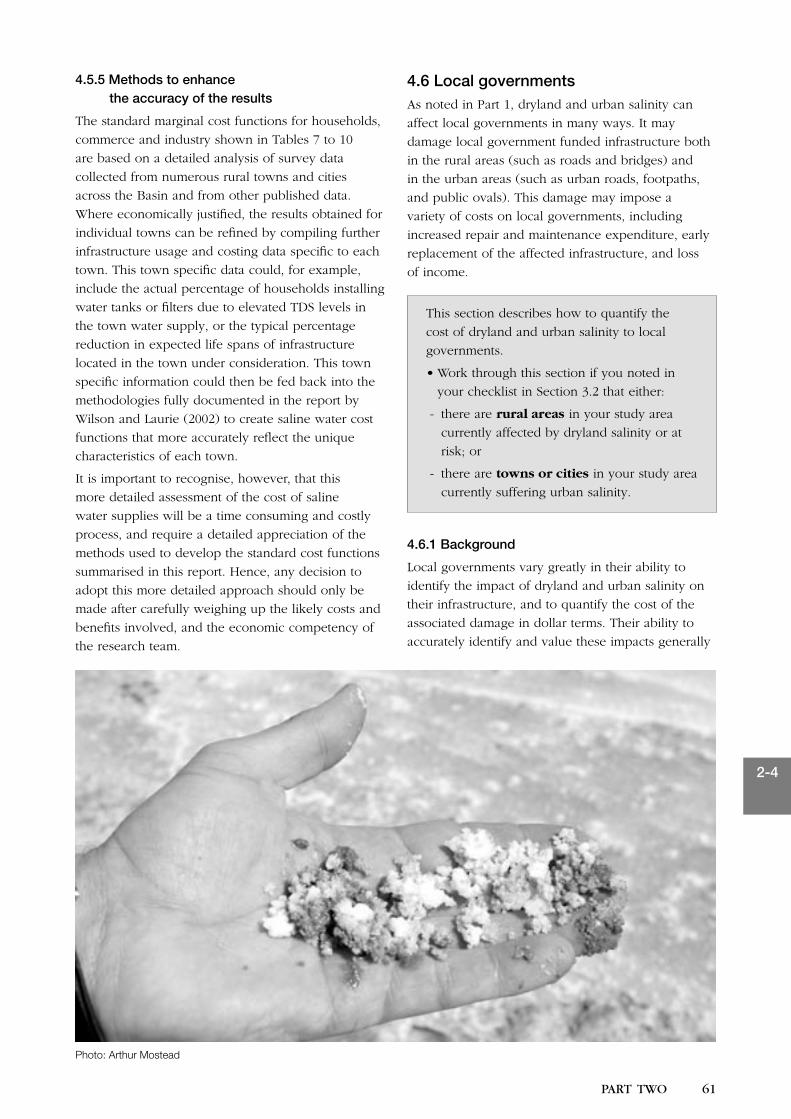
60 PART TWO
2-4
PART TWO 61
4.5.5 Methods to enhance the accuracy of the results
The standard marginal cost functions for households,
commerce and industry shown in Tables 7 to 10
are based on a detailed analysis of survey data
collected from numerous rural towns and cities
across the Basin and from other published data.
Where economically justified, the results obtained for
individual towns can be refined by compiling further
infrastructure usage and costing data specific to each
town. This town specific data could, for example,
include the actual percentage of households installing
water tanks or filters due to elevated TDS levels in
the town water supply, or the typical percentage
reduction in expected life spans of infrastructure
located in the town under consideration. This town
specific information could then be fed back into the
methodologies fully documented in the report by
Wilson and Laurie (2002) to create saline water cost
functions that more accurately reflect the unique
characteristics of each town.
It is important to recognise, however, that this
more detailed assessment of the cost of saline
water supplies will be a time consuming and costly
process, and require a detailed appreciation of the
methods used to develop the standard cost functions
summarised in this report. Hence, any decision to
adopt this more detailed approach should only be
made after carefully weighing up the likely costs and
benefits involved, and the economic competency of
the research team.
4.6 Local governmentsAs noted in Part 1, dryland and urban salinity can
affect local governments in many ways. It may
damage local government funded infrastructure both
in the rural areas (such as roads and bridges) and
in the urban areas (such as urban roads, footpaths,
and public ovals). This damage may impose a
variety of costs on local governments, including
increased repair and maintenance expenditure, early
replacement of the affected infrastructure, and loss
of income.
This section describes how to quantify the
cost of dryland and urban salinity to local
governments.
• Work through this section if you noted in
your checklist in Section 3.2 that either:
- there are rural areas in your study area
currently affected by dryland salinity or at
risk; or
- there are towns or cities in your study area
currently suffering urban salinity.
4.6.1 Background
Local governments vary greatly in their ability to
identify the impact of dryland and urban salinity on
their infrastructure, and to quantify the cost of the
associated damage in dollar terms. Their ability to
accurately identify and value these impacts generally
Photo: Arthur Mostead
62 PART TWO
2-4
PART TWO 63
decrease substantially in areas where salinity is
only an emerging problem and hence community
awareness is low.
With these issues in mind, the suggested approach
for estimating the impact and cost of dryland and
urban salinity to local governments involves using a
combination of techniques as outlined below.
4.6.2 Conduct a survey or census
Conducting a survey or census of local governments
whose boundaries are located either wholly or in
part within the study area provides an excellent
way of collecting information on their perceived
exposure to dryland and urban salinity and the
associated costs. It also enables information on their
actual expenditure on salinity-related preventative
works (such as tree planting) and community
education, research and extension activities to
be collected.
Local government questionnaire
An example questionnaire that can be used to
assess the current nature and costs of dryland and
urban salinity to local government is presented in
Attachment C. This questionnaire helps to collect
information on:
• the nature and impacts of dryland and urban
salinity in the LGA
• additional expenditure on repair and
maintenance activities due to salinity
• increased water treatment costs due to salinity
• increased construction costs due to salinity
• the amount spent on salinity-related
preventative works
• the cost of shortened life spans of salinity
affected infrastructure
• the cost of reduced rate levies due to the
reduction in property values
• loss in income due to the introduction of
rate rebate schemes
• the cost of implementing community
education, research and extension programs
• the source of funds used to meet dryland
and urban salinity costs, and
• whether salinity has led to a reduction in the
quality of services provided to their community.
The following two-stepped approach generally works
well when conducting such a survey or census of
local governments. Step one involves sending the
questionnaire to each local government accompanied
by an introductory letter. Step two then involves
making follow-up phone calls or sending reminder
facsimiles to those local governments that do not
return the questionnaire by the due date. Where
more time and budget is available, a face-to-face
approach also works well.
The example questionnaire recognises the limitations
involved in asking local governments to allocate
costs to a particular catchment. Instead, it relies on
the assumption that it is acceptable to allocate LGA-
wide costs obtained via a survey on a pro-rata $/ha
basis to smaller areas.
For many local governments, no one person will be
aware of all dryland and urban salinity impacts. In
smaller councils, this can be overcome by surveying
one or two key individuals. In the larger councils
such as Dubbo City Council where the costs are
incurred by several separate departments however,
it may be necessary to ask the Mayor to coordinate
a response from each of the relevant departments.
Further details on how to conduct a census or survey
of stakeholders is presented in section 5.
4.6.3 Enhance accuracy of survey results
One of the main difficulties with assessing the cost of
dryland and urban salinity damage to infrastructure
is that the damage is often insidious in nature and
either not recognised or attributed to other causes.
This problem is multiplied when salinity is only an
emerging problem and hence community awareness
is low. For example, local governments may often
not recognise that a subtle increase in the need to
repair damaged footpaths or to increase the fertiliser
application on sports ovals may be attributable to an
emerging salinity problem. Similarly, while council
engineers will generally have a good appreciation of
the costs involved in constructing a new road, they
may be less confident identifying what length of road
is actually affected by dryland and urban salinity, and
the cost of this damage.
Hence, once a survey of local governments in the
study area is complete, it will be highly beneficial
to enhance the accuracy of the results using GIS
analysis and the application of detailed salinity
cost functions.
Rural road impacts and costs
To enhance the accuracy of estimated salinity costs to
local government funded rural roads, the following
digitised GIS datasets should first be combined to
estimate the current (and predicted future) length of
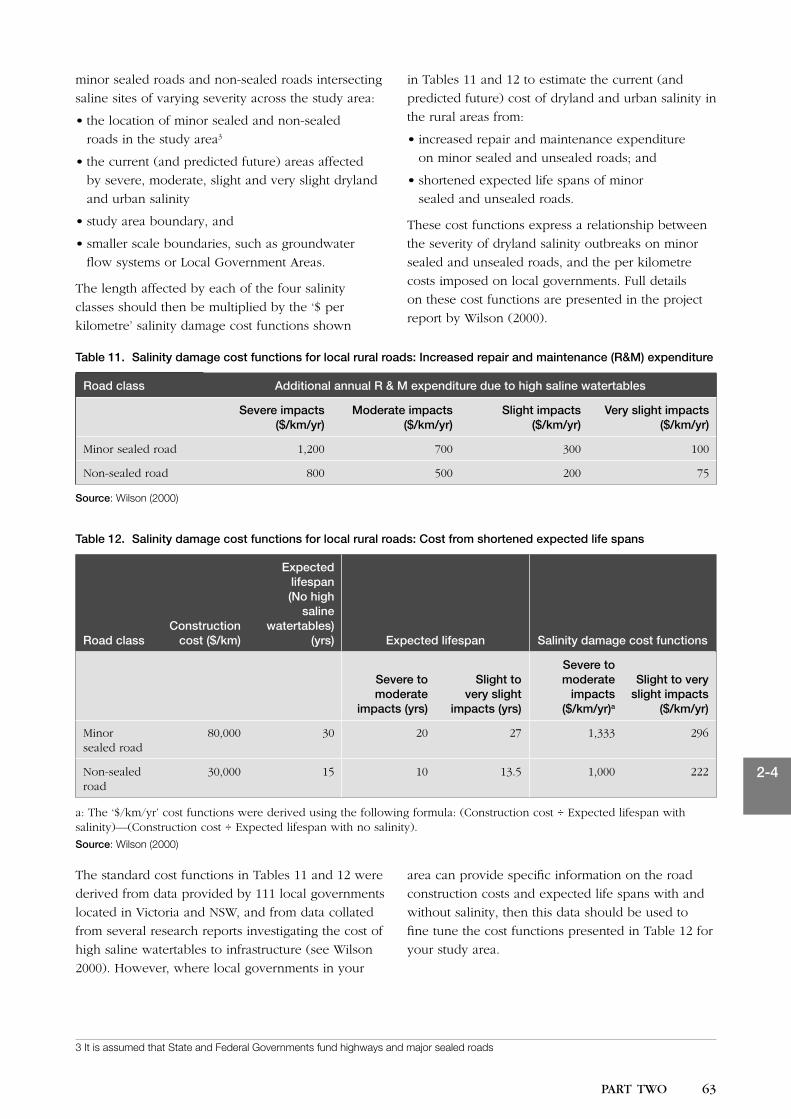
62 PART TWO
2-4
PART TWO 63
minor sealed roads and non-sealed roads intersecting
saline sites of varying severity across the study area:
• the location of minor sealed and non-sealed
roads in the study area3
• the current (and predicted future) areas affected
by severe, moderate, slight and very slight dryland
and urban salinity
• study area boundary, and
• smaller scale boundaries, such as groundwater
flow systems or Local Government Areas.
The length affected by each of the four salinity
classes should then be multiplied by the ‘$ per
kilometre’ salinity damage cost functions shown
in Tables 11 and 12 to estimate the current (and
predicted future) cost of dryland and urban salinity in
the rural areas from:
• increased repair and maintenance expenditure
on minor sealed and unsealed roads; and
• shortened expected life spans of minor
sealed and unsealed roads.
These cost functions express a relationship between
the severity of dryland salinity outbreaks on minor
sealed and unsealed roads, and the per kilometre
costs imposed on local governments. Full details
on these cost functions are presented in the project
report by Wilson (2000).
Table 11. Salinity damage cost functions for local rural roads: Increased repair and maintenance (R&M) expenditure
Road class Additional annual R & M expenditure due to high saline watertables
Severe impacts ($/km/yr)
Moderate impacts ($/km/yr)
Slight impacts ($/km/yr)
Very slight impacts ($/km/yr)
Minor sealed road 1,200 700 300 100
Non-sealed road 800 500 200 75
Source: Wilson (2000)
Table 12. Salinity damage cost functions for local rural roads: Cost from shortened expected life spans
Road classConstruction
cost ($/km)
Expected lifespan (No high
saline watertables)
(yrs) Expected lifespan Salinity damage cost functions
Severe to moderate
impacts (yrs)
Slight to very slight
impacts (yrs)
Severe to moderate
impacts ($/km/yr)a
Slight to very slight impacts
($/km/yr)
Minor sealed road
80,000 30 20 27 1,333 296
Non-sealed road
30,000 15 10 13.5 1,000 222
a: The ‘$/km/yr’ cost functions were derived using the following formula: (Construction cost ÷ Expected lifespan with salinity)—(Construction cost ÷ Expected lifespan with no salinity).
Source: Wilson (2000)
3 It is assumed that State and Federal Governments fund highways and major sealed roads
The standard cost functions in Tables 11 and 12 were
derived from data provided by 111 local governments
located in Victoria and NSW, and from data collated
from several research reports investigating the cost of
high saline watertables to infrastructure (see Wilson
2000). However, where local governments in your
area can provide specific information on the road
construction costs and expected life spans with and
without salinity, then this data should be used to
fine tune the cost functions presented in Table 12 for
your study area.
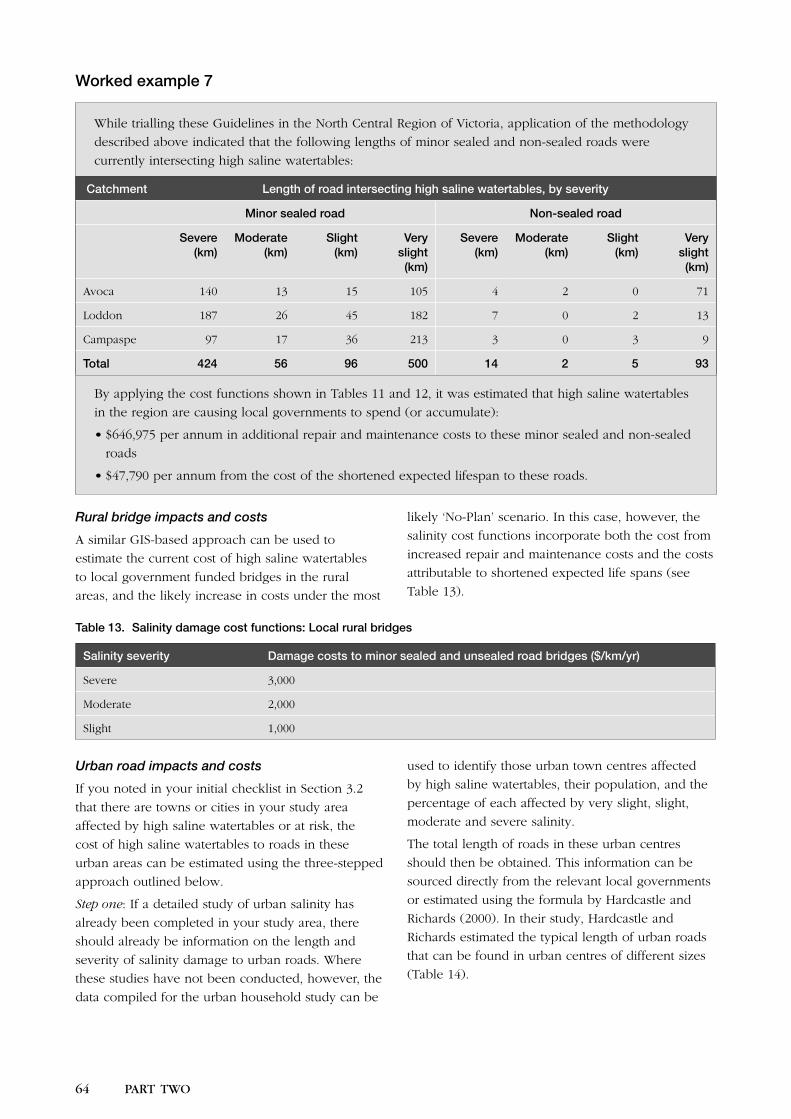
64 PART TWO
2-4
PART TWO 65
Worked example 7
While trialling these Guidelines in the North Central Region of Victoria, application of the methodology
described above indicated that the following lengths of minor sealed and non-sealed roads were
currently intersecting high saline watertables:
Catchment Length of road intersecting high saline watertables, by severity
Minor sealed road Non-sealed road
Severe (km)
Moderate (km)
Slight (km)
Very slight (km)
Severe (km)
Moderate (km)
Slight (km)
Very slight (km)
Avoca 140 13 15 105 4 2 0 71
Loddon 187 26 45 182 7 0 2 13
Campaspe 97 17 36 213 3 0 3 9
Total 424 56 96 500 14 2 5 93
By applying the cost functions shown in Tables 11 and 12, it was estimated that high saline watertables
in the region are causing local governments to spend (or accumulate):
• $646,975 per annum in additional repair and maintenance costs to these minor sealed and non-sealed
roads
• $47,790 per annum from the cost of the shortened expected lifespan to these roads.
Rural bridge impacts and costs
A similar GIS-based approach can be used to
estimate the current cost of high saline watertables
to local government funded bridges in the rural
areas, and the likely increase in costs under the most
likely ‘No-Plan’ scenario. In this case, however, the
salinity cost functions incorporate both the cost from
increased repair and maintenance costs and the costs
attributable to shortened expected life spans (see
Table 13).
Table 13. Salinity damage cost functions: Local rural bridges
Salinity severity Damage costs to minor sealed and unsealed road bridges ($/km/yr)
Severe 3,000
Moderate 2,000
Slight 1,000
Urban road impacts and costs
If you noted in your initial checklist in Section 3.2
that there are towns or cities in your study area
affected by high saline watertables or at risk, the
cost of high saline watertables to roads in these
urban areas can be estimated using the three-stepped
approach outlined below.
Step one: If a detailed study of urban salinity has
already been completed in your study area, there
should already be information on the length and
severity of salinity damage to urban roads. Where
these studies have not been conducted, however, the
data compiled for the urban household study can be
used to identify those urban town centres affected
by high saline watertables, their population, and the
percentage of each affected by very slight, slight,
moderate and severe salinity.
The total length of roads in these urban centres
should then be obtained. This information can be
sourced directly from the relevant local governments
or estimated using the formula by Hardcastle and
Richards (2000). In their study, Hardcastle and
Richards estimated the typical length of urban roads
that can be found in urban centres of different sizes
(Table 14).
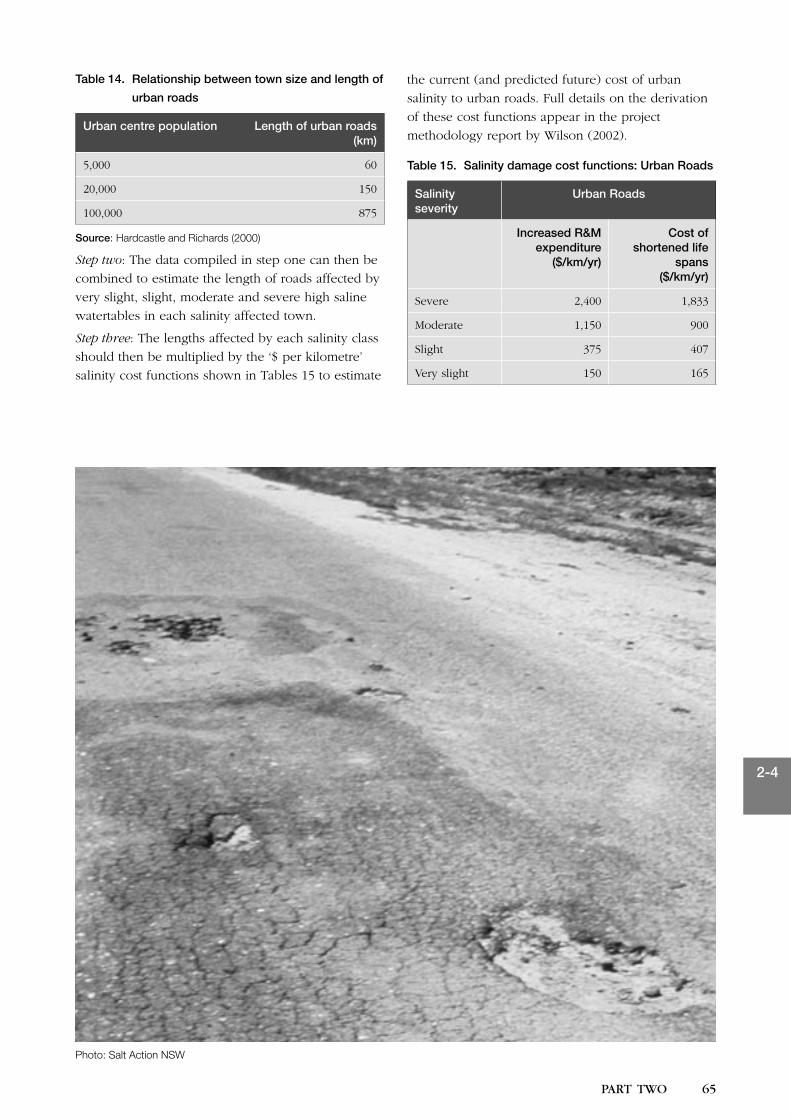
64 PART TWO
2-4
PART TWO 65
Table 14. Relationship between town size and length of
urban roads
Urban centre population Length of urban roads (km)
5,000 60
20,000 150
100,000 875
Source: Hardcastle and Richards (2000)
Step two: The data compiled in step one can then be
combined to estimate the length of roads affected by
very slight, slight, moderate and severe high saline
watertables in each salinity affected town.
Step three: The lengths affected by each salinity class
should then be multiplied by the ‘$ per kilometre’
salinity cost functions shown in Tables 15 to estimate
the current (and predicted future) cost of urban
salinity to urban roads. Full details on the derivation
of these cost functions appear in the project
methodology report by Wilson (2002).
Table 15. Salinity damage cost functions: Urban Roads
Salinity severity
Urban Roads
Increased R&M expenditure
($/km/yr)
Cost of shortened life
spans ($/km/yr)
Severe 2,400 1,833
Moderate 1,150 900
Slight 375 407
Very slight 150 165
Photo: Salt Action NSW
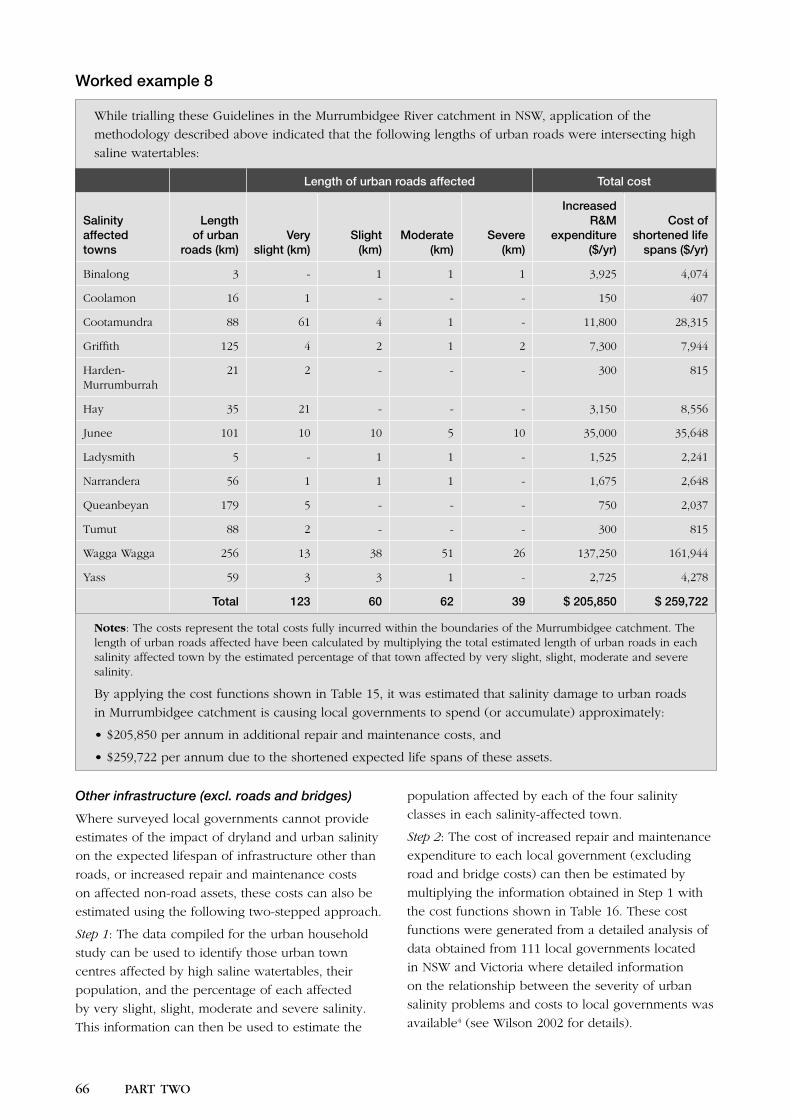
66 PART TWO
2-4
PART TWO 67
Worked example 8
While trialling these Guidelines in the Murrumbidgee River catchment in NSW, application of the
methodology described above indicated that the following lengths of urban roads were intersecting high
saline watertables:
Length of urban roads affected Total cost
Salinity affected towns
Length of urban
roads (km)Very
slight (km)Slight
(km)Moderate
(km)Severe
(km)
Increased R&M
expenditure ($/yr)
Cost of shortened life
spans ($/yr)
Binalong 3 - 1 1 1 3,925 4,074
Coolamon 16 1 - - - 150 407
Cootamundra 88 61 4 1 - 11,800 28,315
Griffith 125 4 2 1 2 7,300 7,944
Harden-Murrumburrah
21 2 - - - 300 815
Hay 35 21 - - - 3,150 8,556
Junee 101 10 10 5 10 35,000 35,648
Ladysmith 5 - 1 1 - 1,525 2,241
Narrandera 56 1 1 1 - 1,675 2,648
Queanbeyan 179 5 - - - 750 2,037
Tumut 88 2 - - - 300 815
Wagga Wagga 256 13 38 51 26 137,250 161,944
Yass 59 3 3 1 - 2,725 4,278
Total 123 60 62 39 $ 205,850 $ 259,722
Notes: The costs represent the total costs fully incurred within the boundaries of the Murrumbidgee catchment. The length of urban roads affected have been calculated by multiplying the total estimated length of urban roads in each salinity affected town by the estimated percentage of that town affected by very slight, slight, moderate and severe salinity.
By applying the cost functions shown in Table 15, it was estimated that salinity damage to urban roads
in Murrumbidgee catchment is causing local governments to spend (or accumulate) approximately:
• $205,850 per annum in additional repair and maintenance costs, and
• $259,722 per annum due to the shortened expected life spans of these assets.
Other infrastructure (excl. roads and bridges)
Where surveyed local governments cannot provide
estimates of the impact of dryland and urban salinity
on the expected lifespan of infrastructure other than
roads, or increased repair and maintenance costs
on affected non-road assets, these costs can also be
estimated using the following two-stepped approach.
Step 1: The data compiled for the urban household
study can be used to identify those urban town
centres affected by high saline watertables, their
population, and the percentage of each affected
by very slight, slight, moderate and severe salinity.
This information can then be used to estimate the
population affected by each of the four salinity
classes in each salinity-affected town.
Step 2: The cost of increased repair and maintenance
expenditure to each local government (excluding
road and bridge costs) can then be estimated by
multiplying the information obtained in Step 1 with
the cost functions shown in Table 16. These cost
functions were generated from a detailed analysis of
data obtained from 111 local governments located
in NSW and Victoria where detailed information
on the relationship between the severity of urban
salinity problems and costs to local governments was
available4 (see Wilson 2002 for details).
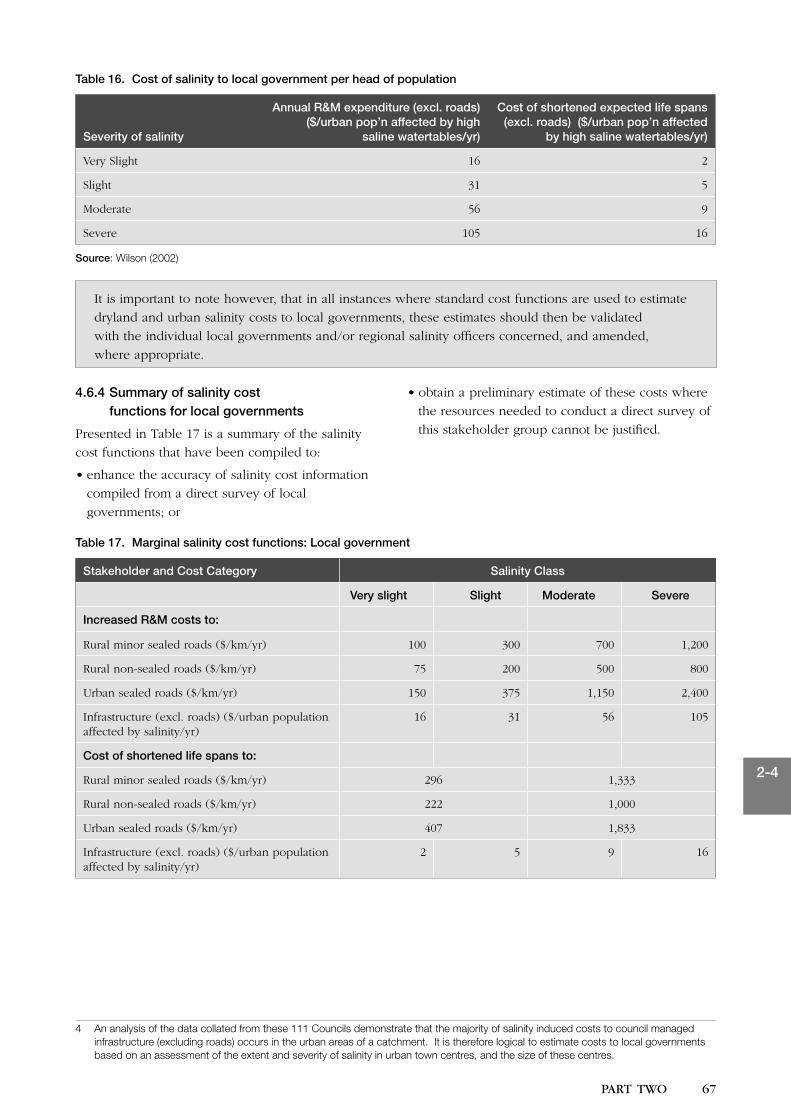
66 PART TWO
2-4
PART TWO 67
Table 16. Cost of salinity to local government per head of population
Severity of salinity
Annual R&M expenditure (excl. roads) ($/urban pop’n affected by high
saline watertables/yr)
Cost of shortened expected life spans (excl. roads) ($/urban pop’n affected
by high saline watertables/yr)
Very Slight 16 2
Slight 31 5
Moderate 56 9
Severe 105 16
Source: Wilson (2002)
It is important to note however, that in all instances where standard cost functions are used to estimate
dryland and urban salinity costs to local governments, these estimates should then be validated
with the individual local governments and/or regional salinity officers concerned, and amended,
where appropriate.
4.6.4 Summary of salinity cost functions for local governments
Presented in Table 17 is a summary of the salinity
cost functions that have been compiled to:
• enhance the accuracy of salinity cost information
compiled from a direct survey of local
governments; or
• obtain a preliminary estimate of these costs where
the resources needed to conduct a direct survey of
this stakeholder group cannot be justified.
Table 17. Marginal salinity cost functions: Local government
Stakeholder and Cost Category Salinity Class
Very slight Slight Moderate Severe
Increased R&M costs to:
Rural minor sealed roads ($/km/yr) 100 300 700 1,200
Rural non-sealed roads ($/km/yr) 75 200 500 800
Urban sealed roads ($/km/yr) 150 375 1,150 2,400
Infrastructure (excl. roads) ($/urban population affected by salinity/yr)
16 31 56 105
Cost of shortened life spans to:
Rural minor sealed roads ($/km/yr) 296 1,333
Rural non-sealed roads ($/km/yr) 222 1,000
Urban sealed roads ($/km/yr) 407 1,833
Infrastructure (excl. roads) ($/urban population affected by salinity/yr)
2 5 9 16
4 An analysis of the data collated from these 111 Councils demonstrate that the majority of salinity induced costs to council managed infrastructure (excluding roads) occurs in the urban areas of a catchment. It is therefore logical to estimate costs to local governments based on an assessment of the extent and severity of salinity in urban town centres, and the size of these centres.
68 PART TWO
2-4
PART TWO 69
4.7 State government agencies and public utilities
As noted in Part 1, dryland and urban salinity can
also affect government agencies and infrastructure-
based utilities in many ways. It may damage
infrastructure both in the rural areas (such as state
roads, rail and bridges, transmission towers and
underground gas pipes) and in the urban areas (such
as water treatment plants and underground water,
sewerage and gas pipes). This damage may impose
costs on government agencies and utilities, including
increased repair and maintenance expenditure,
increased infrastructure construction costs, early
replacement of the affected infrastructure, and loss
of income.
This Section describes how to quantify the cost
of dryland and urban salinity in your study
area to government agencies and infrastructure
utilities.
• Work through this section if you noted in
your checklist in Section 3.2 that either:
– there are rural areas in your study area
currently affected by dryland salinity or at
risk; or
– there are towns or cities in your study area
currently suffering urban salinity.
4.7.1 Background
Several government agencies and utilities (both
publicly owned and privatised) operate in
catchments, and each may be affected by dryland
and urban salinity to varying degrees. Agencies
and utilities most likely to incur costs are those
responsible for:
• agricultural or natural resource management
• major infrastructure projects, roads, rail and
public housing, and
• the supply of water, gas, electricity and
sewerage services.
Agencies and utilities vary greatly in their ability to
identify the impact of dryland and urban salinity
on their infrastructure, and to quantify the cost of
the associated damage. Their ability to accurately
identify and value these impacts generally decreases
substantially in areas where salinity is just an
emerging problem and hence community awareness
is low.
With these issues in mind, the suggested approach
for identifying and valuing the costs of dryland
and urban salinity to government agencies and
utilities is very similar to that recommended for local
governments and involves the following steps:
Step 1: Conduct a literature review to collect
whatever relevant information has previously been
compiled for the area under investigation.
Step 2: Survey each of the key agencies and utilities
operating in the study area to collect any information
on the impacts or costs of dryland and urban salinity
they are able to provide.
Step 3: Enhance the accuracy of the information
collected by using GIS to identify where salinity
outbreaks intersect with infrastructure such as roads,
bridges, and rail networks, and applying salinity
damage cost functions to estimate these costs.
Steps two and three are discussed in more detail in
the following Sections.
4.7.2 Conduct a survey or census
Conducting a survey or census of the key agencies
and utilities likely to incur costs because of salinity
in the urban or rural areas being studied provides an
effective method of collecting information on their
perceived exposure to dryland and urban salinity
and the associated costs. It also proves an effective
method of collecting information on their actual
expenditure on salinity-related preventative works
(such as tree planting) and community education,
research and extension activities.
68 PART TWO
2-4
PART TWO 69
Government agencies and utilities questionnaire
An example questionnaire form that can be used to assess the current nature and costs of dryland and
urban salinity and high watertables to government agencies and utilities is presented in Attachment D.
This questionnaire helps to collect information on their perception of:
• the nature and impacts of high saline watertable and saline water supplies
• additional expenditure on repair and maintenance activities due to salinity
• increased construction costs due to salinity
• the amount spent on salinity-related preventative works
• cost of shortened life spans of salinity affected infrastructure
• cost of implementing community education, research and extension programs
• the source of funds used to meet dryland and urban salinity costs, and
• whether salinity has led to a reduction in the quality of services provided to the local community.
To maximise the relevance of the survey questions
and to minimise the imposition placed on each
survey recipient, it will often be worthwhile tailoring
the questions in the example questionnaire to meet
the specific characteristics of each recipient group.
For example, rather than just asking recipients to
specify any structures managed by their organisation
affected by salinity, it will be useful providing an
example list of direct relevance to the organisation.
In the case of water authorities, for example, the list
could include:
• water supply headworks infrastructure
• rural water distribution infrastructure
• urban water distribution infrastructure
• water supply treatment plants
• waste water reticulation assets
• sewerage treatment plants
• corporate buildings.
Similarly, the length of the questionnaire could be
minimised by only including questions that are
likely to be relevant to the specific organisation.
This approach will help to keep each survey as
short as possible (a critical pre-requisite with mail-
out surveys) and to avoid respondent annoyance
by including questions that are of no relevance to
the organisation.
While preparing tailored questionnaires will require
more research during their development, and
more work in the mail-out process, the trialling of
the Guidelines demonstrated that the extra effort
is well justified. Surveyed recipients generally
seemed more willing to complete and return
the questionnaire forms (when compared with
past survey experiences), and the results were
more comprehensive.
A simple but worthwhile inclusion in the
questionnaire was several blank lines at the bottom
of each question to give respondents the opportunity
to write down any further comments on the matter
raised. In almost all cases, the trialling of the
Guidelines showed that respondents made use of
this opportunity, and either provided qualitative
descriptions of how salinity problems were affecting
specific aspects of both the organisation and the
wider community, or elaborated on the cost estimates
entered into the survey tables. In many cases, this
information would not have been obtained if the
recipients were only given the opportunity to provide
quantitative tabulated responses.
It is also useful to include a simple map of the area
with the questionnaire. This map should at least
show the location of the area in relation to the
rest of the state, its boundary, and any major roads
and towns.
For logistical reasons, it is not practical to send
out survey forms to all government agencies and
utilities operating within the area being studied.
Rather, it is recommended that survey forms only
be sent to those agencies and utilities that are
considered likely to manage land or infrastructure
or to undertake environment-related educational or
research activities. While other agencies operating in
the area may also incur some minor costs, the cost
associated with valuing these additional impacts is
likely to exceed the benefits gained. As an example
of the type of agencies and utilities that should be
contacted, Attachment E lists the various agencies
and utilities operating in 10 Victorian and NSW
catchments that were surveyed as part of this project.
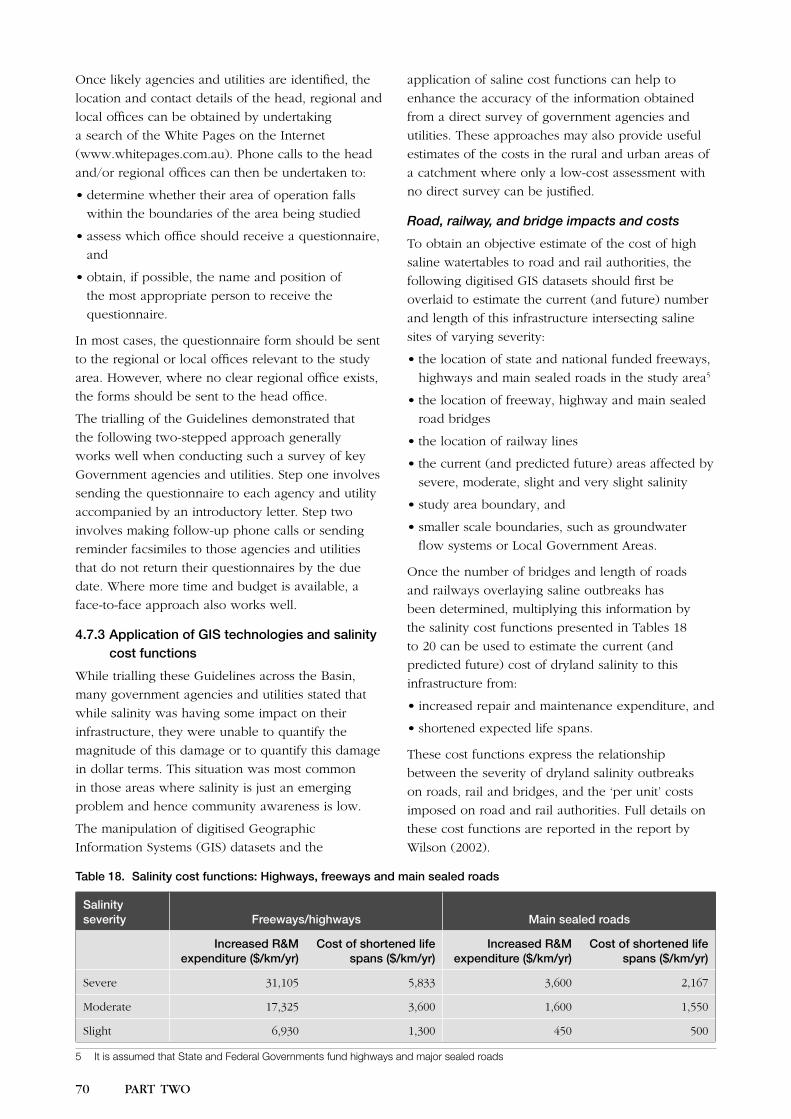
70 PART TWO
2-4
PART TWO 71
Once likely agencies and utilities are identified, the
location and contact details of the head, regional and
local offices can be obtained by undertaking
a search of the White Pages on the Internet
(www.whitepages.com.au). Phone calls to the head
and/or regional offices can then be undertaken to:
• determine whether their area of operation falls
within the boundaries of the area being studied
• assess which office should receive a questionnaire,
and
• obtain, if possible, the name and position of
the most appropriate person to receive the
questionnaire.
In most cases, the questionnaire form should be sent
to the regional or local offices relevant to the study
area. However, where no clear regional office exists,
the forms should be sent to the head office.
The trialling of the Guidelines demonstrated that
the following two-stepped approach generally
works well when conducting such a survey of key
Government agencies and utilities. Step one involves
sending the questionnaire to each agency and utility
accompanied by an introductory letter. Step two
involves making follow-up phone calls or sending
reminder facsimiles to those agencies and utilities
that do not return their questionnaires by the due
date. Where more time and budget is available, a
face-to-face approach also works well.
4.7.3 Application of GIS technologies and salinity cost functions
While trialling these Guidelines across the Basin,
many government agencies and utilities stated that
while salinity was having some impact on their
infrastructure, they were unable to quantify the
magnitude of this damage or to quantify this damage
in dollar terms. This situation was most common
in those areas where salinity is just an emerging
problem and hence community awareness is low.
The manipulation of digitised Geographic
Information Systems (GIS) datasets and the
application of saline cost functions can help to
enhance the accuracy of the information obtained
from a direct survey of government agencies and
utilities. These approaches may also provide useful
estimates of the costs in the rural and urban areas of
a catchment where only a low-cost assessment with
no direct survey can be justified.
Road, railway, and bridge impacts and costs
To obtain an objective estimate of the cost of high
saline watertables to road and rail authorities, the
following digitised GIS datasets should first be
overlaid to estimate the current (and future) number
and length of this infrastructure intersecting saline
sites of varying severity:
• the location of state and national funded freeways,
highways and main sealed roads in the study area5
• the location of freeway, highway and main sealed
road bridges
• the location of railway lines
• the current (and predicted future) areas affected by
severe, moderate, slight and very slight salinity
• study area boundary, and
• smaller scale boundaries, such as groundwater
flow systems or Local Government Areas.
Once the number of bridges and length of roads
and railways overlaying saline outbreaks has
been determined, multiplying this information by
the salinity cost functions presented in Tables 18
to 20 can be used to estimate the current (and
predicted future) cost of dryland salinity to this
infrastructure from:
• increased repair and maintenance expenditure, and
• shortened expected life spans.
These cost functions express the relationship
between the severity of dryland salinity outbreaks
on roads, rail and bridges, and the ‘per unit’ costs
imposed on road and rail authorities. Full details on
these cost functions are reported in the report by
Wilson (2002).
5 It is assumed that State and Federal Governments fund highways and major sealed roads
Table 18. Salinity cost functions: Highways, freeways and main sealed roads
Salinity severity Freeways/highways Main sealed roads
Increased R&M expenditure ($/km/yr)
Cost of shortened life spans ($/km/yr)
Increased R&M expenditure ($/km/yr)
Cost of shortened life spans ($/km/yr)
Severe 31,105 5,833 3,600 2,167
Moderate 17,325 3,600 1,600 1,550
Slight 6,930 1,300 450 500
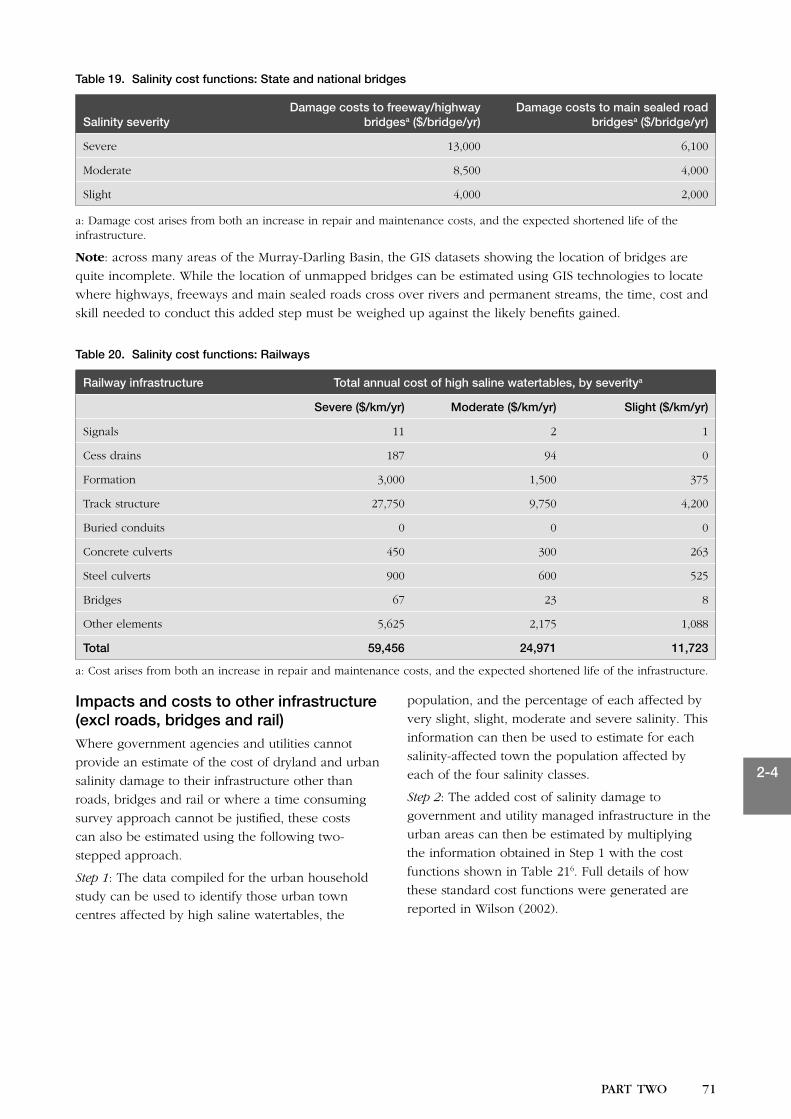
70 PART TWO
2-4
PART TWO 71
Table 19. Salinity cost functions: State and national bridges
Salinity severityDamage costs to freeway/highway
bridgesa ($/bridge/yr)Damage costs to main sealed road
bridgesa ($/bridge/yr)
Severe 13,000 6,100
Moderate 8,500 4,000
Slight 4,000 2,000
a: Damage cost arises from both an increase in repair and maintenance costs, and the expected shortened life of the infrastructure.
Note: across many areas of the Murray-Darling Basin, the GIS datasets showing the location of bridges are
quite incomplete. While the location of unmapped bridges can be estimated using GIS technologies to locate
where highways, freeways and main sealed roads cross over rivers and permanent streams, the time, cost and
skill needed to conduct this added step must be weighed up against the likely benefits gained.
Table 20. Salinity cost functions: Railways
Railway infrastructure Total annual cost of high saline watertables, by severitya
Severe ($/km/yr) Moderate ($/km/yr) Slight ($/km/yr)
Signals 11 2 1
Cess drains 187 94 0
Formation 3,000 1,500 375
Track structure 27,750 9,750 4,200
Buried conduits 0 0 0
Concrete culverts 450 300 263
Steel culverts 900 600 525
Bridges 67 23 8
Other elements 5,625 2,175 1,088
Total 59,456 24,971 11,723
a: Cost arises from both an increase in repair and maintenance costs, and the expected shortened life of the infrastructure.
Impacts and costs to other infrastructure (excl roads, bridges and rail)Where government agencies and utilities cannot
provide an estimate of the cost of dryland and urban
salinity damage to their infrastructure other than
roads, bridges and rail or where a time consuming
survey approach cannot be justified, these costs
can also be estimated using the following two-
stepped approach.
Step 1: The data compiled for the urban household
study can be used to identify those urban town
centres affected by high saline watertables, the
population, and the percentage of each affected by
very slight, slight, moderate and severe salinity. This
information can then be used to estimate for each
salinity-affected town the population affected by
each of the four salinity classes.
Step 2: The added cost of salinity damage to
government and utility managed infrastructure in the
urban areas can then be estimated by multiplying
the information obtained in Step 1 with the cost
functions shown in Table 216. Full details of how
these standard cost functions were generated are
reported in Wilson (2002).
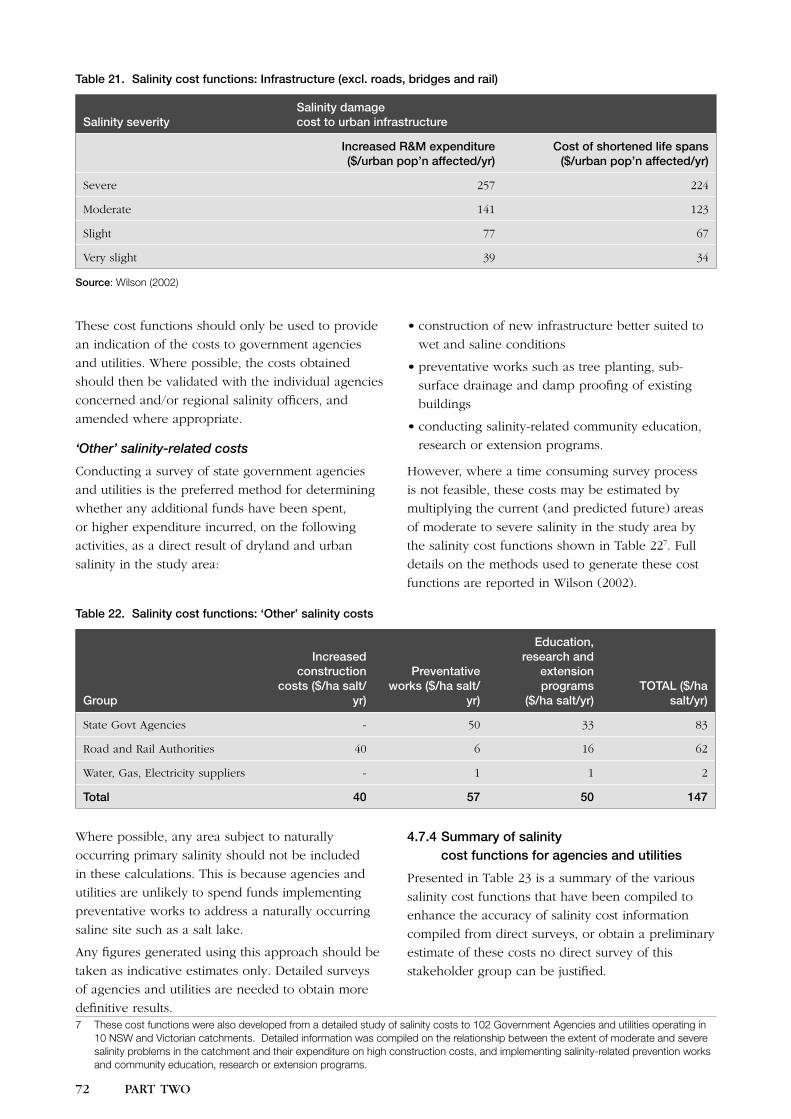
72 PART TWO
2-4
PART TWO 73
Table 21. Salinity cost functions: Infrastructure (excl. roads, bridges and rail)
Salinity severitySalinity damage cost to urban infrastructure
Increased R&M expenditure ($/urban pop’n affected/yr)
Cost of shortened life spans ($/urban pop’n affected/yr)
Severe 257 224
Moderate 141 123
Slight 77 67
Very slight 39 34
Source: Wilson (2002)
Where possible, any area subject to naturally
occurring primary salinity should not be included
in these calculations. This is because agencies and
utilities are unlikely to spend funds implementing
preventative works to address a naturally occurring
saline site such as a salt lake.
Any figures generated using this approach should be
taken as indicative estimates only. Detailed surveys
of agencies and utilities are needed to obtain more
definitive results.
4.7.4 Summary of salinity cost functions for agencies and utilities
Presented in Table 23 is a summary of the various
salinity cost functions that have been compiled to
enhance the accuracy of salinity cost information
compiled from direct surveys, or obtain a preliminary
estimate of these costs no direct survey of this
stakeholder group can be justified.
These cost functions should only be used to provide
an indication of the costs to government agencies
and utilities. Where possible, the costs obtained
should then be validated with the individual agencies
concerned and/or regional salinity officers, and
amended where appropriate.
‘Other’ salinity-related costs
Conducting a survey of state government agencies
and utilities is the preferred method for determining
whether any additional funds have been spent,
or higher expenditure incurred, on the following
activities, as a direct result of dryland and urban
salinity in the study area:
• construction of new infrastructure better suited to
wet and saline conditions
• preventative works such as tree planting, sub-
surface drainage and damp proofing of existing
buildings
• conducting salinity-related community education,
research or extension programs.
However, where a time consuming survey process
is not feasible, these costs may be estimated by
multiplying the current (and predicted future) areas
of moderate to severe salinity in the study area by
the salinity cost functions shown in Table 227. Full
details on the methods used to generate these cost
functions are reported in Wilson (2002).
Table 22. Salinity cost functions: ‘Other’ salinity costs
Group
Increased construction
costs ($/ha salt/yr)
Preventative works ($/ha salt/
yr)
Education, research and
extension programs
($/ha salt/yr)TOTAL ($/ha
salt/yr)
State Govt Agencies - 50 33 83
Road and Rail Authorities 40 6 16 62
Water, Gas, Electricity suppliers - 1 1 2
Total 40 57 50 147
7 These cost functions were also developed from a detailed study of salinity costs to 102 Government Agencies and utilities operating in 10 NSW and Victorian catchments. Detailed information was compiled on the relationship between the extent of moderate and severe salinity problems in the catchment and their expenditure on high construction costs, and implementing salinity-related prevention works and community education, research or extension programs.
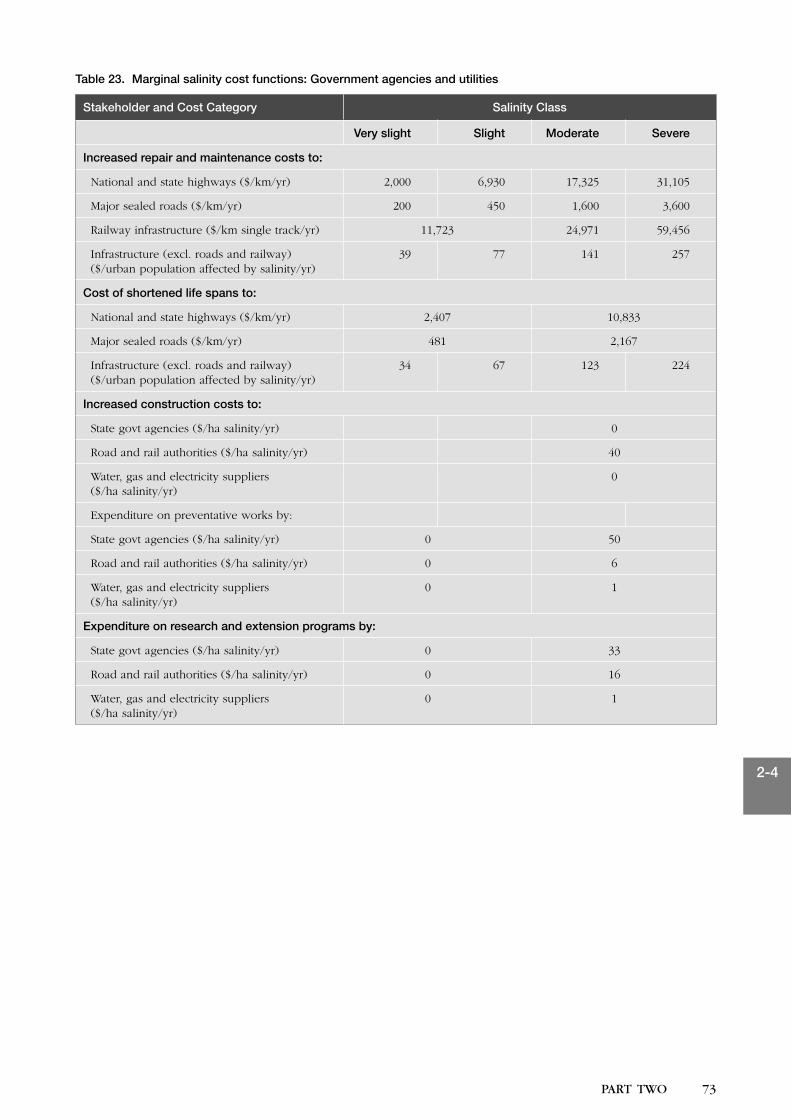
72 PART TWO
2-4
PART TWO 73
Table 23. Marginal salinity cost functions: Government agencies and utilities
Stakeholder and Cost Category Salinity Class
Very slight Slight Moderate Severe
Increased repair and maintenance costs to:
National and state highways ($/km/yr) 2,000 6,930 17,325 31,105
Major sealed roads ($/km/yr) 200 450 1,600 3,600
Railway infrastructure ($/km single track/yr) 11,723 24,971 59,456
Infrastructure (excl. roads and railway) ($/urban population affected by salinity/yr)
39 77 141 257
Cost of shortened life spans to:
National and state highways ($/km/yr) 2,407 10,833
Major sealed roads ($/km/yr) 481 2,167
Infrastructure (excl. roads and railway) ($/urban population affected by salinity/yr)
34 67 123 224
Increased construction costs to:
State govt agencies ($/ha salinity/yr) 0
Road and rail authorities ($/ha salinity/yr) 40
Water, gas and electricity suppliers ($/ha salinity/yr)
0
Expenditure on preventative works by:
State govt agencies ($/ha salinity/yr) 0 50
Road and rail authorities ($/ha salinity/yr) 0 6
Water, gas and electricity suppliers ($/ha salinity/yr)
0 1
Expenditure on research and extension programs by:
State govt agencies ($/ha salinity/yr) 0 33
Road and rail authorities ($/ha salinity/yr) 0 16
Water, gas and electricity suppliers ($/ha salinity/yr)
0 1
74 PART TWO
2-4
PART TWO 75
4.8 Natural environmentThe Murray-Darling Basin is home to significant
biodiversity on both public and private land, and
in rivers, streams and wetlands. Dryland and urban
salinity is impacting on some of these areas, and
is increasing pressures on endangered species and
ecological communities.
This Section describes how to quantify the
impacts and cost of dryland and urban salinity
to the natural environment. Work through
this section if you noted in your checklist in
Section 3.2 that either:
• there are rural areas in your study area
currently affected by dryland salinity or at
risk, or
• there are towns or cities in your study area
currently suffering urban salinity.
4.8.1 Background
Despite the often substantial impacts of salinity
on the environment, a surprisingly small number
of studies have attempted to value these impacts.
This may be attributed to two main difficulties:
• separating out the effects of salinity from other
forms of land degradation (e.g. soil acidity,
erosion), diseases, urban and industrial pollution,
and the presence of pest flora and fauna such as
carp and rabbits.
• placing a value on these impacts because markets
for environmental resources and amenities are
often poorly defined or absent.
Presented below is a description of several
approaches for assessing the environmental impacts
and costs of dryland and urban salinity. As each
approach is associated with different levels of
accuracy and cost, the approach most appropriate for
a particular catchment or region will depend on the
severity of the problem and the resources available.
4.8.2 Initial assessment
In most instances, the first step should be to
conduct an initial low-cost qualitative assessment
of environmentally significant areas within the
catchment. This can be done by collating existing
information, and contacting groups or individuals
with knowledge of the environmental features of the
area. While not exhaustive, the groups include:
• State government agencies (National Parks and
Wildlife Service, Department of Land and Water
Conservation, State Forests, and Environmental
Protection Authority)
• Local Field Naturalists Societies and other
nature conservation groups
• Urban and Rural Landcare/Rivercare Groups
• Soil Conservation Boards and Local Action
Planning Committees in SA
• State Environmental Protection Authorities
• Universities
• Cooperative Research Centres (CRCs)
• Murray-Darling Basin Commission
• Catchment Boards
• Non-government conservation organisations such
as Greening Australia, Australian Conservation
Foundation, World Wide Fund for Nature, and the
various National and State Conservation Councils.
4.8.3 Expanded assessment
If justified, the next step would involve describing
in qualitative terms the current impacts of salinity
on the environment, and where desirable, the
likely future impacts. The broad headings useful
for describing these impacts on public and private
land and elaborated upon in Part 1 of these
Guidelines are:
• terrestrial impacts
• threatened fauna and flora impacts
• water body impacts
• river and stream impacts
• wetland impacts.
GIS technology also provides an effective method of
compiling objective information on environmental
assets that intersect dryland salinity outbreaks in
a study area. While not exhaustive, digitised GIS
datasets particularly useful for undertaking this
task include:
• areas currently affected by dryland salinity,
and those areas at risk in 2020, 2050 and 2100
• recorded sightings of Victorian rare or
threatened flora species
• recorded sightings of Victorian rare or
threatened fauna species
• Commonwealth Department of Environment and
Heritage datasets showing the location of various
wetland types, including RAMSAR wetlands
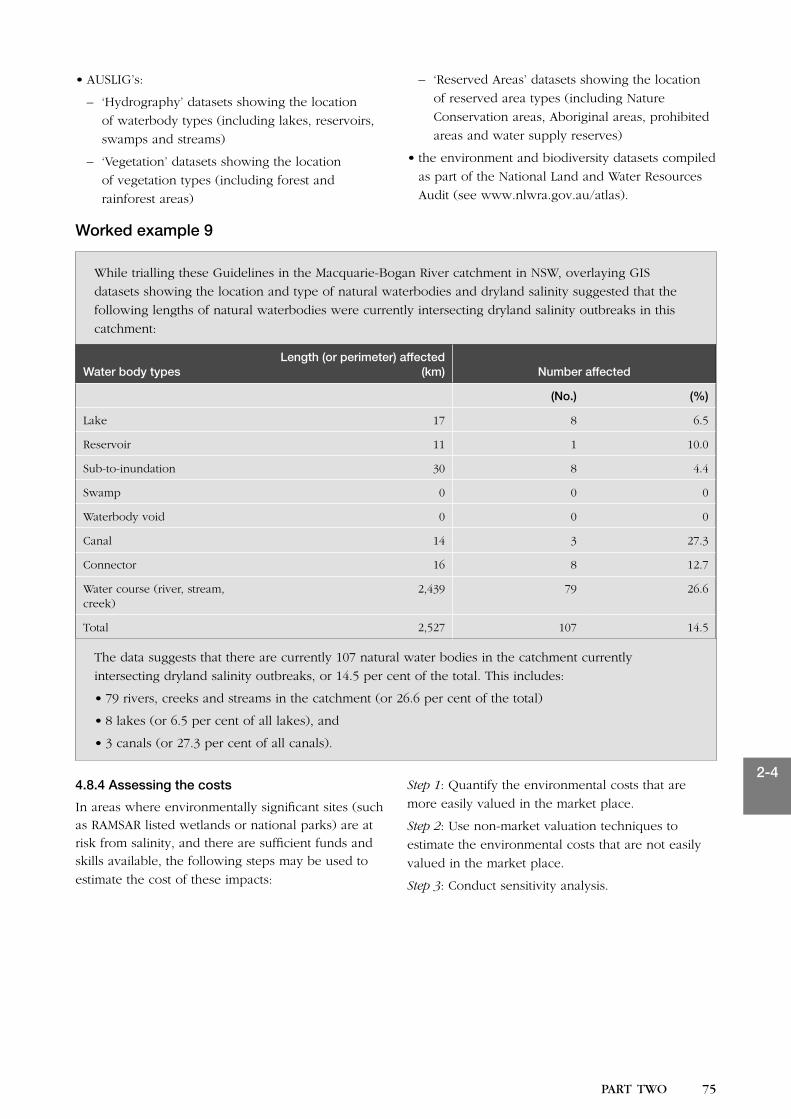
74 PART TWO
2-4
PART TWO 75
• AUSLIG’s:
– ‘Hydrography’ datasets showing the location
of waterbody types (including lakes, reservoirs,
swamps and streams)
– ‘Vegetation’ datasets showing the location
of vegetation types (including forest and
rainforest areas)
– ‘Reserved Areas’ datasets showing the location
of reserved area types (including Nature
Conservation areas, Aboriginal areas, prohibited
areas and water supply reserves)
• the environment and biodiversity datasets compiled
as part of the National Land and Water Resources
Audit (see www.nlwra.gov.au/atlas).
Worked example 9
While trialling these Guidelines in the Macquarie-Bogan River catchment in NSW, overlaying GIS
datasets showing the location and type of natural waterbodies and dryland salinity suggested that the
following lengths of natural waterbodies were currently intersecting dryland salinity outbreaks in this
catchment:
Water body typesLength (or perimeter) affected
(km) Number affected
(No.) (%)
Lake 17 8 6.5
Reservoir 11 1 10.0
Sub-to-inundation 30 8 4.4
Swamp 0 0 0
Waterbody void 0 0 0
Canal 14 3 27.3
Connector 16 8 12.7
Water course (river, stream, creek)
2,439 79 26.6
Total 2,527 107 14.5
The data suggests that there are currently 107 natural water bodies in the catchment currently
intersecting dryland salinity outbreaks, or 14.5 per cent of the total. This includes:
• 79 rivers, creeks and streams in the catchment (or 26.6 per cent of the total)
• 8 lakes (or 6.5 per cent of all lakes), and
• 3 canals (or 27.3 per cent of all canals).
4.8.4 Assessing the costs
In areas where environmentally significant sites (such as RAMSAR listed wetlands or national parks) are at risk from salinity, and there are sufficient funds and skills available, the following steps may be used to
estimate the cost of these impacts:
Step 1: Quantify the environmental costs that are
more easily valued in the market place.
Step 2: Use non-market valuation techniques to
estimate the environmental costs that are not easily
valued in the market place.
Step 3: Conduct sensitivity analysis.
76 PART TWO
2-4
PART TWO 77
Before working through these steps however, it is important to note that valuing the environmental costs
from salinity will require considerable specialist skills and resources. Unless the study area contains
environmentally sites of national or international significance, the cost required to undertake this work is
likely to be prohibitive because of two inter-related factors:
• Before any valuation can be undertaken, the specific impacts that salinity has on the ‘Use’ and ‘Non-
use’ benefits of the environment must be clearly defined. In many cases, this information is not
available and will be costly and time consuming to collect.
• The cost of conducting a statistically significant non-market valuation study varies enormously, but
can range anywhere from $10,000 to several hundred thousand dollars. The cost will depend on the
nature of the environmental amenity or feature being valued, the survey population and the reliability
being sought.
Quantifying the environmental costs that are more easily valued market place
Once a decision has been made to compile
information on the cost of salinity on the
environment, an initial estimate can be compiled
from existing information, such as the net returns
from bee-keeping, timber cutting, fishing, recreation,
and tourism. For example, information on recreation
values may be obtained from data sources such as
entry fees, fishing licences or park registrations8.
Initial estimates can also be compiled by asking local
environmental agencies and groups to:
• quantify their total expenditure on the following
activities in the study area:
– community education and research
– policy development and program management
– assessing grants, and
– environmental restoration
• estimate the percentage of this expenditure
attributable to dryland and urban salinity, and
• estimate the number of unpaid labour hours that
were allocated to each category. A standard ‘per
hour’ labour rate can then be applied during the
data analysis phase to ensure there is consistency
between the groups.
Using non-market valuation techniques
There are several non-market valuation techniques
available to estimate the environmental costs of
salinity, and these are summarised in Table 24. A
more detailed description of each can be found
Wilson (1995), Tredwelland Short (1997), Bateman
and Turner (1993), and Morrison, Blamey, Bennett
and Louviere (1996).
A recent report produced by van Bueren and Bennett
(2001) for the National Land and Water Resources
Audit also describes a study aimed at estimating non-
market values for land and water degradation using
a relatively new technique called ‘Choice Modelling’.
It is recommended that the reader also review this
report if they are considering using non-market
valuation techniques to estimate the environmental
cost of salinity in their study area.
An alternate and lower cost approach can also
involve extrapolating ‘order of magnitude’ estimates
sourced from other areas to provide an indicative
guide to environmental costs. AACM (1996) present
several tables that identify the range of values
that have been estimated through studies of the
non-market environmental costs and benefits of
controlling dryland salinity across Australia. Similar
information is available from natural resource
management databases such as ENVALUE (see
www.epa.nsw.gov.au/envalue).
Conducting sensitivity analysis
Even where expensive non-market valuation
studies have been conducted, the estimates should
still be regarded as indicative estimates only since
the reliability of the estimate will be strongly
influenced by:
• the characteristics of the environmental asset
being valued
• the relative importance of the use and non-use
values of the environmental asset
• the resources available and the statistical rigour
applied during the non-market valuation
• the ability of the non-market valuation technique
to provide robust answers, and
• the ability of the researchers and respondents
to separate out the effects of salinity from
other factors.
8 Care should be used when using licence or entry fees, as they may not accurately reflect the market value of the environmental amenity or feature.
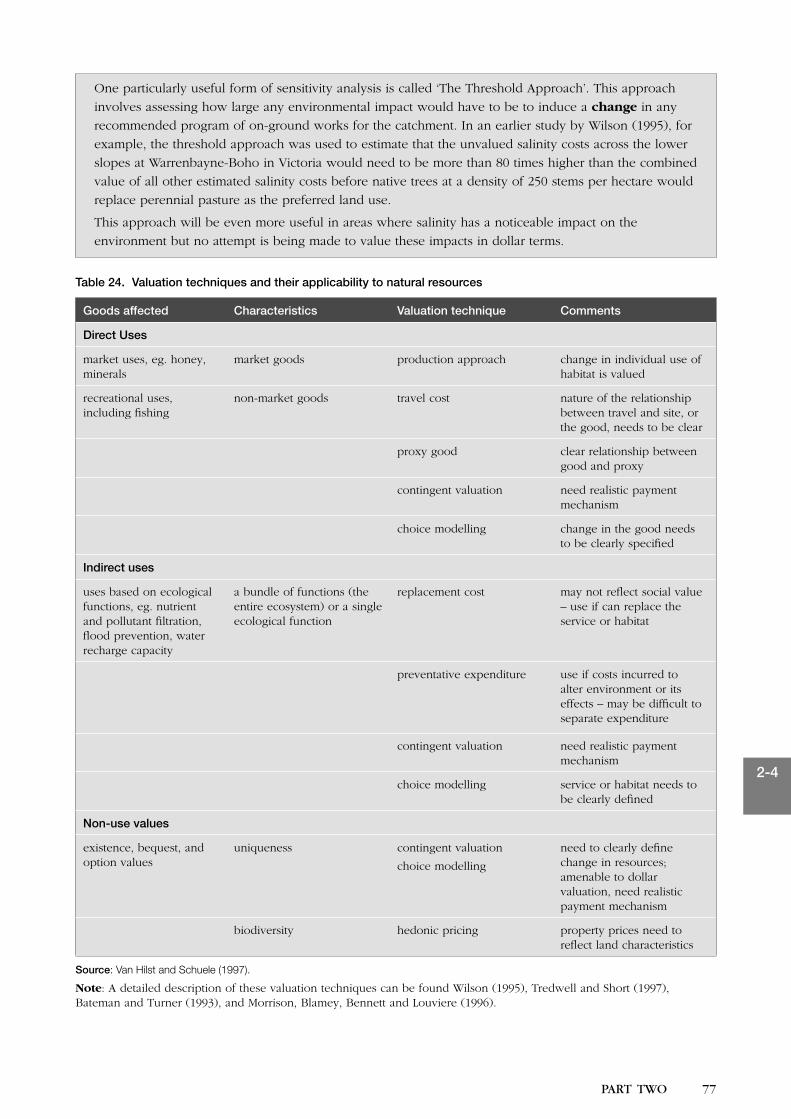
76 PART TWO
2-4
PART TWO 77
One particularly useful form of sensitivity analysis is called ‘The Threshold Approach’. This approach
involves assessing how large any environmental impact would have to be to induce a change in any
recommended program of on-ground works for the catchment. In an earlier study by Wilson (1995), for
example, the threshold approach was used to estimate that the unvalued salinity costs across the lower
slopes at Warrenbayne-Boho in Victoria would need to be more than 80 times higher than the combined
value of all other estimated salinity costs before native trees at a density of 250 stems per hectare would
replace perennial pasture as the preferred land use.
This approach will be even more useful in areas where salinity has a noticeable impact on the
environment but no attempt is being made to value these impacts in dollar terms.
Table 24. Valuation techniques and their applicability to natural resources
Goods affected Characteristics Valuation technique Comments
Direct Uses
market uses, eg. honey, minerals
market goods production approach change in individual use of habitat is valued
recreational uses, including fishing
non-market goods travel cost nature of the relationship between travel and site, or the good, needs to be clear
proxy good clear relationship between good and proxy
contingent valuation need realistic payment mechanism
choice modelling change in the good needs to be clearly specified
Indirect uses
uses based on ecological functions, eg. nutrient and pollutant filtration, flood prevention, water recharge capacity
a bundle of functions (the entire ecosystem) or a single ecological function
replacement cost may not reflect social value – use if can replace the service or habitat
preventative expenditure use if costs incurred to alter environment or its effects – may be difficult to separate expenditure
contingent valuation need realistic payment mechanism
choice modelling service or habitat needs to be clearly defined
Non-use values
existence, bequest, and option values
uniqueness contingent valuation
choice modelling
need to clearly define change in resources; amenable to dollar valuation, need realistic payment mechanism
biodiversity hedonic pricing property prices need to reflect land characteristics
Source: Van Hilst and Schuele (1997).
Note: A detailed description of these valuation techniques can be found Wilson (1995), Tredwell and Short (1997), Bateman and Turner (1993), and Morrison, Blamey, Bennett and Louviere (1996).
78 PART TWO
2-4
PART TWO 79
4.9 Cultural heritageOne of the final impacts of dryland and urban salinity
considered relates to its impact on sites of historical,
natural, or Aboriginal significance.
This section describes how to quantify the
impacts of dryland and urban salinity to
cultural heritage.
• Work through this section if you noted in
your checklist in Section 3.2 that either:
– there are rural areas in your study area
currently affected by dryland salinity or
at risk, or
– there are towns or cities in your study area
currently suffering urban salinity.
4.9.1 Background
Despite the availability of several short reports and
fact sheets describing how salinity may have an
adverse impact on sites with high cultural, historic or
Aboriginal significance, a detailed literature review
and contact with numerous with heritage-based
organisations confirmed that:
• there is a low level of awareness of the
potential impacts of dryland and urban salinity
on cultural heritage
•documented information on actual damage is
scarce, and
• field surveys are needed to record the nature and
extent of the problem to heritage and non-heritage
listed sites before widespread and irreversible
salinity damage occurs.
The recommended approach for assessing the
impacts of dryland and urban salinity on culturally
significant sites in the rural and urban areas is
therefore outlined below.
4.9.2 Salinity impacts in rural areas
The recommended approach for assessing the
impacts of dryland salinity on cultural heritage in
rural areas of a particular catchment or area may
involve some or all of the following steps.
Step 1: Conduct a literature review to collate any
existing information on the impacts of cultural
heritage in the study area.
Step 2: Approaching representatives from the
catchment boards, the salinity officers working with
the state government agencies, or relevant heritage-
based organisations may also provide some anecdotal
information.
Some of the key heritage based organisations
operating throughout the Murray-Darling Basin are:
• The ACT Heritage Council
• The National Trust of Australia
• The Australian Heritage Commission
• The Heritage Council of NSW
• The National Parks and Wildlife Service
• The NSW Heritage office
• The Historic Houses Trust of NSW;
• Charles Sturt University in Albury, NSW;
• The NSW Aboriginal Land Council;
• The Queensland Heritage Council
• The National Trust of Queensland
• State Aboriginal Affairs (S.A. Dept for Transport,
Urban Planning and the Arts)
• Heritage South Australia
• Parks and Wildlife (SA)
• Aboriginal Affairs Victoria
• Heritage Victoria
• The Heritage Council of Victoria
• Parks Victoria.
Step 1: If GIS technology is available, then digitised
datasets showing the location of dryland salinity
outbreaks should be overlain with datasets
identifying sites on the Register of the National
Estate. This process enables the identification of
recorded sites of Aboriginal, historical and natural
significance that intersect known dryland salinity
outbreaks in the rural areas. Digitised datasets of the
Register of the National Estate are available from the
Australian Heritage Commission.
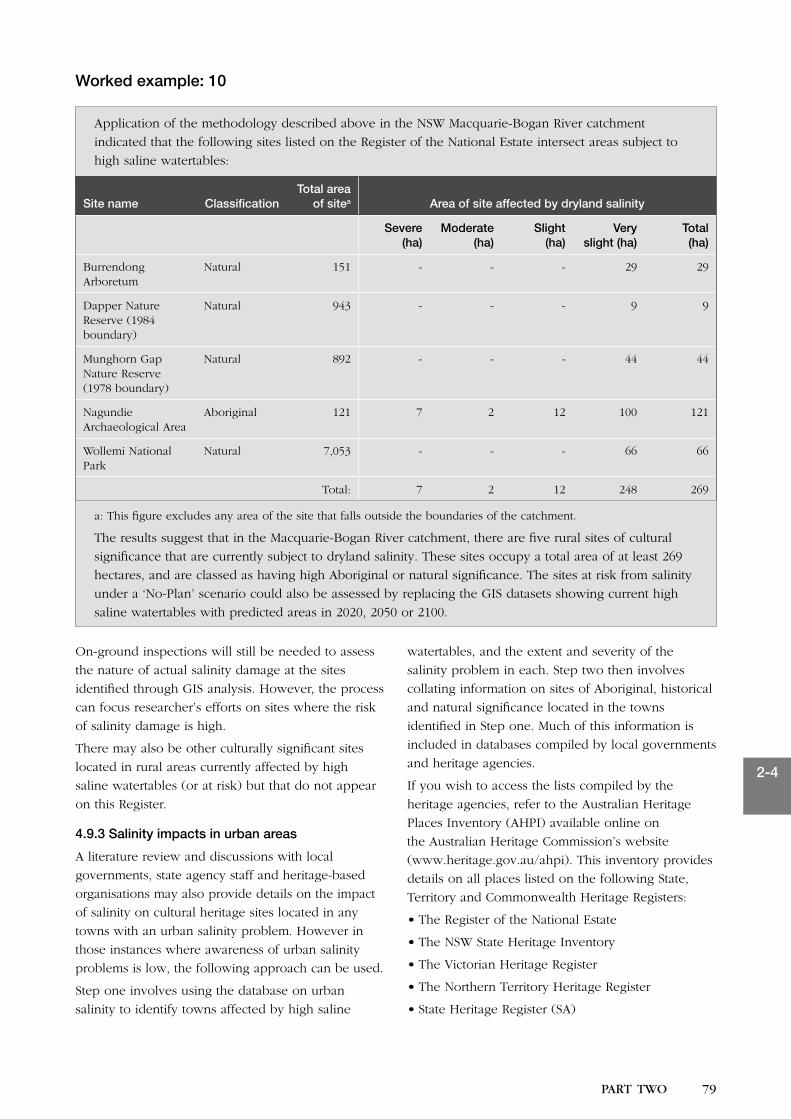
78 PART TWO
2-4
PART TWO 79
Worked example: 10
Application of the methodology described above in the NSW Macquarie-Bogan River catchment
indicated that the following sites listed on the Register of the National Estate intersect areas subject to
high saline watertables:
Site name ClassificationTotal area
of sitea Area of site affected by dryland salinity
Severe (ha)
Moderate (ha)
Slight (ha)
Very slight (ha)
Total (ha)
Burrendong Arboretum
Natural 151 - - - 29 29
Dapper Nature Reserve (1984 boundary)
Natural 943 - - - 9 9
Munghorn Gap Nature Reserve (1978 boundary)
Natural 892 - - - 44 44
Nagundie Archaeological Area
Aboriginal 121 7 2 12 100 121
Wollemi National Park
Natural 7,053 - - - 66 66
Total: 7 2 12 248 269
a: This figure excludes any area of the site that falls outside the boundaries of the catchment.
The results suggest that in the Macquarie-Bogan River catchment, there are five rural sites of cultural
significance that are currently subject to dryland salinity. These sites occupy a total area of at least 269
hectares, and are classed as having high Aboriginal or natural significance. The sites at risk from salinity
under a ‘No-Plan’ scenario could also be assessed by replacing the GIS datasets showing current high
saline watertables with predicted areas in 2020, 2050 or 2100.
On-ground inspections will still be needed to assess
the nature of actual salinity damage at the sites
identified through GIS analysis. However, the process
can focus researcher’s efforts on sites where the risk
of salinity damage is high.
There may also be other culturally significant sites
located in rural areas currently affected by high
saline watertables (or at risk) but that do not appear
on this Register.
4.9.3 Salinity impacts in urban areas
A literature review and discussions with local
governments, state agency staff and heritage-based
organisations may also provide details on the impact
of salinity on cultural heritage sites located in any
towns with an urban salinity problem. However in
those instances where awareness of urban salinity
problems is low, the following approach can be used.
Step one involves using the database on urban
salinity to identify towns affected by high saline
watertables, and the extent and severity of the
salinity problem in each. Step two then involves
collating information on sites of Aboriginal, historical
and natural significance located in the towns
identified in Step one. Much of this information is
included in databases compiled by local governments
and heritage agencies.
If you wish to access the lists compiled by the
heritage agencies, refer to the Australian Heritage
Places Inventory (AHPI) available online on
the Australian Heritage Commission’s website
(www.heritage.gov.au/ahpi). This inventory provides
details on all places listed on the following State,
Territory and Commonwealth Heritage Registers:
• The Register of the National Estate
• The NSW State Heritage Inventory
• The Victorian Heritage Register
• The Northern Territory Heritage Register
• State Heritage Register (SA)
80 PART TWO
2-4
PART TWO 81
• Queensland Heritage Register
• Heritage Places Database (WA)
• Tasmanian Heritage Register.
In the absence of detailed on-ground inspections
of these sites, it is not possible to specify whether
the heritage-listed sites located in towns with
urban salinity are, or are not, affected by high
saline watertables. However, by also specifying the
percentage of each urban town centre that is salt-
affected (and the severity of the salinity problem), it
is possible to assess the potential risk from salinity
damage. For example, if 60 per cent of a town is
currently subject to moderate to severe salinity, then
there is approximately a 60 per cent chance that each
heritage-listed site in this town is also at risk from
moderate to severe salinity damage.
Worked example: 11
While trialling these Guidelines in the Namoi River catchment, application of the methodology described
above led to the identification of 28 places on the Australian Heritage Places Inventory located in towns
subject to urban salinity. The names of the salinity-affected towns, the total percentage of these towns
affected, and the heritage-listed places located in each are presented below.
Namoi River Catchment
Barraba township (20%): Narrabri township (20%) a: Tamworth township (10%):
Oaky Creek Rail Bridge Collins Park Grandstand Peel River Rail Bridge
Narrabri Gaol (former) Power House Monument
Gunnedah township (35%): Narrabri Post Office St Nicholas Catholic Church
Gunnedah Court House
Gunnedah General Cemetery
Narrabri Telegraph Office (former)
Police Residence, Maitland St
Tamworth Council Chambers
and Town Hall
Gunnedah Railway Station Tamworth Gaol (former)
Ruvigne Homestead Complex Tamworth township (10%): Tamworth Hospital (Main Block
only)
Dominican Convent Group and
School
Tamworth Post Office
Manilla township (50%): Dominican Convent and Chapel Tamworth Primary School
Horsley Private Cemetery Lands Office, Fitzroy St Tamworth Town Hall
Namoi River Road Bridge Mechanics Institute (former) Wesley Uniting Church
Without on-ground inspections, it is not possible to confirm whether any of these sites are actually
being damaged by high saline watertables. However, the reasonably high percentage of Barraba,
Gunnedah, Manilla and Narrabri being affected suggests the likelihood that a significant number of these
sites are currently affected is high. In the Manilla township for example, it is reported that around 50 per
cent of the entire township experiences high saline watertable problems.
4.10 Costs to downstream water users
This Section introduces the concept of
calculating saline water costs to downstream
water users.
• Work through this Section if you noted in
your checklist in Section 3.2 that salt loads
in your local streams of rivers are likely
to affect water users or the environment
downstream from your study area.
Most local action plans implemented at a sub-
catchment, catchment or regional scale include
the estimated cost of saline surface water flowing
from the catchment to downstream agricultural,
domestic and industrial water users9. This estimation
is important when developing transparent cost-
sharing arrangements as downstream water users
will be beneficiaries of any salinity control works
recommended as part of the plan.
9 It will not be appropriate to calculate the costs to downstream water users when calculating the total costs of dryland salinity in numerous neighbouring catchments and then summing them to provide a regional esstimate. To do so may result in double counting of these costs.
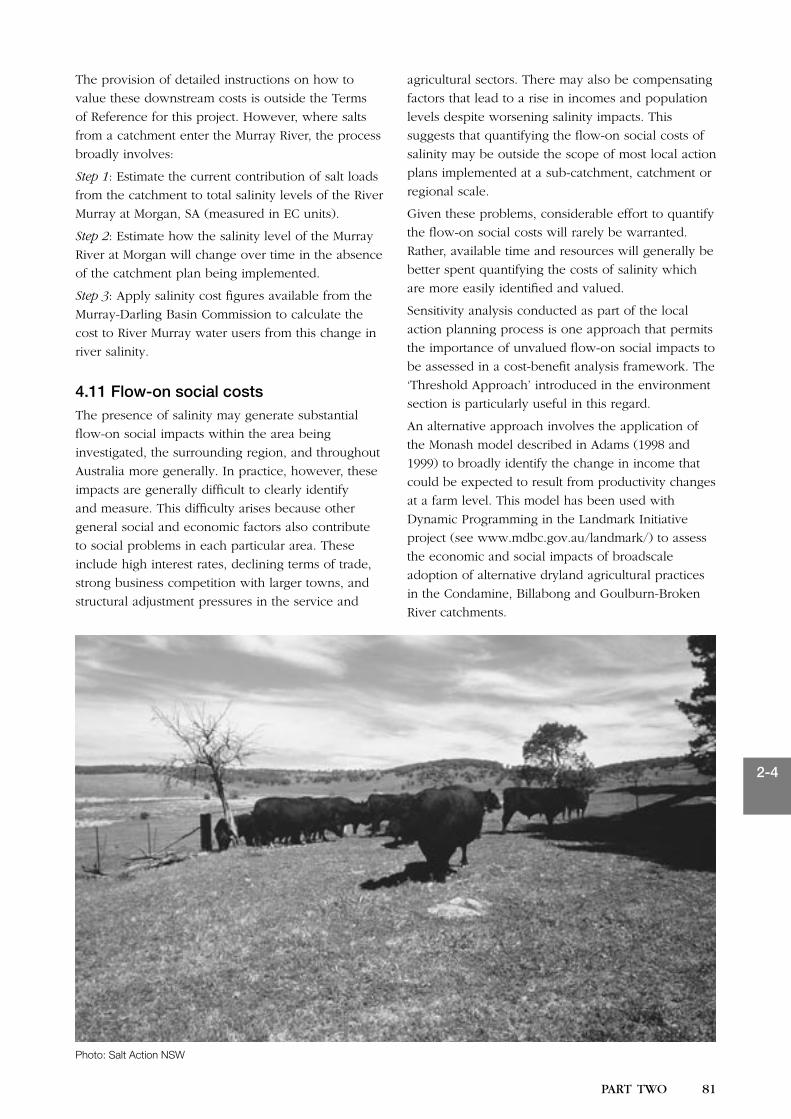
80 PART TWO
2-4
PART TWO 81
The provision of detailed instructions on how to
value these downstream costs is outside the Terms
of Reference for this project. However, where salts
from a catchment enter the Murray River, the process
broadly involves:
Step 1: Estimate the current contribution of salt loads
from the catchment to total salinity levels of the River
Murray at Morgan, SA (measured in EC units).
Step 2: Estimate how the salinity level of the Murray
River at Morgan will change over time in the absence
of the catchment plan being implemented.
Step 3: Apply salinity cost figures available from the
Murray-Darling Basin Commission to calculate the
cost to River Murray water users from this change in
river salinity.
4.11 Flow-on social costsThe presence of salinity may generate substantial
flow-on social impacts within the area being
investigated, the surrounding region, and throughout
Australia more generally. In practice, however, these
impacts are generally difficult to clearly identify
and measure. This difficulty arises because other
general social and economic factors also contribute
to social problems in each particular area. These
include high interest rates, declining terms of trade,
strong business competition with larger towns, and
structural adjustment pressures in the service and
agricultural sectors. There may also be compensating
factors that lead to a rise in incomes and population
levels despite worsening salinity impacts. This
suggests that quantifying the flow-on social costs of
salinity may be outside the scope of most local action
plans implemented at a sub-catchment, catchment or
regional scale.
Given these problems, considerable effort to quantify
the flow-on social costs will rarely be warranted.
Rather, available time and resources will generally be
better spent quantifying the costs of salinity which
are more easily identified and valued.
Sensitivity analysis conducted as part of the local
action planning process is one approach that permits
the importance of unvalued flow-on social impacts to
be assessed in a cost-benefit analysis framework. The
‘Threshold Approach’ introduced in the environment
section is particularly useful in this regard.
An alternative approach involves the application of
the Monash model described in Adams (1998 and
1999) to broadly identify the change in income that
could be expected to result from productivity changes
at a farm level. This model has been used with
Dynamic Programming in the Landmark Initiative
project (see www.mdbc.gov.au/landmark/) to assess
the economic and social impacts of broadscale
adoption of alternative dryland agricultural practices
in the Condamine, Billabong and Goulburn-Broken
River catchments.
Photo: Salt Action NSW

82 PART TWO
2-5
PART TWO 83
Conducting a survey or census of stakeholders
5.1 OverviewThere are 5 key steps involved when conducting a
survey or census of stakeholders:
Step 1: Preparation of a questionnaire form
Step 2: Survey design
Step 3: Implementation of the survey or census
Step 4: Data analysis
Step 5: Publicity
These steps are discussed in detail below.
5.2 Preparation of a questionnaire formWhen preparing any questionnaire form, it is
important to balance the data required with the
size of the questionnaire. For example, the farm
survey questionnaire contains 22 questions. This
will generally be workable where an interviewer
works with the respondent to fill out the form.
However in other situations, the form may prove too
cumbersome. For example, there may be resistance
to a form of this size in a mail-out survey. In these
situations, the less crucial questions could be
removed. Similarly, in other situations it may not be
necessary to include all questions relating to costs.
This situation will arise, for example, if catchment
communities only need information on the costs
under a ‘No-Plan’ scenario and hence do not need to
collect information on the costs of undertaking any
preventative works.
5.3 Survey designInformation can be collected from stakeholder
groups using either a survey or census-based
approach. A census questions every person, business,
farm, etc., in the target group population, whereas
a survey examines only a sub-set of the larger target
group and then extrapolates the results to the entire
population.
A census, or a survey drawing on a relatively large
proportion of the target group, will generally be
cost effective if there are relatively few target groups
in the area. The larger the target group, the more
likely that the most efficient approach will involve
surveying only a proportion of the groups involved.
There are two main techniques available for
designing a survey-based approach:
• a random sampling technique; and
• a stratified sampling technique.
A random sampling technique involves selecting
a random sample from the entire population. A
stratified sampling technique involves categorising a
larger population into a number of sub-populations
based on a particular characteristic (eg, severity of
salinity problems), and then applying a different
sampling technique to each sub-population. This will
often involve surveying a higher proportion of the
population in areas severely affected by salinity than
in areas where the salinity problem is only minor or
non-existent.
Stratified sampling will generally provide more
accurate results where the salinity problem is not
distributed uniformly across the catchment or among
different target groups. However, the technique
requires more information on the type and location
of the target population affected, adding to the
complexity and cost of the task.
5
Presented below is a broad description of how a sub-sample of a target population can be selected
for a survey-based approach. When undertaking this step in practice, it will be essential to employ the
services of a qualified statistician to provide detailed advice on a survey design that is tailored to the
unique characteristics of the individual catchment or region. Poor survey design will lead to survey bias
and unreliable results.
10 Annual costs can be converted to a capitalised value by dividing by the appropriate discount rate that reflects people’s value of money over time.
2-
82 PART TWO
2-5
PART TWO 83
Preparing a survey sample
When establishing a random sample of a stakeholder
group, it will often be useful to purchase a suitable
database from a direct marketing company. These
databases are readily available for most sectors of
the community and areas within Australia. They
can provide details of names, phone numbers,
addresses and business types (where applicable) of
every telephone number on each local exchange
in the study area (each local exchange has its own
telephone number prefix). From these databases, it is
then possible to derive subsidiary lists of farms and
businesses to produce a random sample for each of
these community sectors.
Using this approach to create a survey sample
has the advantages of being relatively simple but
comprehensive. One drawback is that catchment
boundaries often do not correspond to telephone
exchange boundaries. However, this is a relatively
minor problem as addresses located outside the
catchment boundary can easily be discarded.
Another problem is that it is quite common for some
businesses to have more than one number. Again,
however, this is a relatively minor problem that can
be readily resolved.
The use of a database approach is suitable for
moderate to large areas. However, there may
be more effective methods of establishing a
database for smaller areas. These include local
directories, government departments or Landcare
membership lists.
To demonstrate how a survey can be conducted, the
following worked example describes how samples of
households, farms, non-farm businesses, councils and
government agencies were selected while trialling
an early version of these Guidelines in the Talbragar,
Little River and Troy Creek catchments of NSW.
Worked example 12
Households and farms
In the Talbragar and Little River catchments, databases on the location and contact details of urban and
rural households were purchased from a direct marketing company and used to collate urban and rural
properties according to geographical location. The samples were then selected within each geographical
location by choosing every nth listing. The size of the ‘n’ was determined by the size of the database
and the desired sample size. This resulted in a random selection of listings distributed relatively evenly
across the catchments.
In the more urbanised Troy Creek catchment, the salinity problems were centralised in an area of the
catchment known as the Boogedar Estate. The catchment was therefore divided into 3 sampling areas
to enable the problem areas to be sampled more intensively. In the final analysis, the data from these 3
sub-areas were extrapolated separately according to the relative number of houses.
Councils and government agencies
A census was conducted of all local councils located in the study areas. A census of all government
agencies and environmental groups considered to be susceptible to dryland and urban salinity was
also conducted.
Businesses
In the Talbragar and Little River catchments, the survey focused on businesses considered most
susceptible to salinity. This meant that the sampling intensity for these businesses was much higher than
for other less susceptible businesses. Businesses that were not considered susceptible to salinity were
not sampled. In order to avoid bias, the survey results were then extrapolated according to the number
of businesses in each classification.
In the Troy Creek catchment, each business was included in the census due to the small number of
businesses operating in the catchment.
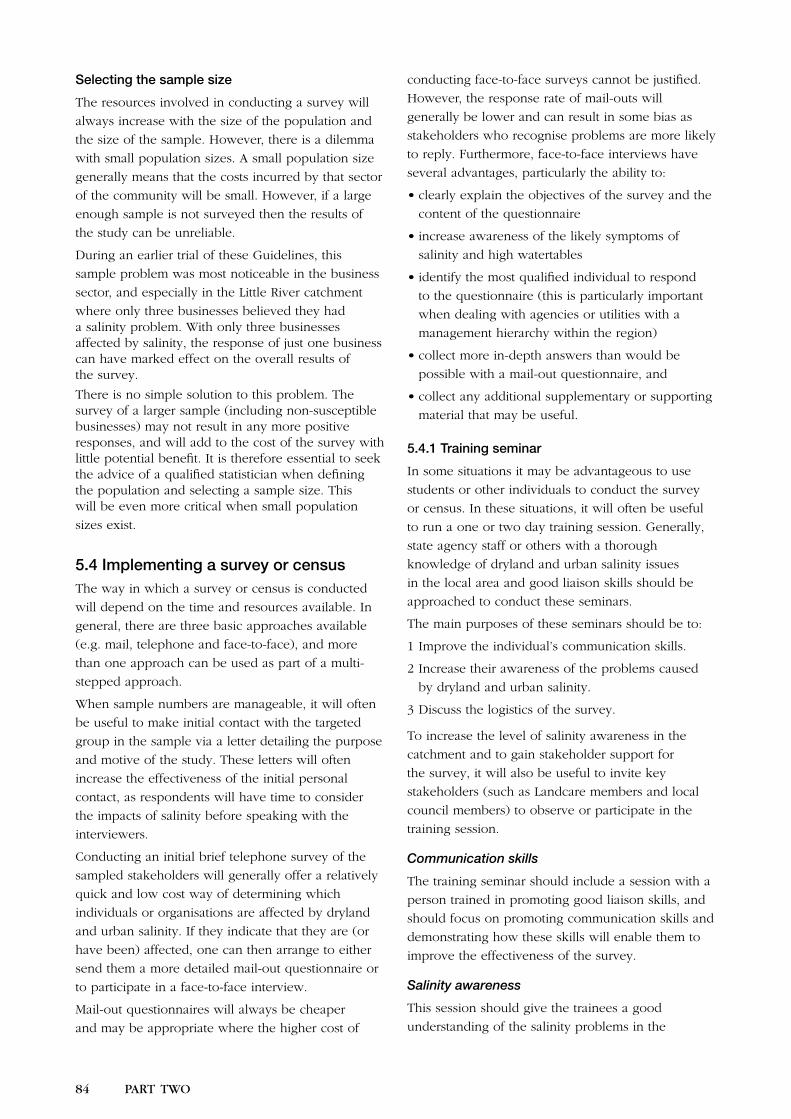
84 PART TWO
2-5
PART TWO 85
Selecting the sample size
The resources involved in conducting a survey will
always increase with the size of the population and
the size of the sample. However, there is a dilemma
with small population sizes. A small population size
generally means that the costs incurred by that sector
of the community will be small. However, if a large
enough sample is not surveyed then the results of
the study can be unreliable.
During an earlier trial of these Guidelines, this
sample problem was most noticeable in the business
sector, and especially in the Little River catchment
where only three businesses believed they had a salinity problem. With only three businesses affected by salinity, the response of just one business can have marked effect on the overall results of the survey.
There is no simple solution to this problem. The survey of a larger sample (including non-susceptible businesses) may not result in any more positive responses, and will add to the cost of the survey with little potential benefit. It is therefore essential to seek the advice of a qualified statistician when defining the population and selecting a sample size. This will be even more critical when small population
sizes exist.
5.4 Implementing a survey or censusThe way in which a survey or census is conducted
will depend on the time and resources available. In
general, there are three basic approaches available
(e.g. mail, telephone and face-to-face), and more
than one approach can be used as part of a multi-
stepped approach.
When sample numbers are manageable, it will often
be useful to make initial contact with the targeted
group in the sample via a letter detailing the purpose
and motive of the study. These letters will often
increase the effectiveness of the initial personal
contact, as respondents will have time to consider
the impacts of salinity before speaking with the
interviewers.
Conducting an initial brief telephone survey of the
sampled stakeholders will generally offer a relatively
quick and low cost way of determining which
individuals or organisations are affected by dryland
and urban salinity. If they indicate that they are (or
have been) affected, one can then arrange to either
send them a more detailed mail-out questionnaire or
to participate in a face-to-face interview.
Mail-out questionnaires will always be cheaper
and may be appropriate where the higher cost of
conducting face-to-face surveys cannot be justified.
However, the response rate of mail-outs will
generally be lower and can result in some bias as
stakeholders who recognise problems are more likely
to reply. Furthermore, face-to-face interviews have
several advantages, particularly the ability to:
• clearly explain the objectives of the survey and the
content of the questionnaire
• increase awareness of the likely symptoms of
salinity and high watertables
• identify the most qualified individual to respond
to the questionnaire (this is particularly important
when dealing with agencies or utilities with a
management hierarchy within the region)
• collect more in-depth answers than would be
possible with a mail-out questionnaire, and
• collect any additional supplementary or supporting
material that may be useful.
5.4.1 Training seminar
In some situations it may be advantageous to use
students or other individuals to conduct the survey
or census. In these situations, it will often be useful
to run a one or two day training session. Generally,
state agency staff or others with a thorough
knowledge of dryland and urban salinity issues
in the local area and good liaison skills should be
approached to conduct these seminars.
The main purposes of these seminars should be to:
1 Improve the individual’s communication skills.
2 Increase their awareness of the problems caused
by dryland and urban salinity.
3 Discuss the logistics of the survey.
To increase the level of salinity awareness in the
catchment and to gain stakeholder support for
the survey, it will also be useful to invite key
stakeholders (such as Landcare members and local
council members) to observe or participate in the
training session.
Communication skills
The training seminar should include a session with a
person trained in promoting good liaison skills, and
should focus on promoting communication skills and
demonstrating how these skills will enable them to
improve the effectiveness of the survey.
Salinity awareness
This session should give the trainees a good
understanding of the salinity problems in the
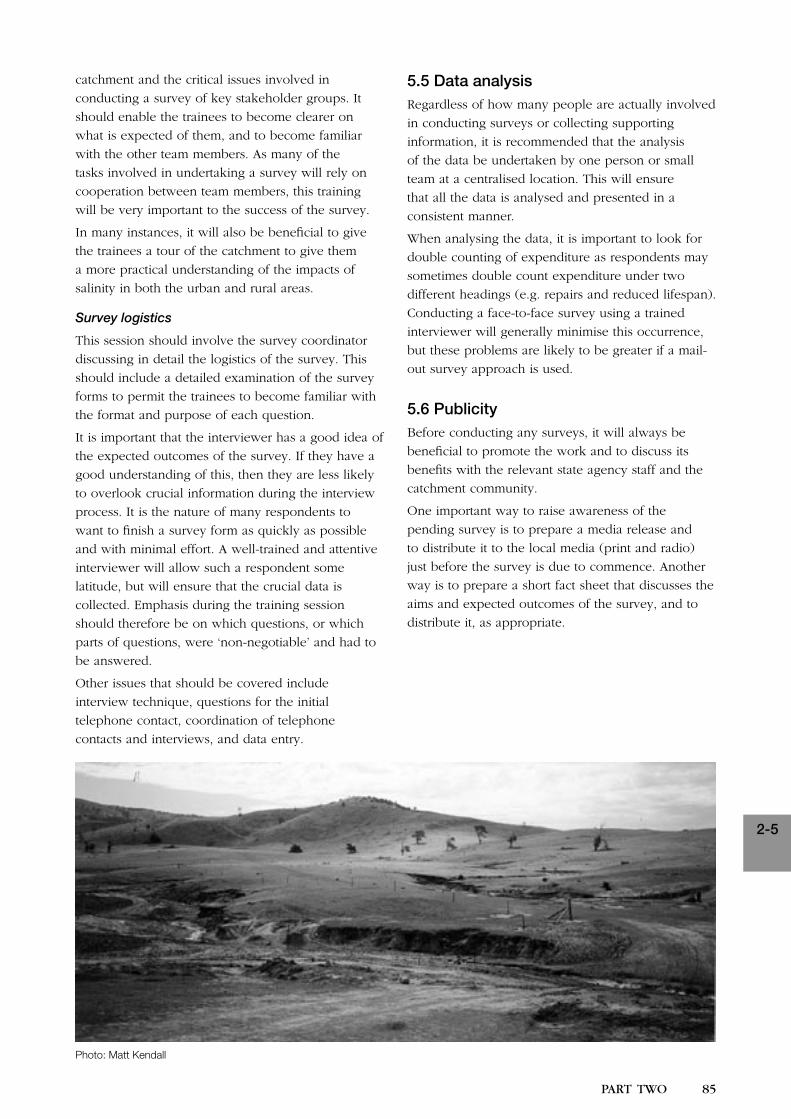
84 PART TWO
2-5
PART TWO 85
catchment and the critical issues involved in
conducting a survey of key stakeholder groups. It
should enable the trainees to become clearer on
what is expected of them, and to become familiar
with the other team members. As many of the
tasks involved in undertaking a survey will rely on
cooperation between team members, this training
will be very important to the success of the survey.
In many instances, it will also be beneficial to give
the trainees a tour of the catchment to give them
a more practical understanding of the impacts of
salinity in both the urban and rural areas.
Survey logistics
This session should involve the survey coordinator
discussing in detail the logistics of the survey. This
should include a detailed examination of the survey
forms to permit the trainees to become familiar with
the format and purpose of each question.
It is important that the interviewer has a good idea of
the expected outcomes of the survey. If they have a
good understanding of this, then they are less likely
to overlook crucial information during the interview
process. It is the nature of many respondents to
want to finish a survey form as quickly as possible
and with minimal effort. A well-trained and attentive
interviewer will allow such a respondent some
latitude, but will ensure that the crucial data is
collected. Emphasis during the training session
should therefore be on which questions, or which
parts of questions, were ‘non-negotiable’ and had to
be answered.
Other issues that should be covered include
interview technique, questions for the initial
telephone contact, coordination of telephone
contacts and interviews, and data entry.
5.5 Data analysisRegardless of how many people are actually involved
in conducting surveys or collecting supporting
information, it is recommended that the analysis
of the data be undertaken by one person or small
team at a centralised location. This will ensure
that all the data is analysed and presented in a
consistent manner.
When analysing the data, it is important to look for
double counting of expenditure as respondents may
sometimes double count expenditure under two
different headings (e.g. repairs and reduced lifespan).
Conducting a face-to-face survey using a trained
interviewer will generally minimise this occurrence,
but these problems are likely to be greater if a mail-
out survey approach is used.
5.6 PublicityBefore conducting any surveys, it will always be
beneficial to promote the work and to discuss its
benefits with the relevant state agency staff and the
catchment community.
One important way to raise awareness of the
pending survey is to prepare a media release and
to distribute it to the local media (print and radio)
just before the survey is due to commence. Another
way is to prepare a short fact sheet that discusses the
aims and expected outcomes of the survey, and to
distribute it, as appropriate.
Photo: Matt Kendall
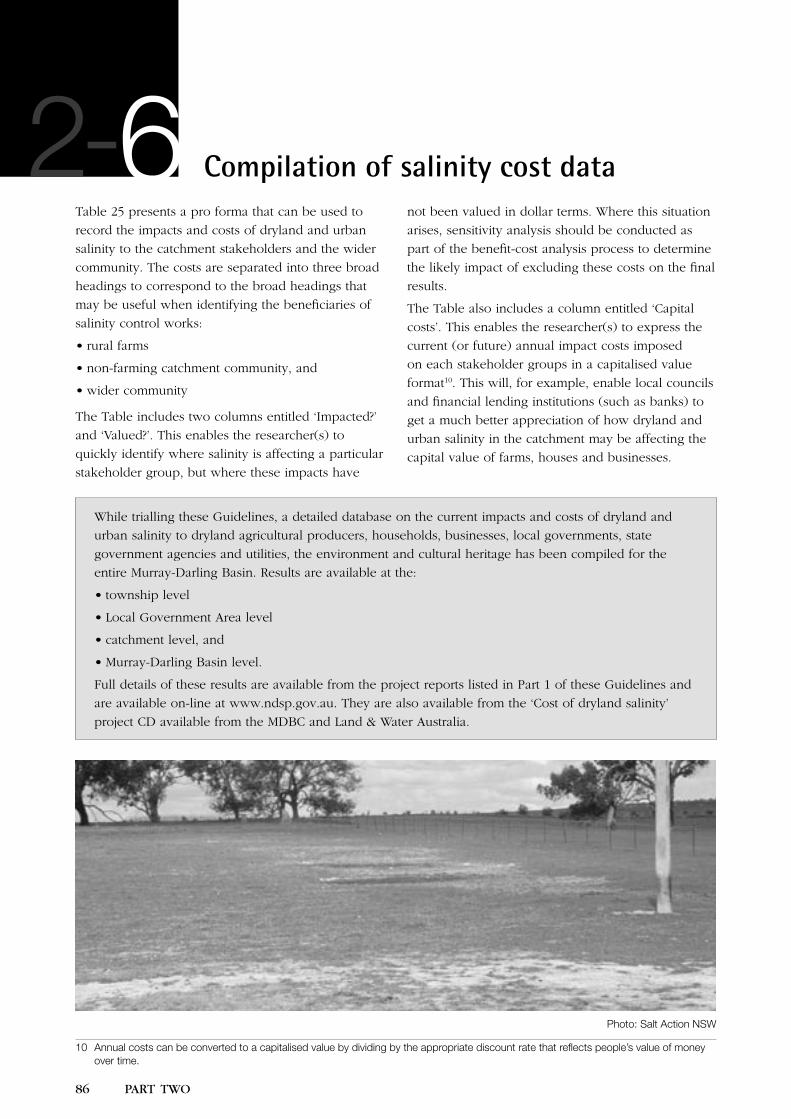
86 PART TWO
2-6
PART TWO 87
Compilation of salinity cost dataTable 25 presents a pro forma that can be used to
record the impacts and costs of dryland and urban
salinity to the catchment stakeholders and the wider
community. The costs are separated into three broad
headings to correspond to the broad headings that
may be useful when identifying the beneficiaries of
salinity control works:
• rural farms
• non-farming catchment community, and
• wider community
The Table includes two columns entitled ‘Impacted?’
and ‘Valued?’. This enables the researcher(s) to
quickly identify where salinity is affecting a particular
stakeholder group, but where these impacts have
not been valued in dollar terms. Where this situation
arises, sensitivity analysis should be conducted as
part of the benefit-cost analysis process to determine
the likely impact of excluding these costs on the final
results.
The Table also includes a column entitled ‘Capital
costs’. This enables the researcher(s) to express the
current (or future) annual impact costs imposed
on each stakeholder groups in a capitalised value
format10. This will, for example, enable local councils
and financial lending institutions (such as banks) to
get a much better appreciation of how dryland and
urban salinity in the catchment may be affecting the
capital value of farms, houses and businesses.
While trialling these Guidelines, a detailed database on the current impacts and costs of dryland and
urban salinity to dryland agricultural producers, households, businesses, local governments, state
government agencies and utilities, the environment and cultural heritage has been compiled for the
entire Murray-Darling Basin. Results are available at the:
• township level
• Local Government Area level
• catchment level, and
• Murray-Darling Basin level.
Full details of these results are available from the project reports listed in Part 1 of these Guidelines and
are available on-line at www.ndsp.gov.au. They are also available from the ‘Cost of dryland salinity’
project CD available from the MDBC and Land & Water Australia.
6
Photo: Salt Action NSW
10 Annual costs can be converted to a capitalised value by dividing by the appropriate discount rate that reflects people’s value of money over time.
2-
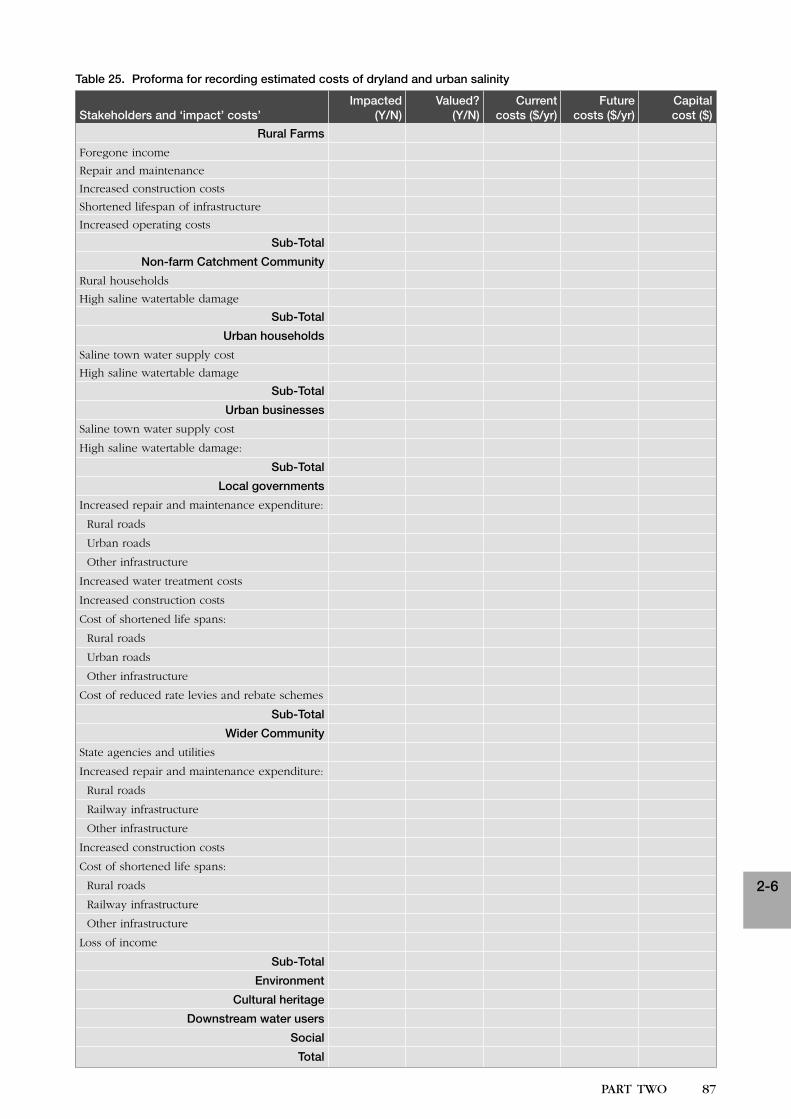
86 PART TWO
2-6
PART TWO 87
Table 25. Proforma for recording estimated costs of dryland and urban salinity
Stakeholders and ‘impact’ costs’Impacted
(Y/N)Valued?
(Y/N)Current
costs ($/yr)Future
costs ($/yr)Capital cost ($)
Rural Farms
Foregone income
Repair and maintenance
Increased construction costs
Shortened lifespan of infrastructure
Increased operating costs
Sub-Total
Non-farm Catchment Community
Rural households
High saline watertable damage
Sub-Total
Urban households
Saline town water supply cost
High saline watertable damage
Sub-Total
Urban businesses
Saline town water supply cost
High saline watertable damage:
Sub-Total
Local governments
Increased repair and maintenance expenditure:
Rural roads
Urban roads
Other infrastructure
Increased water treatment costs
Increased construction costs
Cost of shortened life spans:
Rural roads
Urban roads
Other infrastructure
Cost of reduced rate levies and rebate schemes
Sub-Total
Wider Community
State agencies and utilities
Increased repair and maintenance expenditure:
Rural roads
Railway infrastructure
Other infrastructure
Increased construction costs
Cost of shortened life spans:
Rural roads
Railway infrastructure
Other infrastructure
Loss of income
Sub-Total
Environment
Cultural heritage
Downstream water users
Social
Total

88 PART TWO
2-8
PART TWO 89
Analysing the dataOnce information on the current and predicted
future costs of dryland and urban salinity has been
compiled, it will generally be fed into the overall
local action planning process (as introduced in Part
1). Some of the key issues to be considered when
undertaking this process are outlined below.
When analysing collated data, you will need to assess
its likely accuracy and to assess the implications of
this accuracy on the overall local action planning
process. For example, it will be important to assess
the likely implications of not valuing some or all of
the more intangible environmental or social impacts
through approaches such as threshold analysis.
Similarly, it will be important to assess the
implications of uncertainty in the information used
to derive the cost estimates. This includes possible
variations in annual salinity levels of town water
supplies, or uncertainty over future estimates. One
useful approach to help in this process will be to
record confidence levels for each of the datasets
used, or to record a ‘Lower Estimate’, an ‘Upper
Estimate’ and a ‘Most Likely’ estimate.
Another useful step is to ensure there is no over-
estimation of the costs obtained. In most cases, this
can be done by clearly identifying the purpose of the
study and defining the study area boundaries.
Over-estimation of costs may result when costs
compiled for several local action planning areas,
including the downstream costs, are aggregated to
provide an estimate at the Catchment Management
or Basin-wide level. Similarly, over-estimation of
costs may result when the financial costs of foregone
income to stakeholders in a catchment are included.
This may occur, for example, if the value of net
income foregone from a cancelled horse-racing event
(due to a salinity affected track) was included in the
analysis. If the money that may have been spent at
this racing event was spent on the consumption of
other goods and services in the catchment, there may
have been no net economic costs to the catchment
community. Similarly, if the money saved was spent
on the consumption of goods and services outside
the catchment but within the region, there would
be a financial cost to the catchment community, but
not an economic cost to the wider community. This
demonstrates the need to be clear on the scale and
purpose of the study, and the implications of the
results.
Finally, it will be important to assess the wider
implications of the results to the catchment or
regional communities as a whole. For example, if
dryland and urban salinity is currently a major issue,
or is likely to become a major issue in future years,
then this may have major implications for structural
adjustment pressures in the region. For example,
it may have major implications for future land use
and urban development in the catchment, or on the
financial ability of stakeholders to implement the
preferred mix of on-ground works needed to control
the problem. Individuals interested in learning more
about the structural adjustment issues associated with
dryland salinity and its management across the Basin
can read Adjusting for catchment management:
Structural adjustment and its implications for
catchment management in the Murray-Darling Basin
(MDBC 2000).
72- 2-
88 PART TWO
2-8
PART TWO 89
ReferencesAACM International 1996, Guide to cost-sharing for
on-ground works, Report to the Murray-Darling Basin
Commission, Adelaide.
Adams, P. 1998, Effects of technological improvements
in resources and other industries, Report to Natural
Resources and Environment, Victoria, Centre of
Policy Studies, Monash University.
Adams, P. 1999, Options for growth, A paper
supporting a presentation to the Growing Horizons
Expert Committee, Victoria, Centre of Policy Studies,
Monash University.
Bateman, I.J. and Turner, R.K. 1993, Valuation
of the environment, methods and techniques:
The contingent valuation method—Sustainable
environmental economics and management,
Belhaven Press, London.
Hardcastle and Richards 2000, Impact of rising water
and salinity on infrastructure, Draft report to Dames
and Moore Pty Ltd.
Ivey ATP 1998, Determining the costs of dryland
salinity, Dryland salinity survey of the Talbragar
and Little River Catchments—Central West NSW
(volumes 1–3). Report to the Murray-Darling Basin
Commission, Wellington NSW.
Morrison, M., Blamey, R., Bennet, J. and Louviere,
J. 1996, Choice modelling research reports: A
comparison of stated preference techniques for
estimating environmental values, Research Report
No. 1, University of New South Wales, Canberra.
Treadwell, R. and Short, C. 1997, Nonmarket
valuation of dryland salinity: Guidelines for
incorporating nonmarket values, ABARE
report, Canberra.
van Bueren, M. and Bennett, J. 2000, Estimating
community values for land and water degradation
impacts, Report to the National Land and Water
Resources Audit Project 6.1.4 Unisearch, University of
NSW, Australia.
Van Hilst, R. and Schuele, M. 1997, Salinity and
high watertables in the Loddon and Campaspe
Catchments: Costs to the environment, ABARE report
to the Murray-Darling Basin Commission, Canberra.
Wilson S.M. 2002a, Assessing the costs of dryland
salinity to non-agricultural stakeholders, the
environment and cultural heritage in selected
catchments across the Murray-Darling Basin—
Methodology report 2, Wilson Land Management
Services Report to the Murray-Darling Basin
Commission and the National Dryland Salinity
Program, Canberra.
Wilson S.M. and Laurie 2002, Validation and
refinement of the Gutteridge, Haskins and Davey
saline water cost functions, Wilson Land Management
Services and Ivey ATP Report to the Murray-Darling
Basin Commission, Canberra.
Wilson, S.M. 1995, Draft Guidelines for quantifying
the full range of costs of dryland salinity, ABARE
paper presented at a National Workshop on Dryland
Salinity, Convened by ABARE and the Victorian
Department of Conservation and Natural Resources,
Bendigo, Victoria, 21-23 June.
Wilson, S.M. 2000, Assessing the cost of dryland
salinity to non-agricultural stakeholders across
selected Victorian and NSW catchments: A
methodology report, Wilson Land Management
Services Report to the Murray-Darling Basin
Commission and the National Dryland Salinity
Program, Canberra.
82-
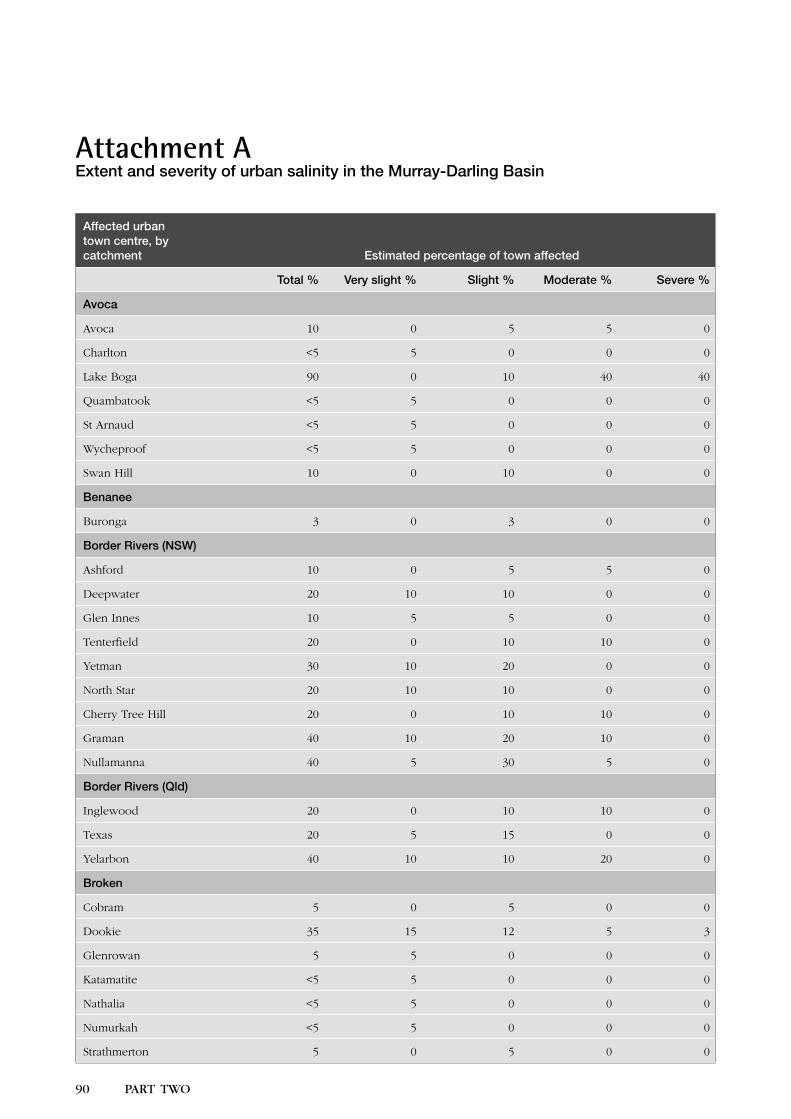
90 PART TWO PART TWO 91
Attachment AExtent and severity of urban salinity in the Murray-Darling Basin
Affected urban town centre, by catchment Estimated percentage of town affected
Total % Very slight % Slight % Moderate % Severe %
Avoca
Avoca 10 0 5 5 0
Charlton <5 5 0 0 0
Lake Boga 90 0 10 40 40
Quambatook <5 5 0 0 0
St Arnaud <5 5 0 0 0
Wycheproof <5 5 0 0 0
Swan Hill 10 0 10 0 0
Benanee
Buronga 3 0 3 0 0
Border Rivers (NSW)
Ashford 10 0 5 5 0
Deepwater 20 10 10 0 0
Glen Innes 10 5 5 0 0
Tenterfield 20 0 10 10 0
Yetman 30 10 20 0 0
North Star 20 10 10 0 0
Cherry Tree Hill 20 0 10 10 0
Graman 40 10 20 10 0
Nullamanna 40 5 30 5 0
Border Rivers (Qld)
Inglewood 20 0 10 10 0
Texas 20 5 15 0 0
Yelarbon 40 10 10 20 0
Broken
Cobram 5 0 5 0 0
Dookie 35 15 12 5 3
Glenrowan 5 5 0 0 0
Katamatite <5 5 0 0 0
Nathalia <5 5 0 0 0
Numurkah <5 5 0 0 0
Strathmerton 5 0 5 0 0
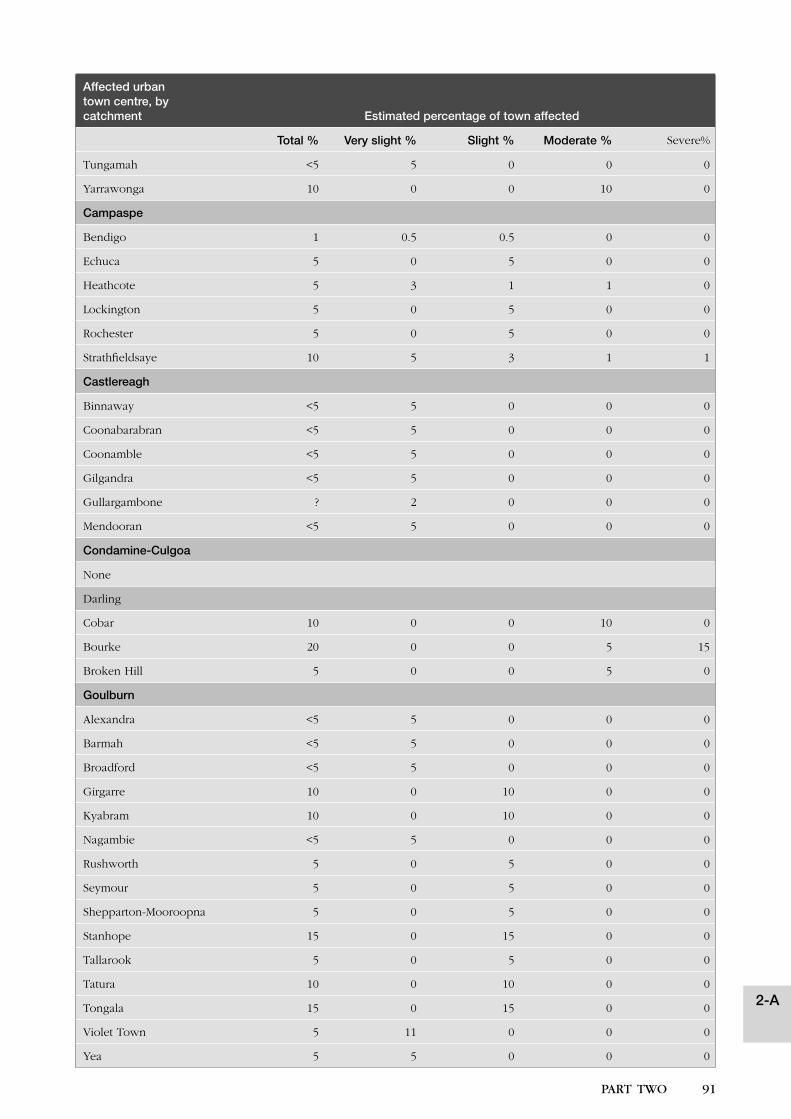
90 PART TWO PART TWO 91
Affected urban town centre, by catchment Estimated percentage of town affected
Total % Very slight % Slight % Moderate % Severe%
Tungamah <5 5 0 0 0
Yarrawonga 10 0 0 10 0
Campaspe
Bendigo 1 0.5 0.5 0 0
Echuca 5 0 5 0 0
Heathcote 5 3 1 1 0
Lockington 5 0 5 0 0
Rochester 5 0 5 0 0
Strathfieldsaye 10 5 3 1 1
Castlereagh
Binnaway <5 5 0 0 0
Coonabarabran <5 5 0 0 0
Coonamble <5 5 0 0 0
Gilgandra <5 5 0 0 0
Gullargambone ? 2 0 0 0
Mendooran <5 5 0 0 0
Condamine-Culgoa
None
Darling
Cobar 10 0 0 10 0
Bourke 20 0 0 5 15
Broken Hill 5 0 0 5 0
Goulburn
Alexandra <5 5 0 0 0
Barmah <5 5 0 0 0
Broadford <5 5 0 0 0
Girgarre 10 0 10 0 0
Kyabram 10 0 10 0 0
Nagambie <5 5 0 0 0
Rushworth 5 0 5 0 0
Seymour 5 0 5 0 0
Shepparton-Mooroopna 5 0 5 0 0
Stanhope 15 0 15 0 0
Tallarook 5 0 5 0 0
Tatura 10 0 10 0 0
Tongala 15 0 15 0 0
Violet Town 5 11 0 0 0
Yea 5 5 0 0 0
2-A
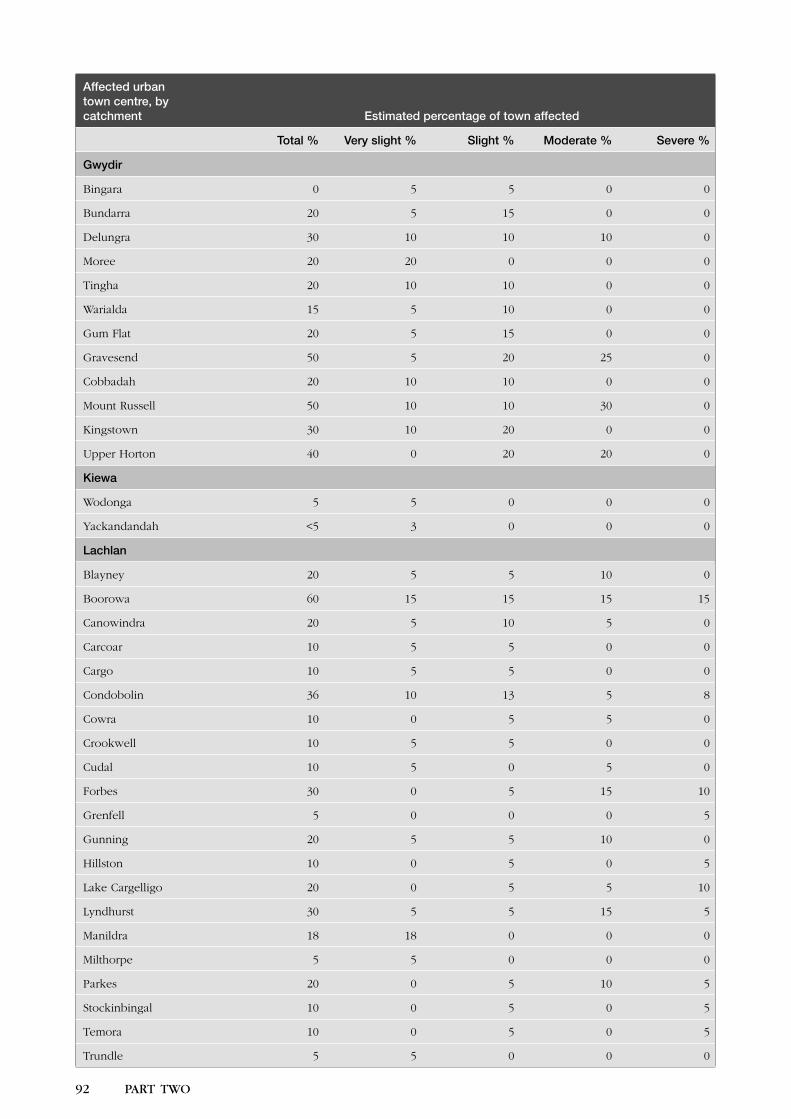
92 PART TWO PART TWO 93
Affected urban town centre, by catchment Estimated percentage of town affected
Total % Very slight % Slight % Moderate % Severe %
Gwydir
Bingara 0 5 5 0 0
Bundarra 20 5 15 0 0
Delungra 30 10 10 10 0
Moree 20 20 0 0 0
Tingha 20 10 10 0 0
Warialda 15 5 10 0 0
Gum Flat 20 5 15 0 0
Gravesend 50 5 20 25 0
Cobbadah 20 10 10 0 0
Mount Russell 50 10 10 30 0
Kingstown 30 10 20 0 0
Upper Horton 40 0 20 20 0
Kiewa
Wodonga 5 5 0 0 0
Yackandandah <5 3 0 0 0
Lachlan
Blayney 20 5 5 10 0
Boorowa 60 15 15 15 15
Canowindra 20 5 10 5 0
Carcoar 10 5 5 0 0
Cargo 10 5 5 0 0
Condobolin 36 10 13 5 8
Cowra 10 0 5 5 0
Crookwell 10 5 5 0 0
Cudal 10 5 0 5 0
Forbes 30 0 5 15 10
Grenfell 5 0 0 0 5
Gunning 20 5 5 10 0
Hillston 10 0 5 0 5
Lake Cargelligo 20 0 5 5 10
Lyndhurst 30 5 5 15 5
Manildra 18 18 0 0 0
Milthorpe 5 5 0 0 0
Parkes 20 0 5 10 5
Stockinbingal 10 0 5 0 5
Temora 10 0 5 0 5
Trundle 5 5 0 0 0
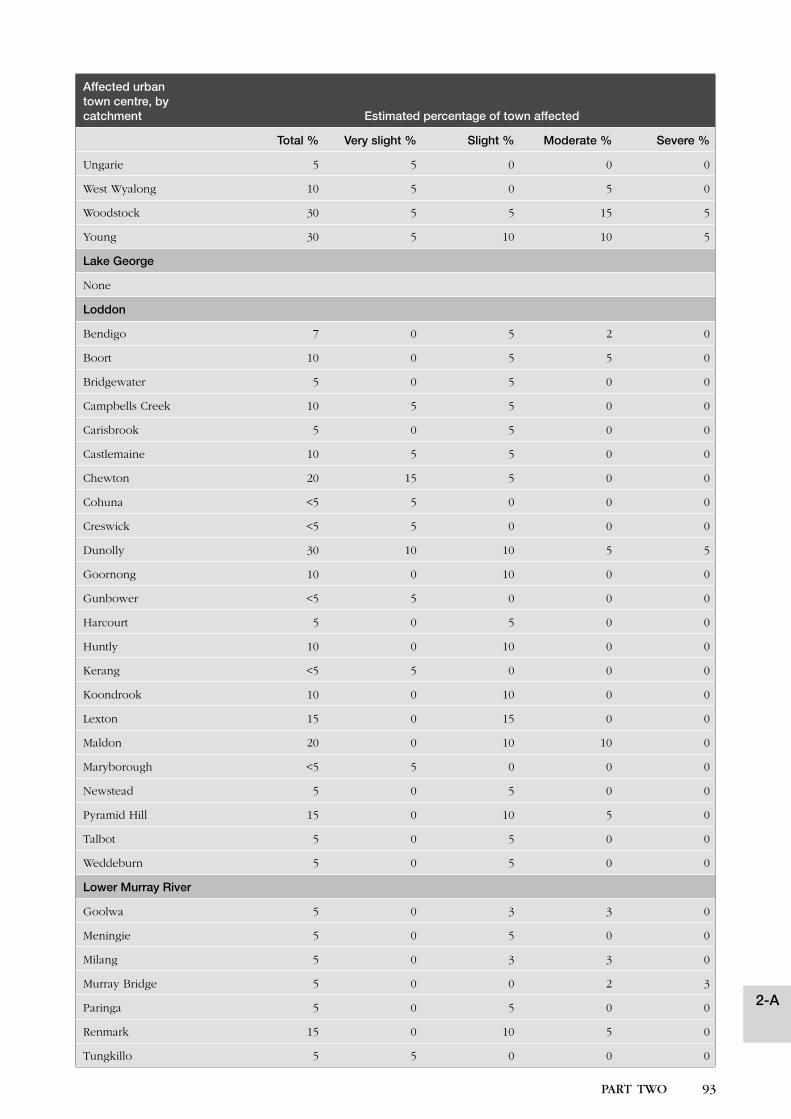
92 PART TWO PART TWO 93
Affected urban town centre, by catchment Estimated percentage of town affected
Total % Very slight % Slight % Moderate % Severe %
Ungarie 5 5 0 0 0
West Wyalong 10 5 0 5 0
Woodstock 30 5 5 15 5
Young 30 5 10 10 5
Lake George
None
Loddon
Bendigo 7 0 5 2 0
Boort 10 0 5 5 0
Bridgewater 5 0 5 0 0
Campbells Creek 10 5 5 0 0
Carisbrook 5 0 5 0 0
Castlemaine 10 5 5 0 0
Chewton 20 15 5 0 0
Cohuna <5 5 0 0 0
Creswick <5 5 0 0 0
Dunolly 30 10 10 5 5
Goornong 10 0 10 0 0
Gunbower <5 5 0 0 0
Harcourt 5 0 5 0 0
Huntly 10 0 10 0 0
Kerang <5 5 0 0 0
Koondrook 10 0 10 0 0
Lexton 15 0 15 0 0
Maldon 20 0 10 10 0
Maryborough <5 5 0 0 0
Newstead 5 0 5 0 0
Pyramid Hill 15 0 10 5 0
Talbot 5 0 5 0 0
Weddeburn 5 0 5 0 0
Lower Murray River
Goolwa 5 0 3 3 0
Meningie 5 0 5 0 0
Milang 5 0 3 3 0
Murray Bridge 5 0 0 2 3
Paringa 5 0 5 0 0
Renmark 15 0 10 5 0
Tungkillo 5 5 0 0 0
2-A
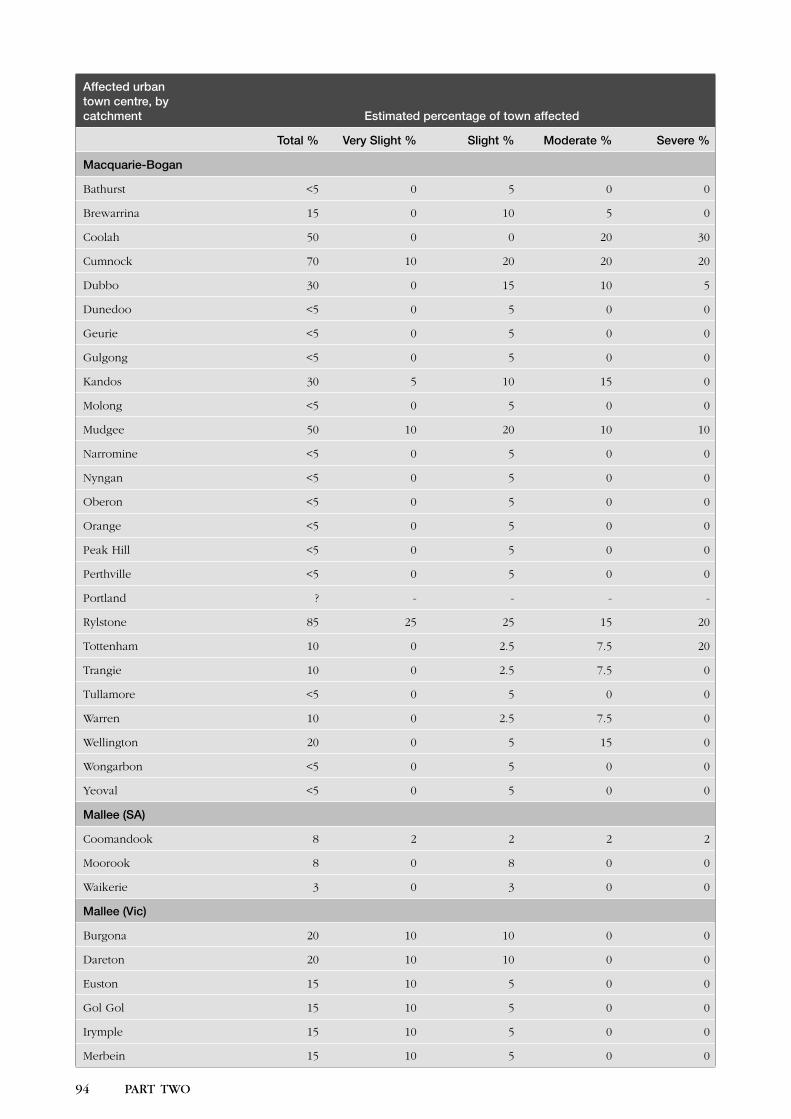
94 PART TWO PART TWO 95
Affected urban town centre, by catchment Estimated percentage of town affected
Total % Very Slight % Slight % Moderate % Severe %
Macquarie-Bogan
Bathurst <5 0 5 0 0
Brewarrina 15 0 10 5 0
Coolah 50 0 0 20 30
Cumnock 70 10 20 20 20
Dubbo 30 0 15 10 5
Dunedoo <5 0 5 0 0
Geurie <5 0 5 0 0
Gulgong <5 0 5 0 0
Kandos 30 5 10 15 0
Molong <5 0 5 0 0
Mudgee 50 10 20 10 10
Narromine <5 0 5 0 0
Nyngan <5 0 5 0 0
Oberon <5 0 5 0 0
Orange <5 0 5 0 0
Peak Hill <5 0 5 0 0
Perthville <5 0 5 0 0
Portland ? - - - -
Rylstone 85 25 25 15 20
Tottenham 10 0 2.5 7.5 20
Trangie 10 0 2.5 7.5 0
Tullamore <5 0 5 0 0
Warren 10 0 2.5 7.5 0
Wellington 20 0 5 15 0
Wongarbon <5 0 5 0 0
Yeoval <5 0 5 0 0
Mallee (SA)
Coomandook 8 2 2 2 2
Moorook 8 0 8 0 0
Waikerie 3 0 3 0 0
Mallee (Vic)
Burgona 20 10 10 0 0
Dareton 20 10 10 0 0
Euston 15 10 5 0 0
Gol Gol 15 10 5 0 0
Irymple 15 10 5 0 0
Merbein 15 10 5 0 0
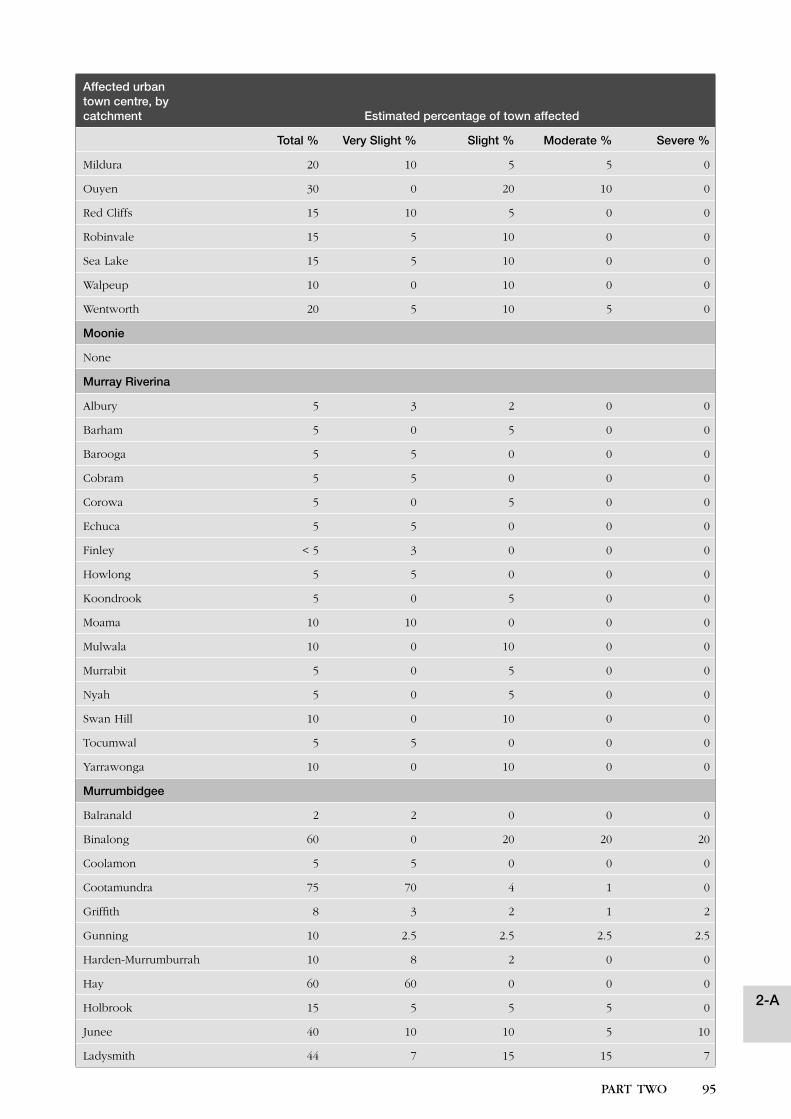
94 PART TWO PART TWO 95
Affected urban town centre, by catchment Estimated percentage of town affected
Total % Very Slight % Slight % Moderate % Severe %
Mildura 20 10 5 5 0
Ouyen 30 0 20 10 0
Red Cliffs 15 10 5 0 0
Robinvale 15 5 10 0 0
Sea Lake 15 5 10 0 0
Walpeup 10 0 10 0 0
Wentworth 20 5 10 5 0
Moonie
None
Murray Riverina
Albury 5 3 2 0 0
Barham 5 0 5 0 0
Barooga 5 5 0 0 0
Cobram 5 5 0 0 0
Corowa 5 0 5 0 0
Echuca 5 5 0 0 0
Finley < 5 3 0 0 0
Howlong 5 5 0 0 0
Koondrook 5 0 5 0 0
Moama 10 10 0 0 0
Mulwala 10 0 10 0 0
Murrabit 5 0 5 0 0
Nyah 5 0 5 0 0
Swan Hill 10 0 10 0 0
Tocumwal 5 5 0 0 0
Yarrawonga 10 0 10 0 0
Murrumbidgee
Balranald 2 2 0 0 0
Binalong 60 0 20 20 20
Coolamon 5 5 0 0 0
Cootamundra 75 70 4 1 0
Griffith 8 3 2 1 2
Gunning 10 2.5 2.5 2.5 2.5
Harden-Murrumburrah 10 8 2 0 0
Hay 60 60 0 0 0
Holbrook 15 5 5 5 0
Junee 40 10 10 5 10
Ladysmith 44 7 15 15 7
2-A
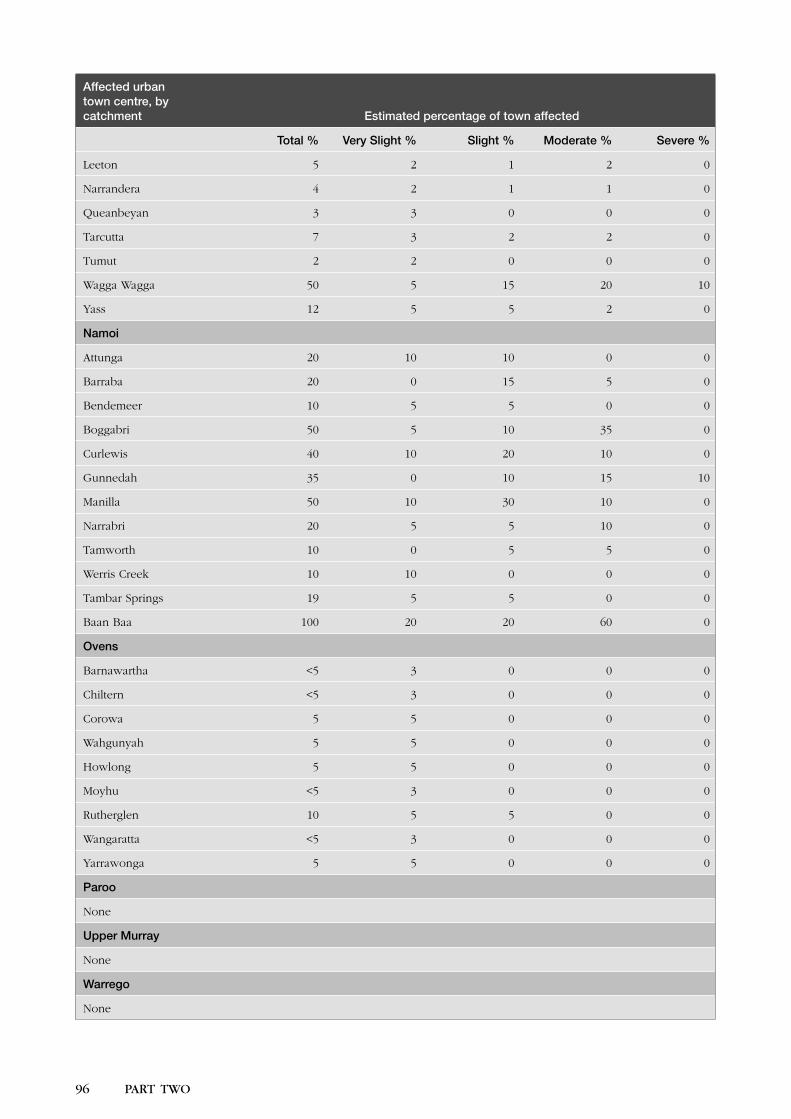
96 PART TWO PART TWO 97
Affected urban town centre, by catchment Estimated percentage of town affected
Total % Very Slight % Slight % Moderate % Severe %
Leeton 5 2 1 2 0
Narrandera 4 2 1 1 0
Queanbeyan 3 3 0 0 0
Tarcutta 7 3 2 2 0
Tumut 2 2 0 0 0
Wagga Wagga 50 5 15 20 10
Yass 12 5 5 2 0
Namoi
Attunga 20 10 10 0 0
Barraba 20 0 15 5 0
Bendemeer 10 5 5 0 0
Boggabri 50 5 10 35 0
Curlewis 40 10 20 10 0
Gunnedah 35 0 10 15 10
Manilla 50 10 30 10 0
Narrabri 20 5 5 10 0
Tamworth 10 0 5 5 0
Werris Creek 10 10 0 0 0
Tambar Springs 19 5 5 0 0
Baan Baa 100 20 20 60 0
Ovens
Barnawartha <5 3 0 0 0
Chiltern <5 3 0 0 0
Corowa 5 5 0 0 0
Wahgunyah 5 5 0 0 0
Howlong 5 5 0 0 0
Moyhu <5 3 0 0 0
Rutherglen 10 5 5 0 0
Wangaratta <5 3 0 0 0
Yarrawonga 5 5 0 0 0
Paroo
None
Upper Murray
None
Warrego
None
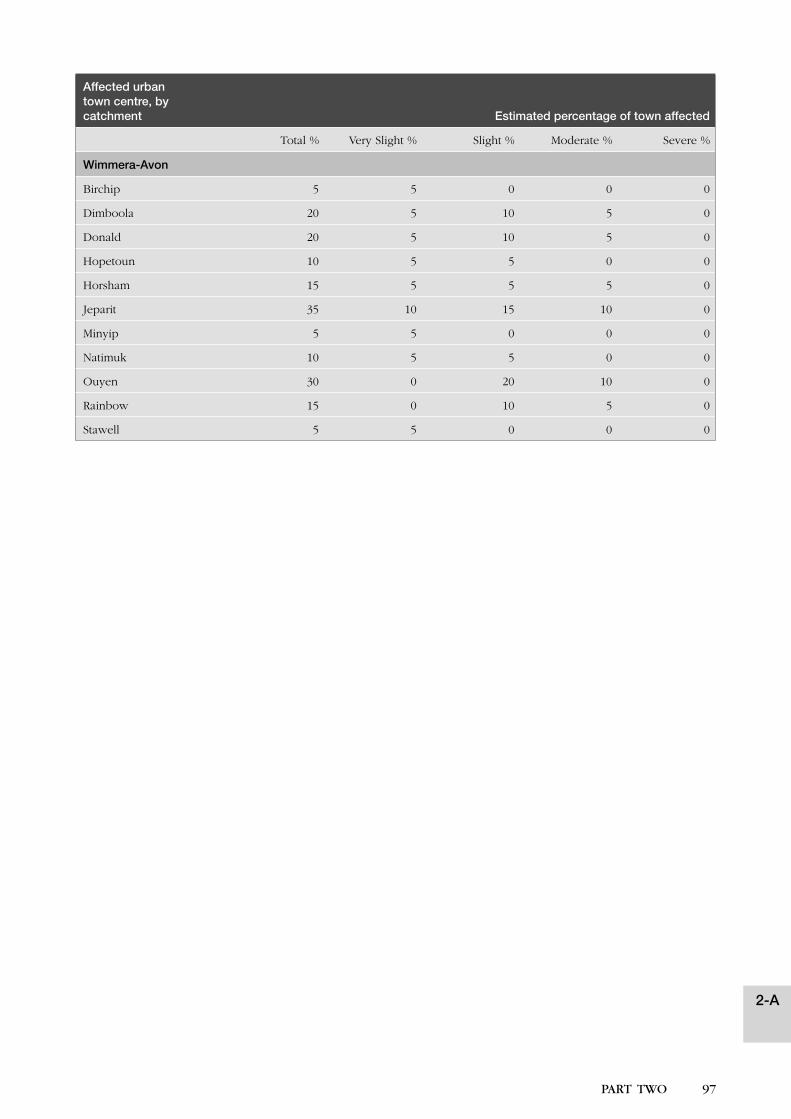
96 PART TWO PART TWO 97
Affected urban town centre, by catchment Estimated percentage of town affected
Total % Very Slight % Slight % Moderate % Severe %
Wimmera-Avon
Birchip 5 5 0 0 0
Dimboola 20 5 10 5 0
Donald 20 5 10 5 0
Hopetoun 10 5 5 0 0
Horsham 15 5 5 5 0
Jeparit 35 10 15 10 0
Minyip 5 5 0 0 0
Natimuk 10 5 5 0 0
Ouyen 30 0 20 10 0
Rainbow 15 0 10 5 0
Stawell 5 5 0 0 0
2-A
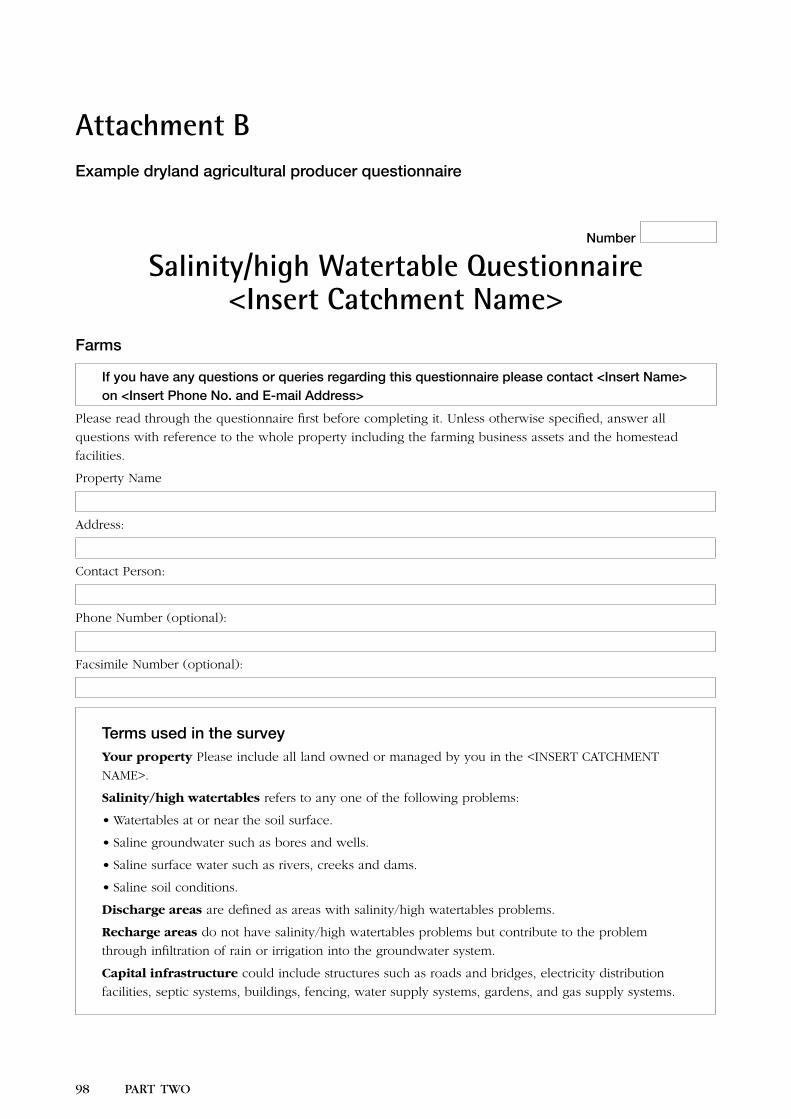
98 PART TWO
1-1
PART TWO 99
Attachment BExample dryland agricultural producer questionnaire
Number
Salinity/high Watertable Questionnaire<Insert Catchment Name>
Farms
If you have any questions or queries regarding this questionnaire please contact <Insert Name> on <Insert Phone No. and E-mail Address>
Please read through the questionnaire first before completing it. Unless otherwise specified, answer all
questions with reference to the whole property including the farming business assets and the homestead
facilities.
Property Name
Address:
Contact Person:
Phone Number (optional):
Facsimile Number (optional):
Terms used in the surveyYour property Please include all land owned or managed by you in the <INSERT CATCHMENT
NAME>.
Salinity/high watertables refers to any one of the following problems:
• Watertables at or near the soil surface.
• Saline groundwater such as bores and wells.
• Saline surface water such as rivers, creeks and dams.
• Saline soil conditions.
Discharge areas are defined as areas with salinity/high watertables problems.
Recharge areas do not have salinity/high watertables problems but contribute to the problem
through infiltration of rain or irrigation into the groundwater system.
Capital infrastructure could include structures such as roads and bridges, electricity distribution
facilities, septic systems, buildings, fencing, water supply systems, gardens, and gas supply systems.
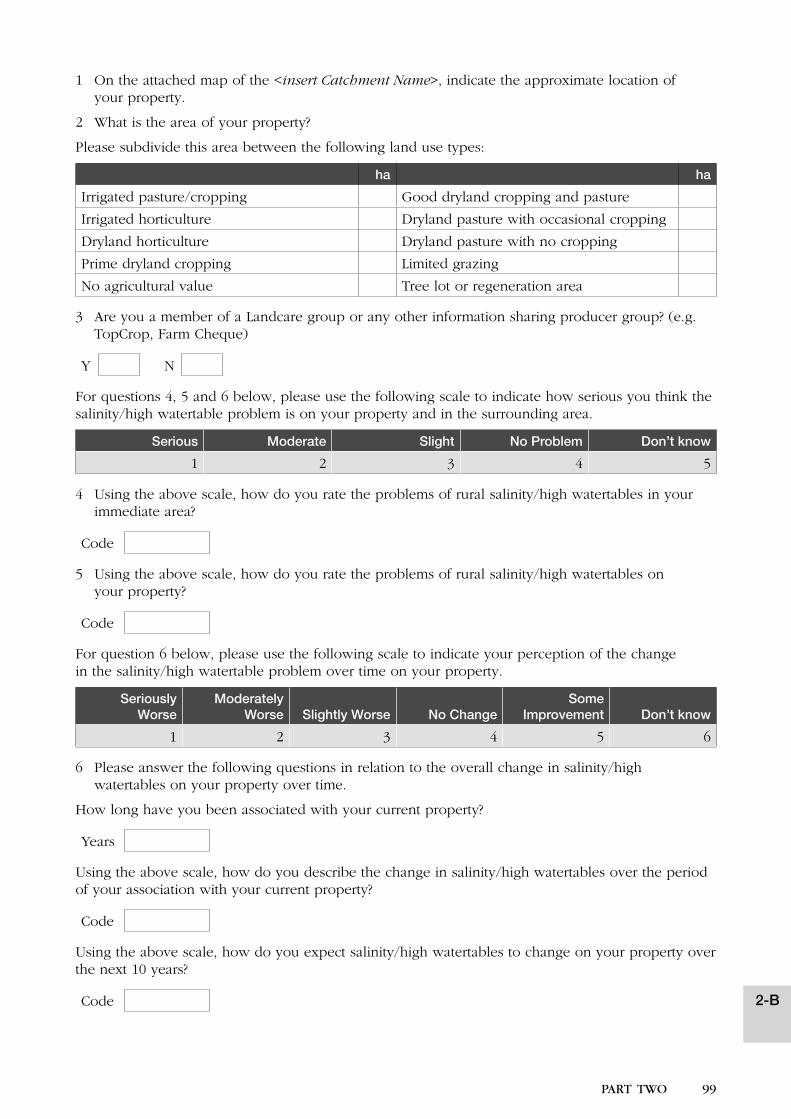
98 PART TWO
1-1
PART TWO 99
1 On the attached map of the <insert Catchment Name>, indicate the approximate location of your property.
2 What is the area of your property?
Please subdivide this area between the following land use types:
ha ha
Irrigated pasture/cropping Good dryland cropping and pasture
Irrigated horticulture Dryland pasture with occasional cropping
Dryland horticulture Dryland pasture with no cropping
Prime dryland cropping Limited grazing
No agricultural value Tree lot or regeneration area
3 Are you a member of a Landcare group or any other information sharing producer group? (e.g. TopCrop, Farm Cheque)
Y N
For questions 4, 5 and 6 below, please use the following scale to indicate how serious you think the salinity/high watertable problem is on your property and in the surrounding area.
Serious Moderate Slight No Problem Don’t know
1 2 3 4 5
4 Using the above scale, how do you rate the problems of rural salinity/high watertables in your immediate area?
Code
5 Using the above scale, how do you rate the problems of rural salinity/high watertables on your property?
Code
For question 6 below, please use the following scale to indicate your perception of the changein the salinity/high watertable problem over time on your property.
Seriously Worse
Moderately Worse Slightly Worse No Change
Some Improvement Don’t know
1 2 3 4 5 6
6 Please answer the following questions in relation to the overall change in salinity/high watertables on your property over time.
How long have you been associated with your current property?
Years
Using the above scale, how do you describe the change in salinity/high watertables over the period of your association with your current property?
Code
Using the above scale, how do you expect salinity/high watertables to change on your property over the next 10 years?
Code 2-B
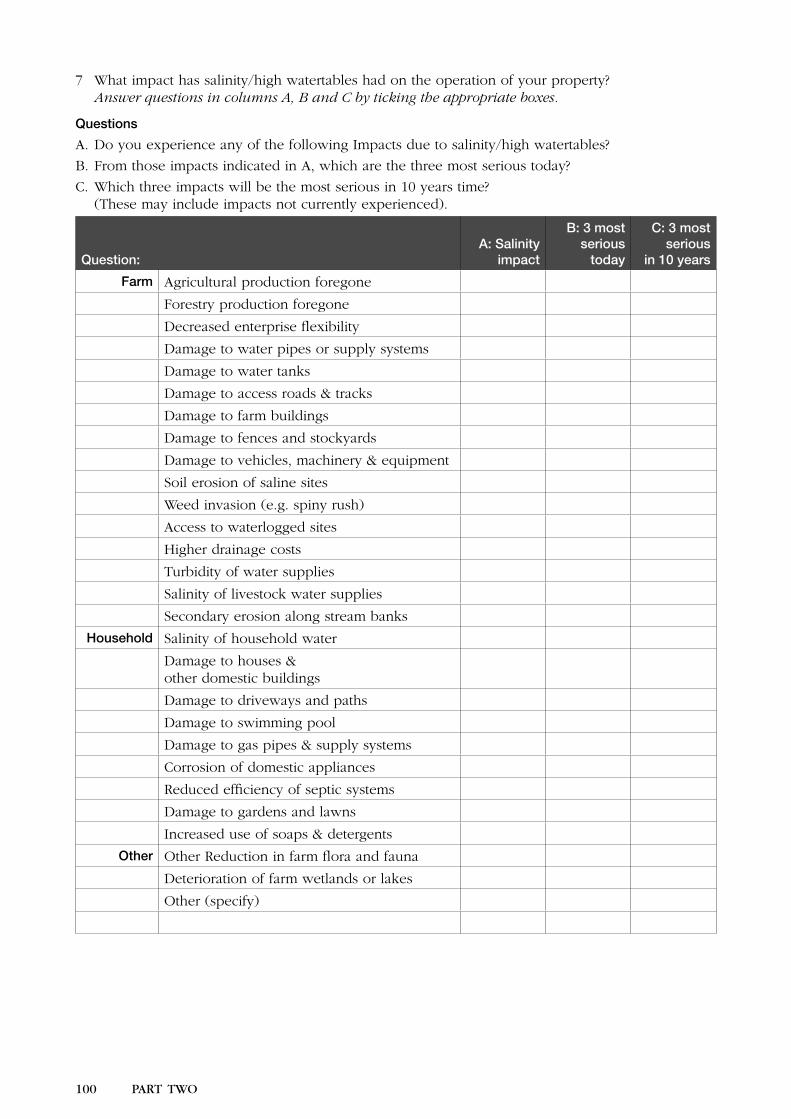
100 PART TWO PART TWO 101
7 What impact has salinity/high watertables had on the operation of your property?Answer questions in columns A, B and C by ticking the appropriate boxes.
Questions
A. Do you experience any of the following Impacts due to salinity/high watertables?
B. From those impacts indicated in A, which are the three most serious today?
C. Which three impacts will be the most serious in 10 years time? (These may include impacts not currently experienced).
Question:A: Salinity
impact
B: 3 most serious
today
C: 3 most serious
in 10 years
Farm Agricultural production foregone
Forestry production foregone
Decreased enterprise flexibility
Damage to water pipes or supply systems
Damage to water tanks
Damage to access roads & tracks
Damage to farm buildings
Damage to fences and stockyards
Damage to vehicles, machinery & equipment
Soil erosion of saline sites
Weed invasion (e.g. spiny rush)
Access to waterlogged sites
Higher drainage costs
Turbidity of water supplies
Salinity of livestock water supplies
Secondary erosion along stream banks
Household Salinity of household water
Damage to houses & other domestic buildings
Damage to driveways and paths
Damage to swimming pool
Damage to gas pipes & supply systems
Corrosion of domestic appliances
Reduced efficiency of septic systems
Damage to gardens and lawns
Increased use of soaps & detergents
Other Other Reduction in farm flora and fauna
Deterioration of farm wetlands or lakes
Other (specify)
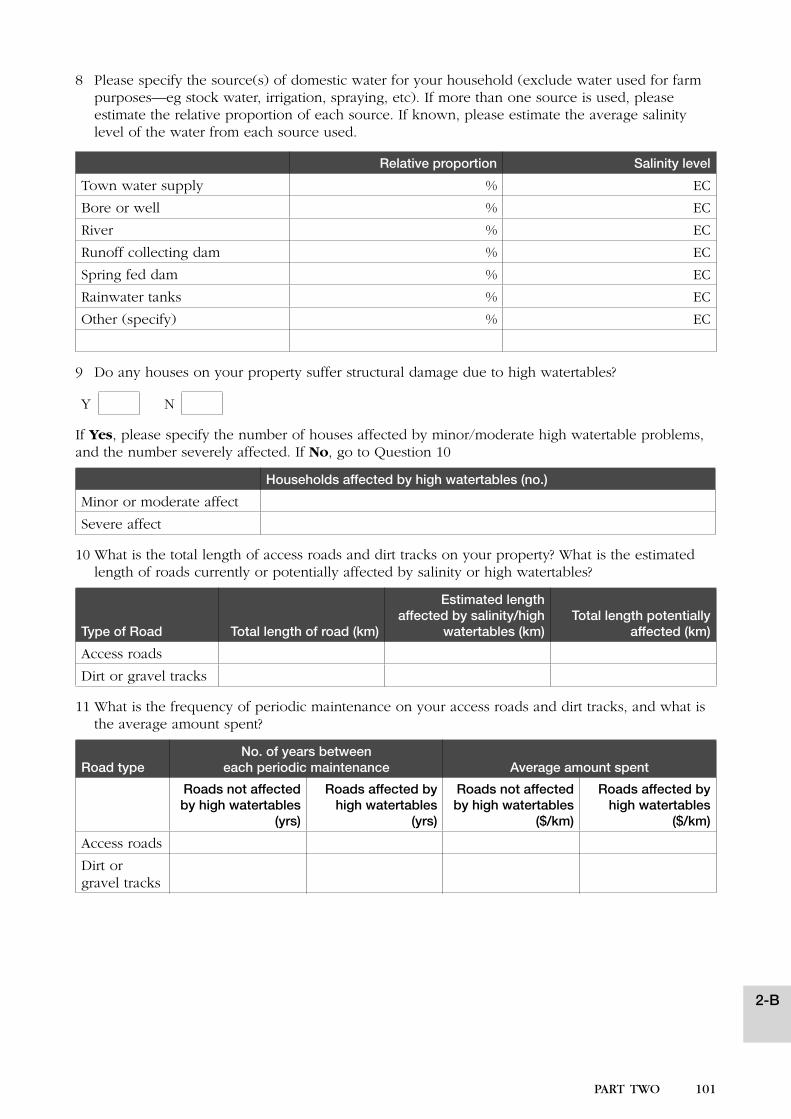
100 PART TWO PART TWO 101
8 Please specify the source(s) of domestic water for your household (exclude water used for farm purposes—eg stock water, irrigation, spraying, etc). If more than one source is used, please estimate the relative proportion of each source. If known, please estimate the average salinity level of the water from each source used.
Relative proportion Salinity level
Town water supply % EC
Bore or well % EC
River % EC
Runoff collecting dam % EC
Spring fed dam % EC
Rainwater tanks % EC
Other (specify) % EC
9 Do any houses on your property suffer structural damage due to high watertables?
Y N
If Yes, please specify the number of houses affected by minor/moderate high watertable problems, and the number severely affected. If No, go to Question 10
Households affected by high watertables (no.)
Minor or moderate affect
Severe affect
10 What is the total length of access roads and dirt tracks on your property? What is the estimated length of roads currently or potentially affected by salinity or high watertables?
Type of Road Total length of road (km)
Estimated length affected by salinity/high
watertables (km)Total length potentially
affected (km)
Access roads
Dirt or gravel tracks
11 What is the frequency of periodic maintenance on your access roads and dirt tracks, and what is the average amount spent?
Road typeNo. of years between
each periodic maintenance Average amount spent
Roads not affected by high watertables
(yrs)
Roads affected by high watertables
(yrs)
Roads not affected by high watertables
($/km)
Roads affected by high watertables
($/km)
Access roads
Dirt or gravel tracks
2-B
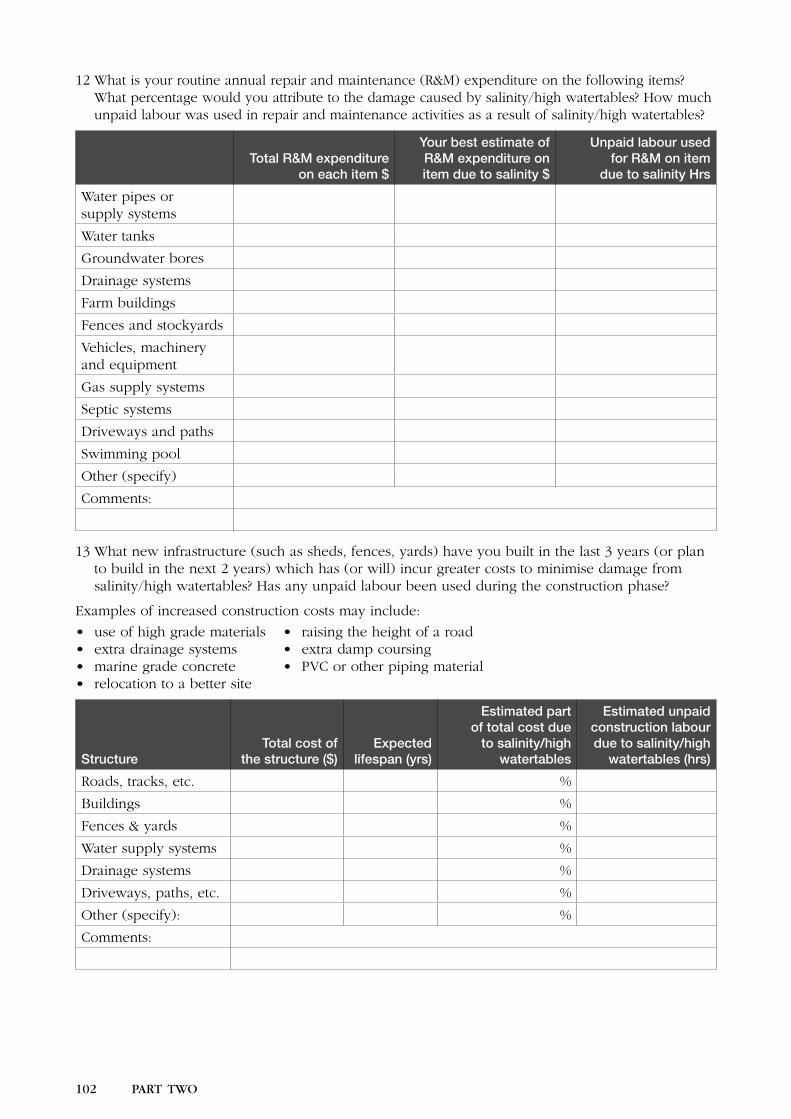
102 PART TWO PART TWO 103
12 What is your routine annual repair and maintenance (R&M) expenditure on the following items? What percentage would you attribute to the damage caused by salinity/high watertables? How much unpaid labour was used in repair and maintenance activities as a result of salinity/high watertables?
Total R&M expenditure on each item $
Your best estimate of R&M expenditure on item due to salinity $
Unpaid labour used for R&M on item
due to salinity Hrs
Water pipes or supply systems
Water tanks
Groundwater bores
Drainage systems
Farm buildings
Fences and stockyards
Vehicles, machinery and equipment
Gas supply systems
Septic systems
Driveways and paths
Swimming pool
Other (specify)
Comments:
13 What new infrastructure (such as sheds, fences, yards) have you built in the last 3 years (or plan to build in the next 2 years) which has (or will) incur greater costs to minimise damage from salinity/high watertables? Has any unpaid labour been used during the construction phase?
Examples of increased construction costs may include:
• use of high grade materials • raising the height of a road• extra drainage systems • extra damp coursing• marine grade concrete • PVC or other piping material• relocation to a better site
StructureTotal cost of
the structure ($)Expected
lifespan (yrs)
Estimated part of total cost due
to salinity/high watertables
Estimated unpaid construction labour due to salinity/high
watertables (hrs)
Roads, tracks, etc. %
Buildings %
Fences & yards %
Water supply systems %
Drainage systems %
Driveways, paths, etc. %
Other (specify): %
Comments:
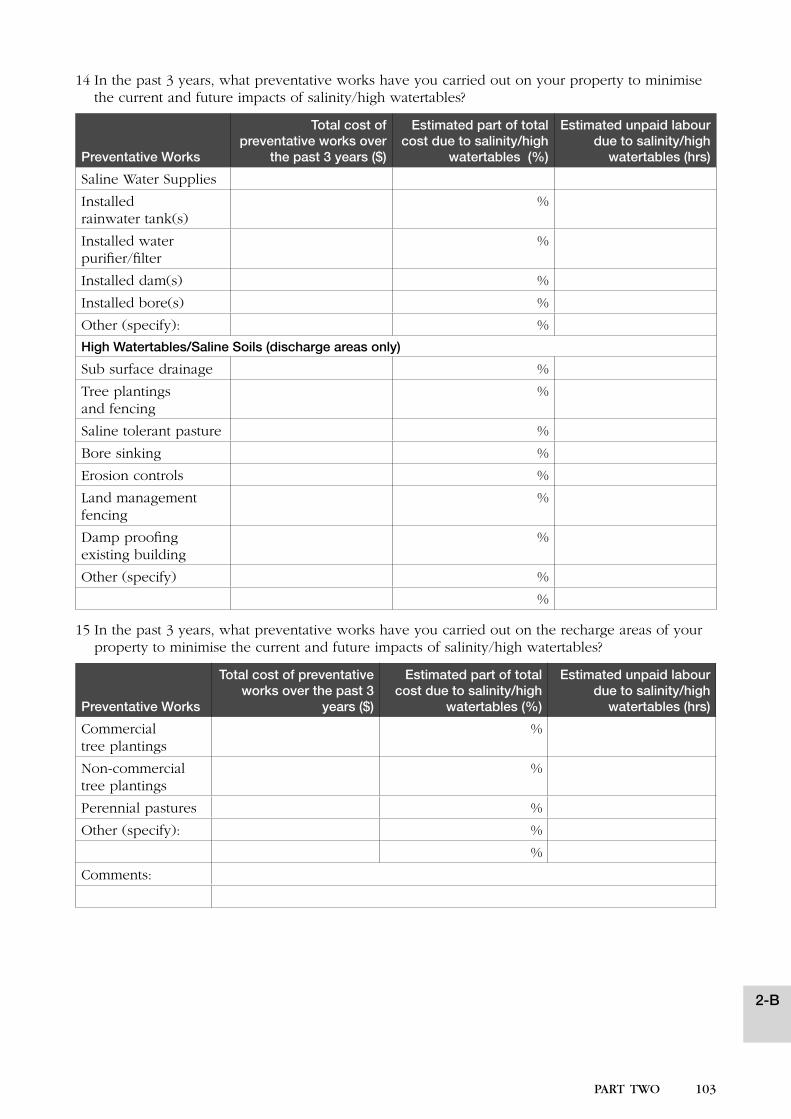
102 PART TWO PART TWO 103
14 In the past 3 years, what preventative works have you carried out on your property to minimise the current and future impacts of salinity/high watertables?
Preventative Works
Total cost of preventative works over
the past 3 years ($)
Estimated part of total cost due to salinity/high
watertables (%)
Estimated unpaid labour due to salinity/high
watertables (hrs)
Saline Water Supplies
Installed rainwater tank(s)
%
Installed water purifier/filter
%
Installed dam(s) %
Installed bore(s) %
Other (specify): %
High Watertables/Saline Soils (discharge areas only)
Sub surface drainage %
Tree plantings and fencing
%
Saline tolerant pasture %
Bore sinking %
Erosion controls %
Land management fencing
%
Damp proofing existing building
%
Other (specify) %
%
15 In the past 3 years, what preventative works have you carried out on the recharge areas of your property to minimise the current and future impacts of salinity/high watertables?
Preventative Works
Total cost of preventative works over the past 3
years ($)
Estimated part of total cost due to salinity/high
watertables (%)
Estimated unpaid labour due to salinity/high
watertables (hrs)
Commercial tree plantings
%
Non-commercial tree plantings
%
Perennial pastures %
Other (specify): %
%
Comments:
2-B
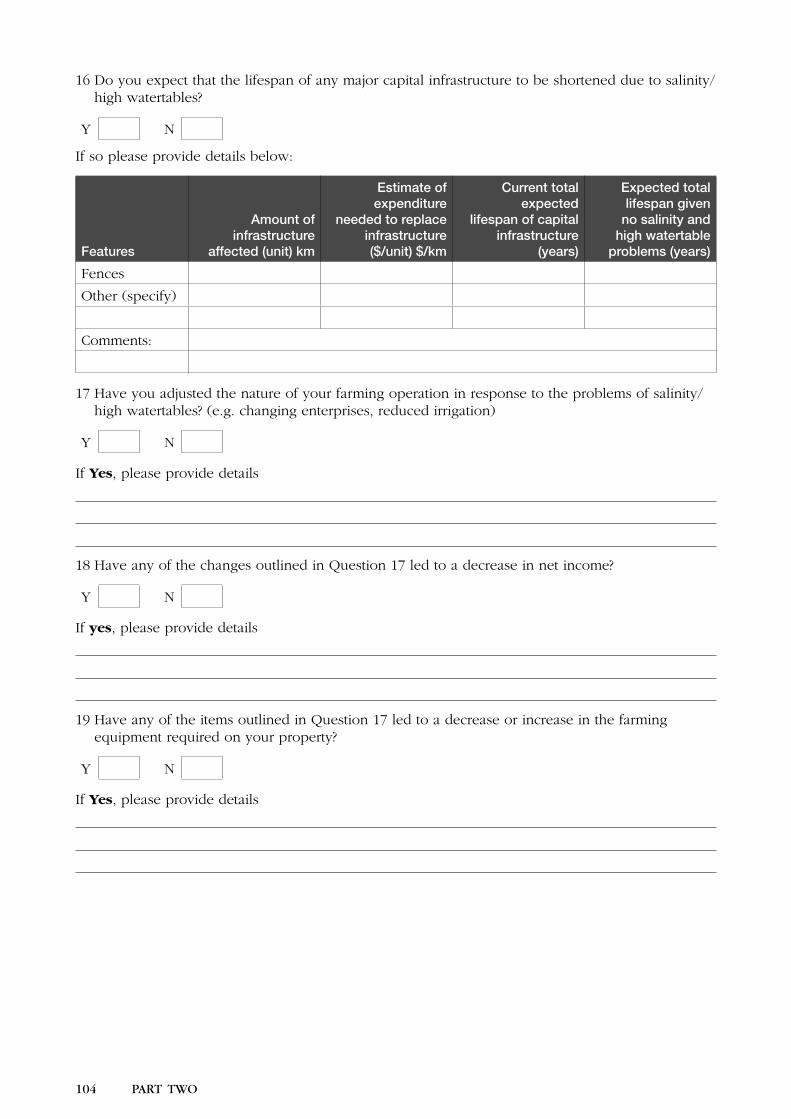
104 PART TWO
2-8
PART TWO 105
16 Do you expect that the lifespan of any major capital infrastructure to be shortened due to salinity/high watertables?
Y N
If so please provide details below:
Features
Amount of infrastructure
affected (unit) km
Estimate of expenditure
needed to replace infrastructure ($/unit) $/km
Current total expected
lifespan of capital infrastructure
(years)
Expected total lifespan given
no salinity and high watertable
problems (years)
Fences
Other (specify)
Comments:
17 Have you adjusted the nature of your farming operation in response to the problems of salinity/high watertables? (e.g. changing enterprises, reduced irrigation)
Y N
If Yes, please provide details
18 Have any of the changes outlined in Question 17 led to a decrease in net income?
Y N
If yes, please provide details
19 Have any of the items outlined in Question 17 led to a decrease or increase in the farming equipment required on your property?
Y N
If Yes, please provide details
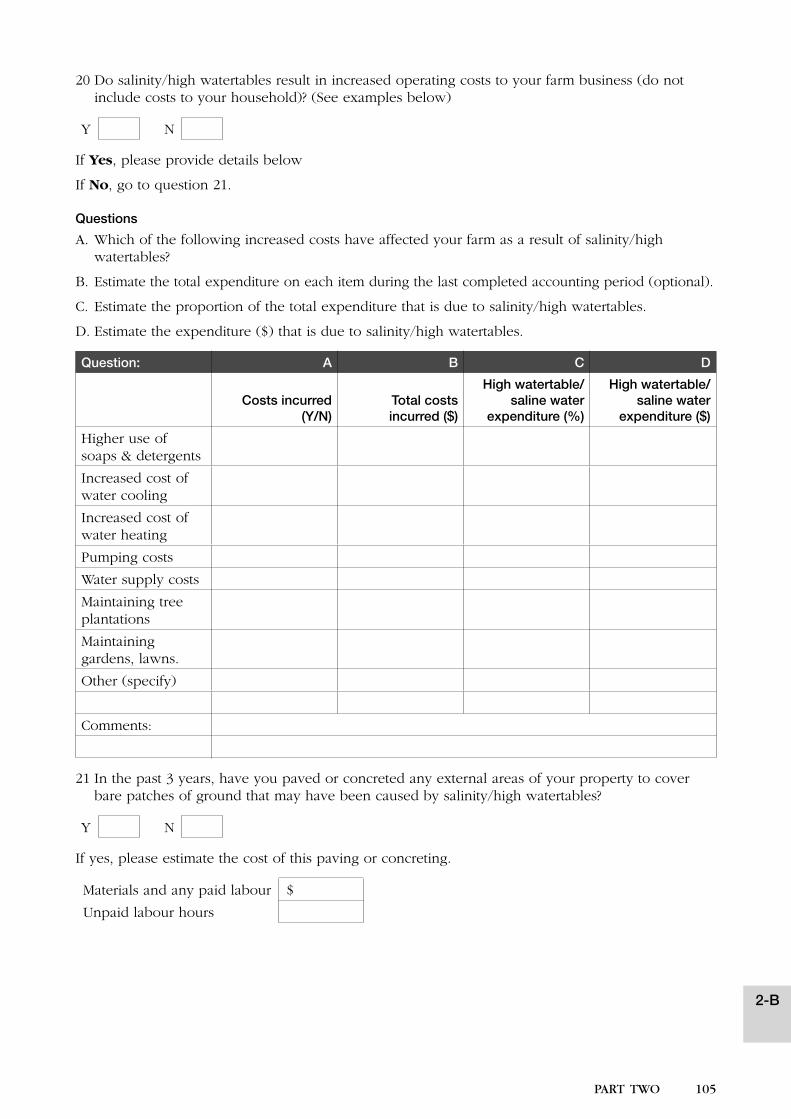
104 PART TWO
2-8
PART TWO 105
20 Do salinity/high watertables result in increased operating costs to your farm business (do not include costs to your household)? (See examples below)
Y N
If Yes, please provide details below
If No, go to question 21.
Questions
A. Which of the following increased costs have affected your farm as a result of salinity/high watertables?
B. Estimate the total expenditure on each item during the last completed accounting period (optional).
C. Estimate the proportion of the total expenditure that is due to salinity/high watertables.
D. Estimate the expenditure ($) that is due to salinity/high watertables.
Question: A B C D
Costs incurred (Y/N)
Total costs incurred ($)
High watertable/saline water
expenditure (%)
High watertable/saline water
expenditure ($)
Higher use of soaps & detergents
Increased cost of water cooling
Increased cost of water heating
Pumping costs
Water supply costs
Maintaining tree plantations
Maintaining gardens, lawns.
Other (specify)
Comments:
21 In the past 3 years, have you paved or concreted any external areas of your property to cover bare patches of ground that may have been caused by salinity/high watertables?
Y N
If yes, please estimate the cost of this paving or concreting.
Materials and any paid labour $
Unpaid labour hours
2-B

106 PART TWO PART TWO 107
22 Do you believe that your household has foregone any other income, or incurred any other costs because of the salinity/high watertables during the last 12 months? (e.g. reduced vegetable yields)
Y N
If Yes, please provide details
If you have any further comments on any matter please write them below:
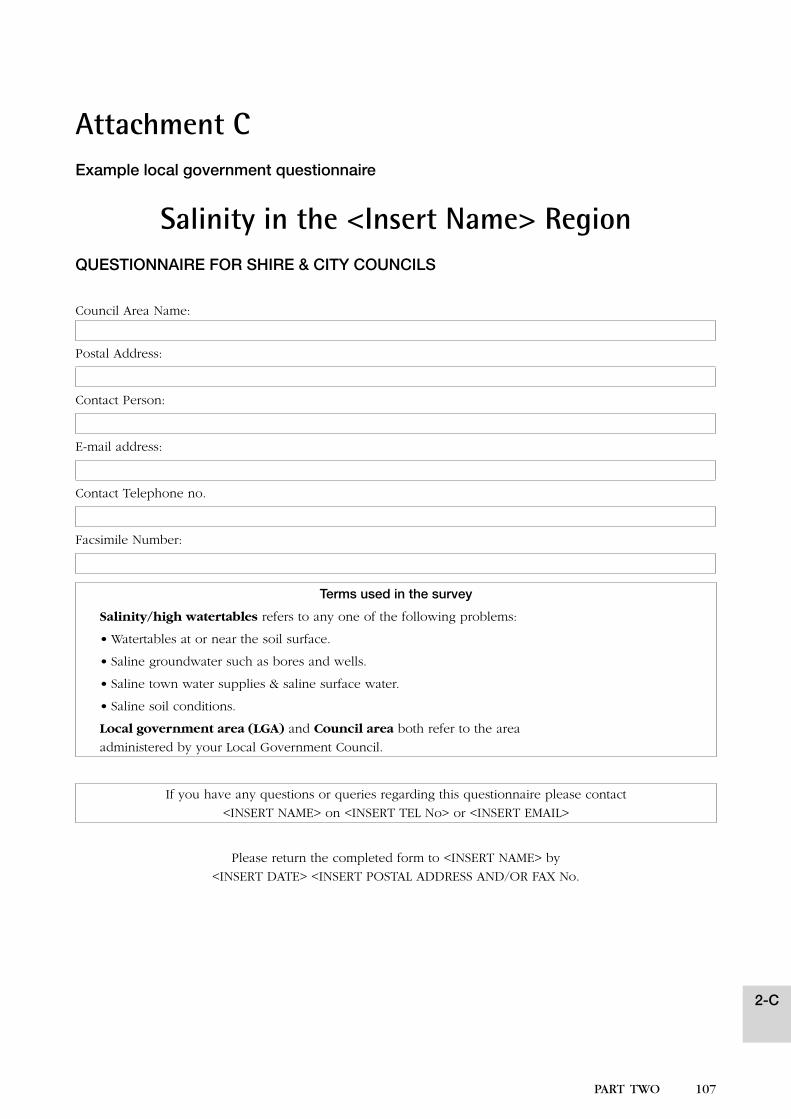
106 PART TWO PART TWO 107
Attachment CExample local government questionnaire
Salinity in the <Insert Name> RegionQUESTIONNAIRE FOR SHIRE & CITY COUNCILS
Council Area Name:
Postal Address:
Contact Person:
E-mail address:
Contact Telephone no.
Facsimile Number:
Terms used in the survey
Salinity/high watertables refers to any one of the following problems:
• Watertables at or near the soil surface.
• Saline groundwater such as bores and wells.
• Saline town water supplies & saline surface water.
• Saline soil conditions.
Local government area (LGA) and Council area both refer to the area
administered by your Local Government Council.
If you have any questions or queries regarding this questionnaire please contact
<INSERT NAME> on <INSERT TEL No> or <INSERT EMAIL>
Please return the completed form to <INSERT NAME> by
<INSERT DATE> <INSERT POSTAL ADDRESS AND/OR FAX No.
2-C
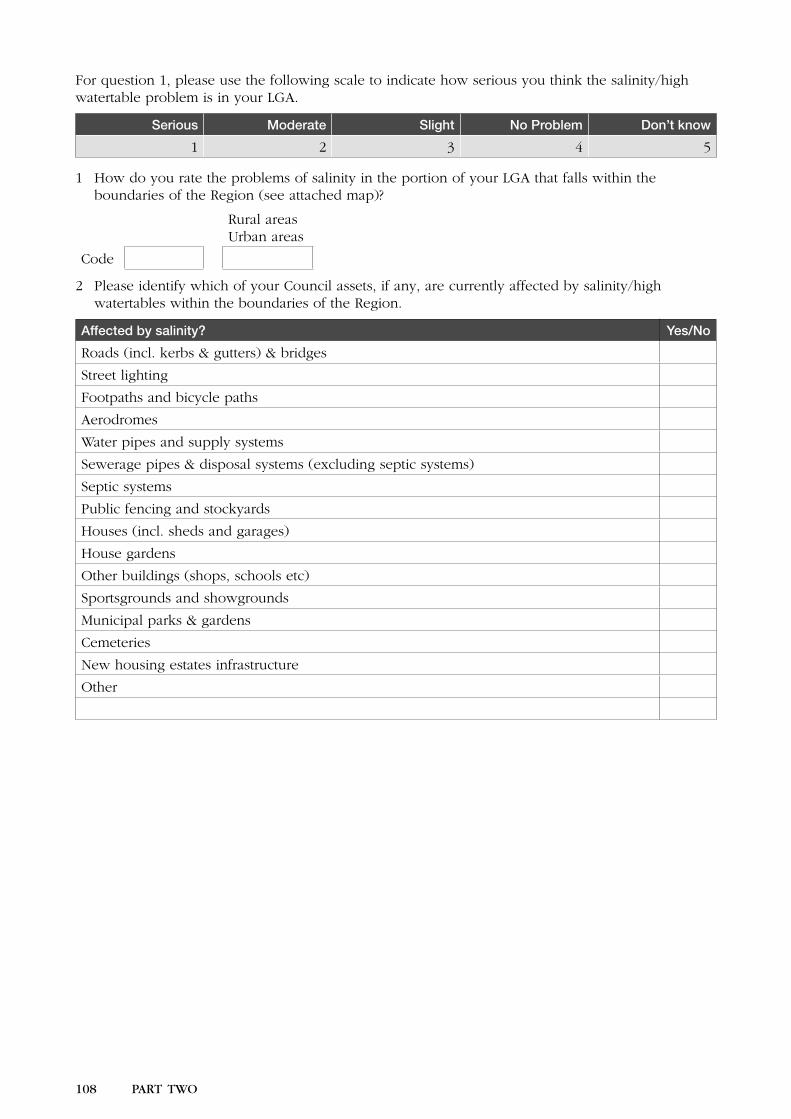
108 PART TWO PART TWO 109
For question 1, please use the following scale to indicate how serious you think the salinity/high watertable problem is in your LGA.
Serious Moderate Slight No Problem Don’t know
1 2 3 4 5
1 How do you rate the problems of salinity in the portion of your LGA that falls within the boundaries of the Region (see attached map)?
Rural areasUrban areas
Code
2 Please identify which of your Council assets, if any, are currently affected by salinity/high watertables within the boundaries of the Region.
Affected by salinity? Yes/No
Roads (incl. kerbs & gutters) & bridges
Street lighting
Footpaths and bicycle paths
Aerodromes
Water pipes and supply systems
Sewerage pipes & disposal systems (excluding septic systems)
Septic systems
Public fencing and stockyards
Houses (incl. sheds and garages)
House gardens
Other buildings (shops, schools etc)
Sportsgrounds and showgrounds
Municipal parks & gardens
Cemeteries
New housing estates infrastructure
Other
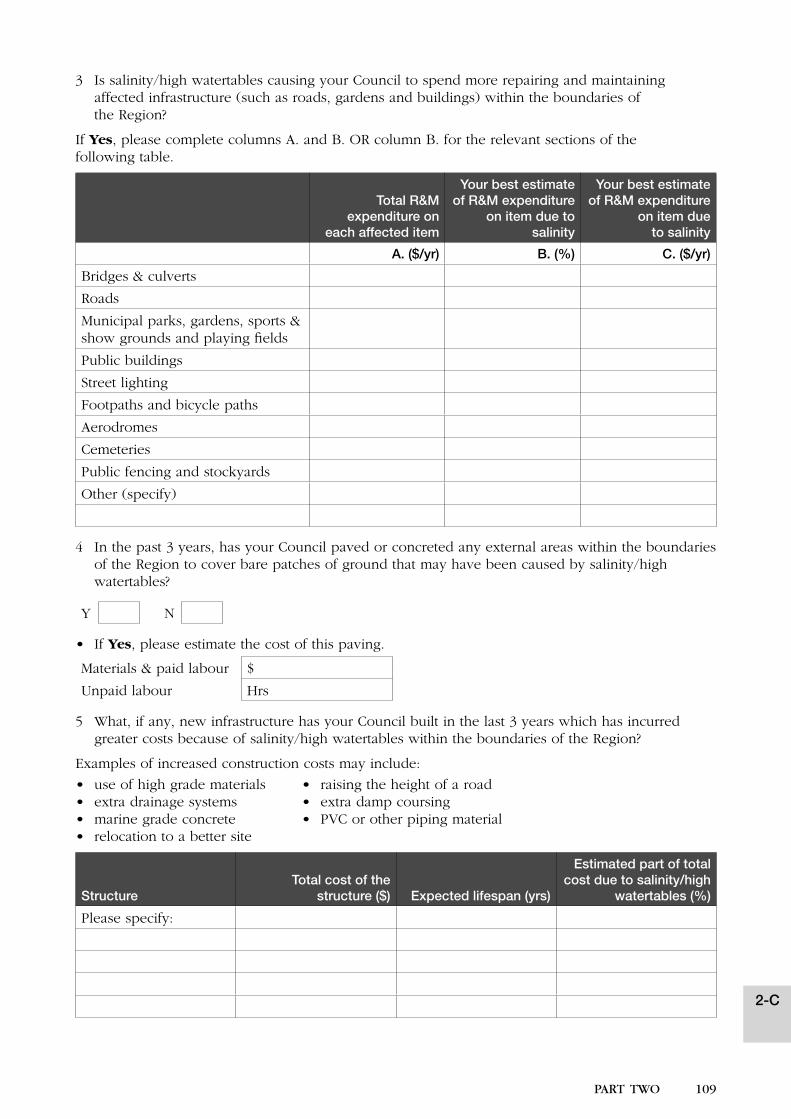
108 PART TWO PART TWO 109
3 Is salinity/high watertables causing your Council to spend more repairing and maintaining affected infrastructure (such as roads, gardens and buildings) within the boundaries of the Region?
If Yes, please complete columns A. and B. OR column B. for the relevant sections of the following table.
Total R&M expenditure on
each affected item
Your best estimate of R&M expenditure
on item due to salinity
Your best estimate of R&M expenditure
on item due to salinity
A. ($/yr) B. (%) C. ($/yr)
Bridges & culverts
Roads
Municipal parks, gardens, sports & show grounds and playing fields
Public buildings
Street lighting
Footpaths and bicycle paths
Aerodromes
Cemeteries
Public fencing and stockyards
Other (specify)
4 In the past 3 years, has your Council paved or concreted any external areas within the boundaries of the Region to cover bare patches of ground that may have been caused by salinity/high watertables?
Y N
• If Yes, please estimate the cost of this paving.
Materials & paid labour $
Unpaid labour Hrs
5 What, if any, new infrastructure has your Council built in the last 3 years which has incurred greater costs because of salinity/high watertables within the boundaries of the Region?
Examples of increased construction costs may include:
• use of high grade materials • raising the height of a road• extra drainage systems • extra damp coursing• marine grade concrete • PVC or other piping material• relocation to a better site
StructureTotal cost of the
structure ($) Expected lifespan (yrs)
Estimated part of total cost due to salinity/high
watertables (%)
Please specify:
2-C
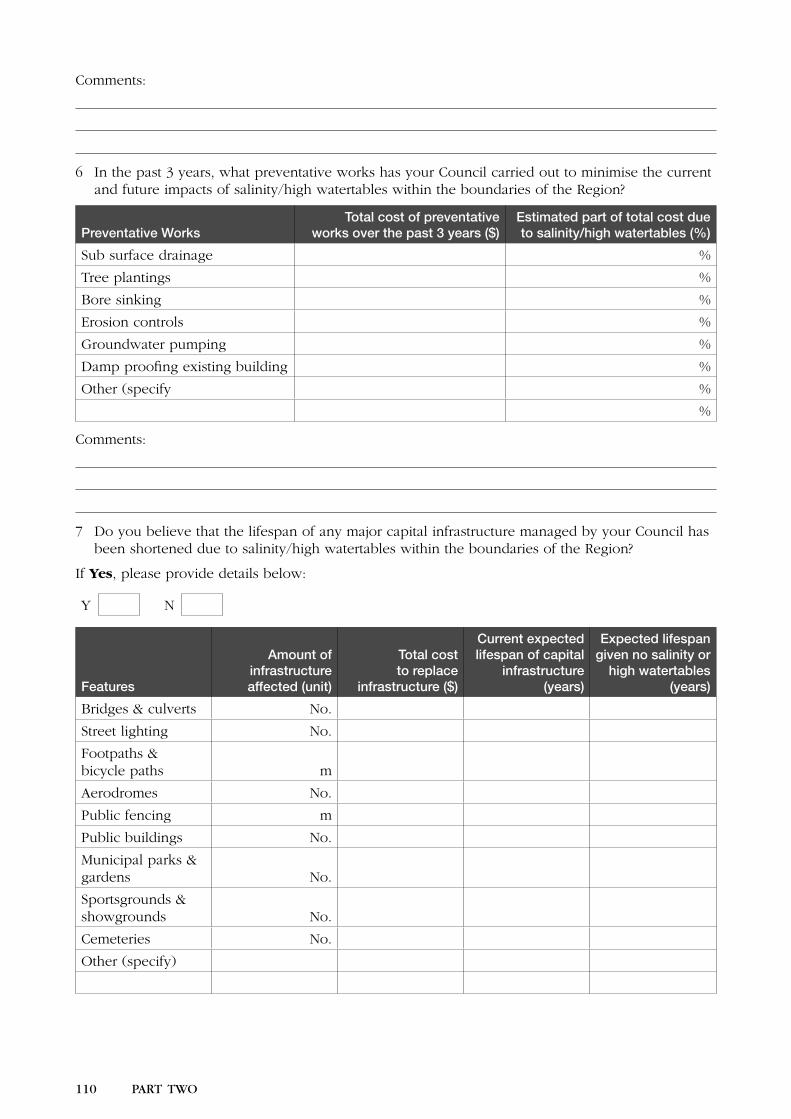
110 PART TWO PART TWO 111
Comments:
6 In the past 3 years, what preventative works has your Council carried out to minimise the current and future impacts of salinity/high watertables within the boundaries of the Region?
Preventative WorksTotal cost of preventative
works over the past 3 years ($)Estimated part of total cost due to salinity/high watertables (%)
Sub surface drainage %
Tree plantings %
Bore sinking %
Erosion controls %
Groundwater pumping %
Damp proofing existing building %
Other (specify %
%
Comments:
7 Do you believe that the lifespan of any major capital infrastructure managed by your Council has been shortened due to salinity/high watertables within the boundaries of the Region?
If Yes, please provide details below:
Y N
Features
Amount of infrastructure affected (unit)
Total cost to replace
infrastructure ($)
Current expected lifespan of capital
infrastructure (years)
Expected lifespan given no salinity or
high watertables (years)
Bridges & culverts No.
Street lighting No.
Footpaths & bicycle paths m
Aerodromes No.
Public fencing m
Public buildings No.
Municipal parks & gardens No.
Sportsgrounds & showgrounds No.
Cemeteries No.
Other (specify)
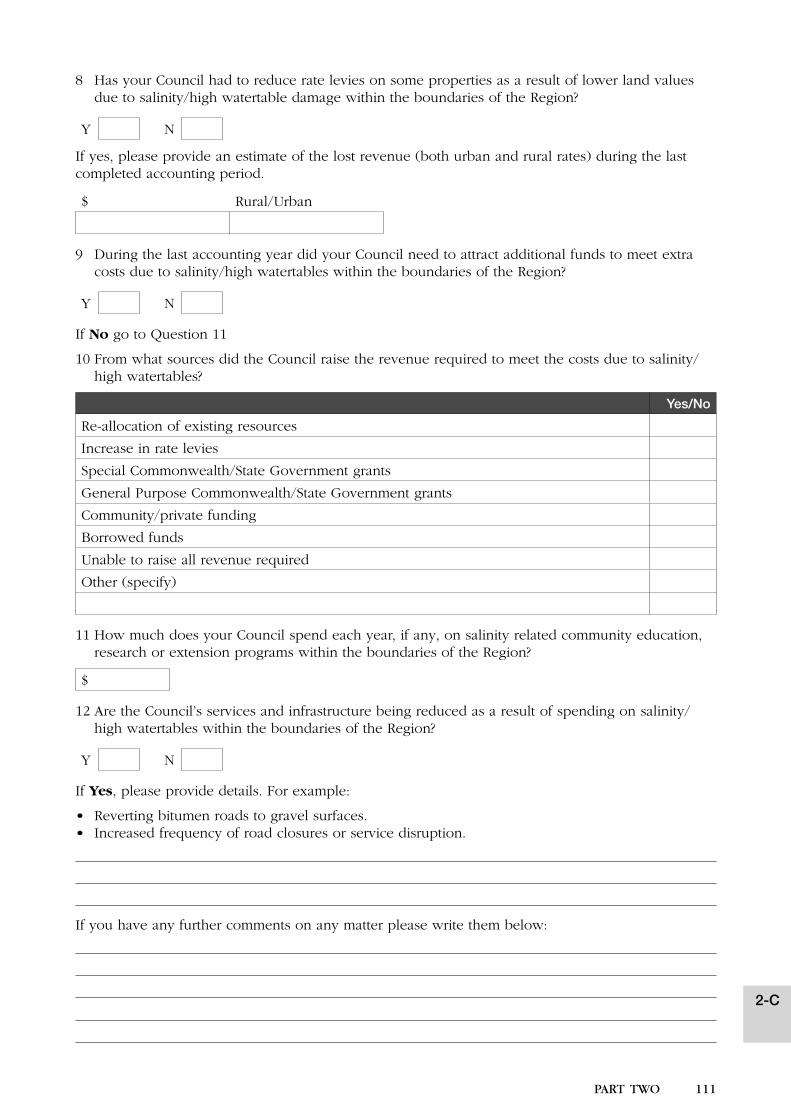
110 PART TWO PART TWO 111
8 Has your Council had to reduce rate levies on some properties as a result of lower land values due to salinity/high watertable damage within the boundaries of the Region?
Y N
If yes, please provide an estimate of the lost revenue (both urban and rural rates) during the last completed accounting period.
$ Rural/Urban
9 During the last accounting year did your Council need to attract additional funds to meet extra costs due to salinity/high watertables within the boundaries of the Region?
Y N
If No go to Question 11
10 From what sources did the Council raise the revenue required to meet the costs due to salinity/high watertables?
Yes/No
Re-allocation of existing resources
Increase in rate levies
Special Commonwealth/State Government grants
General Purpose Commonwealth/State Government grants
Community/private funding
Borrowed funds
Unable to raise all revenue required
Other (specify)
11 How much does your Council spend each year, if any, on salinity related community education, research or extension programs within the boundaries of the Region?
$
12 Are the Council’s services and infrastructure being reduced as a result of spending on salinity/high watertables within the boundaries of the Region?
Y N
If Yes, please provide details. For example:
• Reverting bitumen roads to gravel surfaces.• Increased frequency of road closures or service disruption.
If you have any further comments on any matter please write them below:
2-C
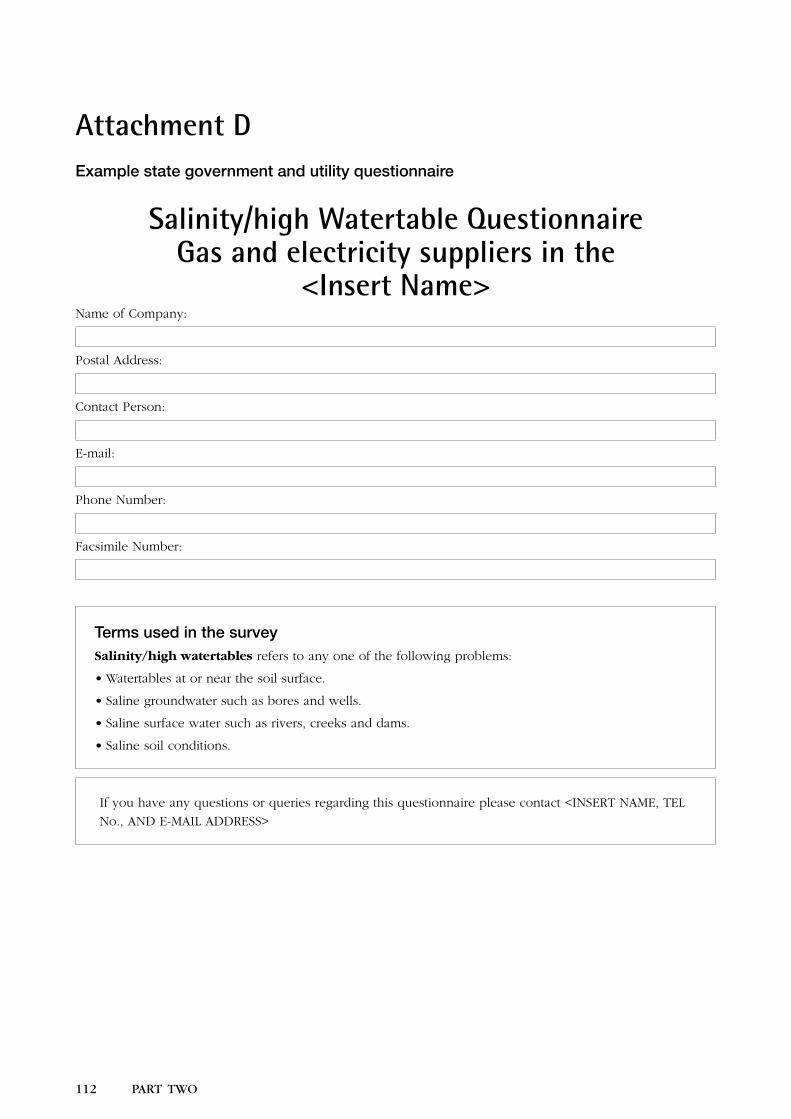
112 PART TWO PART TWO 113
Attachment DExample state government and utility questionnaire
Salinity/high Watertable QuestionnaireGas and electricity suppliers in the
<Insert Name>Name of Company:
Postal Address:
Contact Person:
E-mail:
Phone Number:
Facsimile Number:
Terms used in the surveySalinity/high watertables refers to any one of the following problems:
• Watertables at or near the soil surface.
• Saline groundwater such as bores and wells.
• Saline surface water such as rivers, creeks and dams.
• Saline soil conditions.
If you have any questions or queries regarding this questionnaire please contact <INSERT NAME, TEL
No., AND E-MAIL ADDRESS>
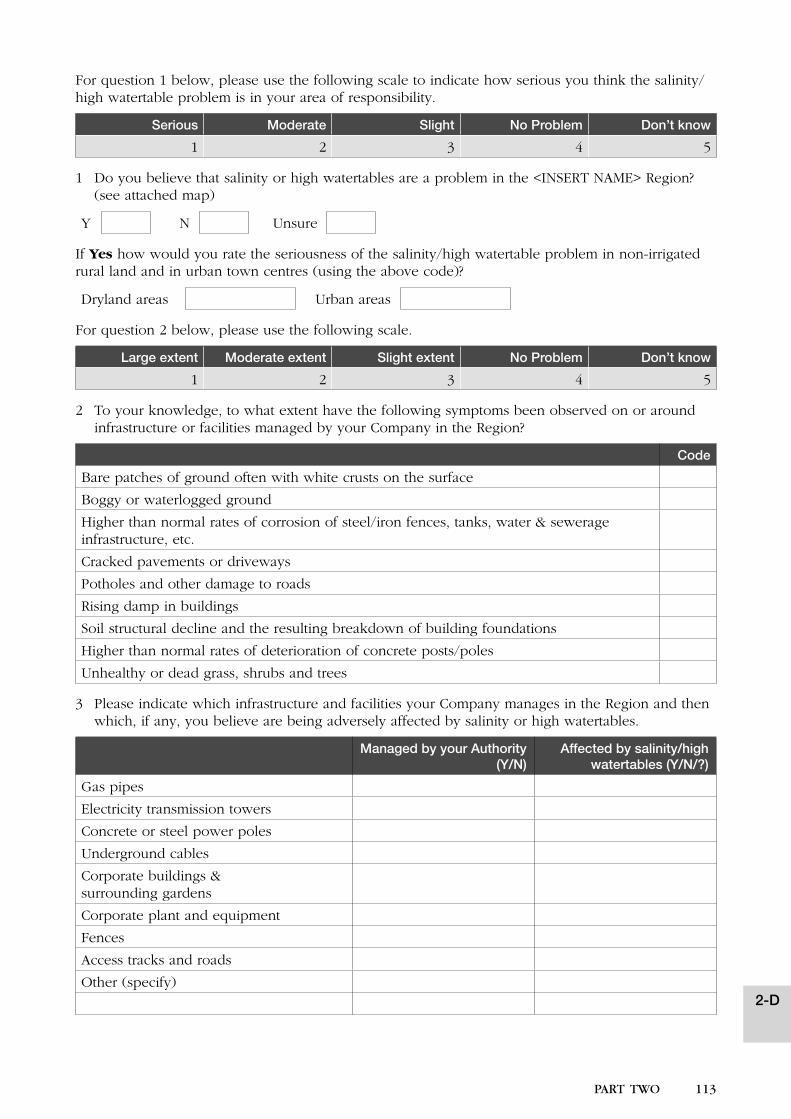
112 PART TWO PART TWO 113
For question 1 below, please use the following scale to indicate how serious you think the salinity/high watertable problem is in your area of responsibility.
Serious Moderate Slight No Problem Don’t know
1 2 3 4 5
1 Do you believe that salinity or high watertables are a problem in the <INSERT NAME> Region? (see attached map)
Y N Unsure
If Yes how would you rate the seriousness of the salinity/high watertable problem in non-irrigated rural land and in urban town centres (using the above code)?
Dryland areas Urban areas
For question 2 below, please use the following scale.
Large extent Moderate extent Slight extent No Problem Don’t know
1 2 3 4 5
2 To your knowledge, to what extent have the following symptoms been observed on or around infrastructure or facilities managed by your Company in the Region?
Code
Bare patches of ground often with white crusts on the surface
Boggy or waterlogged ground
Higher than normal rates of corrosion of steel/iron fences, tanks, water & sewerage infrastructure, etc.
Cracked pavements or driveways
Potholes and other damage to roads
Rising damp in buildings
Soil structural decline and the resulting breakdown of building foundations
Higher than normal rates of deterioration of concrete posts/poles
Unhealthy or dead grass, shrubs and trees
3 Please indicate which infrastructure and facilities your Company manages in the Region and then which, if any, you believe are being adversely affected by salinity or high watertables.
Managed by your Authority (Y/N)
Affected by salinity/high watertables (Y/N/?)
Gas pipes
Electricity transmission towers
Concrete or steel power poles
Underground cables
Corporate buildings & surrounding gardens
Corporate plant and equipment
Fences
Access tracks and roads
Other (specify)2-D
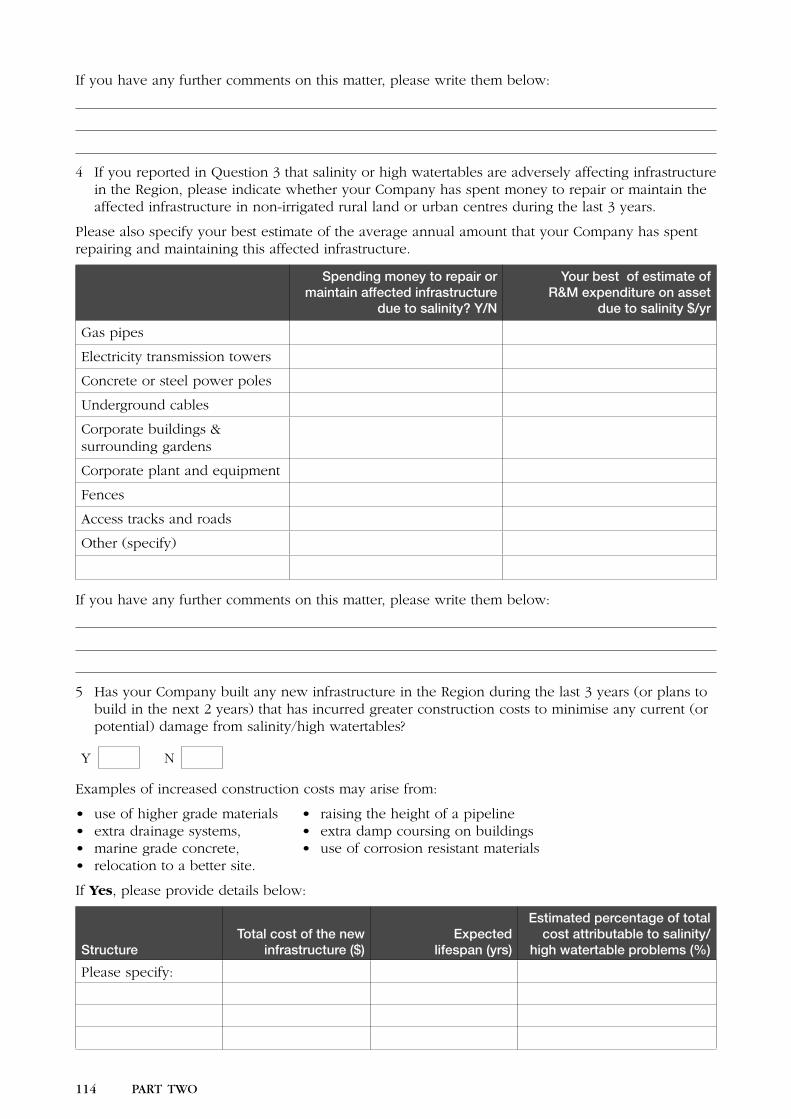
114 PART TWO PART TWO 115
If you have any further comments on this matter, please write them below:
4 If you reported in Question 3 that salinity or high watertables are adversely affecting infrastructure in the Region, please indicate whether your Company has spent money to repair or maintain the affected infrastructure in non-irrigated rural land or urban centres during the last 3 years.
Please also specify your best estimate of the average annual amount that your Company has spent repairing and maintaining this affected infrastructure.
Spending money to repair or maintain affected infrastructure
due to salinity? Y/N
Your best of estimate of R&M expenditure on asset
due to salinity $/yr
Gas pipes
Electricity transmission towers
Concrete or steel power poles
Underground cables
Corporate buildings & surrounding gardens
Corporate plant and equipment
Fences
Access tracks and roads
Other (specify)
If you have any further comments on this matter, please write them below:
5 Has your Company built any new infrastructure in the Region during the last 3 years (or plans to build in the next 2 years) that has incurred greater construction costs to minimise any current (or potential) damage from salinity/high watertables?
Y N
Examples of increased construction costs may arise from:
• use of higher grade materials • raising the height of a pipeline • extra drainage systems, • extra damp coursing on buildings• marine grade concrete, • use of corrosion resistant materials• relocation to a better site.
If Yes, please provide details below:
StructureTotal cost of the new
infrastructure ($)Expected
lifespan (yrs)
Estimated percentage of total cost attributable to salinity/
high watertable problems (%)
Please specify:
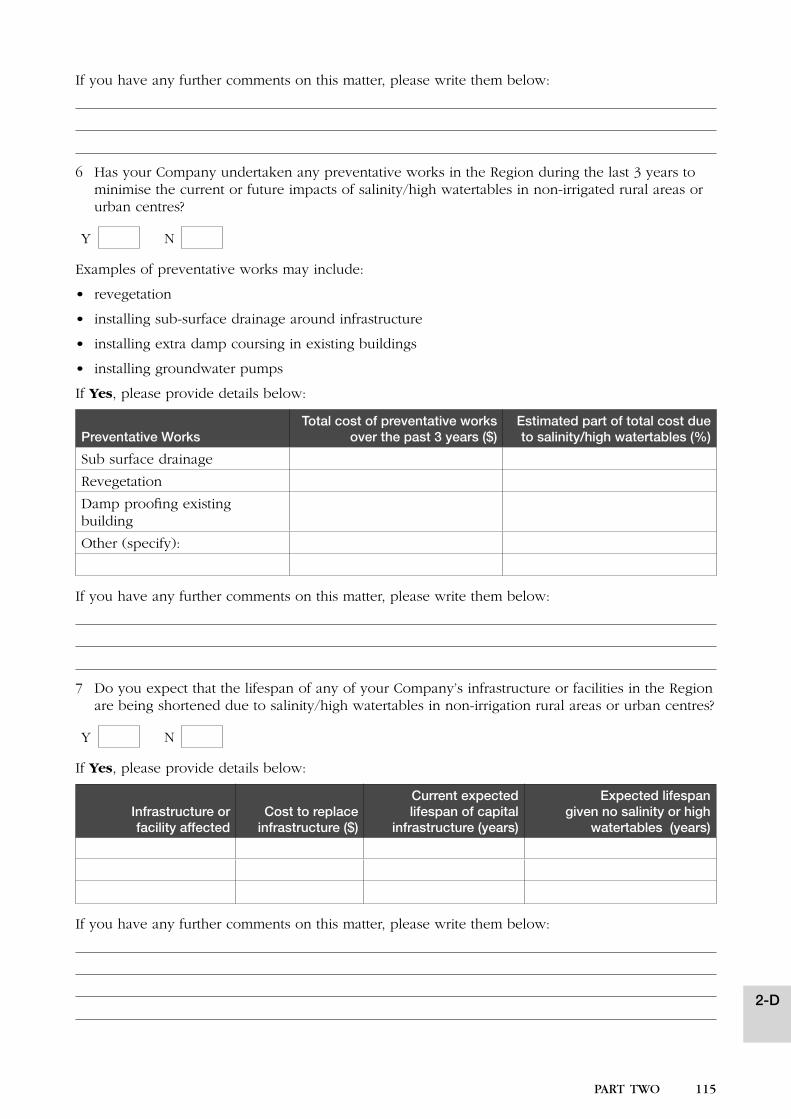
114 PART TWO PART TWO 115
If you have any further comments on this matter, please write them below:
6 Has your Company undertaken any preventative works in the Region during the last 3 years to minimise the current or future impacts of salinity/high watertables in non-irrigated rural areas or urban centres?
Y N
Examples of preventative works may include:
• revegetation
• installing sub-surface drainage around infrastructure
• installing extra damp coursing in existing buildings
• installing groundwater pumps
If Yes, please provide details below:
Preventative WorksTotal cost of preventative works
over the past 3 years ($)Estimated part of total cost due to salinity/high watertables (%)
Sub surface drainage
Revegetation
Damp proofing existing building
Other (specify):
If you have any further comments on this matter, please write them below:
7 Do you expect that the lifespan of any of your Company’s infrastructure or facilities in the Region are being shortened due to salinity/high watertables in non-irrigation rural areas or urban centres?
Y N
If Yes, please provide details below:
Infrastructure or facility affected
Cost to replace infrastructure ($)
Current expected lifespan of capital
infrastructure (years)
Expected lifespan given no salinity or high
watertables (years)
If you have any further comments on this matter, please write them below:
2-D
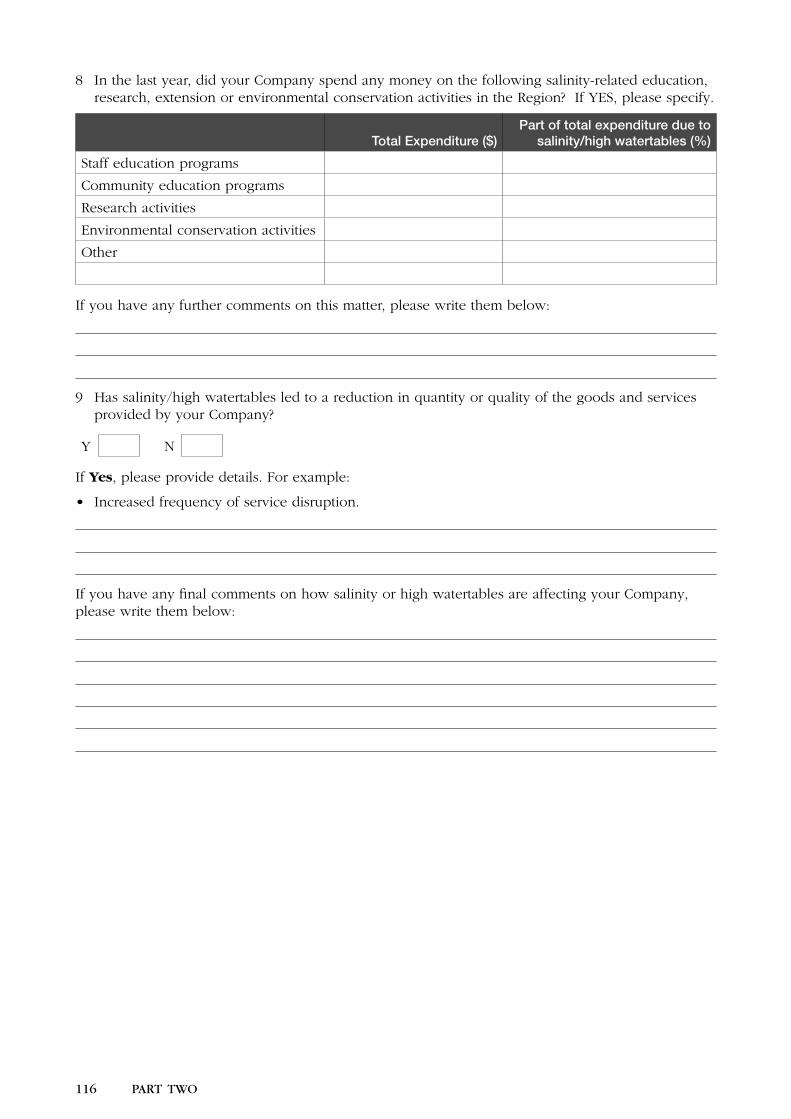
116 PART TWO PART TWO 117
8 In the last year, did your Company spend any money on the following salinity-related education, research, extension or environmental conservation activities in the Region? If YES, please specify.
Total Expenditure ($)Part of total expenditure due to
salinity/high watertables (%)
Staff education programs
Community education programs
Research activities
Environmental conservation activities
Other
If you have any further comments on this matter, please write them below:
9 Has salinity/high watertables led to a reduction in quantity or quality of the goods and services provided by your Company?
Y N
If Yes, please provide details. For example:
• Increased frequency of service disruption.
If you have any final comments on how salinity or high watertables are affecting your Company, please write them below:
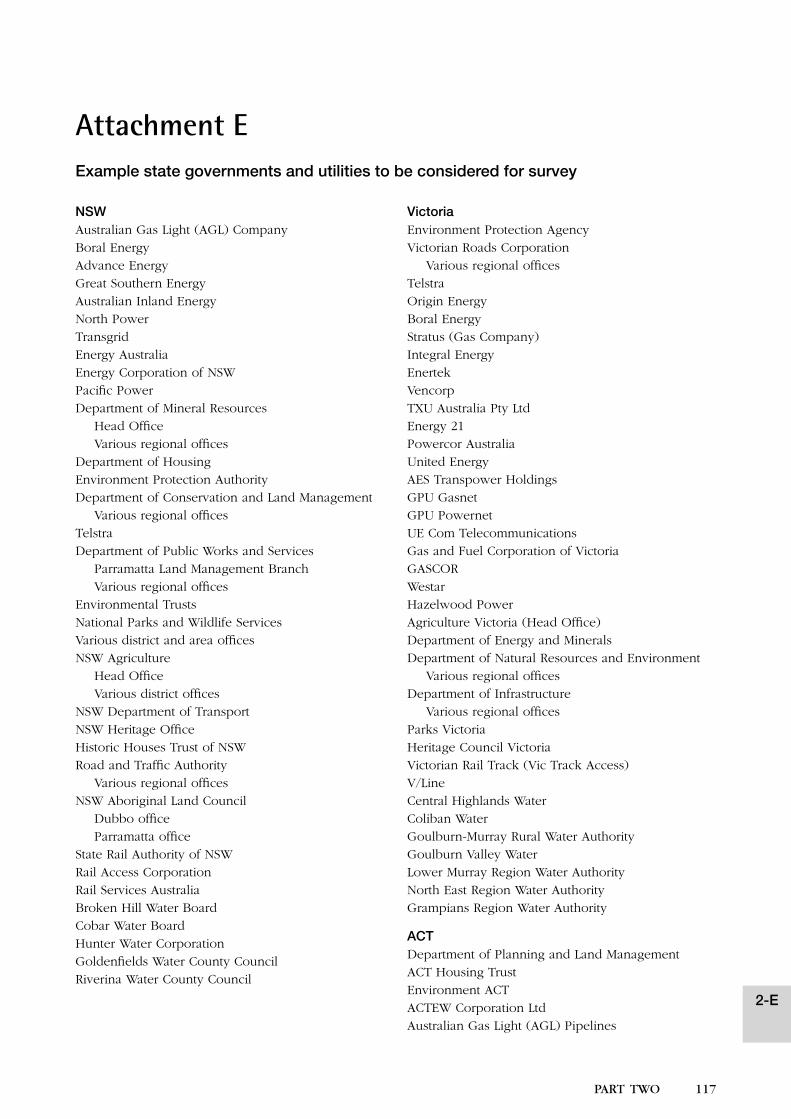
116 PART TWO PART TWO 117
Attachment EExample state governments and utilities to be considered for survey
NSWAustralian Gas Light (AGL) CompanyBoral EnergyAdvance EnergyGreat Southern EnergyAustralian Inland EnergyNorth PowerTransgridEnergy AustraliaEnergy Corporation of NSWPacific PowerDepartment of Mineral Resources
Head OfficeVarious regional offices
Department of HousingEnvironment Protection AuthorityDepartment of Conservation and Land Management
Various regional officesTelstraDepartment of Public Works and Services
Parramatta Land Management BranchVarious regional offices
Environmental TrustsNational Parks and Wildlife ServicesVarious district and area officesNSW Agriculture
Head OfficeVarious district offices
NSW Department of TransportNSW Heritage OfficeHistoric Houses Trust of NSWRoad and Traffic Authority
Various regional officesNSW Aboriginal Land Council
Dubbo officeParramatta office
State Rail Authority of NSWRail Access CorporationRail Services AustraliaBroken Hill Water BoardCobar Water BoardHunter Water CorporationGoldenfields Water County CouncilRiverina Water County Council
VictoriaEnvironment Protection AgencyVictorian Roads Corporation
Various regional officesTelstraOrigin EnergyBoral EnergyStratus (Gas Company)Integral EnergyEnertekVencorpTXU Australia Pty LtdEnergy 21Powercor AustraliaUnited EnergyAES Transpower HoldingsGPU GasnetGPU PowernetUE Com TelecommunicationsGas and Fuel Corporation of VictoriaGASCORWestarHazelwood PowerAgriculture Victoria (Head Office)Department of Energy and MineralsDepartment of Natural Resources and Environment
Various regional officesDepartment of Infrastructure
Various regional officesParks VictoriaHeritage Council VictoriaVictorian Rail Track (Vic Track Access)V/LineCentral Highlands WaterColiban WaterGoulburn-Murray Rural Water AuthorityGoulburn Valley WaterLower Murray Region Water AuthorityNorth East Region Water AuthorityGrampians Region Water Authority
ACTDepartment of Planning and Land ManagementACT Housing TrustEnvironment ACTACTEW Corporation LtdAustralian Gas Light (AGL) Pipelines
2-E
Cost of dryland and urban salinity in the Murray-Darling Basin
MDBC Publication 37/04ISBN 1 876830 89 1
Cost of dryland and urban salinity in the Murray-Darling Basin CD
What is on this CD?
The primary purpose of this CD is to answer the following questions about dryland
and urban salinity in each of the 26 surface water catchments located in the Murray-Darling Basin:
• What are the current impacts of dryland and urban salinity?
• Who are affected?
• What are the costs?
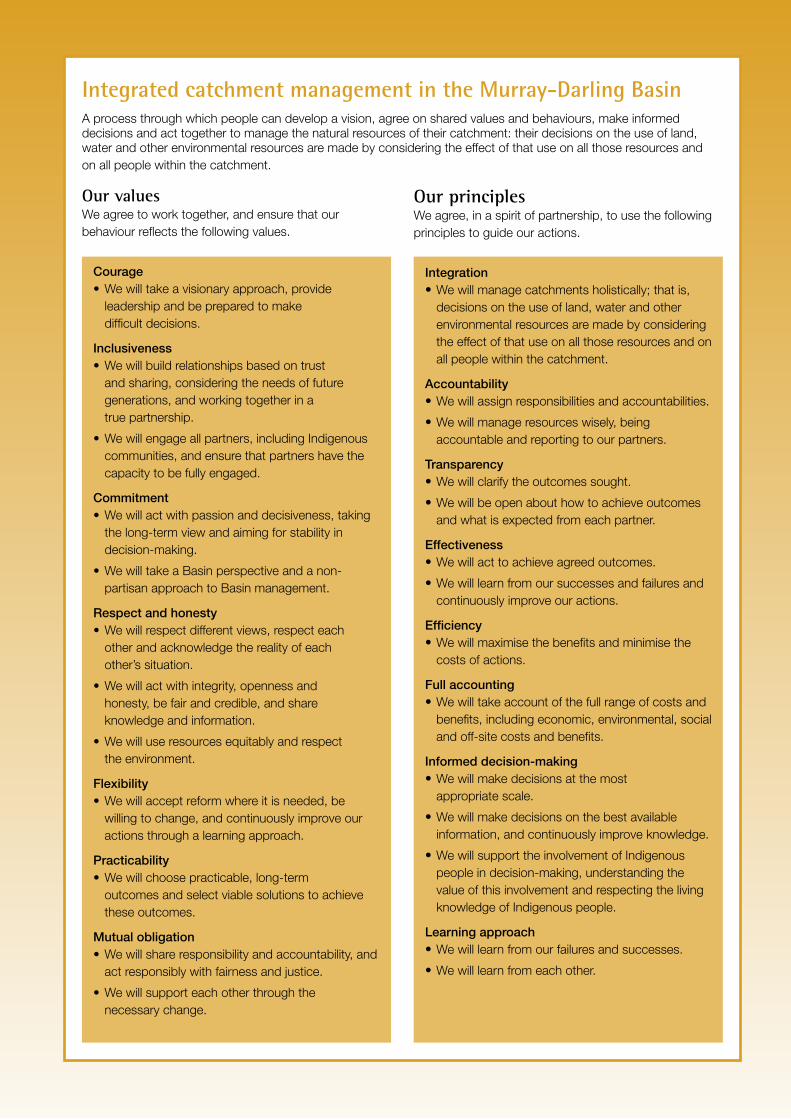
Author: Dr. Suzanne M. Wilson
Published by: Murray-Darling Basin Commission
Postal Address: GPO Box 409, Canberra ACT 2601
Office location: Level 5, 15 Moore Street, Canberra City
Australian Capital Territory
Telephone: (02) 6279 0100
International + 61 2 6279 0100
Facsimile: (02) 6248 8053
International + 61 2 6248 8053
E-mail: [email protected]
Internet: http://www.mdbc.gov.au
For further information contact the Murray-Darling Basin Commission office on (02) 6279 0100.
This report may be cited as:
Wilson, S.M. 2004 Dryland and urban salinity costs across the Murray-Darling Basin. An overview & guidelines
for identifying and valuing the impacts, Murray-Darling Basin Commission, Canberra.
ISBN 1 876830 883
© Copyright Murray-Darling Basin Commission 2004
This work is copyright. Graphical and textual information in the work (with the exception of photographs and the
MDBC logo) may be stored, retrieved and reproduced in whole or in part, provided the information is not sold or used
for commercial benefit and its source Dryland and urban salinity costs across the Murray-Darling Basin. An overview
& guidelines for identifying and valuing the impacts, is acknowledged. Such reproduction includes fair dealing for the
purpose of private study, research, criticism or review as permitted under the Copyright Act 1968. Reproduction for other
purposes is prohibited without prior permission of the Murray-Darling Basin Commission or the individual photographers
and artists with whom copyright applies.
To the extent permitted by law, the copyright holders (including its employees and consultants) exclude all liability
to any person for any consequences, including but not limited to all losses, damages, costs, expenses and any other
compensation, arising directly or indirectly from using this report (in part or in whole) and any information or material
contained in it.
The contents of this publication do not purport to represent the position of the Murray-Darling Basin Commission.
They are presented to inform discussion for improvement of the Basin’s natural resources.
Cover photo: Arthur Mostead, Dryland Salinity reclamation, Galong NSW.
MDBC Publication 34/04
Integrated catchment management in the Murray-Darling BasinA process through which people can develop a vision, agree on shared values and behaviours, make informed decisions and act together to manage the natural resources of their catchment: their decisions on the use of land, water and other environmental resources are made by considering the effect of that use on all those resources and on all people within the catchment.
Our valuesWe agree to work together, and ensure that our behaviour reflects the following values.
Courage• We will take a visionary approach, provide
leadership and be prepared to make difficult decisions.
Inclusiveness• We will build relationships based on trust
and sharing, considering the needs of future generations, and working together in a true partnership.
• We will engage all partners, including Indigenous communities, and ensure that partners have the capacity to be fully engaged.
Commitment• We will act with passion and decisiveness, taking
the long-term view and aiming for stability in decision-making.
• We will take a Basin perspective and a non-partisan approach to Basin management.
Respect and honesty• We will respect different views, respect each
other and acknowledge the reality of each other’s situation.
• We will act with integrity, openness and honesty, be fair and credible, and share knowledge and information.
• We will use resources equitably and respect the environment.
Flexibility• We will accept reform where it is needed, be
willing to change, and continuously improve our actions through a learning approach.
Practicability• We will choose practicable, long-term
outcomes and select viable solutions to achieve these outcomes.
Mutual obligation• We will share responsibility and accountability, and
act responsibly with fairness and justice.
• We will support each other through the necessary change.
Our principlesWe agree, in a spirit of partnership, to use the following principles to guide our actions.
Integration• We will manage catchments holistically; that is,
decisions on the use of land, water and other environmental resources are made by considering the effect of that use on all those resources and on all people within the catchment.
Accountability• We will assign responsibilities and accountabilities.
• We will manage resources wisely, being accountable and reporting to our partners.
Transparency • We will clarify the outcomes sought.
• We will be open about how to achieve outcomes and what is expected from each partner.
Effectiveness• We will act to achieve agreed outcomes.
• We will learn from our successes and failures and continuously improve our actions.
Efficiency • We will maximise the benefits and minimise the
costs of actions.
Full accounting • We will take account of the full range of costs and
benefits, including economic, environmental, social and off-site costs and benefits.
Informed decision-making• We will make decisions at the most
appropriate scale.
• We will make decisions on the best available information, and continuously improve knowledge.
• We will support the involvement of Indigenous people in decision-making, understanding the value of this involvement and respecting the living knowledge of Indigenous people.
Learning approach• We will learn from our failures and successes.
• We will learn from each other.

KN
OW
LE
DG
E
Land
scap
es &
Indu
strie
sDryland and urban salinity costs across the Murray-Darling Basin
Dr Suzanne M. Wilson
AN OVERVIEW & GUIDELINES FOR IDENTIFYING AND VALUING THE IMPACTS
Dry
land
and
urb
an s
alin
ity c
osts
acr
oss
the
Mur
ray-
Dar
ling
Basi
n AN
OVE
RVIE
W &
GU
IDEL
INES
FO
R ID
ENTI
FYIN
G A
ND
VAL
UIN
G T
HE
IMPA
CTS