Embed Size (px)
Citation preview

Dry Mantle Melting and Dry Mantle Melting and the Origin of Basaltic the Origin of Basaltic
MagmaMagma
GEOS 508 Lec 14-15-16GEOS 508 Lec 14-15-16
Mantle meltingMantle melting
Needs special condition to melt, usually Needs special condition to melt, usually solid;solid;
Melt fractions usually low, under 2% at any Melt fractions usually low, under 2% at any given time;given time;
Regardless of melting conditions, yields Regardless of melting conditions, yields one or another variety of basaltic (low one or another variety of basaltic (low silica) melts - andesites, dacites, do not silica) melts - andesites, dacites, do not come out of the mantle;come out of the mantle;

2 principal types of basalt in 2 principal types of basalt in the ocean basins the ocean basins
Common petrographic differences between tholeiitic and alkaline basaltsCommon petrographic differences between tholeiitic and alkaline basalts
Tholeiitic Basalt Alkaline BasaltUsually fine-grained, intergranular Usually fairly coarse, intergranular to ophitic
Groundmass No olivine Olivine common
Clinopyroxene = augite (plus possibly pigeonite) Titaniferous augite (reddish)
Orthopyroxene (hypersthene) common, may rim ol. Orthopyroxene absent
No alkali feldspar Interstitial alkali feldspar or feldspathoid may occur
Interstitial glass and/or quartz common Interstitial glass rare, and quartz absent
Olivine rare, unzoned, and may be partially resorbed Olivine common and zoned
Phenocrysts or show reaction rims of orthopyroxene
Orthopyroxene uncommon Orthopyroxene absent
Early plagioclase common Plagioclase less common, and later in sequence
Clinopyroxene is pale brown augite Clinopyroxene is titaniferous augite, reddish rims
after Hughes (1982) and McBirney (1993).
Tholeiitic Basalt and Alkaline Basalt

Tholeiites are generated at mid-ocean ridgesTholeiites are generated at mid-ocean ridges Also generated at oceanic islands, Also generated at oceanic islands,
subduction zonessubduction zones Alkaline basalts generated at ocean islandsAlkaline basalts generated at ocean islands
Also at subduction zonesAlso at subduction zones
Each is chemically distinctEach is chemically distinct
Evolve via FX as separate series Evolve via FX as separate series along different pathsalong different paths
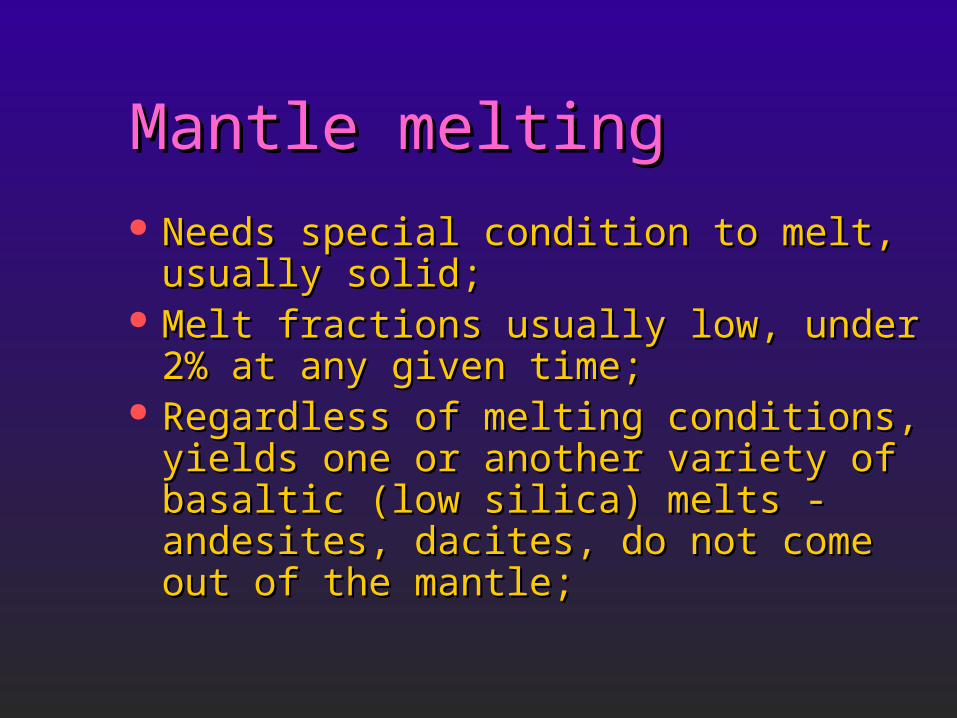
Sources of mantle materialSources of mantle material OphiolitesOphiolites
Slabs of oceanic crust and upper mantleSlabs of oceanic crust and upper mantle Thrust at subduction zones onto edge of continentThrust at subduction zones onto edge of continent
Dredge samples from oceanic fracture zonesDredge samples from oceanic fracture zones Nodules and Nodules and xenolithsxenoliths in some basalts in some basalts Kimberlite xenolithsKimberlite xenoliths
Diamond-bearing pipes blasted up from the Diamond-bearing pipes blasted up from the mantle carrying numerous xenoliths from depthmantle carrying numerous xenoliths from depth
15
10
5
00.0 0.2 0.4 0.6 0.8
Wt.
% A
l 2O3
Wt.% TiO2
DuniteHarzburgite
Lherzolite
Tholeiitic basalt
Partia
l Melt
ing
Residuum
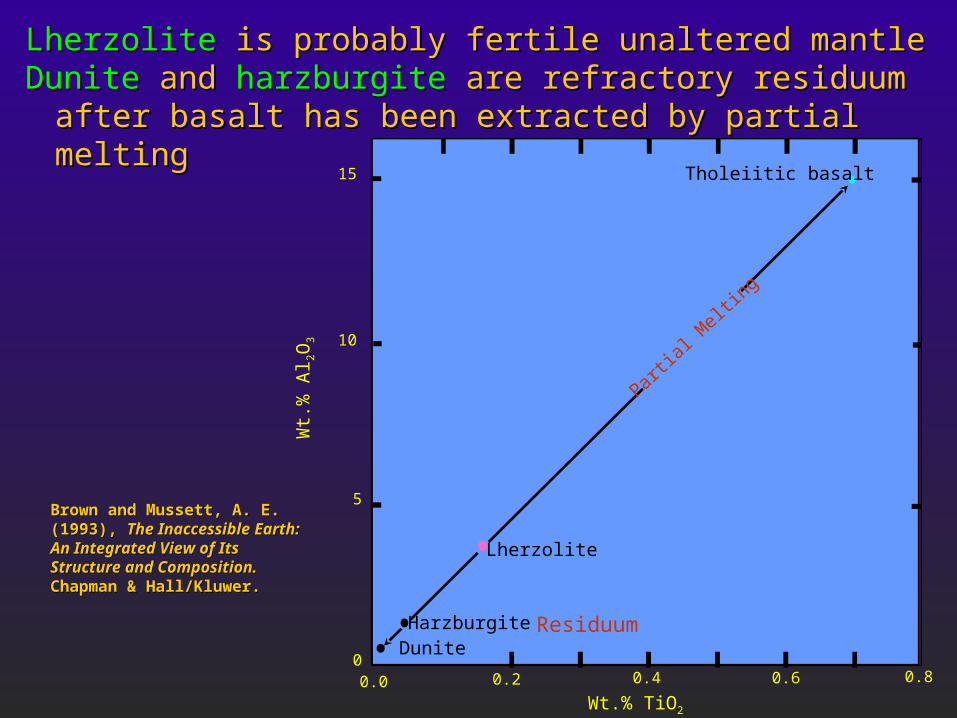
LherzoliteLherzolite is probably fertile unaltered mantle is probably fertile unaltered mantleDuniteDunite and and harzburgiteharzburgite are refractory residuum after basalt has been are refractory residuum after basalt has been
extracted by partial meltingextracted by partial melting
Brown and Mussett, A. E. (1993), Brown and Mussett, A. E. (1993), The Inaccessible Earth: An The Inaccessible Earth: An Integrated View of Its Structure Integrated View of Its Structure and Composition. and Composition. Chapman & Chapman & Hall/Kluwer.Hall/Kluwer.

LherzoliteLherzolite: A type of : A type of peridotiteperidotite with Olivine > Opx + Cpxwith Olivine > Opx + Cpx
OlivineOlivine
ClinopyroxeneClinopyroxeneOrthopyroxeneOrthopyroxene
LherzoliteLherzoliteH
arzb
urgi
teW
ehrlite
Websterite
OrthopyroxeniteOrthopyroxenite
ClinopyroxeniteClinopyroxenite
Olivine Websterite
PeridotitesPeridotites
PyroxenitesPyroxenites
90
40
10
10
DuniteDunite

Phase diagram for aluminous Phase diagram for aluminous 4-phase lherzolite:4-phase lherzolite:
PlagioclasePlagioclase shallow (< 30 km)shallow (< 30 km)
SpinelSpinel 30-80 km30-80 km
GarnetGarnet 80-400 km80-400 km
Si Si VI coord. VI coord. > 400 km> 400 km
Al-phase =Al-phase =
Phase diagram of aluminous lherzolite with melting interval (gray), sub-solidus reactions, and Phase diagram of aluminous lherzolite with melting interval (gray), sub-solidus reactions, and geothermal gradient. After geothermal gradient. After Wyllie, P. J. (1981). Geol. Rundsch. 70, 128-153.Wyllie, P. J. (1981). Geol. Rundsch. 70, 128-153.
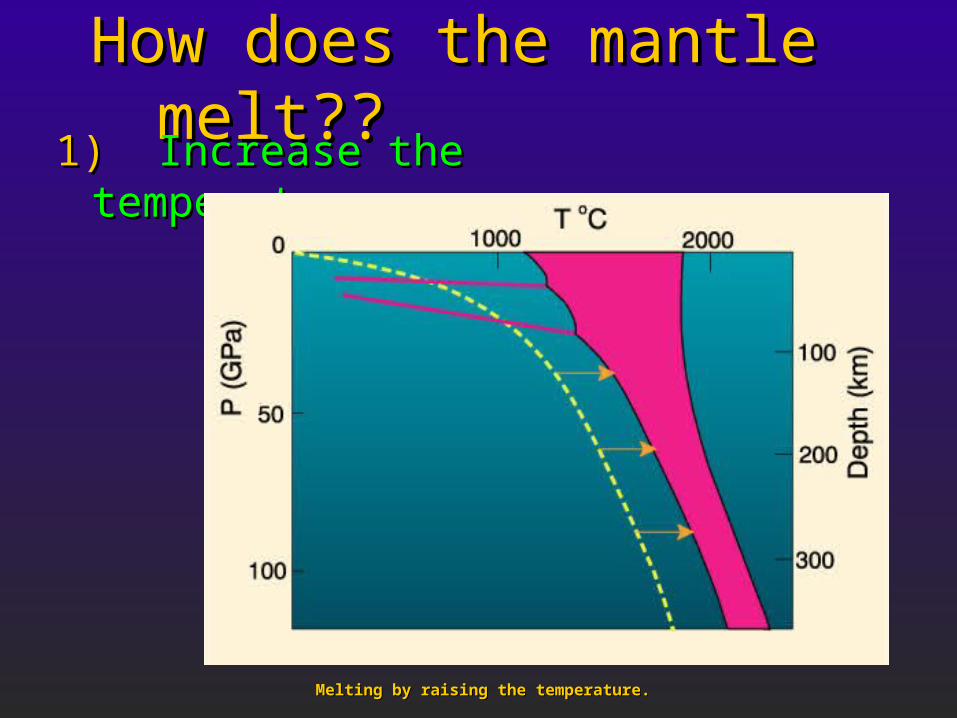
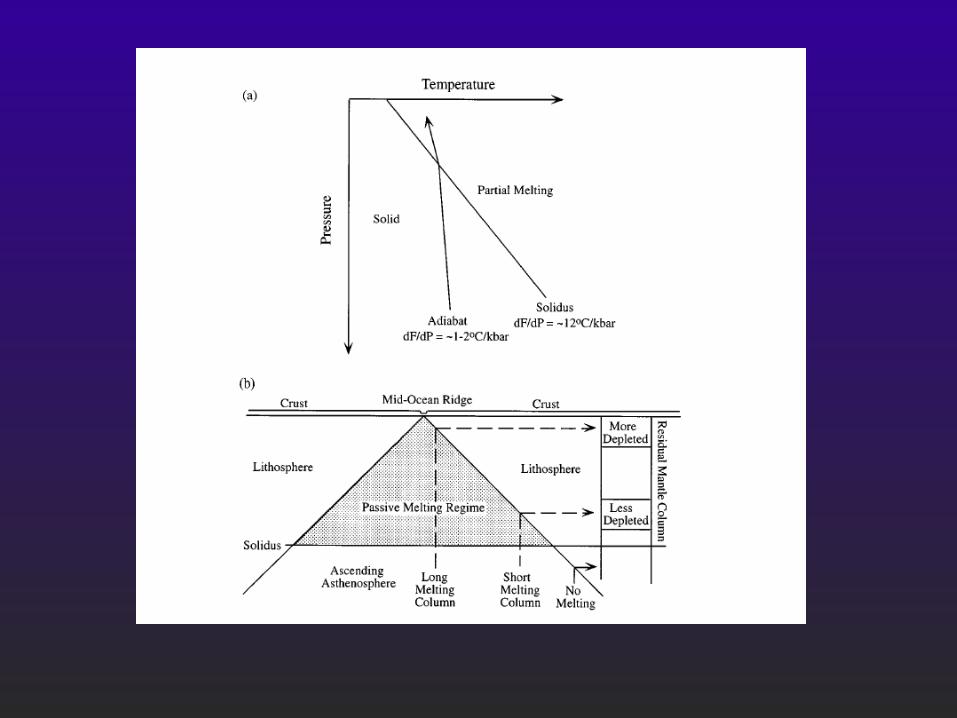
How does the mantle melt??How does the mantle melt??1) 1) Increase the temperatureIncrease the temperature
Melting by raising the temperature.Melting by raising the temperature.

2) 2) Lower the pressureLower the pressure AdiabaticAdiabatic rise of mantle with no conductive heat loss rise of mantle with no conductive heat loss Decompression meltingDecompression melting could melt at least 30% could melt at least 30%
Figure 10-4. Figure 10-4. Melting by (adiabatic) pressure reduction. Melting begins when the adiabat crosses the solidus and traverses the shaded melting interval. Dashed lines represent approximate % melting.

HW 7HW 7
Use pMELTS to determine if the sub SWUS Use pMELTS to determine if the sub SWUS upwelling mantle would melt along an adiabat that upwelling mantle would melt along an adiabat that contains the PT point of 1450contains the PT point of 145000C and 15 kbar. A C and 15 kbar. A typical composition of the SWUS mantle is given typical composition of the SWUS mantle is given via a San Carlos peridotite; calculate the fraction via a San Carlos peridotite; calculate the fraction of melt and phases in equilibrium with the liquid?of melt and phases in equilibrium with the liquid?
What is the composition and melt fraction at 10 What is the composition and melt fraction at 10 kbar (at the Moho), assume 1390C?kbar (at the Moho), assume 1390C?

3) 3) Add volatilesAdd volatiles (especially (especially HH22OO))
Dry peridotite solidus compared to several experiments on H2O-saturated peridotites.

Fraction melted is Fraction melted is limited by limited by availability of wateravailability of water
15% 20% 50% 100%15% 20% 50% 100%
From Burnham and Davis (1974). A J Sci., 274, 902-940.

Heating of Heating of amphibole-bearing peridotiteamphibole-bearing peridotite1) Ocean geotherm 1) Ocean geotherm
2) Shield geotherm2) Shield geotherm
Phase diagram (partly schematic) for a Phase diagram (partly schematic) for a hydrous mantle system, including the H2O-hydrous mantle system, including the H2O-saturated lherzolite solidus of Kushiro et saturated lherzolite solidus of Kushiro et al. (1968), the dehydration breakdown al. (1968), the dehydration breakdown curves for amphibole (Millhollen et al., curves for amphibole (Millhollen et al., 1974) and phlogopite (Modreski and 1974) and phlogopite (Modreski and Boettcher, 1973), plus the ocean and shield Boettcher, 1973), plus the ocean and shield geotherms of Clark and Ringwood (1964) geotherms of Clark and Ringwood (1964) and Ringwood (1966). and Ringwood (1966). After Wyllie (1979).After Wyllie (1979). In In H. S. Yoder (ed.), H. S. Yoder (ed.), The Evolution of the The Evolution of the Igneous Rocks. Fiftieth Anniversary Igneous Rocks. Fiftieth Anniversary Perspectives. Perspectives. Princeton University Press, Princeton University Press, Princeton, N. J, pp. 483-520.Princeton, N. J, pp. 483-520.

Melts Melts cancan be created under be created under realistic circumstancesrealistic circumstances
Plates separatePlates separate and mantle rises at mid- and mantle rises at mid-ocean ridgesocean ridges Adibatic rise Adibatic rise decompression melting decompression melting
Hot spotsHot spots localized plumes of melt localized plumes of melt Fluid fluxingFluid fluxing may give LVL may give LVL
Also important in Also important in subduction zonessubduction zones and and other settingsother settings

Generation of tholeiitic and Generation of tholeiitic and alkaline basalts from a alkaline basalts from a chemicallychemically uniform uniform mantle mantle
Variables (other than X)Variables (other than X) TemperatureTemperature PressurePressure
Phase diagram of aluminous lherzolite with melting Phase diagram of aluminous lherzolite with melting interval (gray), sub-solidus reactions, and geothermal interval (gray), sub-solidus reactions, and geothermal gradient. After gradient. After Wyllie, P. J. (1981). Geol. Rundsch. 70, Wyllie, P. J. (1981). Geol. Rundsch. 70, 128-153.128-153.
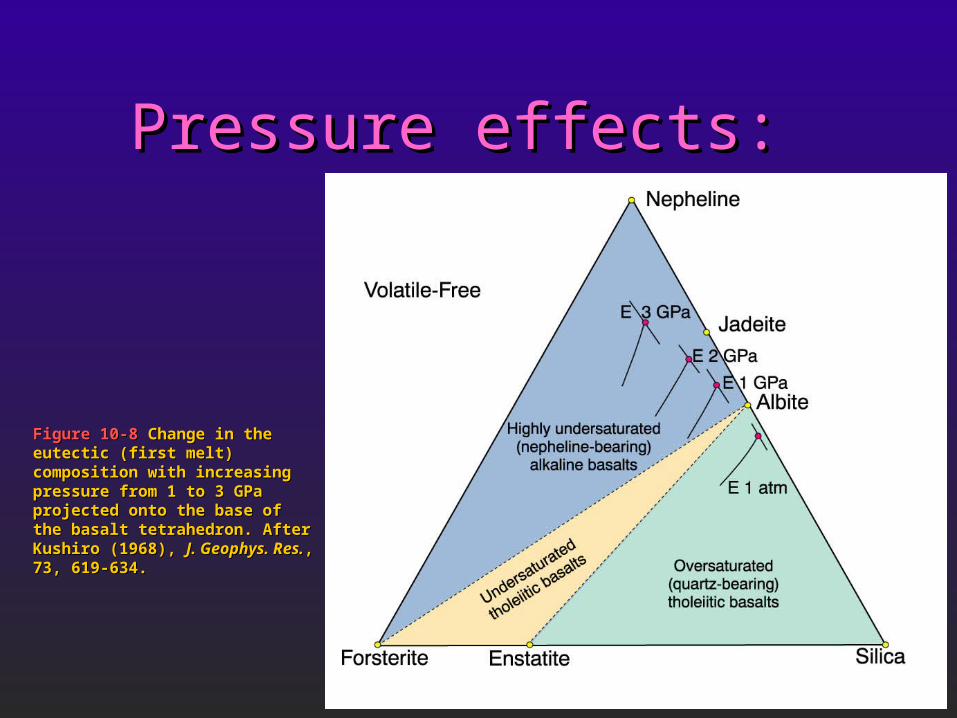
Pressure effects:Pressure effects:
Figure 10-8 Figure 10-8 Change in the eutectic Change in the eutectic (first melt) composition with (first melt) composition with increasing pressure from 1 to 3 GPa increasing pressure from 1 to 3 GPa projected onto the base of the basalt projected onto the base of the basalt tetrahedron. tetrahedron. After Kushiro (1968), After Kushiro (1968), J. J. Geophys. Res.Geophys. Res., 73, 619-634., 73, 619-634.
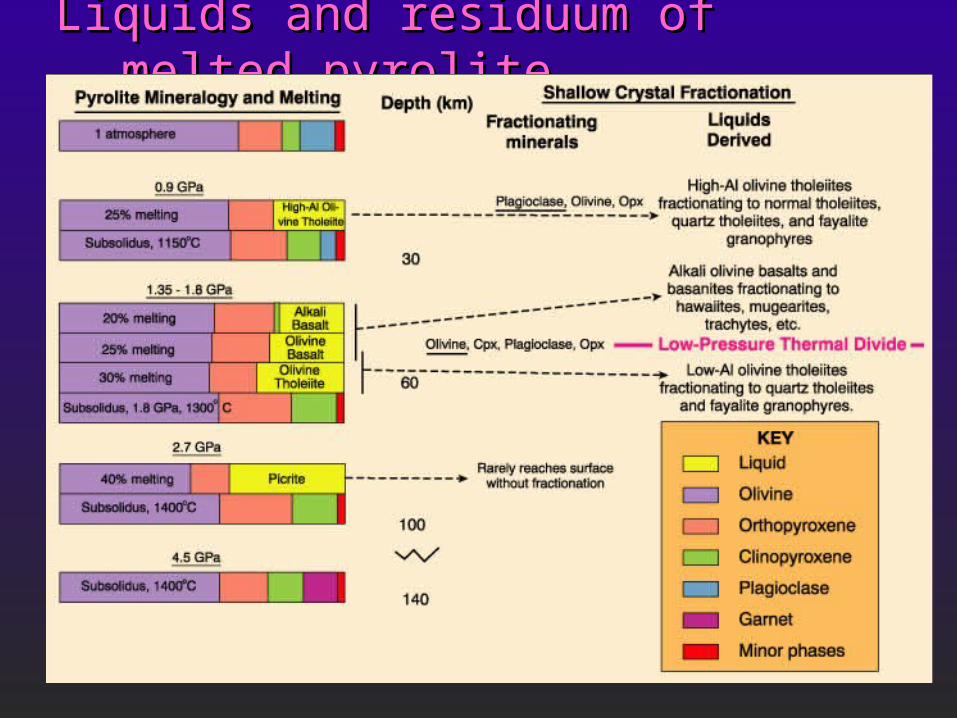
Liquids and residuum of melted pyroliteLiquids and residuum of melted pyrolite

Initial Conclusions:Initial Conclusions: Tholeiites favored by shallower meltingTholeiites favored by shallower melting
25% melting at 25% melting at <<30 km 30 km tholeiite tholeiite 25% melting at 60 km 25% melting at 60 km olivine basalt olivine basalt
Tholeiites favored by greater % partial meltingTholeiites favored by greater % partial melting 20 % melting at 60 km 20 % melting at 60 km alkaline basalt alkaline basalt
incompatibles (alkalis) incompatibles (alkalis) initial melts initial melts 30 % melting at 60 km 30 % melting at 60 km tholeiite tholeiite
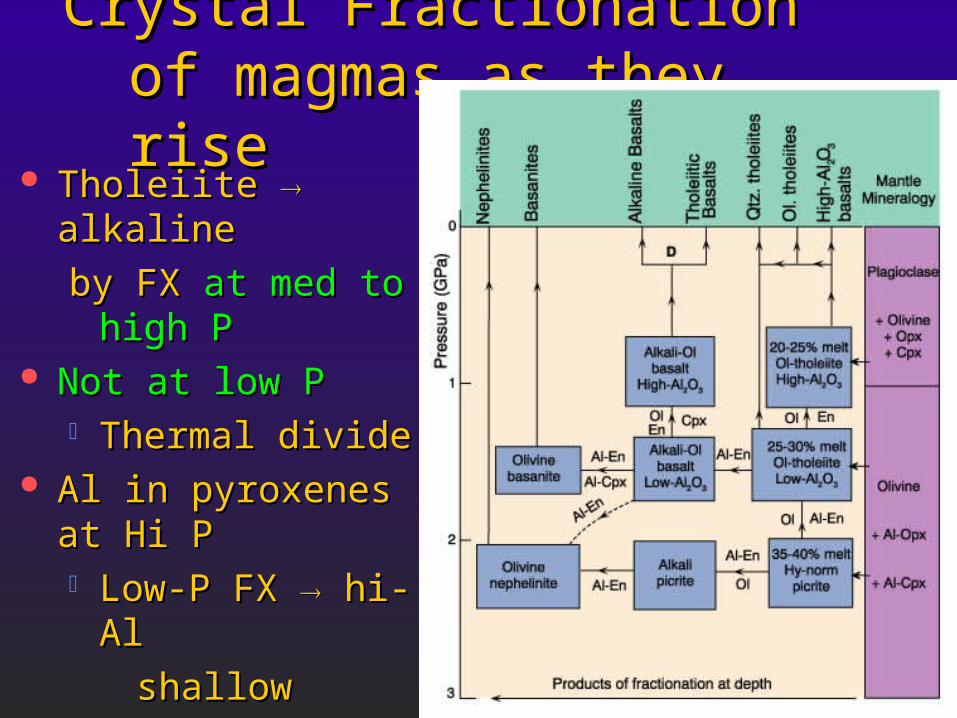
Crystal Fractionation of magmas Crystal Fractionation of magmas as they riseas they rise
Tholeiite Tholeiite alkaline alkaline
by FX by FX at med to high Pat med to high P Not at low PNot at low P
Thermal divideThermal divide Al in pyroxenes at Hi PAl in pyroxenes at Hi P
Low-P FX Low-P FX hi-Al hi-Al
shallow magmasshallow magmas
(“hi-Al” basalt)(“hi-Al” basalt)
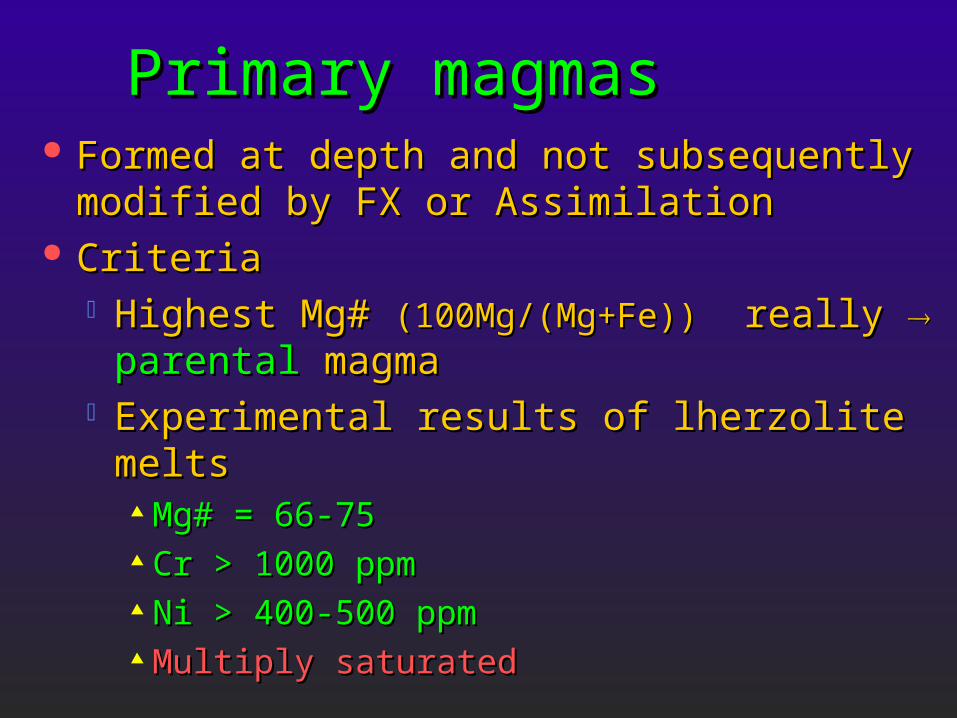
Primary magmasPrimary magmas Formed at depth and not subsequently modified Formed at depth and not subsequently modified
by FX or Assimilationby FX or Assimilation CriteriaCriteria
Highest Mg# Highest Mg# (100Mg/(Mg+Fe))(100Mg/(Mg+Fe)) really really parentalparental magmamagma
Experimental results of lherzolite meltsExperimental results of lherzolite melts Mg# = 66-75Mg# = 66-75 Cr > 1000 ppmCr > 1000 ppm Ni > 400-500 ppmNi > 400-500 ppm Multiply saturatedMultiply saturated

Multiple saturationMultiple saturation Low PLow P
Ol then Plag then Ol then Plag then Cpx as coolCpx as cool
~70~70ooC T rangeC T range
Figure 10-12 Figure 10-12 Anhydrous P-T phase relationships Anhydrous P-T phase relationships for a mid-ocean ridge basalt suspected of being a for a mid-ocean ridge basalt suspected of being a primary magma. primary magma. After Fujii and Kushiro (1977).After Fujii and Kushiro (1977). Carnegie Inst. Wash. Yearb.Carnegie Inst. Wash. Yearb., 76, 461-465., 76, 461-465.

Multiple saturationMultiple saturation Low PLow P
Ol then Plag then Cpx Ol then Plag then Cpx as coolas cool
7070ooC T rangeC T range High PHigh P
Cpx then Plag then OlCpx then Plag then Ol
Anhydrous P-T phase relationships for a mid-Anhydrous P-T phase relationships for a mid-ocean ridge basalt suspected of being a primary ocean ridge basalt suspected of being a primary magma. magma. After Fujii and Kushiro (1977).After Fujii and Kushiro (1977). Carnegie Carnegie Inst. Wash. Yearb.Inst. Wash. Yearb., 76, 461-465., 76, 461-465.
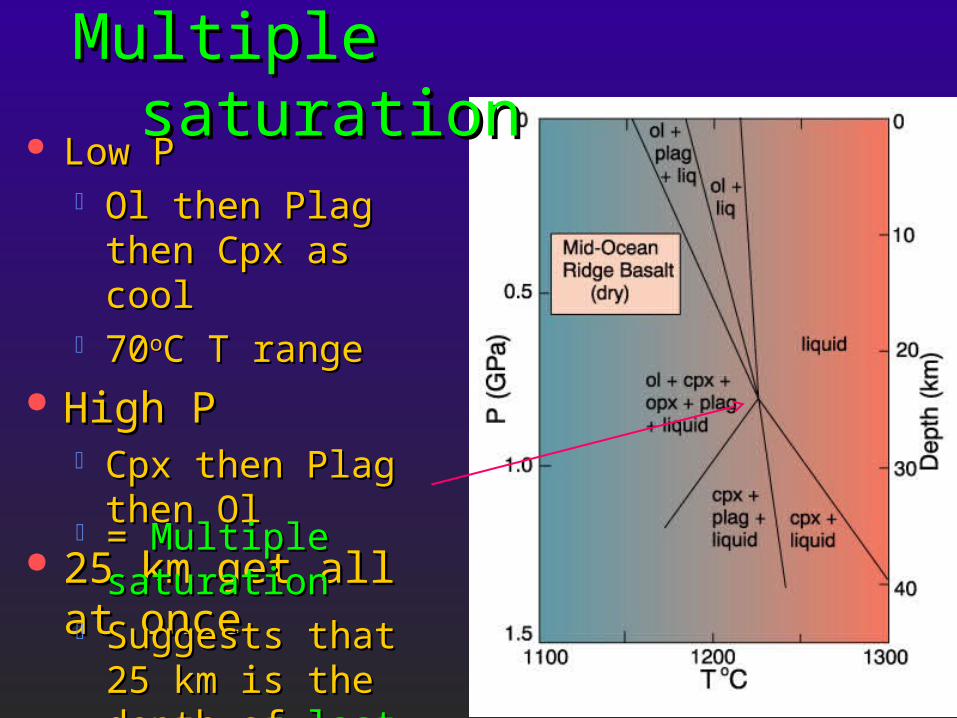
Multiple saturationMultiple saturation Low PLow P
Ol then Plag then Cpx Ol then Plag then Cpx as coolas cool
7070ooC T rangeC T range High PHigh P
Cpx then Plag then OlCpx then Plag then Ol 25 km get all at once25 km get all at once
= = Multiple saturationMultiple saturation Suggests that 25 km is Suggests that 25 km is
the depth of the depth of last eqlast eqmm withwith the mantle the mantle

SummarySummary A chemically homogeneous mantle can A chemically homogeneous mantle can
yield a variety of basalt typesyield a variety of basalt types Alkaline basalts are favored over tholeiites Alkaline basalts are favored over tholeiites
by deeper melting and by low % PMby deeper melting and by low % PM Fractionation at moderate to high depths can Fractionation at moderate to high depths can
also create alkaline basalts from tholeiitesalso create alkaline basalts from tholeiites At low P there is a thermal divide that At low P there is a thermal divide that
separates the two seriesseparates the two series

QuickTime™ and a decompressor
are needed to see this picture.

QuickTime™ and a decompressor
are needed to see this picture.

QuickTime™ and a decompressor
are needed to see this picture.
QuickTime™ and a decompressor
are needed to see this picture.
QuickTime™ and a decompressor
are needed to see this picture.
QuickTime™ and a decompressor
are needed to see this picture.

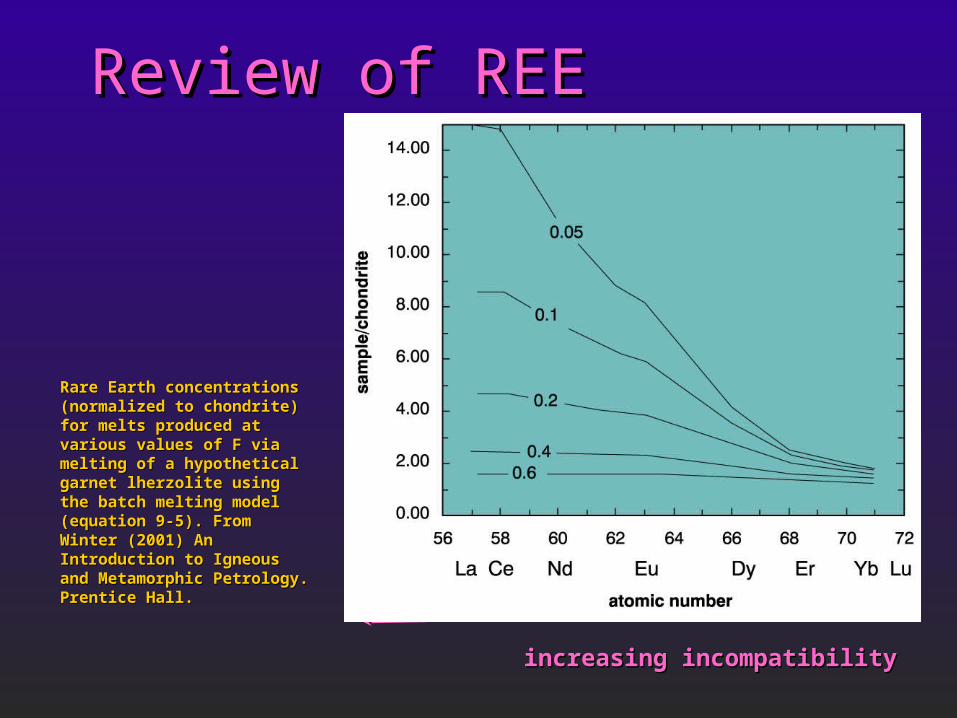
Review of REEReview of REE
0.000.00
2.002.00
4.004.00
6.006.00
8.008.00
10.0010.00
atomic numberatomic number
sam
ple/
chon
drite
sam
ple/
chon
drite
La Ce Nd Sm Eu Tb Er Yb LuLa Ce Nd Sm Eu Tb Er Yb Lu
increasing incompatibilityincreasing incompatibility
Review of REEReview of REE
increasing incompatibilityincreasing incompatibility
Rare Earth concentrations Rare Earth concentrations (normalized to chondrite) for (normalized to chondrite) for melts produced at various melts produced at various values of F via melting of a values of F via melting of a hypothetical garnet lherzolite hypothetical garnet lherzolite using the batch melting model using the batch melting model (equation 9-5). From Winter (equation 9-5). From Winter (2001) An Introduction to (2001) An Introduction to Igneous and Metamorphic Igneous and Metamorphic Petrology. Prentice Hall.Petrology. Prentice Hall.

REE data for oceanic basaltsREE data for oceanic basalts
REE diagram for a typical alkaline ocean island basalt (OIB) and tholeiitic mid-ocean REE diagram for a typical alkaline ocean island basalt (OIB) and tholeiitic mid-ocean ridge basalt (MORB). From Winter (2001) An Introduction to Igneous and Metamorphic ridge basalt (MORB). From Winter (2001) An Introduction to Igneous and Metamorphic Petrology. Prentice Hall. Petrology. Prentice Hall. Data from Sun and McDonough (1989).Data from Sun and McDonough (1989).
increasing incompatibilityincreasing incompatibility
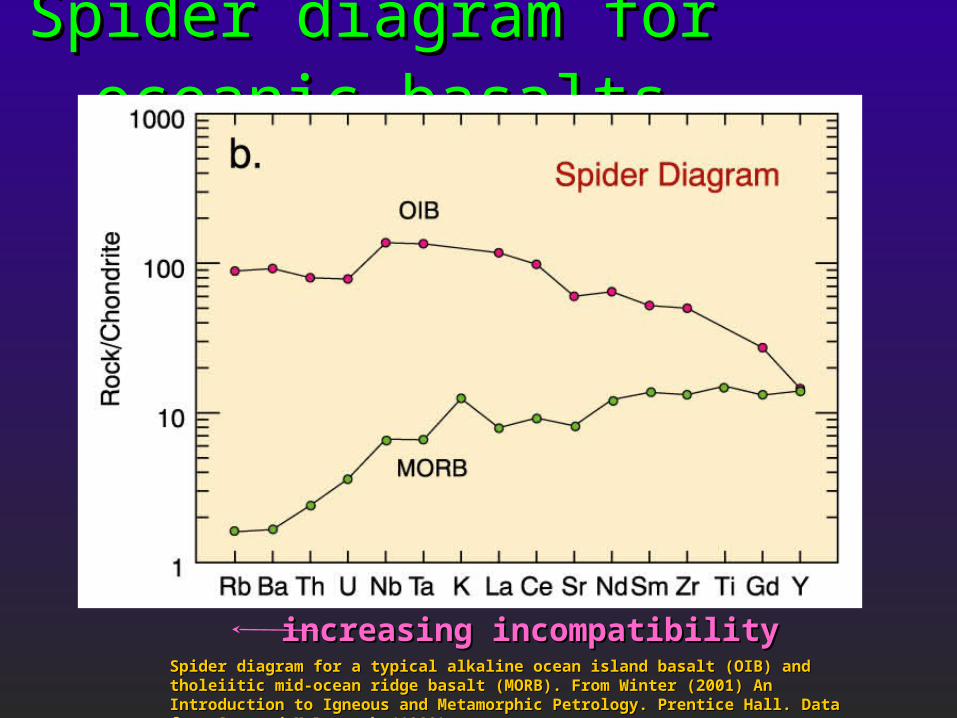
Spider diagram for oceanic basaltsSpider diagram for oceanic basalts
increasing incompatibilityincreasing incompatibilitySpider diagram for a typical alkaline ocean island basalt (OIB) and tholeiitic mid-ocean Spider diagram for a typical alkaline ocean island basalt (OIB) and tholeiitic mid-ocean ridge basalt (MORB). From Winter (2001) An Introduction to Igneous and Metamorphic ridge basalt (MORB). From Winter (2001) An Introduction to Igneous and Metamorphic Petrology. Prentice Hall. Petrology. Prentice Hall. Data from Sun and McDonough (1989).Data from Sun and McDonough (1989).

REE data REE data for UM for UM xenolithsxenoliths
Chondrite-normalized REE diagrams for spinel Chondrite-normalized REE diagrams for spinel (a) (a) and garnet and garnet (b)(b) lherzolites. lherzolites. After Basaltic After Basaltic Volcanism Study Project (1981).Volcanism Study Project (1981). Lunar and Lunar and Planetary Institute.Planetary Institute.
LREE enriched
LREE depleted
or unfractionated
LREE depletedor unfractionated
LREE enriched

Review of Sr isotopesReview of Sr isotopes 8787Rb Rb 8787Sr Sr = 1.42 x 10 = 1.42 x 10⁻¹¹-11 a a Rb (parent) conc. in enriched reservoir (incompatible)Rb (parent) conc. in enriched reservoir (incompatible) Enriched reservoirEnriched reservoir
After Wilson (1989). Igneous Petrogenesis. Unwin Hyman/Kluwer.After Wilson (1989). Igneous Petrogenesis. Unwin Hyman/Kluwer.
develops more87Sr over time
Depleted reservoirDepleted reservoir
(less Rb)develops less87Sr over time

Review of Nd isotopesReview of Nd isotopes 147147Sm Sm 143143Nd Nd = 6.54 x 10 = 6.54 x 10⁻¹³-13 a a Nd (daughter) Nd (daughter) enriched reservoir > Sm enriched reservoir > Sm Enriched res.Enriched res.
develops lessdevelops less143143Nd over timeNd over time
Depleted res.Depleted res.
(higher Sm/Nd)(higher Sm/Nd)develops higherdevelops higher143143Nd/Nd/144144NdNdover timeover time
Nd SmNd Sm
REE diagram
After Wilson (1989). Igneous Petrogenesis. Unwin Hyman/Kluwer.After Wilson (1989). Igneous Petrogenesis. Unwin Hyman/Kluwer.

mantle model IImantle model II Upper depleted mantle = MORB sourceUpper depleted mantle = MORB source Lower undepleted & enriched OIB sourceLower undepleted & enriched OIB source
After Basaltic Volcanism Study Project (1981).After Basaltic Volcanism Study Project (1981). Lunar and Planetary Institute. Lunar and Planetary Institute.

Mantle convection model IMantle convection model I
After Basaltic Volcanism Study Project (1981).After Basaltic Volcanism Study Project (1981). Lunar and Planetary Institute. Lunar and Planetary Institute.

Nd and Sr isotopes of Nd and Sr isotopes of Ocean BasaltsOcean Basalts““Mantle Array”Mantle Array”
Initial Initial 143143Nd/Nd/144144Nd vs. Nd vs. 8787Sr/Sr/8686Sr for oceanic basaltsSr for oceanic basalts. . From Wilson (1989). Igneous Petrogenesis. Unwin From Wilson (1989). Igneous Petrogenesis. Unwin Hyman/Kluwer. Data from Zindler Hyman/Kluwer. Data from Zindler et alet al. (1982) and Menzies (1983).. (1982) and Menzies (1983).

BSE
EMI
HIMU
PREMA
DMMa
DMMb
0.701 0.702 0.703 0.704 0.705 0.706 0.707 0.708 0.7090.5120
0.5125
0.5130
0.5135
143Nd/144Nd
87Sr/86Sr
Zindler-Hart

BSE
EMI
EMII
HIMU
PREMA
DMMa
DMMb
MORB
15 16 17 18 19 20 21 220.5120
0.5125
0.5130
0.5135
143Nd/144Nd
206Pb/204Pb
Zindler-Hart

BSE
EMI
HIMU
PREMA
DMMa
DMMb
EMII
15 16 17 18 19 20 21 2215.0
15.1
15.2
15.3
15.4
15.5
15.6
15.7
15.8
15.9
16.0
207Pb/204Pb
206Pb/204Pb
Zindler-Hart


OAHU
Pali


PaliKoolau CalderaKaauAlimanuSalt LakeMakalapaKahliNuuanu1.2.

Significance of theKoolau component
From Lassiter &Hauri, 1996

Eiler et al., 1996Lassiter and Hauri, 1998
Koolau component-recycled crust?

Sp lherzolite-dPlg-lherzolite-a,b,c,
c d
a b
2mm (a,b,c), 1mm (d)
Take a look at hand specimen too!


.
4 5 6 7
Olivine
Orthopyroxene
Clinopyroxene
Plagioclase
Mauna Kea
Koolau
Pali spinellherzolites
Pali plagioclaselherzolites
Mauna Loa
Delta 18O
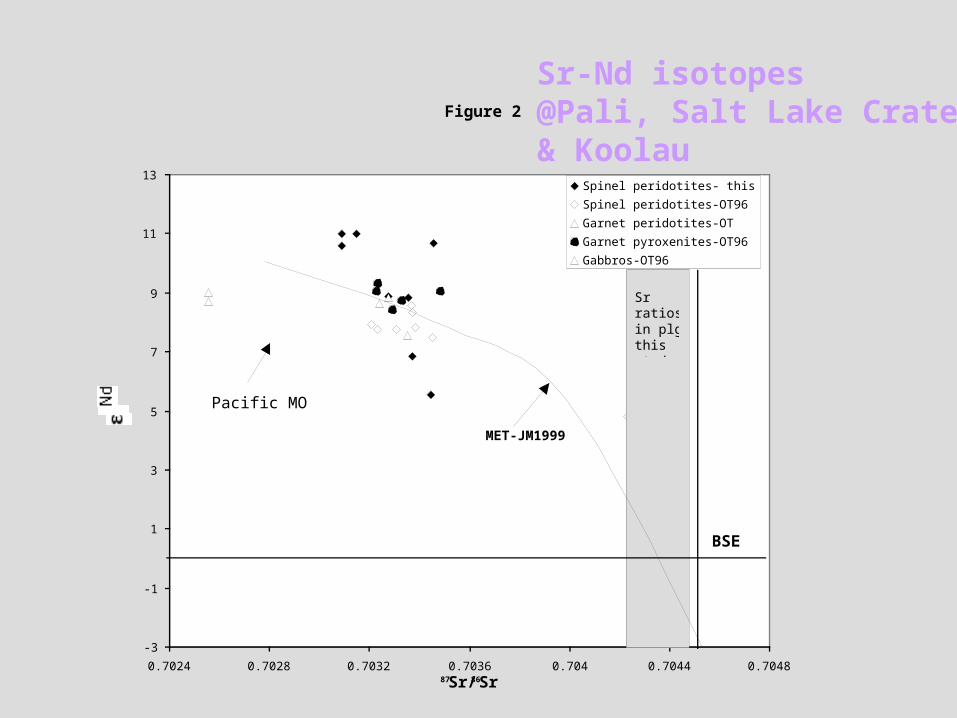
Sr-Nd isotopes@Pali, Salt Lake Crater& Koolau
Figure 2
-3
-1
1
3
5
7
9
11
13
0.7024 0.7028 0.7032 0.7036 0.704 0.7044 0.704887Sr/ 86Sr
Spinel peridotites- this study
Spinel peridotites-OT96
Garnet peridotites-OT
Garnet pyroxenites-OT96
Gabbros-OT96
BSE
Sr ratios in plg;this study
Pacific MORB
MET-JM1999

Nd and Sr isotopes of Nd and Sr isotopes of Kimberlite XenolithsKimberlite Xenoliths
Initial Initial 143143Nd/Nd/144144Nd vs. Nd vs. 8787Sr/Sr/8686Sr for mantle xenolithsSr for mantle xenoliths. . From Wilson (1989). Igneous Petrogenesis. Unwin From Wilson (1989). Igneous Petrogenesis. Unwin Hyman/Kluwer. Data from Zindler Hyman/Kluwer. Data from Zindler et alet al. (1982) and Menzies (1983).. (1982) and Menzies (1983).

Dm , bse, em1, em2, himu

Chemical dynamics- a word of Chemical dynamics- a word of cautioncaution
LAB should be defined based on rheology not LAB should be defined based on rheology not chemistry; T=1250 C is where olivine starts chemistry; T=1250 C is where olivine starts behaving ductily;behaving ductily;
Asthenosphere becomes lithosphere and viceversa Asthenosphere becomes lithosphere and viceversa - thus chemistry is not a good indicator;- thus chemistry is not a good indicator;
Small enriched domains in a chemically Small enriched domains in a chemically heterogenous mantle can supply most melts if F is heterogenous mantle can supply most melts if F is small. small.

QuickTime™ and a decompressor
are needed to see this picture.
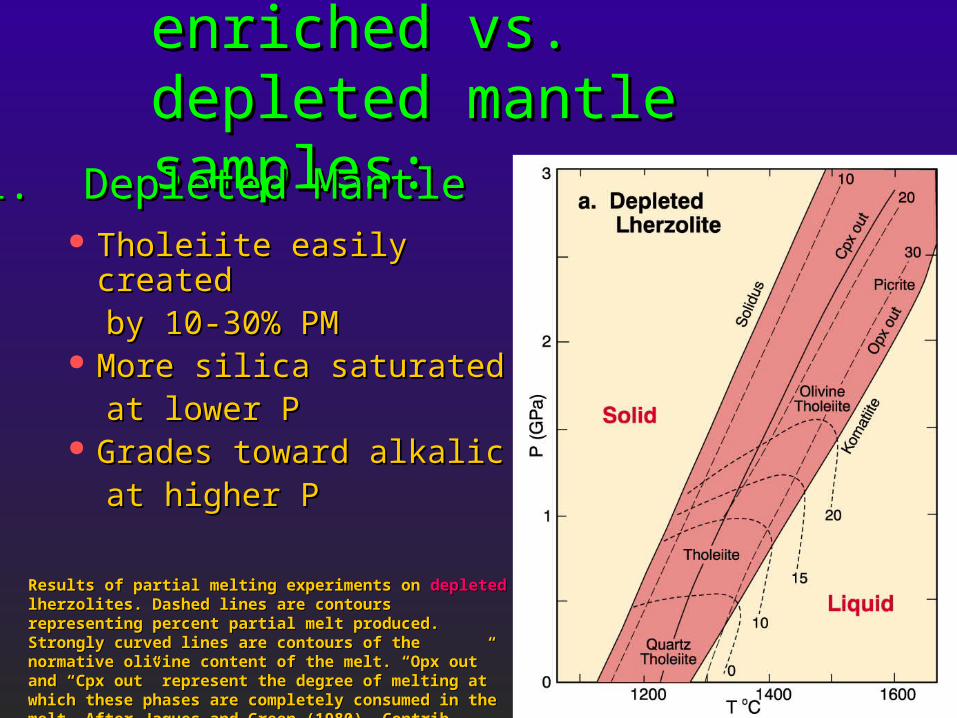
Experiments on melting enriched Experiments on melting enriched vs. depleted mantle samples:vs. depleted mantle samples:
Tholeiite easily createdTholeiite easily createdby 10-30% PMby 10-30% PM
More silica saturatedMore silica saturatedat lower Pat lower P
Grades toward alkalicGrades toward alkalicat higher Pat higher P
1. Depleted Mantle1. Depleted Mantle
Results of partial melting experiments on Results of partial melting experiments on depleteddepleted lherzolites. lherzolites. Dashed lines are contours representing percent partial melt Dashed lines are contours representing percent partial melt produced. Strongly curved lines are contours of the normative produced. Strongly curved lines are contours of the normative olivine content of the melt. “Opx out” and “Cpx out” represent olivine content of the melt. “Opx out” and “Cpx out” represent the degree of melting at which these phases are completely the degree of melting at which these phases are completely consumed in the melt. consumed in the melt. After Jaques and Green (1980).After Jaques and Green (1980). Contrib. Contrib. Mineral. Petrol., 73, 287-310.Mineral. Petrol., 73, 287-310.

Experiments on melting enriched Experiments on melting enriched vs. depleted mantle samples:vs. depleted mantle samples:
Tholeiites extend toTholeiites extend to
higher P than for DMhigher P than for DM Alkaline basalt fieldAlkaline basalt field
at higher P yetat higher P yet And lower % PMAnd lower % PM
2. Enriched Mantle2. Enriched Mantle
Results of partial melting experiments on Results of partial melting experiments on fertilefertile lherzolites. lherzolites. Dashed lines are contours representing percent partial melt Dashed lines are contours representing percent partial melt produced. Strongly curved lines are contours of the normative produced. Strongly curved lines are contours of the normative olivine content of the melt. “Opx out” and “Cpx out” represent olivine content of the melt. “Opx out” and “Cpx out” represent the degree of melting at which these phases are completely the degree of melting at which these phases are completely consumed in the melt. The shaded area represents the consumed in the melt. The shaded area represents the conditions required for the generation of alkaline basaltic conditions required for the generation of alkaline basaltic magmas. magmas. After Jaques and Green (1980).After Jaques and Green (1980). Contrib. Mineral. Contrib. Mineral. Petrol., 73, 287-310.Petrol., 73, 287-310.

Need to parametrize meltingNeed to parametrize melting
Will do this for dry melting only;Will do this for dry melting only; Aim to explain major elements;Aim to explain major elements; Assume adiabatic melting;Assume adiabatic melting; Need a melting function;Need a melting function; Need a start depth and an end depth;Need a start depth and an end depth; Assume that SiO2 does not change much;Assume that SiO2 does not change much; Use fractionall melting in increments of 1 kbarUse fractionall melting in increments of 1 kbar

ParametrizationParametrization
Melting is linear as a function of depth;Melting is linear as a function of depth; Source is only peridotite;Source is only peridotite; Shape of melting domain is triangular; no Shape of melting domain is triangular; no
extra wings to scavenge traces;extra wings to scavenge traces; Based on McKenzie and Bickle (1988); Based on McKenzie and Bickle (1988);
Langmuir et al. (1992) and Wang et al. Langmuir et al. (1992) and Wang et al. (2002). (2002).

QuickTime™ and a decompressor
are needed to see this picture.

QuickTime™ and a decompressor
are needed to see this picture.


AssumptionsAssumptions
Ti is used as a perfectly incompatible Ti is used as a perfectly incompatible element;element;
Fe and Na will constrain the depth where Fe and Na will constrain the depth where melting starts and the length of melting melting starts and the length of melting column respectively;column respectively;
Thickness of melt column is also calculated Thickness of melt column is also calculated (e.g. for MORB it should be 6 km);(e.g. for MORB it should be 6 km);
K influence the calculation - I forget why.K influence the calculation - I forget why.

Comparing against dataComparing against data Plot the major elements of your set against MgO Plot the major elements of your set against MgO
(Harker type diagrams);(Harker type diagrams); Find the FeO, NaFind the FeO, Na22O, TiOO, TiO22 and K and K22O corresponding O corresponding
to the most primitive composition;to the most primitive composition; Those are the values to compare against the Those are the values to compare against the
forward model;forward model; Works for any adiabatic melting assuming that Works for any adiabatic melting assuming that
only peridotite is the source. You can mess with only peridotite is the source. You can mess with fertility (% cpx source), amount of MgO, Na2O, fertility (% cpx source), amount of MgO, Na2O, K2O, FeO in source.K2O, FeO in source.

Na2O=2.8FeO=9

.00
1.00
2.00
3.00
4.00
5.00
6.00
6.00 7.00 8.00 9.00 10.00 11.00 12.00
FeO (wt%)
Na2O (wt%)
Series1


Best matchBest match
Start at 23 kbarStart at 23 kbar Stop at 15 kbarStop at 15 kbar 8 kbar column of melt, stops exactly at crust 8 kbar column of melt, stops exactly at crust
-mantle boundary (about 50 km under the -mantle boundary (about 50 km under the Puna);Puna);
Predicts 2.5 km of basalt accumulated in the Predicts 2.5 km of basalt accumulated in the crust; average melting 7%;crust; average melting 7%;
Is this any good?Is this any good?

Hits solidus at around 1450 C

Other constraintsOther constraints
Use ol-glass thermometer for magma temp;Use ol-glass thermometer for magma temp; Get xenoliths to find out how Get xenoliths to find out how
depleted/fertile a peridotite from under the depleted/fertile a peridotite from under the Puna is;Puna is;
Crustal and lithospheric thickness Crustal and lithospheric thickness constraints from seismo people;constraints from seismo people;

HW8HW8
Use Blondes et al major element data for Use Blondes et al major element data for the Papoose flows only to determine the the Papoose flows only to determine the FeO and Na2O corresponding to the most FeO and Na2O corresponding to the most primitive MgO;primitive MgO;
Use LPK model to determine the melt Use LPK model to determine the melt starting pressure, ending pressure, melt starting pressure, ending pressure, melt thickness and average Fthickness and average F