Embed Size (px)
Citation preview
Drum Rock Early Childhood Center
SurveyWorks! 2013-2014 School Level ReportTable of Contents
Introduction
Section 1: Student Survey
Section 2: Parent Survey
Section 3: Teacher/Staff Survey
Drum Rock Early Childhood Center 1
-Teaching and Student Achievement,-Families and Communities,-Safe and Supportive Schools, and-Funding and Resources.
Participation Rates
Navigating the Report
Data
have navigation buttons that allow the reader to see how a different survey population responded to a similar topic. For example, the page displaying students’ responses to questions about teacher practices contains a navigation button that jumps to teachers’ responses about teacher practices.
Data files are available upon request. Please contact [email protected] for more information. Survey results and related education data can be found on the RIDE InfoWorks website, http://infoworks.ride.ri.gov.
Introduction to the 2013-2014 SurveyWorks School Report
This report presents results from the 2013-2014 SurveyWorks Student, Parent, and Teacher/Staff Surveys for this school. The surveys gather input from students, parents, and teachers and other instructional staff on elements of Rhode Island's Basic Education Program (BEP) including:
Survey results are reported for each of these categories. These data are intended to be used to inform decisions at all levels-including the classroom, school, district, and state. The report is organized into three sections by survey population. Section 1 reports the findings from the Student Survey. Section 2 reports the findings from the Parent Survey. Section 3 reports the findings from the Teacher/Staff Survey. The findings are reported in tables showing the total number and percentage of individuals answering each item by school (or by district) and at the state level. The survey allowed individuals to skip over questions that did not apply to them or that they did not wish to answer. Therefore, the number of responses to any one question may vary. In order to protect individuals’ rights to confidentiality, data for items with fewer than ten responses are not reported. In these cases, a dash (-) indicates that there are insufficient responses to report.
Results from the 2013-2014 SurveyWorks School Administrator Survey are provided in separate reports by LEA and/or LEA-type.
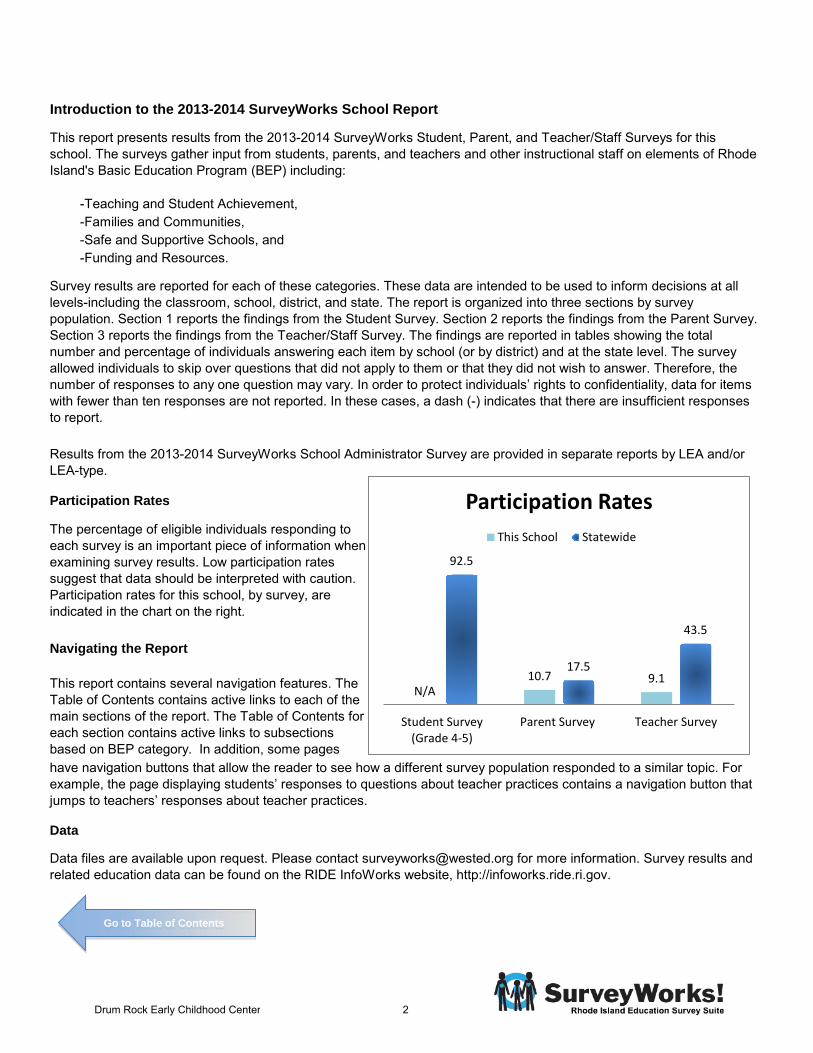
The percentage of eligible individuals responding to each survey is an important piece of information when examining survey results. Low participation rates suggest that data should be interpreted with caution. Participation rates for this school, by survey, are indicated in the chart on the right.
This report contains several navigation features. The Table of Contents contains active links to each of the main sections of the report. The Table of Contents for each section contains active links to subsections based on BEP category. In addition, some pages
N/A 10.7 9.1
92.5
17.5
43.5
Student Survey (Grade 4-5)
Parent Survey Teacher Survey
Participation Rates This School Statewide
Go to Table of Contents
Drum Rock Early Childhood Center 2
Introduction…………………………………………………………………………………………… 4Demographics………………………………………………………………………………………… 5Teaching and Student Achievement…………………………………………………………….… 6 Teacher Practice……………………………………………………………………………… 6 Homework……………………………………………………………………………………… 7 Student Engagement………………………………………………………………………… 7 College/Career Readiness…………………………………………………………………… 7Safe and Supportive Schools………………………………………………………………………… 8 Breakfast………………………………………………………………………………………… 8 Physical Activity………………………………………………………………………………… 8 Asthma………………………………………………………………………………………… 8 Time Home Alone……………………………………………………………………………… 9 Technology Use for Entertainment…………………………………………………………… 9 School Safety…………………………………………………………………………………… 9 Theft……………………………………………………………………………………………… 10 Discipline and Equity…………………………………………………………………………… 10 Bullying………………………………………………………………………………………… 11 Teacher-Student Relationships……………………………………………………………… 12 Teacher-Student Respect…………………………………………………………………… 12 Personal Relationships………………………………………………………………………… 12 Student Violence……………………………………………………………………………… 13 Alcohol…………………………………………………………………………………………… 13 Smoking………………………………………………………………………………………… 13 Drug Usage…………………………………………………………………………………… 14 Drugs at School………………………………………………………………………………… 14Families and Communities…………………………………………………………………………… 15 Parent Engagement…………………………………………………………………………… 15 Parent Engagement in Post High School Plans…………………………………………… 15 Out of School Time…………………………………………………………………………… 15Funding and Resources……………………………………………………………………………… 16 School Facilities………………………………………………………………………………… 16 School Resources……………………………………………………………………………… 16
Section 1: Student Survey
Go to Table of Contents
Drum Rock Early Childhood Center 3
Section 1: Student Survey Introduction
In November 2013, public school students in grades 4-12 were invited to participate in the SurveyWorks Student Survey. Different versions of the Student Survey were used at the elementary (grades 4-5), middle (grades 6-8), and high school (grades 9-12) levels with age appropriate language and content for each group. This section of the report presents the elementary school Student Survey results for this school. Please note that some schools serve students in more than one of these grade spans. These schools have more than one report.
The Student Survey was administered online in Rhode Island public schools from November 12, 2013 through December 20, 2013. To prevent unauthorized access to the survey or multiple entries, students used a randomly generated 7-digit access code distributed by the SurveyWorks Site Coordinator. To guarantee anonymity, students’ personal information was not associated with access codes.
This section of the report presents the students’ responses. Data are provided for this school as well as for all students in comparable grades in Rhode Island public schools. Responses are reported as the percentage of students who responded to each item and the total number of students answering each item by school and across the state. In order to ensure anonymity, data for items with fewer than ten responses are not reported. In these cases, a dash (-) indicates that there are insufficient responses to report. In some cases, a school did not participate in the Student Survey. In these instances, an exclamation mark (!) is used in the report tables to indicate that a school did not participate and only state level data are reported.
As noted in the introduction to the report, this school’s Student Survey participation rate is N/A. The participation rate is calculated as the number of students who responded to the survey as a percentage of the school's average daily membership as of December 1, 2013, minus the number of students whose parents opted them out of survey participation. The participation rates for schools that were not eligible or exempt is reported as "N/A".
Go to Table of Contents
Drum Rock Early Childhood Center 4
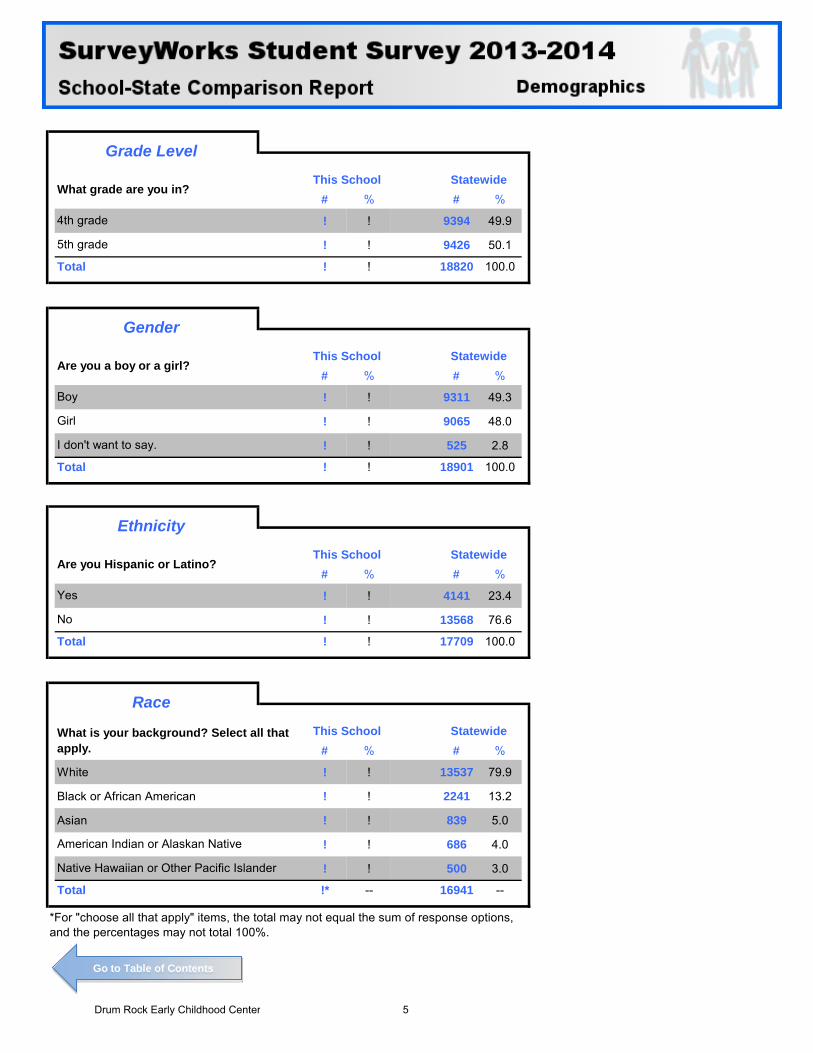
# % # %
! ! 9394 49.9
! ! 9426 50.1
Total ! ! 18820 100.0
# % # %
! ! 9311 49.3
! ! 9065 48.0
! ! 525 2.8
Total ! ! 18901 100.0
# % # %
! ! 4141 23.4
! ! 13568 76.6
Total ! ! 17709 100.0
# % # %
White ! ! 13537 79.9
Black or African American ! ! 2241 13.2
Asian ! ! 839 5.0
! ! 686 4.0
! ! 500 3.0
Total !* -- 16941 --
5th grade
Grade Level
What grade are you in?This School Statewide
4th grade
Yes
Gender
Are you a boy or a girl?This School Statewide
Boy
Girl
I don't want to say.
Ethnicity
Are you Hispanic or Latino?This School Statewide
Native Hawaiian or Other Pacific Islander
*For "choose all that apply" items, the total may not equal the sum of response options, and the percentages may not total 100%.
No
Race
What is your background? Select all that apply.
This School Statewide
American Indian or Alaskan Native
Go to Table of Contents
Drum Rock Early Childhood Center 5
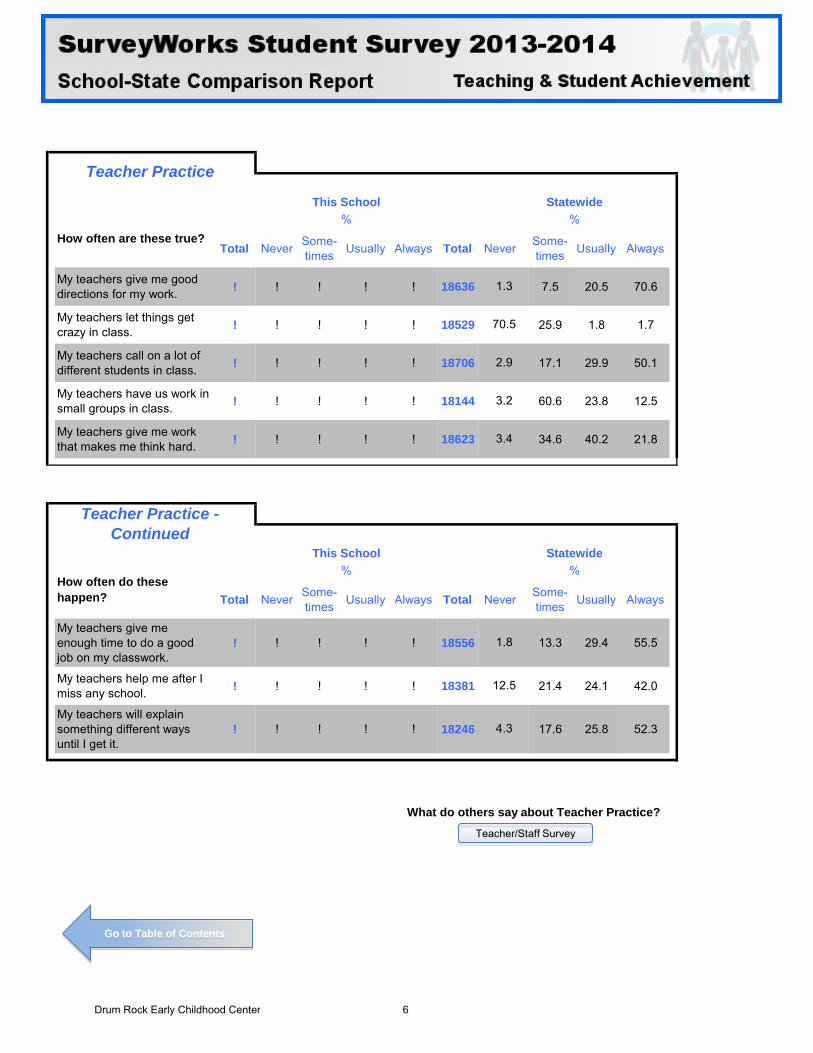
Total Never Some-times Usually Always Total Never Some-
times Usually Always
My teachers give me good directions for my work. ! ! ! ! ! 18636 7.5 20.5 70.6
My teachers let things get crazy in class. ! ! ! ! ! 18529 25.9 1.8 1.7
My teachers call on a lot of different students in class. ! ! ! ! ! 18706 17.1 29.9 50.1
My teachers have us work in small groups in class. ! ! ! ! ! 18144 60.6 23.8 12.5
My teachers give me work that makes me think hard. ! ! ! ! ! 18623 34.6 40.2 21.8
Total Never Some-times Usually Always Total Never Some-
times Usually Always
My teachers give me enough time to do a good job on my classwork.
! ! ! ! ! 18556 13.3 29.4 55.5
My teachers help me after I miss any school. ! ! ! ! ! 18381 21.4 24.1 42.0
My teachers will explain something different ways until I get it.
! ! ! ! ! 18246 17.6 25.8 52.3
70.5
1.3
4.3
2.9
3.2
3.4
1.8
12.5
What do others say about Teacher Practice?
Teacher Practice
This School Statewide
How often are these true?% %
Teacher Practice - Continued
This School Statewide
How often do these happen?
% %
Teacher/Staff Survey
Go to Table of Contents
Drum Rock Early Childhood Center 6
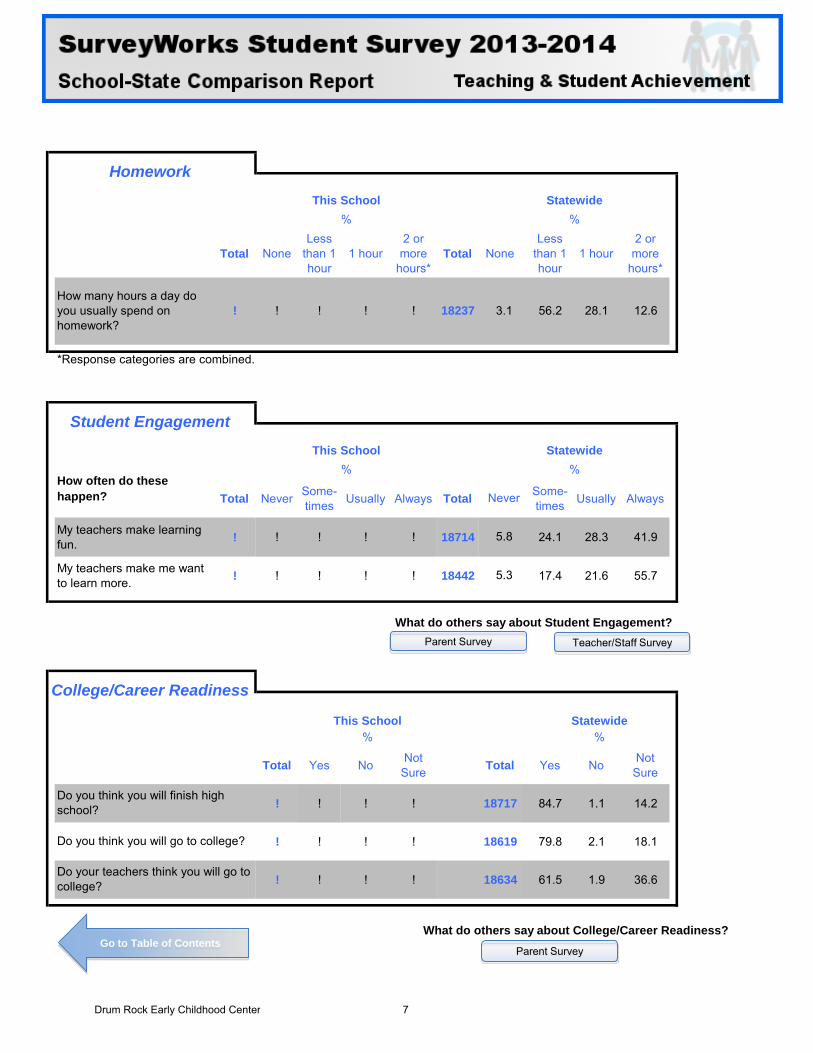
Total NoneLess
than 1 hour
1 hour2 or
more hours*
Total NoneLess
than 1 hour
1 hour2 or
more hours*
*Response categories are combined.
Total Never Some-times Usually Always Total Some-
times Usually Always
My teachers make learning fun. ! ! ! ! ! 18714 24.1 28.3 41.9
My teachers make me want to learn more. ! ! ! ! ! 18442 17.4 21.6 55.7
Total Yes No Not Sure Total Yes No Not
Sure
! ! ! ! 18717 84.7 1.1 14.2
! ! ! ! 18619 79.8 2.1 18.1
! ! ! ! 18634 61.5 1.9 36.6
3.1
Never
5.8
5.3
% %Statewide
How often do these happen?
HomeworkThis School Statewide
% %
College/Career Readiness
This School
What do others say about Student Engagement?
Student Engagement
How many hours a day do you usually spend on homework?
! ! ! ! ! 18237 56.2 28.1 12.6
This School
Statewide% %
What do others say about College/Career Readiness?
Do you think you will finish high school?
Do you think you will go to college?
Do your teachers think you will go to college?
Teacher/Staff Survey Parent Survey
Parent Survey Go to Table of Contents
Drum Rock Early Childhood Center 7
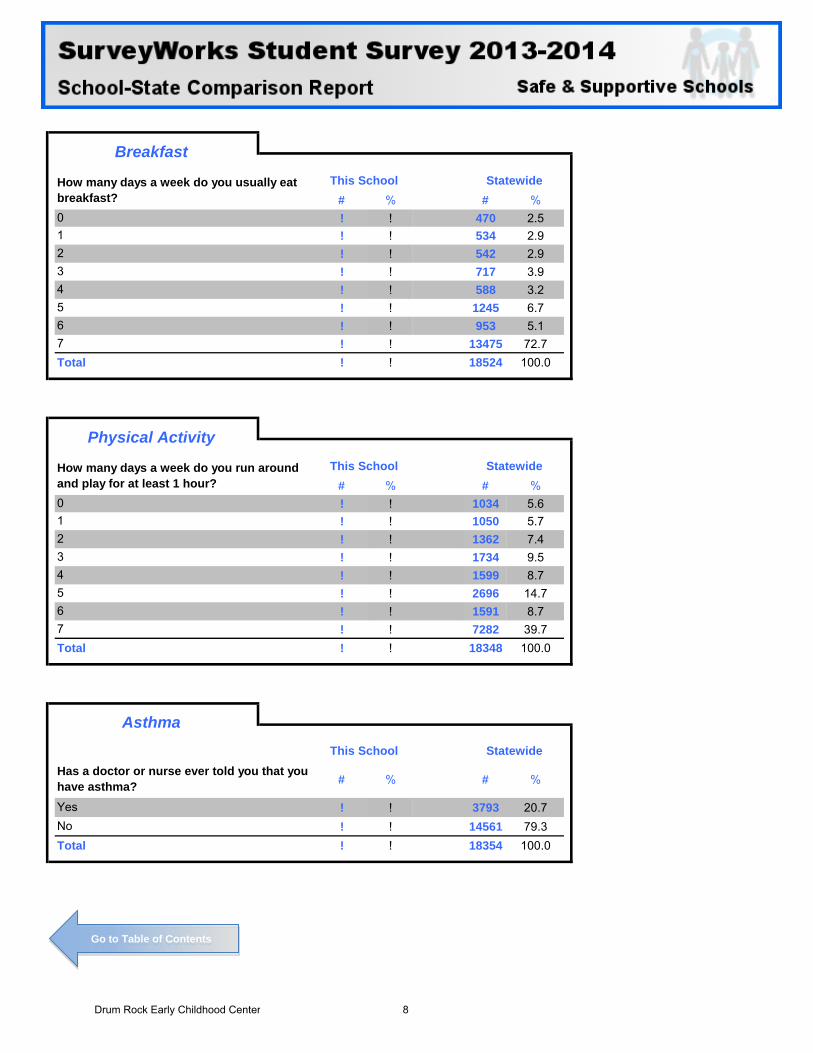
# % # %! ! 470 2.5! ! 534 2.9! ! 542 2.9! ! 717 3.9! ! 588 3.2! ! 1245 6.7! ! 953 5.1! ! 13475 72.7
Total ! ! 18524 100.0
# % # %! ! 1034 5.6! ! 1050 5.7! ! 1362 7.4! ! 1734 9.5! ! 1599 8.7! ! 2696 14.7! ! 1591 8.7! ! 7282 39.7
Total ! ! 18348 100.0
# % # %
! ! 3793 20.7! ! 14561 79.3
Total ! ! 18354 100.0
AsthmaThis School Statewide
Has a doctor or nurse ever told you that you have asthma?YesNo
234567
Physical Activity
How many days a week do you run around and play for at least 1 hour?
This School
Breakfast
How many days a week do you usually eat breakfast?
This School Statewide
01
Statewide
01
234567
Go to Table of Contents
Drum Rock Early Childhood Center 8
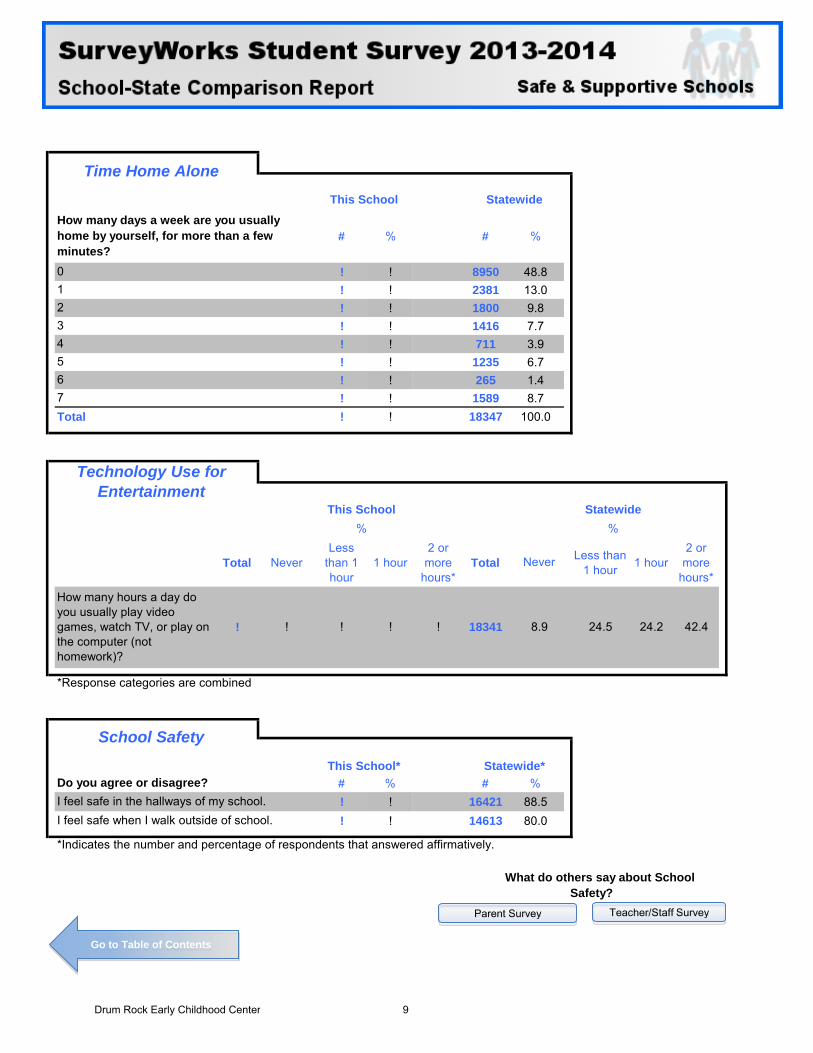
# % # %
! ! 8950 48.8! ! 2381 13.0! ! 1800 9.8! ! 1416 7.7! ! 711 3.9! ! 1235 6.7! ! 265 1.4! ! 1589 8.7
Total ! ! 18347 100.0
Total NeverLess
than 1 hour
1 hour2 or
more hours*
Total Less than 1 hour 1 hour
2 or more
hours*
*Response categories are combined
# % # %! ! 16421 88.5! ! 14613 80.0
*Indicates the number and percentage of respondents that answered affirmatively.
This School* Statewide*Do you agree or disagree?I feel safe in the hallways of my school.I feel safe when I walk outside of school.
What do others say about School Safety?
18341 8.9 24.5 24.2 42.4
School Safety
How many hours a day do you usually play video games, watch TV, or play on the computer (not homework)?
! ! ! ! !
Technology Use for Entertainment
This School Statewide% %
Never
234567
Time Home AloneThis School Statewide
How many days a week are you usually home by yourself, for more than a few minutes?01
Parent Survey Teacher/Staff Survey
Go to Table of Contents
Drum Rock Early Childhood Center 9
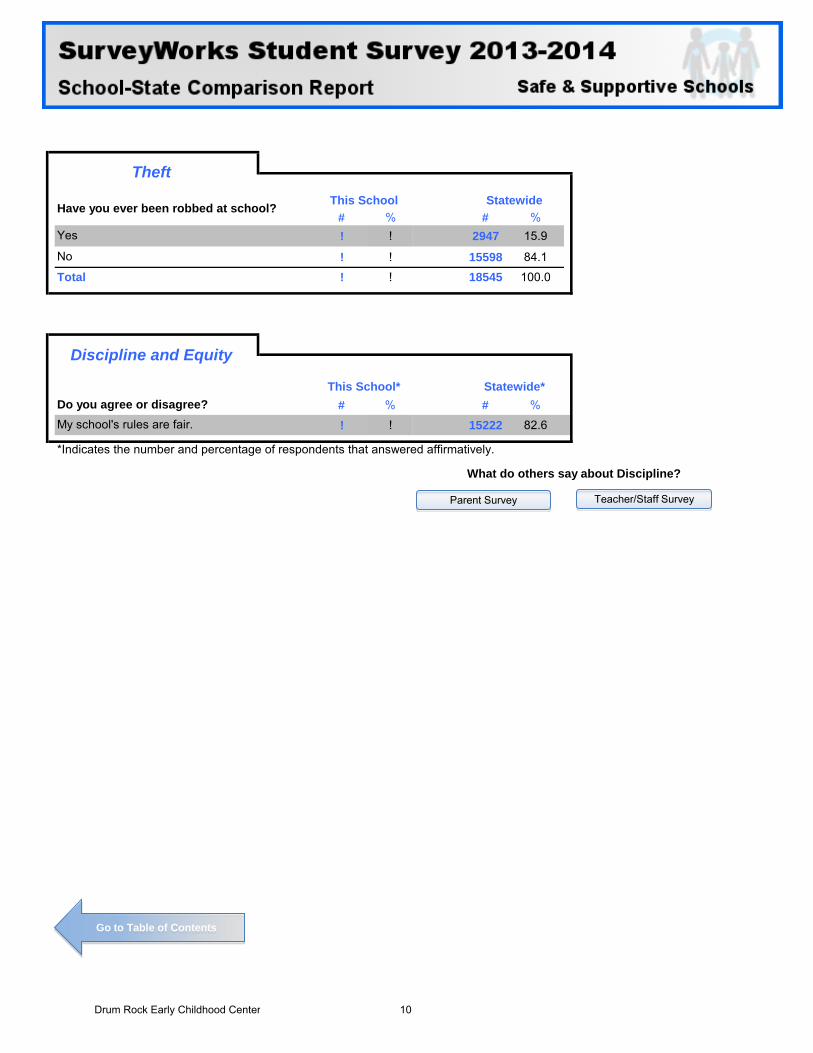
# % # %! ! 2947 15.9
! ! 15598 84.1
Total ! ! 18545 100.0
# % # %
! ! 15222 82.6
*Indicates the number and percentage of respondents that answered affirmatively.
Discipline and Equity
This School* Statewide*Do you agree or disagree?My school's rules are fair.
What do others say about Discipline?
Theft
Have you ever been robbed at school? This School Statewide
Yes
No
Parent Survey Teacher/Staff Survey
Go to Table of Contents
Drum Rock Early Childhood Center 10
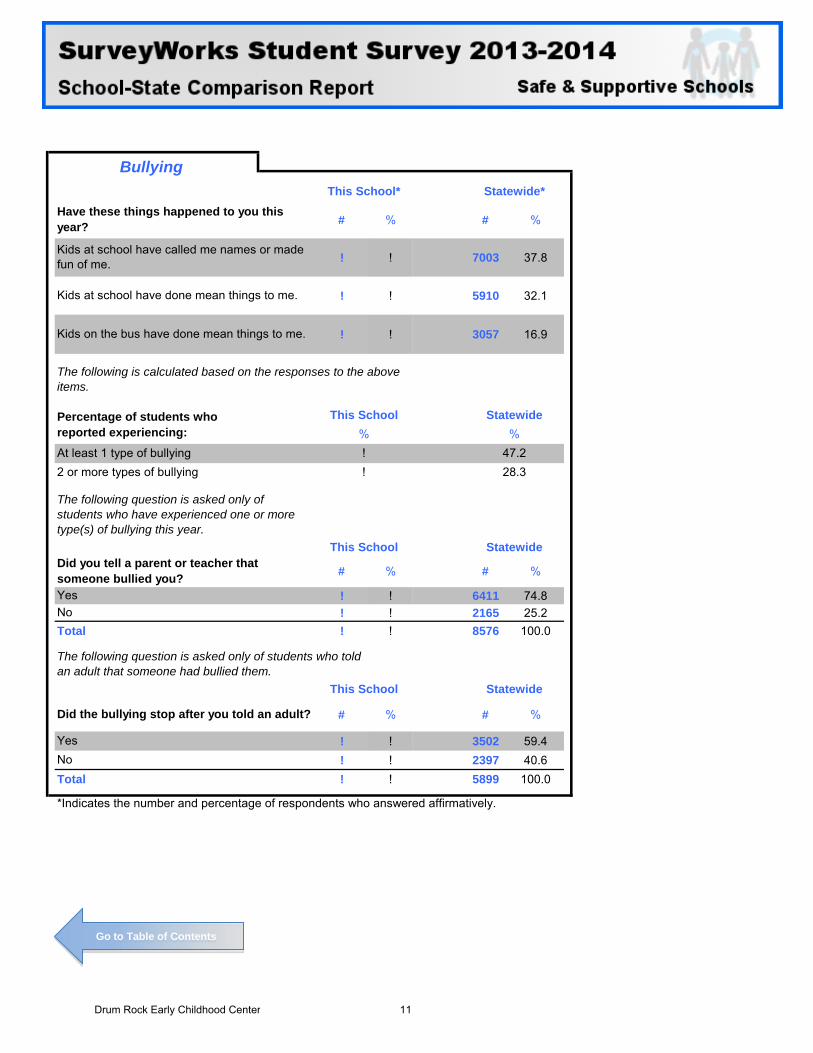
# % # %
! ! 7003 37.8
! ! 5910 32.1
! ! 3057 16.9
# % # %
! ! 6411 74.8! ! 2165 25.2
Total ! ! 8576 100.0
# % # %
! ! 3502 59.4! ! 2397 40.6
Total ! ! 5899 100.0
*Indicates the number and percentage of respondents who answered affirmatively.
The following question is asked only of students who told an adult that someone had bullied them.
This School Statewide
Did the bullying stop after you told an adult?
YesNo
The following question is asked only of students who have experienced one or more type(s) of bullying this year.
This School StatewideDid you tell a parent or teacher that someone bullied you?YesNo
At least 1 type of bullying ! 47.22 or more types of bullying ! 28.3
Kids on the bus have done mean things to me.
The following is calculated based on the responses to the above items.
Percentage of students who reported experiencing:
This School Statewide% %
BullyingThis School* Statewide*
Have these things happened to you this year?
Kids at school have called me names or made fun of me.
Kids at school have done mean things to me.
Go to Table of Contents
Drum Rock Early Childhood Center 11
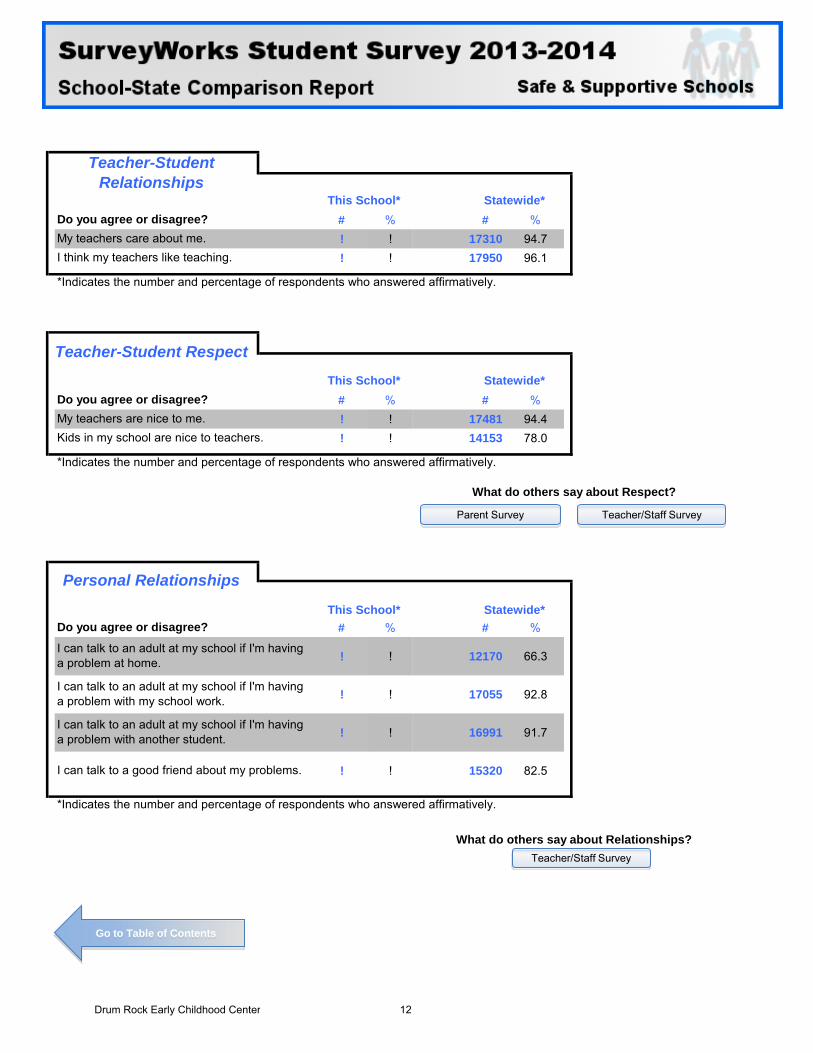
# % # %! ! 17310 94.7! ! 17950 96.1
*Indicates the number and percentage of respondents who answered affirmatively.
# % # %! ! 17481 94.4! ! 14153 78.0
*Indicates the number and percentage of respondents who answered affirmatively.
# % # %
! ! 12170 66.3
! ! 17055 92.8
! ! 16991 91.7
! ! 15320 82.5
*Indicates the number and percentage of respondents who answered affirmatively.
I can talk to an adult at my school if I'm having a problem with my school work.
I can talk to an adult at my school if I'm having a problem with another student.
I can talk to a good friend about my problems.
What do others say about Relationships?
What do others say about Respect?
Personal Relationships
This School* Statewide*Do you agree or disagree?
I can talk to an adult at my school if I'm having a problem at home.
Teacher-Student RespectThis School* Statewide*
Do you agree or disagree?My teachers are nice to me.Kids in my school are nice to teachers.
Teacher-Student Relationships
This School* Statewide*Do you agree or disagree?My teachers care about me.I think my teachers like teaching.
Parent Survey Teacher/Staff Survey
Teacher/Staff Survey
Go to Table of Contents
Drum Rock Early Childhood Center 12
# % # %
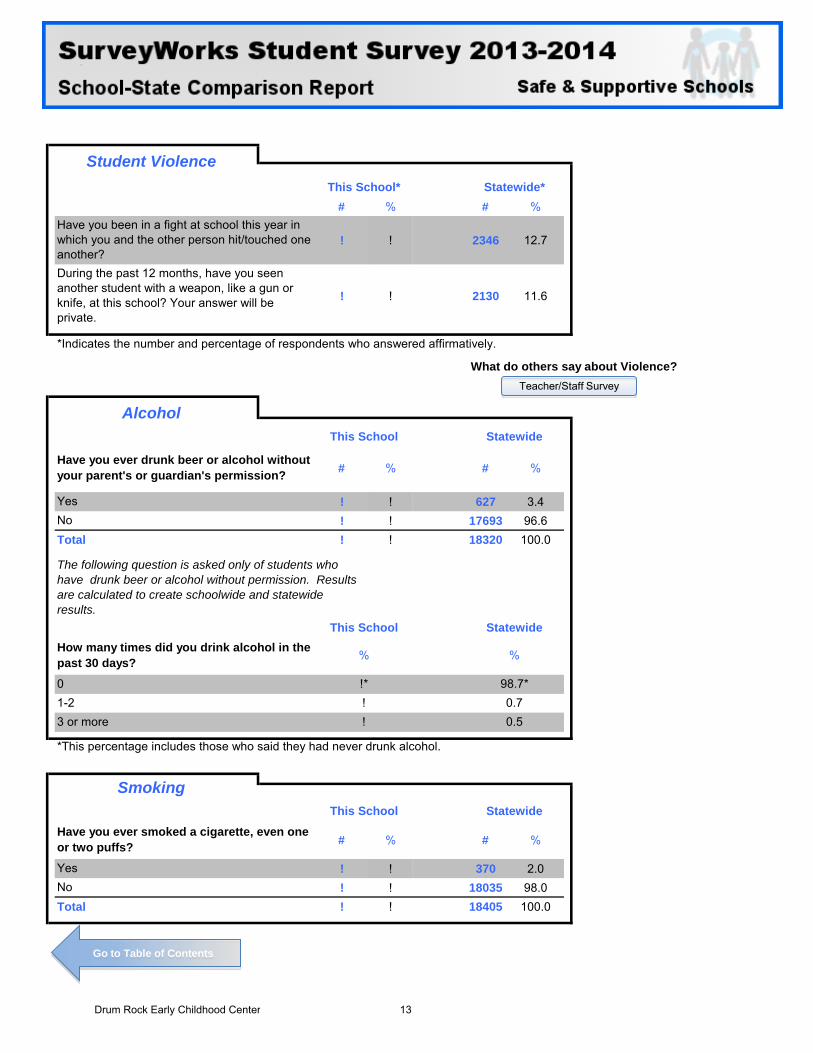
! ! 2346 12.7
! ! 2130 11.6
# % # %
! ! 627 3.4! ! 17693 96.6
Total ! ! 18320 100.0
*This percentage includes those who said they had never drunk alcohol.
# % # %
! ! 370 2.0! ! 18035 98.0
Total ! ! 18405 100.0
SmokingThis School Statewide
Have you ever smoked a cigarette, even one or two puffs?YesNo
1-2 ! 0.73 or more ! 0.5
How many times did you drink alcohol in the past 30 days? % %
0 !* 98.7*
Have you ever drunk beer or alcohol without your parent's or guardian's permission?
YesNo
The following question is asked only of students who have drunk beer or alcohol without permission. Results are calculated to create schoolwide and statewide results.
This School Statewide
Have you been in a fight at school this year in which you and the other person hit/touched one another?During the past 12 months, have you seen another student with a weapon, like a gun or knife, at this school? Your answer will be private.
*Indicates the number and percentage of respondents who answered affirmatively.
What do others say about Violence?
AlcoholThis School Statewide
Student ViolenceThis School* Statewide*
Teacher/Staff Survey
Go to Table of Contents
Drum Rock Early Childhood Center 13
# % # %
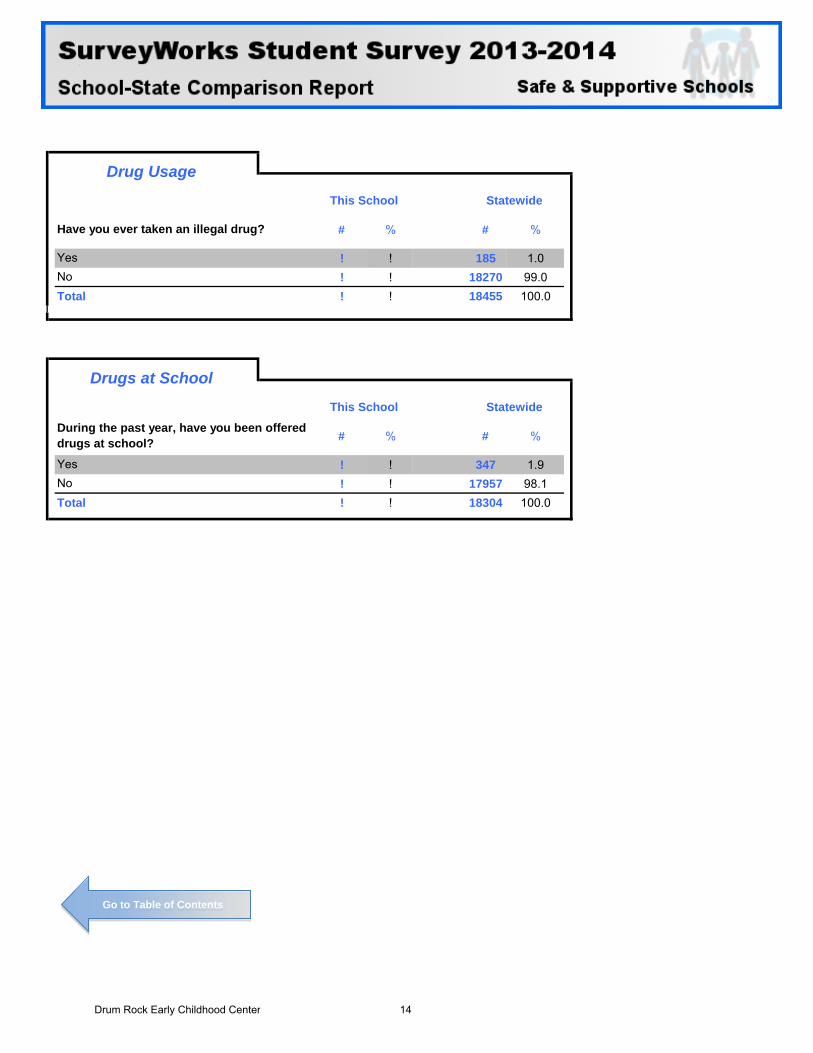
! ! 185 1.0! ! 18270 99.0
Total ! ! 18455 100.0
# % # %
! ! 347 1.9! ! 17957 98.1
Total ! ! 18304 100.0
Drugs at SchoolThis School Statewide
During the past year, have you been offered drugs at school?YesNo
Drug UsageThis School Statewide
Have you ever taken an illegal drug?
YesNo
Go to Table of Contents
Drum Rock Early Childhood Center 14
Statewide*# % # %
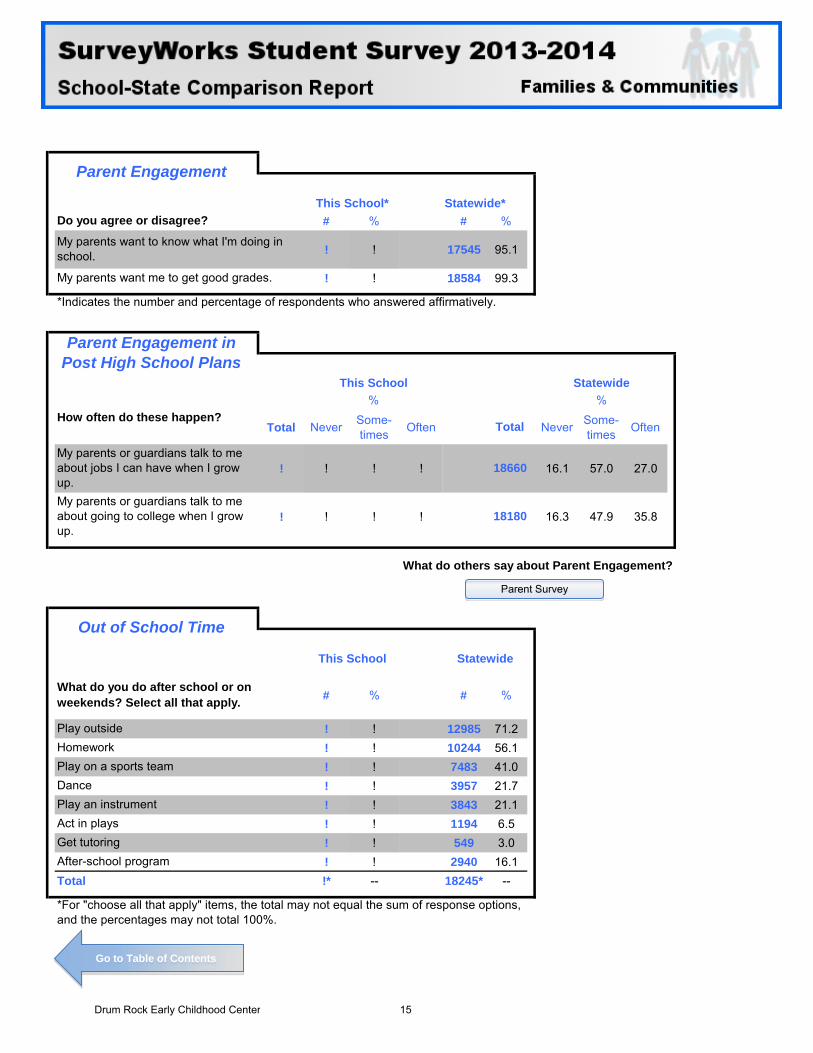
! ! 17545 95.1
! ! 18584 99.3
*Indicates the number and percentage of respondents who answered affirmatively.
Total Never Some-times Often Never Some-
times Often
! ! ! ! 16.1 57.0 27.0
! ! ! ! 16.3 47.9 35.8
# % # %
! ! 12985 71.2! ! 10244 56.1! ! 7483 41.0! ! 3957 21.7! ! 3843 21.1! ! 1194 6.5! ! 549 3.0! ! 2940 16.1
Total !* -- 18245* --
Parent Engagement in Post High School Plans
18660
18180
Total
Parent Engagement
This School*Do you agree or disagree?
My parents want to know what I'm doing in school.
My parents want me to get good grades.
What do you do after school or on weekends? Select all that apply.
This School Statewide
How often do these happen?% %
My parents or guardians talk to me about jobs I can have when I grow up.My parents or guardians talk to me about going to college when I grow up.
Out of School Time
This School Statewide
What do others say about Parent Engagement?
Get tutoringAfter-school program
*For "choose all that apply" items, the total may not equal the sum of response options, and the percentages may not total 100%.
Play outsideHomeworkPlay on a sports teamDancePlay an instrumentAct in plays
Parent Survey
Go to Table of Contents
Drum Rock Early Childhood Center 15
Total Never Some-times Usually Always Total Some-
times Usually Always
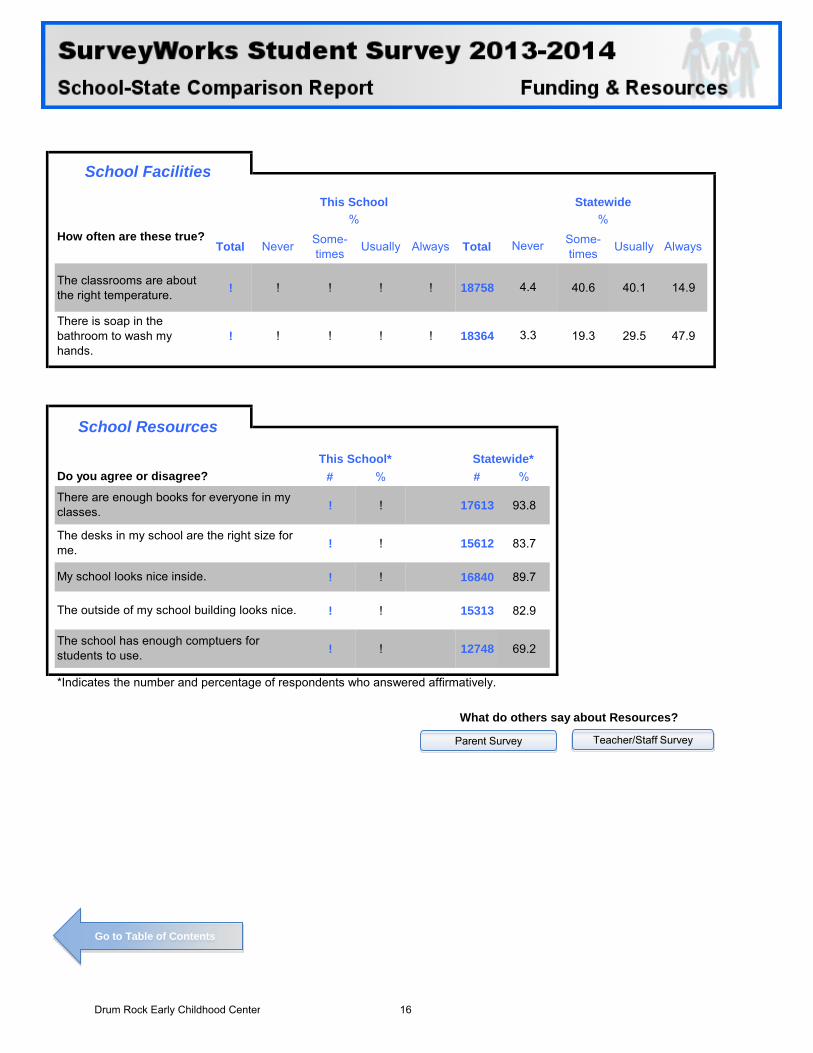
The classrooms are about the right temperature. ! ! ! ! ! 18758 40.6 40.1 14.9
There is soap in the bathroom to wash my hands.
! ! ! ! ! 18364 19.3 29.5 47.9
# % # %
! ! 17613 93.8
! ! 15612 83.7
! ! 16840 89.7
! ! 15313 82.9
! ! 12748 69.2
*Indicates the number and percentage of respondents who answered affirmatively.
What do others say about Resources?
4.4
3.3
School Resources
This School* Statewide*Do you agree or disagree?
There are enough books for everyone in my classes.
The desks in my school are the right size for me.
My school looks nice inside.
The outside of my school building looks nice.
The school has enough comptuers for students to use.
School Facilities
This School Statewide
How often are these true?% %
Never
Parent Survey Teacher/Staff Survey
Go to Table of Contents
Drum Rock Early Childhood Center 16
Introduction……………………………………………………………………………………………………… 18Demographics………………………………………………………………………………………………… 19Teaching and Student Achievement………………………………………………………………………… 21 Student Engagement…………………………………………………………………………………… 21 College/Career Readiness…………………………………………………………………………… 21Safe and Supportive Schools………………………………………………………………………………… 22 School Safety and Climate…………………………………………………………………………… 22 Discipline, Equity and Respect………………………………………………………………………… 22Families and Communities…………………………………………………………………………………… 23 Parent Engagement…………………………………………………………………………………… 23 Parent Participation…………………………………………………………………………………… 24 Learning Opportunities………………………………………………………………………………… 24 Involvement in Decision-making……………………………………………………………………… 25 Parent-School Partnership…………………………………………………………………………… 25 Parent Involvement……………………………………………………………………………………… 26 Parent Involvement Frequency………………………………………………………………………… 26 Parent Engagement in Post High School Plans……………………………………………………… 26 Parent-Teacher Communication……………………………………………………………………… 27 School-Parent Communication………………………………………………………………………… 28 School Services………………………………………………………………………………………… 30 Community Support…………………………………………………………………………………… 30Funding and Resources……………………………………………………………………………………… 31 School Resources……………………………………………………………………………………… 31
Section 2: Parent Survey
Go to Table of Contents
Drum Rock Early Childhood Center 17
Section 2: Parent Survey Introduction In November 2013, parents/guardians of students at all public schools in Rhode Island were invited to participate in the SurveyWorks Parent Survey. The Parent Survey was administered online and on paper from November 12, 2013 through December 20, 2013.
Parents who had multiple students in the same school were instructed to answer the survey only once based on their experience with the oldest child. Surveys were conducted anonymously. The Parent Survey asked about: the school facility and learning environment, school resources and activities, parent involvement, school-family communication, school safety, and college and career readiness issues.
This section of the report presents the parents’ responses. Data tables are provided for this school as well as for parents statewide in Rhode Island. Responses are reported as the percentage of parents who responded to each item and the total number answering each item by school and across the state. In order to ensure anonymity, data for items with fewer than ten responses are not reported. In these cases, a dash (-) indicates that there are insufficient responses to report at the school level.
As noted in the introduction, this school’s Parent Survey participation rate is 10.7%. The participation rate is calculated as the number of Parent Surveys received as a percentage of the total number of unique student addresses for the school. This method of counting families is more accurate than the total number of students in a school, but may overcount some families and undercount others. Data from schools with low participation rates should be interpreted with caution. Parent Survey results are not reported for any school where the total Parent Survey participation rate is less than 10%. In these cases, a tilde symbol (~) is used in the data tables to denote that an insufficient participation rate was received for this school and that data are not reportable at the school level. In these instances, only state level data are reported. In some cases, a school did not participate in the Parent Survey. In these instances, an exclamation mark (!) is used in the data tables to indicate that a school did not participate and only state level data are reported.
Go to Table of Contents
Drum Rock Early Childhood Center 18
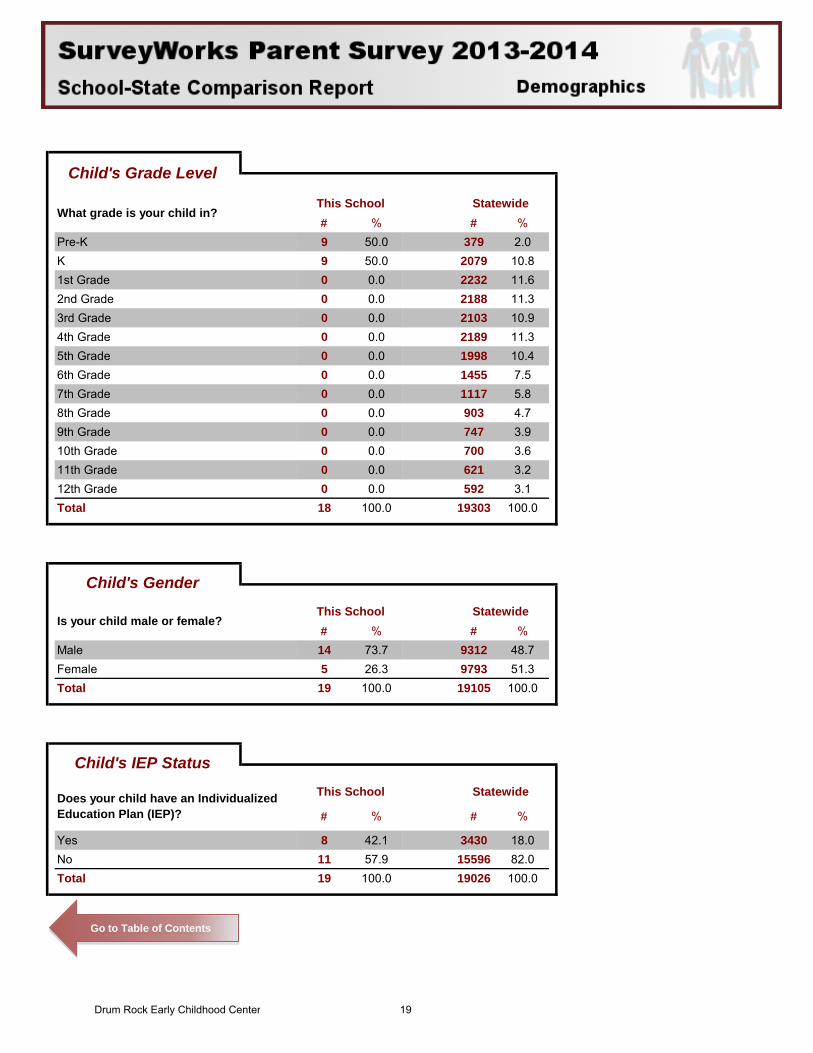
# % # %Pre-K 9 50.0 379 2.0K 9 50.0 2079 10.81st Grade 0 0.0 2232 11.62nd Grade 0 0.0 2188 11.33rd Grade 0 0.0 2103 10.94th Grade 0 0.0 2189 11.35th Grade 0 0.0 1998 10.46th Grade 0 0.0 1455 7.57th Grade 0 0.0 1117 5.88th Grade 0 0.0 903 4.79th Grade 0 0.0 747 3.910th Grade 0 0.0 700 3.611th Grade 0 0.0 621 3.212th Grade 0 0.0 592 3.1Total 18 100.0 19303 100.0
# % # %Male 14 73.7 9312 48.7Female 5 26.3 9793 51.3Total 19 100.0 19105 100.0
# % # %
Yes 8 42.1 3430 18.0No 11 57.9 15596 82.0Total 19 100.0 19026 100.0
Child's Grade Level
What grade is your child in?This School Statewide
Child's Gender
Is your child male or female?This School Statewide
Child's IEP Status
Does your child have an Individualized Education Plan (IEP)?
This School Statewide
Go to Table of Contents
Drum Rock Early Childhood Center 19
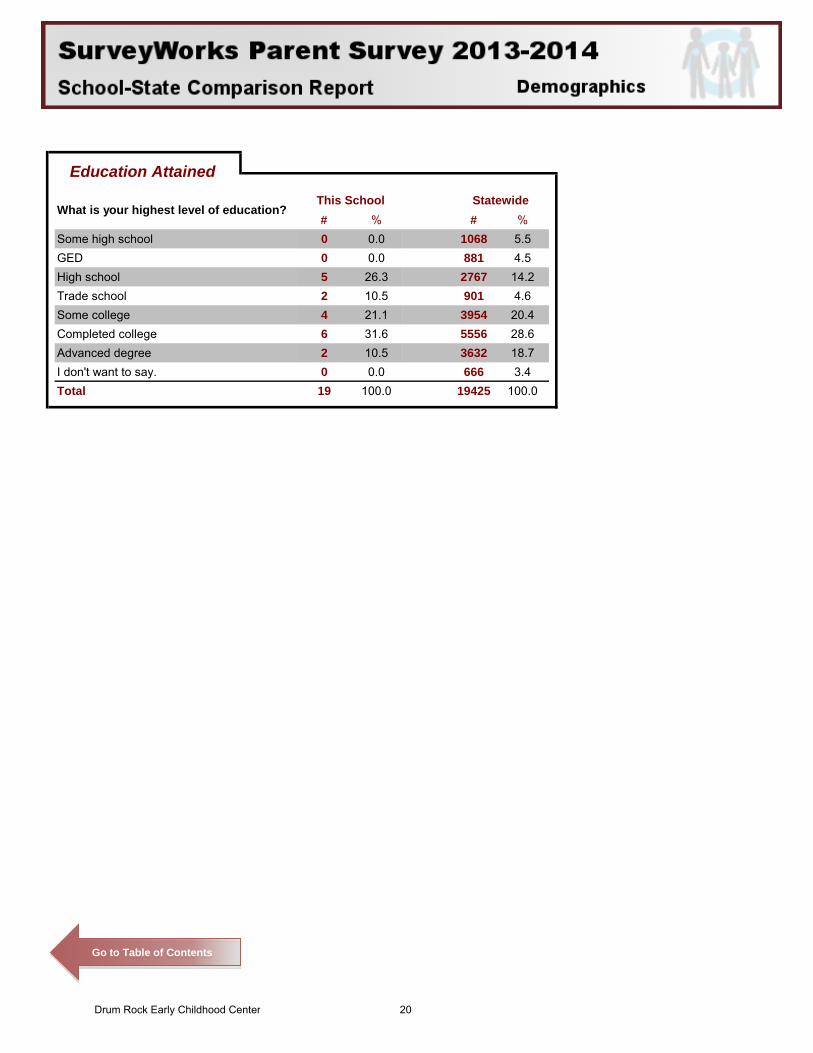
# % # %Some high school 0 0.0 1068 5.5GED 0 0.0 881 4.5High school 5 26.3 2767 14.2Trade school 2 10.5 901 4.6Some college 4 21.1 3954 20.4Completed college 6 31.6 5556 28.6Advanced degree 2 10.5 3632 18.7I don't want to say. 0 0.0 666 3.4Total 19 100.0 19425 100.0
What is your highest level of education?This School Statewide
Education Attained
Go to Table of Contents
Drum Rock Early Childhood Center 20
Total Strongly Disagree Disagree Agree Strongly
Agree Total Disagree Agree Strongly Agree
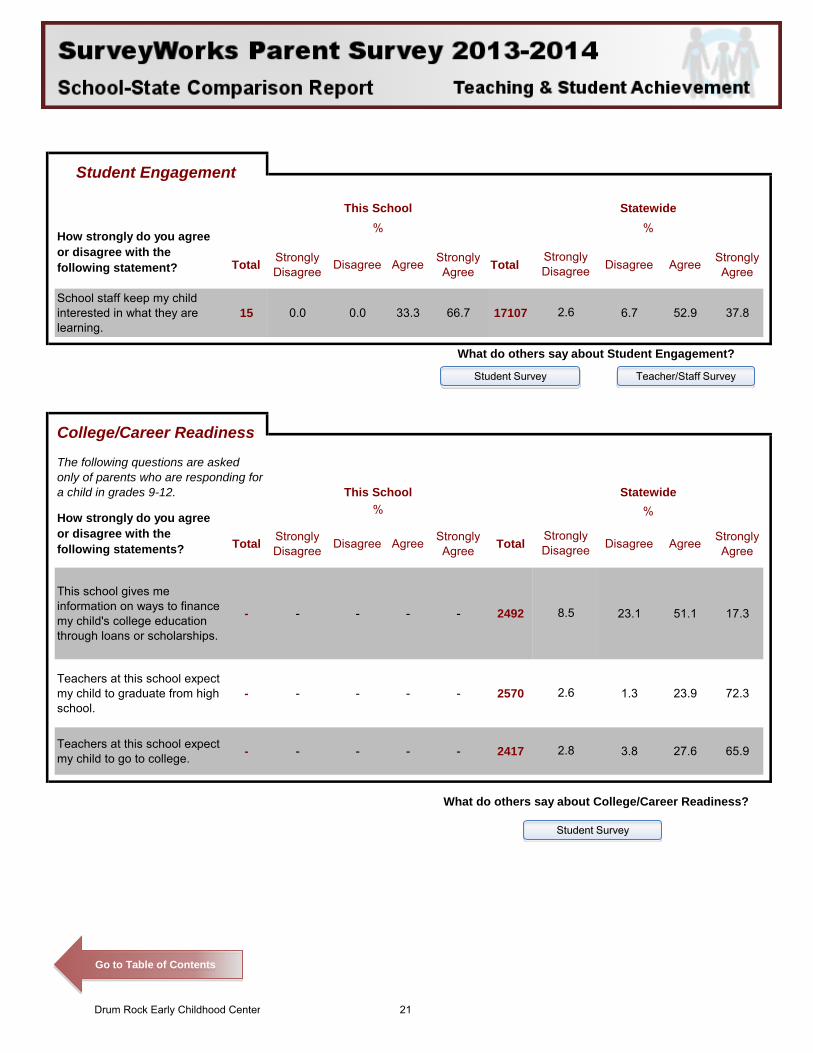
School staff keep my child interested in what they are learning.
15 0.0 0.0 33.3 66.7 17107 6.7 52.9 37.8
Total Strongly Disagree Disagree Agree Strongly
Agree Total Disagree Agree Strongly Agree
This school gives me information on ways to finance my child's college education through loans or scholarships.
- - - - - 2492 23.1 51.1 17.3
Teachers at this school expect my child to graduate from high school.
- - - - - 2570 1.3 23.9 72.3
Teachers at this school expect my child to go to college. - - - - - 2417 3.8 27.6 65.9
Student Engagement
This School Statewide
How strongly do you agree or disagree with the following statement?
% %
Strongly Disagree
2.6
What do others say about Student Engagement?
College/Career Readiness
The following questions are asked only of parents who are responding for a child in grades 9-12. This School Statewide
2.8
What do others say about College/Career Readiness?
How strongly do you agree or disagree with the following statements?
% %
Strongly Disagree
8.5
2.6
Teacher/Staff Survey Student Survey
Student Survey
Go to Table of Contents
Drum Rock Early Childhood Center 21
Total Strongly Disagree Disagree Agree Strongly
Agree Total Disagree Agree Strongly Agree
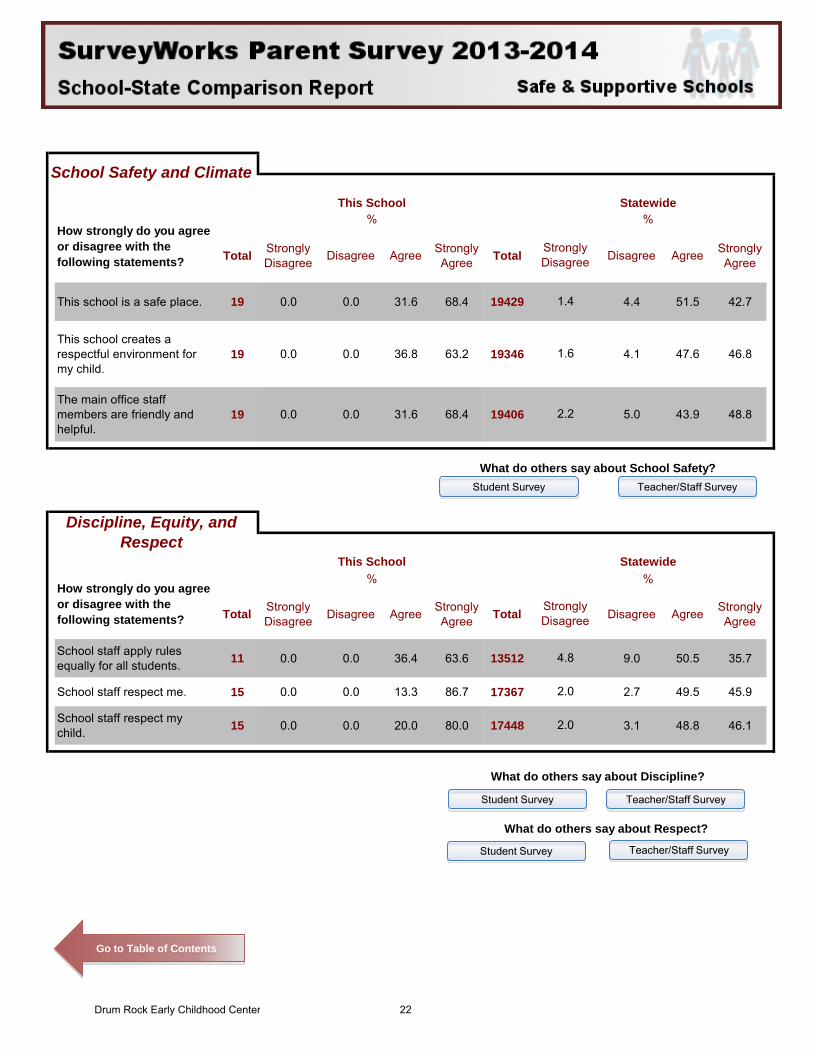
This school is a safe place. 19 0.0 0.0 31.6 68.4 19429 4.4 51.5 42.7
This school creates a respectful environment for my child.
19 0.0 0.0 36.8 63.2 19346 4.1 47.6 46.8
The main office staff members are friendly and helpful.
19 0.0 0.0 31.6 68.4 19406 5.0 43.9 48.8
Total Strongly Disagree Disagree Agree Strongly
Agree Total Disagree Agree Strongly Agree
School staff apply rules equally for all students. 11 0.0 0.0 36.4 63.6 13512 9.0 50.5 35.7
School staff respect me. 15 0.0 0.0 13.3 86.7 17367 2.7 49.5 45.9
School staff respect my child. 15 0.0 0.0 20.0 80.0 17448 3.1 48.8 46.1
This School Statewide
School Safety and Climate
This School Statewide
How strongly do you agree or disagree with the following statements?
% %
Strongly Disagree
1.4
1.6
2.2
What do others say about School Safety?
Discipline, Equity, and Respect
2.0
What do others say about Discipline?
What do others say about Respect?
How strongly do you agree or disagree with the following statements?
% %
Strongly Disagree
4.8
2.0
Teacher/Staff Survey Student Survey
Teacher/Staff Survey Student Survey
Teacher/Staff Survey Student Survey
Go to Table of Contents
Drum Rock Early Childhood Center 22
Total Strongly Disagree Disagree Agree Strongly
Agree Total Strongly Disagree Agree Strongly
Agree
I know what my child is studying in his or her classes.
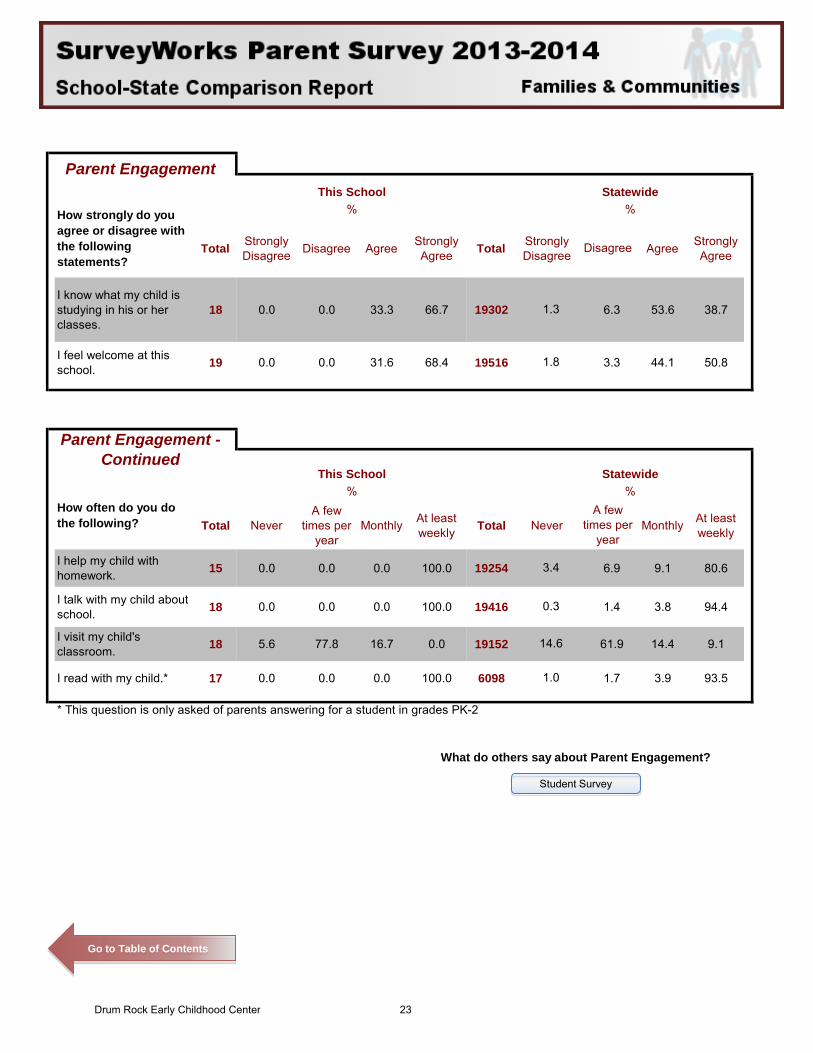
18 0.0 0.0 33.3 66.7 19302 6.3 53.6 38.7
I feel welcome at this school. 19 0.0 0.0 31.6 68.4 19516 3.3 44.1 50.8
Total NeverA few
times per year
Monthly At least weekly Total Never Monthly At least
weekly
I help my child with homework. 15 0.0 0.0 0.0 100.0 19254 6.9 9.1 80.6
I talk with my child about school. 18 0.0 0.0 0.0 100.0 19416 1.4 3.8 94.4
I visit my child's classroom. 18 5.6 77.8 16.7 0.0 19152 61.9 14.4 9.1
I read with my child.* 17 0.0 0.0 0.0 100.0 6098 1.7 3.9 93.5
Parent EngagementThis School Statewide
How strongly do you agree or disagree with the following statements?
% %
Disagree
1.3
1.8
Parent Engagement - Continued
This School Statewide
How often do you do the following?
% %A few
times per year
3.4
0.3
14.6
1.0
* This question is only asked of parents answering for a student in grades PK-2
What do others say about Parent Engagement?
Student Survey
Go to Table of Contents
Drum Rock Early Childhood Center 23
# % # %
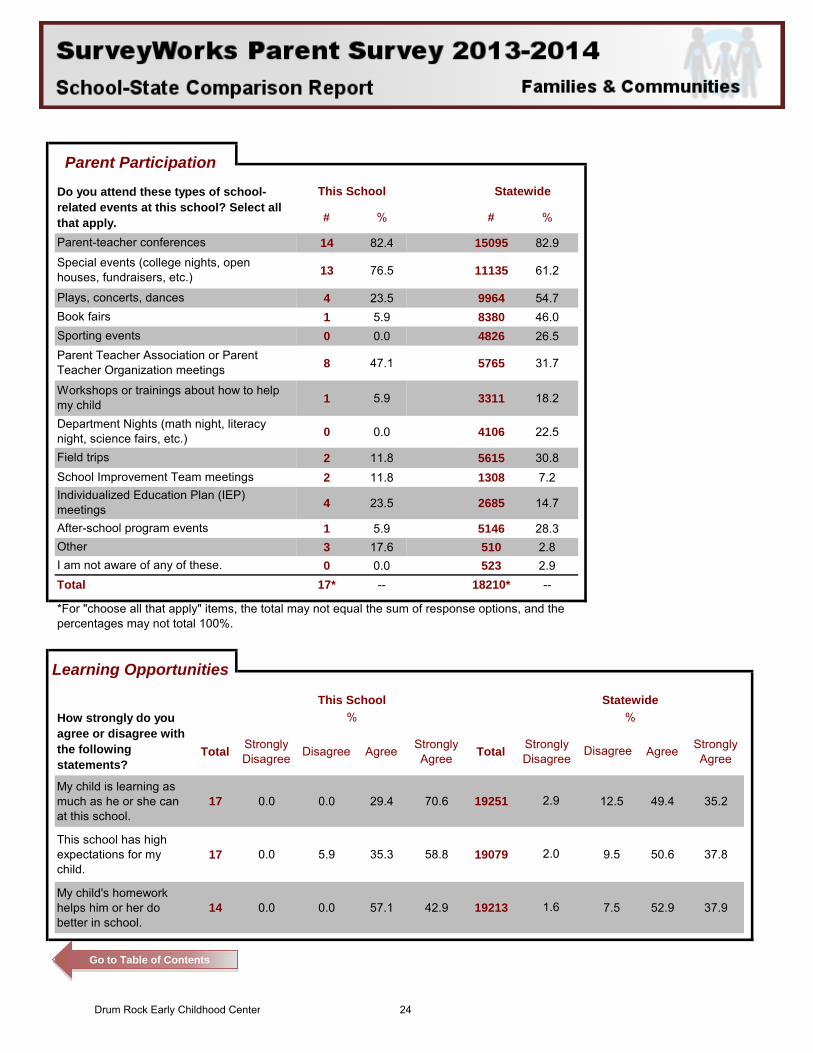
14 82.4 15095 82.9
13 76.5 11135 61.2
4 23.5 9964 54.71 5.9 8380 46.00 0.0 4826 26.5
8 47.1 5765 31.7
1 5.9 3311 18.2
0 0.0 4106 22.5
2 11.8 5615 30.82 11.8 1308 7.2
4 23.5 2685 14.7
1 5.9 5146 28.33 17.6 510 2.80 0.0 523 2.9
Total 17* -- 18210* --
Total Strongly Disagree Disagree Agree Strongly
Agree Total Strongly Disagree Agree Strongly
Agree
My child is learning as much as he or she can at this school.
17 0.0 0.0 29.4 70.6 19251 12.5 49.4 35.2
This school has high expectations for my child.
17 0.0 5.9 35.3 58.8 19079 9.5 50.6 37.8
My child's homework helps him or her do better in school.
14 0.0 0.0 57.1 42.9 19213 7.5 52.9 37.9
Parent Participation
Do you attend these types of school-related events at this school? Select all that apply.
This School Statewide
Parent-teacher conferences
Department Nights (math night, literacy night, science fairs, etc.)Field tripsSchool Improvement Team meetingsIndividualized Education Plan (IEP) meetingsAfter-school program eventsOther
Special events (college nights, open houses, fundraisers, etc.)
Plays, concerts, dancesBook fairsSporting eventsParent Teacher Association or Parent Teacher Organization meetings
Workshops or trainings about how to help my child
2.9
2.0
1.6
I am not aware of any of these.
*For "choose all that apply" items, the total may not equal the sum of response options, and the percentages may not total 100%.
Learning Opportunities
This School StatewideHow strongly do you agree or disagree with the following statements?
% %
Disagree
Go to Table of Contents
Drum Rock Early Childhood Center 24
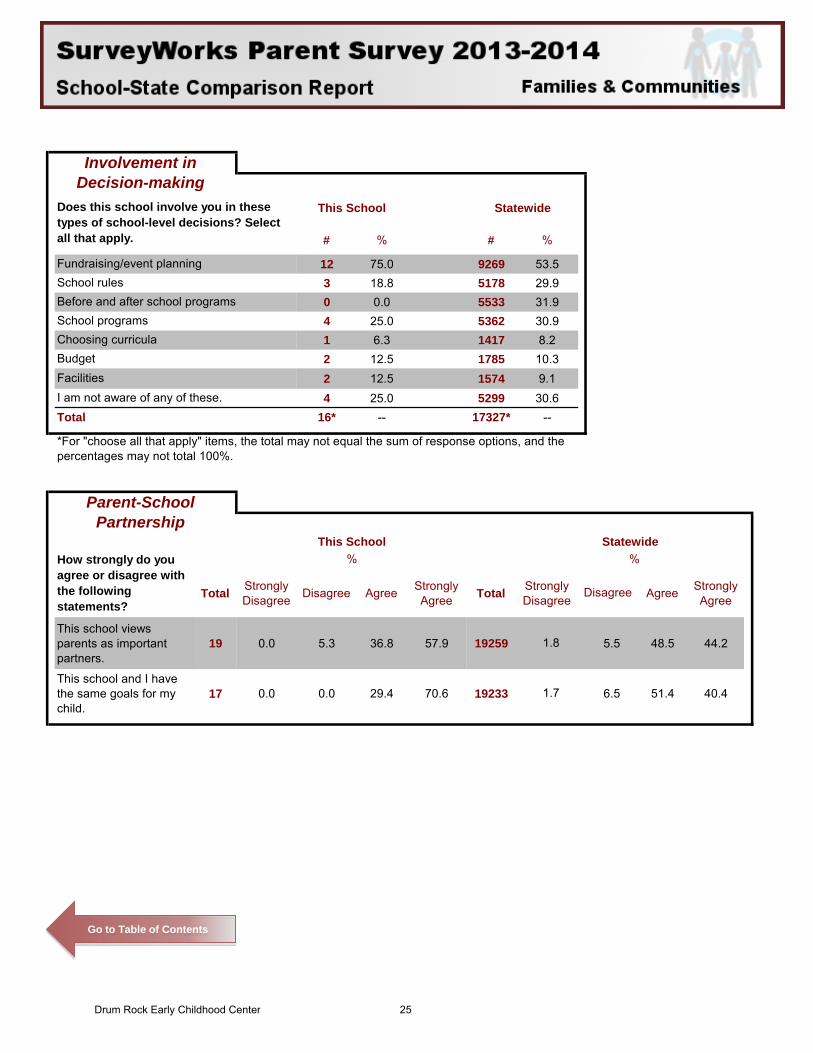
# % # %
12 75.0 9269 53.53 18.8 5178 29.90 0.0 5533 31.94 25.0 5362 30.91 6.3 1417 8.22 12.5 1785 10.32 12.5 1574 9.14 25.0 5299 30.6
Total 16* -- 17327* --
Total Strongly Disagree Disagree Agree Strongly
Agree Total Strongly Disagree Agree Strongly
Agree
This school views parents as important partners.
19 0.0 5.3 36.8 57.9 19259 5.5 48.5 44.2
This school and I have the same goals for my child.
17 0.0 0.0 29.4 70.6 19233 6.5 51.4 40.4
Involvement in Decision-making
Does this school involve you in these types of school-level decisions? Select all that apply.
This School Statewide
FacilitiesI am not aware of any of these.
*For "choose all that apply" items, the total may not equal the sum of response options, and the percentages may not total 100%.
Parent-School Partnership
This School Statewide
Fundraising/event planningSchool rulesBefore and after school programsSchool programsChoosing curriculaBudget
How strongly do you agree or disagree with the following statements?
% %
Disagree
1.8
1.7
Go to Table of Contents
Drum Rock Early Childhood Center 25
Total Strongly Disagree Disagree Agree Strongly
Agree Total Strongly Disagree Agree Strongly
Agree
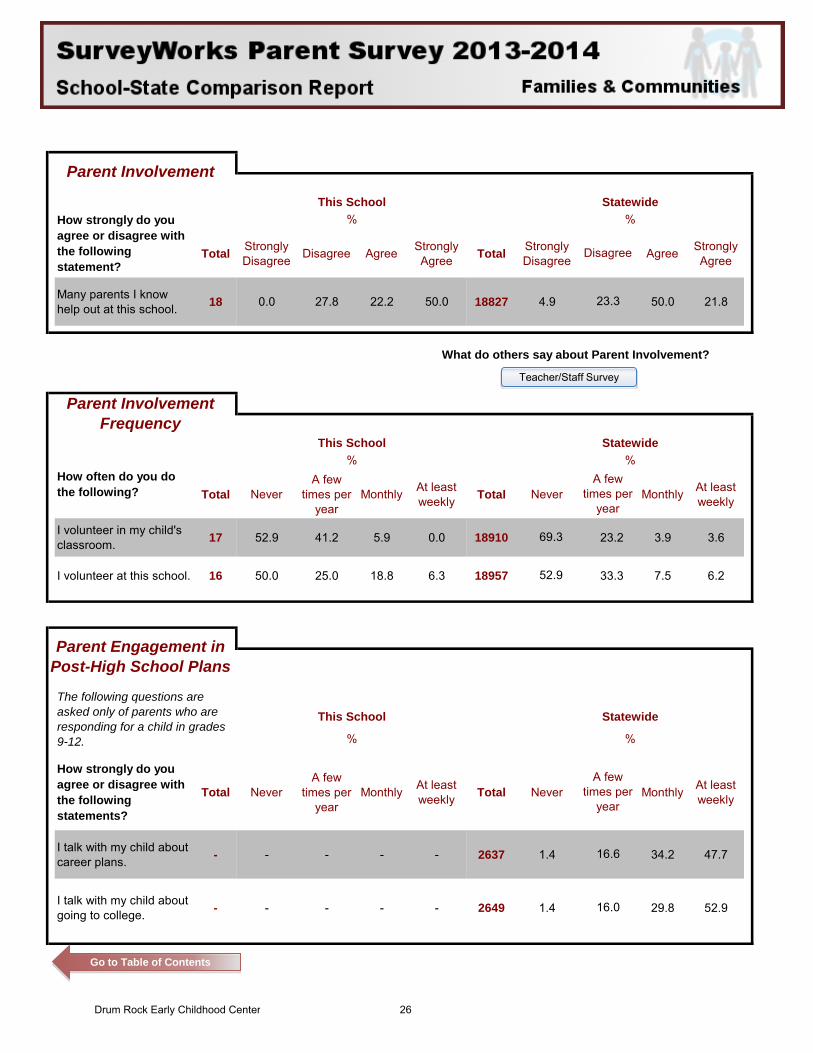
Many parents I know help out at this school. 18 0.0 27.8 22.2 50.0 18827 4.9 50.0 21.8
Total NeverA few
times per year
Monthly At least weekly Total Never Monthly At least
weekly
I volunteer in my child's classroom. 17 52.9 41.2 5.9 0.0 18910 23.2 3.9 3.6
I volunteer at this school. 16 50.0 25.0 18.8 6.3 18957 33.3 7.5 6.2
How strongly do you agree or disagree with the following statements?
Total NeverA few
times per year
Monthly At least weekly Total Never Monthly At least
weekly
I talk with my child about career plans. - - - - - 2637 1.4 34.2 47.7
I talk with my child about going to college. - - - - - 2649 1.4 29.8 52.9
Parent Involvement
This School StatewideHow strongly do you agree or disagree with the following statement?
% %
Disagree
23.3
What do others say about Parent Involvement?
Parent Involvement Frequency
This School Statewide
How often do you do the following?
% %A few
times per year
69.3
52.9
Parent Engagement in Post-High School Plans
The following questions are asked only of parents who are responding for a child in grades 9-12.
This School Statewide
% %
A few times per
year
16.6
16.0
Teacher/Staff Survey
Go to Table of Contents
Drum Rock Early Childhood Center 26
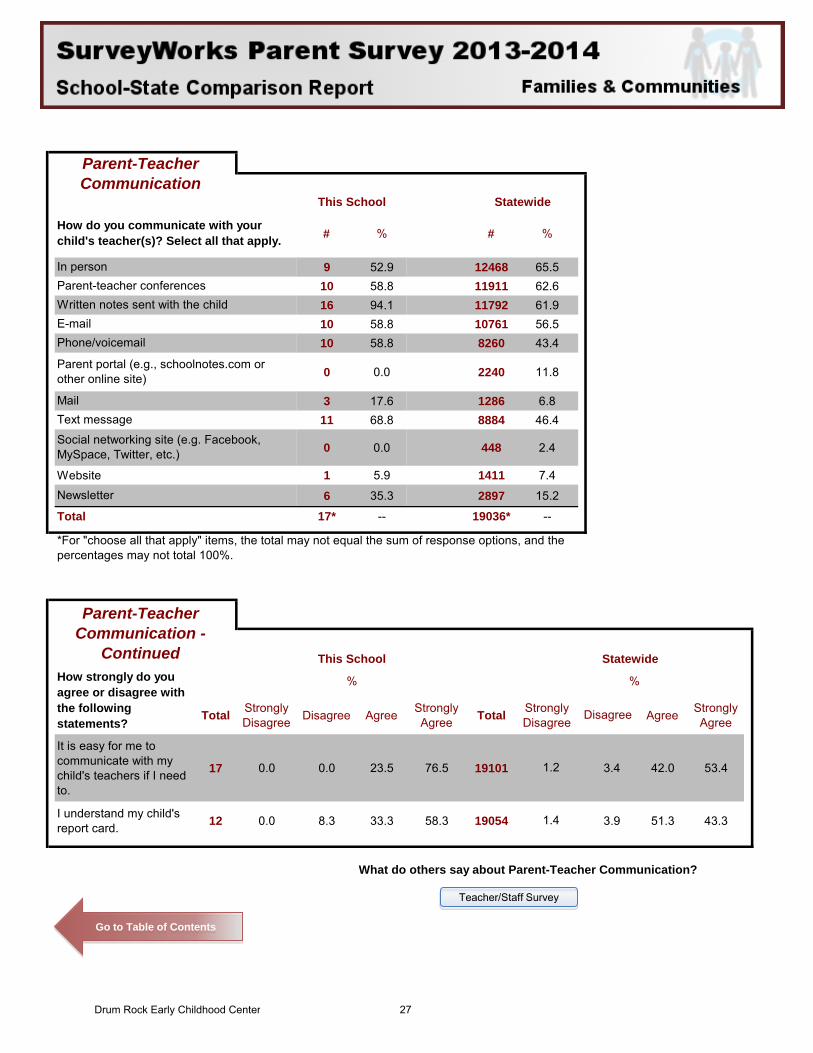
# % # %
9 52.9 12468 65.510 58.8 11911 62.616 94.1 11792 61.910 58.8 10761 56.510 58.8 8260 43.4
0 0.0 2240 11.8
3 17.6 1286 6.811 68.8 8884 46.4
0 0.0 448 2.4
Website 1 5.9 1411 7.4
6 35.3 2897 15.2
Total 17* -- 19036* --
Total Strongly Disagree Disagree Agree Strongly
Agree Total Strongly Disagree Agree Strongly
Agree
It is easy for me to communicate with my child's teachers if I need to.
17 0.0 0.0 23.5 76.5 19101 3.4 42.0 53.4
I understand my child's report card. 12 0.0 8.3 33.3 58.3 19054 3.9 51.3 43.3
How do you communicate with your child's teacher(s)? Select all that apply.
In personParent-teacher conferencesWritten notes sent with the childE-mailPhone/voicemail
Parent-Teacher Communication
This School Statewide
Parent-Teacher Communication -
Continued This School StatewideHow strongly do you agree or disagree with the following statements?
% %
Disagree
Parent portal (e.g., schoolnotes.com or other online site)
MailText message
Social networking site (e.g. Facebook, MySpace, Twitter, etc.)
Newsletter
*For "choose all that apply" items, the total may not equal the sum of response options, and the percentages may not total 100%.
1.2
1.4
What do others say about Parent-Teacher Communication?
Teacher/Staff Survey
Go to Table of Contents
Drum Rock Early Childhood Center 27
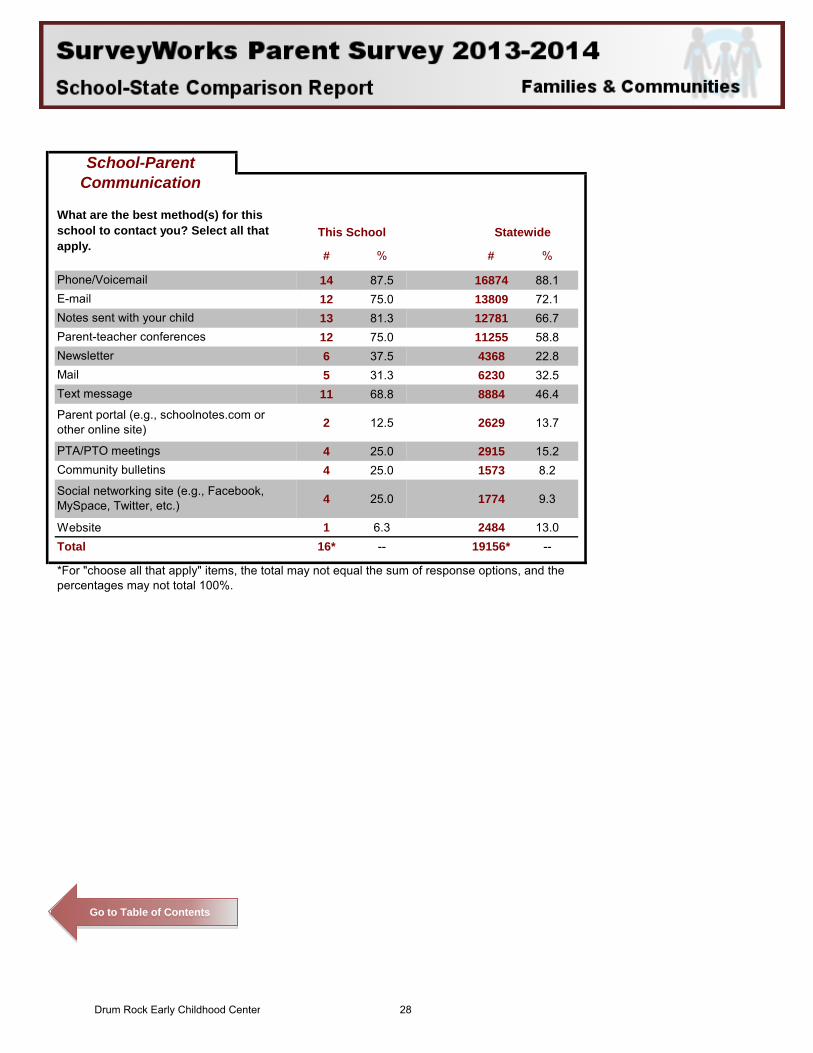
# % # %
14 87.5 16874 88.112 75.0 13809 72.113 81.3 12781 66.712 75.0 11255 58.86 37.5 4368 22.85 31.3 6230 32.5
11 68.8 8884 46.4
2 12.5 2629 13.7
4 25.0 2915 15.24 25.0 1573 8.2
4 25.0 1774 9.3
Website 1 6.3 2484 13.0Total 16* -- 19156* --
Phone/VoicemailE-mailNotes sent with your childParent-teacher conferencesNewsletterMail
School-Parent Communication
What are the best method(s) for this school to contact you? Select all that apply.
This School Statewide
Text message
Parent portal (e.g., schoolnotes.com or other online site)
PTA/PTO meetingsCommunity bulletins
Social networking site (e.g., Facebook, MySpace, Twitter, etc.)
*For "choose all that apply" items, the total may not equal the sum of response options, and the percentages may not total 100%.
Go to Table of Contents
Drum Rock Early Childhood Center 28
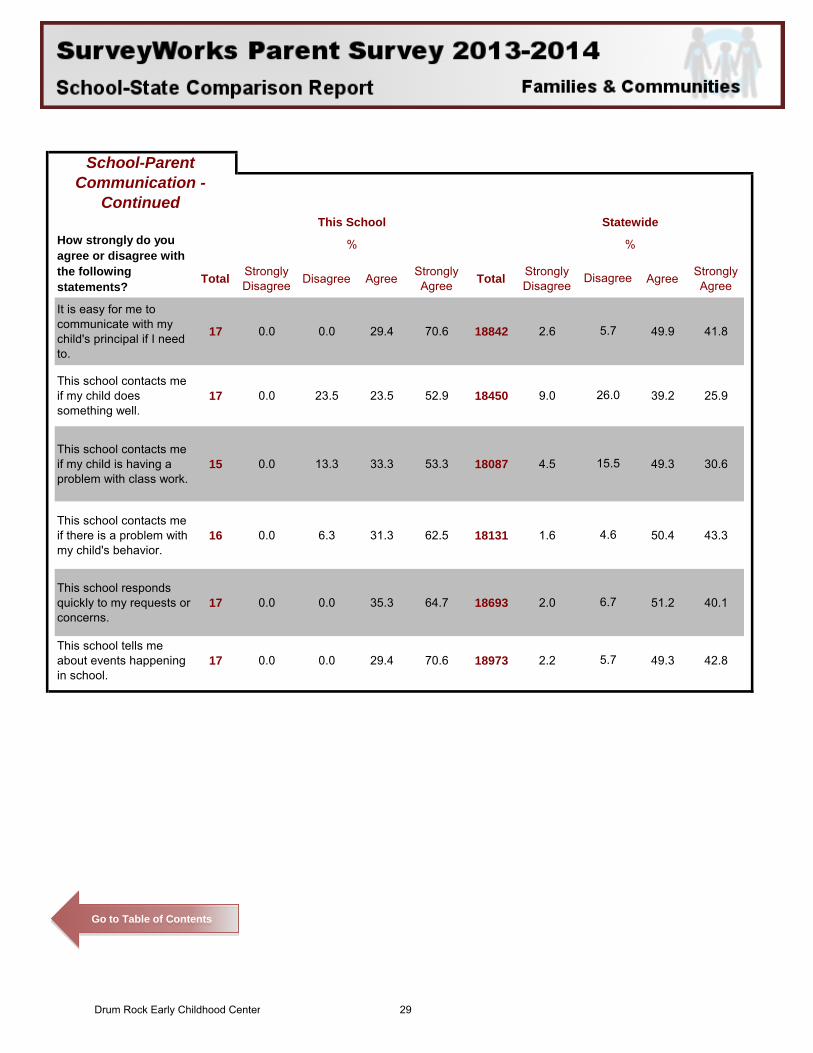
Total Strongly Disagree Disagree Agree Strongly
Agree Total Strongly Disagree Agree Strongly
Agree
It is easy for me to communicate with my child's principal if I need to.
17 0.0 0.0 29.4 70.6 18842 2.6 49.9 41.8
This school contacts me if my child does something well.
17 0.0 23.5 23.5 52.9 18450 9.0 39.2 25.9
This school contacts me if my child is having a problem with class work.
15 0.0 13.3 33.3 53.3 18087 4.5 49.3 30.6
This school contacts me if there is a problem with my child's behavior.
16 0.0 6.3 31.3 62.5 18131 1.6 50.4 43.3
This school responds quickly to my requests or concerns.
17 0.0 0.0 35.3 64.7 18693 2.0 51.2 40.1
This school tells me about events happening in school.
17 0.0 0.0 29.4 70.6 18973 2.2 49.3 42.8
School-Parent Communication -
ContinuedThis School Statewide
How strongly do you agree or disagree with the following statements?
% %
Disagree
5.7
26.0
15.5
4.6
6.7
5.7
Go to Table of Contents
Drum Rock Early Childhood Center 29
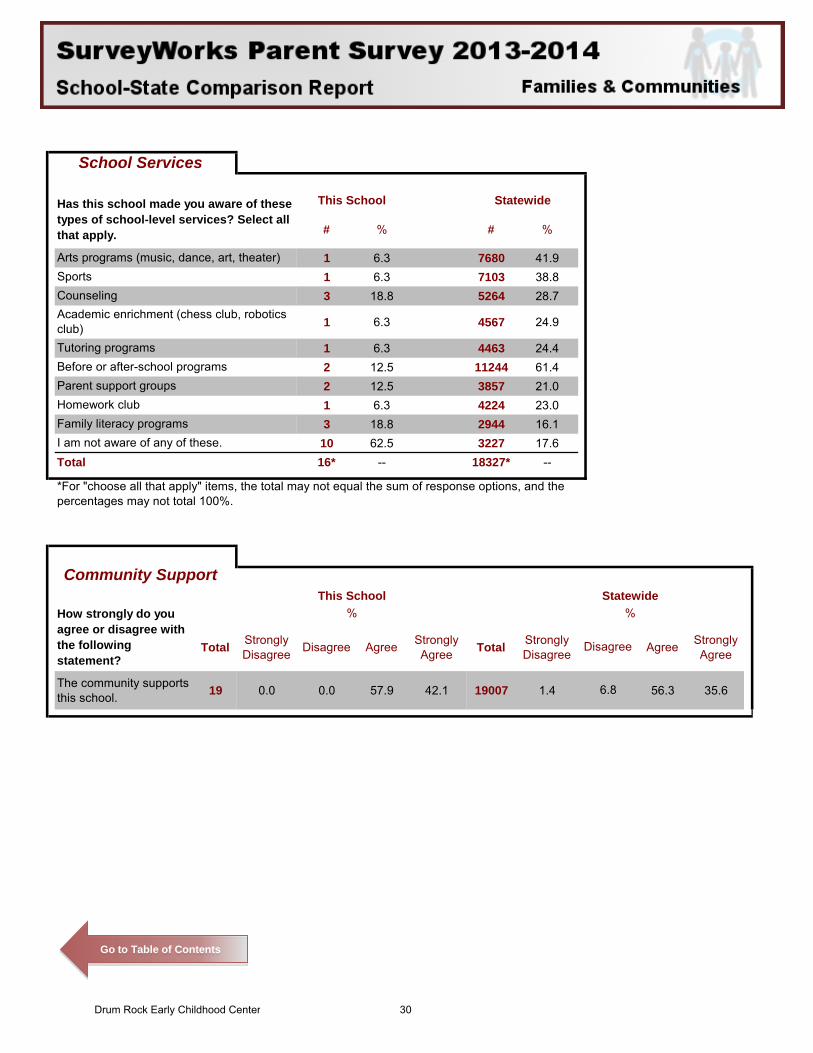
# % # %
1 6.3 7680 41.91 6.3 7103 38.83 18.8 5264 28.7
1 6.3 4567 24.9
1 6.3 4463 24.42 12.5 11244 61.42 12.5 3857 21.01 6.3 4224 23.03 18.8 2944 16.1
10 62.5 3227 17.6Total 16* -- 18327* --
Total Strongly Disagree Disagree Agree Strongly
Agree Total Strongly Disagree Agree Strongly
Agree
The community supports this school. 19 0.0 0.0 57.9 42.1 19007 1.4 56.3 35.6
Statewide
Arts programs (music, dance, art, theater)SportsCounselingAcademic enrichment (chess club, robotics club)Tutoring programsBefore or after-school programsParent support groupsHomework club
School Services
Has this school made you aware of these types of school-level services? Select all that apply.
This School
How strongly do you agree or disagree with the following statement?
% %
Disagree
6.8
Family literacy programsI am not aware of any of these.
*For "choose all that apply" items, the total may not equal the sum of response options, and the percentages may not total 100%.
Community SupportThis School Statewide
Go to Table of Contents
Drum Rock Early Childhood Center 30
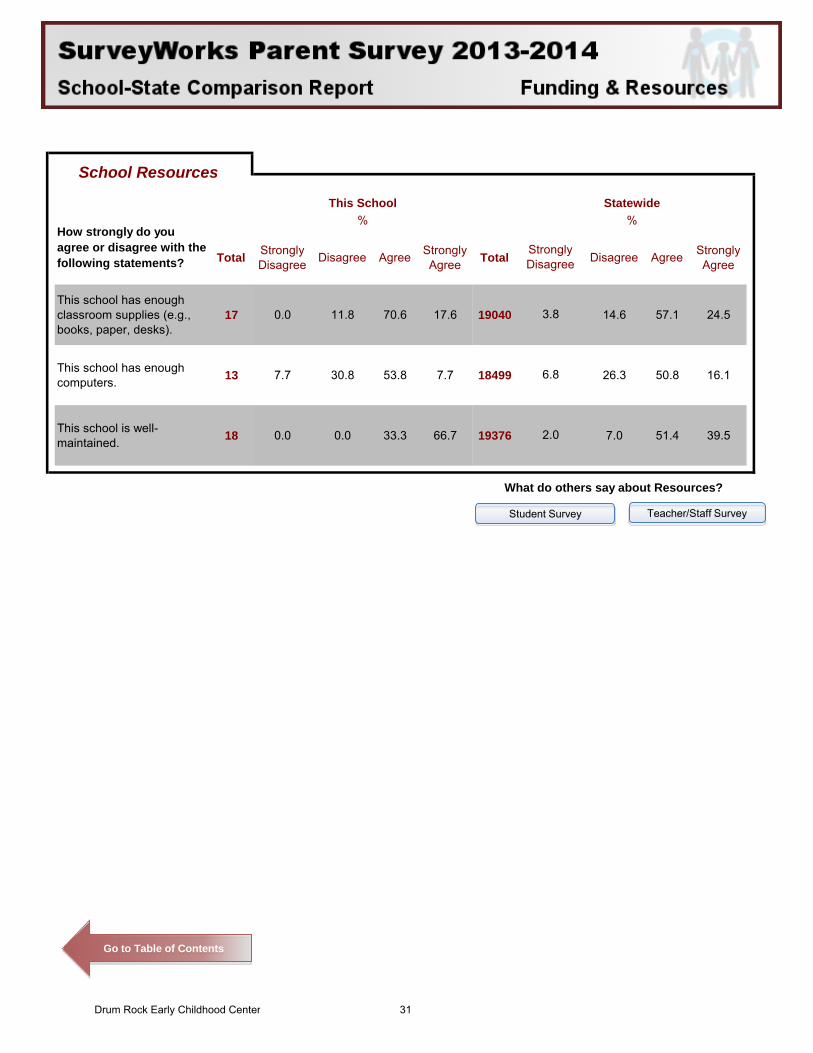
Total Strongly Disagree Disagree Agree Strongly
Agree Total Disagree Agree Strongly Agree
This school has enough classroom supplies (e.g., books, paper, desks).
17 0.0 11.8 70.6 17.6 19040 14.6 57.1 24.5
This school has enough computers. 13 7.7 30.8 53.8 7.7 18499 26.3 50.8 16.1
This school is well-maintained. 18 0.0 0.0 33.3 66.7 19376 7.0 51.4 39.5
3.8
6.8
2.0
What do others say about Resources?
School Resources
This School Statewide
How strongly do you agree or disagree with the following statements?
% %
Strongly Disagree
Student Survey Teacher/Staff Survey
Go to Table of Contents
Drum Rock Early Childhood Center 31
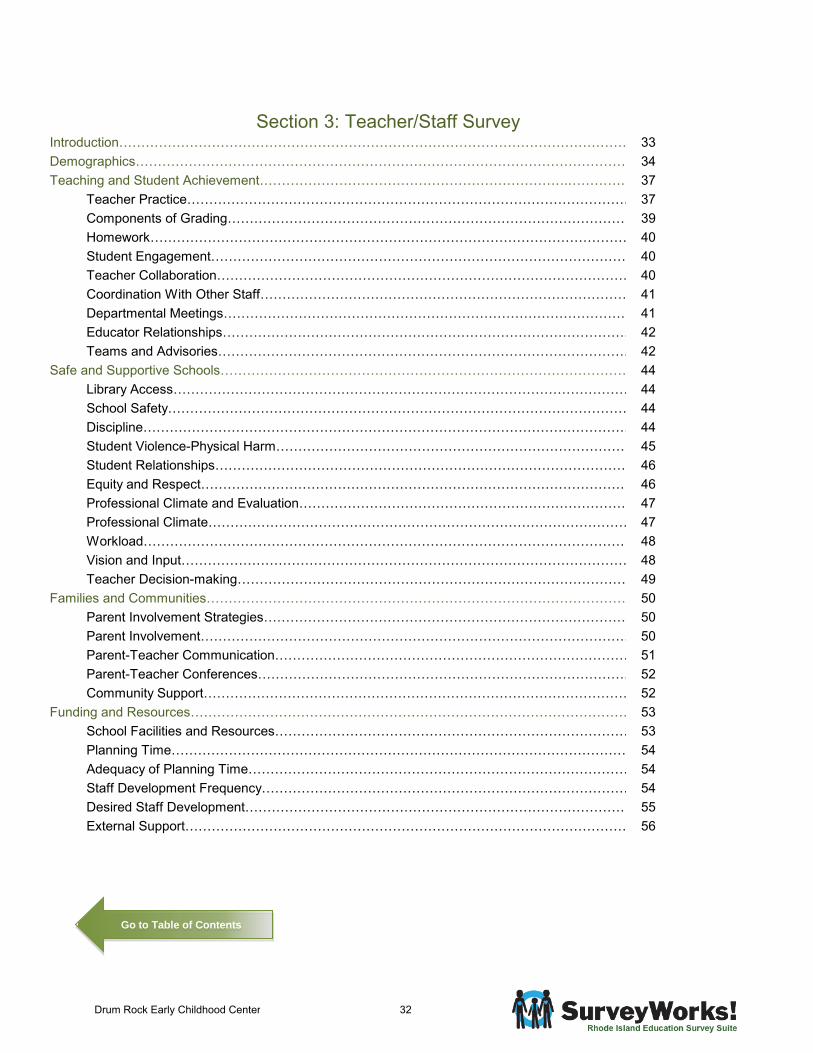
Introduction……………………………………………………………………………………………………… 33Demographics………………………………………………………………………………………………… 34Teaching and Student Achievement…………………………………………………………….…………… 37 Teacher Practice………………………………………………………………………………………… 37 Components of Grading………………………………………………………………………………… 39 Homework……………………………………………………………………………………………… 40 Student Engagement…………………………………………………………………………………… 40 Teacher Collaboration………………………………………………………………………………… 40 Coordination With Other Staff………………………………………………………………………… 41 Departmental Meetings………………………………………………………………………………… 41 Educator Relationships………………………………………………………………………………… 42 Teams and Advisories………………………………………………………………………………… 42Safe and Supportive Schools………………………………………………………………………………… 44 Library Access…………………………………………………………………………………………… 44 School Safety…………………………………………………………………………………………… 44 Discipline………………………………………………………………………………………………… 44 Student Violence-Physical Harm……………………………………………………………………… 45 Student Relationships………………………………………………………………………………… 46 Equity and Respect……………………………………………………………………………………… 46 Professional Climate and Evaluation………………………………………………………………… 47 Professional Climate…………………………………………………………………………………… 47 Workload………………………………………………………………………………………………… 48 Vision and Input………………………………………………………………………………………… 48 Teacher Decision-making……………………………………………………………………………… 49Families and Communities…………………………………………………………………………………… 50 Parent Involvement Strategies………………………………………………………………………… 50 Parent Involvement……………………………………………………………………………………… 50 Parent-Teacher Communication……………………………………………………………………… 51 Parent-Teacher Conferences………………………………………………………………………… 52 Community Support…………………………………………………………………………………… 52Funding and Resources……………………………………………………………………………………… 53 School Facilities and Resources……………………………………………………………………… 53 Planning Time…………………………………………………………………………………………… 54 Adequacy of Planning Time…………………………………………………………………………… 54 Staff Development Frequency………………………………………………………………………… 54 Desired Staff Development…………………………………………………………………………… 55 External Support………………………………………………………………………………………… 56
Section 3: Teacher/Staff Survey
Go to Table of Contents
Drum Rock Early Childhood Center 32
Section 3: Teacher/Staff Survey Introduction
In November 2013, teachers and instructional staff at all public schools in Rhode Island were invited to participate in the SurveyWorks Teacher/Staff Survey. The Teacher/Staff Survey was administered online from November 12, 2013 through December 20, 2013. This section of the report presents a series of tables created from the Teacher/Staff Survey responses for this school. In order to ensure anonymity, data for items with fewer than ten responses are not reported. In these cases, a dash (-) indicates that there are insufficient responses to report at the school level.
To maintain the anonymity of survey participants, teacher/staff responses to demographic questions are grouped and presented at the local education authority (LEA) level and not reported at the school level. The demographic data for teachers/staff from district-authorized charter schools are reported with their districts. Demographic data for teachers/staff from state-operated schools and state-authorized charters are reported together. Responses to all other items are reported at the school level as the percentage and total number of teachers/staff who answered each item at this school, as well as statewide.
As noted in the introduction, this school’s Teacher/Staff Survey participation rate is 9.1%. The participation rate is the number of teachers/staff who responded to the survey as a percentage of the eligible teachers/staff at this school. The number of eligible teachers/staff come from one of two data sources. School principals were asked to provide the number of teachers and instructional staff. For those schools that provided the data, these numbers are used. For schools that did not provide this information, staffing data are provided by the Rhode Island Department of Education.
In some cases, a school did not participate in the Teacher/Staff Survey. In these instances, an exclamation mark (!) is used in the data tables to indicate that a school did not participate and only state level data are reported.
Go to Table of Contents
Drum Rock Early Childhood Center 33
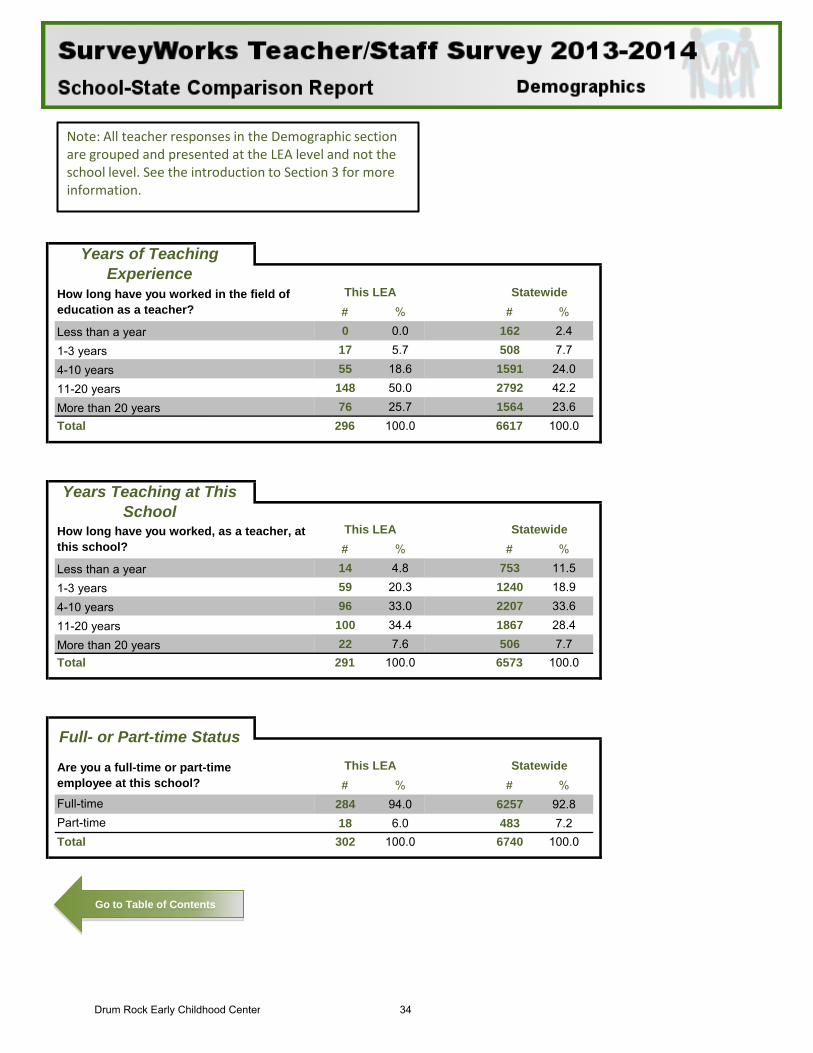
# % # %
Less than a year 0 0.0 162 2.4
1-3 years 17 5.7 508 7.7
4-10 years 55 18.6 1591 24.0
11-20 years 148 50.0 2792 42.2
More than 20 years 76 25.7 1564 23.6Total 296 100.0 6617 100.0
# % # %
Less than a year 14 4.8 753 11.5
1-3 years 59 20.3 1240 18.9
4-10 years 96 33.0 2207 33.6
11-20 years 100 34.4 1867 28.4
More than 20 years 22 7.6 506 7.7Total 291 100.0 6573 100.0
# % # %284 94.0 6257 92.818 6.0 483 7.2
Total 302 100.0 6740 100.0Part-time
Years of Teaching Experience
How long have you worked in the field of education as a teacher?
This LEA Statewide
Years Teaching at This School
How long have you worked, as a teacher, at this school?
This LEA Statewide
Full- or Part-time Status
Are you a full-time or part-time employee at this school?
This LEA Statewide
Full-time
Note: All teacher responses in the Demographic section are grouped and presented at the LEA level and not the school level. See the introduction to Section 3 for more information.
Go to Table of Contents
Drum Rock Early Childhood Center 34
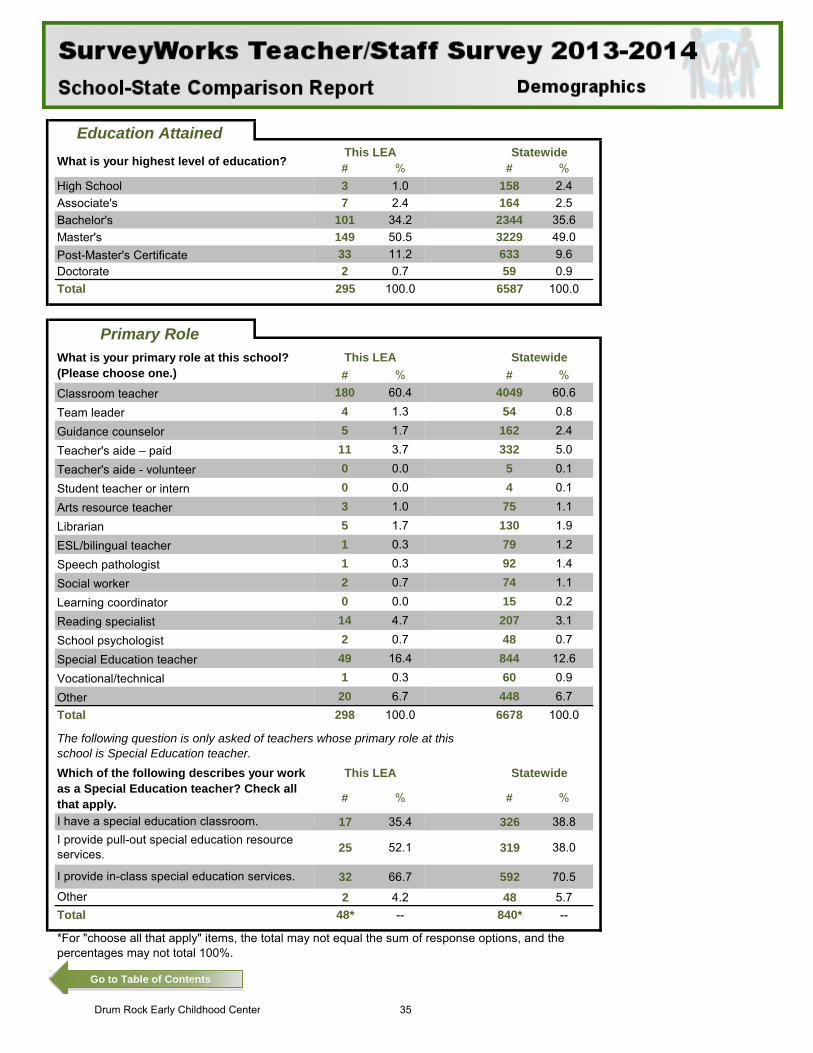
# % # %High School 3 1.0 158 2.4Associate's 7 2.4 164 2.5Bachelor's 101 34.2 2344 35.6Master's 149 50.5 3229 49.0Post-Master's Certificate 33 11.2 633 9.6Doctorate 2 0.7 59 0.9Total 295 100.0 6587 100.0
# % # %Classroom teacher 180 60.4 4049 60.6
Team leader 4 1.3 54 0.8
Guidance counselor 5 1.7 162 2.4
Teacher's aide – paid 11 3.7 332 5.0
Teacher's aide - volunteer 0 0.0 5 0.1
Student teacher or intern 0 0.0 4 0.1
Arts resource teacher 3 1.0 75 1.1
Librarian 5 1.7 130 1.9
ESL/bilingual teacher 1 0.3 79 1.2
Speech pathologist 1 0.3 92 1.4
Social worker 2 0.7 74 1.1
Learning coordinator 0 0.0 15 0.2
Reading specialist 14 4.7 207 3.1
School psychologist 2 0.7 48 0.7
Special Education teacher 49 16.4 844 12.6
Vocational/technical 1 0.3 60 0.9
Other 20 6.7 448 6.7Total 298 100.0 6678 100.0
# % # %
17 35.4 326 38.8
25 52.1 319 38.0
32 66.7 592 70.5
2 4.2 48 5.7Total 48* -- 840* --
I provide pull-out special education resource services.
Education AttainedWhat is your highest level of education?
This LEA Statewide
Primary RoleWhat is your primary role at this school? (Please choose one.)
This LEA Statewide
The following question is only asked of teachers whose primary role at this school is Special Education teacher.Which of the following describes your work as a Special Education teacher? Check all that apply.
This LEA Statewide
I have a special education classroom.
I provide in-class special education services.
Other
*For "choose all that apply" items, the total may not equal the sum of response options, and the percentages may not total 100%.
Go to Table of Contents
Drum Rock Early Childhood Center 35
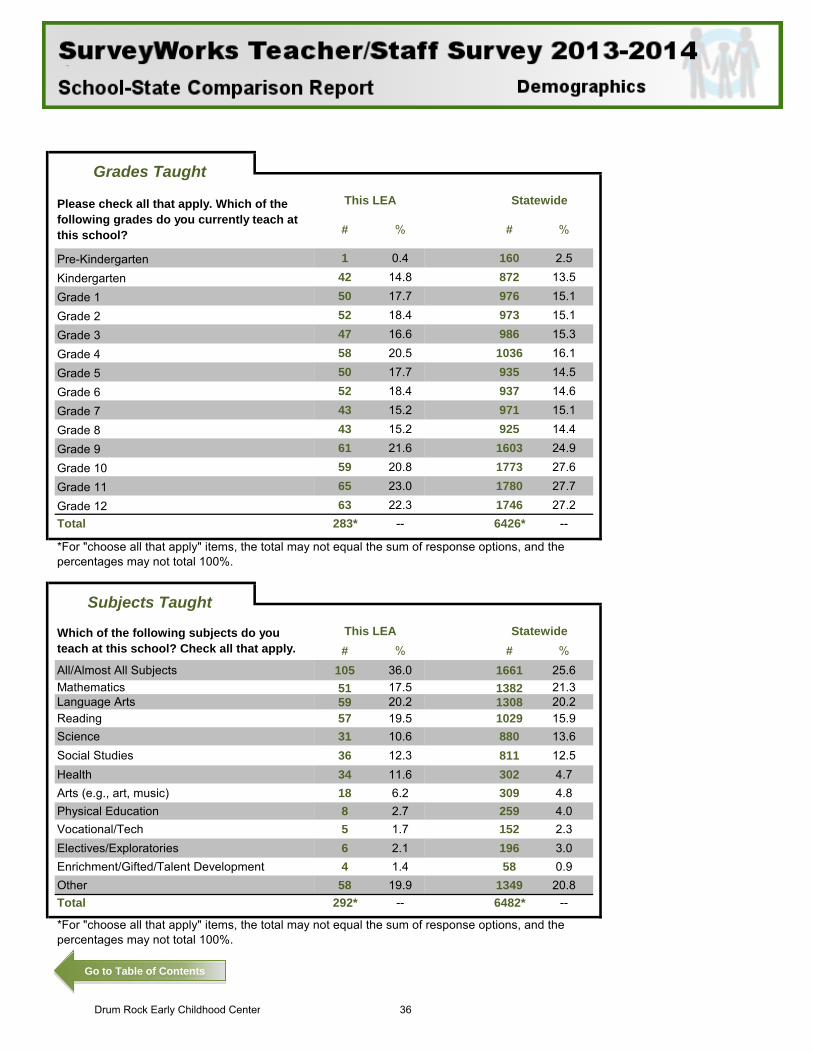
# % # %
Pre-Kindergarten 1 0.4 160 2.5
Kindergarten 42 14.8 872 13.5
Grade 1 50 17.7 976 15.1
Grade 2 52 18.4 973 15.1
Grade 3 47 16.6 986 15.3
Grade 4 58 20.5 1036 16.1
Grade 5 50 17.7 935 14.5
Grade 6 52 18.4 937 14.6
Grade 7 43 15.2 971 15.1
Grade 8 43 15.2 925 14.4
Grade 9 61 21.6 1603 24.9
Grade 10 59 20.8 1773 27.6
Grade 11 65 23.0 1780 27.7
Grade 12 63 22.3 1746 27.2Total 283* -- 6426* --
# % # %All/Almost All Subjects 105 36.0 1661 25.6Mathematics 51 17.5 1382 21.3Language Arts 59 20.2 1308 20.2Reading 57 19.5 1029 15.9Science 31 10.6 880 13.6Social Studies 36 12.3 811 12.5Health 34 11.6 302 4.7Arts (e.g., art, music) 18 6.2 309 4.8Physical Education 8 2.7 259 4.0Vocational/Tech 5 1.7 152 2.3Electives/Exploratories 6 2.1 196 3.0Enrichment/Gifted/Talent Development 4 1.4 58 0.9Other 58 19.9 1349 20.8Total 292* -- 6482* --
*For "choose all that apply" items, the total may not equal the sum of response options, and the percentages may not total 100%.
Grades Taught
Please check all that apply. Which of the following grades do you currently teach at this school?
This LEA Statewide
*For "choose all that apply" items, the total may not equal the sum of response options, and the percentages may not total 100%.
Subjects Taught
Which of the following subjects do you teach at this school? Check all that apply.
This LEA Statewide
Go to Table of Contents
Drum Rock Early Childhood Center 36
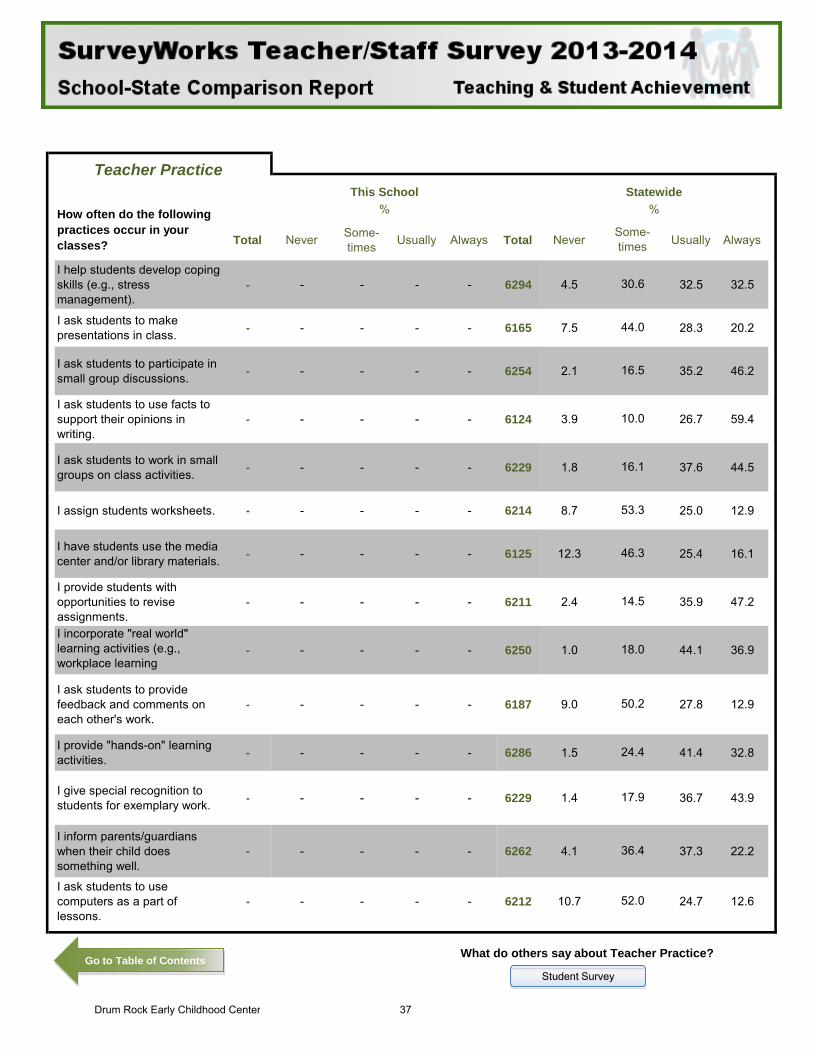
Total Never Some-times Usually Always Total Never Usually Always
I help students develop coping skills (e.g., stress management).
- - - - - 6294 4.5 32.5 32.5
I ask students to make presentations in class. - - - - - 6165 7.5 28.3 20.2
I ask students to participate in small group discussions. - - - - - 6254 2.1 35.2 46.2
I ask students to use facts to support their opinions in writing.
- - - - - 6124 3.9 26.7 59.4
I ask students to work in small groups on class activities. - - - - - 6229 1.8 37.6 44.5
I assign students worksheets. - - - - - 6214 8.7 25.0 12.9
I have students use the media center and/or library materials. - - - - - 6125 12.3 25.4 16.1
I provide students with opportunities to revise assignments.
- - - - - 6211 2.4 35.9 47.2
I incorporate "real world" learning activities (e.g., workplace learning
i i
- - - - - 6250 1.0 44.1 36.9
I ask students to provide feedback and comments on each other's work.
- - - - - 6187 9.0 27.8 12.9
I provide "hands-on" learning activities. - - - - - 6286 1.5 41.4 32.8
I give special recognition to students for exemplary work. - - - - - 6229 1.4 36.7 43.9
I inform parents/guardians when their child does something well.
- - - - - 6262 4.1 37.3 22.2
I ask students to use computers as a part of lessons.
- - - - - 6212 10.7 24.7 12.6
What do others say about Teacher Practice?
30.6
44.0
16.5
10.0
16.1
53.3
Teacher PracticeThis School Statewide
How often do the following practices occur in your classes?
% %
Some-times
50.2
52.0
46.3
14.5
18.0
24.4
17.9
36.4
Student Survey Go to Table of Contents
Drum Rock Early Childhood Center 37
%
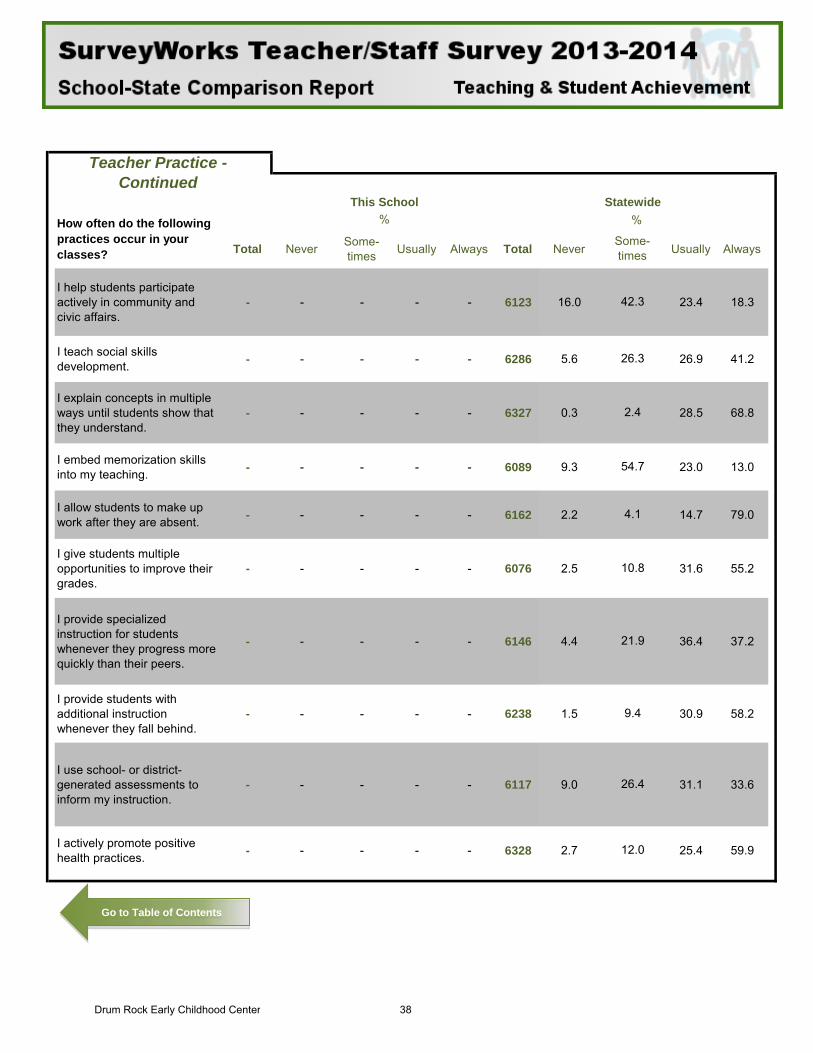
Total Never Some-times Usually Always Total Never Usually Always
I help students participate actively in community and civic affairs.
- - - - - 6123 16.0 23.4 18.3
I teach social skills development. - - - - - 6286 5.6 26.9 41.2
I explain concepts in multiple ways until students show that they understand.
- - - - - 6327 0.3 28.5 68.8
I embed memorization skills into my teaching. - - - - - 6089 9.3 23.0 13.0
I allow students to make up work after they are absent. - - - - - 6162 2.2 14.7 79.0
I give students multiple opportunities to improve their grades.
- - - - - 6076 2.5 31.6 55.2
I provide specialized instruction for students whenever they progress more quickly than their peers.
- - - - - 6146 4.4 36.4 37.2
I provide students with additional instruction whenever they fall behind.
- - - - - 6238 1.5 30.9 58.2
I use school- or district-generated assessments to inform my instruction.
- - - - - 6117 9.0 31.1 33.6
I actively promote positive health practices. - - - - - 6328 2.7 25.4 59.9
How often do the following practices occur in your classes?
%
Some-times
42.3
26.3
2.4
Teacher Practice - Continued
This School Statewide
12.0
54.7
4.1
10.8
21.9
9.4
26.4
Go to Table of Contents
Drum Rock Early Childhood Center 38
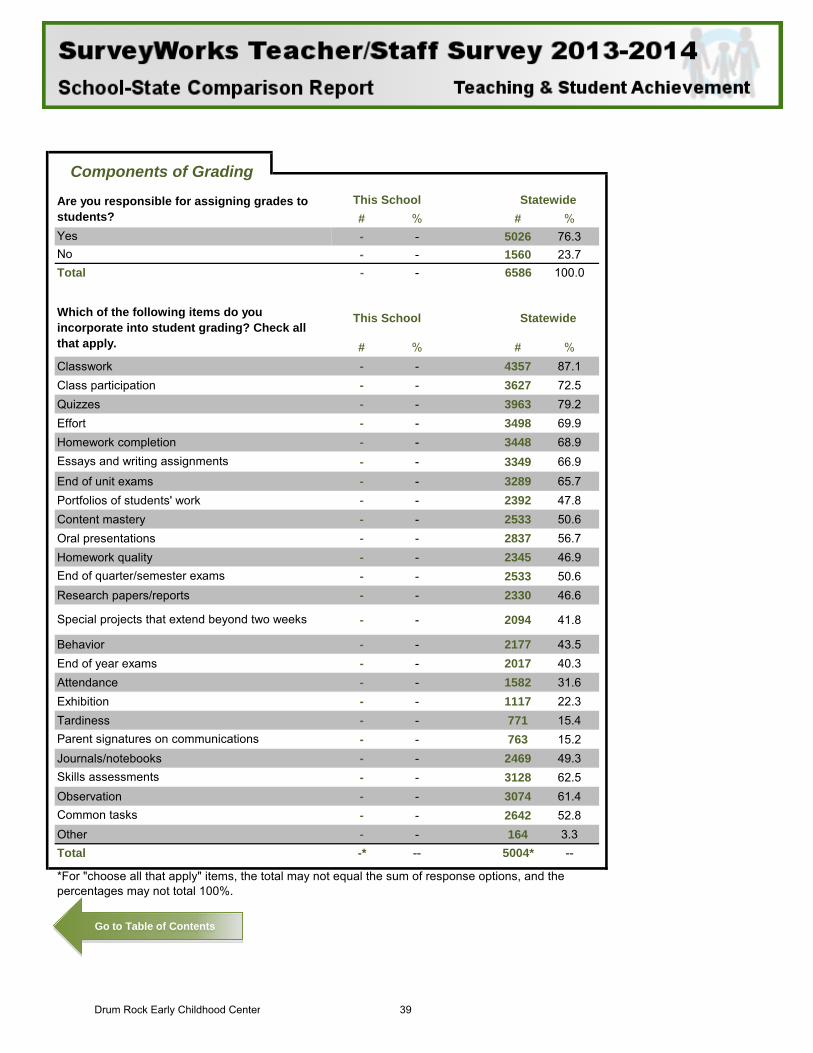
# % # %- - 5026 76.3- - 1560 23.7
Total - - 6586 100.0
# % # %Classwork - - 4357 87.1Class participation - - 3627 72.5Quizzes - - 3963 79.2Effort - - 3498 69.9Homework completion - - 3448 68.9
- - 3349 66.9End of unit exams - - 3289 65.7Portfolios of students' work - - 2392 47.8Content mastery - - 2533 50.6Oral presentations - - 2837 56.7Homework quality - - 2345 46.9
- - 2533 50.6Research papers/reports - - 2330 46.6
- - 2094 41.8
Behavior - - 2177 43.5End of year exams - - 2017 40.3Attendance - - 1582 31.6Exhibition - - 1117 22.3Tardiness - - 771 15.4
- - 763 15.2Journals/notebooks - - 2469 49.3
- - 3128 62.5Observation - - 3074 61.4
- - 2642 52.8Other - - 164 3.3Total -* -- 5004* --
Components of Grading
Are you responsible for assigning grades to students?
This School Statewide
Yes
Special projects that extend beyond two weeks
Parent signatures on communications
Skills assessments
Common tasks
*For "choose all that apply" items, the total may not equal the sum of response options, and the percentages may not total 100%.
No
Which of the following items do you incorporate into student grading? Check all that apply.
This School Statewide
Essays and writing assignments
End of quarter/semester exams
Go to Table of Contents
Drum Rock Early Childhood Center 39
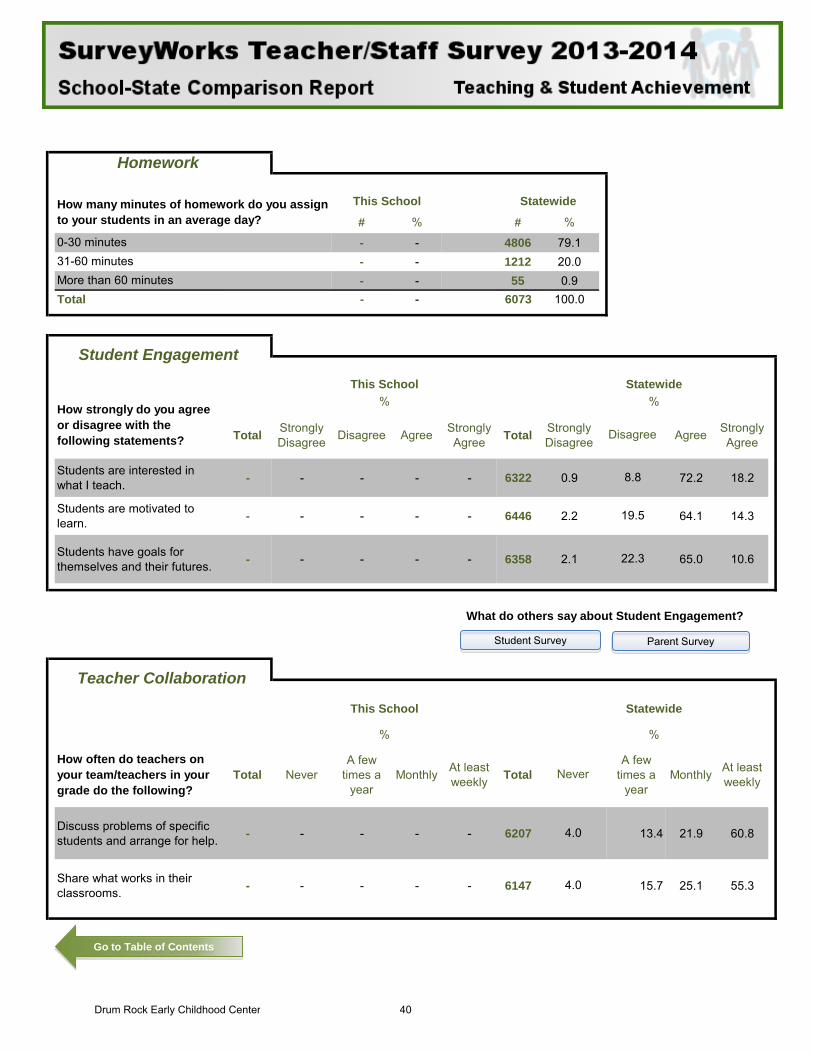
# % # %
- - 4806 79.1- - 1212 20.0- - 55 0.9
Total - - 6073 100.0
Total Strongly Disagree Disagree Agree Strongly
Agree Total Strongly Disagree Agree Strongly
Agree
Students are interested in what I teach. - - - - - 6322 0.9 72.2 18.2
Students are motivated to learn. - - - - - 6446 2.2 64.1 14.3
Students have goals for themselves and their futures. - - - - - 6358 2.1 65.0 10.6
How often do teachers on your team/teachers in your grade do the following?
Total NeverA few
times a year
Monthly At least weekly Total
A few times a
yearMonthly At least
weekly
Discuss problems of specific students and arrange for help. - - - - - 6207 13.4 21.9 60.8
Share what works in their classrooms. - - - - - 6147 15.7 25.1 55.3
Homework
How many minutes of homework do you assign to your students in an average day?
This School Statewide
0-30 minutes31-60 minutesMore than 60 minutes
22.3
What do others say about Student Engagement?
How strongly do you agree or disagree with the following statements?
% %
Disagree
8.8
19.5
Teacher Collaboration
This School Statewide
% %
Never
4.0
4.0
Student Engagement
This School Statewide
Parent Survey Student Survey
Go to Table of Contents
Drum Rock Early Childhood Center 40
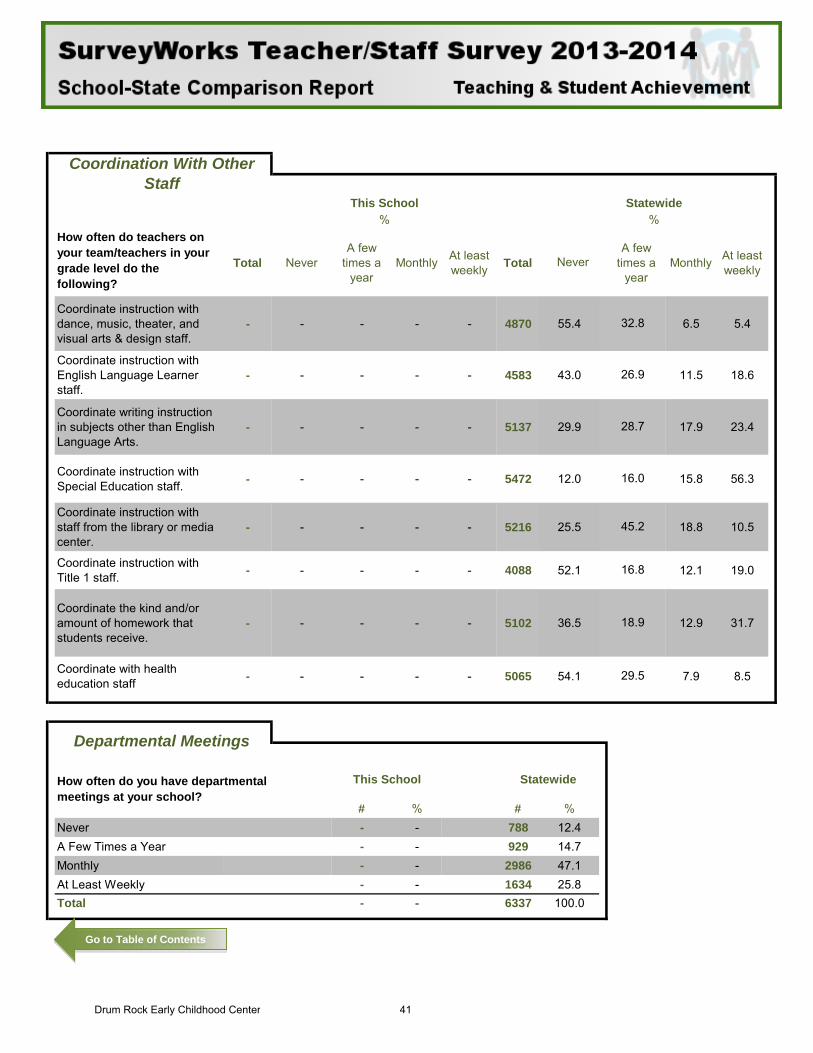
How often do teachers on your team/teachers in your grade level do the following?
Total NeverA few
times a year
Monthly At least weekly Total
A few times a
yearMonthly At least
weekly
Coordinate instruction with dance, music, theater, and visual arts & design staff.
- - - - - 4870 55.4 6.5 5.4
Coordinate instruction with English Language Learner staff.
- - - - - 4583 43.0 11.5 18.6
Coordinate writing instruction in subjects other than English Language Arts.
- - - - - 5137 29.9 17.9 23.4
Coordinate instruction with Special Education staff. - - - - - 5472 12.0 15.8 56.3
Coordinate instruction with staff from the library or media center.
- - - - - 5216 25.5 18.8 10.5
Coordinate instruction with Title 1 staff. - - - - - 4088 52.1 12.1 19.0
Coordinate the kind and/or amount of homework that students receive.
- - - - - 5102 36.5 12.9 31.7
Coordinate with health education staff - - - - - 5065 54.1 7.9 8.5
# % # %Never - - 788 12.4A Few Times a Year - - 929 14.7Monthly - - 2986 47.1At Least Weekly - - 1634 25.8Total - - 6337 100.0
Coordination With Other Staff
This School Statewide
16.0
45.2
16.8
18.9
29.5
% %
32.8
26.9
28.7
Never
Departmental Meetings
How often do you have departmental meetings at your school?
This School Statewide
Go to Table of Contents
Drum Rock Early Childhood Center 41
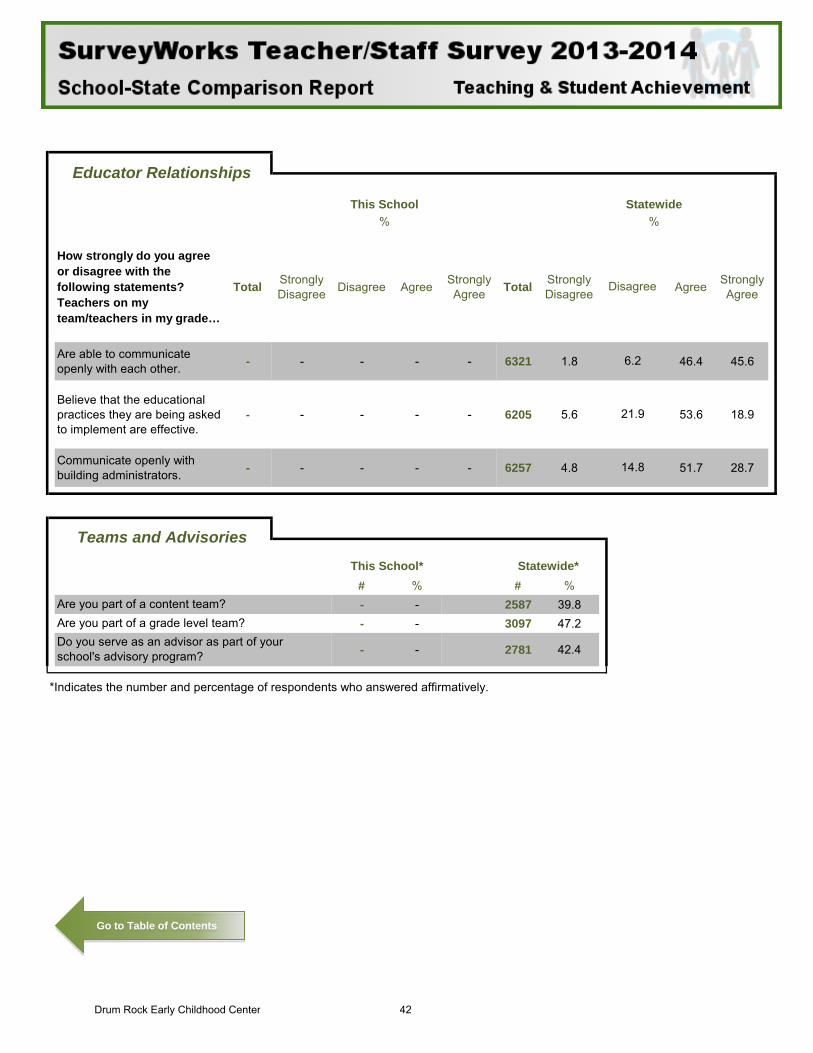
How strongly do you agree or disagree with the following statements? Teachers on my team/teachers in my grade…
Total Strongly Disagree Disagree Agree Strongly
Agree Total Strongly Disagree Agree Strongly
Agree
Are able to communicate openly with each other. - - - - - 6321 1.8 46.4 45.6
Believe that the educational practices they are being asked to implement are effective.
- - - - - 6205 5.6 53.6 18.9
Communicate openly with building administrators. - - - - - 6257 4.8 51.7 28.7
# % # %- - 2587 39.8- - 3097 47.2
- - 2781 42.4
% %
Disagree
6.2
21.9
14.8
Educator Relationships
This School Statewide
Do you serve as an advisor as part of your school's advisory program?
*Indicates the number and percentage of respondents who answered affirmatively.
Teams and AdvisoriesThis School* Statewide*
Are you part of a content team?Are you part of a grade level team?
Go to Table of Contents
Drum Rock Early Childhood Center 42
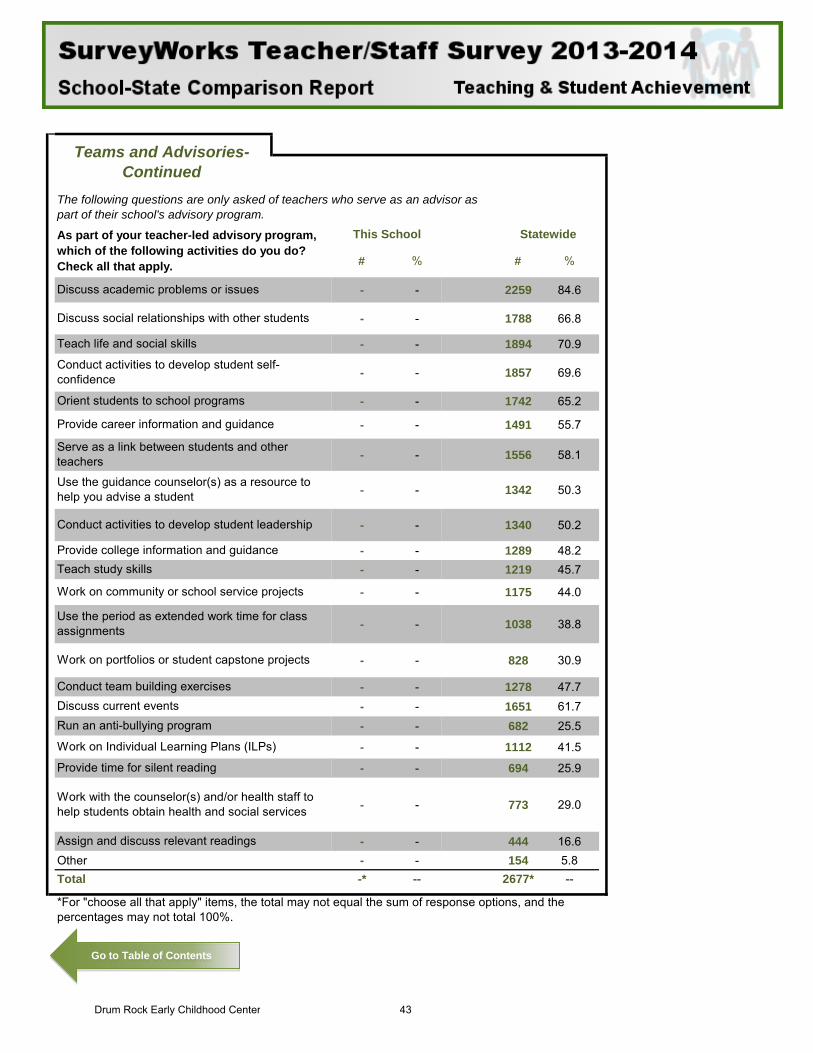
# % # %
- - 2259 84.6
- - 1788 66.8
- - 1894 70.9
- - 1857 69.6
- - 1742 65.2
- - 1491 55.7
- - 1556 58.1
- - 1342 50.3
- - 1340 50.2
- - 1289 48.2- - 1219 45.7
- - 1175 44.0
- - 1038 38.8
- - 828 30.9
- - 1278 47.7- - 1651 61.7- - 682 25.5
- - 1112 41.5
- - 694 25.9
- - 773 29.0
- - 444 16.6Other - - 154 5.8Total -* -- 2677* --
Provide career information and guidance
Teams and Advisories- Continued
The following questions are only asked of teachers who serve as an advisor as part of their school's advisory program.
As part of your teacher-led advisory program, which of the following activities do you do? Check all that apply.
This School Statewide
Provide time for silent reading
Work with the counselor(s) and/or health staff to help students obtain health and social services
Assign and discuss relevant readings
*For "choose all that apply" items, the total may not equal the sum of response options, and the percentages may not total 100%.
Use the period as extended work time for class assignments
Work on portfolios or student capstone projects
Conduct team building exercisesDiscuss current eventsRun an anti-bullying program
Work on Individual Learning Plans (ILPs)
Serve as a link between students and other teachers
Use the guidance counselor(s) as a resource to help you advise a student
Conduct activities to develop student leadership
Provide college information and guidanceTeach study skills
Work on community or school service projects
Discuss academic problems or issues
Discuss social relationships with other students
Teach life and social skills
Conduct activities to develop student self-confidence
Orient students to school programs
Go to Table of Contents
Drum Rock Early Childhood Center 43
Total Strongly Disagree Disagree Agree Strongly
Agree Total Strongly Disagree Disagree Agree Strongly
Agree
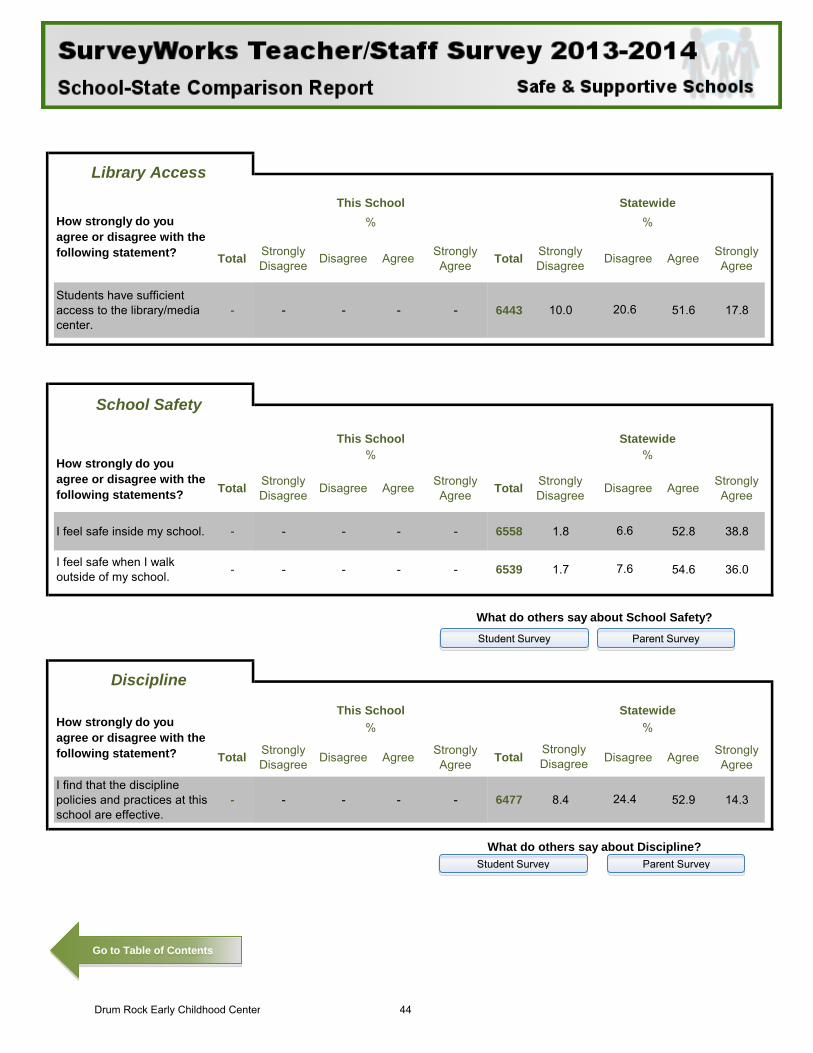
Students have sufficient access to the library/media center.
- - - - - 6443 10.0 51.6 17.8
Total Strongly Disagree Disagree Agree Strongly
Agree Total Strongly Disagree Disagree Agree Strongly
Agree
I feel safe inside my school. - - - - - 6558 1.8 52.8 38.8
I feel safe when I walk outside of my school. - - - - - 6539 1.7 54.6 36.0
Total Strongly Disagree Disagree Agree Strongly
Agree Total Disagree Agree Strongly Agree
I find that the discipline policies and practices at this school are effective.
- - - - - 6477 8.4 52.9 14.3
6.6
7.6
24.4
Library Access
How strongly do you agree or disagree with the following statement?
This School Statewide% %
What do others say about School Safety?
20.6
School Safety
This School Statewide
How strongly do you agree or disagree with the following statements?
% %
What do others say about Discipline?
Discipline
How strongly do you agree or disagree with the following statement?
This School Statewide% %
Strongly Disagree
Parent Survey Student Survey
Parent Survey Student Survey
Go to Table of Contents
Drum Rock Early Childhood Center 44
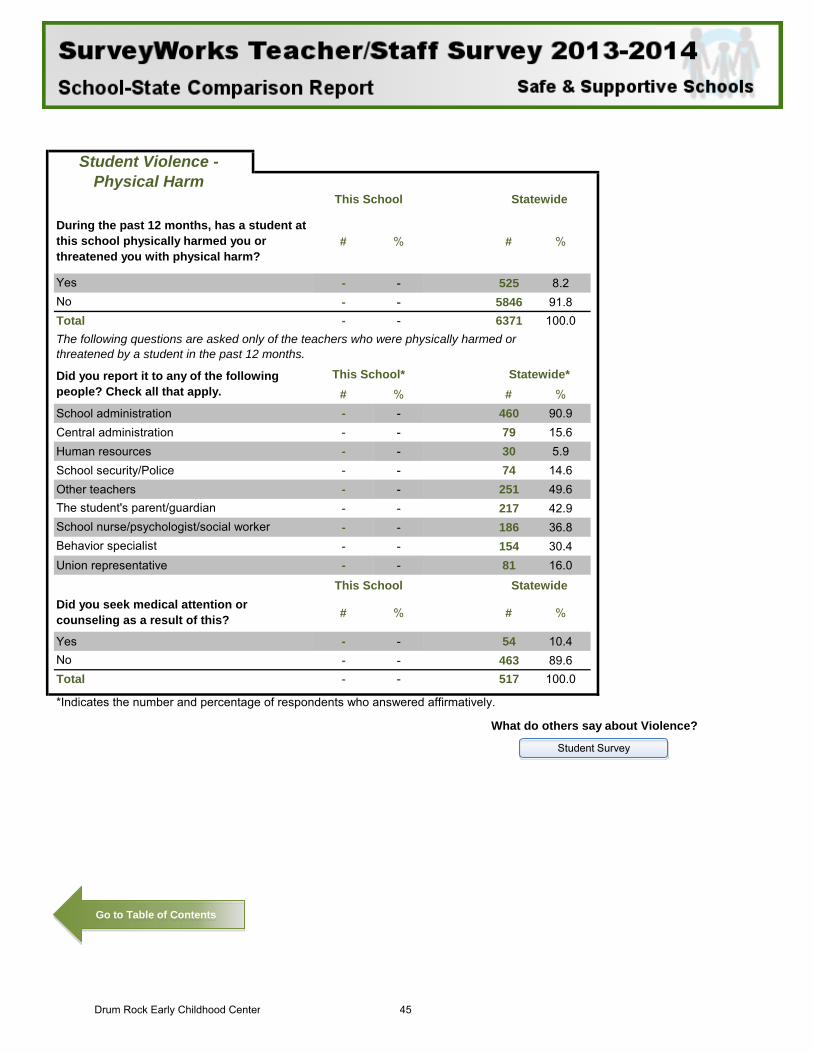
# % # %
- - 525 8.2- - 5846 91.8
Total - - 6371 100.0
# % # %School administration - - 460 90.9Central administration - - 79 15.6Human resources - - 30 5.9School security/Police - - 74 14.6Other teachers - - 251 49.6
- - 217 42.9- - 186 36.8- - 154 30.4
Union representative - - 81 16.0
# % # %
Yes - - 54 10.4- - 463 89.6
Total - - 517 100.0
Student Violence - Physical Harm
This School Statewide
The student's parent/guardian
StatewideDid you seek medical attention or counseling as a result of this?
During the past 12 months, has a student at this school physically harmed you or threatened you with physical harm?
YesNo
The following questions are asked only of the teachers who were physically harmed or threatened by a student in the past 12 months.
Did you report it to any of the following people? Check all that apply.
This School* Statewide*
No
*Indicates the number and percentage of respondents who answered affirmatively.
What do others say about Violence?
School nurse/psychologist/social workerBehavior specialist
This School
Student Survey
Go to Table of Contents
Drum Rock Early Childhood Center 45
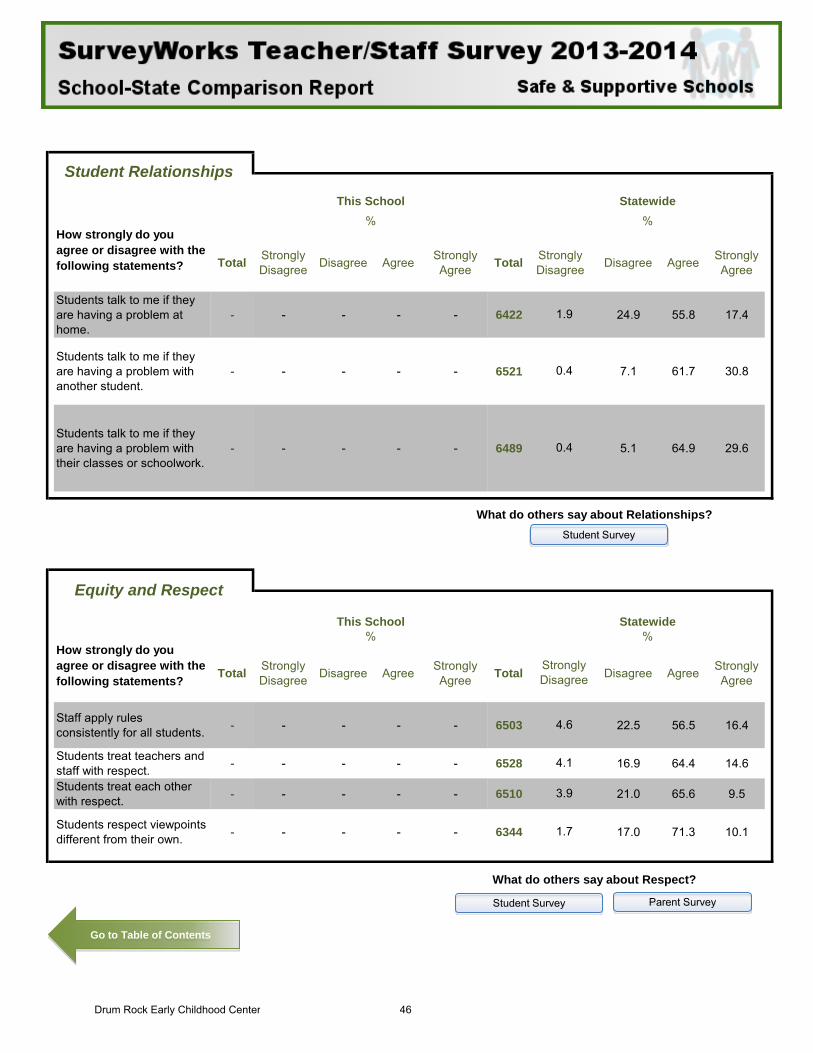
Total Strongly Disagree Disagree Agree Strongly
Agree Total Strongly Disagree Disagree Agree Strongly
Agree
Students talk to me if they are having a problem at home.
- - - - - 6422 24.9 55.8 17.4
Students talk to me if they are having a problem with another student.
- - - - - 6521 7.1 61.7 30.8
Students talk to me if they are having a problem with their classes or schoolwork.
- - - - - 6489 5.1 64.9 29.6
Total Strongly Disagree Disagree Agree Strongly
Agree Total Disagree Agree Strongly Agree
Staff apply rules consistently for all students. - - - - - 6503 22.5 56.5 16.4
Students treat teachers and staff with respect. - - - - - 6528 16.9 64.4 14.6
Students treat each other with respect. - - - - - 6510 21.0 65.6 9.5
Students respect viewpoints different from their own. - - - - - 6344 17.0 71.3 10.1
How strongly do you agree or disagree with the following statements?
% %
Strongly Disagree
Student Relationships
This School Statewide
How strongly do you agree or disagree with the following statements?
% %
4.6
4.1
1.9
0.4
0.4
What do others say about Relationships?
Equity and Respect
This School Statewide
3.9
1.7
What do others say about Respect?
Parent Survey Student Survey
Student Survey
Go to Table of Contents
Drum Rock Early Childhood Center 46
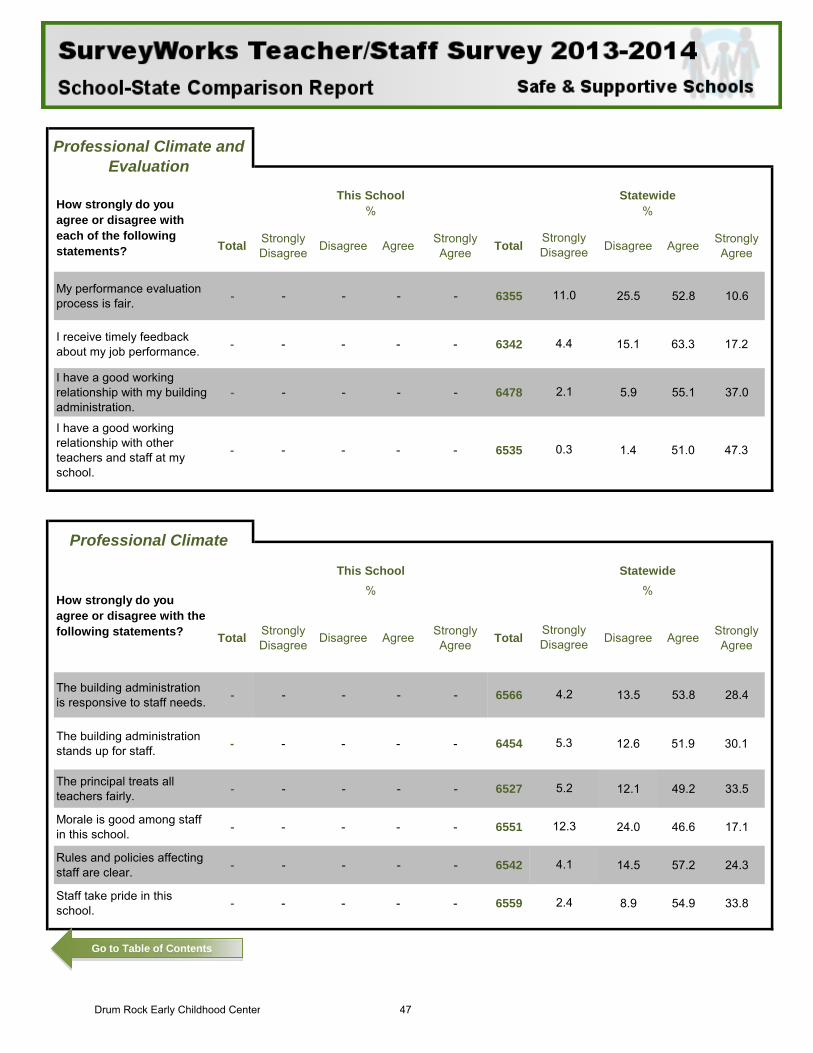
Total Strongly Disagree Disagree Agree Strongly
Agree Total Disagree Agree Strongly Agree
My performance evaluation process is fair. - - - - - 6355 25.5 52.8 10.6
I receive timely feedback about my job performance. - - - - - 6342 15.1 63.3 17.2
I have a good working relationship with my building administration.
- - - - - 6478 5.9 55.1 37.0
I have a good working relationship with other teachers and staff at my school.
- - - - - 6535 1.4 51.0 47.3
Total Strongly Disagree Disagree Agree Strongly
Agree Total Disagree Agree Strongly Agree
The building administration is responsive to staff needs. - - - - - 6566 13.5 53.8 28.4
The building administration stands up for staff. - - - - - 6454 12.6 51.9 30.1
The principal treats all teachers fairly. - - - - - 6527 12.1 49.2 33.5
Morale is good among staff in this school. - - - - - 6551 24.0 46.6 17.1
Rules and policies affecting staff are clear. - - - - - 6542 14.5 57.2 24.3
Staff take pride in this school. - - - - - 6559 8.9 54.9 33.8
Professional Climate
Professional Climate and Evaluation
How strongly do you agree or disagree with each of the following statements?
This School Statewide% %
Strongly Disagree
11.0
4.4
2.1
0.3
2.4
4.2
5.3
5.2
12.3
4.1
Strongly Disagree
%%StatewideThis School
How strongly do you agree or disagree with the following statements?
Go to Table of Contents
Drum Rock Early Childhood Center 47
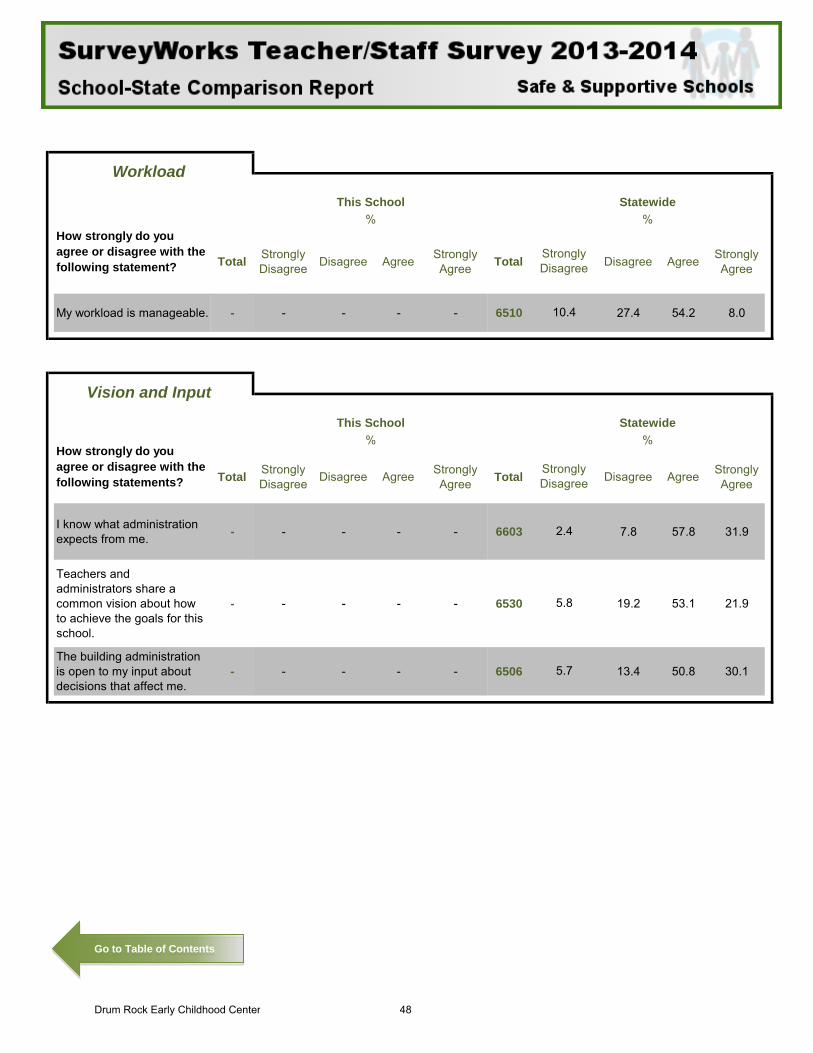
Total Strongly Disagree Disagree Agree Strongly
Agree Total Disagree Agree Strongly Agree
My workload is manageable. - - - - - 6510 27.4 54.2 8.0
Total Strongly Disagree Disagree Agree Strongly
Agree Total Disagree Agree Strongly Agree
I know what administration expects from me. - - - - - 6603 7.8 57.8 31.9
Teachers and administrators share a common vision about how to achieve the goals for this school.
- - - - - 6530 19.2 53.1 21.9
The building administration is open to my input about decisions that affect me.
- - - - - 6506 13.4 50.8 30.1
10.4
Workload
This School Statewide
How strongly do you agree or disagree with the following statement?
% %
Strongly Disagree
Vision and Input
This School Statewide
5.7
How strongly do you agree or disagree with the following statements?
% %
Strongly Disagree
2.4
5.8
Go to Table of Contents
Drum Rock Early Childhood Center 48
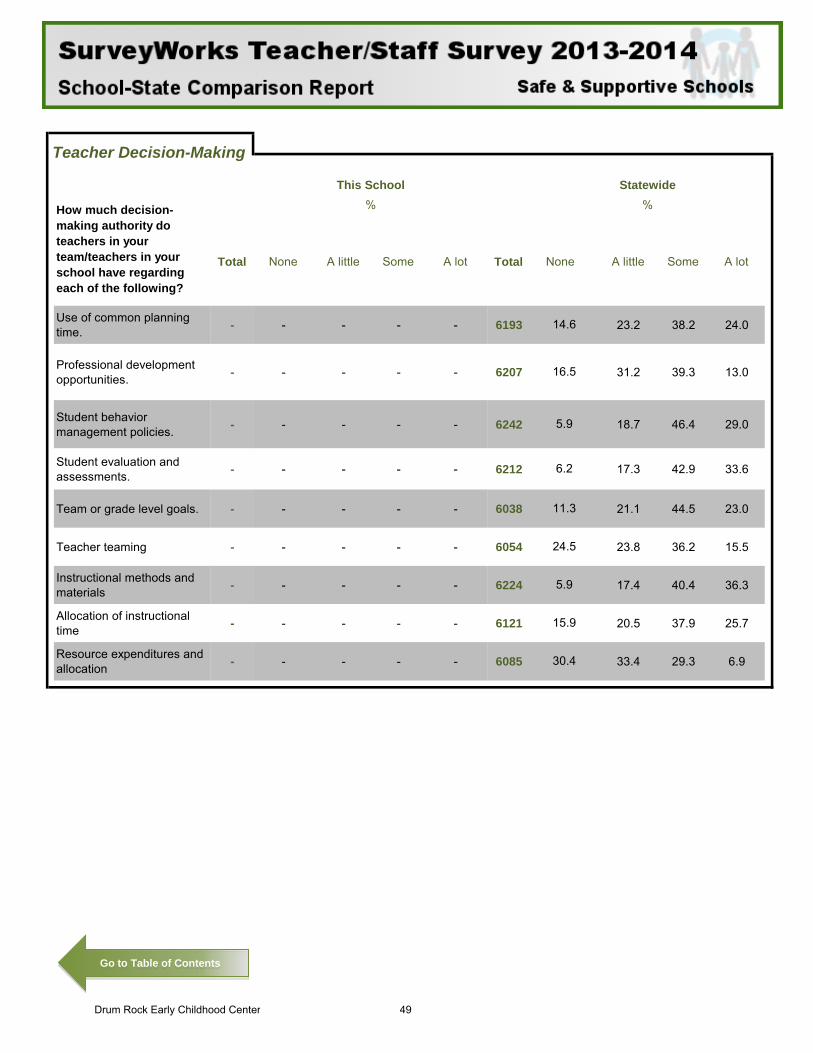
Total None A little Some A lot Total None A little Some A lot
Use of common planning time. - - - - - 6193 23.2 38.2 24.0
Professional development opportunities. - - - - - 6207 31.2 39.3 13.0
Student behavior management policies. - - - - - 6242 18.7 46.4 29.0
Student evaluation and assessments. - - - - - 6212 17.3 42.9 33.6
Team or grade level goals. - - - - - 6038 21.1 44.5 23.0
Teacher teaming - - - - - 6054 23.8 36.2 15.5
Instructional methods and materials - - - - - 6224 17.4 40.4 36.3
Allocation of instructional time - - - - - 6121 20.5 37.9 25.7
Resource expenditures and allocation - - - - - 6085 33.4 29.3 6.9
%
30.4
5.9
15.9
14.6
16.5
5.9
6.2
11.3
24.5
Teacher Decision-Making
This School Statewide
How much decision-making authority do teachers in your team/teachers in your school have regarding each of the following?
%
Go to Table of Contents
Drum Rock Early Childhood Center 49
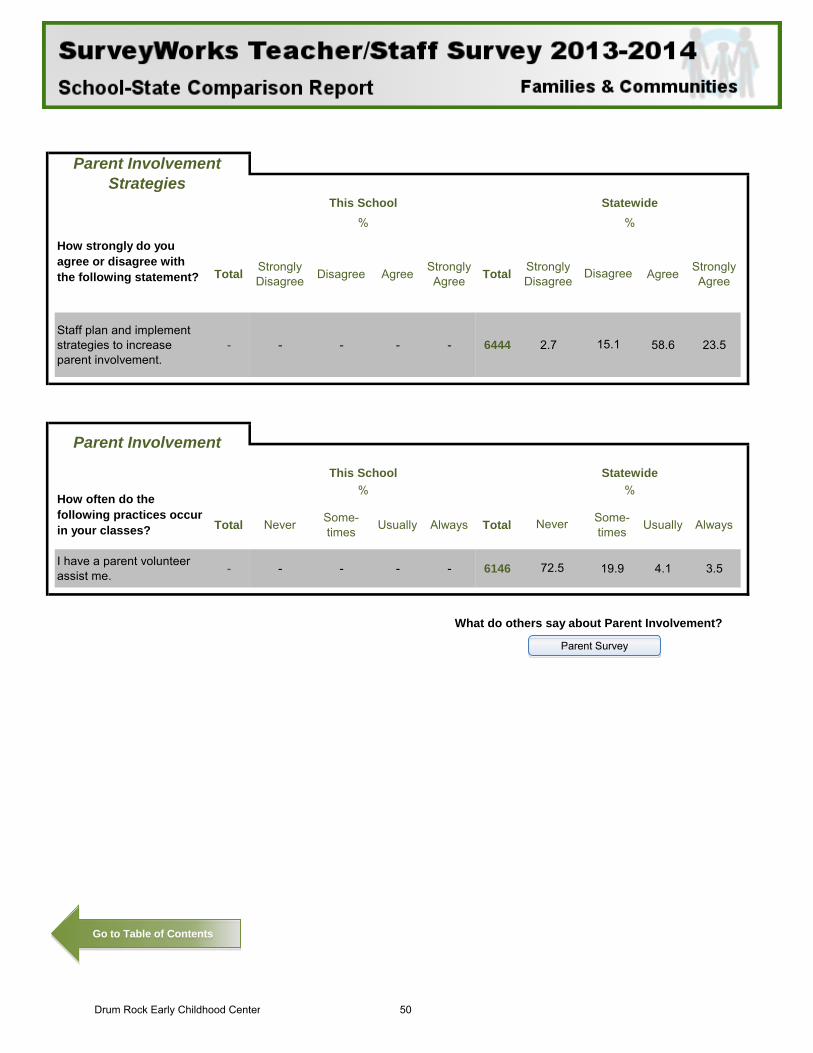
Total Strongly Disagree Disagree Agree Strongly
Agree Total Strongly Disagree Agree Strongly
Agree
Staff plan and implement strategies to increase parent involvement.
- - - - - 6444 2.7 58.6 23.5
Total Never Some-times Usually Always Total Some-
times Usually Always
I have a parent volunteer assist me. - - - - - 6146 19.9 4.1 3.5
15.1
72.5
Parent Involvement Strategies
This School Statewide
How strongly do you agree or disagree with the following statement?
% %
Disagree
Parent Involvement
This School Statewide
How often do the following practices occur in your classes?
% %
Never
What do others say about Parent Involvement?
Parent Survey
Go to Table of Contents
Drum Rock Early Childhood Center 50
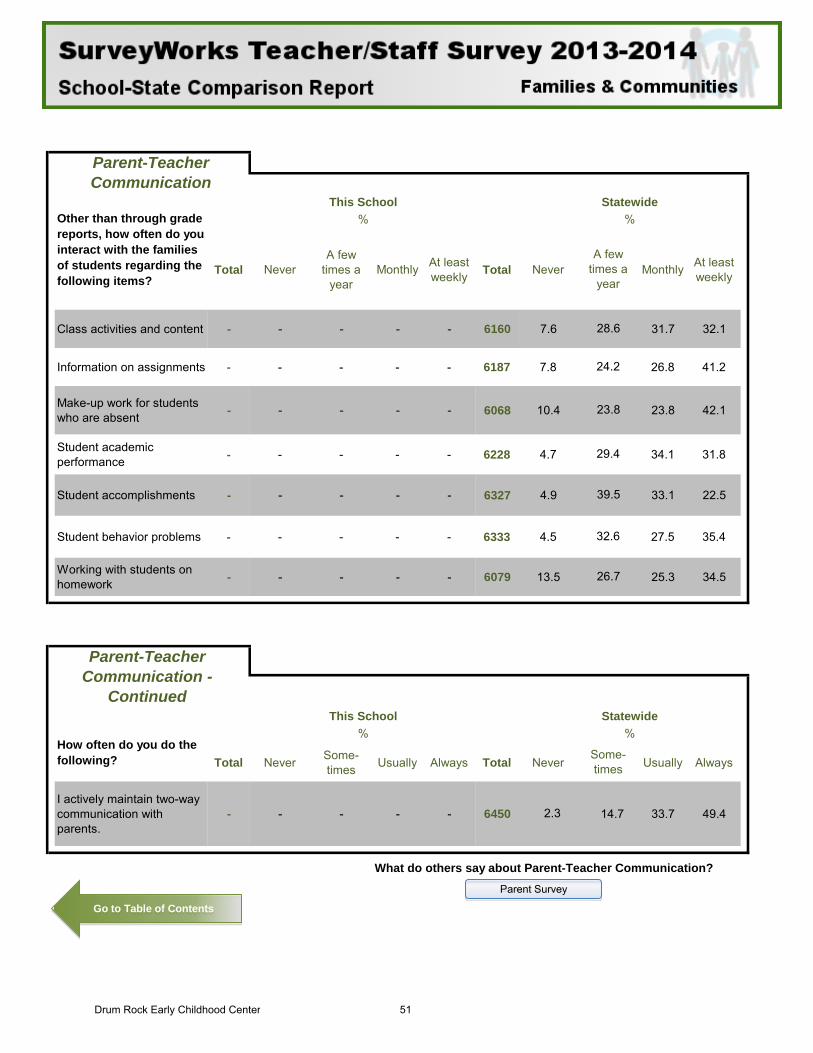
Total NeverA few
times a year
Monthly At least weekly Total Never Monthly At least
weekly
Class activities and content - - - - - 6160 7.6 31.7 32.1
Information on assignments - - - - - 6187 7.8 26.8 41.2
Make-up work for students who are absent - - - - - 6068 10.4 23.8 42.1
Student academic performance - - - - - 6228 4.7 34.1 31.8
Student accomplishments - - - - - 6327 4.9 33.1 22.5
Student behavior problems - - - - - 6333 4.5 27.5 35.4
Working with students on homework - - - - - 6079 13.5 25.3 34.5
Total Never Some-times Usually Always Total Never Usually Always
I actively maintain two-way communication with parents.
- - - - - 6450 14.7 33.7 49.4
What do others say about Parent-Teacher Communication?
32.6
Parent-Teacher Communication
This School StatewideOther than through grade reports, how often do you interact with the families of students regarding the following items?
% %
A few times a
year
28.6
24.2
23.8
29.4
39.5
26.7
Parent-Teacher Communication -
ContinuedThis School Statewide
How often do you do the following?
% %
Some- times
2.3
Parent Survey
Go to Table of Contents
Drum Rock Early Childhood Center 51
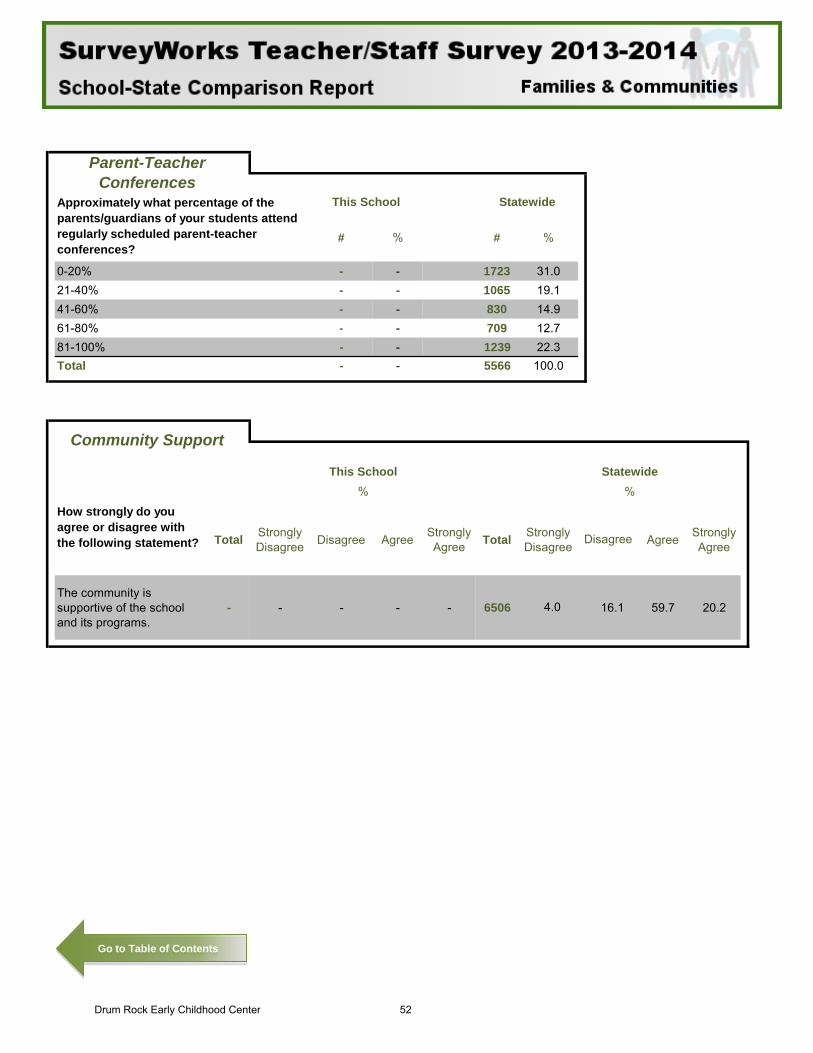
# % # %
0-20% - - 1723 31.021-40% - - 1065 19.141-60% - - 830 14.961-80% - - 709 12.781-100% - - 1239 22.3Total - - 5566 100.0
Total Strongly Disagree Disagree Agree Strongly
Agree Total Strongly Disagree Agree Strongly
Agree
The community is supportive of the school and its programs.
- - - - - 6506 16.1 59.7 20.2
Parent-Teacher Conferences
Approximately what percentage of the parents/guardians of your students attend regularly scheduled parent-teacher conferences?
This School Statewide
Community Support
This School Statewide
How strongly do you agree or disagree with the following statement?
% %
Disagree
4.0
Go to Table of Contents
Drum Rock Early Childhood Center 52
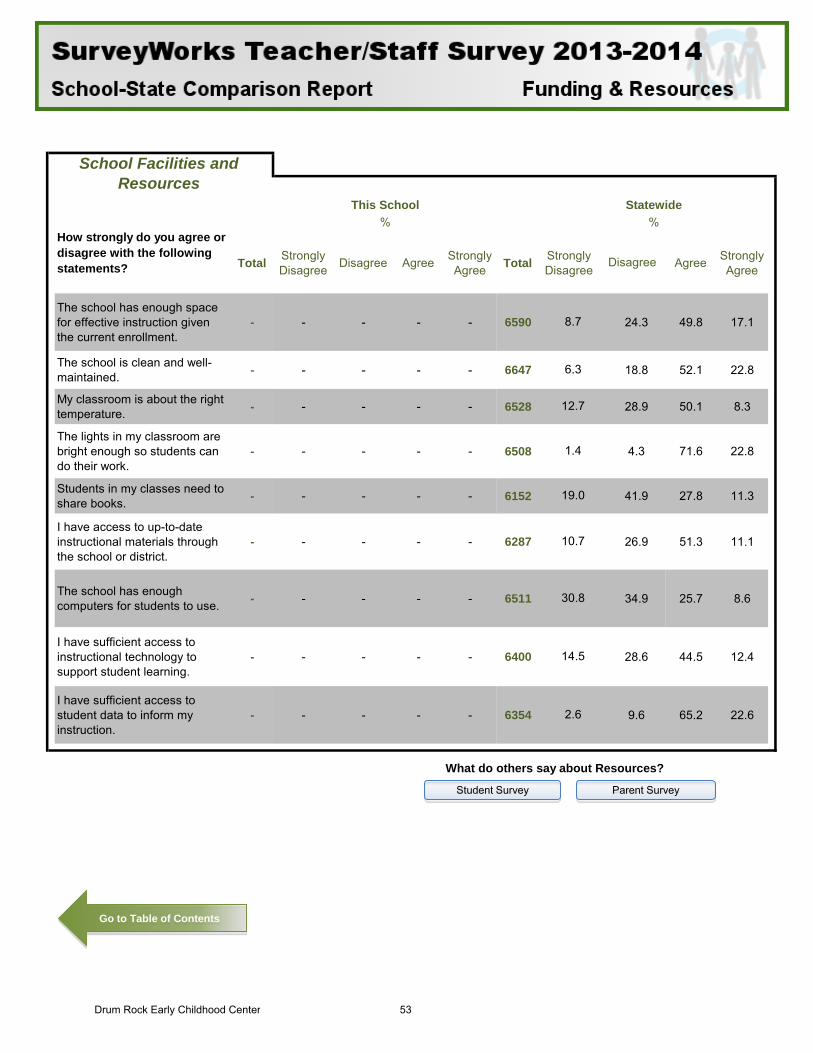
Total Strongly Disagree Disagree Agree Strongly
Agree Total Strongly Disagree Agree Strongly
Agree
The school has enough space for effective instruction given the current enrollment.
- - - - - 6590 24.3 49.8 17.1
The school is clean and well-maintained. - - - - - 6647 18.8 52.1 22.8
My classroom is about the right temperature. - - - - - 6528 28.9 50.1 8.3
The lights in my classroom are bright enough so students can do their work.
- - - - - 6508 4.3 71.6 22.8
Students in my classes need to share books. - - - - - 6152 41.9 27.8 11.3
I have access to up-to-date instructional materials through the school or district.
- - - - - 6287 26.9 51.3 11.1
The school has enough computers for students to use. - - - - - 6511 34.9 25.7 8.6
I have sufficient access to instructional technology to support student learning.
- - - - - 6400 28.6 44.5 12.4
I have sufficient access to student data to inform my instruction.
- - - - - 6354 9.6 65.2 22.6
School Facilities and Resources
This School Statewide
How strongly do you agree or disagree with the following statements?
% %
Disagree
8.7
6.3
12.7
1.4
19.0
10.7
30.8
14.5
2.6
What do others say about Resources?
Student Survey Parent Survey
Go to Table of Contents
Drum Rock Early Childhood Center 53
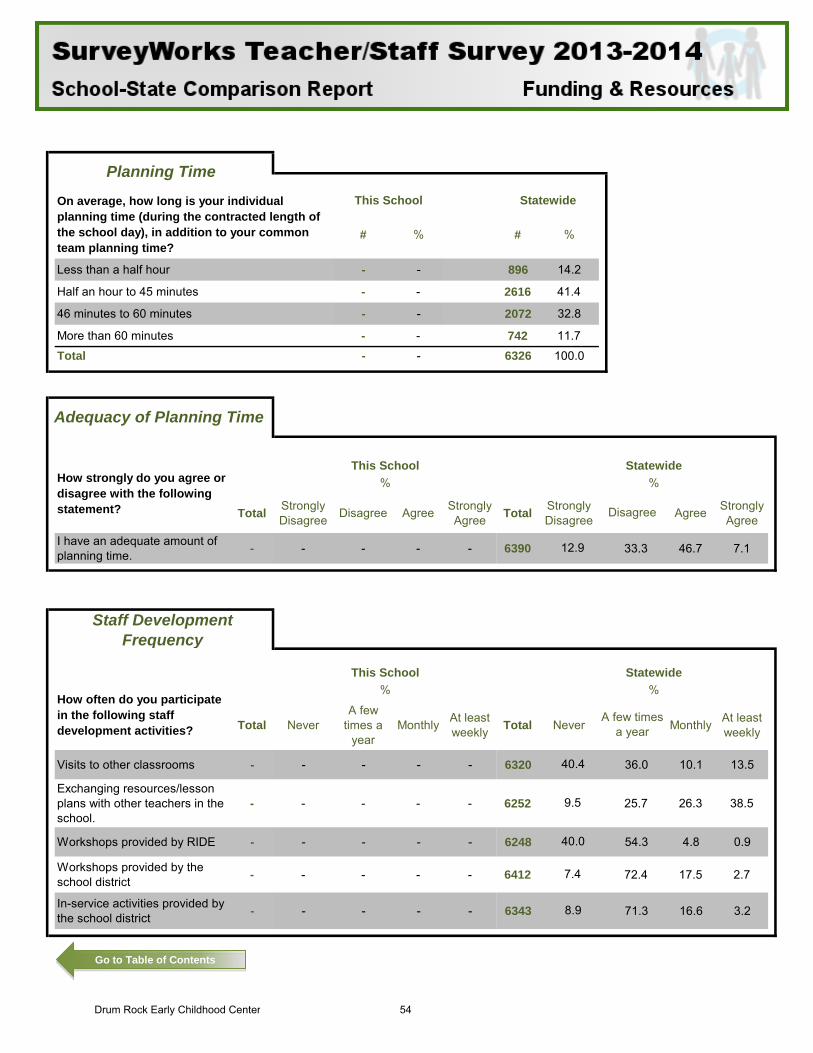
# % # %
Less than a half hour - - 896 14.2
Half an hour to 45 minutes - - 2616 41.4
46 minutes to 60 minutes - - 2072 32.8
More than 60 minutes - - 742 11.7
Total - - 6326 100.0
Total Strongly Disagree Disagree Agree Strongly
Agree Total Strongly Disagree Agree Strongly
Agree
I have an adequate amount of planning time. - - - - - 6390 33.3 46.7 7.1
Total NeverA few
times a year
Monthly At least weekly Total Never Monthly At least
weekly
Visits to other classrooms - - - - - 6320 36.0 10.1 13.5
Exchanging resources/lesson plans with other teachers in the school.
- - - - - 6252 25.7 26.3 38.5
Workshops provided by RIDE - - - - - 6248 54.3 4.8 0.9
Workshops provided by the school district - - - - - 6412 72.4 17.5 2.7
In-service activities provided by the school district - - - - - 6343 71.3 16.6 3.2
On average, how long is your individual planning time (during the contracted length of the school day), in addition to your common team planning time?
This School Statewide
Planning Time
Adequacy of Planning Time
How strongly do you agree or disagree with the following statement?
This School Statewide% %
Disagree
12.9
Staff Development Frequency
This School Statewide
How often do you participate in the following staff development activities?
% %
A few times a year
40.4
9.5
40.0
7.4
8.9
Go to Table of Contents
Drum Rock Early Childhood Center 54
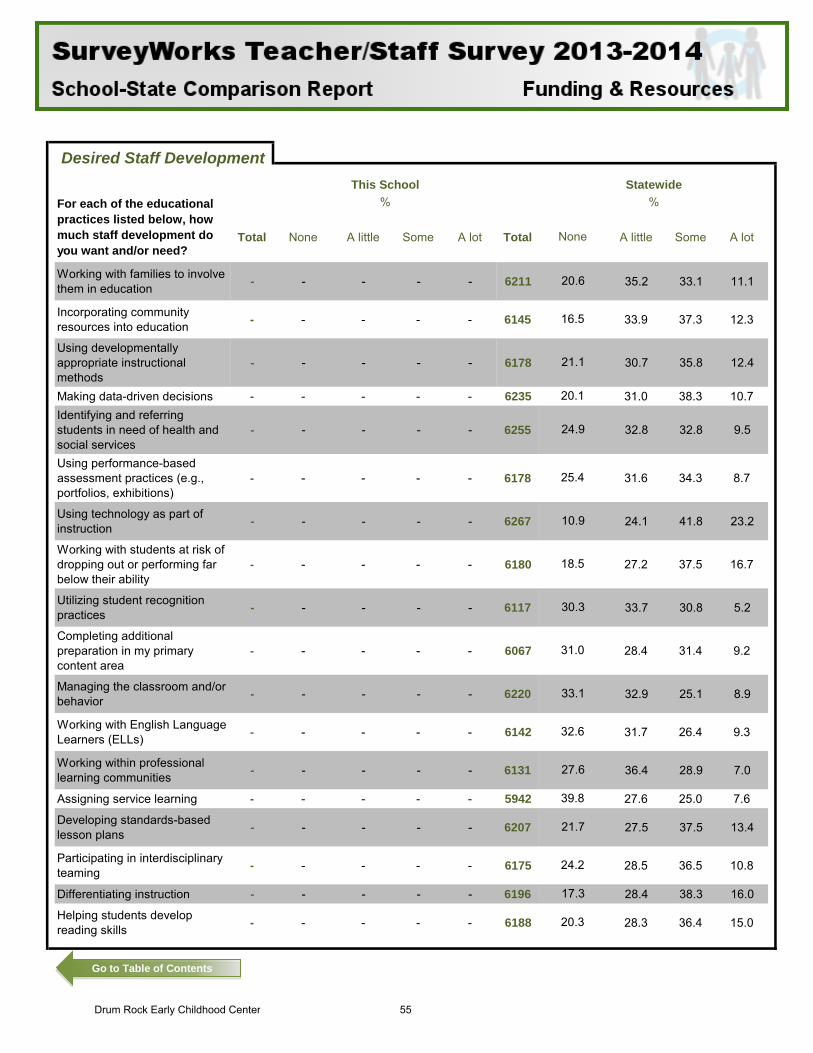
Total None A little Some A lot Total A little Some A lot
Working with families to involve them in education - - - - - 6211 35.2 33.1 11.1
Incorporating community resources into education - - - - - 6145 33.9 37.3 12.3
Using developmentally appropriate instructional methods
- - - - - 6178 30.7 35.8 12.4
Making data-driven decisions - - - - - 6235 31.0 38.3 10.7Identifying and referring students in need of health and social services
- - - - - 6255 32.8 32.8 9.5
Using performance-based assessment practices (e.g., portfolios, exhibitions)
- - - - - 6178 31.6 34.3 8.7
Using technology as part of instruction - - - - - 6267 24.1 41.8 23.2
Working with students at risk of dropping out or performing far below their ability
- - - - - 6180 27.2 37.5 16.7
Utilizing student recognition practices - - - - - 6117 33.7 30.8 5.2
Completing additional preparation in my primary content area
- - - - - 6067 28.4 31.4 9.2
Managing the classroom and/or behavior - - - - - 6220 32.9 25.1 8.9
Working with English Language Learners (ELLs) - - - - - 6142 31.7 26.4 9.3
Working within professional learning communities - - - - - 6131 36.4 28.9 7.0
Assigning service learning - - - - - 5942 27.6 25.0 7.6
Developing standards-based lesson plans - - - - - 6207 27.5 37.5 13.4
Participating in interdisciplinary teaming - - - - - 6175 28.5 36.5 10.8
Differentiating instruction - - - - - 6196 28.4 38.3 16.0
Helping students develop reading skills - - - - - 6188 28.3 36.4 15.0
25.4
Desired Staff DevelopmentThis School Statewide
For each of the educational practices listed below, how much staff development do you want and/or need?
% %
None
20.6
16.5
21.1
20.1
24.9
20.3
10.9
18.5
30.3
31.0
33.1
32.6
27.6
39.8
21.7
24.2
17.3
Go to Table of Contents
Drum Rock Early Childhood Center 55
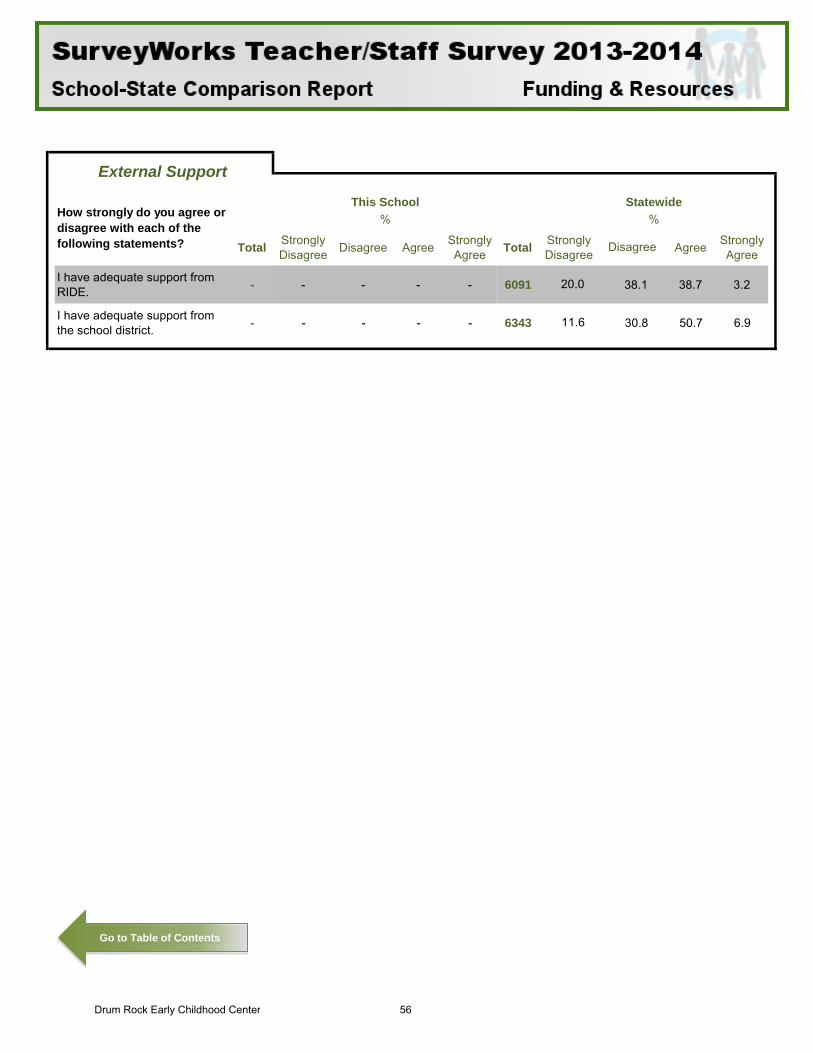
Total Strongly Disagree Disagree Agree Strongly
Agree Total Strongly Disagree Agree Strongly
Agree
I have adequate support from RIDE. - - - - - 6091 38.1 38.7 3.2
I have adequate support from the school district. - - - - - 6343 30.8 50.7 6.9
20.0
11.6
External Support
How strongly do you agree or disagree with each of the following statements?
This School Statewide% %
Disagree
Go to Table of Contents
Drum Rock Early Childhood Center 56