Embed Size (px)
Citation preview

www.druid.dk
DRUID Working Paper No. 05-11
The Structure of Cluster Knowledge Networks:
Uneven and Selective, not Pervasive and Collective
By
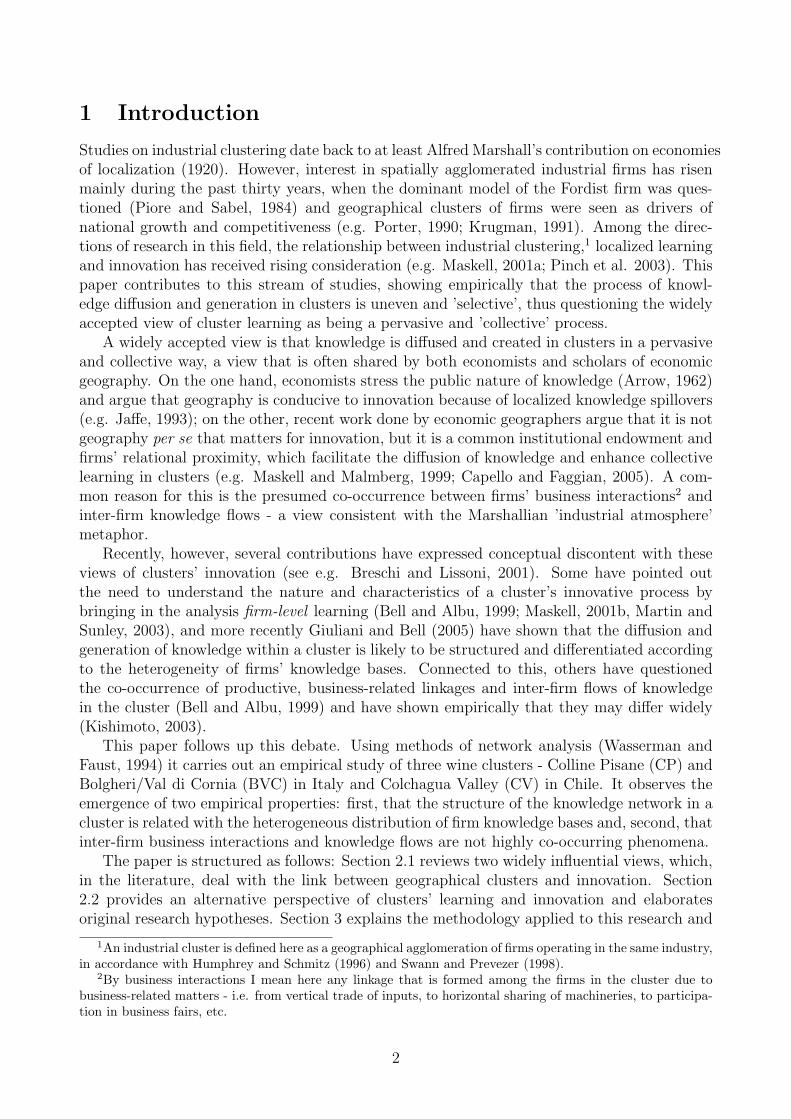
Elisa Giuliani
www.druid.dk
The Structure of Cluster Knowledge Networks: Uneven and Selective, not
Pervasive and Collective
Elisa Giuliani
SPRU, The Freeman Centre University of Sussex
Brighton, BN1 9QE, UK E-mail: [email protected]
July 23, 2005 Abstract: This study focuses on the relationship between industrial clustering and innovation. It contributes to this literature by showing two empirical properties of the cluster learning process: first, that the structure of the knowledge network in a cluster is related with the heterogeneous distribution of firm knowledge bases and, second, that business interactions and inter-firm knowledge flows are not highly co-occurring phenomena. In particular, this paper highlights how the heterogeneity of firms’ knowledge bases generates uneven distribution of knowledge and selective inter-firm learning. This study has been based on empirical evidence collected at firm level in three wine clusters in Italy and Chile. Methods of social network analysis have been applied to process the data. Key words: Industrial clusters, knowledge flows, business interactions, networks. JEL Codes: O18, O30
ISBN 87-7873-175-5

www.druid.dk
Acknowledgements: The author would like express her gratitude to Martin Bell, Angelo Secchi and Lionel Nesta for their helpful suggestions during the elaboration of this paper. Thanks go also to Cristian Diaz Bravo, Erica Nardi and Elena Bartoli for their support in data gathering. This paper has also benefited from comments and insights given by Nick von Tunzelmann, Hubert Schmitz, Stefano Breschi, Mari Sako and Michael Storper as well as by the participants of the Technology and Development seminar series at SPRU, University of Sussex. Usual disclaimers apply. Funding provided by the EU Marie Curie Program and the UK Economic Social Research Council (ESRC) is gratefully acknowledged.
1 Introduction
Studies on industrial clustering date back to at least Alfred Marshall’s contribution on economiesof localization (1920). However, interest in spatially agglomerated industrial firms has risenmainly during the past thirty years, when the dominant model of the Fordist firm was ques-tioned (Piore and Sabel, 1984) and geographical clusters of firms were seen as drivers ofnational growth and competitiveness (e.g. Porter, 1990; Krugman, 1991). Among the direc-tions of research in this field, the relationship between industrial clustering,1 localized learningand innovation has received rising consideration (e.g. Maskell, 2001a; Pinch et al. 2003). Thispaper contributes to this stream of studies, showing empirically that the process of knowl-edge diffusion and generation in clusters is uneven and ’selective’, thus questioning the widelyaccepted view of cluster learning as being a pervasive and ’collective’ process.
A widely accepted view is that knowledge is diffused and created in clusters in a pervasiveand collective way, a view that is often shared by both economists and scholars of economicgeography. On the one hand, economists stress the public nature of knowledge (Arrow, 1962)and argue that geography is conducive to innovation because of localized knowledge spillovers(e.g. Jaffe, 1993); on the other, recent work done by economic geographers argue that it is notgeography per se that matters for innovation, but it is a common institutional endowment andfirms’ relational proximity, which facilitate the diffusion of knowledge and enhance collectivelearning in clusters (e.g. Maskell and Malmberg, 1999; Capello and Faggian, 2005). A com-mon reason for this is the presumed co-occurrence between firms’ business interactions2 andinter-firm knowledge flows - a view consistent with the Marshallian ’industrial atmosphere’metaphor.
Recently, however, several contributions have expressed conceptual discontent with theseviews of clusters’ innovation (see e.g. Breschi and Lissoni, 2001). Some have pointed outthe need to understand the nature and characteristics of a cluster’s innovative process bybringing in the analysis firm-level learning (Bell and Albu, 1999; Maskell, 2001b, Martin andSunley, 2003), and more recently Giuliani and Bell (2005) have shown that the diffusion andgeneration of knowledge within a cluster is likely to be structured and differentiated accordingto the heterogeneity of firms’ knowledge bases. Connected to this, others have questionedthe co-occurrence of productive, business-related linkages and inter-firm flows of knowledgein the cluster (Bell and Albu, 1999) and have shown empirically that they may differ widely(Kishimoto, 2003).
This paper follows up this debate. Using methods of network analysis (Wasserman andFaust, 1994) it carries out an empirical study of three wine clusters - Colline Pisane (CP) andBolgheri/Val di Cornia (BVC) in Italy and Colchagua Valley (CV) in Chile. It observes theemergence of two empirical properties: first, that the structure of the knowledge network in acluster is related with the heterogeneous distribution of firm knowledge bases and, second, thatinter-firm business interactions and knowledge flows are not highly co-occurring phenomena.
The paper is structured as follows: Section 2.1 reviews two widely influential views, which,in the literature, deal with the link between geographical clusters and innovation. Section2.2 provides an alternative perspective of clusters’ learning and innovation and elaboratesoriginal research hypotheses. Section 3 explains the methodology applied to this research and
1An industrial cluster is defined here as a geographical agglomeration of firms operating in the same industry,in accordance with Humphrey and Schmitz (1996) and Swann and Prevezer (1998).
2By business interactions I mean here any linkage that is formed among the firms in the cluster due tobusiness-related matters - i.e. from vertical trade of inputs, to horizontal sharing of machineries, to participa-tion in business fairs, etc.
2
the operationalization of concepts. Section 4 presents the empirical evidence and Section 5discusses the results and briefly comments on possible policy implications.
2 Literature review and research hypotheses
2.1 The pervasive nature of knowledge diffusion in clusters
The process of knowledge diffusion and generation in clusters of firms has traditionally beenbased on differing re-interpretations of the Marshallian, externality-driven, world of industrialdistricts. Several empirical studies have elaborated on the Marshallian notion of knowledgespillovers.3 I will mention here two widely influential views: (i) the economists’ perspective on’localized knowledge spillovers’ and (ii) the economic geographers’ view of cluster ’collectivelearning’.
The economists’ view is that knowledge spillovers, which are by definition a public good(Arrow, 1962), tend to be highly localized (Jaffe, 1989; Jaffe et al., 1993), a property thatconceptually links geography and innovation. Within this stream of studies, robust empiricalevidence has shown that a relationship exists between spatial clustering, knowledge spillovers,and firms’ innovative output (e.g. Audretsch and Feldman, 1996; Baptista, 2000). Thisempirical evidence has led scholars and policy makers to believe that geography matters forinnovation and for competitiveness (e.g. OECD, 2001). As an example, in his work onindustrial clusters and nations’ competitive advantage, Porter (1990) connects the processesof learning and innovation in clusters to the ’Marshallian atmosphere’ concept, stating that “the information flow, visibility, and mutual reinforcement within such a locale give meaningto Alfred Marshall’s insightful observation that in some places an industry is ‘in the air”’ (p.156). He notes in particular that “more important, however, is the influence of geographicconcentration on improvement and innovation” (p. 157), since “proximity increases the speedof information flow within the national industry and the rate at which innovations diffuse.”(p. 157).
Within the economics literature, however, the mechanisms by which geographic proximityis likely to generate innovation are not fully explored (Feldman, 1999; Anselin et al., 2000) andwhat tends to predominate is the conception of knowledge as a public good, which spreadspervasively within a spatially-bounded area - as in the case of a cluster. This limitation maywell be due to the inherent ambiguity of the concept of localized knowledge spillovers (Krug-man, 1991), which has received poor analytical treatment and it is to date considered by manyas a ’black box’ (Breschi and Lissoni, 2001).
Economic geographers have made attempts to open up this black box through a vast arrayof qualitative studies adopting multidisciplinary methods of analysis. They have now agreedthat geographic proximity per se is not sufficient to generate learning and that economic spaceneeds other forms of proximity to explain innovation (Boschma, 2005). Among these, a greatemphasis is given to the role of social and relational proximity (e.g. Maskell and Malmberg,1999; Amin and Cohendet, 2004). Industrial clusters, being a spatially localized set of eco-nomic activities, are in fact envisaged as ’embedded’ economies (Granovetter, 1985) wheresocial relationships, such as friendship and kinship, are entangled with business ones. Morespecifically, social proximity is believed to favour the formation of relational capital, defined
3Marshall described the industrial district as a place where ”mysteries of trade become no mysteries; butare as it were in the air.” (p. 225)
3
as a sort of productive ’thickening’ based on market and cooperative inter-firm relationships(Scott, 1998). The relational capital, favouring the interaction of productive agents and thediffusion of tacit knowledge (Howells, 2002), is finally said to be the ’substratum’ of collectivelearning (Capello and Faggian, 2005).
Economic geographers appear to have a more powerful interpretative framework to un-derstand the mechanisms that link geography and innovation, if compared to economists’idea of localized knowledge spillovers.4 The geographers’ concept of collective learning differsfrom that of localized knowledge spillovers, since it more explicitly entails an interactive andcumulative effort by co-localized firms. As an example, Keeble and Wilkinson (1999) definecollective learning in regions as “ the creation and further development of a base of commonand shared knowledge among individuals making up a productive system which allows themto co-ordinate their actions in the resolution of the technological and organizational problemsthey confront ” (p. 296). In this literature, thus, collective learning processes are not merely aneffect of firms’ geographical co-localization but they are tied to a given ”territory” (Camagni,2002; Crevoisier, 2004) in which firms and people share common cultural values. Within this“territory”, several “meso-level” mechanisms are envisaged as favouring inter-firm diffusion ofknowledge and collective learning, among them: the turn-over of skilled labour, the intenseclient-supplier interactions, and the proliferation of spin-off firms. Finally, the combinationof all these mechanisms result in unstructured and diffuse local interactions, consistent withMalmberg (2003) who mentions that “ local interactions are characterized not just by beingunstructured and unplanned, but also relatively broad and diffuse, sometimes unwanted andoften seemingly of little immediate use.” (p. 157). According to this view, the diffuse localinteractions generate a learning environment where local knowledge, which is here conceivedas an inherently private good, is shared through the short geographical and relational dis-tance, thus becoming available as a public or a club good (Lawson and Lorenz, 1999). Hence,it should be noted that the essential characteristic of collective learning is that it still has apublic dimension. As Capello (1999) put it:“ the mechanisms for the spatial transfer of knowl-edge are social because new knowledge is transferred to other agents, whatever the will of theoriginal inventor, thanks to common technological, organizational and institutional routinesand behaviours which facilitate the sharing of information and know-how” (p. 356).Put to the extreme, because of the centrality given to the public nature of knowledge eitherwithin a spatially or a relationally bounded area, both economists and economic geographers’views seem consistent with the Marshallian, externality-driven interpretation of clusters’ learn-ing and innovation. Recently, however, several contributions have expressed their discontentto this interpretation. These are elaborated and discussed in the following section.
2.2 Alternative perspectives and hypotheses of research
An alternative perspective to those discussed in the previous section, comes from other scholarswho have recently expressed the need to include firm-level learning into the analysis of clusters’innovation (e.g. Bell and Albu, 1999; Maskell, 2001b) with the objective of understanding howfirm-level and cluster-level learning processes interact. In this direction, Martin and Sunley(2003) argue that:
4On the interaction between geographical economics and economic geography see Martin and Sunley (1998).
4
‘The cluster literature’ lacks any serious analysis or theory of the internal organizationof business enterprises (Best and Forrant, 1996). Instead it emphasizes the importanceof factors external to firms and somehow residing in the local environment. In too manyaccounts local ’territorial learning’ is privileged, yet what this process actually is remainsambiguous and its interactions with firm-based learning are left completely unexamined(Hudson, 1999). (p. 17)
Using the expression ’territorial learning’, Martin and Sunley (2003) clearly refer here tothe ’collective learning’ process occurring at the cluster level (cf. Martin and Sunley, 2003, p.17) and stress the need to understand how such a process interacts with firm-level learning.I propose here a conceptual framework that allows this interaction to be explored. Startingfrom Nelson and Winter’s (1982) evolutionary theory of the firm, I argue that firms in thecluster are likely to be characterized by heterogeneous knowledge bases. By knowledge base Imean here the ”set of information inputs, knowledge and capabilities that inventors draw onwhen looking for innovative solutions.” (Dosi, 1988, p. 1126) Knowledge is seen as residing infirms’ skilled knowledge workers, who embody tacit capabilities, and at the same time, it is notmerely the sum of each individual’s knowledge, since it resides in the organizational memoryof the firm. As Nelson and Winter (1982) put it ”[t]he possession of technical ’knowledge’ isan attribute of the firm as a whole, as an organized entity, and it is not reducible to what anysingle individual knows, or even to any simple aggregation of the various competences andcapabilities of all the various individuals, equipments, and installations of the firm.” (Nelsonand Winter, 1982, p. 63) The knowledge base is moreover considered here as the result ofa process of cumulative learning, which is inherently imperfect, complex and path-dependent(Dosi, 1997) and which delivers persistent heterogeneity between the firms in the economicsystem and, understandably in a cluster. Thus the question arises, how does the heterogeneityin firm knowledge bases relate with the way knowledge is diffused among firms in the cluster,and hence with the structural characteristics of the cluster knowledge network?
An argument here is that when firms seek advice on specific technical problems, for whichthey have no in-house solution, they target and select those firms, which are most likely tooffer a better solution to the problem (von Hippel, 1987; Schrader, 1991). Reasonably enough,since networking is a time consuming and costly process, one should not expect firms to engagein inter-firm learning just randomly. Hence, it is firms with stronger knowledge bases that arelikely to be perceived by other cluster firms as ’technological leaders’ in the local area, andthat are sought out for technical advice more often than firms with weaker knowledge bases.Likewise, firms will ask for technical advice when they know that they will be able to absorbthe received knowledge (Carter, 1989). This means that firms’ relative cognitive proximity(Cohen and Levinthal, 1990; Lane and Lubatkin, 1998) is likely to affect the way in whichknowledge is diffused within clusters. The implication of this argument is that one shouldtherefore not expect knowledge diffusion in clusters to be simply collective, but rather, to bestructured by the relative distance of firms’ knowledge bases (Giuliani and Bell, 2005). Thefirst hypothesis is therefore elaborated as follows:
HP 1: The structure of the knowledge network is related with the heterogene-
ity of firm knowledge bases in the cluster
This argument therefore provides a specific rationale for the structural characteristics ofthe knowledge network in clusters. Pushing the argument further, one may question the roleplayed by the relational proximity of firms, discussed in Section 2.1, in the formation of knowl-edge linkages. To what extent does relational proximity matter for the transfer of inter-firmknowledge? One form of relational proximity is represented by e.g. productive linkages -
5
i.e. the trade of goods, services and inputs - formed at the horizontal and vertical level inthe cluster. As mentioned in the introduction, insights into how productive linkages interactwith the knowledge system have been recently provided by cluster scholars in the literatureabout developing countries. Bell and Albu (1999) have argued that knowledge systems arenot identical to production systems and have stressed that, although they may interact witheach other, their interaction is highly variable and poorly understood. Indeed, recent empiri-cal studies have thrown light on the interplay between these two systems (Nadvi and Halder,2002; Kishimoto, 2003) showing that they may diverge and involve different key actors, sothat they should not be considered highly co-occurring phenomena. In this paper, I definebusiness interactions not merely as the trade of goods or inputs but, broadly, as any interactionthat occurs among firms for any matter related to their business. Thus, business interactionsmay include the trade of goods, as well as the transfer of information. They are therefore areasonable approximation of firms’ relational proximity. The question here is to what extentone should expect a substantial overlapping between the overall business interactions, as theyhave been defined here, and the inter-firm diffusion of knowledge.
In exploring this question, I adopt two positions. On the one hand, I am ’conservative’ andI retain the assumption that business interactions occur in the ’Marshallian’ way, thus beingrelatively pervasive in the cluster - consistent with Pyke at al. (1990) and Malmberg (2003),among others. On the other, I provide an interpretation of the knowledge flows in the clusteras being structured by the knowledge bases of firms - consistent with Hypothesis 1. Followingthis, two hypotheses have been developed, which are formulated below: the first one is thatsince business interactions and knowledge flows are driven by differing underlying rationales- the ’Marshallian’ on the one hand, and the ’evolutionary’ on the other - the network ofbusiness interactions will structurally differ from the network of knowledge. However, while itis reasonable to believe that they will differ, since the knowledge network will be a subset ofthe overall business interactions, the difference will be in a rather specific direction. I argueknowledge to be diffused more unevenly that one would expect if it was distributed primarilythrough the network of business interactions. In the latter case, in fact, the knowledge flowsshould be spread relatively evenly across the cluster - consistent with the localized knowledgespillovers and collective learning arguments discussed in Section 2.1. In contrast, in an ’evolu-tionary world’, where firms have heterogeneous knowledge bases, the knowledge will be spreadmore unevenly. The following hypotheses are therefore elaborated as follows:
HP 2(a): The structure of the knowledge network differs significantly from
that of the network of business interactions
HP 2(b): The diffusion of knowledge among firms with heterogeneous knowl-
edge bases will be more uneven than one would expect if knowledge were to flow
primarily through the network of business interactions.
3 Methodology
3.1 The data
This study is based on micro level network data, collected at the firm level in three wineclusters in Italy and Chile, namely: Colline Pisane (CP), Bolgheri/Val di Cornia (BVC) andColchagua Valley (CV). The analysis has required careful data collection through interviews.
6
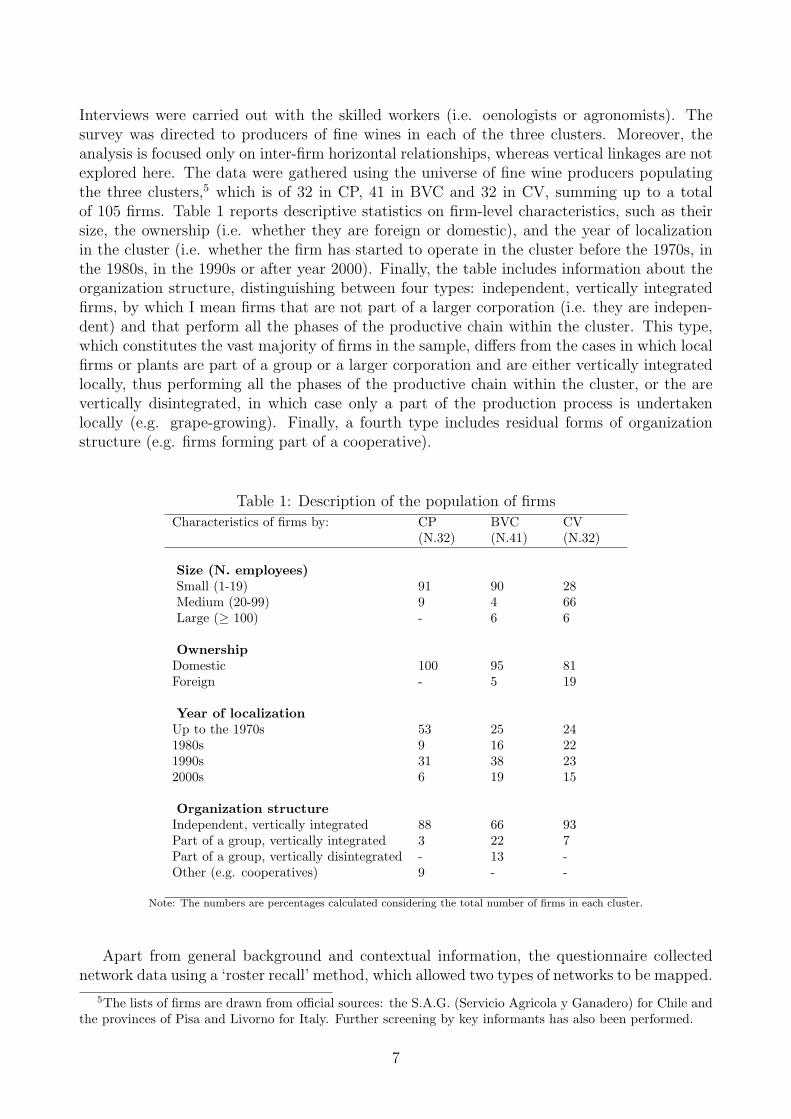
Interviews were carried out with the skilled workers (i.e. oenologists or agronomists). Thesurvey was directed to producers of fine wines in each of the three clusters. Moreover, theanalysis is focused only on inter-firm horizontal relationships, whereas vertical linkages are notexplored here. The data were gathered using the universe of fine wine producers populatingthe three clusters,5 which is of 32 in CP, 41 in BVC and 32 in CV, summing up to a totalof 105 firms. Table 1 reports descriptive statistics on firm-level characteristics, such as theirsize, the ownership (i.e. whether they are foreign or domestic), and the year of localizationin the cluster (i.e. whether the firm has started to operate in the cluster before the 1970s, inthe 1980s, in the 1990s or after year 2000). Finally, the table includes information about theorganization structure, distinguishing between four types: independent, vertically integratedfirms, by which I mean firms that are not part of a larger corporation (i.e. they are indepen-dent) and that perform all the phases of the productive chain within the cluster. This type,which constitutes the vast majority of firms in the sample, differs from the cases in which localfirms or plants are part of a group or a larger corporation and are either vertically integratedlocally, thus performing all the phases of the productive chain within the cluster, or the arevertically disintegrated, in which case only a part of the production process is undertakenlocally (e.g. grape-growing). Finally, a fourth type includes residual forms of organizationstructure (e.g. firms forming part of a cooperative).
Table 1: Description of the population of firms
Characteristics of firms by: CP(N.32)
BVC(N.41)
CV(N.32)
Size (N. employees)Small (1-19) 91 90 28Medium (20-99) 9 4 66Large (≥ 100) - 6 6
OwnershipDomestic 100 95 81Foreign - 5 19
Year of localizationUp to the 1970s 53 25 241980s 9 16 221990s 31 38 232000s 6 19 15
Organization structureIndependent, vertically integrated 88 66 93Part of a group, vertically integrated 3 22 7Part of a group, vertically disintegrated - 13 -Other (e.g. cooperatives) 9 - -
Note: The numbers are percentages calculated considering the total number of firms in each cluster.
Apart from general background and contextual information, the questionnaire collectednetwork data using a ‘roster recall’ method, which allowed two types of networks to be mapped.
5The lists of firms are drawn from official sources: the S.A.G. (Servicio Agricola y Ganadero) for Chile andthe provinces of Pisa and Livorno for Italy. Further screening by key informants has also been performed.
7
The first one, which I call network of knowledge (KN) maps inter-firm flows of knowledge,which occur for technical advice purposes. It has been developed by asking the following twoquestions:
(KN1) If you are in a critical situation and you need technical advice, to which of
the cluster firms mentioned in the roster do you turn?
(KN2) Which of the following cluster firms do you think have benefited from technical
support from this firm?
[Please indicate the importance you attach to the knowledge linkage established with each of the
firms according to its persistence and quality, on the basis of the following scale: 0= none; 1=
low; 2= medium; 3= high]
These questions specifically address problem solving and technical assistance because theyinvolve some effort in producing improvements and change within the economic activity of afirm. This is meant to go beyond the mere transfer of information, whose access can be easilyattained through other channels (e.g. trade fairs, the internet, specialized reviews etc.). So,for example, knowledge is transferred by providing a suggestion on how to treat a new pest orhow to deal with high levels of wine acidity during fermentation. Accordingly, the knowledgetransferred is normally the reply to a query on a complex problem that has emerged and thatthe firm seeks to solve.
The second network, defined as the network of business interactions (BI), maps the presenceof linkages among firms of the same cluster, which may occur for any business matter - e.g.trade of inputs, participation in the same business association, exchange of information andthe like. As such this network includes also the knowledge flows occurring among firms inthe cluster. This network is used to measure the relational proximity of cluster firms. Byproviding the respondents with a roster of the population of fine wine producers in the cluster,the following question was addressed:
(BI)With which of the cluster firms mentioned in the roster do you interact for
business matters?
[Please indicate the frequency of interaction according to the following scale: 0= none; 1= low;
2= medium; 3= high]
The interviews were also designed to obtain information that would permit the develop-ment of another quantitative indicator that is relevant for this present study: the ’knowledgebase’ of the firms. In the literature, this concept is often measured through information ontraining, human resources and R&D. Correspondingly, the structured interviews sought de-tailed information about the quality and experience of the technical human resources andabout the quality of firm experimentation intensity - an appropriate proxy for knowledge cre-ation efforts, since information about expenditure on formal R&D would have been both toonarrowly defined and too difficult to obtain systematically.
3.2 Operationalization of concepts
The test of Hypothesis 1 has required the operationalization of two concepts. The first oneis the knowledge base of firms. This concept has been associated here with (i) the number ofknowledge workers (i.e. oenologists and agronomists) employed full time by the firm, (ii) themonths of experience of such knowledge workers in the wine industry, and (iii) the intensity
8
of the firms’ experimentation activities. The latter is proxied by a scale ranging from aminimum of 0 to a maximum of 4, according to nature of experimentation. This informationwas then transformed into an operational indicator of the knowledge base (KB) using aPrincipal Component analysis.6
The second concept is the structure of the knowledge network. I have applied here a set ofmeasures to provide a description of this network general structure. On the one hand, I haveused indexes of actor-level degree centrality and, on the other, different techniques to identifycohesive subgroups.
Actor-level degree (DC(ni)) centrality refers to the extent to which an actor is central ina network on the basis of the ties that it has directly established with other j actors of thenetwork:
DC(ni) =∑
xij (1)
The actor-level degree centrality is calculated here considering indirected ties of the KN net-work, and it is a non-negative discrete variable that counts the number of linkages that a firmhas established with other firms in the cluster.7 In order to test Hypothesis 1, I estimatefirm-level degree centrality of the KN network as a function of the firm knowledge base, usinga negative binomial specification model with fixed effects (Cameron and Trivedi, 1986).8 Themodel includes also firm and cluster dummies. Firm dummies are included to control forsome key firm-level characteristics, namely the ownership (OWN), the year of localizationin the cluster (Y EAR) and the organization structure (ORG). A control variable for firmsize (SIZE) measured by the number of employees, is also introduced in the model. Finally,cluster dummy variables (CLUSTER) control for the type of cluster.
Following the actor-level measures of network structure, I moved to the identification of co-hesive subgroups of actors within the KN network. Cohesive subgroups are defined as ”subsetsof actors among whom there are relatively strong, direct, intense, frequent or positive ties.”(Wassermann and Faust, 1994, p. 249) A set of methods and measures have been adoptedin this paper to identify cohesive subgroups, among them I looked for cliques, 2 − cliques,core − periphery models and factions. A clique is defined as a maximal subgraph of threeor more nodes and it represents a subgroup of nodes which are all connected to each other.A 2 − clique is a maximal subgraph in which the largest geodesic distance between any twonodes is no greater than 2.9 A core−periphery analysis allows the identification of a cohesivesubgroup of core firms and a set of peripheral firms that are loosely connected to the core - asexplained in Borgatti and Everett (1999). Finally, a faction is a partition of a network done bygrouping together actors on the basis of similarity to whom they are tied to (Hanneman, 2001).
The test of Hypothesis 2(a) has been based, first, on a simple measure of the networkstructure: network density (ND), defined as the proportion of possible linkages that areactually present in a graph. ND is calculated as the ratio of the number of linkages present,L, to its theoretical maximum, g(g − 1)/2, with g being the number of nodes in the network
6A variant of this variable is also described in Giuliani and Bell (2005).7I refer here specifically to the degree centrality calculated using dichotomous data.8The baseline specification assumes that the dependent variable follows a Poisson distribution. The choice
of the negative binomial specification is due to overdispersion in the dependent variable. For an applicationof this, see Nesta and Saviotti, 2005.
9On the concept of maximal subgraph, geodesic distance and on the formal definition of cliques, 2−cliques
see Wasserman and Faust (1994).
9
(Wasserman and Faust, 1994):
ND =L
g(g − 1)/2(2)
In order to test the structural differences between BI and KN networks, I applied Snijdersand Borgatti’s (1999) bootstrap-assisted paired sample t-test to BI and KN network densities.Beside this, a Quadratic Assignment Procedure (QAP) correlation (Borgatti et al. (2002) andHanneman (2001)) was performed on BI and KN networks and I used the Jaccard coefficientto measure how much of the business interactions occur in the form of knowledge flows.10
Finally, the test of Hypothesis 2(b) has been based on two levels of measurament. First,I performed an analysis of the heterogeneity of the ’coreness’ of each actor in both BI andKN network. By ’coreness’ I refer here to the degree of closeness of each node to a coreof densely connected nodes observable in the network, as described by Borgatti and Everett(1999). Using actor-level coreness data, I calculated two indexes of heterogeneity: Gini (G)and Hirschman/Herfindahl(HH). Second, I analyzed the distribution properties of actor-leveldegree centrality (DC) of the two networks.
4 Empirical results
4.1 Uneven knowledge diffusion and the knowledge base of firms
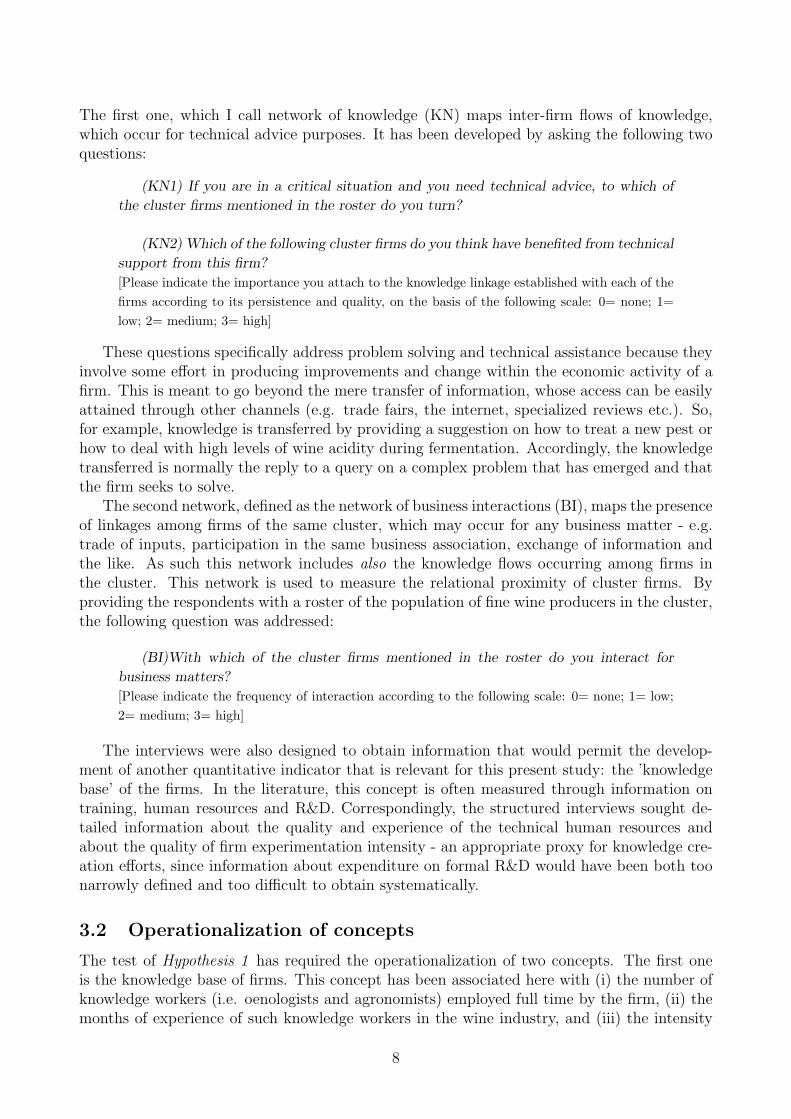
This section analyzes the structural characteristics of the knowledge networks and exploreswhether they are related to the heterogeneity of firm knowledge bases in the clusters. Table2 presents descriptive statistics of the three indicators used for the measurement of the firmknowledge base: (i) the number of knowledge workers, (ii) their months of experience in theindustry and (iii) the experimentation intensity carried out at the firm level.
Table 2: Key indicators of firm knowledge bases and their heterogeneity
CP BVC CVMean SD Min Max Mean SD Min Max Mean SD Min Max
Knowledge workers .34 .65 0 3 .56 .80 0 3 2.21 2.01 0 6
Months of experi-ence
11 39 0 203 28 57 0 238 68 86 0 410
Experimentationintensity
.68 .95 0 3 1.09 1.35 0 4 1.59 1.43 0 4
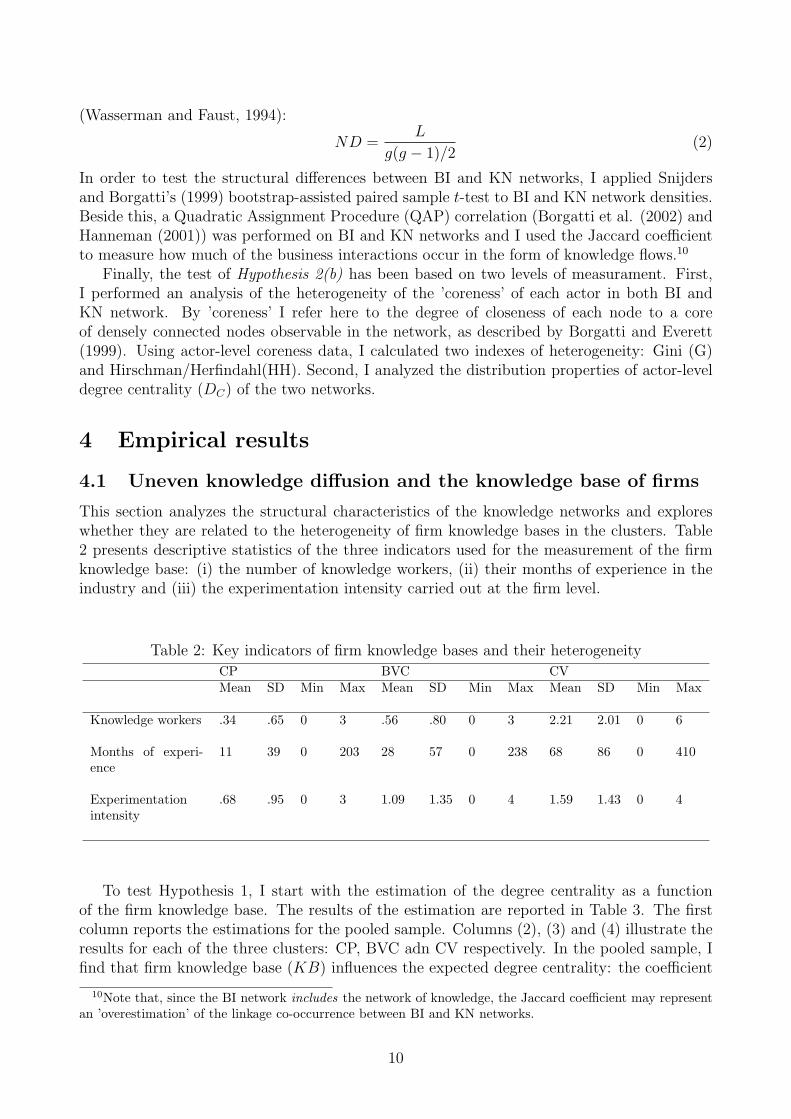
To test Hypothesis 1, I start with the estimation of the degree centrality as a functionof the firm knowledge base. The results of the estimation are reported in Table 3. The firstcolumn reports the estimations for the pooled sample. Columns (2), (3) and (4) illustrate theresults for each of the three clusters: CP, BVC adn CV respectively. In the pooled sample, Ifind that firm knowledge base (KB) influences the expected degree centrality: the coefficient
10Note that, since the BI network includes the network of knowledge, the Jaccard coefficient may representan ’overestimation’ of the linkage co-occurrence between BI and KN networks.
10
is positive and significant at 5%. Strikingly enough, none of the firm-level control variables issignificant. Significance is found for one of the cluster dummies (CLUSTER − CP ), whichmeans that, if compared with the baseline cluster CV, the expected degree centrality in CollinePisane is going to decrease by 0.85%. These results lead to further exploration of the databy disaggregating them at the cluster level. As indicated in Column (2) the KB does notsignificantly influence the dependent variable degree centrality in Colline Pisane, whereassignificant and positive results are found for both BVC and CV clusters.
Table 3: The relationship between degree centrality and firm knowledge base
Model Pooled Sample CP BVC CV
Intercept 1.33 (.63)** -2.73 (1.64)* .76 (.40)* 1.55 (.64)**
KB .33 (12)** -.10 (.46) .35 (0.17)** .57 (.18)***
SIZE .017 (.12) .49 (.35) -.04 (.18) -.08 (.15)
OWN .44 (.43) - - .44 (.43)
ORG1 -.66 (.58) - .38 (.47) -.80 (.59)
ORG3 -.41 (.51) 1.53 (.95) - -45 (.45)
ORG4 -1.29 (.99) - - -
Y EAR70 .35 (.31) 1.02 (1.17) .46 (.41) .43 (.50)
Y EAR80 .24 (.34) .88 (1.34) .52 (.45) -
Y EAR90 .20 (.31) 1.14 (1.19) -.13 (.47) .42 (46)
Y EAR00 - - - .27 (.51)
CLUSTER − CP -.85 (.40)**
CLUSTER − BV C -.16 (.35)
Log-likelihood -206.09 -48.54 -79.18 -70.06LR Chi Square 28.38*** 6.36** 11.80** 12.41**Pseudo R2 .06 .06 .06 .08
Note: ∗ ∗ ∗, ∗∗, ∗ indicate significant at 1, 5 and 10% respectively.ORG1= Part of a group, vertically integrated; ORG2= Part of a group, vertically disintegrated; ORG3= Independent,
vertically integrated; ORG4= Other
Y EAR70, Y EAR80, Y EAR80, Y EAR790 refer to the decade of firm localization in the cluster: 1970s, 1980s, 1990s and 2000
respectively.
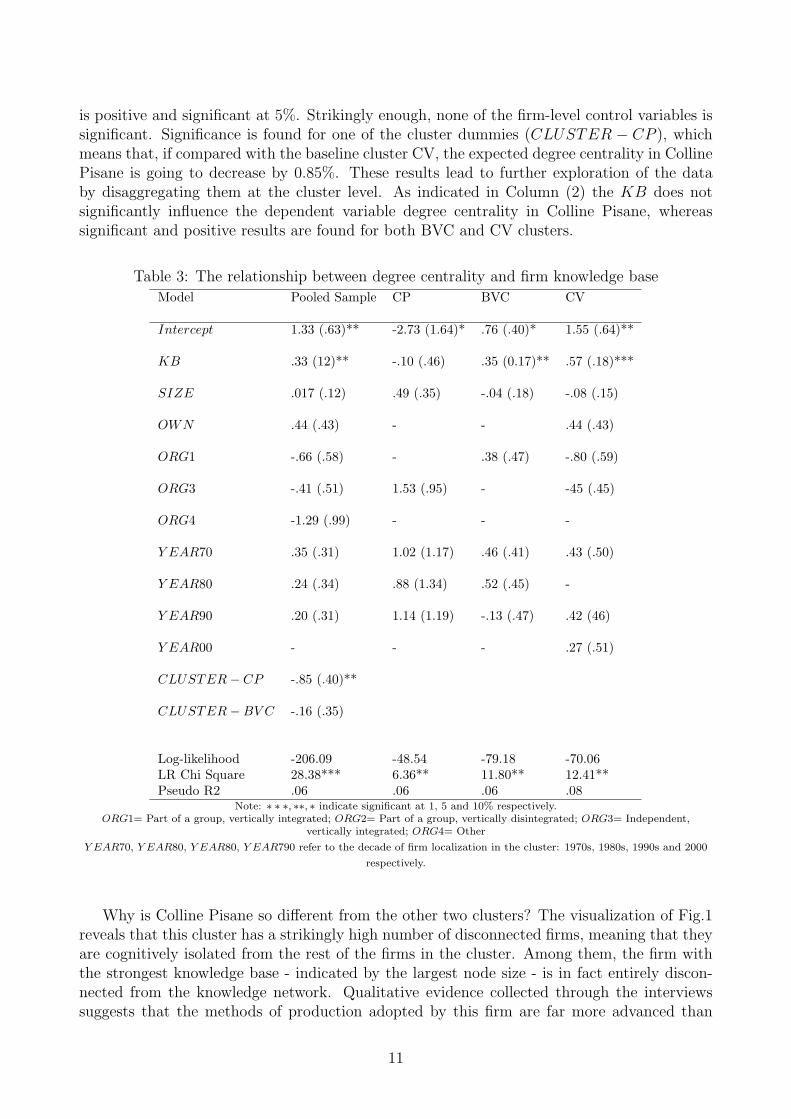
Why is Colline Pisane so different from the other two clusters? The visualization of Fig.1reveals that this cluster has a strikingly high number of disconnected firms, meaning that theyare cognitively isolated from the rest of the firms in the cluster. Among them, the firm withthe strongest knowledge base - indicated by the largest node size - is in fact entirely discon-nected from the knowledge network. Qualitative evidence collected through the interviewssuggests that the methods of production adopted by this firm are far more advanced than
11
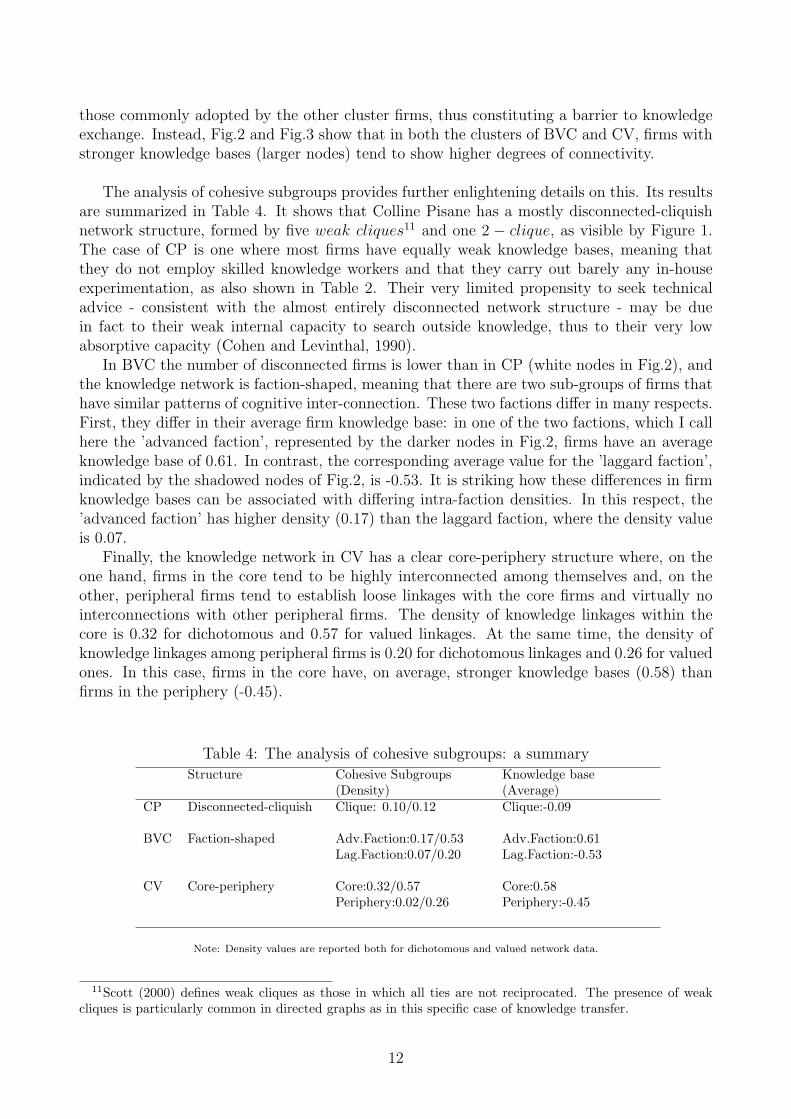
those commonly adopted by the other cluster firms, thus constituting a barrier to knowledgeexchange. Instead, Fig.2 and Fig.3 show that in both the clusters of BVC and CV, firms withstronger knowledge bases (larger nodes) tend to show higher degrees of connectivity.
The analysis of cohesive subgroups provides further enlightening details on this. Its resultsare summarized in Table 4. It shows that Colline Pisane has a mostly disconnected-cliquishnetwork structure, formed by five weak cliques11 and one 2 − clique, as visible by Figure 1.The case of CP is one where most firms have equally weak knowledge bases, meaning thatthey do not employ skilled knowledge workers and that they carry out barely any in-houseexperimentation, as also shown in Table 2. Their very limited propensity to seek technicaladvice - consistent with the almost entirely disconnected network structure - may be duein fact to their weak internal capacity to search outside knowledge, thus to their very lowabsorptive capacity (Cohen and Levinthal, 1990).
In BVC the number of disconnected firms is lower than in CP (white nodes in Fig.2), andthe knowledge network is faction-shaped, meaning that there are two sub-groups of firms thathave similar patterns of cognitive inter-connection. These two factions differ in many respects.First, they differ in their average firm knowledge base: in one of the two factions, which I callhere the ’advanced faction’, represented by the darker nodes in Fig.2, firms have an averageknowledge base of 0.61. In contrast, the corresponding average value for the ’laggard faction’,indicated by the shadowed nodes of Fig.2, is -0.53. It is striking how these differences in firmknowledge bases can be associated with differing intra-faction densities. In this respect, the’advanced faction’ has higher density (0.17) than the laggard faction, where the density valueis 0.07.
Finally, the knowledge network in CV has a clear core-periphery structure where, on theone hand, firms in the core tend to be highly interconnected among themselves and, on theother, peripheral firms tend to establish loose linkages with the core firms and virtually nointerconnections with other peripheral firms. The density of knowledge linkages within thecore is 0.32 for dichotomous and 0.57 for valued linkages. At the same time, the density ofknowledge linkages among peripheral firms is 0.20 for dichotomous linkages and 0.26 for valuedones. In this case, firms in the core have, on average, stronger knowledge bases (0.58) thanfirms in the periphery (-0.45).
Table 4: The analysis of cohesive subgroups: a summary
Structure Cohesive Subgroups Knowledge base(Density) (Average)
CP Disconnected-cliquish Clique: 0.10/0.12 Clique:-0.09
BVC Faction-shaped Adv.Faction:0.17/0.53Lag.Faction:0.07/0.20
Adv.Faction:0.61Lag.Faction:-0.53
CV Core-periphery Core:0.32/0.57 Core:0.58Periphery:0.02/0.26 Periphery:-0.45
Note: Density values are reported both for dichotomous and valued network data.
11Scott (2000) defines weak cliques as those in which all ties are not reciprocated. The presence of weakcliques is particularly common in directed graphs as in this specific case of knowledge transfer.
12
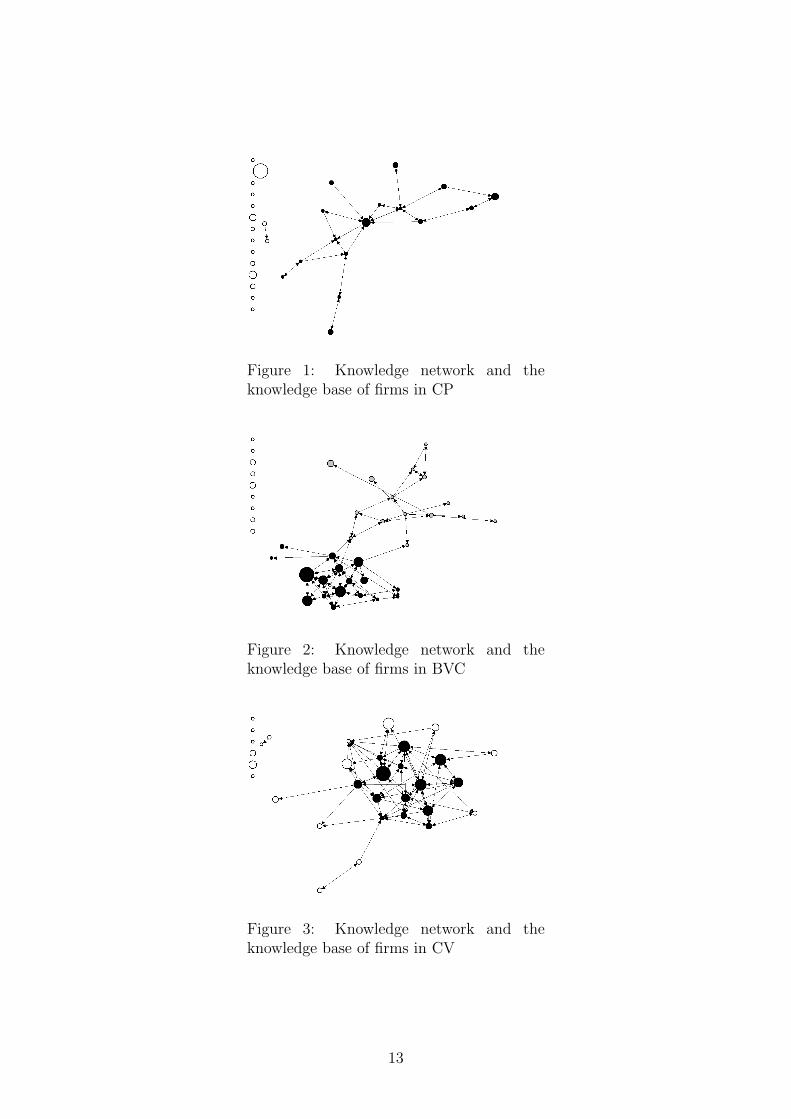
Figure 1: Knowledge network and theknowledge base of firms in CP
Figure 2: Knowledge network and theknowledge base of firms in BVC
Figure 3: Knowledge network and theknowledge base of firms in CV
13
These results indicate that a relationship exists between firms’ knowledge bases and thestructural characteristics of inter-firm knowledge networks. Strongly significant coefficientswere found in both BVC and CV between, indicating that firms with stronger knowledge basestend to be more central in the knowledge network. This, as suggested in Section 2.2, maybe due to the fact that firms with higher internal capabilities are perceived as ’technologicalleaders’ in the local area and thus sought out for technical advice more often. In addition tothat, firms with stronger knowledge bases are more capable to absorb knowledge spilling overfrom other equally or more advanced cluster firm and, therefore, they are more probable toform part of the knowledge network.
Where a significant estimation was not found, as in Colline Pisane, that was due to thehighly disconnected knowledge network. There, the majority of firms are characterized by veryweak knowledge bases an aspect that hinders inter-firm knowledge flows altogether. Besides,the relative cognitive distance between the majority of firms with weak knowledge bases andthe only firm with more advanced techniques of production also contributes to the overallfragmentation of the knowledge network in CP.
The analysis of cohesive subgroups of also BVC and CV suggests that knowledge tendsto flow in clusters in a highly polarized and uneven fashion. Knowledge is diffused primarilywithin the boundaries of one or more restricted subgroups of firms, as for example the ’ad-vanced faction’ in BVC and the ’core’ in CV, with very limited knowledge spilling over to therest of the cluster firms - i.e. the ’laggard faction’ or the ’periphery’ and no knowledge spillingover to disconnected firms.
These results validate Hypothesis 1.
4.2 Pervasive business interactions and selective inter-firm learning
Before testing Hypotheses 2(a) and 2(b), the visualization of BI and KN network data for thethree clusters (Figures 4 to 9) suggests two striking features: first, that business interactionsare visibly very similar across the three clusters and, second, that, consistent with the previoussection, a much smaller number of firms is connected through the KN network. Density valuesare reported in Table 5, where the value for business interactions is significantly higher thanthe one characterizing knowledge networks:12 in Colline Pisane the density of the BI networkis 0.32, it is 0.20 in Bolgheri/Val di Cornia and 0.30 in Colchagua Valley. As expected, thedensity of KN networks is considerably lower in all cases ranging from 0.04 in Colline Pisaneto 0.05 in Bolgheri/Val di Cornia and to 0.09 in Colchagua Valley. Table 5 also reports theresults of the bootstrap t-test, which shows that BI and KN densities are statistically different,both in the case that the three clusters are taken separately and in the case in which they arepooled together in the same matrix (all t-values are higher than 2, the critical value). Thesedifferences tell us that only a minority of the overall business interactions are in fact knowledgeflows. As shown in Table 5 the Jaccard coefficients resulting from the QAP correlation betweenBI and KN networks, have a strikingly low value in CP (10,4%), whereas the values for BVCand CV are slightly higher (25.8% and 28.1% respectively). However, these values may wellbe an an overestimation of the real co-occurrence between BI and KN linkages since part ofthe knowledge linkages may have formed without a different type of business interaction tohave occurred at the same time (see Footnote 10).
In fact, qualitative evidence collected in the field suggests that this is often the case. Oe-
12Note that Table 5 also reports results for the pooled matrix data (Pooled). This matrix has been con-structed by pooling together cluster level network data.
14
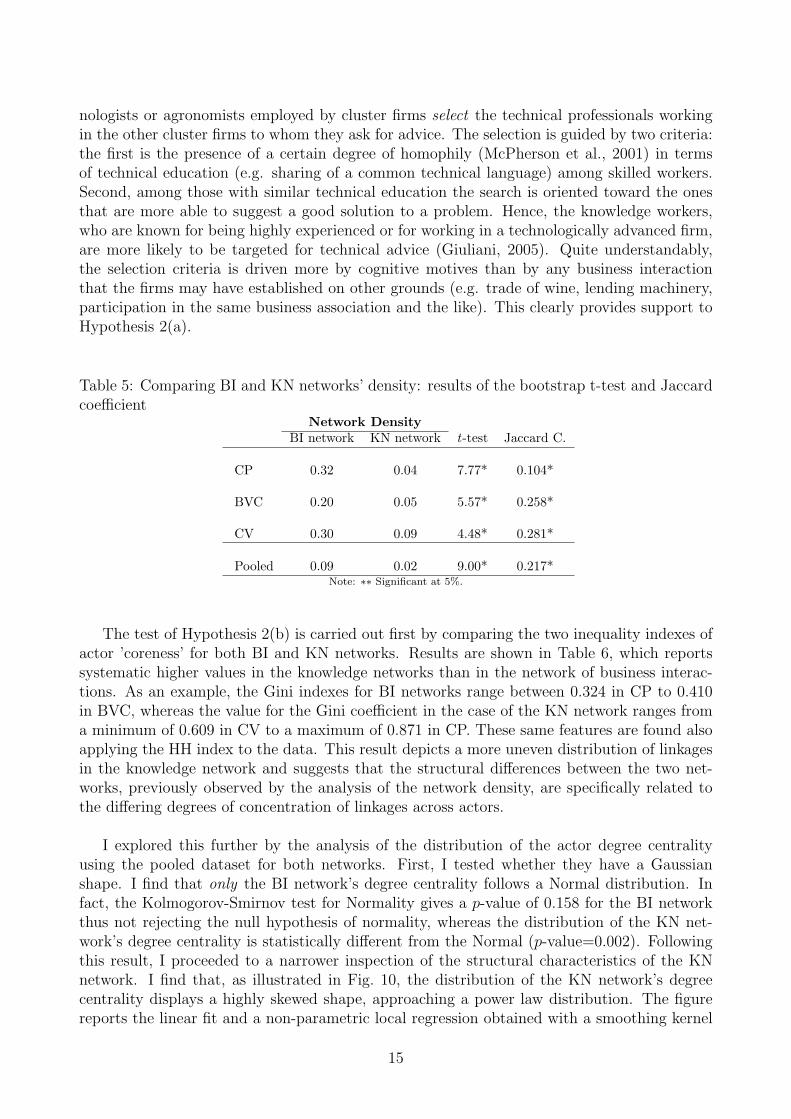
nologists or agronomists employed by cluster firms select the technical professionals workingin the other cluster firms to whom they ask for advice. The selection is guided by two criteria:the first is the presence of a certain degree of homophily (McPherson et al., 2001) in termsof technical education (e.g. sharing of a common technical language) among skilled workers.Second, among those with similar technical education the search is oriented toward the onesthat are more able to suggest a good solution to a problem. Hence, the knowledge workers,who are known for being highly experienced or for working in a technologically advanced firm,are more likely to be targeted for technical advice (Giuliani, 2005). Quite understandably,the selection criteria is driven more by cognitive motives than by any business interactionthat the firms may have established on other grounds (e.g. trade of wine, lending machinery,participation in the same business association and the like). This clearly provides support toHypothesis 2(a).
Table 5: Comparing BI and KN networks’ density: results of the bootstrap t-test and Jaccardcoefficient
Network DensityBI network KN network t-test Jaccard C.
CP 0.32 0.04 7.77* 0.104*
BVC 0.20 0.05 5.57* 0.258*
CV 0.30 0.09 4.48* 0.281*
Pooled 0.09 0.02 9.00* 0.217*Note: ∗∗ Significant at 5%.
The test of Hypothesis 2(b) is carried out first by comparing the two inequality indexes ofactor ’coreness’ for both BI and KN networks. Results are shown in Table 6, which reportssystematic higher values in the knowledge networks than in the network of business interac-tions. As an example, the Gini indexes for BI networks range between 0.324 in CP to 0.410in BVC, whereas the value for the Gini coefficient in the case of the KN network ranges froma minimum of 0.609 in CV to a maximum of 0.871 in CP. These same features are found alsoapplying the HH index to the data. This result depicts a more uneven distribution of linkagesin the knowledge network and suggests that the structural differences between the two net-works, previously observed by the analysis of the network density, are specifically related tothe differing degrees of concentration of linkages across actors.
I explored this further by the analysis of the distribution of the actor degree centralityusing the pooled dataset for both networks. First, I tested whether they have a Gaussianshape. I find that only the BI network’s degree centrality follows a Normal distribution. Infact, the Kolmogorov-Smirnov test for Normality gives a p-value of 0.158 for the BI networkthus not rejecting the null hypothesis of normality, whereas the distribution of the KN net-work’s degree centrality is statistically different from the Normal (p-value=0.002). Followingthis result, I proceeded to a narrower inspection of the structural characteristics of the KNnetwork. I find that, as illustrated in Fig. 10, the distribution of the KN network’s degreecentrality displays a highly skewed shape, approaching a power law distribution. The figurereports the linear fit and a non-parametric local regression obtained with a smoothing kernel
15
Pajek
Figure 4: Business interactions in CP
Pajek
Figure 5: Knowledge flows in CP
Pajek
Figure 6: Business interactions inBVC
Pajek
Figure 7: Knowledge flows in BVC
Pajek
Figure 8: Business interactions in CV
Pajek
Figure 9: Knowledge flows in CV
16
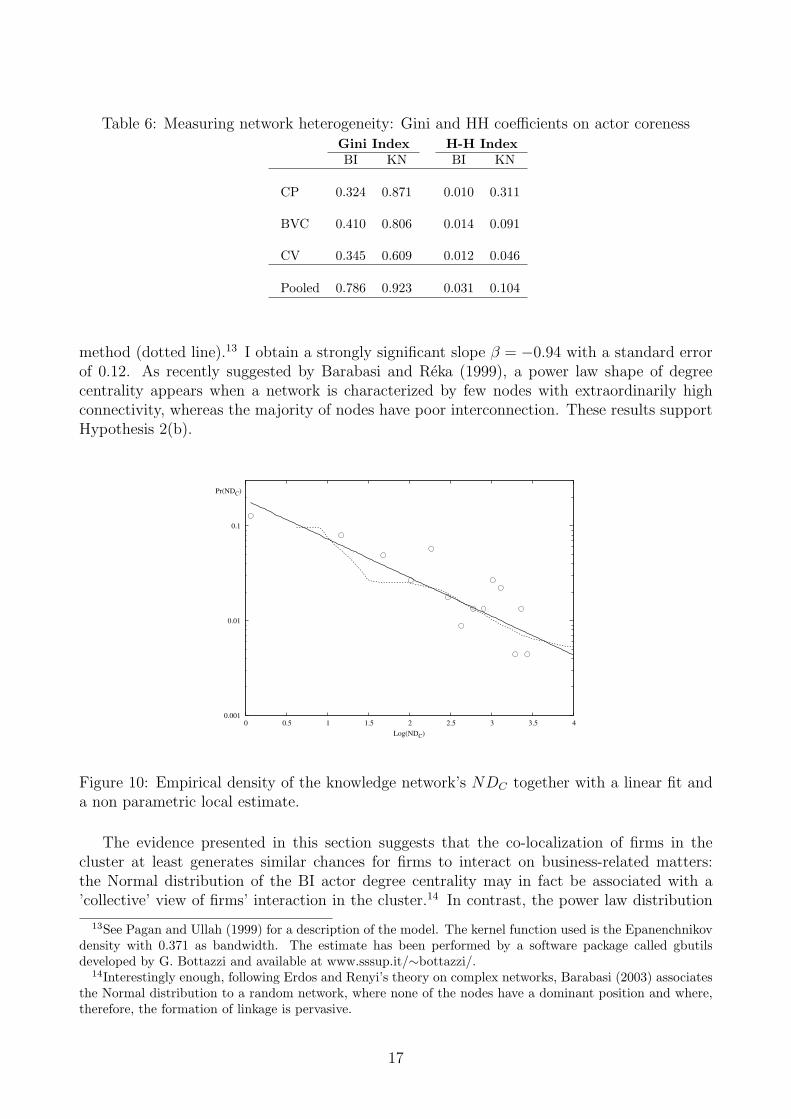
Table 6: Measuring network heterogeneity: Gini and HH coefficients on actor corenessGini Index H-H IndexBI KN BI KN
CP 0.324 0.871 0.010 0.311
BVC 0.410 0.806 0.014 0.091
CV 0.345 0.609 0.012 0.046
Pooled 0.786 0.923 0.031 0.104
method (dotted line).13 I obtain a strongly significant slope β = −0.94 with a standard errorof 0.12. As recently suggested by Barabasi and Reka (1999), a power law shape of degreecentrality appears when a network is characterized by few nodes with extraordinarily highconnectivity, whereas the majority of nodes have poor interconnection. These results supportHypothesis 2(b).
0.001
0.01
0.1
0 0.5 1 1.5 2 2.5 3 3.5 4
Log(NDC)
Pr(NDC)
Figure 10: Empirical density of the knowledge network’s NDC together with a linear fit anda non parametric local estimate.
The evidence presented in this section suggests that the co-localization of firms in thecluster at least generates similar chances for firms to interact on business-related matters:the Normal distribution of the BI actor degree centrality may in fact be associated with a’collective’ view of firms’ interaction in the cluster.14 In contrast, the power law distribution
13See Pagan and Ullah (1999) for a description of the model. The kernel function used is the Epanenchnikovdensity with 0.371 as bandwidth. The estimate has been performed by a software package called gbutilsdeveloped by G. Bottazzi and available at www.sssup.it/∼bottazzi/.
14Interestingly enough, following Erdos and Renyi’s theory on complex networks, Barabasi (2003) associatesthe Normal distribution to a random network, where none of the nodes have a dominant position and where,therefore, the formation of linkage is pervasive.
17
can be seen as the result of a selective process over time. This distribution is in fact oftenassociated with a ’preferential attachment’ rule (Barabasi and Reka, 1999), which means that,as a knowledge network grows, there is a higher probability that a new node connects tothe best-connected node in the network (known as the ”rich-get-richer” phenomenon). Thiscondition helps to explain the formation of large ”hubs”, characterized by extraordinarily highdegree centrality values (Barabasi and Bonabeau, 2003).
5 Conclusion
This paper has attempted to open up the black box of ’localized knowledge spillovers’ in in-dustrial clusters. Using network data I was able to compare BI with KN networks, applyingnetwork theory to analyze their structural differences. The study has revealed that BI and KNdiffer in their network structure. Higher densities and relatively low values in the Gini andHH coefficients in the former network are consistent with the presence of pervasive businessinteractions among cluster firms. In addition, the Normal distribution of the degree centralityoffers a ’collective’ account of business interactions. This is compatible with the Marshal-lian ’industrial atmosphere’ methaphor. However, the original contribution of this paper isthat it has allowed the emergence of a second account, which is commonly overshadowed bythe previous one. In spite of pervasive business interactions, inter-firm knowledge flows arestrikingly limited to cohesive subgroups of firms. Consequently, they are unevenly distributedwithin the cluster. The power law shape of the knowledge network actor’s degree centralitysuggests in fact that only a minority of ”‘hub”’ firms both contributes to and benefits fromthe presence of localized knowledge spillovers. Besides, the empirical analysis here suggeststhat this minority tends to be formed mainly by firms with similarly strong knowledge bases,whereas firms with weak knowledge bases are likely to be less connected.
This empirical evidence thus suggests that similar meso-characteristics -i.e. the geo-graphic and relational proximity of firms - do not necessarily constitute the ’substratum’for collectively-shared knowledge flows. On the contrary, this study supports a selective viewof cluster knowledge diffusion and learning processes.
On the basis of this, two considerations can be raised. First, bearing in mind that inter-firmknowledge flows may contribute to innovation, one should be extremely careful in associatingthe concept of industrial clusters to enhanced innovation capacity even when firms are geo-graphically and relationally proximate. Instead, more rigorous studies should be carried out inthe future that analyze the interplay between firms and the cluster knowledge network, wheremost of the innovation is likely to be generated. Second, as recently suggested by Markusen(2003), more rigorous analysis in regional studies will provide better indications for policymakers. Indeed, this study supports the view that innovation in clusters is more likely to beenhanced by strengthening firms’ knowledge bases rather than by pooling firms together in thesame geographical area (as is the case of ’technopoles’, (OECD, 2000)) or by the promotinginter-firm and networking per se (UNCTAD, 2001; UNIDO, 2001).
18
References
Amin A, Cohendet P. 2004. Architectures of Knowledge. Firms, Capabilities and Communities.Oxford, Oxford University Press.
Anselin, L, Varga, A, Zoltan, A. 2000. Geographical spillovers and university research: aspatial econometric perspective. Growth and Change 31(Fall): 501-515.
Arrow KJ. 1962. Economic welfare and the allocation of resources for invention. In The Rateand Direction of Inventive Activity, ed. RR Nelson, pp. 609-26. Princeton: Princeton Uni-versity.
Audretsch D, Feldman MP. 1996. R&D spillovers and the geography of innovation and pro-duction. American Economic Review 86: 630-40.
Baptista R. 2000. Do innovations diffuse faster within geographical clusters? InternationalJournal of Industrial Organization 18: 515-35.
Barabasi A-L. 2003. Linked. How everything is connected to everything else and what it meansfor business, science and everyday life. Plume. Penguin Group. New York, USA.
Barabasi A-L, Bonabeau A. 2003. Scale-free networks. Scientific American 288: 50-9.
Barabasi A-L, Reka A. 1999. Emergence of scaling in real networks. Science 286: 509-512.
Belderbos R, Capannelli G, Fukao K. 2001. Backward Vertical Linkages of Foreign Man-ufacturing Affiliates: Evidence from Japanese Multinationals. World Development 29(1),189-208.
Bell M, Albu, M. 1999. Knowledge systems and technological dynamism in industrial clustersin developing countries. World Development 27: 1715-34.
Best M, Forrant R. 1996. Creating industrial capacity: Pentagon-led versus production-ledindustrial policies. In J. Michie and J. Grieve Smith (eds) Creating Industrial Capacity:Towards Full Employment. Oxford: Oxford University Press.
Borgatti SP, Everett MG. 1999. Models of core/periphery structures. Social Networks, 21:375-395.
Borgatti SP, Everett MG, Freeman, LC. 2002. Ucinet 6 for Windows, Harvard: AnalyticTechnologies.
Boschma RA. 2005. Proximity and innovation: A critical assessment. Regional Studies. 39 (1):61-74.
Breschi S, Lissoni F. 2001. Knowledge spillovers and Local Innovation Systems: A criticalsurvey. Industrial and Corporate Change 10: 975-1005.
Camagni R. 2002. On the concept of territorial competitiveness: Sound or misleading? UrbanStudies 39 (13): 2395-2411.
Cameron AC, Trivedi PK. 1986. Econometric models based on count data: comparison andapplications of some estimators and tests. Journal of Applied Econometrics 18 (1): 29-53.
19

Capello R. 1999. Spatial transfer of knowledge in high technology milieux: Learning versuscollective learning processes. Regional Studies 33: 353-65.
Capello R, Faggian A. 2005. Collective learning and relational capital in local innovationprocesses. Regional Studies 39 (1): 75-87.
Carter AP. 1989. Know-how trading as economic exchange. Research Policy 18: 155-63.
Cohen W, Levinthal D. 1990. Absorptive-Capacity - a new perspective on learning and inno-vation. Administrative Science Quarterly 35: 128-52.
Crevoisier O. 2004. The innovative milieus approach: Toward a territorialized understandingof the economy? Economic Geography 80 (4): 367-379.
Dosi G. 1988. Sources, procedures and microeconomic effects of innovation. Journal of Eco-nomic Literature 26: 1120-71.
Dosi G, Freeman C, Nelson R, Silverberg G, Soete L. 1988. Technical Change and EconomicTheory. London: Pinter.
Dosi G. 1997. Opportunities, incentives and the collective patterns of technological change.Economic Journal 107: 1530-47.
Feldman MP. 1999. The new economics of innovation, spillovers and agglomeration: a reviewof empirical studies. The Economics of Innovation and New Technology 8: 5-25.
Giuliani E. 2005. When the micro shapes the meso: learning and innovation in wine clusters.Unpublished DPhil Thesis, SPRU: University of Sussex, Brighton, UK.
Giuliani E, Bell M. 2005. The micro-determinants of meso-level learning and innovation: evi-dence from a Chilean wine cluster. Research Policy, 34(1): 47-68.
Granovetter M. 1985. Economic action and social structure: the problem of embeddedness.American Journal of Sociology 91: 481-510.
Halder G, Nadvi K. 2002. Local clusters in global value chains: exploring dynamic linkagesbetween Germany and Pakistan. IDS Working Paper 152.
Hanneman RA. 2001. Social Network Methods: an online handbook. University of California,Riverside, http://faculty.ucr.edu/ hanneman/networks/nettext.pdf.
Howells JRL. 2002. Tacit knowledge, innovation and economic geography. Urban Studies 39(5-6): 871-884.
Hudson R. 1999. The learning economy, the learning firm and the learning region: a sympa-thetic critique of the limits to learning. European Urban and Regional Studies, 6: 59-72.
Humphrey J, Schmitz H. 1996. The triple C approach to local industrial policy. World Devel-opment 24: 1859-77.
Jaffe A.B. 1989. Real effects of academic research. American Economic Review 79: 984-99.
Jaffe AB, Trajtenberg M, Henderson R. 1993. Geographic localization of knowledge spilloversas evidence from patent citations. Quarterly Journals of Economics 188: 577-98.
20

Keeble D, Wilkinson F. 1999. Collective learning and knowledge development in the evolutionof regional clusters of high technology SMEs in Europe. Regional Studies 33 (4): 295-303.
Kishimoto C. 2003. Upgrading in the Taiwanese computer cluster: transformation of its pro-duction and knowledge systems. IDS Working Paper 186, Brighton: Institute of Develop-ment Studies.
Krugman P. 1991. Geography and Trade. Cambridge: MIT Press.
Lane PJ, Lubatkin M. 1998. Relative absorptive capacity and interorganizational learning.Strategic Management Journal 19: 461-77.
Lawson C, Lorenz E. 1999. Collective learning, tacit knowledge and regional innovative ca-pacity. Regional Studies 33 (4): 305-317.
Malmberg A. 2003. Beyond the cluster - Local milieus and global economic connections. InRemaking the Global Economy, ed. J Peck, Yeung, HWC, pp. 145-59. London: SAGEPublications.
Markusen A. 2003. Fuzzy concepts, scanty evidence, policy distance: The case for rigour andpolicy relevance in critical regional studies. Regional Studies 37: 701-17.
Maskell P. 2001a. Towards a knowledge-based theory of the geographical cluster. Industrialand Corporate Change 10: 921-943.
Maskell P. 2001b. The firm in economic geography. Economic Geography, 77 (4), 329-344.
Maskell P, Malmberg A. 1999. Localised learning and industrial competitiveness. CambridgeJournal of Economics 23 (2), 167-186.
Marshall A. 1920. Principles of Economics. London: MacMillan.
Martin R, Sunley P.1998. Slow convergence? The new endogenous growth theory and regionaldevelopment, Economic Geography, 74 (3): 201-227.
Martin R, Sunley P. 2003. Deconstructing clusters: chaotic concept or policy panacea? Journalof Economic Geography, 3 (1): 5-35.
McPherson M, Smith-Lovin L, Cook JM. 2001. Birds of a feather: Homophily in social net-works. Annual Review of Sociology 27: 415-44.
Nelson RR, Winter SG. 1982. An Evolutionary Theory of Economic Change. Cambridge, Mass:Belknap Press of Harvard University Press.
Nesta L, Saviotti PP. 2005. Coherence of the knowledge base and the firms’ innovative per-formance: evidence from the U.S. pharmaceutical industry. The Journal of Industrial Eco-nomics, LII (1): 123-142.
OECD. 2000. Local partnership, clusters and SMEs globalisation, Conference for Ministersresponsible for SMEs and Industry Ministers, Bologna, Italy, 14-15 June.
OECD. 2001. Innovative Clusters: Drivers of National Innovation Systems. Paris: OECD.
21
Pagan A, Ullah A. (1999) Nonparametric Econometrics, Cambridge University Press, Cam-bridge, UK.
Pinch S, Henry N, Jenkins M, Tallman S. (2003) From ’industrial districts’ to ’knowledgeclusters’: a model of knowledge dissemination and competitive advantage in industrial ag-glomerations, Journal of Economic Geography 3: 373-388.
Piore MJ, Sabel, CF. 1984. The Second Industrial Divide: Possibility for Prosperity. NewYork: Basic Books Inc.
Porter ME. 1990. The Competitive Advantage of Nations. London: Macmillan.
Pyke F, Becattini G, Sengenberger W. 1990. Industrial Districts and Inter-firm Co-operationin Italy. Geneva: International Institute for Labour Studies.
Scott J. 2000. Social Network Analysis. A Handbook. London: SAGE Publications.
Scott AJ. 1998. Regions and the World Economy the Coming Shape of Global Production,Competition, and Political Order. New York: Oxford University Press.
Schrader S. 1991. Informal technology transfer between firms: cooperation through informaltrading. Research Policy 20: 153-70.
Snijders TAB, Borgatti SP. 1999. Non-parametric standard errors and tests for network statis-tics. Connections 22: 61-70.
Swann GMP, Prevezer M. 1998. A comparison of the dynamics of industrial clustering incomputing and biotechnology. Research Policy 25: 139-57.
UNCTAD. 2001. World Development Report. Promoting Linkages. Geneva, New York: UnitedNations Publication.
UNIDO. 2001. Development of clusters & networks of SMEs. Vienna: United Nation IndustrialDevelopment Organization.
Von Hippel E. 1987. Cooperation between rivals: informal know-how trading. Research Policy16: 291-302.
Wasserman S, Faust K. 1994. Social Network Analysis. Methods and Applications. Cambridge:Cambridge University Press.
22