Embed Size (px)
Citation preview
Drugonomics: Industrial Organization of Illegal Drug Markets
Alberto J. Naranjo R.
DISSERTATIONS IN ECONOMICS 2007:1
© Copyright by Alberto J. Naranjo R., 2007. All rights reserved.
Department of Economics Stockholm University
ISBN 91-7155-354-1 Printed by US-AB, Stockholm, Sweden, 2007.
To Colombia

v
ACKNOWLEDGEMENTS
It is difficult to understand what this thesis represents. I think it is fair to say that
it represents part of my life. It represents my family and the school years with my
love for learning; the years at my home University with my dreams; my travel to
England and Israel with my maturity; my first work as a research assistant with my
decisions; the first years in Sweden with the cultural shocks and my character; my
Canadian experience with the change; my "comeback" to Colombia with the new
reality; and my life together with Anna Maria.
In this thesis, you will find the effort by Sten Nyberg, my supervisor, and his in-
valuable help in structuring my thoughts. My deepest gratitude goes to Sten. You
will also find the invaluable input from people at the Department of Economics,
especially, Jonas Häckner, Michael Lundholm, Ann-Sofie Kolm, Claes-Henric Siven,
Astri Muren, Rikard Forslid, and Hans Wijkander. To them I also give my gratitude.
I am especially grateful to Adam Jacobsson with whom I worked in the second chap-
ter and who has always been a good listener to my thoughts, to Mathias Herzing
with his insightful comments, and to David Vestin whose contribution on the last
chapter of this thesis was also invaluable.
My gratitude also goes to Ingela Arvidsson and her predecessors who were always
there in answering all my questions, to Anita Karlsson and Karl Eriksson for their
invaluable help, to all the administrative staff of the Department of Economics for
being the right support, and to Christina Lönnblad for her enormous and efficient
assistance in the correction of the language in this thesis. For financial support,
I thank the Department of Economics and the donations Knut-Alice Wallenbergs
Stiftelse and Kock-Lindberg Stipendium at Stockholm University.
My invaluable friends also deserve my deep gratitude. In a random selection, I owe
thanks to Mathias, Adam, Daniel, Thomas, Damian, Natalia, Jorge, Sandra, Lars,
Camilo, Markus, Gelkha, Carlis, Vicky, and Andres. Without them, and also their
friends, partners, or family, life and research would not have been the same. This
vi
gratitude also goes to those persons to whom I felt very close along these years, but
who for different reasons were physically distant. They are Andres R., David D.,
Bo, Malin, Jan, Cristina, Lena, Dan, and Peter S.T.. I am also grateful to Angelica
and Lina, who were part of this experience and kept me there.
I owe thanks to my "classmates", with whom I started this experience some years
ago, and especially, to Gabriella, Therese, Sandra, and Magnus. I survived those
first years thanks to them.
An enourmes gratitude to the Institute of Latin American Studies at Stockholm
University, and in particular to Jaime Behar, for giving me the opportunity to start
this experience and for the invaluable assistance during my first years.
My family in Colombia and Sweden also know how grateful I am for their closeness
along these years. To my Colombian family, thanks for their smiles and happiness
when I was arriving and their tears and sadness when I was leaving. Thanks for
waiting. To my Swedish family, thanks for their understanding and love. Thanks
for being part of me.
And finally, all my love and deep gratitude to my "l-wife", Anna Maria, for existing
and for sharing this experience with me. Without her I would not have been here
today.
Stockholm, January 2007
Alberto J. Naranjo R.
vii
TABLE OF CONTENTS
Introduction 1
Chapter I. Insurgents, drug lords and anti-drug supply
policies in the Andes 13
Chapter II. Counter-intuitive effects of domestic law enforcement
policies in the United States 41
Chapter III. Spillover effects of domestic law enforcement policies 67
Chapter IV. Drive-by competition? Violence in the drug market 97

Introduction
In spite of the billions of dollars spent to reduce them, illegal drug produc-
tion, drug trafficking, and drug abuse today remain an important problem for many
countries around the world. While the economic cost of drug abuse in the United
States was estimated at $180.9 billion in 2002, and there is an important increase
of drug users in Europe every day, people die in Colombia and Afghanistan, in Cen-
tral America and the Balkans, fighting for some profits in this lucrative business.
Understanding how these drug markets operate is therefore an important issue for
saving lives and resources.
Drugonomics is a study of these markets where the interaction between drug
participants, i.e. suppliers, plays an important role. If the competition between
them is relevant, drug policies affecting the behavior of these participants will ul-
timately affect drug abuse, drug distribution and drug production. Drugonomics
studies the effect of anti-drug policies on these markets through the behavior of
drug participants.
Two facts are important to recognize about drug markets.
First, even though it might sound tautological, drug markets are markets. There
is a demand for and a supply of drugs. One of the first economists to recognize
this fact was the Nobel Prize laureate Gary Becker in 1968 with his research on
the economics of crime. Many have then followed his theoretical framework and a
vast literature on optimal law enforcement has given important insights not only to
the research community but also to policy makers. Policies aimed at increasing the
punishment of criminals and/or their probability of being punished by the enforcing
authority are then expected to also increase the costs of drug production and distri-
bution and, since drug prices perfectly reflect these costs, ultimately decrease drug
abuse. The fact that prices perfectly reflect the costs of production and distribution
means that drug sellers and distributors are sufficiently small in these markets to
affect prices. As a result, drug policies that increase costs will also increase prices
1
2 Introduction
and thus decrease drug abuse. For these reasons, the cost structure in drug markets
becomes very important in this traditional framework.1
While this framework gives the possibility of studying welfare effects of different
types of anti-drug policies in a simple fashion, it also presents some limitations. Em-
pirically, the evidence on drug prices, drug abuse, drug production and distribution
activities does not support the predictions of this framework; and theoretically, the
assumption of perfect competition among sellers and distributors of illegal drugs is
not realistic.2
The second fact about drug markets is that they are illegal. Illegality brings an
important element to these markets. In order to enforce contracts, defend rights,
deter entry, or “steal” competitors’ customers or profits, drug sellers and distributors
in these markets (and also users) make use of violence.
It is the use of violence that makes drug markets different from legal markets and
allow drug sellers and distributors to be sufficiently “large” to affect drug prices. For
instance, participants in these markets must be sufficiently violent to be able to enter
the market or sufficiently violent to be able to defend their market power whenever
it is necessary. Therefore, violence allows competition between drug participants to
have an effect on drug prices and abuse in these markets.
This thesis studies the effects of price and quantity competition among sellers
and distributors of illegal drugs. Our focus is then on market competition among
participants rather than on their cost structure. Hence, the strategic interaction
between drug participants becomes relevant in this “new” framework.3
Since governments have agreed upon the illegal nature of these drug markets,
they have been implementing a range of policies to combat them. From the demand
side, treatment and prevention programs, research programs, and also law enforce-
ment, seek to decrease the size of the market by reducing the number of people
1See Becker and Murphy (2005).2First, there is enough evidence showing the existence of important mark ups over costs which
may reflect market power. Second, the evidence of high profits and the use of violence in these
markets show that free entry and exit may simply not exist. Third, there is no evidence that
policies aimed at increasing the costs of drug production and distribution have indeed increased
drug prices and decreased drug use. See Poret (2003) and Skott and Jepsen (2002) for further
references on this last point.3See Poret (2003) and Skott and Jepsen (2002), among others, for other examples where the
strategic interaction between drug participants is also relevant.
Introduction 3
willing to buy drugs. From the supply side, crop eradication programs, interdiction
programs, alternative development programs, and even law enforcement, seek to
decrease the drug available for consumption.
If competition among drug participants plays an important role in these markets,
and demand and/or supply oriented policies affect their behavior in the market, these
policies may ultimately have an effect on prices, drug abuse, drug distribution and
drug production. This is the line of reasoning that crosses all chapters in this thesis.
In chapter one, we study the drug market in producer countries, particularly
the Andean region, and provide an explanation for the ineffectiveness of anti-drug
supply policies implemented in this region with the aim of reducing illegal drug
production and availability.
According to the U.S. government, the implementation of these “supply” oriented
policies would increase the cost for drug production and transportation, thereby
decreasing its manufacture and availability in the U.S. market, while also raising
wholesale drug prices. However, U.S. expenditures on supply-oriented policies in
Peru and Colombia increased between 1986 and 2000, and potential cocaine and
heroin production and manufacture followed an upward trend. Moreover, while drug
availability on the U.S. market did not show any signs of being reduced, wholesale
cocaine and heroin prices (per pure gram) dropped constantly with fairly stable
purity levels.
This chapter suggests that the strategic interaction between insurgents and drug
lords in this region and their reactions to “supply” oriented policies, have canceled
out their intended effects. In addition, these policies could have affected the insur-
gents’ growth in the region.
We present a model of illegal drug production and manufacture where the drug
market is affected by supply oriented policies. These policies are aimed at decreasing
drug production and manufacture in source countries and are modeled through a
contest between an insurgent group and a government, which is a novel idea. In our
model, drug production will actually increase with the implementation of supply
policies in source countries, since drug lords respond to them by increasing the
manufacture, despite the increase in insurgent spending. In addition, they will have
no effect on drug availability, since they reduce drug productivity and increase the
amount of drug production to the same extent. As a consequence, drug prices remain
unaffected. Furthermore, the insurgent activity in the region will increase with the
4 Introduction
implementation of supply policies since a higher drug production makes insurgents’
revenues sufficiently large relative to the cost of their activity.
In chapter two, we study the drug market at the wholesale level in the United
States.4
Two decades ago, the U.S. government started a “war on drugs” with the ob-
jective of reducing the consumption of illegal drugs, and its related costs, by means
of domestic law enforcement, demand reduction policies, international drug source
policies and interdiction programs. Among all these policies, domestic law enforce-
ment has accounted for almost 50 percent of the federal budget allocated to this war
every year. Implementing domestic law enforcement policies would disrupt domestic
drug markets by dismantling the drug networks transporting and distributing drugs
throughout the United States. This spending should raise drug distribution costs
and increase drug prices by, for example, increasing the probability of arrests and/or
reducing the drugs available to final users, ultimately reducing drug consumption.
However, while domestic law enforcement spending increased over time in the
past two decades, drug distribution activities seemed to follow a non-monotonic
trend, with increases in the first decade and decreases in the second. Cocaine and
heroin prices, two of the main drug problems in the U.S., dropped during the 1980’s
and were fairly stable during the 1990’s, and the estimated consumption of cocaine
and heroin somehow surprisingly increased during the 1980’s and, in the best sce-
nario, slowly started to decrease during the 1990’s.
This chapter provides a possible explanation for the counter-intuitive effects of
domestic law enforcement expenditures on drug distribution activities and drug
prices, and their expected effect on drug consumption. The effect of these expendi-
tures is modeled via the amount of resources drug lords spend on maintaining a drug
distribution network. The aim of our analysis is to sharpen the economic intuition
on how domestic law enforcement spending affects the behavior of drug lords who
sell and distribute drugs.
Domestic law enforcement policies are all possible measures targeting illegal drug
distribution activities. Instead of considering this spending as a policy increasing
the cost of drug distribution as has traditionally been the case, we see it as a policy
that effectively disrupts the connection between drug users and suppliers, which has
an impact on drug lords in reducing their available demand for drugs.
4This chapter is coauthored with Adam Jacobsson.
Introduction 5
This policy is modeled within a conflict framework with drug lords over the
control of distribution channels for illegal drugs, which is novel. The model predicts
drug distribution activities, drug prices, and drug consumption in the U.S.. These
predictions appear to be consistent with the data.
In chapter three, we study the external effects that domestic law enforcement
policies implemented by local governments may have over other markets based on a
vertical structure of the illegal drug industry (i.e. wholesale and retail level), taking
the United States as an example.
In the war against drugs, local and state governments in this country have spent
millions of dollars on law enforcement with the aim of reducing drug consumption
in their territories. These independent efforts by local governments contrast with a
more global structure of illegal drug markets, where drug lords sell and distribute
drugs simultaneously in different territories.
It is then possible that investments in domestic law enforcement policies by local
or state governments might affect illegal drug activities in other areas. This fact
seems to be clear for the U.S. Federal Government. Hence, understanding these
external effects and the incentives that local governments may have to coordinate
their policies is then an important issue for explaining patterns in drug distribution,
drug consumption and prices in different places and also their global trends. This
is the contribution of the present chapter.
The chapter studies the effect that these policies may have on a vertically struc-
tured drug industry, where drug lords buy drugs from an upstream market and
simultaneously sell and distribute them in downstream markets. Our model pre-
dicts that increases in domestic law enforcement policies in one market affect the
optimal decision by drug organizations and not only have consequences at the level
of drug distribution, drug consumption and drug prices in the domestic market, but
also in other markets.
The existence of externalities opens up the possibility for coordination between
governments with the aim of reaching efficiency in the allocation of public resources
at a global sphere. Even though coordination between governments creates a lower
spending of resources, it also results in a higher level of global drug consumption.
Conversely, policies set by independent governments create a lower global drug con-
sumption but a higher spending of resources. These results are found to be robust to
differences in the degree of competition in both the upstream and the downstream
6 Introduction
markets.
Nonetheless, the governments’ incentives to coordinate their levels of domestic
law enforcement policies do depend on the relative level of competition in their
respective downstream markets. We find that governments with identical loss func-
tions are more likely to coordinate their policies, if the level of competition in their
downstream markets is also similar. However, if the level of competition differs
substantially between their markets, one of the governments may find it optimal to
independently set its level of domestic law enforcement policies.
Finally, in chapter four, we study the role of violence at a street-level drug market
in the United States.
Today, crack and powder cocaine, heroin and marijuana abuse constitute serious
drug problems in the United States. The retail distribution, mainly in the hands
of street gangs, accounts for most of the drug related violence in many states and
cities.
Interestingly, the level of violence in drug markets appears to vary with the type
of drug. For instance, the U.S. Department of Justice notes that marijuana markets
are the least violent while the highest level of violence is found in crack cocaine
markets. With marijuana being the drug most abused in the United States and
both drugs being distributed by street gangs, this interesting observation remains
unexplained.
This chapter suggests one possible explanation for this based on the notion that
gangs use violence strategically to compete for customers. In particular, we are
interested in how these incentives relate to properties of the gang and the markets.
We analyze these issues in a two-stage drug gang duopoly model where gangs first
choose the level of violence to inflict on the competitor’s market place and then they
compete in prices.
Two main results are found. First, the more effective is violence in shifting
demand, which we will refer to as the impact of violence, the more attractive it
is to strategically use violence, which tends to increase the equilibrium level of
violence in the market. Second, the cost of switching suppliers also affects the level
of violence in the market depending on how strong is the impact of gang violence.
Some empirical evidence suggests that the model’s predictions are consistent with
the observed difference in the level of violence between crack cocaine and marijuana
markets. Finally, the model might contribute to shed some light on how some anti-
Introduction 7
drug policies affect the level of violence in drug markets.
To conclude this brief introduction, it is worth mentioning the limitations of our
research.
First, even though one of the chapters includes an explicit analysis of optimal
anti-drug policies, welfare analyses where consumer and producer surplus are taken
into account are not studied. Instead, we focus on a positive analysis of the effect
of different anti-drug policies on an imperfect competitive drug market. However,
we do believe that future research should include the study of these issues in these
types of markets.5
The second limitation is the focus on the United States illegal drug industry and,
in particular, on natural drugs such as cocaine, heroin, and marijuana. This choice
was basically due to the existence of a more complete and homogenous data set found
in the United States market relative to other areas around the world. However, we
do believe that the predictions of our models can also be used for understanding
other types of drugs (e.g. amphetamines) and other regions (e.g. Western Europe),
as suggested by some basic evidence.6
The third limitation is precisely the type of data collected from illegal drug mar-
kets in the United States. This data comes from nationally representative samples
(based on households or school populations) that are self-reported and determine
the overall prevalence of drug use; sub-populations samples, not statistically rep-
resented, that determine drug abuse and dependence; Drug Enforcement Agency
(DEA) agents who record the quantity, price, purity, and purchase location of ac-
tual or negotiated drug buys (STRIDE); the Federal Bureau of Investigations (FBI)
reports on crime; and both the Unites States Federal Government and the Office
for Drugs and Crime of the United Nations which publish reports on potential drug
production. All this data presents its own advantages and disadvantages and even
though it only gives a partial view of what might really be happening in these illegal
markets, it is also the only way of getting a closer look at these markets.
The fourth and last limitation of our research is the lack of a serious empirical
analysis of illegal drug markets. The evidence used in all chapters is based on basic
correlations and observable trends more than statistical analysis. We believe this
5See for example Poret (2005) for a study of optimal law enforcement policies.6For further references, see the Annual Report of the European Monitoring Centre for Drugs
and Drug Addiction, 2005: “The State of the drugs problem in the European Union and Norway”.
8 Introduction
to be the next step on the research agenda, but it will depend on the availability of
data.
As a conclusion, and in spite of these limitations, we believe that this thesis
provides a reasonable starting point for formally thinking about the effects of com-
petition on illegal drug markets and the direct or indirect effects of drug policies
in these markets, and invite the public to discover new forms of dealing with these
problems based on a more positive analysis of illegal drug markets.
Introduction 9
References
Becker, G., “Crime and punishment: An economic approach”, Journal of Political
Economy, pp 169-217, 1968.
Becker, G., Murphy, K., and Grossman, M. The market for illegal goods: the case
of drugs. Journal of Political Economy, Vol. 114, pp. 38-60, February 2006.
Caulkins, J. “Domestic Geographic Variation in Illicit Drug Prices”, Journal of
Urban Economics, 37, pp 38-56, 1995.
Caulkins, J., Reuter, P. and Taylor, L. “Can Supply Restrictions Lower Price?
Violence, Drug dealing and Positional Advantage”. Contributions to Economic
Analysis & Policy, Vol. 5, No. 1. 2006.
EMCDDA. Annual Report 2005 “The State of the drugs problem in the European
Union and Norway”, European Monitoring Centre for Drugs and Drug Addic-
tion, 2005.
Everingham, S. and Rydell, P., “Controlling Cocaine. Supply Versus Demand Pro-
grams”, RAND, Drug Policy Research Center, Santa Monica, California, 1994.
Federal Bureau of Investigations, Crime in the United States, Washington D.C.,
1995-2001.
Garoupa, N. “Optimal law enforcement and the economics of the drug market:
Some comments on the Schengen Agreements”. International Review of Law
and Economics, 17, 1997.
Goldstein, P., “The Drug/Violence Nexus: A Tripartite Conceptual Framework”,
Journal of Drug Issues, 14, pp. 493-506, 1985.
Miron, J. “Violence, Guns, and Drugs: A Cross-market Analysis”, Journal of Law
and Economics, vol. XLIV, 2001.
National Institute of Justice. Arrestee Drug Abuse Monitoring (ADAM), 2003.
Office of National Drug Control Policy, National Drug Control Strategy, available at
http://www.whitehousedrugpolicy.gov, 2004.
Office of National Drug Control Policy, The Economic Costs of Drug Abuse in the
United States 1992-2002, available at http://www.whitehousedrugpolicy.gov,
2004.
Poret, S. “Paradoxical effects of law enforcement policies: the case of the illicit drug
market”. International Review of Law and Economics, 22, pp. 465-493. 2003.
––– “An Optimal Anti-Drug Law Enforcement Policy”. CRESTWorking Paper.
10 Introduction
April 2005.
Reuter, P. and Greenfield, V., “Measuring Global Drug markets”,World Economics,
Vol. 4, Number 2, 2001.
SAMHSA, Office of Applied Studies, National Survey on Drug Use and Health, 2002,
available at http://www.oas.samhsa.gov.
Skaperdas, S. “Warlord Competition”, Journal of Peace Research, vol. 39, no. 4,
2002, pp. 435-446.
Skott, P. and Jepsen, G. “Paradoxical effects of drug policy in a model with im-
perfect competition and switching costs”. Journal of Economic Behavior and
Organization, Vol. 48, pp. 335-354. 2002.
United States General Accounting Office, Drug Control reports. 1987 - 2006.
United States Department of Justice. Drug Threat Assessments, National Drug
Intelligence Center, 2001-2004.
–––. National Gang Threat Assessment, National Alliance of Gang Investigators
Associations, 2005.
–––. National Drug Threat Assessment. Report of the Department’s National
Drug Intelligence Center (NDIC), 2004.

Chapter I

Insurgents, drug lords andanti-drug supply policies in the
Andes∗
1 Introduction
Since 1986, the U.S. administration has been spending enormous amounts of re-
sources to decrease the production of cocaine and heroin in source producer coun-
tries, mainly from the Andean region, and their availability on the U.S. market, in
order to reduce the abuse of these drugs. The implementation of these “supply” ori-
ented policies would then increase the cost for drug production and transportation,
thereby decreasing its manufacture and availability in the U.S. market while also
raising wholesale drug prices.
However, U.S. expenditures on supply-oriented policies in Peru and Colombia
increased between 1986 and 2000, and potential cocaine and heroin production and
manufacture followed an upward trend.1 Moreover, while drug availability on the
U.S. market did not show any signs of being reduced, wholesale cocaine and heroin
prices (per pure gram) dropped constantly with fairly stable purity levels.
While these dismal results could merely reflect counter effects of demand oriented
policies implemented in the U.S., or problems associated with the implementation of
supply policies in the Andean region, e.g. lack of commitment by source countries’
governments or corruption, thereby neutralizing the effects of both international and∗I am grateful to Sten Nyberg for his advice, two anonymous referees, Ola Olsson, Sylvaine
Poret, and Mikael Lundholm, Mathias Herzing, workshop participants at the Department of Eco-nomics, Stockholm University, and Conference participants at University of Coimbra, for helpfulcomments.
1Since the year 2000 this illegal market has experienced important structural changes that needs
to be addressed in a different framework. For example, supply oriented policies in this region grew
by almost 600% relative to previous years.
13
14 I: Insurgents, drug lords and anti-drug supply policies in the Andes
interdiction programs, there are also other theoretical reasons why these policies
may have failed to produce the desired effects. This paper suggests one of these
explanations: the strategic interaction between insurgents and drug lords and their
reactions to these policies, have canceled out their intended effects.2
In addition, Peru and Colombia have experienced an accelerated growth of in-
surgents during the same period of time while their governments have spent an
important amount of resources to diminish the insurgent activity in the region.
While the rapid growth experienced by the insurgency in the Andean region might
be explained by social or political factors, some evidence points to its connection
with the illegal drug industry.3 Therefore, supply oriented policies implemented in
the region could have affected its growth.4
We present a model of illegal drug production and manufacture where the drug
market is affected by supply oriented policies. These policies are aimed at decreasing
drug production and manufacture in source countries and are modeled through a
contest between an insurgent group and a government, which is a novel idea.
The drug market is now a simultaneous interaction between drug lords and an
insurgent group. While drug lords produce and sell the drug in a final market, the
insurgent group protects its drug production. By accounting for this interaction,
we are able to predict the counter-productive effects that supply oriented policies
may have had on drug production in source countries, drug availability on the U.S.
market, and the size of the insurgency in the Andean region.
Drug production will actually increase with the implementation of supply policies
in source countries, since drug lords respond to them by increasing the manufacture,
despite the increase in insurgent spending. However, they will have no effect on drug
availability, since they reduce drug productivity and increase the amount of drug
2Insurgents refer to groups which offered protection at any level of the drug production chain
but which does not have any direct links with final markets. Drug lords refer to players in the
drug market directly involved in both production and distribution of the illegal drug to the final
market. See Vargas (1999, 2003) and the United States General Accounting Office’s reports for
further evidence.3A Congressional testimony by a DEA’s deputy in August 1999 said: “An alliance of conve-
nience between guerillas and traffickers is nothing new. Since the 1970s, drug traffickers based in
Colombia have made temporary alliances of convenience with leftist guerillas, or with right wing
groups. In each case, this has been done to secure protection for the drug interests”.4For a complete review of the economic literature on the interaction of narcotics and conflict,
see Cornell (2005).
I: Insurgents, drug lords and anti-drug supply policies in the Andes 15
production to the same extent. As a consequence, drug prices remain unaffected.5
Furthermore, the insurgent activity in the region will increase with the implemen-
tation of supply policies since a higher drug production makes insurgents’ revenues
sufficiently large relative to the cost of its activity.
This paper is related to the broad literature on conflict and appropriation where
Grossman (1991), Skaperdas (1992, 1996) and Hirshleifer (1991, 1995), among oth-
ers, are the leaders.6
Since strategic interactions between players in the drug industry may cause
counter-productive results of anti-drug policies, this paper is also related to Skott
and Jepsen (2002), Poret (2003), and Poret and Téjédo (2006), where aggregated
effects of policies are offset by the incentives created in their interaction. Skott and
Jepsen (2002) model the effects of law enforcement on drug use, focusing on three
features of the drug market: addiction, imperfect competition and the presence of
switching costs and consumer loyalty; Poret (2003) studies the effect of a tougher
drug law enforcement on drug prices in a model of a vertically organized distribu-
tion network; and Poret and Téjédo (2006) study the paradoxical multiplication of
trafickers following increased law enforcement against them.
More specifically, few papers have studied the interaction between drug lords,
insurgents and their response to anti-drug policies. Jacobsson and Naranjo (2004)
examine the behavior of drug lords competing in final markets and how they react
to domestic law enforcement policies. Answering this question, they are able to
explain the trends in drug distribution activities, wholesale drug prices, and drug
consumption in the U.S.. However, the illicit behavior in source countries is not
explicitly modeled.7
Brito and Intriligator (1992) study the symbiosis between a guerrilla warfare and
the drug trade in a three-person differential game (i.e., the guerrilla, the government,
and the drug lords). The focus in their paper is on the role of drug lords in the
guerrilla war where the government can be corrupted, which bears little relation to
the questions analyzed here. However, our modeling approach of the insurgents as
suppliers of protected territory to the drug lord is akin to that in their paper, and
5As will be discussed later on, this result is due to the fact that the marginal cost of drug
production is proportional to its productivity.6See Neary (1997) for a comparison between rent seeking and conflict models.7The present paper can also be extended to allow for domestic law enforcement policies as in
Jacobsson and Naranjo (2004).
16 I: Insurgents, drug lords and anti-drug supply policies in the Andes
also closely related to that in Collier (1999) and Konrad and Skaperdas (1998). The
common ground is that a player extracts rents attached to a certain location (e.g.,
predation of illegal natural resource exports) and needs to finance an initial phase
of growth during which it is unprofitable to operate.
The present paper is structured as follows: section two shows some empirical
evidence while section three sets up the model and presents the key results; the final
section presents a discussion of the results and suggestions for future research.
2 Some empirical evidence
2.1 U.S. International Narcotics Control Expenditure
According to the Office of National Drug Control Strategy, supply policies are clas-
sified in international (e.g., crop eradication, drugs seized in source countries, labs
destroyed, etc.) and interdiction programs (e.g., drugs seized close to the U.S. bor-
der).
Within the U.S. Department of State, the Bureau for International Narcotics and
Law Enforcement Affairs (INL) designs and carries out international counternar-
cotics policies and programs, while advising and coordinating the overseas anti-drug
activities of other U.S. agencies.
The International Narcotics Control program in Peru combines police and mili-
tary assistance; support for intelligence-gathering and air and riverine interdiction;
law enforcement, customs and judiciary training; and demand reduction, develop-
ment and alternative agriculture programs. In Colombia, this program is aimed at
eliminating the cultivation of opium poppy, coca leaf, and marijuana; strengthening
host nation capabilities to disrupt and dismantle major drug trafficking organiza-
tions and preventing their resurgence; destroying the cocaine and heroin processing
industries and stopping the diversion of licit chemicals into illicit channels.
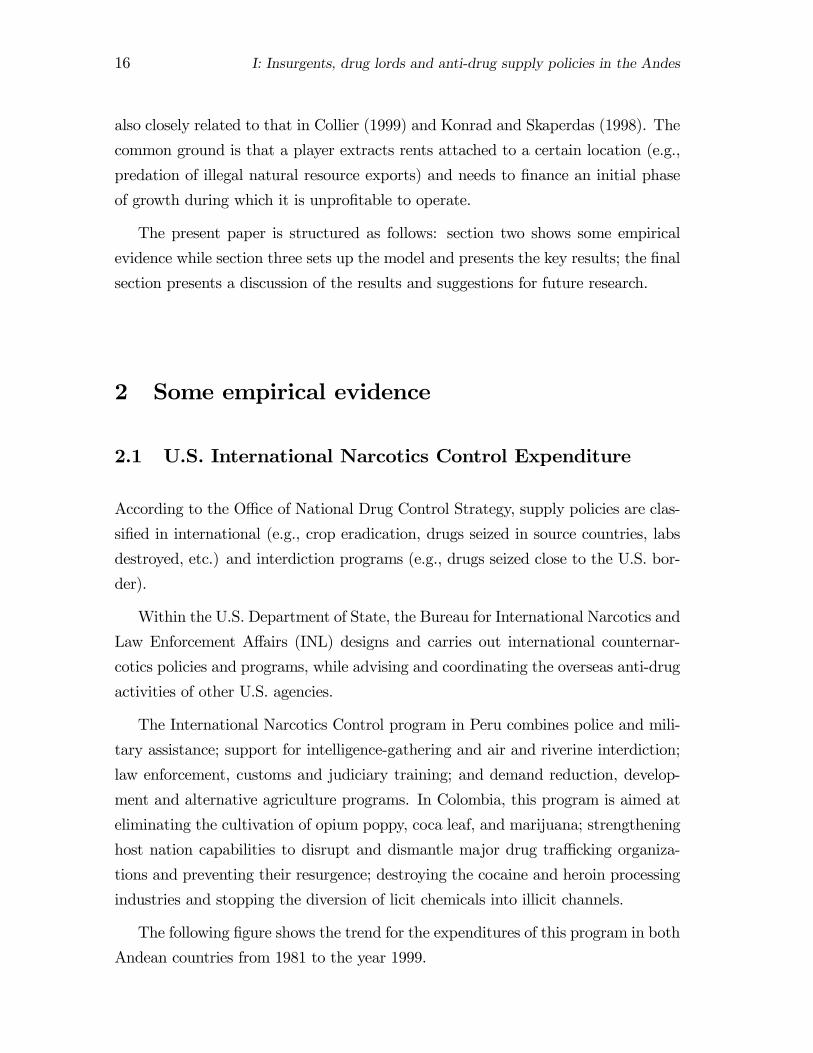
The following figure shows the trend for the expenditures of this program in both
Andean countries from 1981 to the year 1999.
I: Insurgents, drug lords and anti-drug supply policies in the Andes 17
1981
1983
1985
1987
1989
1991
1993
1995
1997
0
10
20
30
40
Figure 1. International Narcotics Control Expenditure in Peru and Colombia
(1979 million US$) (Source: U.S. General Accounting Office reports)
With the exception of a few years, this spending has been growing over time .
2.2 Cocaine and heroin production and availability
In the Andean region, Colombia is the only producer of heroin while Peru, Bolivia
and Colombia all produce cocaine.8 However, the potential heroin production in
Colombia is outweighed by the potential cocaine production in those other countries
(in terms of metric tons) and cocaine production in Peru and Colombia outweighed
the production in Bolivia. For this reason, the data presented in this section is based
on cocaine production and availability in Peru and Colombia.
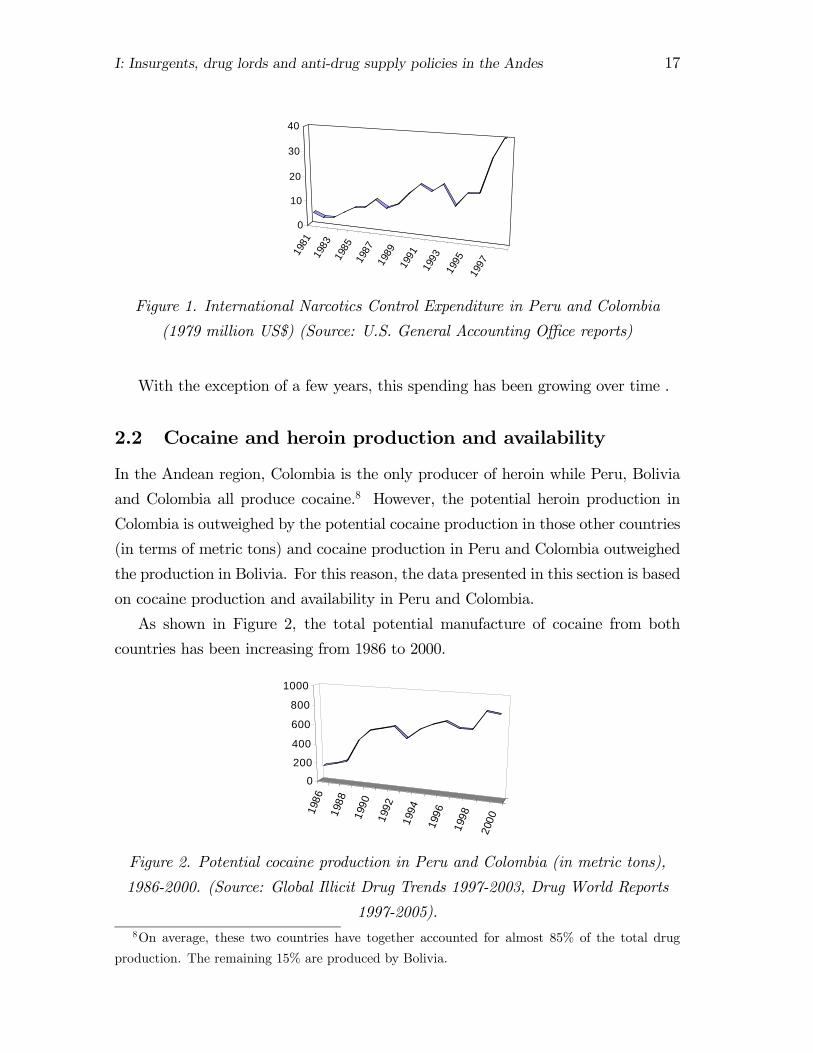
As shown in Figure 2, the total potential manufacture of cocaine from both
countries has been increasing from 1986 to 2000.
1986
1988
1990
1992
1994
1996
1998
2000
0
200
400
600
800
1000
Figure 2. Potential cocaine production in Peru and Colombia (in metric tons),
1986-2000. (Source: Global Illicit Drug Trends 1997-2003, Drug World Reports
1997-2005).8On average, these two countries have together accounted for almost 85% of the total drug
production. The remaining 15% are produced by Bolivia.
18 I: Insurgents, drug lords and anti-drug supply policies in the Andes
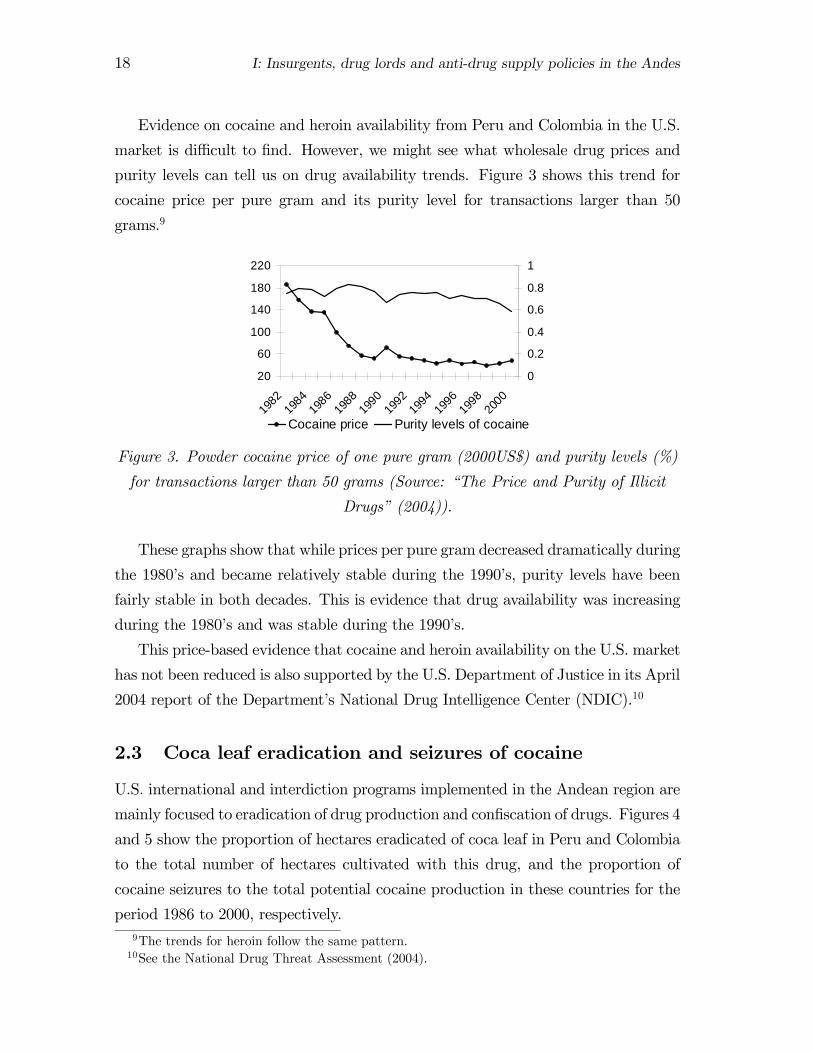
Evidence on cocaine and heroin availability from Peru and Colombia in the U.S.
market is difficult to find. However, we might see what wholesale drug prices and
purity levels can tell us on drug availability trends. Figure 3 shows this trend for
cocaine price per pure gram and its purity level for transactions larger than 50
grams.9
20
60
100
140
180
220
1982
1984
1986
1988
1990
1992
1994
1996
1998
2000
0
0.2
0.4
0.6
0.8
1
Cocaine price Purity levels of cocaine
Figure 3. Powder cocaine price of one pure gram (2000US$) and purity levels (%)
for transactions larger than 50 grams (Source: “The Price and Purity of Illicit
Drugs” (2004)).
These graphs show that while prices per pure gram decreased dramatically during
the 1980’s and became relatively stable during the 1990’s, purity levels have been
fairly stable in both decades. This is evidence that drug availability was increasing
during the 1980’s and was stable during the 1990’s.
This price-based evidence that cocaine and heroin availability on the U.S. market
has not been reduced is also supported by the U.S. Department of Justice in its April
2004 report of the Department’s National Drug Intelligence Center (NDIC).10
2.3 Coca leaf eradication and seizures of cocaine
U.S. international and interdiction programs implemented in the Andean region are
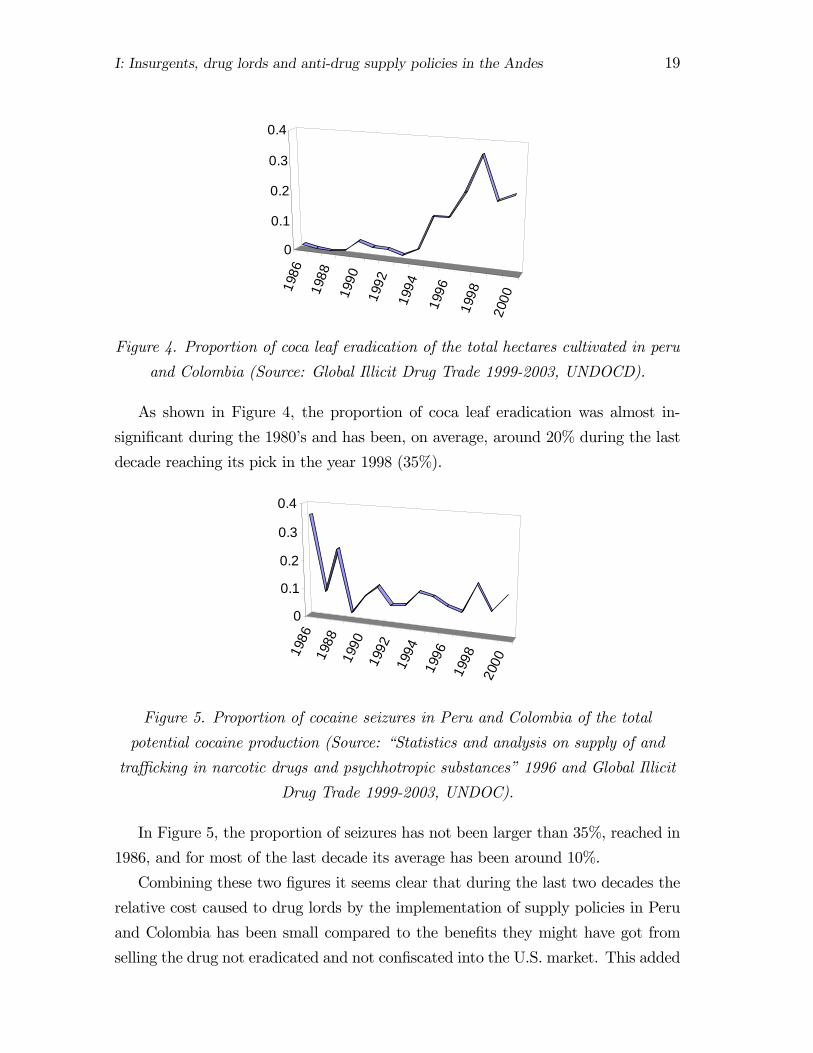
mainly focused to eradication of drug production and confiscation of drugs. Figures 4
and 5 show the proportion of hectares eradicated of coca leaf in Peru and Colombia
to the total number of hectares cultivated with this drug, and the proportion of
cocaine seizures to the total potential cocaine production in these countries for the
period 1986 to 2000, respectively.9The trends for heroin follow the same pattern.10See the National Drug Threat Assessment (2004).
I: Insurgents, drug lords and anti-drug supply policies in the Andes 19
1986
1988
1990
1992
1994
1996
1998
2000
0
0.1
0.2
0.3
0.4
Figure 4. Proportion of coca leaf eradication of the total hectares cultivated in peru
and Colombia (Source: Global Illicit Drug Trade 1999-2003, UNDOCD).
As shown in Figure 4, the proportion of coca leaf eradication was almost in-
significant during the 1980’s and has been, on average, around 20% during the last
decade reaching its pick in the year 1998 (35%).
1986
1988
1990
1992
1994
1996
1998
2000
0
0.1
0.2
0.3
0.4
Figure 5. Proportion of cocaine seizures in Peru and Colombia of the total
potential cocaine production (Source: “Statistics and analysis on supply of and
trafficking in narcotic drugs and psychhotropic substances” 1996 and Global Illicit
Drug Trade 1999-2003, UNDOC).
In Figure 5, the proportion of seizures has not been larger than 35%, reached in
1986, and for most of the last decade its average has been around 10%.
Combining these two figures it seems clear that during the last two decades the
relative cost caused to drug lords by the implementation of supply policies in Peru
and Colombia has been small compared to the benefits they might have got from
selling the drug not eradicated and not confiscated into the U.S. market. This added
20 I: Insurgents, drug lords and anti-drug supply policies in the Andes
to the low costs of drug production and the high prices obtained in the U.S. market
make these costs even more insignificant.
2.4 Insurgents
Insurgents in the Andean region have existed since the beginning of the 1950’s,
before any development in the illegal drug industries. Since then (and for many
years), drug lords have used their territories to produce and manufacture illegal
drugs. These circumstances have made insurgents take advantage of their strategic
position as enforcers of these territories and extract some profits from this illegal
business.
Even though their role in the drug industry has been changing during the last
years, before 1999 the role was mainly to provide protection at different levels of
the drug production and manufacture chain, in exchange for a share in the drug
production.11
According to Echandia (1999), rebel movements did not have the structure and
networking to take over the vacuum left by the disruption of drug cartels during the
1990’s. The frequent ground fire sustained by Colombian National Police aircraft
when engaged in eradication missions over these insurgent “controlled” areas is also
indicative of the extent to which insurgents protect their drug interests.12
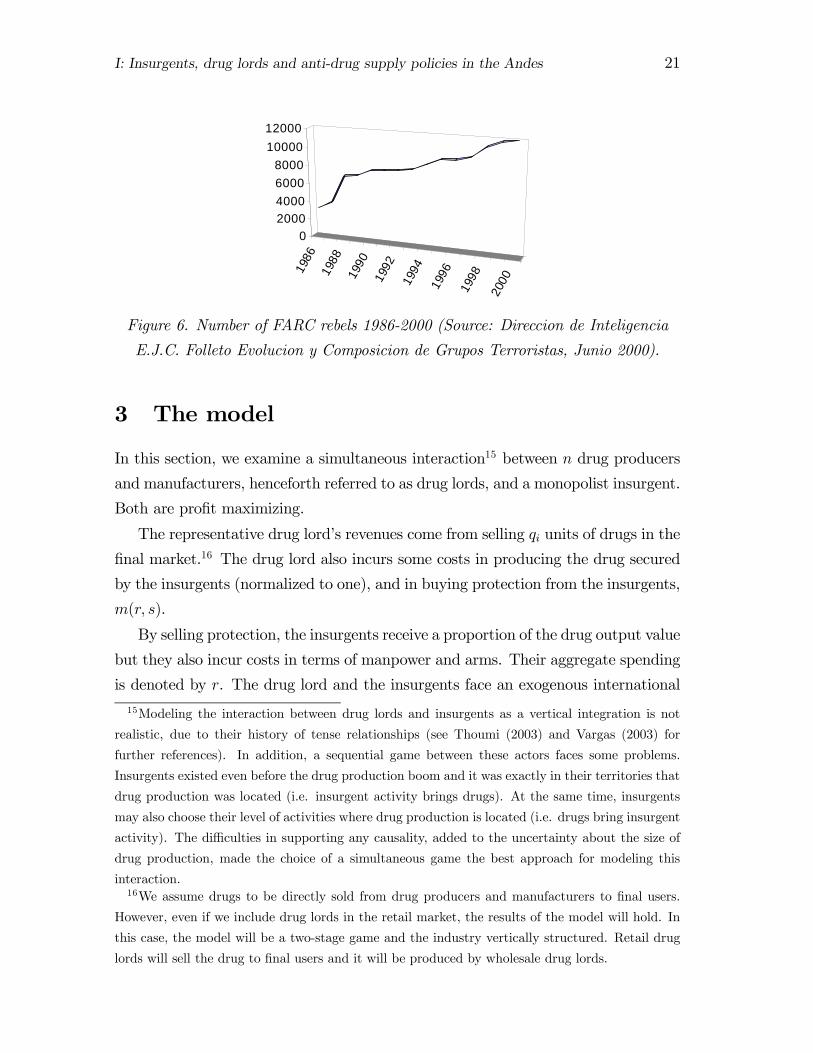
Two of the main insurgents groups that have been actively involved in the illegal
drug business are the “Lighting Path” in Peru and the “FARC” in Colombia.13 This
last group has been the largest in terms of size and insurgent activities.14 Figure 6
presents the trend for the Colombian group.
11For further references on both issues, see Vargas (1999, 2003).12For further references, see the “DEA Congressional Testimony” on August 6, 1999.13Contrary to these two insurgents groups, a third group (the “AUC”), which emerged in Colom-
bia during the mid-1990’s, has been involved at higher levels of the drug production and distribu-
tion in source countries. See also Echandia (1999), Vargas (2003) and Thoumi (2004) for further
references on this issue.14The “Lighting Path” movement grew during the 1980’s, reaching its peak by 1990 and then
decreased along the last decade to being almost extinguished by 1996. Both groups have acted
independently.
I: Insurgents, drug lords and anti-drug supply policies in the Andes 21
1986
1988
1990
1992
1994
1996
1998
2000
02000400060008000
1000012000
Figure 6. Number of FARC rebels 1986-2000 (Source: Direccion de Inteligencia
E.J.C. Folleto Evolucion y Composicion de Grupos Terroristas, Junio 2000).
3 The model
In this section, we examine a simultaneous interaction15 between n drug producers
and manufacturers, henceforth referred to as drug lords, and a monopolist insurgent.
Both are profit maximizing.
The representative drug lord’s revenues come from selling qi units of drugs in the
final market.16 The drug lord also incurs some costs in producing the drug secured
by the insurgents (normalized to one), and in buying protection from the insurgents,
m(r, s).
By selling protection, the insurgents receive a proportion of the drug output value
but they also incur costs in terms of manpower and arms. Their aggregate spending
is denoted by r. The drug lord and the insurgents face an exogenous international
15Modeling the interaction between drug lords and insurgents as a vertical integration is not
realistic, due to their history of tense relationships (see Thoumi (2003) and Vargas (2003) for
further references). In addition, a sequential game between these actors faces some problems.
Insurgents existed even before the drug production boom and it was exactly in their territories that
drug production was located (i.e. insurgent activity brings drugs). At the same time, insurgents
may also choose their level of activities where drug production is located (i.e. drugs bring insurgent
activity). The difficulties in supporting any causality, added to the uncertainty about the size of
drug production, made the choice of a simultaneous game the best approach for modeling this
interaction.16We assume drugs to be directly sold from drug producers and manufacturers to final users.
However, even if we include drug lords in the retail market, the results of the model will hold. In
this case, the model will be a two-stage game and the industry vertically structured. Retail drug
lords will sell the drug to final users and it will be produced by wholesale drug lords.
22 I: Insurgents, drug lords and anti-drug supply policies in the Andes
policy, s, measured in terms of expenditures.
The total drug production that is secured by drug lords in source countries, Q,
then has the following technology:17
Q = m(s, r)nXj=1
qj, (1)
where qj is the drug production by drug lord j, andPn
j=1 qj is total drug production.
On the other hand, m(s, r) can be interpreted as productivity per hectare, which
is a function of the level of supply policies, s, and insurgent spending, r. This
productivity per unit of drug has the following properties: ∂m(s,r)∂s
< 0, ∂m(s,r)∂r
> 0,
and ∂2m(s,r)∂2s
> 0.
A suitable function for m(s, r) which exhibits the previously mentioned prop-
erties might, for example, be a simple version of the classic Tullock rent seeking
function.18 Define productivity per hectare, m(s, r), as the ratio of total insur-
gent activity to the sum of both supply anti-drug policies and insurgent activity.19
Therefore,
m(s, r) =r
r + s. (2)
The marginal cost of producing qi units of drugs is normalized to one and the
amount of drug production paid to the insurgent group20 equals αqi. The total drug
production that is secured in source countries and reaches the final market,21 Q, is
then sold in the final market at the price γ > 0 (the inverse demand).
17In a more general case, q = mϑwβcλ, where λ,β,ϑ > 0. Input factor w represents workers
and/or other intermediate inputs for drug production. In the paper, w is assumed to be fixed and
equal to one. If ϑ 6= 1, our results still hold. For simplicity, we assume that ϑ = 1.18We refer to Tullock (1980) and Konrad and Skaperdas (1998) for more on this functional form.
See also Hirshleifer (1991) and Skaperdas (1996) for a discussion on contest success functions. In
a more general function of the type m(s, r) = φ(r)φ(r)+φ(s)+φ(ρ) , where
∂φ(r)∂r is constant, the main
results of the paper still hold.19A parameter ρ > 0 can be added to avoid the possibility of r = 0, when s = 0. This parameter
would indicate that, even in the absence of these policies, other mechanisms such as employee
thefts, would tend to depreciate drug output. However, to make the model as simple as possible,
without affecting our main results, this case is ruled out.20Since we assume the price for the drug secured to be equal to one, α can either be interpreted
as a share of drug production or as a share of drug revenues.21In equilibrium, drug availability in the final market equals drug sales.
I: Insurgents, drug lords and anti-drug supply policies in the Andes 23
To simplify the analysis, we assume a linear aggregate demand function22 equal
to qd = a− bγ, where b > 0 is the price sensitivity parameter and a > 0 the demandparameter.
Hence, the equilibrium condition in the final market is qd = Q, or in terms of
the inverse demand function:
γ =a
b− Qb. (3)
Now, what follows is to specify the problems for each player.
3.1 Drug lords
Having defined the drug lord’s revenues and costs, total profits for the representative
drug lord i are:
πi = γ (m(s, r)qi)− (1 + α) (m(s, r)qi) . (4)
Notice that for drug production to be a profitable venture, it is necessary that the
willingness to pay for the first unit, ab, exceeds the marginal cost, (1+α). We assume
this to be the case.
Drug lord i then chooses drug production, qi, given the levels of supply policies
s, and insurgent activity, r. While the drug lord pays for protection with part of
the drug production, he does not have any control over how much will be protected
as this is an insurgent’s decision. In addition, even though supply policies decrease
the drug lord’s drug production, they also decrease the cost paid by the drug lord
to the same extent. Therefore, supply policies increase the drug lord’s profits by
increasing the drug price.23
The first-order condition with respect to qi is:24
22See Burrus (1999) for references on the same specification. Skott and Jepsen (2002) instead
assumed a constant price elasticity specification, whereas Poret (2003) assumed a fixed consumption
of one unit per drug user.23In our specification, we assume that the drug lord does not pay the cost for the drug that is
not secured. The evidence supports this assumption. The average of the proportion of hectares
eradicated over the area cultivated in Peru and Colombia between 1986 and 2000 has only been
11% and evidence from the Drug Enforcement Administration shows that the proportion of drugs
seized by authorities of the total drug manufactured is estimated to be between 10% and 15%.
These facts make the cost paid by drug lords for the drug that is not secured insignificant relative
to the cost for the drug that is secured.24The second-order condition is always negative.
24 I: Insurgents, drug lords and anti-drug supply policies in the Andes
∂πi∂qi
= m(s, r)
Ãa
b− m(s, r)
b
ÃnXj=1
qj + qi
!− (1 + α)
!≤ 0.
In addition, we have the complementary slackness condition for the corner solu-
tion. Assuming symmetry and solving for q yields:
q =
µr + s
r
¶µb
(n+ 1)
³ab− (1 + α)
´¶. (5)
This is the drug lord’s best response function with respect to the insurgent
activity. As we notice, an (a) increase (decrease) in this spending will decrease
(increase) drug production.
Expression (5) implies that for a given insurgent activity, an increase in supply
policies raises drug production. Since the insurgent activity affects the drug lord’s
best response, any change in its level, due to changes in supply anti-drug policies,
will have an indirect effect on drug production. Therefore, the net effect of an
increase in an anti-drug supply policy will depend on the direction and level of both
the direct effects (∂nq(r)∂s) and the indirect effects (∂nq(r)
∂rdrds).
3.2 The insurgency
The insurgents maximize profits by choosing the level of their spending, r, to secure
total drug production,Pn
j=1 qj. Their revenue comes from the proportion of drug
production received from the drug lord,25 αQ, while the total cost is equal to r.
Hence,
πr = αm(s, r)nXj=1
qj − r. (6)
Here, the cost of the insurgent activity is assumed to be independent of the
amount of drugs produced and manufactured,26Pn
j=1 qj.25Decreases in α reflect a lower participation for the insurgency in the illegal business, which
can be the consequence of a higher competition for the territories with drug production and man-
ufacture.26When the total cost is equal to r
Pnj=1 q
λj , the same conclusions can be reached if λ < 1. In
other words, a marginal increase in drug production and manufacture must marginally increase
the insurgent’s revenue more than its cost. There is strong evidence supporting this assumption.
See, for example, Angrist and Kugler (2005).
I: Insurgents, drug lords and anti-drug supply policies in the Andes 25
The first-order condition of equation (6) with respect to r is:27
∂πr∂r
= α
µs
(r + s)2
¶ nXj=1
qj − 1 ≤ 0.
Hence,
r =
vuutαsnXj=1
qj − s. (7)
Notice that for a given level of drug production, supply policies have a non-
monotonic direct effect, which increases (decreases) insurgent activity ifPn
j=1 qj >
4 sα(Pn
j=1 qj < 4 sα)..e. the level of anti-drug supply policies should be sufficiently
low as compared to the size of drug production in order to give positive profits to
the insurgents.
Notice that for a given level of drug production, supply policies have a non-
monotonic direct effect, which increases (decreases) insurgent activity ifPn
j=1 qj >
4 sα(Pn
j=1 qj < 4sα).
However, anti-drug supply policies directly affectPn
j=1 qj and indirectly affect
the insurgent activity through the insurgent’s best response function. As an increase
in drug production increases the insurgent activity (equation (7)), any change inPnj=1 qj from changes in supply policies will have an indirect effect on the insurgent
activity. Therefore, the net effect of an increase in these anti-drug policies will
depend on the direction and level of both the direct effects (∂r(c)∂s) and the indirect
effects (∂r(nq)∂nq
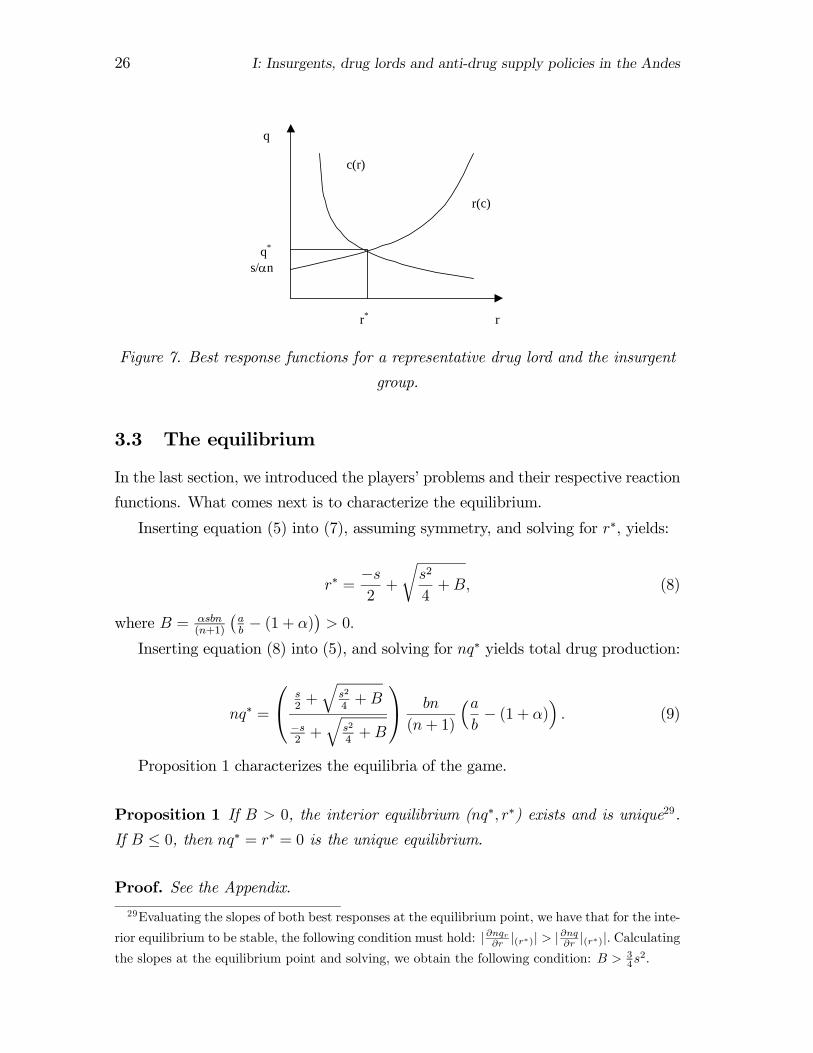
dnqds). Figure 7 illustrates the best response for a representative drug
lord and the insurgents.28
27The second-order condition always holds ifPnj=1 qj > 0.
28In a simultaneous game, best responses are more a technical and illustrative device since players
do not react to each other’s strategies.
26 I: Insurgents, drug lords and anti-drug supply policies in the Andes
r* r
q* s/αn
q
c(r)
r(c)
Figure 7. Best response functions for a representative drug lord and the insurgent
group.
3.3 The equilibrium
In the last section, we introduced the players’ problems and their respective reaction
functions. What comes next is to characterize the equilibrium.
Inserting equation (5) into (7), assuming symmetry, and solving for r∗, yields:
r∗ =−s2+
rs2
4+B, (8)
where B = αsbn(n+1)
¡ab− (1 + α)
¢> 0.
Inserting equation (8) into (5), and solving for nq∗ yields total drug production:
nq∗ =
⎛⎝ s2+q
s2
4+B
−s2+q
s2
4+B
⎞⎠ bn
(n+ 1)
³ab− (1 + α)
´. (9)
Proposition 1 characterizes the equilibria of the game.
Proposition 1 If B > 0, the interior equilibrium (nq∗, r∗) exists and is unique29.
If B ≤ 0, then nq∗ = r∗ = 0 is the unique equilibrium.
Proof. See the Appendix.29Evaluating the slopes of both best responses at the equilibrium point, we have that for the inte-
rior equilibrium to be stable, the following condition must hold: |∂nqr∂r |(r∗)| > |∂nq∂r |(r∗)|. Calculating
the slopes at the equilibrium point and solving, we obtain the following condition: B > 34s2.
I: Insurgents, drug lords and anti-drug supply policies in the Andes 27
Having found the equilibrium values for drug production and insurgent activity,
we then calculate drug availability in equilibrium, which is the drug output secured
from supply policies,
Q∗ =bn
(n+ 1)
³ab− (1 + α)
´. (10)
Furthermore, inserting (10) into (3) yields the drug price in equilibrium
γ∗ =1
(n+ 1)
³ab+ n(1 + α)
´. (11)
To conclude, the insurgent’s and the representative drug lord’s profits in equi-
librium become
π∗i =bn
(n+ 1)2
³ ab− (1 + α)
´2. (12)
π∗r =αbn
(n+ 1)
³ab− (1 + α)
´+s
2−rs2
4+B, (13)
where B = αsbn(n+1)
¡ab− (1 + α)
¢.
The following subsection analyses these values in equilibrium.
3.4 Comparative Statics
This section examines the effects in the equilibrium due to changes in some para-
meters and, in particular, in supply oriented anti-drug policies. Since the effects of
demand parameters a and b are obvious, we skip their analysis.
3.4.1 Insurgent spending
In the interior equilibrium (equation (8)), an increase in supply policies has a
non-monotonic direct effect on the insurgent activity: at low levels it is positive
(nq > 4 sα), while turning negative at high levels (nq < 4 s
α), and there is a positive
indirect effect through the increase in total drug production. When the size of drug
production is sufficiently large, any increase in supply policies makes the insurgent
activity increase since the marginal benefit is higher than its marginal cost. On
the other hand, when drug production is sufficiently small, the marginal cost of the
insurgent activity is higher than its marginal benefit and decreases. These are the
28 I: Insurgents, drug lords and anti-drug supply policies in the Andes
direct effects. However, the size of drug production changes positively with supply
policies and a larger size increases the marginal benefit of the insurgent activity.
These are the indirect effects. The net effect is an increase in insurgent spending
when supply policies increase. Therefore, the indirect effect is always greater than
the direct effect when drug production is sufficiently small.
In addition, an increase in the proportion of the drug production obtained by
the insurgents, α, has a non-monotonic effect on r. This is because increases in α
do not always increase insurgent spending due to the indirect effect of a decrease in
drug production, which we know reduces the insurgent activity.
Furthermore, an increase in market competition between drug lords will increase
the insurgent activity in equilibrium, due to the increase in total drug production
(an obvious result) which increases the marginal benefit of this spending.
Proposition 2 summarizes these results.
Proposition 2 Insurgent activity, r∗: (i) increases with supply policies, s, and the
number of drug lords, n; and (ii) has an inverse U-shape in the fraction paid for
protection, α: it increases for low values and decreases for high values.
Proof. Immediate with respect to n. See the Appendix for s and α.
3.4.2 Drug production and availability
In the interior equilibrium (equation (9)), an increase in supply policies has a positive
effect on drug production. Once more, the balance between the direct and indirect
effects depends on the amount of drug production. An increase in supply policies
reduces the productivity per hectare (direct effect), which allows the drug lords to
increase drug production as the marginal revenue is higher than the marginal cost.
However, depending on the size of drug production, the insurgents will increase or
decrease their activity (indirect effect). In equilibrium, even though the insurgent
activity increases, productivity per hectare decreases to such an extent that drug
production must increase.
Furthermore, increases in competition in the drug market raise drug produc-
tion but it is decreased by a higher proportion of drug production obtained by the
insurgents. These are two straightforward results.
Proposition 3 summarizes the comparative statics of equation (9).
I: Insurgents, drug lords and anti-drug supply policies in the Andes 29
Proposition 3 Drug production in equilibrium, nq∗: (i) increases with supply poli-
cies, s, and the number of drug lords, n; (ii) decreases with the fraction paid for
protection, α.
Proof. Immediate for s and n. See the Appendix for α.
In terms of drug availability in equilibrium, equation (10) implies that it is not
affected by supply policies. There are two opposite effect. Increases in supply policies
raise drug production but also decrease productivity per hectare. These effects are
exactly compensated leaving the drug availability unchanged.
Proposition 4 sums up the main findings.
Proposition 4 Drug availability, Q∗: (i) decreases with the fraction paid for pro-
tection, α; (ii) increases with the number of drug lords, n; (iii) is not affected by
supply policies, s.
3.4.3 Drug price and profits
As can be seen from equation (11), supply policies do not affect the drug price in
equilibrium. The reason is that these policies decrease the productivity per hectare
and increase the equilibrium drug production to the same extent, leaving drug avail-
ability unchanged and the drug price constant.
Moreover, increases in competition between drug lords reduce the drug price
in equilibrium, since drug availability increases. However, a higher proportion of
drug production obtained by the insurgents, α, increases the drug price, since drug
production is reduced. These are two straightforward results.
Proposition 5 sums up the comparative statics of the drug price in equilibrium.
Proposition 5 Drug price in equilibrium, γ∗ : (i) increases in α; (ii) is not affected
by supply policies, s; (iii) decreases with the number of drug lords, n.
Proof. Immediate with respect to s and α. See the Appendix for n.
In terms of the profit levels in equilibrium for both drug lords and insurgents,
equations (12) and (13), an increase in supply policies does not affect the represen-
tative drug lord’s profits but reduces those of the insurgent. This is because neither
30 I: Insurgents, drug lords and anti-drug supply policies in the Andes
drug availability nor drug price are affected by these policies in equilibrium. How-
ever, the insurgent’s profits in equilibrium are negatively affected, since an increase
in these policies raises insurgent activities.
Proposition 6 sums up these and other results.
Proposition 6 Drug lord’s profits, π∗i : (i) decrease with the number of drug lords,
n;(ii) are not affected by supply policies, s. Rebel’s profits, π∗r; (iii) increase with
the number of drug lords, n; (iv) decrease with supply policies, s.
So far, we have taken the government’s actions as given. However, it can be
interesting to study how a government would set the level of anti-drug supply policies
depending on its objective function. For simplicity, we can derive some conclusions
by looking at the profit functions for both players, without explicitly setting the
government’s problem.
According to propositions 3, 4 and 5, supply policies increase drug production
and manufacture and do not affect drug availability and prices. Therefore, a ra-
tional government with the objective of minimizing drug availability will not invest
resources in these types of policies. The same conclusion is reached if the govern-
ment is interested in minimizing the drug lords’ profits or maximizing the drug price
level.
On the other hand, if a government is interested in minimizing the insurgent
activity, r, it will not invest in supply policies since increases in these policies will
raise activity. However, if it wants to minimize the insurgent’s profits, it should set
a positive level for these policies.
4 Discussion
By introducing strategic interactions between a drug lord and an insurgent group,
this paper provides an explanation for both the poor results from the implementa-
tion of supply policies in the Andean region by the U.S. government, and the poor
performance in reducing insurgent activity in the region by the Andean governments.
Contrary to expectations, the model predicts that supply oriented policies in-
crease drug production and manufacture in source countries but do not affect drug
I: Insurgents, drug lords and anti-drug supply policies in the Andes 31
availability and drug prices30 in the final market. In addition, these policies increase
the level of insurgent activity. While these predictions of the effect of supply policies
are well supported in the trends of cocaine and heroin production and the level of
insurgent activity in the Andean region between 1982 and 2000, this only explains
the trends for cocaine and heroin availability and wholesale prices in the U.S. during
the 1990’s. In this decade, supply policies were at their highest and the availability
of these drugs and their prices remained fairly stable. However, a decade before,
cocaine and heroin availability on the U.S. market had increased and the prices de-
creased. Our model suggests that these trends may be explained by the increase in
the number of drug lords. Even though this increase was more evident during the
1990’s when the Cali and Medellin drug organizations were disrupted, it was also
the case that, far from being economic cartels that decided on drug production to
maximize joint profits, these organizations were formed by many small drug lords
under a unique enforcer whose function was simply to enforce peace among the
members.31 Since these organizations grew rapidly during the 1980’s, this growth
might possibly be explained by an increase in the number of drug lords.
The predictions obtained in this paper are based on one assumption. While
supply policies decrease the aggregate availability of drugs, increasing the price and
therefore the profit for each drug lord, they decrease drug production and its cost for
each drug lord to the same extent, thereby leaving its profit unchanged. Some data
supports this assumption. First, the average between the years 1986 and 2000 of
the proportion of coca leaf and poppy eradication over their total cultivated area in
Peru and Colombia has only been around 10% (see Figure 4 in section two). Second,
the costs of growing coca leaf and opium poppy are almost insignificant for a drug
lord, which makes the 10% an even smaller number. And third, the proportion of
drugs seized by the authorities to the total drugs manufactured is usually estimated
to be between 10% and 15% which can be supported by the proportion of cocaine
seized in Peru and Colombia (see Figure 5 in section two). These facts make the
cost of the drug secured through the insurgent group by the drug lords the most
relevant cost for them.
30Rydell and Everingham (1994) have claimed that international and interdiction programs have
small effects on drug prices, whereas Crane, Rivolo and Comfort (1997) have claimed a strong em-
pirical relationship. According to Manski, Pepper and Thomas (1999), this issue remains unsettled.31See Skaperdas (2001) and Thoumi (2002) for further references.
32 I: Insurgents, drug lords and anti-drug supply policies in the Andes
As we have seen, once the drug market is analyzed as a strategic interaction be-
tween drug lords and insurgents, their simultaneous reaction to these supply policies
offsets the intended effect of these policies on drug production, drug availability, and
drug prices. As a result, drug lords’ profits are not affected by these policies whereas
the insurgent’s profits are reduced. Therefore, a government aiming at minimizing
insurgents’ profits would invest resources in supply policies whereas a government
wanting to minimize either drug production and manufacture in source countries
or drug availability on the final market, would not. Since the insurgent activity
increases with supply policies, a government wanting to reduce this activity would
not invest in these policies either.
In contrast to these predictions, the U.S. government has invested enormous
amounts of resources in the Andean region in the form of supply policies in cooper-
ation with the Colombian and Peruvian governments. In the light of our paper, this
remains a puzzle, unless these governments have a different theory which supports
their policies, as seems to be the case.32 Why is this the case, remains an open
question to future research.
To sum up, the present paper discusses the effects of supplying anti-drug policies
when strategic effects between a drug lord and insurgents are taken into account.
The main conclusion from the paper is that supply policies may have had a counter-
productive effect on the drug industry in the Andean region until the year 2000,
since drug lords could react to them by increasing the amount of drug production
and manufacture offsetting the decrease in drug productivity, resulting in a null
effect on drug prices and drug availability. This, in turn, encouraged insurgents to
increase their activity in source countries.
This paper also has some limitations. Supply policies are usually classified into
international and interdiction policies. We abstract from this difference and instead
assume that both affect drug market participants in the same way. Since the paper
focuses on the Andean region, we believe that this generalization does not affect our
predictions since both types of policies have a similar effect on each player.
32As suggested by the U.S. government’s drug strategy reports, they believe that supply policies
affect the drug production costs of drug lords in a competitive illegal market. In this case, higher
costs due to increases in supply policies would be reflected in lower drug production and drug
availability, and in higher prices, specially under a fairly stable demand for drugs. Hence, strategic
interactions between players in these markets are ruled out from the analysis. However, neither
are their assumptions well supported nor do their predictions fit the evidence.
I: Insurgents, drug lords and anti-drug supply policies in the Andes 33
A second limitation is that this paper studies the illegal drug market in the
Andean region only until the year 2000. There are mainly two reasons for this:
supply oriented policies experienced a dramatic change after that year, which has
made the costs of drug production faced by drug lords more relevant, and the roles
played by drug lords and insurgents may certainly have changed since then. For that
reason, the model’s predictions must be used with caution if we want to understand
the effect of supply policies in the Andean region after the year 2000 and this analysis
is left open for future research.
Nonetheless, this paper constitutes a step forward in the analysis of the ef-
fects of anti-drug supply policies on the illegal drug industry in the Andean region.
Empirical research to test the theoretical implications of the paper should also be
encouraged for future research.
34 I: Insurgents, drug lords and anti-drug supply policies in the Andes
References
Angrist, J. and Kugler, A. “Rural windfall or a new resource course? Coca, in-
come and civil conflict in Colombia”. National Bureau of Economic Research,
Working Paper No. 11219, March 2005.
Becker, G., “Crime and punishment. An economic approach”, Journal of Political
Economy, pp 169-217, 1968.
Brito, D., and Intriligator, M. “Narco-Traffick and Guerrilla Warfare: A New Sym-
biosis”, Defense Economics, 3, 263-274 pp. 1992.
Burrus, R., Jr., “Do efforts to Reduce the Supply of illegal Drugs Increase Turf War
Violence? A Theoretical Analysis”, Journal of Economics and Finance, Vol.
23, Number 3, pp 226-234, Fall 1999.
Chalk, P., and Rabasa, A. “Colombian Labyrinth”, RAND Corporation, 2001.
Collier, Paul., “Rebellion as a Quasi-Criminal Activity”, Journal of Conflict Reso-
lution, Vol. 44, No. 6, December 2000, 839-853.
Crane, B., Rivolo, A., and Comfort, G. An Empirical Examination of Counterdrug
Interdiction Programs Effectiveness, paper prepared for the Institute of Defense
Analysis, Washington, D.C., 1997.
Cornell, S. “The Interaction of Narcotics and Conflict”, Journal of Peace Research,
Vol. 42, No. 6, 2005.
Everingham, S. and Rydell, P., “Controlling Cocaine. Supply Versus Demand Pro-
grams”, RAND, Drug Policy Research Center, Santa Monica, California, 1994.
Grossman, H.I. “A general equilibrium model of insurrections” American Economic
Review, Vol. 81, pp 912-21, 1991.
Hirshleifer, J., “The technology of conflict as an economic activity”, American Eco-
nomic Review, Vol. 81, pp 130-134, 1991.
––– “Anarchy and its breakdown”, Journal of Political Economy, Vol. 103, pp
26-52, 1995.
Jacobsson, A., and Naranjo, A. “Drug lords and demand anti-drug policies”, Work-
ing Paper, Department of Economics, Stockholm University, 2004.
Kay, B. “Violent Opportunities: The rise and fall of “King Coca” and Shining Path”.
Journal of Interamerican Studies and World Affairs, 1999, pp. 97-127.
Konrad, K., and Skaperdas, S., “Extortion”, Economica, (1998) 65, 461-477.
Manski, C., Pepper, J., and Thomas, Y. Assessment of Two Cost Effectiveness
I: Insurgents, drug lords and anti-drug supply policies in the Andes 35
Studies on Cocaine Control Policy, National Academy Press, Washington, D.C.,
1999.
McCormick, G. The Shining Path and the Future of Peru. RAND Corporation.
National Defense Research Institute. 2003.
Ministry of National Defense, Colombia, “El Narcotrafico: Una Amenaza para la
Seguridad Nacional”. October, 2000.
Neary, H.,“A comparison of rent-seeking models and economic models of conflict”,
Public Choice, 93, 373-388, 1997.
Office of National Drug Control Policy, National Drug Control Strategy, available
at http://www.whitehousedrugpolicy.gov, 1995-2003.
––– The Price of Illicit Drugs: 1981 through the Second Quarter of 2003. No-
vember 2004.
––– What America’s users spend in illegal drugs 1988-2000. December 2001.
Poret, S. “Paradoxical effects of law enforcement policies: the case of the illicit drug
market”. International Review of Law and Economics, 22, 2003.
Poret, S. and Téjédo, C. “Law enforcement and concentration of illicit drug mar-
kets”. European Journal of Political Economy, 22, 2006.
Skaperdas, S., “Cooperation, conflict, and power in the absence of property rights.
American Economic Review, Vol. 82, 720-39. 1992.
––– “Contest success functions”, Economic Theory, Vol. 7, pp 283-290, 1996.
––– “The political economy of organized crime: providing protection when the
state does not”, Economics of Governance, Vol. 2, pp 173-202, 2001.
––– “Warlord Competition”, Journal of Peace Research, vol. 39, no. 4, 2002,
pp. 435-446.
Skott, P., and Jepsen, G., “Paradoxical effects of drug policy in a model with im-
perfect competition and switching costs”. Journal of Economic Behavior and
Organization, Vol. 48, pp 335-54. 2002.
Thoumi, F., El imperio de la droga: Narcotrafico, economia y sociedad en Los Andes.
Instituto de Estudios Politicos y Relaciones Internacionales- IEPRI; Universi-
dad Nacional de Colombia. Editorial Planeta, 2002. Challenges in Implement-
ing Plan Colombia. October, 2002.
Tullock, G., “Efficient rent seeking”, in Buchanan, J., and Tollison, R., Tullock, G.,
(eds), Toward a theory of the rent seeking society, Texas, 1980.
United Nations Office of Drugs and Crime (UNDCO), Global Illicit Drug Trade,
36 I: Insurgents, drug lords and anti-drug supply policies in the Andes
1999-2003.
United States Department of Justice, National Drug Threat Assessment. Report of
the Department’s National Drug Intelligence Center (NDIC), 2004.
United States General Accounting Office, National Security and International Af-
fairs Division, “Drug Control: US Drug Interdiction Issues in Latin America”,
October, 1994.
––– “Drug Control: US antidrug efforts in Peru’s Upper Huallaga Valley”. De-
cember, 1994.
––– “Review of Assistance to Colombia”, December, 1995.
––– “Drug Control: US counternarcotics efforts in Colombia face continuing
challenges”, February, 1998.
––– “Drug Control: US Efforts in Latin America and the Caribbean”, 2000.
–––“Drug Control: US International Narcotics Control Activities”, March, 1988.
––– “Drug Control: International Narcotics Control Activities of the United
States”, January, 1987.
Vargas, R. Drogas, Conflicto armado y Desarrollo Alternativo: Una perspectiva
desde el Sur de Colombia. Transnational Institute. 2003.
––– “The Revolutionary Armed Forces of Colombia (FARC) and the Illicit Drug
Trade”. Transnational Institute (TNI), Washington, DC, June 1999.
I: Insurgents, drug lords and anti-drug supply policies in the Andes 37
Appendix
Proposition (1)
(a) The interior equilibrium: We need to prove that both best response functions
cross once and only once. B > 0 implies nq(r) > B ∀r > 0 and ∂nq(r)∂r
< 0, given
nq(r) continuity and differentiability. Therefore, nq(r) ∈ (∞, B)∀r > 0. On the
other hand, the inverse best response function for the rebel movement (i.e., in terms
of r), nqr(r) > sα∀r > 0 and ∂nqr(r)
∂r> 0, given nqr(r) continuity and differentiability.
Therefore, nqr(r) ∈ ( sα ,∞) ∀r > 0. Sincesα< ∞ and B < ∞, then both response
functions must cross. Since ∂nq(r)∂r
< 0 and ∂nqr(r)∂r
> 0, they cross only once.
(b) The corner solution: If B ≤ 0 then nq(r) = 0. Moreover, r(nq = 0) = 0 as
nq < sα(assuming that s > 0 and α > 0). Q.E.D.
Proposition (2)
(1) To prove that r∗ increases with supply oriented policies s, we take the first
derivative of equation (8) with respect to s and get:∂r∗
∂s= −1
2+
s2+Bs
2
qs2
4+B= 1
2
qs2
4+B
∙−q
s2
4+B +
q¡s2+ B
s
¢2¸= 1
2
qs2
4+B
∙−q
s2
4+B +
qs2
4+B + B2
s2
¸> 0. Q.E.D.
(2) To prove that r∗ has a hump-shaped relationship to α for positive values of r∗
and α, it is sufficient to show that equation (8) is strictly concave and achieves a
maximum for α > 0. First, let us examine the concavity:∂2r∗
∂2α= 2
¡∂B∂α
¢ ¡s2
¢ ³s2
4+ αBs
´−12+³
s2
2
´ ¡α¡∂B∂α
¢+B
¢2µ−12
³s2
4+ αBs
´−32
¶< 0. Hence, we have strict concavity, as
B > 0, and α > 0. Setting the first derivative of equation (8) with respect to α, to
zero, and solving for α yields: αmax = 12
¡ab− 1¢> 0 (as r∗ > 0) . Hence, equation
(8) peaks for a positive value of α. Q.E.D.
Proposition (3)
(1) We need to prove that nq∗ decreases for any value of α. Taking the first derivative
of equation (9) with respect to α, we have:
∂nq∗
∂α= B(
− 12s(
14+αB
s )− 12 (B−αb
2 )³−12+√
14+αB
s
´2 ) +
µ1 + 1
− 12+√
14+αB
s
¶¡− b2
¢≷ 0.
38 I: Insurgents, drug lords and anti-drug supply policies in the Andes
From condition B > 0, we know that α < (ab− 1).
Therefore, we have the following two cases:
(i) If B − αb2> 0 (α < 1
2
¡ab− 1¢) then ∂nq∗
∂α< 0.
(ii) If B − αb2≤ 0 (α ≥ 1
2
¡ab− 1¢) then
sb
¡12
¡ab− 1¢− 3
2α¢− α3 ≷ 0.
Since in case (ii) α ≥ 12
¡ab− 1¢, this implies
α ≥ 13
¡ab− 1¢and
¡12
¡ab− 1¢− 3
2α¢≤ 0.
Therefore,sb
¡12
¡ab− 1¢− 3
2α¢− α3 ≤ 0 and ∂nq∗
∂α≤ 0. Q.E.D.
Proposition (5)
We need to prove that the drug price decreases for any positive value of n. Taking
the first derivative with respect to n in equation (11), we have:∂γ∗
∂n= (1+α)
(n+1)− 1
(n+1)2
¡qb+ n (1 + α)
¢≷ 0.
Solving this expression, we have that
(1 + α) < abbecause Q∗ > 0 in equilibrium. Then, ∂γ∗
∂n< 0. Q.E.D
Chapter II

Counter-intuitive effects ofdomestic law enforcement policies
in the United States∗
1 Introduction
According to the U.S. Office of National Drug Control Policy (ONDCP), the total
economic costs of drug use for society was estimated at $ 168 billion in 2000, which
corresponds to about 1.6% of total U.S. GDP. The cost is composed of health care
costs, productivity losses, costs of drug related crime, social welfare and the criminal
justice system.1
Two decades ago, the U.S. government started a “war on drugs” with the ob-
jective of reducing the consumption of illegal drugs, and its related costs, by means
of domestic law enforcement, demand reduction policies, international drug source
policies and interdiction programs. Among all these policies, domestic law enforce-
ment has accounted for almost 50 percent of the federal budget allocated to this war
every year.2 Implementing domestic law enforcement policies would disrupt domes-
tic drug markets by dismantling the drug networks transporting and distributing
drugs throughout the United States. This spending should raise drug distribution
costs and increase drug prices by, for example, increasing the probability of arrests
∗This chapter is coauthored with Adam Jacobsson. We are grateful to Sten Nyberg, two anony-mous referees, and workshop participants at Stockholm University, Department of Economics, forhelpful comments.
1Office of National Drug Control Policy 2002 (ONDCP).2According to Everingham, S. and Rydell, P. (1994), in the case of cocaine, domestic law
enforcement policies are also three times more cost-effective in reducing drug consumption in
the U.S. than international and interdiction programs, but less effective than demand reduction
policies.
41
42 II: Counter-intuitive effects of domestic law enforcement policies in the United States
and/or reducing the drugs available to final users, ultimately reducing drug con-
sumption.
However, while domestic law enforcement spending increased over time in the
past two decades, drug distribution activities followed a non-monotonic trend, with
increases in the first decade and decreases in the second.3 Cocaine and heroin
prices, two of the main drug problems in the U.S., dropped during the 1980’s and
were fairly stable during the 1990’s, and the estimated consumption of cocaine and
heroin somehow surprisingly increased during the 1980’s and, in the best scenario,
slowly started to decrease during the 1990’s.4
This paper provides a possible explanation for the counter-intuitive effects of do-
mestic law enforcement expenditures on drug distribution activities and drug prices,
and their expected effect on drug consumption. The effect of these expenditures is
modeled via the amount of resources drug lords spend on maintaining a drug dis-
tribution network. The aim of our analysis is to sharpen the economic intuition on
how domestic law enforcement spending affects the behavior of drug lords who sell
and distribute drugs.
Domestic law enforcement policies are all possible measures targeting illegal drug
distribution activities. Instead of considering this spending as a policy increasing
the cost of drug distribution as has traditionally been the case, we see it as a policy
that effectively disrupts the connection between drug users and suppliers, which has
an impact on drug lords in reducing their available demand for drugs.5
This policy is modeled within a conflict framework with drug lords over the
control of distribution channels for illegal drugs, which is novel. The model predicts
drug distribution activities, drug prices, and drug consumption in the U.S.. These
predictions appear to be consistent with the data.
Let us look at the literature to date on the effect of demand and supply oriented
policies on drug distribution activities, drug prices and drug consumption.
Skott and Jepsen (2003) model the effects of law enforcement on drug use, fo-
3Drug distribution activities are studied through the trends on drug related violent crime, the
proportion of drug arrests for sale and manufacture of drugs, and the amount of drugs seized by
the Drug Enforcement Administration in the U.S.4See Everingham and Rydell (1994) and “What America’s Users Spend on Illegal Drugs” by
the ONDCP, for these estimations.5For example, police presence in the streets reduces the possibility of selling drugs and strategies
for chasing drug dealers (organizations) reduce the demand for drugs.
II: Counter-intuitive effects of domestic law enforcement policies in the United States 43
cusing on three features of the drug market: addiction, imperfect competition and
the presence of switching costs and consumer loyalty. They find the net effect of
this government policy on drug use to be ambiguous and a tough stance may, in
some circumstances, be counterproductive. Law enforcement is assumed to affect
cost parameters and is implicitly modeled. In our model, however, law enforcement
is interpreted as a demand oriented policy within the framework of a contest success
function yielding different results.
Chiu, Mansley and Morgan (1998) study the trade-off between investing in do-
mestic law enforcement and interdiction of drug supplies at their source. They find
the location of enforcement to be irrelevant for the problem and conclude the choice
between domestic or international drug enforcement to only be of secondary impor-
tance in choosing effective anti-drug policies. Our results cast doubt on the relevance
of their irrelevance result. In our model, domestic (domestic law enforcement) and
international or interdiction programs (supply policies affecting the marginal cost of
drug production) have different effects on drug use, price and distribution activities.
Burrus (1999) analyzes a model of illegal drug dealers as territorial monopolists
who wage turf wars against each other. He considers a two-stage game where drug
dealers first fight each other to gain a turf where, in period two, they will exercise
drug monopolies. As in Skott and Jepsen (2003), government law enforcement is
modeled as a linear cost parameter. Larger expenditures on law enforcement are
associated with lower profit levels for domestic monopolies and hence, lower sales of
drugs.
Due to the nature of the war on drugs, it appears natural to map government
spending on demand oriented policies within the framework of a contest with drug
lords, as opposed to simply a cost parameter. Thus, we obtain qualitatively different
results. As our aim is to analyze the effects of an exogenous government policy, we
do not model the government as an active player.6
The paper is structured as follows: We start by presenting some stylized facts on
the U.S. market for illegal drugs. Then, we proceed to set up our base line model
and present the key results. Section four introduces increasing marginal production
costs in the base line model. The final section contains a discussion of the results
and suggestions for future research.
6See Naranjo (2006b) for this extension under the presence of externalities.
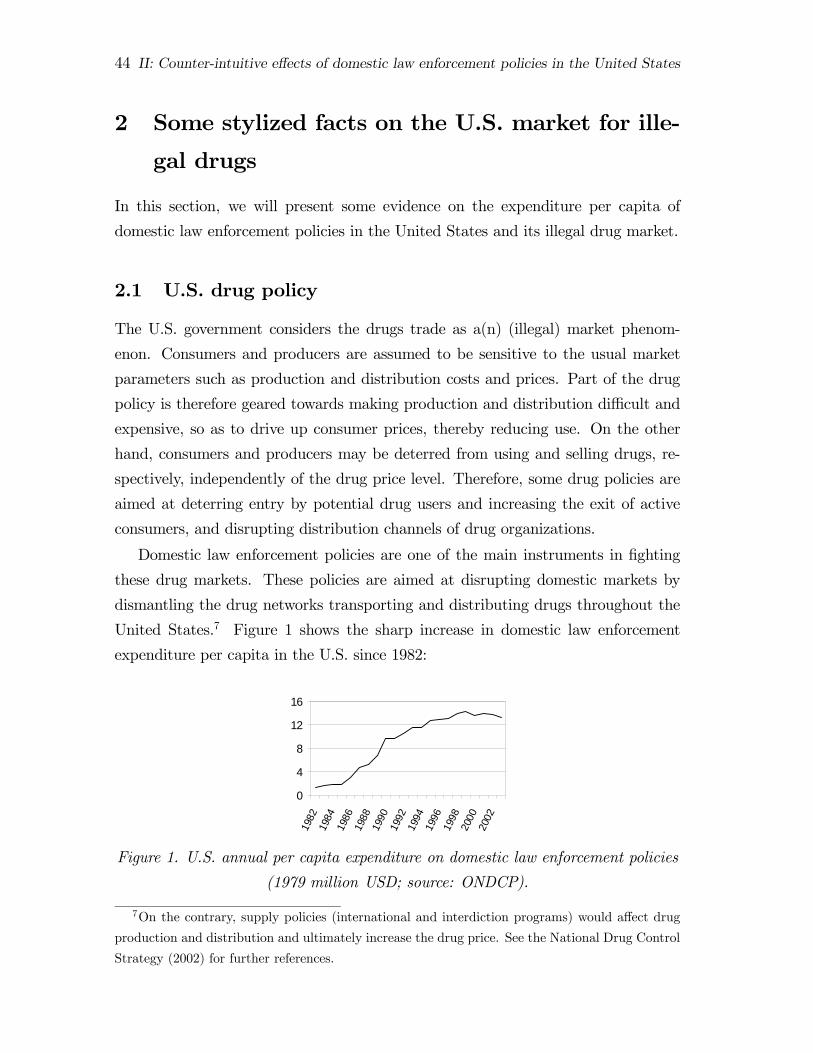
44 II: Counter-intuitive effects of domestic law enforcement policies in the United States
2 Some stylized facts on the U.S. market for ille-
gal drugs
In this section, we will present some evidence on the expenditure per capita of
domestic law enforcement policies in the United States and its illegal drug market.
2.1 U.S. drug policy
The U.S. government considers the drugs trade as a(n) (illegal) market phenom-
enon. Consumers and producers are assumed to be sensitive to the usual market
parameters such as production and distribution costs and prices. Part of the drug
policy is therefore geared towards making production and distribution difficult and
expensive, so as to drive up consumer prices, thereby reducing use. On the other
hand, consumers and producers may be deterred from using and selling drugs, re-
spectively, independently of the drug price level. Therefore, some drug policies are
aimed at deterring entry by potential drug users and increasing the exit of active
consumers, and disrupting distribution channels of drug organizations.
Domestic law enforcement policies are one of the main instruments in fighting
these drug markets. These policies are aimed at disrupting domestic markets by
dismantling the drug networks transporting and distributing drugs throughout the
United States.7 Figure 1 shows the sharp increase in domestic law enforcement
expenditure per capita in the U.S. since 1982:
0
4
8
12
16
1982
1984
1986
1988
1990
1992
1994
1996
1998
2000
2002
Figure 1. U.S. annual per capita expenditure on domestic law enforcement policies
(1979 million USD; source: ONDCP).
7On the contrary, supply policies (international and interdiction programs) would affect drug
production and distribution and ultimately increase the drug price. See the National Drug Control
Strategy (2002) for further references.
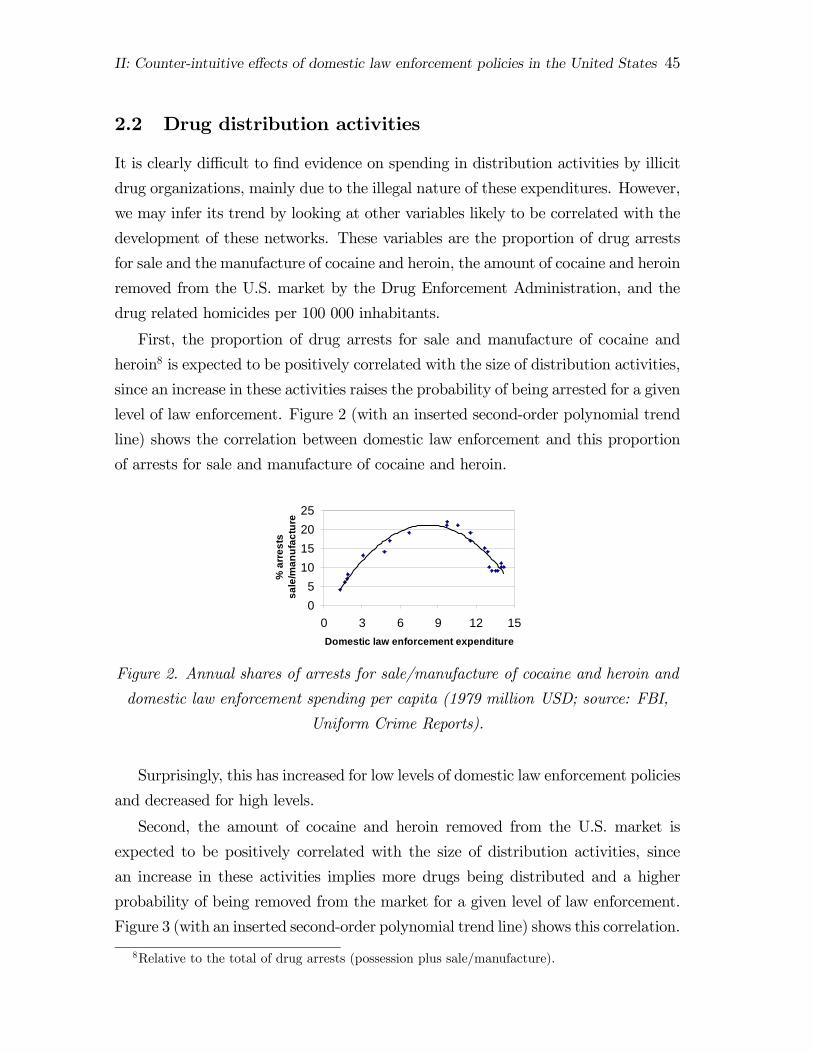
II: Counter-intuitive effects of domestic law enforcement policies in the United States 45
2.2 Drug distribution activities
It is clearly difficult to find evidence on spending in distribution activities by illicit
drug organizations, mainly due to the illegal nature of these expenditures. However,
we may infer its trend by looking at other variables likely to be correlated with the
development of these networks. These variables are the proportion of drug arrests
for sale and the manufacture of cocaine and heroin, the amount of cocaine and heroin
removed from the U.S. market by the Drug Enforcement Administration, and the
drug related homicides per 100 000 inhabitants.
First, the proportion of drug arrests for sale and manufacture of cocaine and
heroin8 is expected to be positively correlated with the size of distribution activities,
since an increase in these activities raises the probability of being arrested for a given
level of law enforcement. Figure 2 (with an inserted second-order polynomial trend
line) shows the correlation between domestic law enforcement and this proportion
of arrests for sale and manufacture of cocaine and heroin.
05
10152025
0 3 6 9 12 15Domestic law enforcement expenditure
% a
rres
ts
sale
/man
ufac
ture
Figure 2. Annual shares of arrests for sale/manufacture of cocaine and heroin and
domestic law enforcement spending per capita (1979 million USD; source: FBI,
Uniform Crime Reports).
Surprisingly, this has increased for low levels of domestic law enforcement policies
and decreased for high levels.
Second, the amount of cocaine and heroin removed from the U.S. market is
expected to be positively correlated with the size of distribution activities, since
an increase in these activities implies more drugs being distributed and a higher
probability of being removed from the market for a given level of law enforcement.
Figure 3 (with an inserted second-order polynomial trend line) shows this correlation.
8Relative to the total of drug arrests (possession plus sale/manufacture).
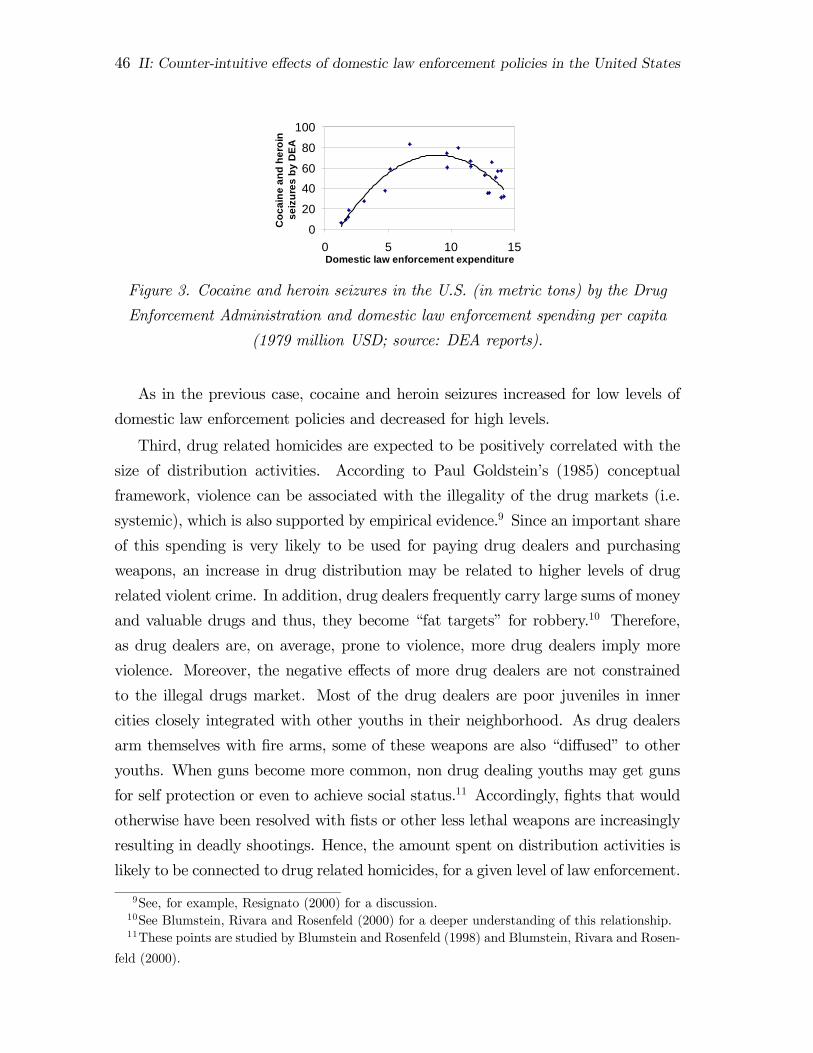
46 II: Counter-intuitive effects of domestic law enforcement policies in the United States
0
20
4060
80
100
0 5 10 15Domestic law enforcement expenditure
Coc
aine
and
her
oin
seiz
ures
by
DEA
Figure 3. Cocaine and heroin seizures in the U.S. (in metric tons) by the Drug
Enforcement Administration and domestic law enforcement spending per capita
(1979 million USD; source: DEA reports).
As in the previous case, cocaine and heroin seizures increased for low levels of
domestic law enforcement policies and decreased for high levels.
Third, drug related homicides are expected to be positively correlated with the
size of distribution activities. According to Paul Goldstein’s (1985) conceptual
framework, violence can be associated with the illegality of the drug markets (i.e.
systemic), which is also supported by empirical evidence.9 Since an important share
of this spending is very likely to be used for paying drug dealers and purchasing
weapons, an increase in drug distribution may be related to higher levels of drug
related violent crime. In addition, drug dealers frequently carry large sums of money
and valuable drugs and thus, they become “fat targets” for robbery.10 Therefore,
as drug dealers are, on average, prone to violence, more drug dealers imply more
violence. Moreover, the negative effects of more drug dealers are not constrained
to the illegal drugs market. Most of the drug dealers are poor juveniles in inner
cities closely integrated with other youths in their neighborhood. As drug dealers
arm themselves with fire arms, some of these weapons are also “diffused” to other
youths. When guns become more common, non drug dealing youths may get guns
for self protection or even to achieve social status.11 Accordingly, fights that would
otherwise have been resolved with fists or other less lethal weapons are increasingly
resulting in deadly shootings. Hence, the amount spent on distribution activities is
likely to be connected to drug related homicides, for a given level of law enforcement.
9See, for example, Resignato (2000) for a discussion.10See Blumstein, Rivara and Rosenfeld (2000) for a deeper understanding of this relationship.11These points are studied by Blumstein and Rosenfeld (1998) and Blumstein, Rivara and Rosen-
feld (2000).
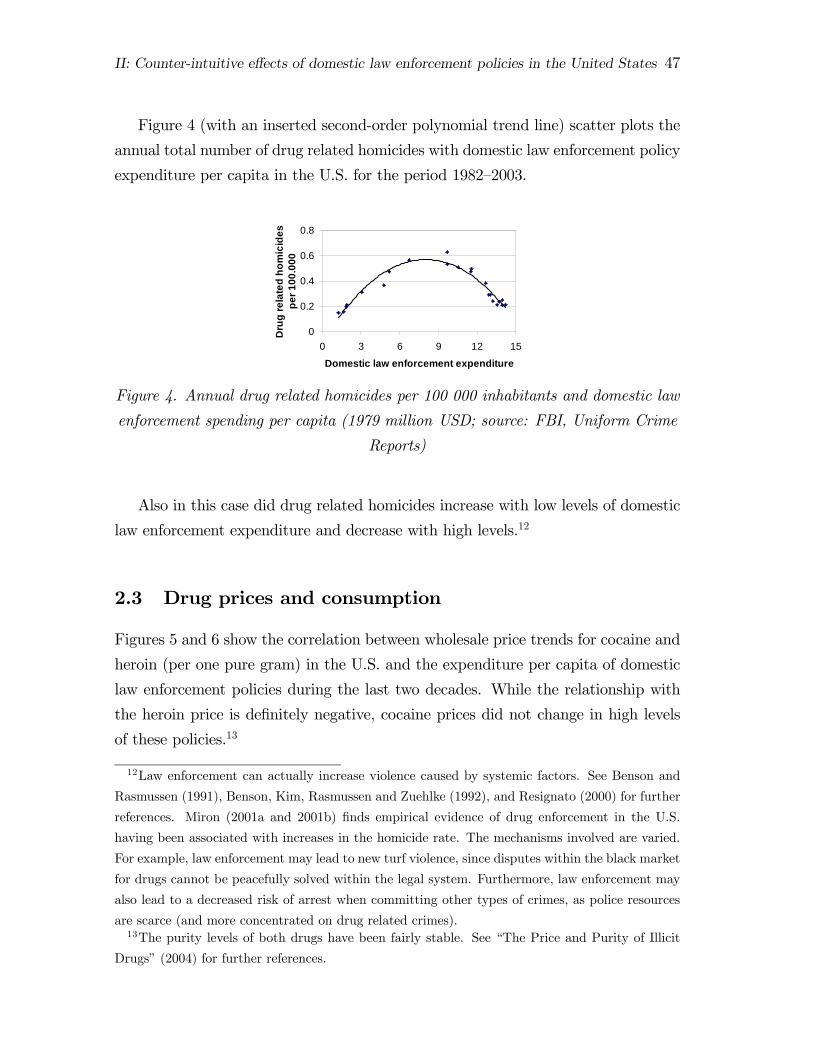
II: Counter-intuitive effects of domestic law enforcement policies in the United States 47
Figure 4 (with an inserted second-order polynomial trend line) scatter plots the
annual total number of drug related homicides with domestic law enforcement policy
expenditure per capita in the U.S. for the period 1982—2003.
0
0.2
0.4
0.6
0.8
0 3 6 9 12 15
Domestic law enforcement expenditure
Dru
g re
late
d ho
mic
ides
pe
r 100
.000
Figure 4. Annual drug related homicides per 100 000 inhabitants and domestic law
enforcement spending per capita (1979 million USD; source: FBI, Uniform Crime
Reports)
Also in this case did drug related homicides increase with low levels of domestic
law enforcement expenditure and decrease with high levels.12
2.3 Drug prices and consumption
Figures 5 and 6 show the correlation between wholesale price trends for cocaine and
heroin (per one pure gram) in the U.S. and the expenditure per capita of domestic
law enforcement policies during the last two decades. While the relationship with
the heroin price is definitely negative, cocaine prices did not change in high levels
of these policies.13
12Law enforcement can actually increase violence caused by systemic factors. See Benson and
Rasmussen (1991), Benson, Kim, Rasmussen and Zuehlke (1992), and Resignato (2000) for further
references. Miron (2001a and 2001b) finds empirical evidence of drug enforcement in the U.S.
having been associated with increases in the homicide rate. The mechanisms involved are varied.
For example, law enforcement may lead to new turf violence, since disputes within the black market
for drugs cannot be peacefully solved within the legal system. Furthermore, law enforcement may
also lead to a decreased risk of arrest when committing other types of crimes, as police resources
are scarce (and more concentrated on drug related crimes).13The purity levels of both drugs have been fairly stable. See “The Price and Purity of Illicit
Drugs” (2004) for further references.
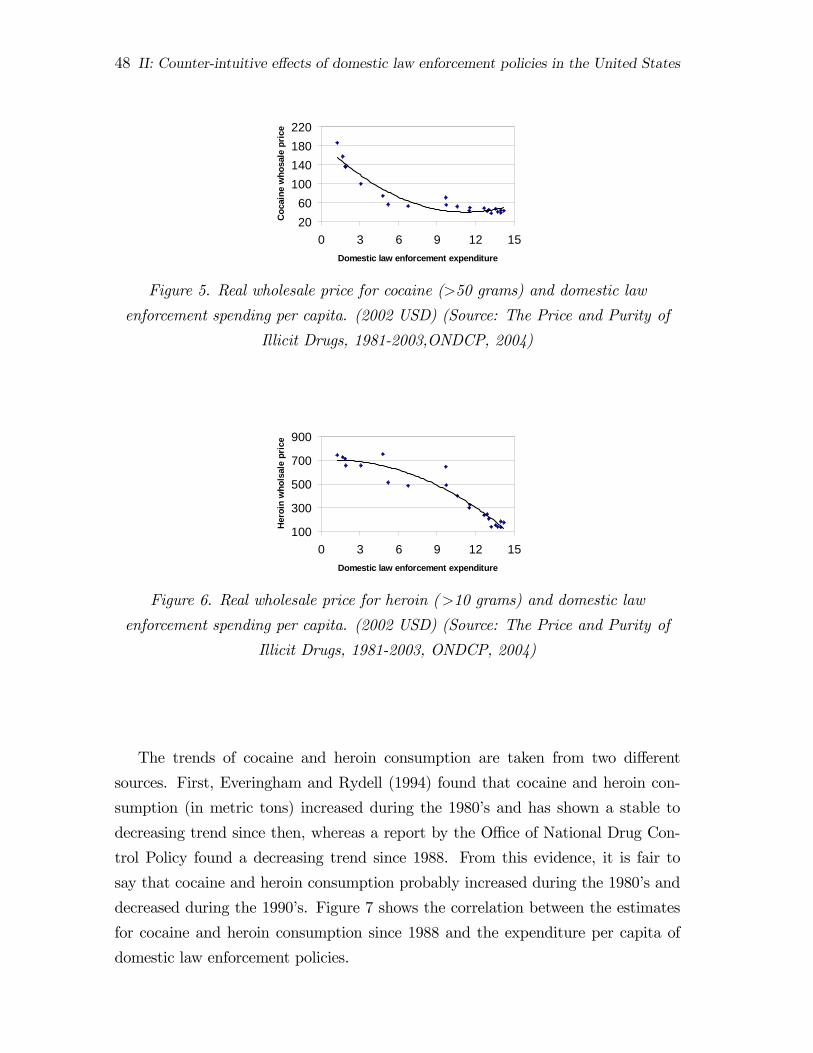
48 II: Counter-intuitive effects of domestic law enforcement policies in the United States
2060
100140180220
0 3 6 9 12 15Domestic law enforcement expenditure
Coc
aine
who
sale
pri
ceFigure 5. Real wholesale price for cocaine (>50 grams) and domestic law
enforcement spending per capita. (2002 USD) (Source: The Price and Purity of
Illicit Drugs, 1981-2003,ONDCP, 2004)
100
300
500
700
900
0 3 6 9 12 15Domestic law enforcement expenditure
Her
oin
who
lsal
e pr
ice
Figure 6. Real wholesale price for heroin (>10 grams) and domestic law
enforcement spending per capita. (2002 USD) (Source: The Price and Purity of
Illicit Drugs, 1981-2003, ONDCP, 2004)
The trends of cocaine and heroin consumption are taken from two different
sources. First, Everingham and Rydell (1994) found that cocaine and heroin con-
sumption (in metric tons) increased during the 1980’s and has shown a stable to
decreasing trend since then, whereas a report by the Office of National Drug Con-
trol Policy found a decreasing trend since 1988. From this evidence, it is fair to
say that cocaine and heroin consumption probably increased during the 1980’s and
decreased during the 1990’s. Figure 7 shows the correlation between the estimates
for cocaine and heroin consumption since 1988 and the expenditure per capita of
domestic law enforcement policies.
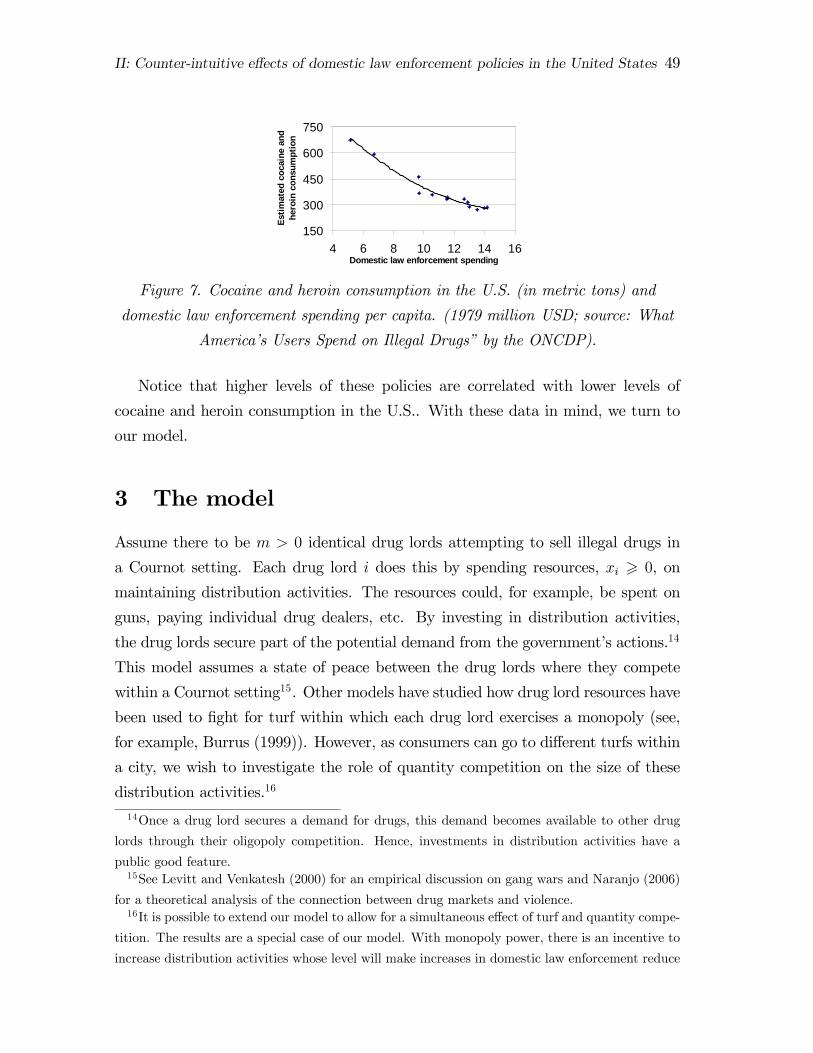
II: Counter-intuitive effects of domestic law enforcement policies in the United States 49
150
300
450
600
750
4 6 8 10 12 14 16Domestic law enforcement spending
Estim
ated
coc
aine
and
hero
in c
onsu
mpt
ion
Figure 7. Cocaine and heroin consumption in the U.S. (in metric tons) and
domestic law enforcement spending per capita. (1979 million USD; source: What
America’s Users Spend on Illegal Drugs” by the ONCDP).
Notice that higher levels of these policies are correlated with lower levels of
cocaine and heroin consumption in the U.S.. With these data in mind, we turn to
our model.
3 The model
Assume there to be m > 0 identical drug lords attempting to sell illegal drugs in
a Cournot setting. Each drug lord i does this by spending resources, xi > 0, on
maintaining distribution activities. The resources could, for example, be spent on
guns, paying individual drug dealers, etc. By investing in distribution activities,
the drug lords secure part of the potential demand from the government’s actions.14
This model assumes a state of peace between the drug lords where they compete
within a Cournot setting15. Other models have studied how drug lord resources have
been used to fight for turf within which each drug lord exercises a monopoly (see,
for example, Burrus (1999)). However, as consumers can go to different turfs within
a city, we wish to investigate the role of quantity competition on the size of these
distribution activities.16
14Once a drug lord secures a demand for drugs, this demand becomes available to other drug
lords through their oligopoly competition. Hence, investments in distribution activities have a
public good feature.15See Levitt and Venkatesh (2000) for an empirical discussion on gang wars and Naranjo (2006)
for a theoretical analysis of the connection between drug markets and violence.16It is possible to extend our model to allow for a simultaneous effect of turf and quantity compe-
tition. The results are a special case of our model. With monopoly power, there is an incentive to
increase distribution activities whose level will make increases in domestic law enforcement reduce
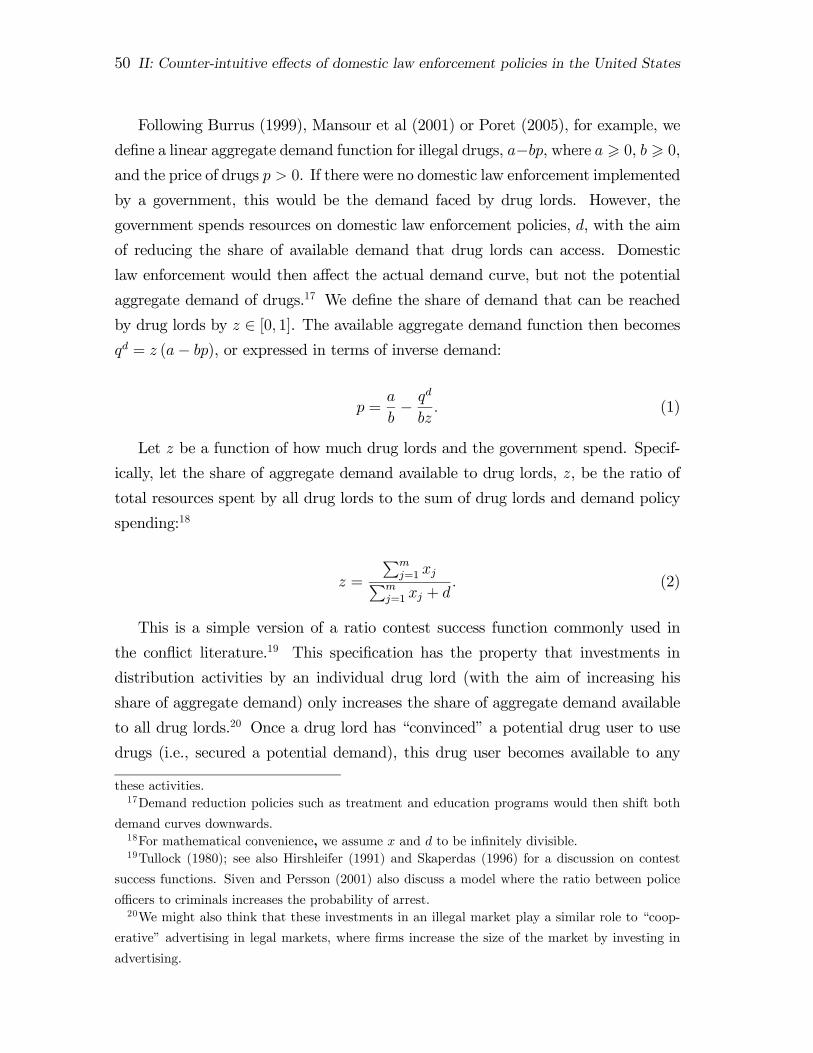
50 II: Counter-intuitive effects of domestic law enforcement policies in the United States
Following Burrus (1999), Mansour et al (2001) or Poret (2005), for example, we
define a linear aggregate demand function for illegal drugs, a−bp, where a > 0, b > 0,and the price of drugs p > 0. If there were no domestic law enforcement implemented
by a government, this would be the demand faced by drug lords. However, the
government spends resources on domestic law enforcement policies, d, with the aim
of reducing the share of available demand that drug lords can access. Domestic
law enforcement would then affect the actual demand curve, but not the potential
aggregate demand of drugs.17 We define the share of demand that can be reached
by drug lords by z ∈ [0, 1]. The available aggregate demand function then becomesqd = z (a− bp), or expressed in terms of inverse demand:
p =a
b− q
d
bz. (1)
Let z be a function of how much drug lords and the government spend. Specif-
ically, let the share of aggregate demand available to drug lords, z, be the ratio of
total resources spent by all drug lords to the sum of drug lords and demand policy
spending:18
z =
Pmj=1 xjPm
j=1 xj + d. (2)
This is a simple version of a ratio contest success function commonly used in
the conflict literature.19 This specification has the property that investments in
distribution activities by an individual drug lord (with the aim of increasing his
share of aggregate demand) only increases the share of aggregate demand available
to all drug lords.20 Once a drug lord has “convinced” a potential drug user to use
drugs (i.e., secured a potential demand), this drug user becomes available to any
these activities.17Demand reduction policies such as treatment and education programs would then shift both
demand curves downwards.18For mathematical convenience, we assume x and d to be infinitely divisible.19Tullock (1980); see also Hirshleifer (1991) and Skaperdas (1996) for a discussion on contest
success functions. Siven and Persson (2001) also discuss a model where the ratio between police
officers to criminals increases the probability of arrest.20We might also think that these investments in an illegal market play a similar role to “coop-
erative” advertising in legal markets, where firms increase the size of the market by investing in
advertising.
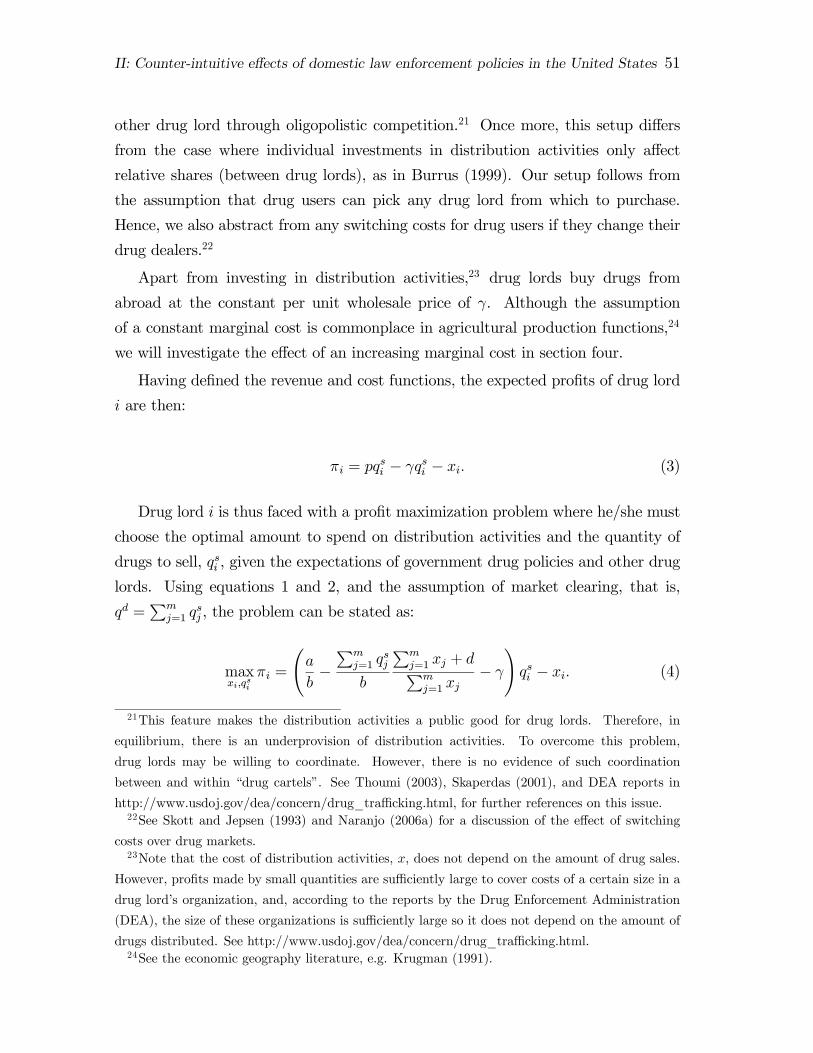
II: Counter-intuitive effects of domestic law enforcement policies in the United States 51
other drug lord through oligopolistic competition.21 Once more, this setup differs
from the case where individual investments in distribution activities only affect
relative shares (between drug lords), as in Burrus (1999). Our setup follows from
the assumption that drug users can pick any drug lord from which to purchase.
Hence, we also abstract from any switching costs for drug users if they change their
drug dealers.22
Apart from investing in distribution activities,23 drug lords buy drugs from
abroad at the constant per unit wholesale price of γ. Although the assumption
of a constant marginal cost is commonplace in agricultural production functions,24
we will investigate the effect of an increasing marginal cost in section four.
Having defined the revenue and cost functions, the expected profits of drug lord
i are then:
πi = pqsi − γqsi − xi. (3)
Drug lord i is thus faced with a profit maximization problem where he/she must
choose the optimal amount to spend on distribution activities and the quantity of
drugs to sell, qsi , given the expectations of government drug policies and other drug
lords. Using equations 1 and 2, and the assumption of market clearing, that is,
qd =Pm
j=1 qsj , the problem can be stated as:
maxxi,qsi
πi =
Ãa
b−Pm
j=1 qsj
b
Pmj=1 xj + dPmj=1 xj
− γ
!qsi − xi. (4)
21This feature makes the distribution activities a public good for drug lords. Therefore, in
equilibrium, there is an underprovision of distribution activities. To overcome this problem,
drug lords may be willing to coordinate. However, there is no evidence of such coordination
between and within “drug cartels”. See Thoumi (2003), Skaperdas (2001), and DEA reports in
http://www.usdoj.gov/dea/concern/drug_trafficking.html, for further references on this issue.22See Skott and Jepsen (1993) and Naranjo (2006a) for a discussion of the effect of switching
costs over drug markets.23Note that the cost of distribution activities, x, does not depend on the amount of drug sales.
However, profits made by small quantities are sufficiently large to cover costs of a certain size in a
drug lord’s organization, and, according to the reports by the Drug Enforcement Administration
(DEA), the size of these organizations is sufficiently large so it does not depend on the amount of
drugs distributed. See http://www.usdoj.gov/dea/concern/drug_trafficking.html.24See the economic geography literature, e.g. Krugman (1991).
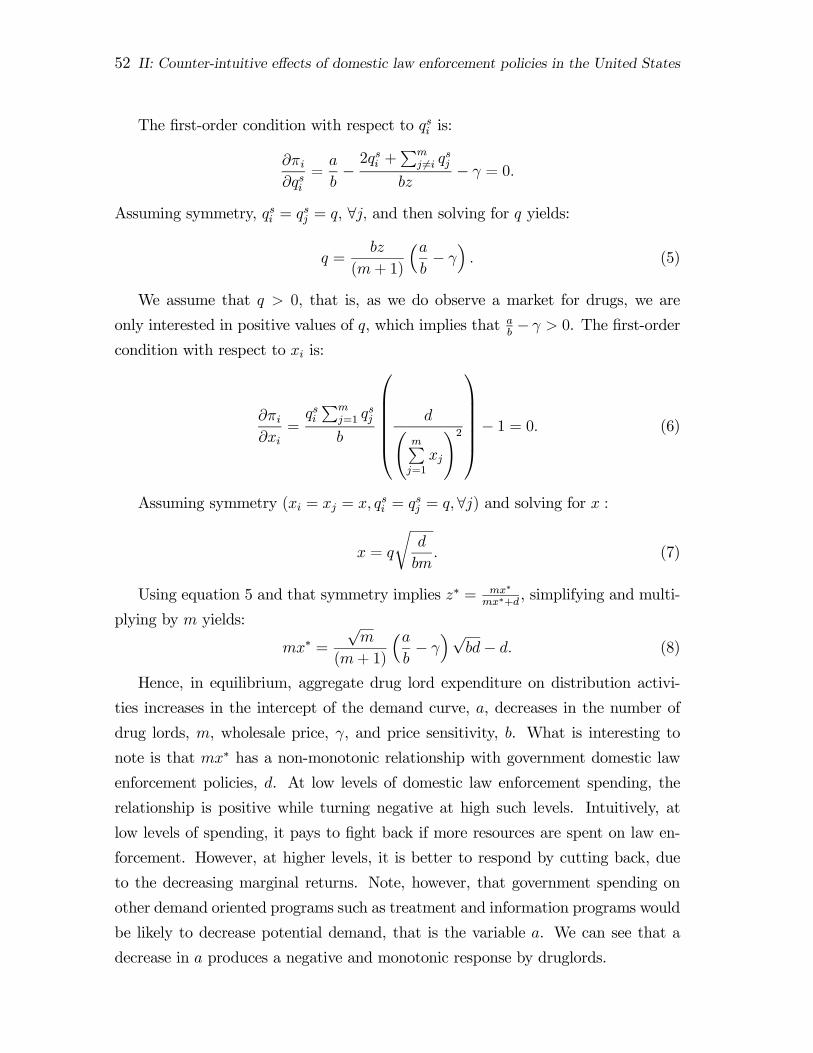
52 II: Counter-intuitive effects of domestic law enforcement policies in the United States
The first-order condition with respect to qsi is:
∂πi∂qsi
=a
b−2qsi +
Pmj 6=i q
sj
bz− γ = 0.
Assuming symmetry, qsi = qsj = q, ∀j, and then solving for q yields:
q =bz
(m+ 1)
³ab− γ
´. (5)
We assume that q > 0, that is, as we do observe a market for drugs, we are
only interested in positive values of q, which implies that ab− γ > 0. The first-order
condition with respect to xi is:
∂πi∂xi
=qsiPm
j=1 qsj
b
⎛⎜⎜⎜⎜⎜⎝dÃ
mPj=1
xj
!2⎞⎟⎟⎟⎟⎟⎠− 1 = 0. (6)
Assuming symmetry (xi = xj = x, qsi = qsj = q,∀j) and solving for x :
x = q
rd
bm. (7)
Using equation 5 and that symmetry implies z∗ = mx∗
mx∗+d , simplifying and multi-
plying by m yields:
mx∗ =
√m
(m+ 1)
³ab− γ
´√bd− d. (8)
Hence, in equilibrium, aggregate drug lord expenditure on distribution activi-
ties increases in the intercept of the demand curve, a, decreases in the number of
drug lords, m, wholesale price, γ, and price sensitivity, b. What is interesting to
note is that mx∗ has a non-monotonic relationship with government domestic law
enforcement policies, d. At low levels of domestic law enforcement spending, the
relationship is positive while turning negative at high such levels. Intuitively, at
low levels of spending, it pays to fight back if more resources are spent on law en-
forcement. However, at higher levels, it is better to respond by cutting back, due
to the decreasing marginal returns. Note, however, that government spending on
other demand oriented programs such as treatment and information programs would
be likely to decrease potential demand, that is the variable a. We can see that a
decrease in a produces a negative and monotonic response by druglords.
II: Counter-intuitive effects of domestic law enforcement policies in the United States 53
It may be somewhat surprising that the amount spent on distribution activities
is negatively related to the total number of drug lords, m. The opposite relationship
might be expected as the total amount of resources spent (in this case on distrib-
ution networks) in a typical rent seeking contest is positively related to the degree
of competition.25 However, in this model, the contest involving drug dealers is be-
tween the government and the drug lords. The effect of incremental spending is such
that it increases the share of demand available to all drug lords, while only draw-
ing resources from the spending drug lord. Hence, the other drug lords free ride.
Thus, ceteris paribus, if competition in the drug market increases, the equilibrium
expenditure on distribution activities decreases.26
We summarize the main comparative statics of equation 8 in proposition 1.
Proposition 1 The total amount spent on distribution activities, mx∗, (i) decreases
monotonically in the number of drug lords, m; (ii) has a non monotonic relationship
with government domestic law enforcement policies, d. At low levels of this spending,
the relationship is positive while turning negative at high levels.
Proof. See the Appendix.
Let us proceed to examine equilibrium drug use in the economy. First, we find
the equilibrium share of available demand, z∗, by using equation 8 in equation 2:
z∗ = 1− (m+ 1)√m
1¡ab− γ
¢qbd
. (9)
Second, to find the aggregate amount of sold drugs, mq∗, we insert equation 9
into equation 5 and multiply by m:
mq∗ =m
(m+ 1)b³ab− γ
´−√bdm. (10)
We see that mq∗ decreases, as expected, with price sensitivity, b, wholesale price,
γ, and domestic law enforcement policy spending, d, and increases in the intercept of
the demand curve, a. Moreover, mq∗ has a non-monotonic relationship with respect25See, for example, Tullock (1980).26A key assumption for this result to hold is that expenditure on distribution is not used for
fighting turf wars with other drug lords. In a sequential game, if we allow drug lords to fight
for a share of the drug market in a first stage and then act as monopolists deciding the level of
distribution networks and drug sales in a second stage, our results do not qualitatively change.
54 II: Counter-intuitive effects of domestic law enforcement policies in the United States
to the number of competing drug lords, m.27 At low levels of m, the relationship
is positive while turning negative at high levels. Two main effects are at play here:
First, a higher m decreases aggregate spending on distribution networks, that is,
the free-rider effect, which reduces available demand and thereby limits the amount
sold. Second, the increase in (Cournot) market competition decreases the price,
which increases demand. Thus, at low levels of competition, an additional drug
lord means that more drugs will be sold as the competition effect dominates the
free-rider effect.28 The main comparative statics for the aggregate amount of drugs
sold is summed up in proposition 2:
Proposition 2 Drug consumption, mq∗: (i) Decreases monotonically with govern-
ment domestic law enforcement policy spending, d; (ii) has a non monotonic rela-
tionship with respect to the number of competing drug lords, m. At low levels of m,
the relationship is positive while turning negative at high levels.
Proof. Immediate with respect d. See the Appendix for m.
The equilibrium price in the symmetric case is derived from equation 1, noting
that qd = mq, where q is given by equation 5:
p∗ =a
b− m
(m+ 1)
³ab− γ
´. (11)
Notice that equilibrium price is not a function of government domestic law en-
forcement policy spending, d. Why? Government demand policies affect both the
demand and the supply of drugs through z. For example, more domestic law enforce-
ment shrinks demand as it reduces the share of total available demand, which tends
to decrease the price. Drug lords then respond by reducing sales, which tends to in-
crease the price. In our model, these two effects cancel out exactly (due to constant
average and marginal production costs). The following proposition summarizes the
main comparative statics of equilibrium price, equation 11:
Proposition 3 Equilibrium price, p∗: (i) Decreases monotonically in the number
of drug lords, m; (ii) is not affected by domestic law enforcement policy spending, d.27The relationship is non-monotonic, provided that the market is sufficiently profitable. See the
Appendix, proof of proposition 2, for a formal treatment.28If we allow for a model with turf wars, the free-rider effect might disappear.
II: Counter-intuitive effects of domestic law enforcement policies in the United States 55
From the evidence presented in section 2, drug prices have a negative correla-
tion with domestic law enforcement spending. While other policies, such as demand
reduction programs, might have a negative effect on drug prices, there is also a possi-
bility that domestic law enforcement policies can explain these correlations. Section
four investigates this possibility by introducing increasing marginal production costs.
4 Increasing marginal production costs
As is clear from Proposition 3, price is, somehow surprisingly, not affected by do-
mestic law enforcement policies in the base line model. This result is due to : (i)
the assumption of a constant marginal cost of drug production and (ii) the market
scaling effect of demand policies. In this section, we relax the first assumption by
introducing an increasing marginal cost of drug production to check the robustness
of the predictions from the base line model.29 The total cost for a drug lord i is now
defined as γ (qsi )2. The intuition behind this assumption is the following. The larger
is the amount of drugs sold from the producer market, the higher is the amount of
drugs seized by the government.30
Hence, the profit function is now defined as:
πi = pqsi − γ (qsi )
2 − xi. (12)
Using equations 1 and 2, together with the assumption of market clearing, that
is, qd =Pm
j=1 qsj , the problem can be stated as:
maxxi,qsi
πi =
Ãa
b−Pm
j=1 qsj
b
Pmj=1 xj + dPmj=1 xj
!qsi − γ (qsi )
2 − xi. (13)
The first-order condition with respect to qsi is:
∂πi∂qsi
=a
b−2qsi +
Pmj 6=i q
sj
bz− 2γqsi = 0.
Assuming symmetry, qsi = qsj = q, xi = xj = x, ∀j 6= i, and then solving for q yields:
q =a
(m+ 1)¡mx+dmx
¢+ 2bγ
. (14)
29Both increasing and decreasing marginal costs have been proposed in the literature; see Ever-
ingham and Rydell (1994).30There is now a higher volume of drugs traded for a constant level of supply policies or a higher
volume of drugs traded creates a higher level of supply policies.
56 II: Counter-intuitive effects of domestic law enforcement policies in the United States
We assume that q > 0, that is, as we do observe a market for drugs, we are only
interested in positive values of q. The first-order condition with respect to xi is31:
∂πi∂xi
=qsiPm
j=1 qsj
b
⎛⎜⎜⎜⎜⎜⎝dÃ
mPj=1
xj
!2⎞⎟⎟⎟⎟⎟⎠− 1 = 0.
Assuming symmetry (xi = xj = x, qsi = qsj = q,∀i 6= j) and solving for x :
x = q
rd
bm. (15)
Combining equations 14 and 15, and multiplying by m, we find the equilibrium
aggregate values32:
mq∗ =ma− (m+ 1)
√bdm
(m+ 1) + 2bγ(16)
mx∗ =aq
dmb− d (m+ 1)
(m+ 1) + 2bγ. (17)
Solving for equilibrium price:
p∗ =ab(1 + 2bγ)− 2γ
√dbm
m+ 1 + 2bγ. (18)
We summarize the comparative statics of equations 16, 17, and 18 with respect
to policy variable d in proposition 4.
Proposition 4 (i) mq∗ decreases in d. (ii) mx∗ has a concave non-monotonic
relationship with respect to d. At low levels of d, the relationship is positive while
turning negative at high levels. (iii) p∗ decreases in d.
Proof. Immediate with respect to ∂mq∗
∂dand ∂p∗
∂d. See the Appendix for ∂mx∗
∂d.
We note that the only qualitative difference from the baseline model is that
price now decreases with domestic law enforcement policies. The intuition behind
the result is that as these policies scale down market size (∂mq∗
∂d< 0), production
costs no longer fall proportionately. A lower volume implies lower marginal costs
and a lower price, which appears to be consistent with the data.31The second-order condition requires the level of demand policies to be sufficiently small with
respect to the size of the distribution networks (4m(1+γb)(m−1)2 (mx) > d).32If mq∗ > 0 and mx∗ > 0, then a
(m+1)
pmb >√d.
II: Counter-intuitive effects of domestic law enforcement policies in the United States 57
5 Discussion
Our model predicts that, ceteris paribus, domestic law enforcement policies produce
a non-monotonic response in the amount spent by drug lords on distribution ac-
tivities (proposition 2). Thus, we can provide one possible theoretical explanation
for the empirical relationship between the two above variables. When domestic law
enforcement spending affects the available demand for drugs and its effect depends
on the level of the distribution activities, drug lords may, in fact, increase these
activities under low levels of this spending but decrease them under high levels.
As for cocaine and heroin price, Proposition 4 predicts that domestic law en-
forcement policy expenditure decreases the price through the reduction in market
size and the associated decreased marginal production cost. Hence, our model also
provides a possible theoretical explanation for the decreasing drug price trend.
In addition, our analysis can predict that even though drug prices may fall con-
stantly, drug consumption may still be reduced by the implementation of domestic
law enforcement policies. According to our model, drug consumption will decline
with higher expenditures on these policies and responds non-monotonically to the
number of drug lords in the drug market. Given the positive trends in this policy
spending and the increase in the number of drug lords since the mid-1980’s, this
prediction seems reasonable.
The increase in drug consumption during the 1980’s must be explained by a factor
other than the level of domestic law enforcement policies. One possible explanation,
which is predicted by our model, could be that the drug market started to be
affected by an increase in the number of drug lords from a sufficiently low level. This
explanation is well supported by empirical evidence which shows how the structure
of the market for illegal drugs in the U.S. (and in source countries) started to change
from being concentrated to being more competitive. See, for example, the reports
by the United States General Accounting Office.33
Summing up, our model provides a possible theoretical explanation for the trends
33For further references about the effect of anti-drug policies on the size and number of drug
organizations, see Poret and Téjédo (2006). Yet another explanation could be a change in consumer
preferences or in the price for complements (or substitutes) to these illegal drugs. For example,
if marijuana is a complement good to cocaine and heroin, increases in its consumption may have
produced the increase in consumption for these other drugs. However, it seems that demand effects
have not played any important role in this trend.
58 II: Counter-intuitive effects of domestic law enforcement policies in the United States
in drug distribution and cocaine and heroin price in the U.S. since the beginning
of the eighties. It also explains why these prices may have dropped when cocaine
and heroin consumption was constantly increasing. These explanations are based
on the assumption that drug lords can, to some extent, counteract domestic law
enforcement policies by varying the amount spent on distribution activities. The
key element of the model is that the fight is between the government and the drug
lords over distribution channels, by means of a contest success function. Another
key element is the existence of non-violent competition between drug lords. Previous
literature has, to a large extent, treated government anti-drug policies as a linear
cost parameter in the drug lord’s profit function and has downplayed the impor-
tance of drug lords’ peaceful competition. This produces a monotonic and negative
relationship between domestic law enforcement policies and drug distribution and
drug consumption. As seen in the data, the relationship between domestic law
enforcement policy expenditure and distribution activities, through their positive
correlation with drug arrests, drug seizures and drug related violent crime, appears
to be non-monotonic, as would be predicted by our model. The goal of U.S. policy
has been to reduce drug consumption by increasing the price of drugs. Our model
suggests price to be a poor measure of the success of this policy.
During the mid-eighties, domestic law enforcement policy expenditure was in-
creasing from a low level and, according to our model, did not succeed in decreasing
neither drug distribution activities nor drug consumption. However, as domestic
law enforcement policy expenditure has been boosted to a level where drug lords
find it optimal to downsize their organizations, distribution activities drop with a
small decrease in drug consumption. Hence, at these high levels of domestic law
enforcement policy expenditure, two birds may indeed have been killed with one
stone. Had it not been for the increased level of competition in the drug market,
there might have been a stronger decrease in drug consumption during the 1990’s.
To explain U.S. government behavior, we would need to model the government
as an active player. The aim of this paper has merely been to derive a best response
to government drug policies. We do believe, however, that endogenizing government
policy would be a fruitful line for future research. In addition, although endogeniz-
ing the number of drug lords looks interesting at first sight, this must be treated
with some caution. In the real world, drug lords may form cartels of different sizes.
As anti-drug policies can be aimed at breaking some of the larger cartels, this might
II: Counter-intuitive effects of domestic law enforcement policies in the United States 59
create the illusion of decreasing the number of drug lords (i.e., cartels) when, in real-
ity, these are increased by the policy increases as many small cartels may survive.34
Therefore, if we want to understand the effect of endogenizing the number of drug
lords, we should take this effect into account. We do believe that by keeping the
number of drug lords exogenous, it is possible to have a good understanding of the
counter-intuitive effects of domestic law enforcement policies on the drug distribu-
tion activities and drug prices in the United States and on the relationship between
drug prices and drug consumption.
34Poret and Téjédo (2006) further develop this idea.
60 II: Counter-intuitive effects of domestic law enforcement policies in the United States
References
Becker, G., “Crime and punishment. An economic approach”, Journal of Political
Economy, pp 169-217, 1968.
Benson, B. and Rasmussen, D., “The relationship between illegal drug enforcement
and property crimes”, Contemporary Policy Issues, 9, pp 106-115, 1991.
Benson, B., Kim, I., Rasmussen D. and Zuehlke, T., “Is property crime caused by
drug use or by drug enforcement policy?”, Applied Economics, 24, pp 679-692,
1992.
Blumstein, A. and Rosenfeld, R., “Explaining Recent Trends in U.S. Homicide
rates”, The Journal of Criminal Law & Criminology, Vol 88, No.1, 1998.
Blumstein, A., Rivara, F. and Rosenfeld, R., “The Rise and Decline of Homicide -
and Why”, Annual Review of Public Health, vol. 21, pp. 505-541, 2000.
Burrus, R., Jr., “Do efforts to Reduce the Supply of illegal Drugs Increase Turf War
Violence? A Theoretical Analysis”, Journal of Economics and Finance, Vol.
23, Number 3, pp 226-234, Fall 1999.
Chaloupka, F. and Saffer, H. “The demand for illicit drugs”, Economic Inquiry, Vol.
37, No. 3, 1999.
Chiu, S., Mansley, E. and Morgan, J., “Choosing the right battlefield for the war on
drugs: an irrelevance result.”, Economic letters, 59, pp 107-111, 1998.
Everingham, S. and Rydell, P., “Controlling Cocaine. Supply Versus Demand Pro-
grams”, RAND, Drug Policy Research Center, Santa Monica, California, 1994.
Federal Bureau of Investigations, Crime in the United States, Washington D.C.,
1995-2001.
Goldstein, P., “The Drug/Violence Nexus: A Tripartite Conceptual Framework”,
Journal of Drug Issues, 14, pp. 493-506, 1985.
Krugman, P., “Increasing returns and economic geography”, Journal of Political
Economy, Vol. 99, pp 484-499, 1991.
Hirshleifer, J., “The technology of conflict as an economic activity”, American Eco-
nomic Review, Vol. 81, pp 130-134, 1991.
Levitt, S. and Venkatesh, S., “An economic analysis of a drug selling gang’s fi-
nances”, NBER Working Paper 6592, Cambridge, MA, June 1999.
Mansour, A., Marceau, N., Mongrain, S., “Gangs and Crime Deterrence”. Working
Paper No. 138, Center for Research on Economic Fluctuations and Employ-
II: Counter-intuitive effects of domestic law enforcement policies in the United States 61
ment, Université du Québec à Montréal, 2001.
Miron, J., “Violence and the U.S. Prohibitions of Drugs and Alcohol”, Boston Uni-
versity, 2001a, available at http://econ.bu.edu/miron/.
–––. “Violence, Guns, and Drugs: A Cross-Country Analysis”, Journal of Law
and Economics, vol. XLIV, 2001b.
Naranjo, Alberto. “Drive-by competition? Violence in the drug market”. Depart-
ment of Economics, Stockholm University, 2006a.
–––. “Spillover effects of domestic law enforcement policies”. Department of
Economics, Stockholm University, 2006b.
Office of National Drug Control Policy, National Drug Control Strategy, available at
http://www.whitehousedrugpolicy.gov, 2002.
–––. The Price and Purity of Illicit Drugs” November 2004.
Poret, S. and Téjédo, C. “Law enforcement and concentration of illicit drug mar-
kets”. European Journal of Political Economy, 22, 2006.
Resignato, A., “Violent Crime: A Function of Drug Use or Drug Enforcement?”,
Applied Economics, Vol. 32, Number 6, May 2000.
Siven, C-H. and Persson, M., “Incentive and Incarceration Effects in a General
Equilibrium Model of Crime”, MIMEO, Department of Economics and the
IIES, Stockholm University, 2001.
Skaperdas, S., “Contest success functions”, Economic Theory, Vol. 7, 1996.
Skott, P. and Jepsen, G., “Paradoxical effects of drug policy in a model with im-
perfect competition and switching costs”, Journal of Economic Behavior &
Organization, Vol. 48, pp 335-354, 2003.
Thies, C.F., and Register, C.A. “Decriminalization of marijuana and the demand
for alcohol, marijuana and cocaine”. Social Science Journal, Vol. 30, No.4,
1993.
Tullock, G., “Efficient rent seeking”, in Buchanan, J., and Tollison, R., Tullock, G.,
(eds), Toward a theory of the rent seeking society, Texas, 1980.
United States Census Bureau, Population Division, Population Estimates Programme,
June 28, 2000.
United States General Accounting Office, “Drug Control: Challenges in Implement-
ing Plan Colombia”. October, 2002.
University of Michigan, Monitoring the Future Study, 2002. Data available at:
www.monitoringthefuture.com.
62 II: Counter-intuitive effects of domestic law enforcement policies in the United States
Appendix
Proofs
Proposition (1)
First, we need to show that ∂mx∗
∂m< 0 wheremx∗ = −d+
√m
(m+1)
¡ab− γ
¢√bd. Remem-
ber that we have assumed ab− γ > 0. Then, it is sufficient to show that
∂√m
(m+1)
∂m< 0.
Taking the derivative:∂√m
(m+1)
∂m= 1
2√m(m+1)
−√m
(m+1)2< 0.
Rearranging yields: m < 2m− 1, which is true for m > 1.Second, we want to prove that mx∗ has a hump-shaped relationship to d for positive
values of mx∗ and d. It is sufficient to show that equation 8 is strictly concave and
achieves a maximum for d > 0.
First, let us examine the concavity:∂2mx∗
∂d2= −
√m
4(m+1)
¡ab− γ
¢√bd−
32 < 0 .
Hence, we have strict concavity.
Further, at what value of d does equation 8 have its peak value?
Setting the first derivative of equation 8 with respect to d to zero and solving for d
yields:
dmax = (√m
2(m+1)
¡ab− γ
¢√b)2 > 0. Hence, equation 8 peaks for a positive value of d.
Q.E.D.
Proposition (2)
We need to show that mq∗ = m(m+1)
b(ab−γ)−
√bdm has a hump-shaped relationship
to m for positive values of mq∗. For notational convenience, we rewrite
mq∗ =m
(m+ 1)α− β
√m, (19)
where α = b(ab− γ) and β =
√bd.
Let us examine how mq∗ depends on m:
∂mq∗
∂m=
α
(m+ 1)2− β
2√m. (20)
This will be positive if2α
β
√m > (m+ 1)2. (21)
II: Counter-intuitive effects of domestic law enforcement policies in the United States 63
We note that the left-hand side is strictly concave, while the right-hand side is
strictly convex in m. For the smallest possible number of drug lords, m = 1, the
right-hand side equals 4. For equation 20 to be strictly positive, 2αβmust be greater
than 4. Due to the concavity of the left-hand side and the convexity of the right-
hand side of equation 21, increasing m will eventually make equation 20 negative.2αβ> 4 implies that α > 2β. Plugging α = 2β into equation 19 yields mq∗ = 0 for
m = 1. For any value of α > 2β, mq∗ > 0 for m = 1. As ∂mq∗
∂m> 0 for α > 2β and
m = 1, we know we are in the positive quadrant.
Q.E.D.
Proposition (4)
From equation 17, we know that if m∗x∗ > 0 then d < a2m(m+1)2b
must hold.
Then, ∂m∗x∗
∂d= 1
(m+1b )+2γ
¡ab12
pmbd− 1
b(m+ 1)
¢≷ 0 and simplifying we get: a2
4(m+1)2mb≷
d. Because ∂2m∗x∗
∂2d=
µ1
(m+1b )+2γ
¶¡−ab14d
pmbd
¢< 0, m∗x∗ is concave with respect to
d, with d = 14
³a2m
(m+1)2b
´> 0 as the critical point.
Q.E.D.


Chapter III

Spillover effects of domestic lawenforcement policies∗
1 Introduction
In the war against drugs, local and state governments in the United States have spent
millions of dollar in law enforcement with the aim of reducing drug consumption in
their territories. These independent efforts by local or state governments contrast
with a more global structure of illegal drug markets where drug lords sell and dis-
tribute drugs simultaneously in different territories.1 For example, while Colombian
traffickers distribute cocaine at the wholesale level in cities such as Boston, Miami,
Newark, New York, and Philadelphia, Mexican traffickers do it in Chicago, Dallas,
Denver, Houston, Los Angeles, Phoenix, San Diego, San Francisco, and Seattle. The
same pattern is found in the distribution of heroin throughout the United States.2
It is then possible that investments in domestic law enforcement policies by local
or state governments might affect illegal drug activities in other areas.3 This seems
to be the case in cities (and states) of the United States where patterns in drug use
and drug distribution differ.4
∗I thank Sten Nyberg for his advice, and workshop participants at the Department of Economics,Stockholm University, and Conference participants at ENTER Jamboree at Université Libre deBruxelles (Brussels), for helpful comments.
1The same pattern may also apply to national governments.2See DEA reports for further references on the structure of these markets. At a national level,
traffickers also distribute drugs simultaneously in different countries.3In a more general context, investments by national governments might also affect illegal drug
actitivies in other countries. This might explain, for example, the different trends in cocaine
consumption and drug distribution between the United States and some European countries.4See Lang and Johnson (1997) for evidence on differences in crack use between large cities,
and the FBI and DEA reports for differences in drug arrests, drug related violent crime, and drug
seizures in the United States, all correlated with their distribution.
67
68 III: Spillover effects of domestic law enforcement policies
That domestic law enforcement policies by local or state governments do not
only affect the “host” market but also have external effects over other markets
is recognized by the U.S. Federal government in the program of High Intensity
Drug Trafficking Areas (HIDTA), where it assumes that drug trafficking in certain
areas of the United States affects other areas in the country. Understanding these
external effects and the incentives that governments may have to coordinate their
policies is then an important issue for explaining patterns in drug distribution, drug
consumption and prices in different legal jurisdictions and also explaining their global
trends. This is the contribution of the present paper.
The paper studies the effect that these policies may have on a vertically struc-
tured drug industry, where drug suppliers buy drugs from an upstream market and
simultaneously sell and distribute them in downstream markets where arbitrage is
not possible.5 Our model predicts that increases in domestic law enforcement policies
in one market affect the optimal decision by drug suppliers and have consequences
not only at the level of drug distribution, drug consumption and drug prices in the
domestic market, but also in other markets. We find two reasons for these effects.
First, a reduced available demand for illegal drugs in one downstream market can
push down the wholesale price “internationally” and lead to increased consumption
in other downstream markets. Second, if the illegal drug industry, or “drug lords”,
adapt market investments, such as drug distribution activities, to the governments’
domestic law enforcement policies, this interaction can also contribute to local drug
policies spilling over to other markets.
The model captures the spillover effects of domestic law enforcement policies in
other markets andmay help to explain the pattern of trends in drug consumption and
drug distribution between cities in the United States (or countries in a more general
context), and also the simultaneously declining drug prices in both upstream and
downstream markets. The result is that stricter domestic law enforcement policies
in one market tend to increase drug distribution activities in other markets, while
having a non-monotonic effect on these activities in the “host” market.6 Hence,
drug consumption in the “host” market is reduced while increased in other markets
5Some evidence on price differences between cities and regions in the United States support this
assumption. See Caulkins (1995) and Reuter and Greenfield (2001) for further references.6For evidence on differences in the size of Police Departments in large cities see Reaves and
Hickman (2002).
III: Spillover effects of domestic law enforcement policies 69
and drug prices in both upstream and downstream markets are reduced.
When these external effects are present, the local or state governments’ deci-
sions on spending in domestic law enforcement policies in those drug markets are
also linked. Their optimal policies are analyzed in section 3. The existence of exter-
nalities opens up the possibility for coordination between governments with the aim
of reaching efficiency in the allocation of public resources at a global sphere. Even
though coordination between governments creates a lower spending of resources, it
also results in a higher level of global drug consumption. Conversely, policies set
by independent governments create a lower global drug consumption but a higher
spending of resources. These results are found to be robust to differences in the
degree of competition in both the upstream and the downstream markets.
Nonetheless, the governments’ incentives to coordinate their levels of domestic
law enforcement policies do depend on the relative level of competition in their
respective downstream markets. This issue is developed in Section 4. We find
that governments with identical loss functions are more likely to coordinate their
policies, if the level of competition in their downstream markets is also similar.
However, if the level of competition differs substantially between their markets, one
of the governments may find it optimal to independently set its level of domestic
law enforcement policies.
With this brief introduction to the present paper, we may now review some of
the related literature.
In the last years, there have been few theoretical papers related to the issues
analyzed here.7 Jacobsson and Naranjo (2004) provide the basic theoretical frame-
work used in this paper. However, they do not consider the effect of drug policy
in a global context with a vertical structure industry. Among other results, by ac-
counting for these features, we are able to explain how an increase in domestic law
enforcement policies will reduce drug prices without relying on increasing marginal
costs of drug production, as it is the case in their model.
Poret (2005) studies the optimal law enforcement policy in a model of a vertically
organized distribution network. She is interested in finding what type of sellers
authorities must pursue and which sanction a seller has to pay in case of arrest.
Unlike her study we are interested in the external effects of optimal law enforcement
7For a general reference to the methodology in this paper, see Venables (1999). For a similar
idea in the light of the optimal law enforcement literature, see Garoupa (1997).
70 III: Spillover effects of domestic law enforcement policies
policies due to the vertical organization of the illegal drug industry and their effects
on drug consumption, drug distribution and prices in related markets.
Chiu, Mansley and Morgan (1998) analyze the location of optimal enforcement
efforts between both the upstream and the downstream drug markets. They find
the effect on this location to be of no relevance for minimizing the consumption
of drugs. Although assuming the same vertical structure, this paper studies the
effect of policies between downstream markets. We find that due to the negative
externalities from implementing domestic law enforcement policies in downstream
markets the location of these policies matter.
Konrad (1994) explores why rational local governments use supply restricting
drug policies (i.e. prohibition) to fight the illicit drug industry. Since supply restric-
tion gives addicts an incentive to migrate, it has an external effect, which makes
the policy individually rational but leads to socially inefficient results in a federal
system. Instead, we focus on the effect of policies on drug suppliers and find that
external effects leads also to inneficient allocation of resources at a global sphere.
Rasmussen et al. (1993) empirically examine the effect of drug law enforcement
on violent crime, in the context of spatial competition in illicit drug markets. They
assume drug sellers’ costs to vary geographically with differences in policing efforts
between drug markets, thereby changing the relative probability of being arrested.
Their results suggest that stricter drug enforcement in one jurisdiction increases
the size of the drug market in an adjoining jurisdiction, resulting in a higher violent
crime rate.8 Under a different approach, our paper provides a theoretical explanation
for their findings if drug distribution activities are positively correlated with violent
crime.
The paper is structured as follows. Sections two and three set up the basic model,
study the governments’ decisions and show the key results. Section four extends the
baseline model allowing for competition in the downstream market. The last section
discusses the results and gives suggestions for future research.
8See Bronars and Lott (1998) for a paper related to geographic spillovers in crime.
III: Spillover effects of domestic law enforcement policies 71
2 The Model
In the benchmark model, there are one upstream and one downstream monopolist.9
The upstream drug lord produces the drug at a constant marginal cost, β, and
sells it to the downstream drug lord who in turn, chooses the level of distribution
activities in order to effectively reach the potential demand for drugs and sells the
drug to final users in two segmented markets, i and j.
For simplicity, following Poret (2005), we assume that the potential demand
for illegal drugs in market k = i, j is given by a linear aggregate demand function
ak − bpk, where ak > 0, b > 0, and the price of drugs pk > 0.10
Furthermore, we assume that the actual demand for drugs in market k depends
on how much the downstream monopolist invests in distribution activities in that
market, xk, relative to how much the government spends on domestic law enforce-
ment policies, dk. For simplicity, spending on these policies is equally effective
between downstream markets. Specifically, let the share of the total demand that
the downstream monopolist can provide, zk, be11
zk =xk
xk + dk. (1)
Hence, the actual aggregate demand function is qk = zk¡ak − bpk
¢, or expressed in
terms of inverse demand
pk =ak
b− qk
bzk. (2)
The downstream monopolist buys drugs from an upstream monopolist at the
input drug price, s, and its profits are12
9An oligopolic structure in both the downstream and the upstream market does not affect our
results but make their interpretation a bit more complicated. For that reason the choice of this
benchmark model.10As opposed to a constant elastic demand, the linear demand function gives the possibility of
having an additive relationship between input and output drug prices in equilibrium, in support
of the findings by Desimone (2006) and Caulkins and Reuter (1998).11This is the standard contest success function; see Skaperdas (1995), Hirschleifer (1991), and
Tullock (1972) for further references.12Note that distribution activities do not depend on drug sales. Since drug suppliers must be
sufficiently large to enter the market and the profits by selling small quantities of drugs such as
cocaine or heroin are sufficiently large, this assumption seems reasonable.
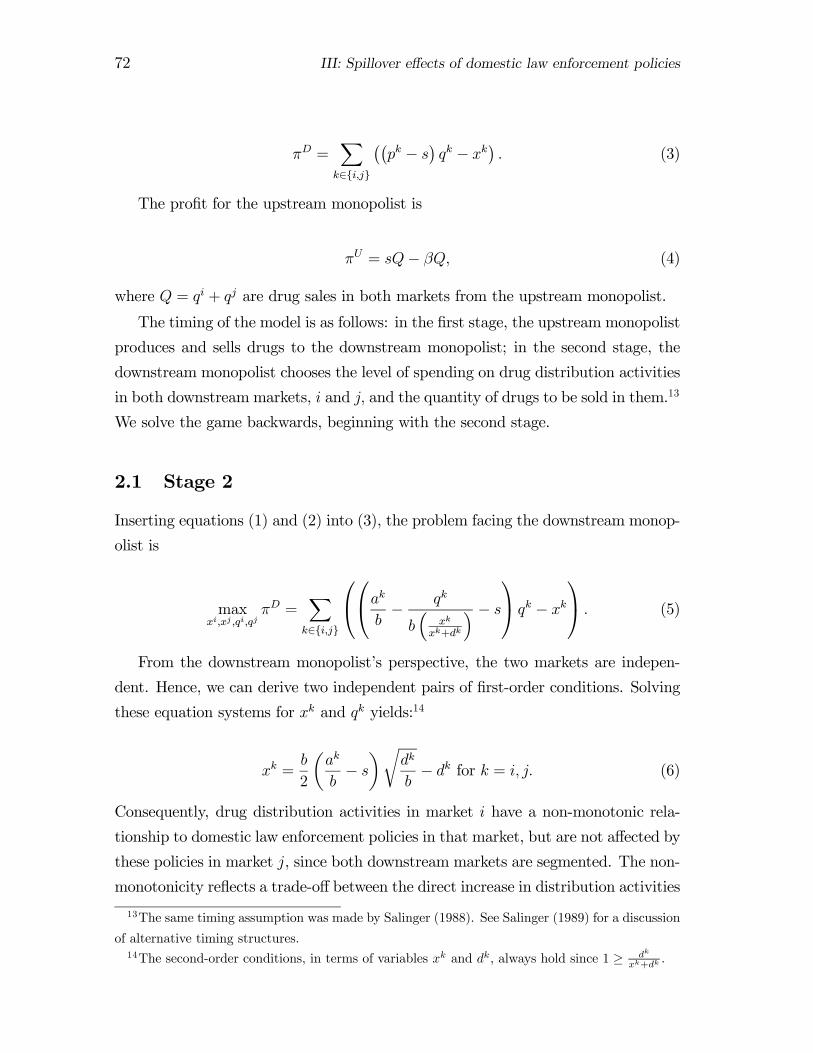
72 III: Spillover effects of domestic law enforcement policies
πD =Xk∈{i,j}
¡¡pk − s
¢qk − xk
¢. (3)
The profit for the upstream monopolist is
πU = sQ− βQ, (4)
where Q = qi + qj are drug sales in both markets from the upstream monopolist.
The timing of the model is as follows: in the first stage, the upstream monopolist
produces and sells drugs to the downstream monopolist; in the second stage, the
downstream monopolist chooses the level of spending on drug distribution activities
in both downstream markets, i and j, and the quantity of drugs to be sold in them.13
We solve the game backwards, beginning with the second stage.
2.1 Stage 2
Inserting equations (1) and (2) into (3), the problem facing the downstream monop-
olist is
maxxi,xj ,qi,qj
πD =Xk∈{i,j}
⎛⎝⎛⎝akb− qk
b³
xk
xk+dk
´ − s⎞⎠ qk − xk
⎞⎠ . (5)
From the downstream monopolist’s perspective, the two markets are indepen-
dent. Hence, we can derive two independent pairs of first-order conditions. Solving
these equation systems for xk and qk yields:14
xk =b
2
µak
b− s¶r
dk
b− dk for k = i, j. (6)
Consequently, drug distribution activities in market i have a non-monotonic rela-
tionship to domestic law enforcement policies in that market, but are not affected by
these policies in market j, since both downstream markets are segmented. The non-
monotonicity reflects a trade-off between the direct increase in distribution activities
13The same timing assumption was made by Salinger (1988). See Salinger (1989) for a discussion
of alternative timing structures.14The second-order conditions, in terms of variables xk and dk, always hold since 1 ≥ dk
xk+dk.
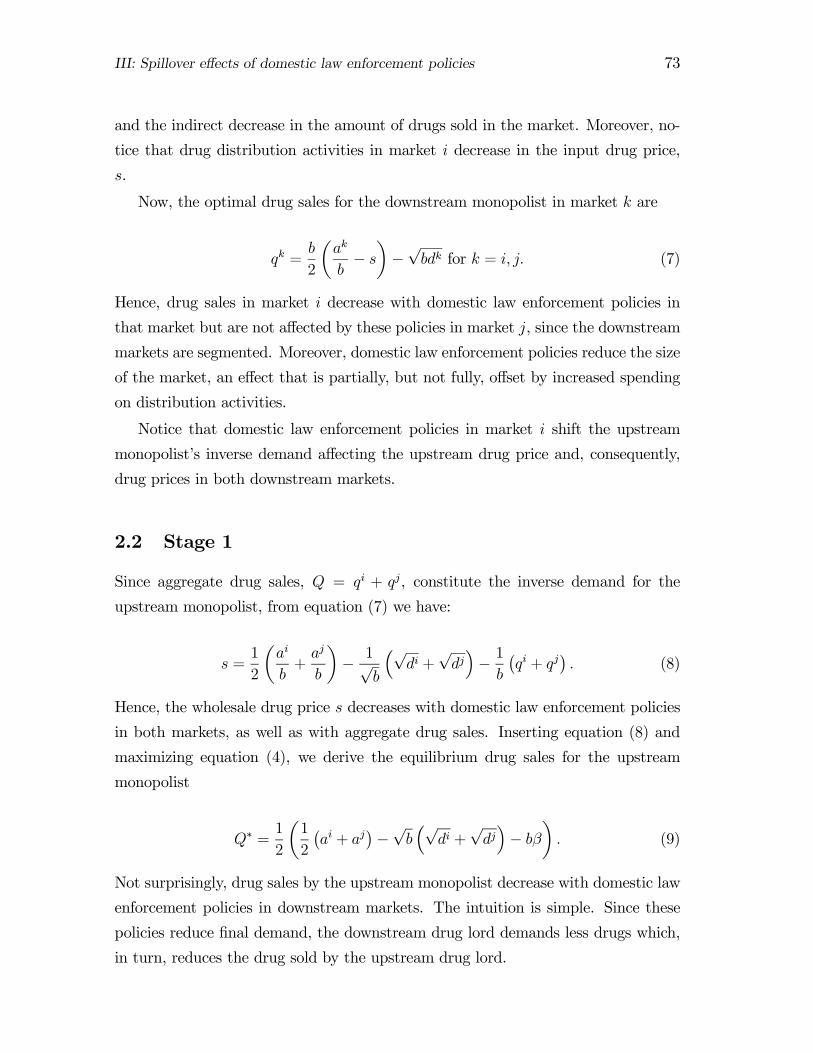
III: Spillover effects of domestic law enforcement policies 73
and the indirect decrease in the amount of drugs sold in the market. Moreover, no-
tice that drug distribution activities in market i decrease in the input drug price,
s.
Now, the optimal drug sales for the downstream monopolist in market k are
qk =b
2
µak
b− s¶−√bdk for k = i, j. (7)
Hence, drug sales in market i decrease with domestic law enforcement policies in
that market but are not affected by these policies in market j, since the downstream
markets are segmented. Moreover, domestic law enforcement policies reduce the size
of the market, an effect that is partially, but not fully, offset by increased spending
on distribution activities.
Notice that domestic law enforcement policies in market i shift the upstream
monopolist’s inverse demand affecting the upstream drug price and, consequently,
drug prices in both downstream markets.
2.2 Stage 1
Since aggregate drug sales, Q = qi + qj, constitute the inverse demand for the
upstream monopolist, from equation (7) we have:
s =1
2
µai
b+aj
b
¶− 1√
b
³√di +√dj´− 1b
¡qi + qj
¢. (8)
Hence, the wholesale drug price s decreases with domestic law enforcement policies
in both markets, as well as with aggregate drug sales. Inserting equation (8) and
maximizing equation (4), we derive the equilibrium drug sales for the upstream
monopolist
Q∗ =1
2
µ1
2
¡ai + aj
¢−√b³√di +√dj´− bβ
¶. (9)
Not surprisingly, drug sales by the upstream monopolist decrease with domestic law
enforcement policies in downstream markets. The intuition is simple. Since these
policies reduce final demand, the downstream drug lord demands less drugs which,
in turn, reduces the drug sold by the upstream drug lord.
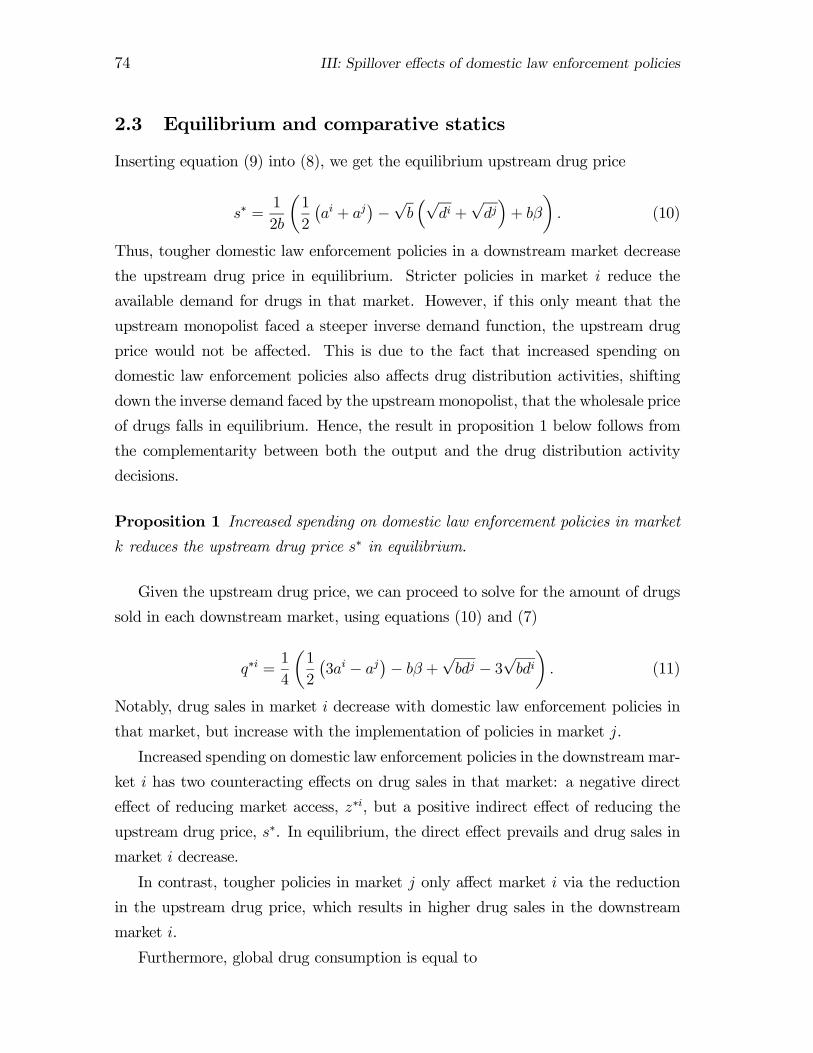
74 III: Spillover effects of domestic law enforcement policies
2.3 Equilibrium and comparative statics
Inserting equation (9) into (8), we get the equilibrium upstream drug price
s∗ =1
2b
µ1
2
¡ai + aj
¢−√b³√di +√dj´+ bβ
¶. (10)
Thus, tougher domestic law enforcement policies in a downstream market decrease
the upstream drug price in equilibrium. Stricter policies in market i reduce the
available demand for drugs in that market. However, if this only meant that the
upstream monopolist faced a steeper inverse demand function, the upstream drug
price would not be affected. This is due to the fact that increased spending on
domestic law enforcement policies also affects drug distribution activities, shifting
down the inverse demand faced by the upstreammonopolist, that the wholesale price
of drugs falls in equilibrium. Hence, the result in proposition 1 below follows from
the complementarity between both the output and the drug distribution activity
decisions.
Proposition 1 Increased spending on domestic law enforcement policies in market
k reduces the upstream drug price s∗ in equilibrium.
Given the upstream drug price, we can proceed to solve for the amount of drugs
sold in each downstream market, using equations (10) and (7)
q∗i =1
4
µ1
2
¡3ai − aj
¢− bβ +
√bdj − 3
√bdi¶. (11)
Notably, drug sales in market i decrease with domestic law enforcement policies in
that market, but increase with the implementation of policies in market j.
Increased spending on domestic law enforcement policies in the downstreammar-
ket i has two counteracting effects on drug sales in that market: a negative direct
effect of reducing market access, z∗i, but a positive indirect effect of reducing the
upstream drug price, s∗. In equilibrium, the direct effect prevails and drug sales in
market i decrease.
In contrast, tougher policies in market j only affect market i via the reduction
in the upstream drug price, which results in higher drug sales in the downstream
market i.
Furthermore, global drug consumption is equal to
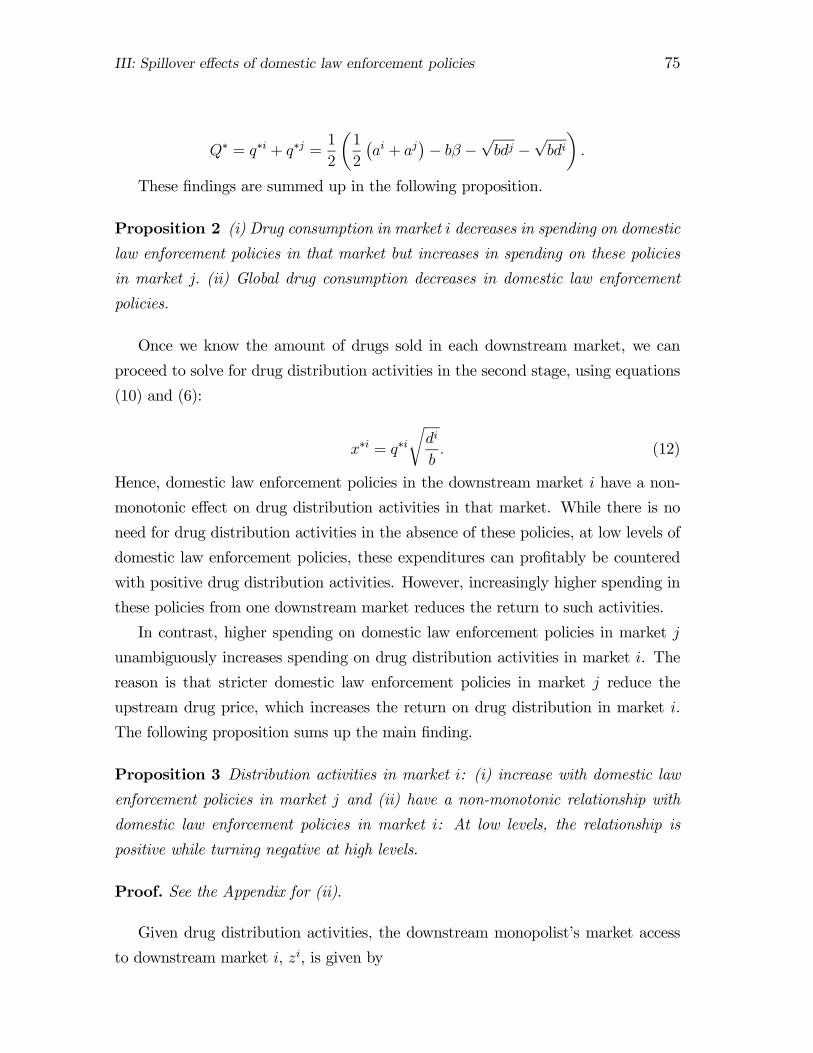
III: Spillover effects of domestic law enforcement policies 75
Q∗ = q∗i + q∗j =1
2
µ1
2
¡ai + aj
¢− bβ −
√bdj −
√bdi¶.
These findings are summed up in the following proposition.
Proposition 2 (i) Drug consumption in market i decreases in spending on domestic
law enforcement policies in that market but increases in spending on these policies
in market j. (ii) Global drug consumption decreases in domestic law enforcement
policies.
Once we know the amount of drugs sold in each downstream market, we can
proceed to solve for drug distribution activities in the second stage, using equations
(10) and (6):
x∗i = q∗irdi
b. (12)
Hence, domestic law enforcement policies in the downstream market i have a non-
monotonic effect on drug distribution activities in that market. While there is no
need for drug distribution activities in the absence of these policies, at low levels of
domestic law enforcement policies, these expenditures can profitably be countered
with positive drug distribution activities. However, increasingly higher spending in
these policies from one downstream market reduces the return to such activities.
In contrast, higher spending on domestic law enforcement policies in market j
unambiguously increases spending on drug distribution activities in market i. The
reason is that stricter domestic law enforcement policies in market j reduce the
upstream drug price, which increases the return on drug distribution in market i.
The following proposition sums up the main finding.
Proposition 3 Distribution activities in market i: (i) increase with domestic law
enforcement policies in market j and (ii) have a non-monotonic relationship with
domestic law enforcement policies in market i: At low levels, the relationship is
positive while turning negative at high levels.
Proof. See the Appendix for (ii).
Given drug distribution activities, the downstream monopolist’s market access
to downstream market i, zi, is given by
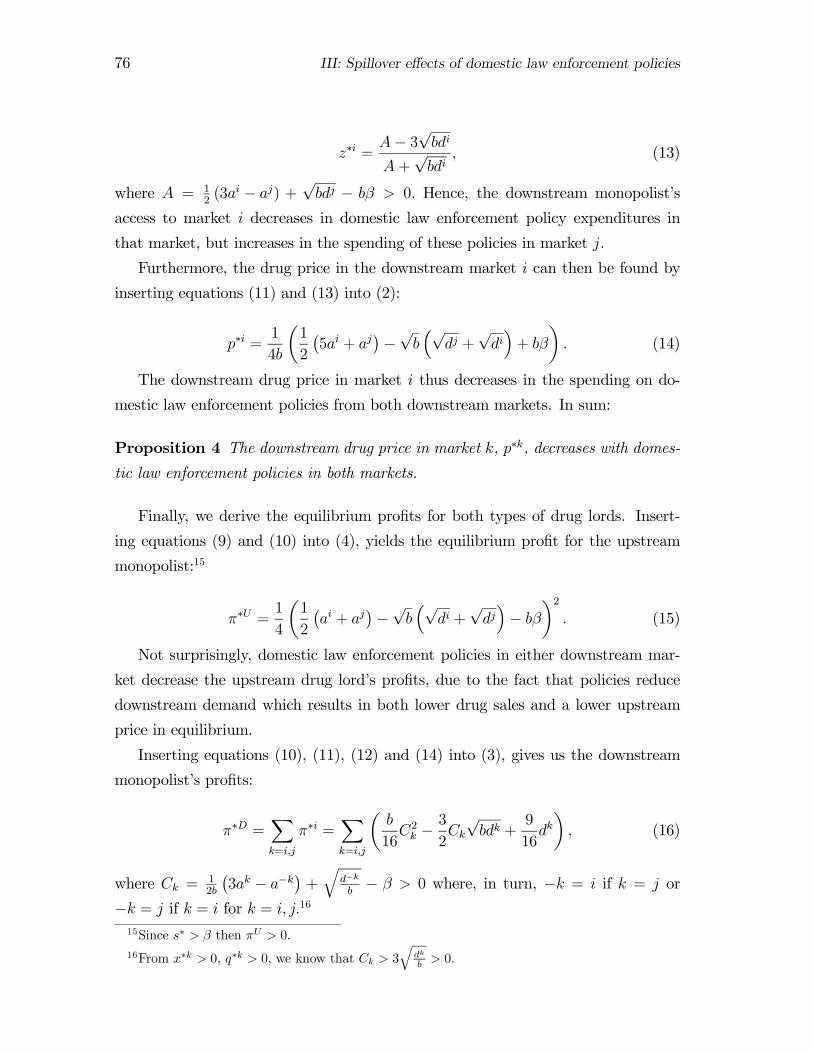
76 III: Spillover effects of domestic law enforcement policies
z∗i =A− 3
√bdi
A+√bdi
, (13)
where A = 12(3ai − aj) +
√bdj − bβ > 0. Hence, the downstream monopolist’s
access to market i decreases in domestic law enforcement policy expenditures in
that market, but increases in the spending of these policies in market j.
Furthermore, the drug price in the downstream market i can then be found by
inserting equations (11) and (13) into (2):
p∗i =1
4b
µ1
2
¡5ai + aj
¢−√b³√dj +
√di´+ bβ
¶. (14)
The downstream drug price in market i thus decreases in the spending on do-
mestic law enforcement policies from both downstream markets. In sum:
Proposition 4 The downstream drug price in market k, p∗k, decreases with domes-
tic law enforcement policies in both markets.
Finally, we derive the equilibrium profits for both types of drug lords. Insert-
ing equations (9) and (10) into (4), yields the equilibrium profit for the upstream
monopolist:15
π∗U =1
4
µ1
2
¡ai + aj
¢−√b³√di +√dj´− bβ
¶2. (15)
Not surprisingly, domestic law enforcement policies in either downstream mar-
ket decrease the upstream drug lord’s profits, due to the fact that policies reduce
downstream demand which results in both lower drug sales and a lower upstream
price in equilibrium.
Inserting equations (10), (11), (12) and (14) into (3), gives us the downstream
monopolist’s profits:
π∗D =Xk=i,j
π∗i =Xk=i,j
µb
16C2k −
3
2Ck√bdk +
9
16dk¶, (16)
where Ck = 12b
¡3ak − a−k
¢+q
d−k
b− β > 0 where, in turn, −k = i if k = j or
−k = j if k = i for k = i, j.1615Since s∗ > β then πU > 0.
16From x∗k > 0, q∗k > 0, we know that Ck > 3q
dk
b > 0.
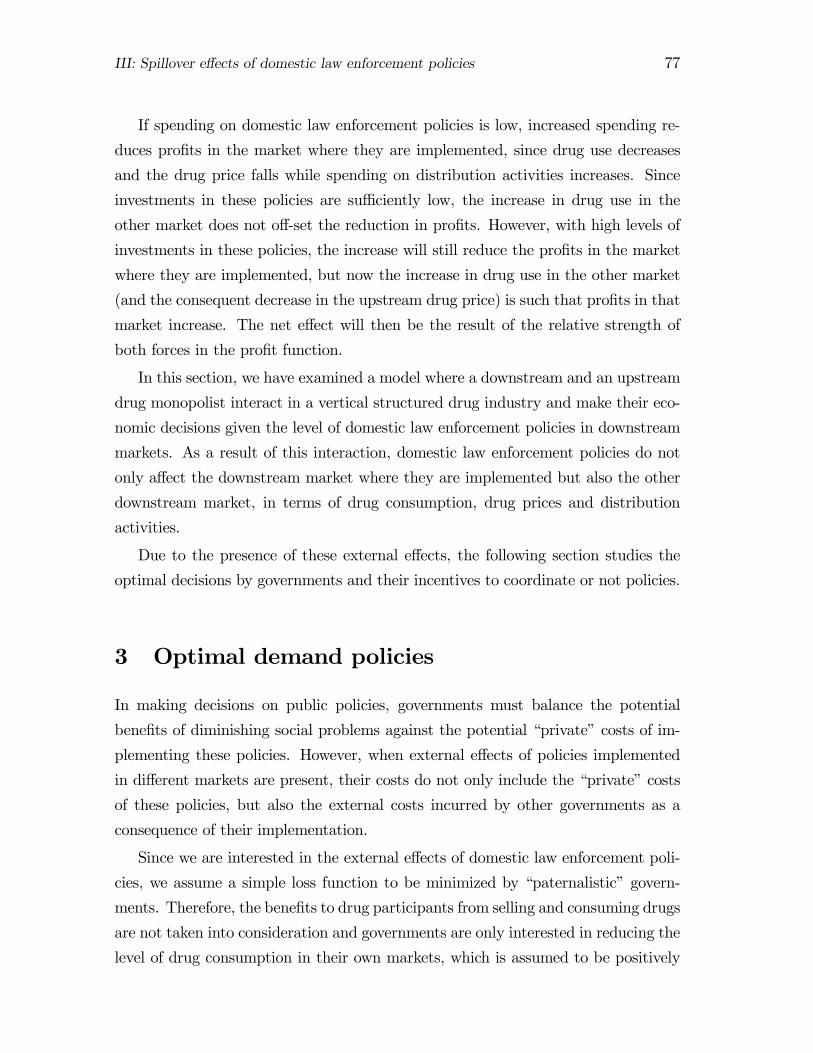
III: Spillover effects of domestic law enforcement policies 77
If spending on domestic law enforcement policies is low, increased spending re-
duces profits in the market where they are implemented, since drug use decreases
and the drug price falls while spending on distribution activities increases. Since
investments in these policies are sufficiently low, the increase in drug use in the
other market does not off-set the reduction in profits. However, with high levels of
investments in these policies, the increase will still reduce the profits in the market
where they are implemented, but now the increase in drug use in the other market
(and the consequent decrease in the upstream drug price) is such that profits in that
market increase. The net effect will then be the result of the relative strength of
both forces in the profit function.
In this section, we have examined a model where a downstream and an upstream
drug monopolist interact in a vertical structured drug industry and make their eco-
nomic decisions given the level of domestic law enforcement policies in downstream
markets. As a result of this interaction, domestic law enforcement policies do not
only affect the downstream market where they are implemented but also the other
downstream market, in terms of drug consumption, drug prices and distribution
activities.
Due to the presence of these external effects, the following section studies the
optimal decisions by governments and their incentives to coordinate or not policies.
3 Optimal demand policies
In making decisions on public policies, governments must balance the potential
benefits of diminishing social problems against the potential “private” costs of im-
plementing these policies. However, when external effects of policies implemented
in different markets are present, their costs do not only include the “private” costs
of these policies, but also the external costs incurred by other governments as a
consequence of their implementation.
Since we are interested in the external effects of domestic law enforcement poli-
cies, we assume a simple loss function to be minimized by “paternalistic” govern-
ments. Therefore, the benefits to drug participants from selling and consuming drugs
are not taken into consideration and governments are only interested in reducing the
level of drug consumption in their own markets, which is assumed to be positively
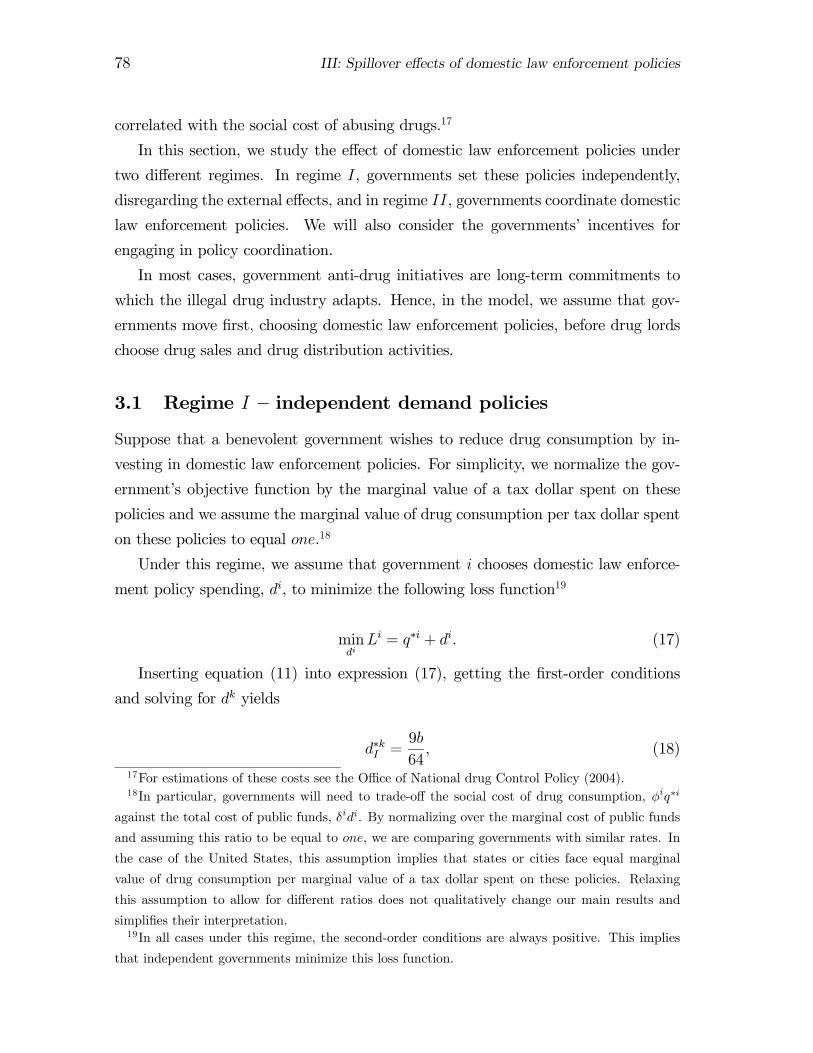
78 III: Spillover effects of domestic law enforcement policies
correlated with the social cost of abusing drugs.17
In this section, we study the effect of domestic law enforcement policies under
two different regimes. In regime I, governments set these policies independently,
disregarding the external effects, and in regime II, governments coordinate domestic
law enforcement policies. We will also consider the governments’ incentives for
engaging in policy coordination.
In most cases, government anti-drug initiatives are long-term commitments to
which the illegal drug industry adapts. Hence, in the model, we assume that gov-
ernments move first, choosing domestic law enforcement policies, before drug lords
choose drug sales and drug distribution activities.
3.1 Regime I — independent demand policies
Suppose that a benevolent government wishes to reduce drug consumption by in-
vesting in domestic law enforcement policies. For simplicity, we normalize the gov-
ernment’s objective function by the marginal value of a tax dollar spent on these
policies and we assume the marginal value of drug consumption per tax dollar spent
on these policies to equal one.18
Under this regime, we assume that government i chooses domestic law enforce-
ment policy spending, di, to minimize the following loss function19
mindiLi = q∗i + di. (17)
Inserting equation (11) into expression (17), getting the first-order conditions
and solving for dk yields
d∗kI =9b
64, (18)
17For estimations of these costs see the Office of National drug Control Policy (2004).18In particular, governments will need to trade-off the social cost of drug consumption, φiq∗i
against the total cost of public funds, δidi. By normalizing over the marginal cost of public funds
and assuming this ratio to be equal to one, we are comparing governments with similar rates. In
the case of the United States, this assumption implies that states or cities face equal marginal
value of drug consumption per marginal value of a tax dollar spent on these policies. Relaxing
this assumption to allow for different ratios does not qualitatively change our main results and
simplifies their interpretation.19In all cases under this regime, the second-order conditions are always positive. This implies
that independent governments minimize this loss function.
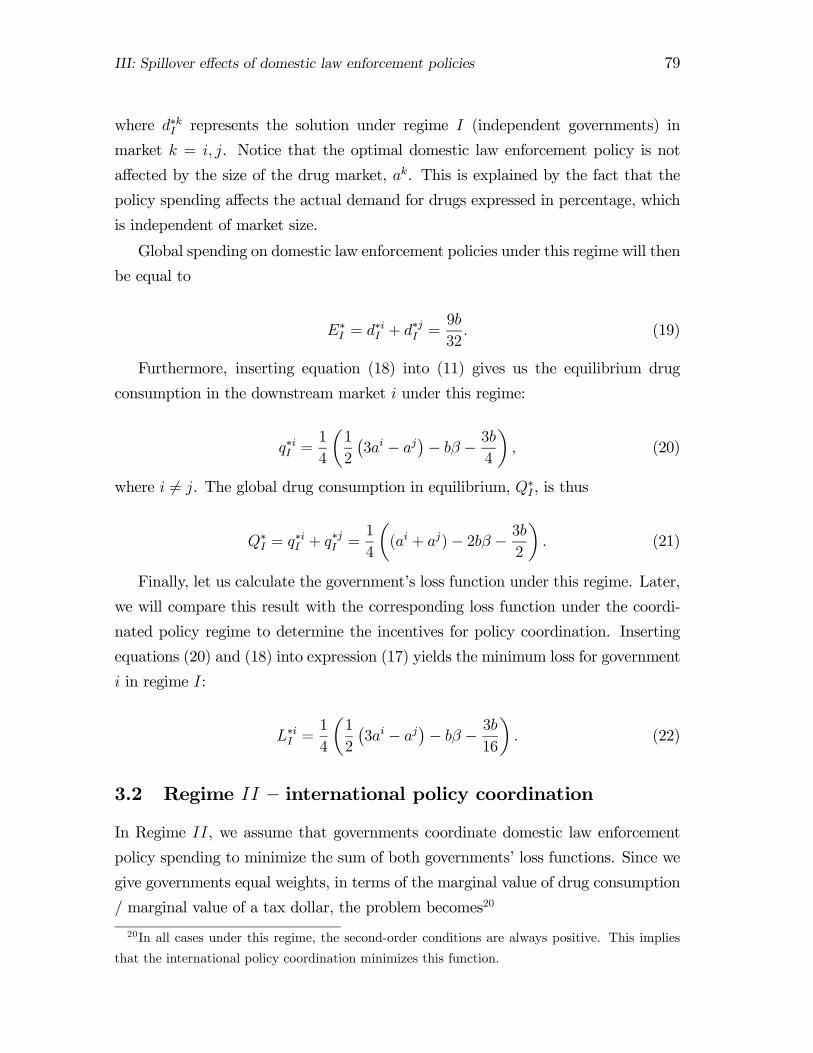
III: Spillover effects of domestic law enforcement policies 79
where d∗kI represents the solution under regime I (independent governments) in
market k = i, j. Notice that the optimal domestic law enforcement policy is not
affected by the size of the drug market, ak. This is explained by the fact that the
policy spending affects the actual demand for drugs expressed in percentage, which
is independent of market size.
Global spending on domestic law enforcement policies under this regime will then
be equal to
E∗I = d∗iI + d
∗jI =
9b
32. (19)
Furthermore, inserting equation (18) into (11) gives us the equilibrium drug
consumption in the downstream market i under this regime:
q∗iI =1
4
µ1
2
¡3ai − aj
¢− bβ − 3b
4
¶, (20)
where i 6= j. The global drug consumption in equilibrium, Q∗I , is thus
Q∗I = q∗iI + q
∗jI =
1
4
µ(ai + aj)− 2bβ − 3b
2
¶. (21)
Finally, let us calculate the government’s loss function under this regime. Later,
we will compare this result with the corresponding loss function under the coordi-
nated policy regime to determine the incentives for policy coordination. Inserting
equations (20) and (18) into expression (17) yields the minimum loss for government
i in regime I:
L∗iI =1
4
µ1
2
¡3ai − aj
¢− bβ − 3b
16
¶. (22)
3.2 Regime II — international policy coordination
In Regime II, we assume that governments coordinate domestic law enforcement
policy spending to minimize the sum of both governments’ loss functions. Since we
give governments equal weights, in terms of the marginal value of drug consumption
/ marginal value of a tax dollar, the problem becomes20
20In all cases under this regime, the second-order conditions are always positive. This implies
that the international policy coordination minimizes this function.
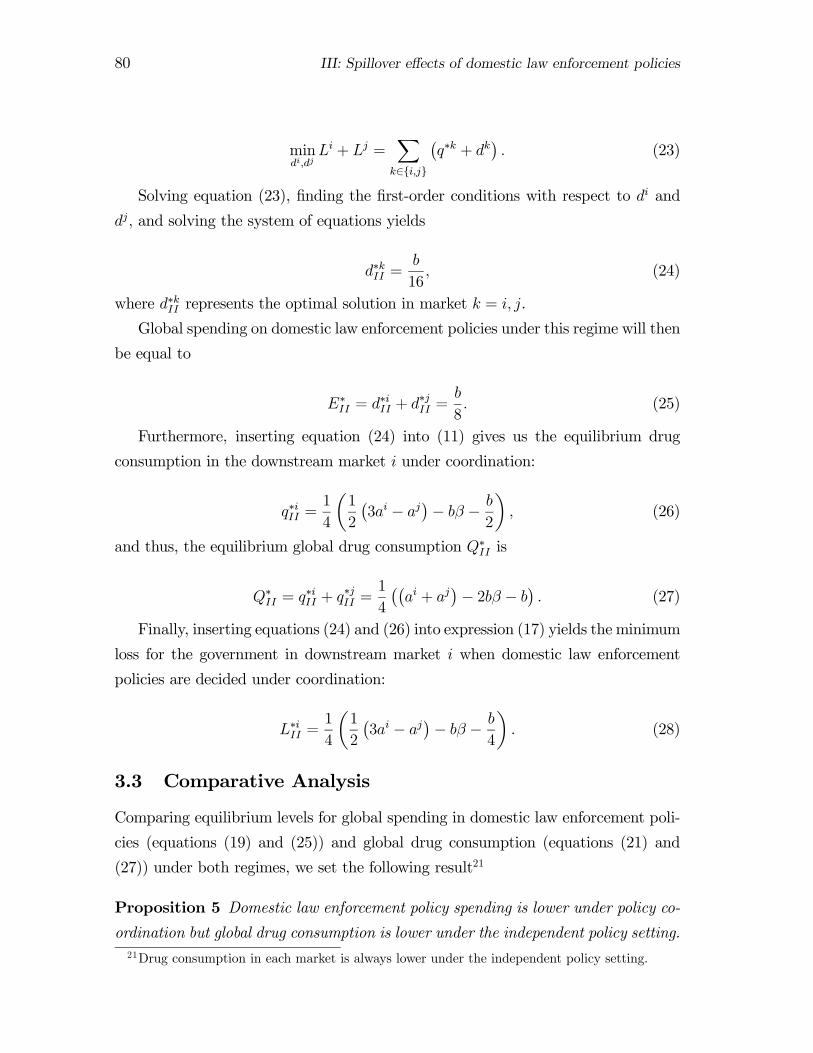
80 III: Spillover effects of domestic law enforcement policies
mindi,dj
Li + Lj =Xk∈{i,j}
¡q∗k + dk
¢. (23)
Solving equation (23), finding the first-order conditions with respect to di and
dj, and solving the system of equations yields
d∗kII =b
16, (24)
where d∗kII represents the optimal solution in market k = i, j.
Global spending on domestic law enforcement policies under this regime will then
be equal to
E∗II = d∗iII + d
∗jII =
b
8. (25)
Furthermore, inserting equation (24) into (11) gives us the equilibrium drug
consumption in the downstream market i under coordination:
q∗iII =1
4
µ1
2
¡3ai − aj
¢− bβ − b
2
¶, (26)
and thus, the equilibrium global drug consumption Q∗II is
Q∗II = q∗iII + q
∗jII =
1
4
¡¡ai + aj
¢− 2bβ − b
¢. (27)
Finally, inserting equations (24) and (26) into expression (17) yields the minimum
loss for the government in downstream market i when domestic law enforcement
policies are decided under coordination:
L∗iII =1
4
µ1
2
¡3ai − aj
¢− bβ − b
4
¶. (28)
3.3 Comparative Analysis
Comparing equilibrium levels for global spending in domestic law enforcement poli-
cies (equations (19) and (25)) and global drug consumption (equations (21) and
(27)) under both regimes, we set the following result21
Proposition 5 Domestic law enforcement policy spending is lower under policy co-
ordination but global drug consumption is lower under the independent policy setting.21Drug consumption in each market is always lower under the independent policy setting.
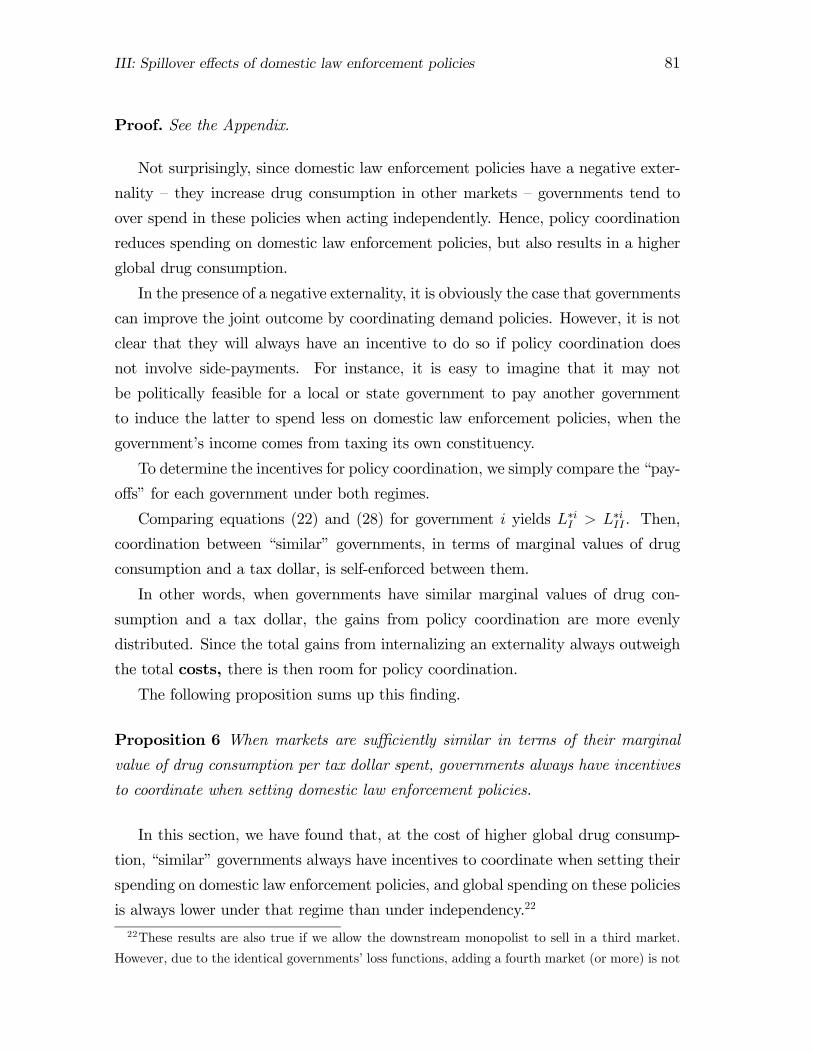
III: Spillover effects of domestic law enforcement policies 81
Proof. See the Appendix.
Not surprisingly, since domestic law enforcement policies have a negative exter-
nality — they increase drug consumption in other markets — governments tend to
over spend in these policies when acting independently. Hence, policy coordination
reduces spending on domestic law enforcement policies, but also results in a higher
global drug consumption.
In the presence of a negative externality, it is obviously the case that governments
can improve the joint outcome by coordinating demand policies. However, it is not
clear that they will always have an incentive to do so if policy coordination does
not involve side-payments. For instance, it is easy to imagine that it may not
be politically feasible for a local or state government to pay another government
to induce the latter to spend less on domestic law enforcement policies, when the
government’s income comes from taxing its own constituency.
To determine the incentives for policy coordination, we simply compare the “pay-
offs” for each government under both regimes.
Comparing equations (22) and (28) for government i yields L∗iI > L∗iII . Then,
coordination between “similar” governments, in terms of marginal values of drug
consumption and a tax dollar, is self-enforced between them.
In other words, when governments have similar marginal values of drug con-
sumption and a tax dollar, the gains from policy coordination are more evenly
distributed. Since the total gains from internalizing an externality always outweigh
the total costs, there is then room for policy coordination.
The following proposition sums up this finding.
Proposition 6 When markets are sufficiently similar in terms of their marginal
value of drug consumption per tax dollar spent, governments always have incentives
to coordinate when setting domestic law enforcement policies.
In this section, we have found that, at the cost of higher global drug consump-
tion, “similar” governments always have incentives to coordinate when setting their
spending on domestic law enforcement policies, and global spending on these policies
is always lower under that regime than under independency.22
22These results are also true if we allow the downstream monopolist to sell in a third market.
However, due to the identical governments’ loss functions, adding a fourth market (or more) is not
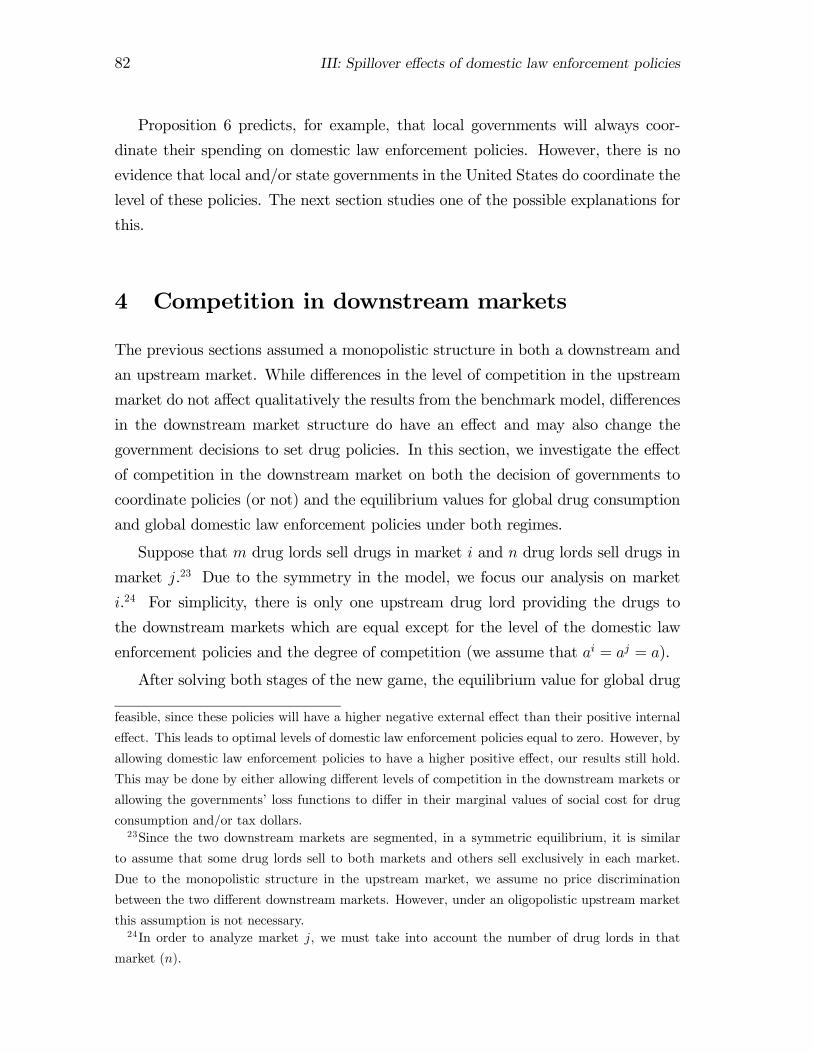
82 III: Spillover effects of domestic law enforcement policies
Proposition 6 predicts, for example, that local governments will always coor-
dinate their spending on domestic law enforcement policies. However, there is no
evidence that local and/or state governments in the United States do coordinate the
level of these policies. The next section studies one of the possible explanations for
this.
4 Competition in downstream markets
The previous sections assumed a monopolistic structure in both a downstream and
an upstream market. While differences in the level of competition in the upstream
market do not affect qualitatively the results from the benchmark model, differences
in the downstream market structure do have an effect and may also change the
government decisions to set drug policies. In this section, we investigate the effect
of competition in the downstream market on both the decision of governments to
coordinate policies (or not) and the equilibrium values for global drug consumption
and global domestic law enforcement policies under both regimes.
Suppose that m drug lords sell drugs in market i and n drug lords sell drugs in
market j.23 Due to the symmetry in the model, we focus our analysis on market
i.24 For simplicity, there is only one upstream drug lord providing the drugs to
the downstream markets which are equal except for the level of the domestic law
enforcement policies and the degree of competition (we assume that ai = aj = a).
After solving both stages of the new game, the equilibrium value for global drug
feasible, since these policies will have a higher negative external effect than their positive internal
effect. This leads to optimal levels of domestic law enforcement policies equal to zero. However, by
allowing domestic law enforcement policies to have a higher positive effect, our results still hold.
This may be done by either allowing different levels of competition in the downstream markets or
allowing the governments’ loss functions to differ in their marginal values of social cost for drug
consumption and/or tax dollars.23Since the two downstream markets are segmented, in a symmetric equilibrium, it is similar
to assume that some drug lords sell to both markets and others sell exclusively in each market.
Due to the monopolistic structure in the upstream market, we assume no price discrimination
between the two different downstream markets. However, under an oligopolistic upstream market
this assumption is not necessary.24In order to analyze market j, we must take into account the number of drug lords in that
market (n).
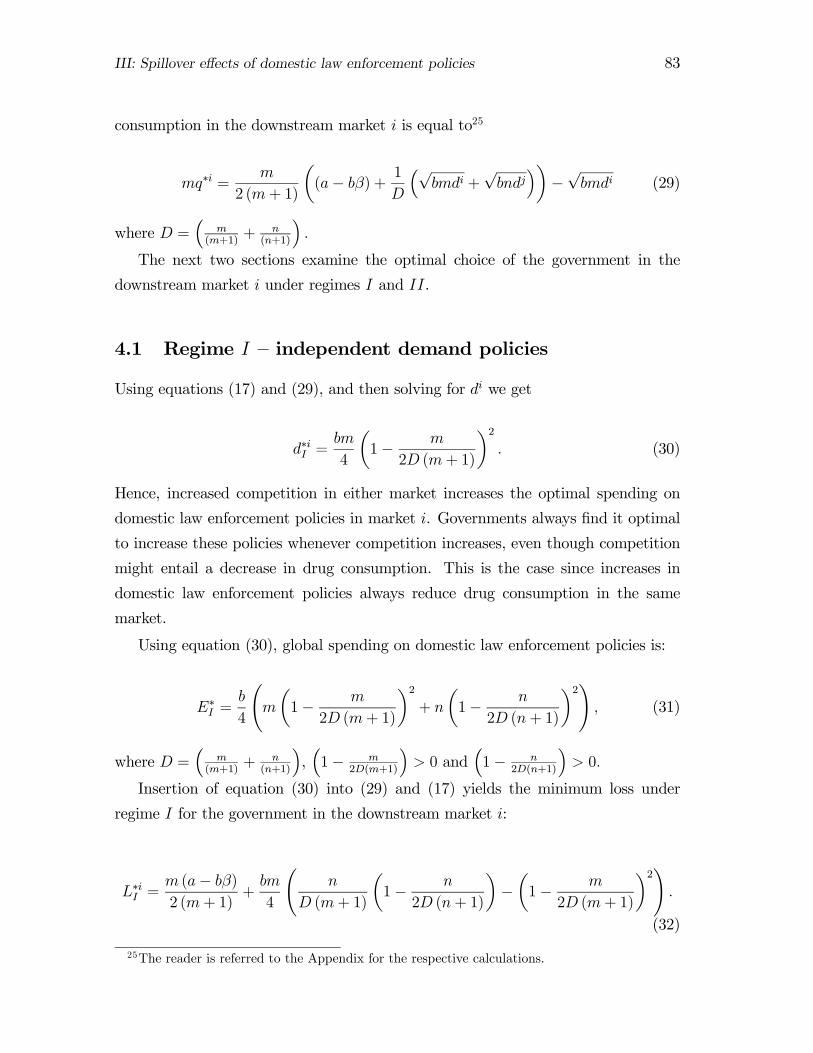
III: Spillover effects of domestic law enforcement policies 83
consumption in the downstream market i is equal to25
mq∗i =m
2 (m+ 1)
µ(a− bβ) + 1
D
³√bmdi +
√bndj
´¶−√bmdi (29)
where D =³
m(m+1)
+ n(n+1)
´.
The next two sections examine the optimal choice of the government in the
downstream market i under regimes I and II.
4.1 Regime I — independent demand policies
Using equations (17) and (29), and then solving for di we get
d∗iI =bm
4
µ1− m
2D (m+ 1)
¶2. (30)
Hence, increased competition in either market increases the optimal spending on
domestic law enforcement policies in market i. Governments always find it optimal
to increase these policies whenever competition increases, even though competition
might entail a decrease in drug consumption. This is the case since increases in
domestic law enforcement policies always reduce drug consumption in the same
market.
Using equation (30), global spending on domestic law enforcement policies is:
E∗I =b
4
Ãm
µ1− m
2D (m+ 1)
¶2+ n
µ1− n
2D (n+ 1)
¶2!, (31)
where D =³
m(m+1)
+ n(n+1)
´,³1− m
2D(m+1)
´> 0 and
³1− n
2D(n+1)
´> 0.
Insertion of equation (30) into (29) and (17) yields the minimum loss under
regime I for the government in the downstream market i:
L∗iI =m (a− bβ)2 (m+ 1)
+bm
4
Ãn
D (m+ 1)
µ1− n
2D (n+ 1)
¶−µ1− m
2D (m+ 1)
¶2!.
(32)
25The reader is referred to the Appendix for the respective calculations.
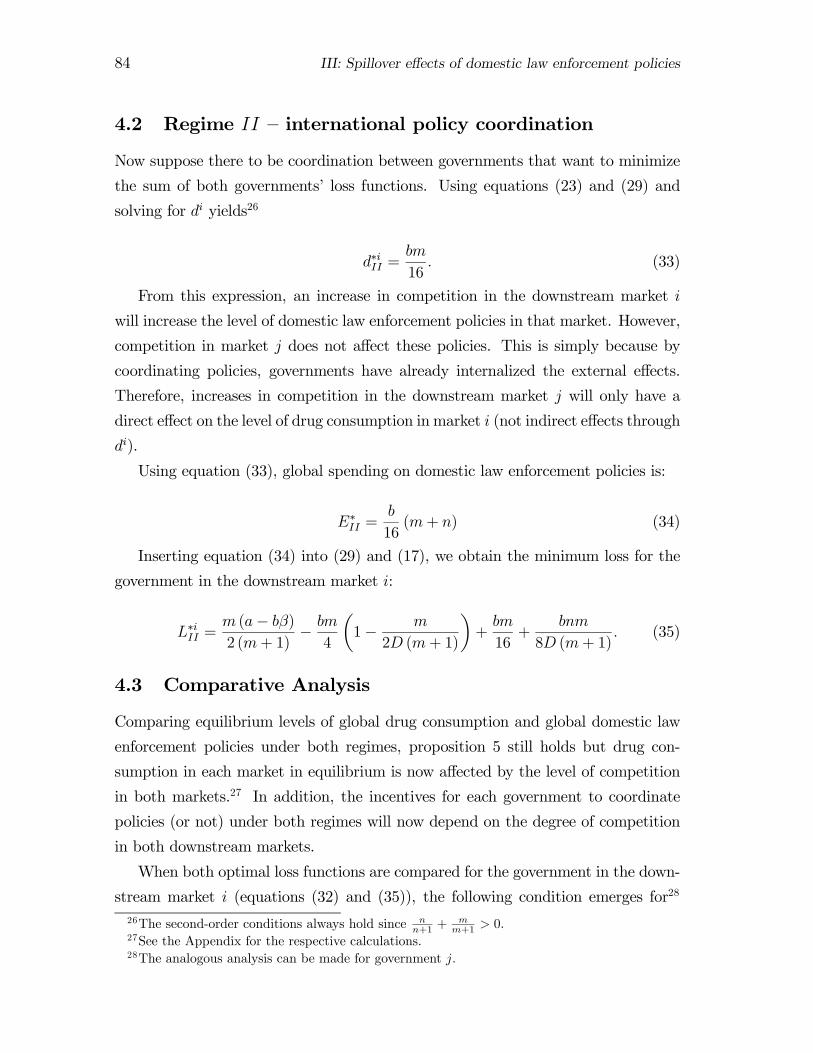
84 III: Spillover effects of domestic law enforcement policies
4.2 Regime II — international policy coordination
Now suppose there to be coordination between governments that want to minimize
the sum of both governments’ loss functions. Using equations (23) and (29) and
solving for di yields26
d∗iII =bm
16. (33)
From this expression, an increase in competition in the downstream market i
will increase the level of domestic law enforcement policies in that market. However,
competition in market j does not affect these policies. This is simply because by
coordinating policies, governments have already internalized the external effects.
Therefore, increases in competition in the downstream market j will only have a
direct effect on the level of drug consumption in market i (not indirect effects through
di).
Using equation (33), global spending on domestic law enforcement policies is:
E∗II =b
16(m+ n) (34)
Inserting equation (34) into (29) and (17), we obtain the minimum loss for the
government in the downstream market i:
L∗iII =m (a− bβ)2 (m+ 1)
− bm4
µ1− m
2D (m+ 1)
¶+bm
16+
bnm
8D (m+ 1). (35)
4.3 Comparative Analysis
Comparing equilibrium levels of global drug consumption and global domestic law
enforcement policies under both regimes, proposition 5 still holds but drug con-
sumption in each market in equilibrium is now affected by the level of competition
in both markets.27 In addition, the incentives for each government to coordinate
policies (or not) under both regimes will now depend on the degree of competition
in both downstream markets.
When both optimal loss functions are compared for the government in the down-
stream market i (equations (32) and (35)), the following condition emerges for28
26The second-order conditions always hold since nn+1 +
mm+1 > 0.
27See the Appendix for the respective calculations.28The analogous analysis can be made for government j.
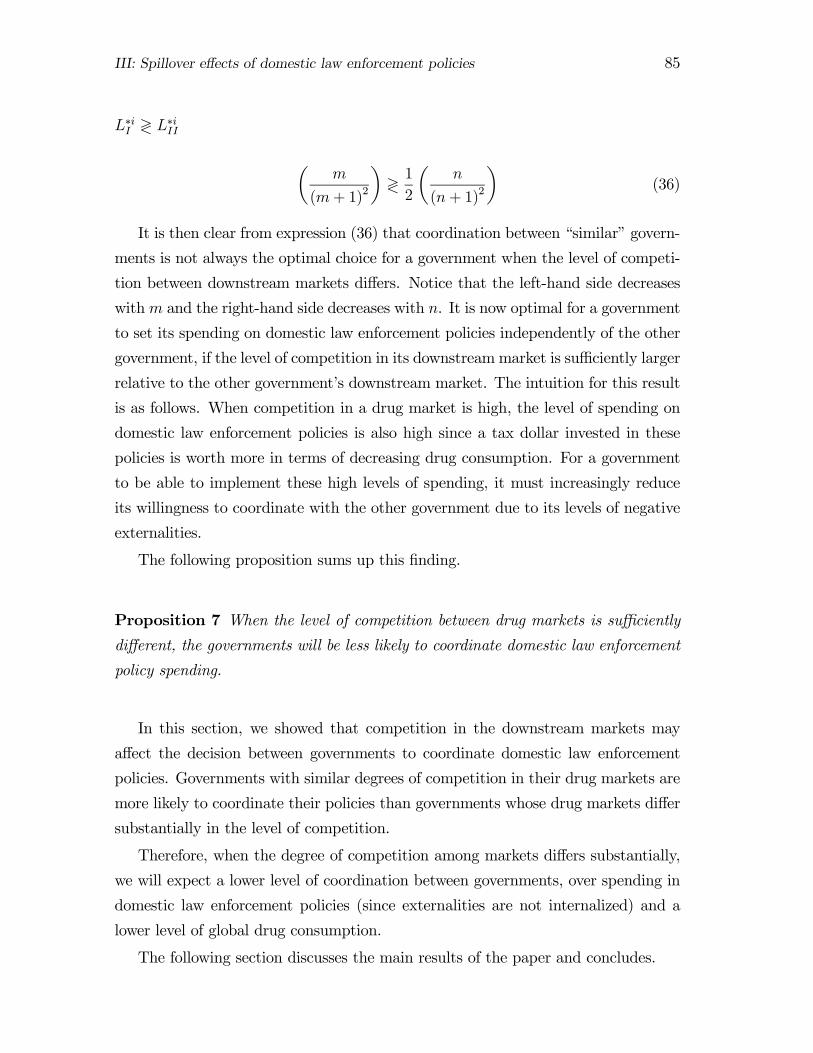
III: Spillover effects of domestic law enforcement policies 85
L∗iI ≷ L∗iII
µm
(m+ 1)2
¶≷ 12
µn
(n+ 1)2
¶(36)
It is then clear from expression (36) that coordination between “similar” govern-
ments is not always the optimal choice for a government when the level of competi-
tion between downstream markets differs. Notice that the left-hand side decreases
withm and the right-hand side decreases with n. It is now optimal for a government
to set its spending on domestic law enforcement policies independently of the other
government, if the level of competition in its downstreammarket is sufficiently larger
relative to the other government’s downstream market. The intuition for this result
is as follows. When competition in a drug market is high, the level of spending on
domestic law enforcement policies is also high since a tax dollar invested in these
policies is worth more in terms of decreasing drug consumption. For a government
to be able to implement these high levels of spending, it must increasingly reduce
its willingness to coordinate with the other government due to its levels of negative
externalities.
The following proposition sums up this finding.
Proposition 7 When the level of competition between drug markets is sufficiently
different, the governments will be less likely to coordinate domestic law enforcement
policy spending.
In this section, we showed that competition in the downstream markets may
affect the decision between governments to coordinate domestic law enforcement
policies. Governments with similar degrees of competition in their drug markets are
more likely to coordinate their policies than governments whose drug markets differ
substantially in the level of competition.
Therefore, when the degree of competition among markets differs substantially,
we will expect a lower level of coordination between governments, over spending in
domestic law enforcement policies (since externalities are not internalized) and a
lower level of global drug consumption.
The following section discusses the main results of the paper and concludes.
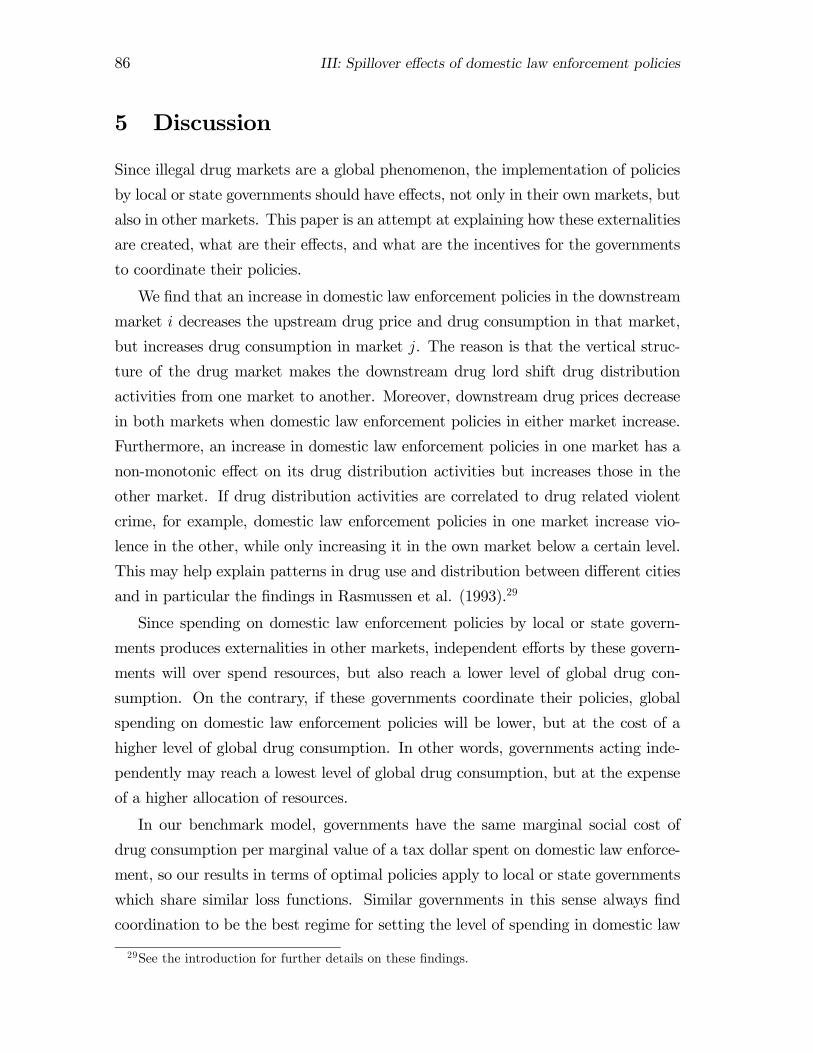
86 III: Spillover effects of domestic law enforcement policies
5 Discussion
Since illegal drug markets are a global phenomenon, the implementation of policies
by local or state governments should have effects, not only in their own markets, but
also in other markets. This paper is an attempt at explaining how these externalities
are created, what are their effects, and what are the incentives for the governments
to coordinate their policies.
We find that an increase in domestic law enforcement policies in the downstream
market i decreases the upstream drug price and drug consumption in that market,
but increases drug consumption in market j. The reason is that the vertical struc-
ture of the drug market makes the downstream drug lord shift drug distribution
activities from one market to another. Moreover, downstream drug prices decrease
in both markets when domestic law enforcement policies in either market increase.
Furthermore, an increase in domestic law enforcement policies in one market has a
non-monotonic effect on its drug distribution activities but increases those in the
other market. If drug distribution activities are correlated to drug related violent
crime, for example, domestic law enforcement policies in one market increase vio-
lence in the other, while only increasing it in the own market below a certain level.
This may help explain patterns in drug use and distribution between different cities
and in particular the findings in Rasmussen et al. (1993).29
Since spending on domestic law enforcement policies by local or state govern-
ments produces externalities in other markets, independent efforts by these govern-
ments will over spend resources, but also reach a lower level of global drug con-
sumption. On the contrary, if these governments coordinate their policies, global
spending on domestic law enforcement policies will be lower, but at the cost of a
higher level of global drug consumption. In other words, governments acting inde-
pendently may reach a lowest level of global drug consumption, but at the expense
of a higher allocation of resources.
In our benchmark model, governments have the same marginal social cost of
drug consumption per marginal value of a tax dollar spent on domestic law enforce-
ment, so our results in terms of optimal policies apply to local or state governments
which share similar loss functions. Similar governments in this sense always find
coordination to be the best regime for setting the level of spending in domestic law
29See the introduction for further details on these findings.
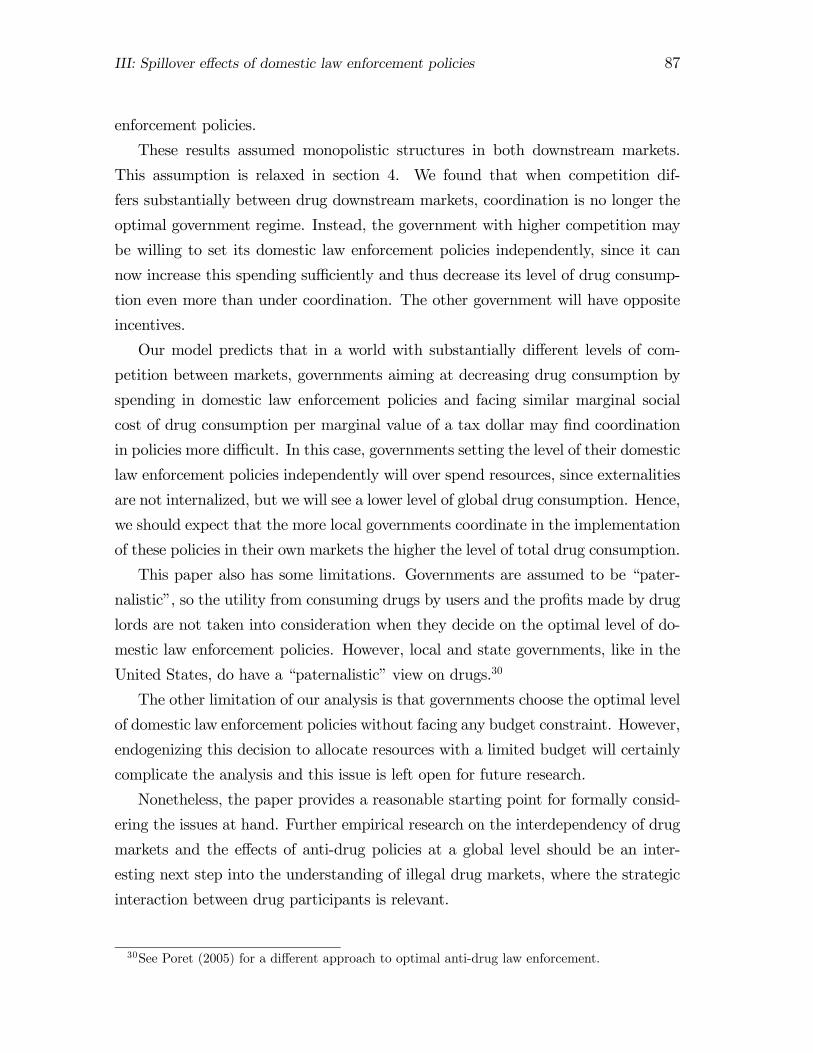
III: Spillover effects of domestic law enforcement policies 87
enforcement policies.
These results assumed monopolistic structures in both downstream markets.
This assumption is relaxed in section 4. We found that when competition dif-
fers substantially between drug downstream markets, coordination is no longer the
optimal government regime. Instead, the government with higher competition may
be willing to set its domestic law enforcement policies independently, since it can
now increase this spending sufficiently and thus decrease its level of drug consump-
tion even more than under coordination. The other government will have opposite
incentives.
Our model predicts that in a world with substantially different levels of com-
petition between markets, governments aiming at decreasing drug consumption by
spending in domestic law enforcement policies and facing similar marginal social
cost of drug consumption per marginal value of a tax dollar may find coordination
in policies more difficult. In this case, governments setting the level of their domestic
law enforcement policies independently will over spend resources, since externalities
are not internalized, but we will see a lower level of global drug consumption. Hence,
we should expect that the more local governments coordinate in the implementation
of these policies in their own markets the higher the level of total drug consumption.
This paper also has some limitations. Governments are assumed to be “pater-
nalistic”, so the utility from consuming drugs by users and the profits made by drug
lords are not taken into consideration when they decide on the optimal level of do-
mestic law enforcement policies. However, local and state governments, like in the
United States, do have a “paternalistic” view on drugs.30
The other limitation of our analysis is that governments choose the optimal level
of domestic law enforcement policies without facing any budget constraint. However,
endogenizing this decision to allocate resources with a limited budget will certainly
complicate the analysis and this issue is left open for future research.
Nonetheless, the paper provides a reasonable starting point for formally consid-
ering the issues at hand. Further empirical research on the interdependency of drug
markets and the effects of anti-drug policies at a global level should be an inter-
esting next step into the understanding of illegal drug markets, where the strategic
interaction between drug participants is relevant.
30See Poret (2005) for a different approach to optimal anti-drug law enforcement.
88 III: Spillover effects of domestic law enforcement policies
References
Benson, B. and Rasmussen, D., “Illicit drugs and crime”, Independent Policy Re-
port: Illicit drugs and crime, Oakland, CA: The Independent Institute, 1996.
Available at http://www.druglibrary.org.
Bronars, S. and Lott, J. “Criminal deterrence, geographic spillovers, and the right
to carry concealed handguns”. American Economic Review Papers and Pro-
ceedings, Vol 88, No.2, May 1998.
Caulkins, J. “Domestic Geographic Variation in Illicit Drug Prices”, Journal of
Urban Economics, 37, pp 38-56, 1995.
Desimone, J. “The relationship between illegal drug prices at the retail user and
seller levels”. Contemporary Economic Policy. Vol. 24, No. 1, 2006.
Drug Enforcement Administration (DEA). Reports on Federal and state statistics
on drugs in www.usdoj.gov/dea/statistics.html. 2006.
–––Annual Report 2003 “The State of the drugs problem in the European Union
and Norway”, 2003.
Federal Bureau of Investigations, Crime in the United States, Washington D.C.,
1995-2001.
Garoupa, N. “Optimal law enforcement and the economics of the drug market:
Some comments on the Schengen Agreements”. International Review of Law
and Economics, 17, 1997.
Jacobsson, A., and Naranjo, A. “Drug lords and demand anti-drug policies”, Work-
ing Paper, Department of Economics, Stockholm University, 2004.
Kleiman, M. and Smith, K. “State and local drug enforcement: in search of a
strategy”. Crime and Justice (Chicago). University of Chicago, 1990 (13), pp.
69-108.
Konrad, K. “Drug Policy and Federalism”. Public Choice 80: 55-68. 1994.
Lang, A. and Johnson, B. “Crack’s Decline: Some Surprises Across U.S. Cities”.
National Institute of Justice, U.S. Department of Justice, 1997.
Miron, J. “Violence, Guns, and Drugs: A Cross-market Analysis”, Journal of Law
and Economics, vol. XLIV, 2001.
Office of National Drug Control Policy, National Drug Control Strategy, available at
http://www.whitehousedrugpolicy.gov, 2004.
–––, “Economic costs of drug abuse in the United States 1992-2000”, 2004.
III: Spillover effects of domestic law enforcement policies 89
Poret, S. “Paradoxical effects of law enforcement policies: the case of the illicit drug
market”. International Review of Law and Economics, 22, pp. 465-493. 2003.
––– “An optimal anti-drug law enforcement policy”. Working Paper, CREST,
2005.
Rasmussen, D., Benson, B. and Sollars, D. “Spatial Competition in Illicit Drug Mar-
kets: The Consequences of Increased Drug Enforcement”, Review of Regional
Studies, 23. 1993.
Reaves, B. and Hickman, M. “Police Departments in large Cities, 1990-2000”. Spe-
cial Report Bureau of Justice Statistics, U.S. Department of Justice, 2002.
Resignato, A., “Violent Crime: A Function of Drug Use or Drug Enforcement?”,
Applied Economics, Vol. 32, Number 6, May 2000.
Reuter, P. and Greenfield, V., “Measuring Global Drug markets”,World Economics,
Vol. 4, Number 2, 2001.
Salinger, M.A. “The Meaning of “Upstream” and “Downstream” an the Implication
for Modeling Vertical Mergers.” Journal of Industrial Economics 37: 373-387.
1989.
––– “Vertical Mergers and Market Foreclosure”. Quarterly Journal of Economics
103: 345-356. 1988.
Skaperdas, S., “Contest success functions”, Economic Theory, Vol. 7, pp 283-290,
1996.
Skott, P. and Jepsen, G. “Paradoxical effects of drug policy in a model with im-
perfect competition and switching costs”. Journal of Economic Behavior and
Organization, Vol. 48, pp. 335-354. 2002.
Substance Abuse and Mental Health Services Administration (SAMHSA), Office of
Applied Studies, National Survey on Drug Use and Health, 2002, available at
http://www.oas.samhsa.gov.
Tullock, G., “Efficient rent seeking”, in Buchanan, J., and Tollison, R., Tullock, G.,
(eds), Toward a theory of the rent seeking society, Texas, 1980.
University of Michigan, Monitoring the Future Study, 2002. Data available at:
www.monitoringthefuture.com.
Venables, A. “International Capacity choice and national market games”. Journal
of International Economics, 29, pp 23-42, 1990.
90 III: Spillover effects of domestic law enforcement policies
Appendix
Proof of Proposition (3)
Taking the first derivative of equation (14), we have:∂x∗i
∂di= 1
8
qbdi
µ32ai
b− 1
2aj
b+q
dj
b− β
¶− 3
4≷ 0.
Solving for di we have that:
b36
µ32ai
b− 1
2aj
b+q
dj
b− β
¶2≷ di
And the second derivative is equal to:∂2x∗i
∂2di= − 1
16di
qbdi
µ32ai
b− 1
2aj
b+q
dj
b− β
¶< 0.
As from equation (15) we know that in an interior solution:
di < b9
µ32ai
b− 1
2aj
b+q
dj
b− β
¶2.
Then, an increase in domestic law enforcement policies in downstream market i first
increases distribution activities in that market and then decreases them. Q.E.D.
Proof of Proposition (5)
(ii) Comparing equations (21) and (27), we have that QI < QII since 0 < 2, so that
global drug consumption is always lower under an independent setting. Q.E.D.
Competition in the downstream market
Solving backwards, in the second stage, we solve the system of equations coming
from the representative drug lord’s problem in market i, who simultaneously sells
drugs and sets its distribution activities. After assuming symmetry, we get that
distribution activities are:31
mxi =1
(m+ 1)
³ab− s´√
bmdi − di. (37)
Notice that from expression (37), an increase in competition in market k de-
creases the level of distribution activities in that market. In the same way, total
drug consumption in market i, mqi is:
31The following second-order condition must hold: 4m(m+1)2 ≥
di
mxi+di . Therefore, the size of the
downstream market must be sufficiently large. In other terms, (ab − β) > (m+1)3√di
2m√bm
((m+ 1)3 −2m2
D )−√bndj
2bD . Moreover, mx > 0.
III: Spillover effects of domestic law enforcement policies 91
mqi =bm
(m+ 1)
³ab− s´−√bmdi (38)
In expression (38), mqi has a non-monotonic relationship with respect to the
number of competing drug lords, m. At low levels of m, the relationship is positive
while turning negative at high levels. Two main effects are at play here: First, a
higher m decreases aggregate spending on distribution activities, that is, the free
rider effect, which reduces available demand and thereby limits the amount sold.
Second, the increase in (Cournot) market competition decreases the price, which
increases demand. Thus, at low levels of competition, an additional drug lord means
that more drugs will be sold as the competition effect dominates the free rider effect.
Since total demand for drugs by the downstream drug lords in both markets is
equal to mqi+nqj, the symmetric inverse demand for the upstream monopolist now
becomes:
sd =1
bD
³aD −
³√bmdi +
√bndj
´−¡mqi + nqj
¢´, (39)
where D =³
m(m+1)
+ n(n+1)
´.
This inverse demand is used for the upstream monopolist in the first stage. Using
equation (39) and the market clearing condition mqi + nqj = Q in the upstream
monopolist’s problem (equation (4)), we then solve for the level of drug production32
Q:
Q∗ =1
2
³D (a− bβ)−
³√bmdi +
√bndj
´´. (40)
Notice that higher competition in each market has a non-monotonic effect on the
level of drug sales. It increases for low levels and decreases for high levels. The
reason is that the direct effect of competition in the downstream markets is passed
to the upstream market.
Substituting equation (40) into (39) and using the market clearing condition, the
upstream drug price in equilibrium becomes:
s∗d =1
2b
µ(a+ bβ)− 1
D
³√bmdi +
√bndj
´¶. (41)
32The second-order condition is negative.
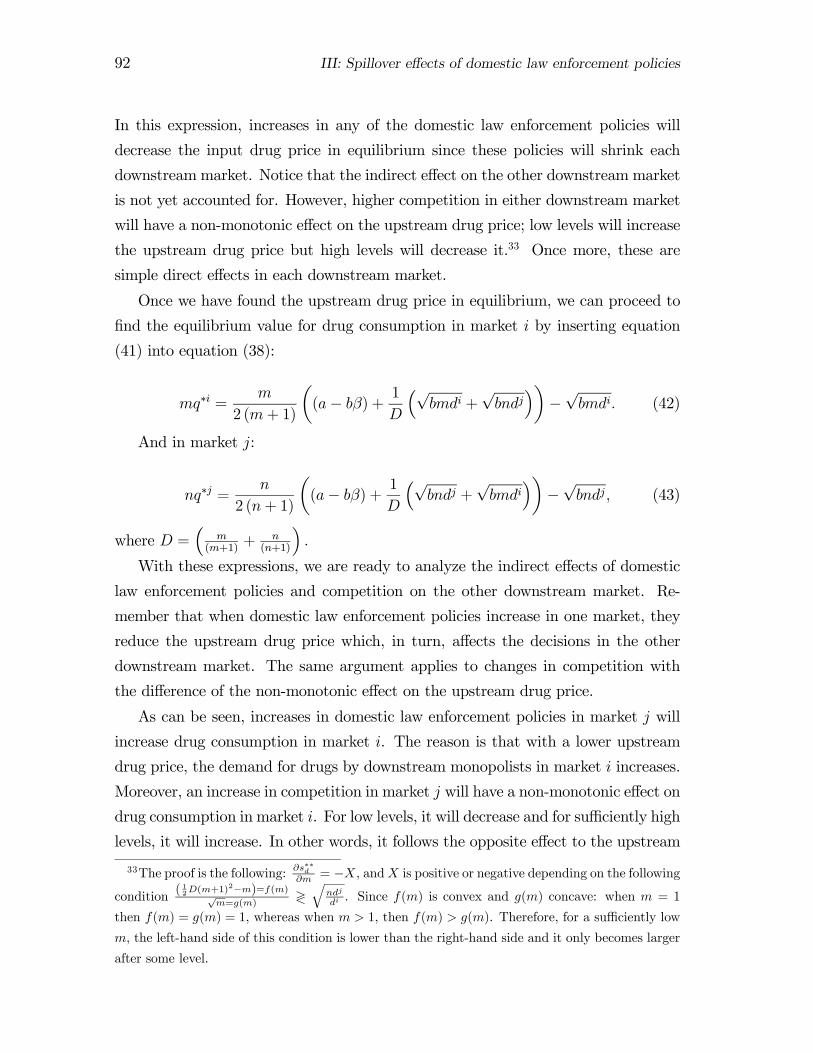
92 III: Spillover effects of domestic law enforcement policies
In this expression, increases in any of the domestic law enforcement policies will
decrease the input drug price in equilibrium since these policies will shrink each
downstream market. Notice that the indirect effect on the other downstream market
is not yet accounted for. However, higher competition in either downstream market
will have a non-monotonic effect on the upstream drug price; low levels will increase
the upstream drug price but high levels will decrease it.33 Once more, these are
simple direct effects in each downstream market.
Once we have found the upstream drug price in equilibrium, we can proceed to
find the equilibrium value for drug consumption in market i by inserting equation
(41) into equation (38):
mq∗i =m
2 (m+ 1)
µ(a− bβ) + 1
D
³√bmdi +
√bndj
´¶−√bmdi. (42)
And in market j:
nq∗j =n
2 (n+ 1)
µ(a− bβ) + 1
D
³√bndj +
√bmdi
´¶−√bndj, (43)
where D =³
m(m+1)
+ n(n+1)
´.
With these expressions, we are ready to analyze the indirect effects of domestic
law enforcement policies and competition on the other downstream market. Re-
member that when domestic law enforcement policies increase in one market, they
reduce the upstream drug price which, in turn, affects the decisions in the other
downstream market. The same argument applies to changes in competition with
the difference of the non-monotonic effect on the upstream drug price.
As can be seen, increases in domestic law enforcement policies in market j will
increase drug consumption in market i. The reason is that with a lower upstream
drug price, the demand for drugs by downstream monopolists in market i increases.
Moreover, an increase in competition in market j will have a non-monotonic effect on
drug consumption in market i. For low levels, it will decrease and for sufficiently high
levels, it will increase. In other words, it follows the opposite effect to the upstream
33The proof is the following: ∂s∗∗d∂m = −X, andX is positive or negative depending on the following
condition (12D(m+1)
2−m)=f(m)√m=g(m)
≷q
ndj
di . Since f(m) is convex and g(m) concave: when m = 1
then f(m) = g(m) = 1, whereas when m > 1, then f(m) > g(m). Therefore, for a sufficiently low
m, the left-hand side of this condition is lower than the right-hand side and it only becomes larger
after some level.
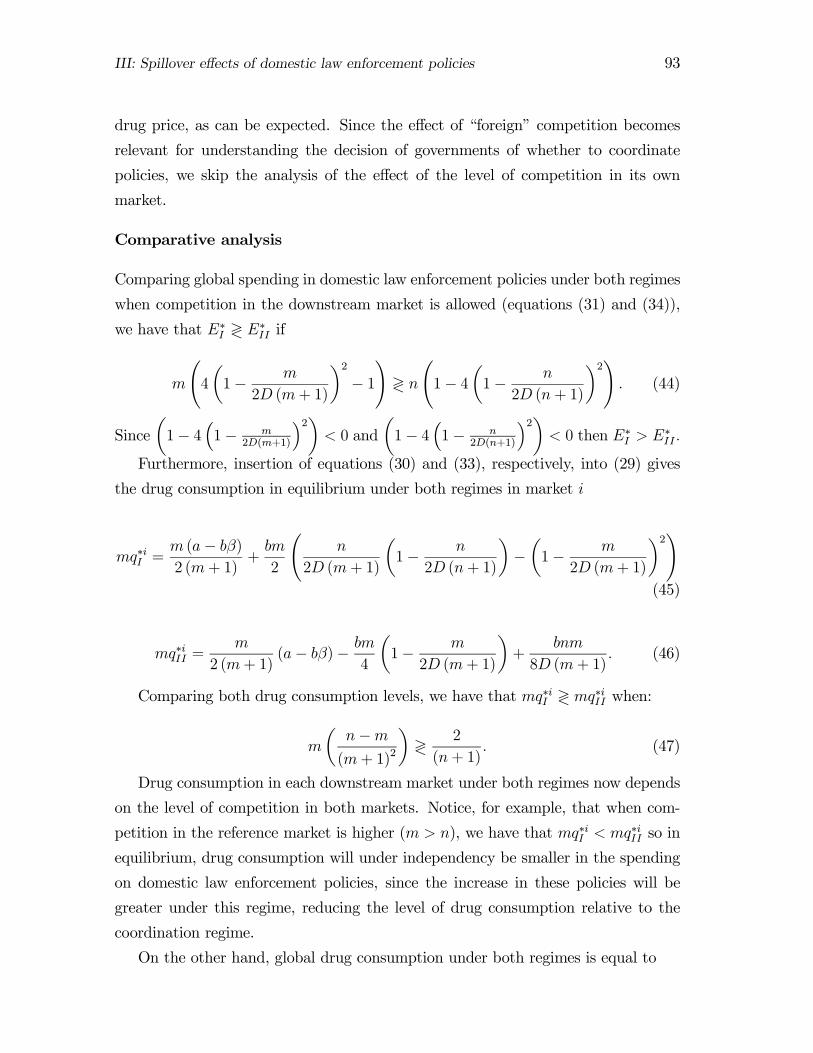
III: Spillover effects of domestic law enforcement policies 93
drug price, as can be expected. Since the effect of “foreign” competition becomes
relevant for understanding the decision of governments of whether to coordinate
policies, we skip the analysis of the effect of the level of competition in its own
market.
Comparative analysis
Comparing global spending in domestic law enforcement policies under both regimes
when competition in the downstream market is allowed (equations (31) and (34)),
we have that E∗I ≷ E∗II if
m
Ã4
µ1− m
2D (m+ 1)
¶2− 1!≷ n
Ã1− 4
µ1− n
2D (n+ 1)
¶2!. (44)
Sinceµ1− 4
³1− m
2D(m+1)
´2¶< 0 and
µ1− 4
³1− n
2D(n+1)
´2¶< 0 then E∗I > E
∗II .
Furthermore, insertion of equations (30) and (33), respectively, into (29) gives
the drug consumption in equilibrium under both regimes in market i
mq∗iI =m (a− bβ)2 (m+ 1)
+bm
2
Ãn
2D (m+ 1)
µ1− n
2D (n+ 1)
¶−µ1− m
2D (m+ 1)
¶2!(45)
mq∗iII =m
2 (m+ 1)(a− bβ)− bm
4
µ1− m
2D (m+ 1)
¶+
bnm
8D (m+ 1). (46)
Comparing both drug consumption levels, we have that mq∗iI ≷ mq∗iII when:
m
µn−m(m+ 1)2
¶≷ 2
(n+ 1). (47)
Drug consumption in each downstream market under both regimes now depends
on the level of competition in both markets. Notice, for example, that when com-
petition in the reference market is higher (m > n), we have that mq∗iI < mq∗iII so in
equilibrium, drug consumption will under independency be smaller in the spending
on domestic law enforcement policies, since the increase in these policies will be
greater under this regime, reducing the level of drug consumption relative to the
coordination regime.
On the other hand, global drug consumption under both regimes is equal to
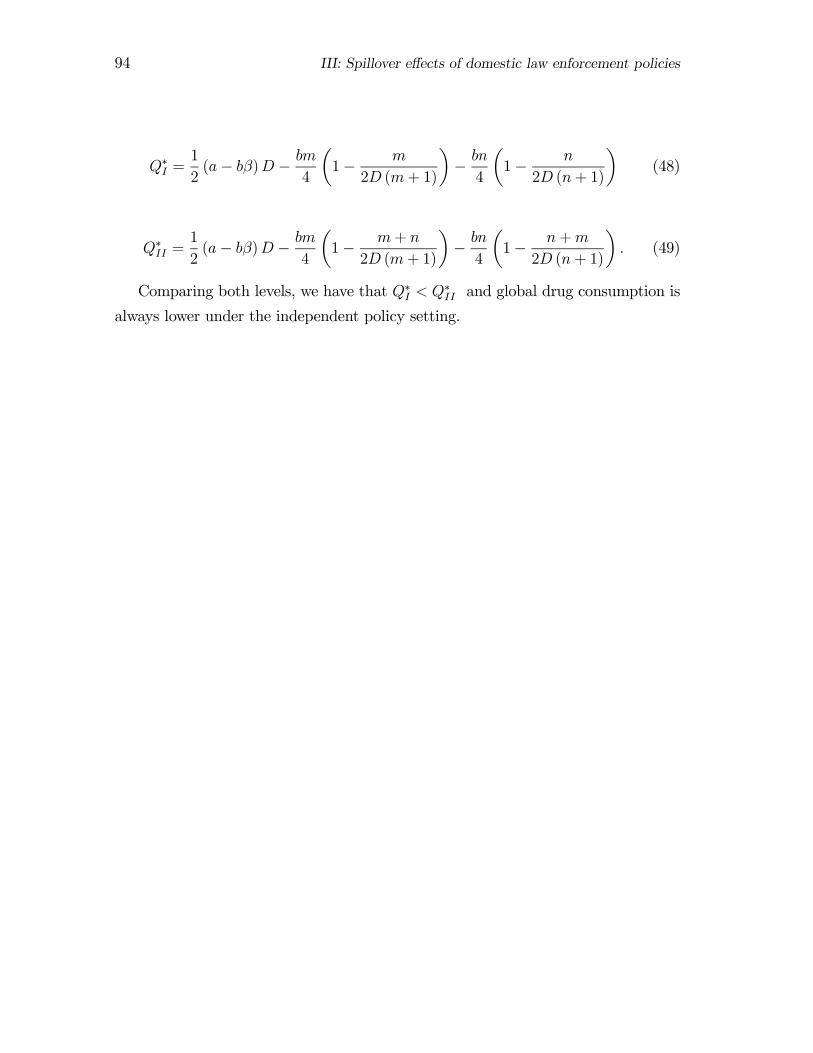
94 III: Spillover effects of domestic law enforcement policies
Q∗I =1
2(a− bβ)D − bm
4
µ1− m
2D (m+ 1)
¶− bn4
µ1− n
2D (n+ 1)
¶(48)
Q∗II =1
2(a− bβ)D − bm
4
µ1− m+ n
2D (m+ 1)
¶− bn4
µ1− n+m
2D (n+ 1)
¶. (49)
Comparing both levels, we have that Q∗I < Q∗II and global drug consumption is
always lower under the independent policy setting.

Chapter IV

Drive-by competition? Violence inthe drug market∗
“(...) If we try to shoot around there, nobody, and I mean it you dig, nobody
gonna step on their turf. But we gotta be careful, ’cause they can shoot around here
too and then we all f - - - .”1
1 Introduction
Today, crack and powder cocaine, heroin and marijuana abuse constitute serious
drug problems in the United States. The retail distribution, mainly in the hands
of street gangs, accounts for most of the drug related violence in many states and
cities.2
Interestingly, the level of violence in drug markets appears to vary with the type
of drug. For instance, the U.S. Department of Justice notes that marijuana markets
are the least violent, while the highest level of violence is found in crack cocaine
markets. With marijuana being the drug most abused in the United States and
both drugs being distributed by street gangs, this interesting observation remains
unexplained.3
This paper suggests one possible explanation for this based on the notion that
gangs strategically use violence to compete for customers. There is evidence for such
a strategic role of violence. In their study of a gang in Chicago between 1994 and
∗I thank Sten Nyberg for his advice, and Mathias Herzing, David Vestin, Ann-Sofie Kolm,Jonas Häckner, Hans Wijkander, and workshop participants at Stockholm University, Departmentof Economics, for helpful comments.
1Statement of a gang member in Levitt and Venkatesh (2001).2See the Drug Threat Assessments by the U.S. Department of Justice (2001-2004).3In some cities, powder cocaine and heroin markets also seem to have differences in drug related
violence and similar levels of drug activity. For further evidence, see the U.S. Department of Justice
(ADAM- 2003) and the Office of National Drug Control Policy (1997, 2004, and 2005).
97
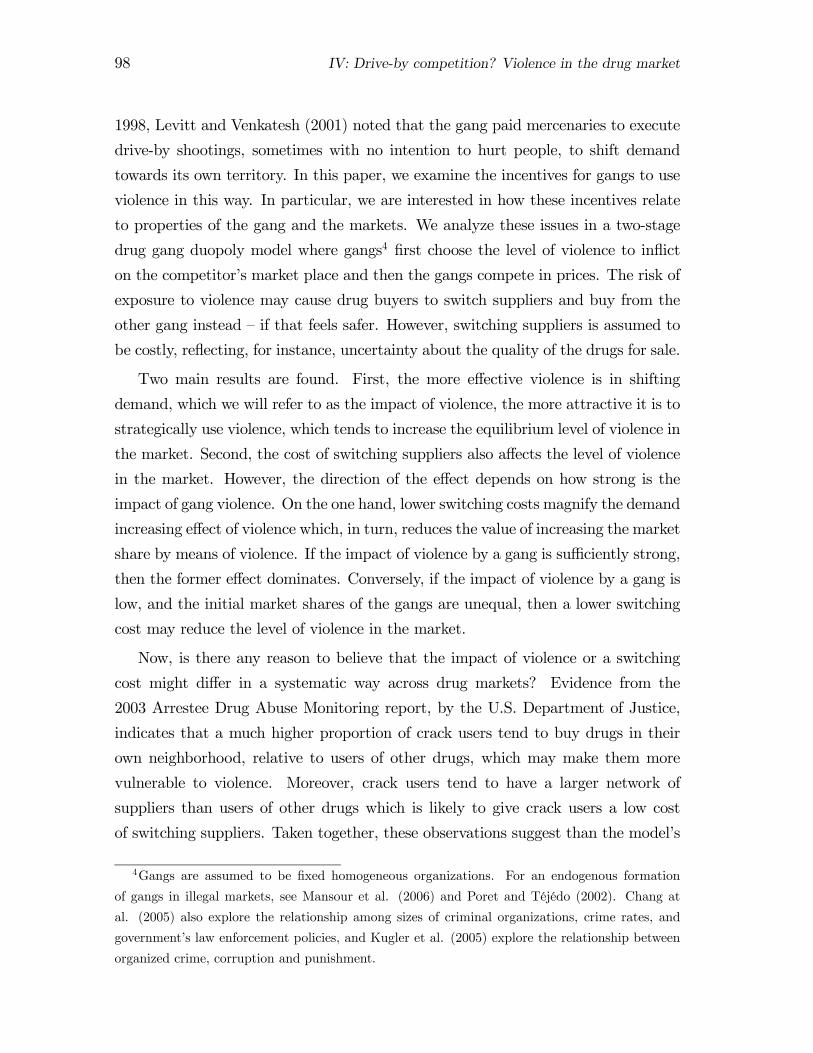
98 IV: Drive-by competition? Violence in the drug market
1998, Levitt and Venkatesh (2001) noted that the gang paid mercenaries to execute
drive-by shootings, sometimes with no intention to hurt people, to shift demand
towards its own territory. In this paper, we examine the incentives for gangs to use
violence in this way. In particular, we are interested in how these incentives relate
to properties of the gang and the markets. We analyze these issues in a two-stage
drug gang duopoly model where gangs4 first choose the level of violence to inflict
on the competitor’s market place and then the gangs compete in prices. The risk of
exposure to violence may cause drug buyers to switch suppliers and buy from the
other gang instead — if that feels safer. However, switching suppliers is assumed to
be costly, reflecting, for instance, uncertainty about the quality of the drugs for sale.
Two main results are found. First, the more effective violence is in shifting
demand, which we will refer to as the impact of violence, the more attractive it is to
strategically use violence, which tends to increase the equilibrium level of violence in
the market. Second, the cost of switching suppliers also affects the level of violence
in the market. However, the direction of the effect depends on how strong is the
impact of gang violence. On the one hand, lower switching costs magnify the demand
increasing effect of violence which, in turn, reduces the value of increasing the market
share by means of violence. If the impact of violence by a gang is sufficiently strong,
then the former effect dominates. Conversely, if the impact of violence by a gang is
low, and the initial market shares of the gangs are unequal, then a lower switching
cost may reduce the level of violence in the market.
Now, is there any reason to believe that the impact of violence or a switching
cost might differ in a systematic way across drug markets? Evidence from the
2003 Arrestee Drug Abuse Monitoring report, by the U.S. Department of Justice,
indicates that a much higher proportion of crack users tend to buy drugs in their
own neighborhood, relative to users of other drugs, which may make them more
vulnerable to violence. Moreover, crack users tend to have a larger network of
suppliers than users of other drugs which is likely to give crack users a low cost
of switching suppliers. Taken together, these observations suggest than the model’s
4Gangs are assumed to be fixed homogeneous organizations. For an endogenous formation
of gangs in illegal markets, see Mansour et al. (2006) and Poret and Téjédo (2002). Chang at
al. (2005) also explore the relationship among sizes of criminal organizations, crime rates, and
government’s law enforcement policies, and Kugler et al. (2005) explore the relationship between
organized crime, corruption and punishment.
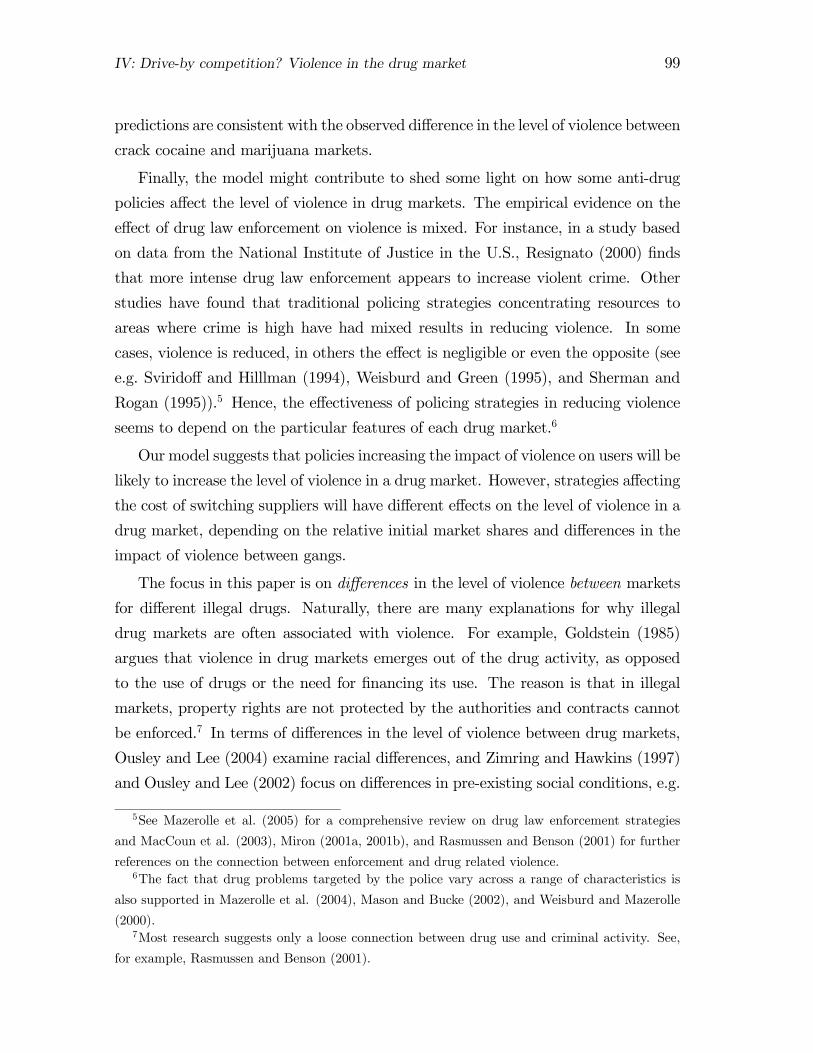
IV: Drive-by competition? Violence in the drug market 99
predictions are consistent with the observed difference in the level of violence between
crack cocaine and marijuana markets.
Finally, the model might contribute to shed some light on how some anti-drug
policies affect the level of violence in drug markets. The empirical evidence on the
effect of drug law enforcement on violence is mixed. For instance, in a study based
on data from the National Institute of Justice in the U.S., Resignato (2000) finds
that more intense drug law enforcement appears to increase violent crime. Other
studies have found that traditional policing strategies concentrating resources to
areas where crime is high have had mixed results in reducing violence. In some
cases, violence is reduced, in others the effect is negligible or even the opposite (see
e.g. Sviridoff and Hilllman (1994), Weisburd and Green (1995), and Sherman and
Rogan (1995)).5 Hence, the effectiveness of policing strategies in reducing violence
seems to depend on the particular features of each drug market.6
Our model suggests that policies increasing the impact of violence on users will be
likely to increase the level of violence in a drug market. However, strategies affecting
the cost of switching suppliers will have different effects on the level of violence in a
drug market, depending on the relative initial market shares and differences in the
impact of violence between gangs.
The focus in this paper is on differences in the level of violence between markets
for different illegal drugs. Naturally, there are many explanations for why illegal
drug markets are often associated with violence. For example, Goldstein (1985)
argues that violence in drug markets emerges out of the drug activity, as opposed
to the use of drugs or the need for financing its use. The reason is that in illegal
markets, property rights are not protected by the authorities and contracts cannot
be enforced.7 In terms of differences in the level of violence between drug markets,
Ousley and Lee (2004) examine racial differences, and Zimring and Hawkins (1997)
and Ousley and Lee (2002) focus on differences in pre-existing social conditions, e.g.
5See Mazerolle et al. (2005) for a comprehensive review on drug law enforcement strategies
and MacCoun et al. (2003), Miron (2001a, 2001b), and Rasmussen and Benson (2001) for further
references on the connection between enforcement and drug related violence.6The fact that drug problems targeted by the police vary across a range of characteristics is
also supported in Mazerolle et al. (2004), Mason and Bucke (2002), and Weisburd and Mazerolle
(2000).7Most research suggests only a loose connection between drug use and criminal activity. See,
for example, Rasmussen and Benson (2001).
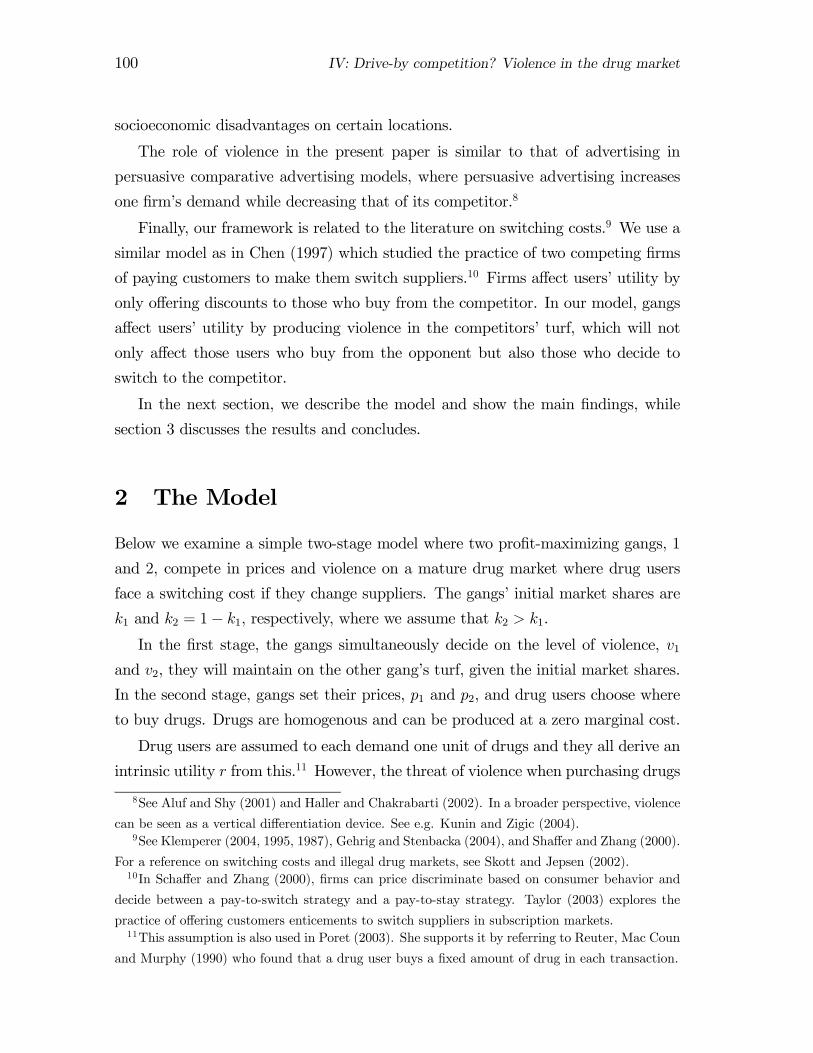
100 IV: Drive-by competition? Violence in the drug market
socioeconomic disadvantages on certain locations.
The role of violence in the present paper is similar to that of advertising in
persuasive comparative advertising models, where persuasive advertising increases
one firm’s demand while decreasing that of its competitor.8
Finally, our framework is related to the literature on switching costs.9 We use a
similar model as in Chen (1997) which studied the practice of two competing firms
of paying customers to make them switch suppliers.10 Firms affect users’ utility by
only offering discounts to those who buy from the competitor. In our model, gangs
affect users’ utility by producing violence in the competitors’ turf, which will not
only affect those users who buy from the opponent but also those who decide to
switch to the competitor.
In the next section, we describe the model and show the main findings, while
section 3 discusses the results and concludes.
2 The Model
Below we examine a simple two-stage model where two profit-maximizing gangs, 1
and 2, compete in prices and violence on a mature drug market where drug users
face a switching cost if they change suppliers. The gangs’ initial market shares are
k1 and k2 = 1− k1, respectively, where we assume that k2 > k1.In the first stage, the gangs simultaneously decide on the level of violence, v1
and v2, they will maintain on the other gang’s turf, given the initial market shares.
In the second stage, gangs set their prices, p1 and p2, and drug users choose where
to buy drugs. Drugs are homogenous and can be produced at a zero marginal cost.
Drug users are assumed to each demand one unit of drugs and they all derive an
intrinsic utility r from this.11 However, the threat of violence when purchasing drugs
8See Aluf and Shy (2001) and Haller and Chakrabarti (2002). In a broader perspective, violence
can be seen as a vertical differentiation device. See e.g. Kunin and Zigic (2004).9See Klemperer (2004, 1995, 1987), Gehrig and Stenbacka (2004), and Shaffer and Zhang (2000).
For a reference on switching costs and illegal drug markets, see Skott and Jepsen (2002).10In Schaffer and Zhang (2000), firms can price discriminate based on consumer behavior and
decide between a pay-to-switch strategy and a pay-to-stay strategy. Taylor (2003) explores the
practice of offering customers enticements to switch suppliers in subscription markets.11This assumption is also used in Poret (2003). She supports it by referring to Reuter, Mac Coun
and Murphy (1990) who found that a drug user buys a fixed amount of drug in each transaction.
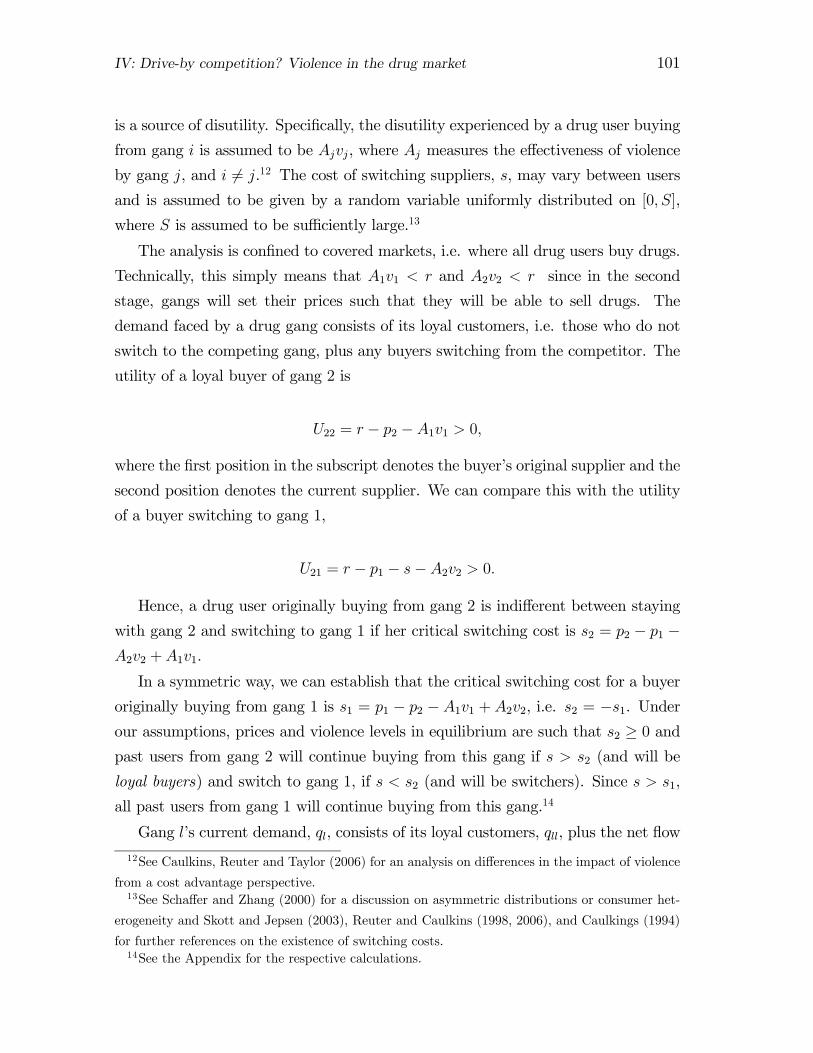
IV: Drive-by competition? Violence in the drug market 101
is a source of disutility. Specifically, the disutility experienced by a drug user buying
from gang i is assumed to be Ajvj, where Aj measures the effectiveness of violence
by gang j, and i 6= j.12 The cost of switching suppliers, s, may vary between usersand is assumed to be given by a random variable uniformly distributed on [0, S],
where S is assumed to be sufficiently large.13
The analysis is confined to covered markets, i.e. where all drug users buy drugs.
Technically, this simply means that A1v1 < r and A2v2 < r since in the second
stage, gangs will set their prices such that they will be able to sell drugs. The
demand faced by a drug gang consists of its loyal customers, i.e. those who do not
switch to the competing gang, plus any buyers switching from the competitor. The
utility of a loyal buyer of gang 2 is
U22 = r − p2 −A1v1 > 0,
where the first position in the subscript denotes the buyer’s original supplier and the
second position denotes the current supplier. We can compare this with the utility
of a buyer switching to gang 1,
U21 = r − p1 − s−A2v2 > 0.
Hence, a drug user originally buying from gang 2 is indifferent between staying
with gang 2 and switching to gang 1 if her critical switching cost is s2 = p2 − p1 −A2v2 +A1v1.
In a symmetric way, we can establish that the critical switching cost for a buyer
originally buying from gang 1 is s1 = p1 − p2 − A1v1 + A2v2, i.e. s2 = −s1. Underour assumptions, prices and violence levels in equilibrium are such that s2 ≥ 0 andpast users from gang 2 will continue buying from this gang if s > s2 (and will be
loyal buyers) and switch to gang 1, if s < s2 (and will be switchers). Since s > s1,
all past users from gang 1 will continue buying from this gang.14
Gang l’s current demand, ql, consists of its loyal customers, qll, plus the net flow
12See Caulkins, Reuter and Taylor (2006) for an analysis on differences in the impact of violence
from a cost advantage perspective.13See Schaffer and Zhang (2000) for a discussion on asymmetric distributions or consumer het-
erogeneity and Skott and Jepsen (2003), Reuter and Caulkins (1998, 2006), and Caulkings (1994)
for further references on the existence of switching costs.14See the Appendix for the respective calculations.
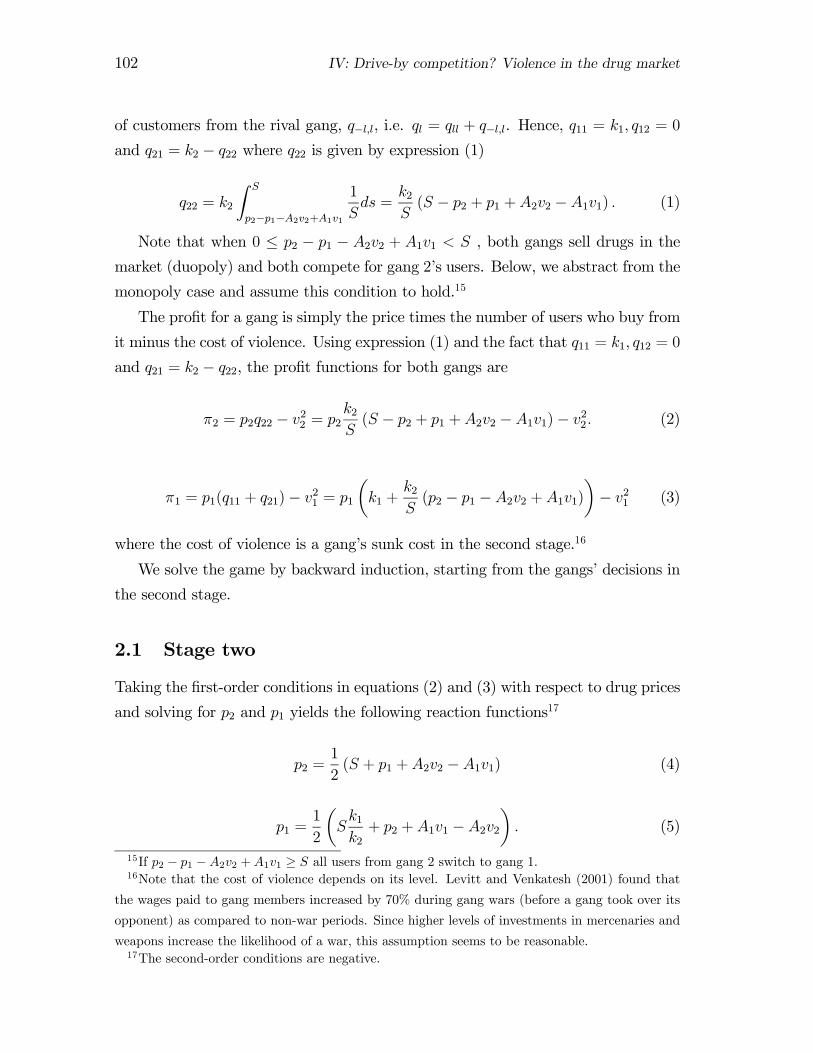
102 IV: Drive-by competition? Violence in the drug market
of customers from the rival gang, q−l,l, i.e. ql = qll + q−l,l. Hence, q11 = k1, q12 = 0
and q21 = k2 − q22 where q22 is given by expression (1)
q22 = k2
Z S
p2−p1−A2v2+A1v1
1
Sds =
k2S(S − p2 + p1 +A2v2 −A1v1) . (1)
Note that when 0 ≤ p2 − p1 − A2v2 + A1v1 < S , both gangs sell drugs in themarket (duopoly) and both compete for gang 2’s users. Below, we abstract from the
monopoly case and assume this condition to hold.15
The profit for a gang is simply the price times the number of users who buy from
it minus the cost of violence. Using expression (1) and the fact that q11 = k1, q12 = 0
and q21 = k2 − q22, the profit functions for both gangs are
π2 = p2q22 − v22 = p2k2S(S − p2 + p1 +A2v2 −A1v1)− v22. (2)
π1 = p1(q11 + q21)− v21 = p1µk1 +
k2S(p2 − p1 −A2v2 +A1v1)
¶− v21 (3)
where the cost of violence is a gang’s sunk cost in the second stage.16
We solve the game by backward induction, starting from the gangs’ decisions in
the second stage.
2.1 Stage two
Taking the first-order conditions in equations (2) and (3) with respect to drug prices
and solving for p2 and p1 yields the following reaction functions17
p2 =1
2(S + p1 +A2v2 −A1v1) (4)
p1 =1
2
µSk1k2+ p2 +A1v1 −A2v2
¶. (5)
15If p2 − p1 −A2v2 +A1v1 ≥ S all users from gang 2 switch to gang 1.16Note that the cost of violence depends on its level. Levitt and Venkatesh (2001) found that
the wages paid to gang members increased by 70% during gang wars (before a gang took over its
opponent) as compared to non-war periods. Since higher levels of investments in mercenaries and
weapons increase the likelihood of a war, this assumption seems to be reasonable.17The second-order conditions are negative.
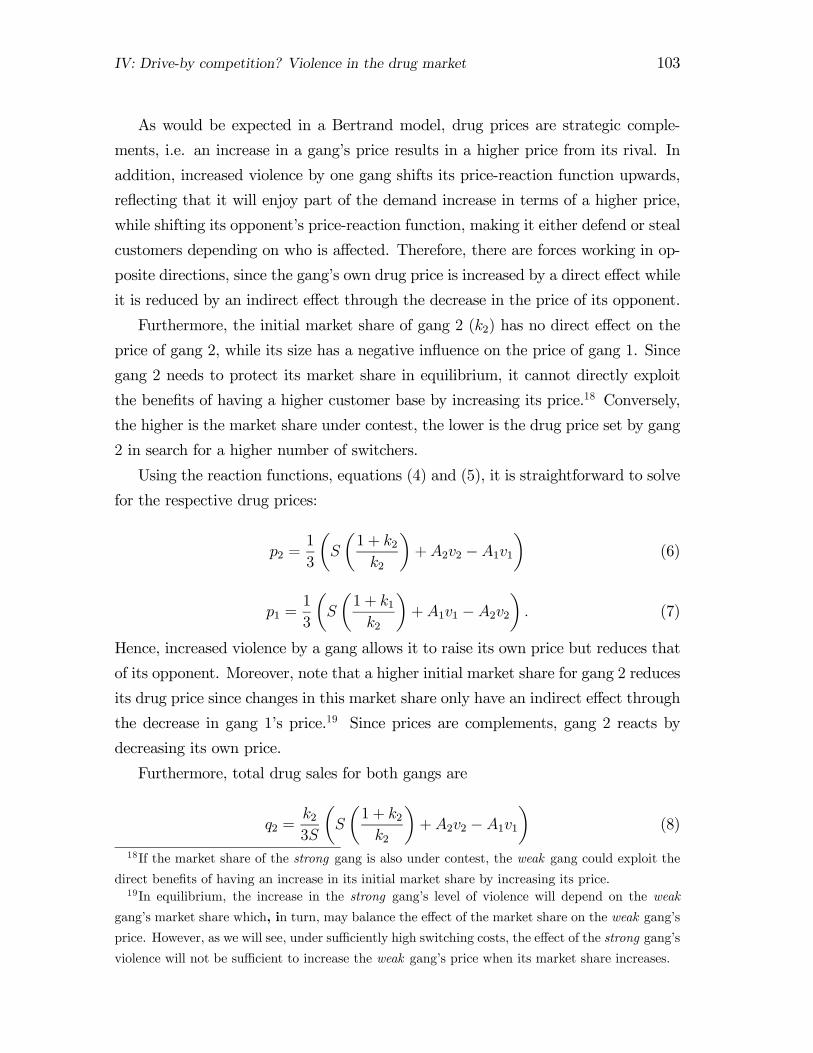
IV: Drive-by competition? Violence in the drug market 103
As would be expected in a Bertrand model, drug prices are strategic comple-
ments, i.e. an increase in a gang’s price results in a higher price from its rival. In
addition, increased violence by one gang shifts its price-reaction function upwards,
reflecting that it will enjoy part of the demand increase in terms of a higher price,
while shifting its opponent’s price-reaction function, making it either defend or steal
customers depending on who is affected. Therefore, there are forces working in op-
posite directions, since the gang’s own drug price is increased by a direct effect while
it is reduced by an indirect effect through the decrease in the price of its opponent.
Furthermore, the initial market share of gang 2 (k2) has no direct effect on the
price of gang 2, while its size has a negative influence on the price of gang 1. Since
gang 2 needs to protect its market share in equilibrium, it cannot directly exploit
the benefits of having a higher customer base by increasing its price.18 Conversely,
the higher is the market share under contest, the lower is the drug price set by gang
2 in search for a higher number of switchers.
Using the reaction functions, equations (4) and (5), it is straightforward to solve
for the respective drug prices:
p2 =1
3
µS
µ1 + k2k2
¶+A2v2 −A1v1
¶(6)
p1 =1
3
µS
µ1 + k1k2
¶+A1v1 −A2v2
¶. (7)
Hence, increased violence by a gang allows it to raise its own price but reduces that
of its opponent. Moreover, note that a higher initial market share for gang 2 reduces
its drug price since changes in this market share only have an indirect effect through
the decrease in gang 1’s price.19 Since prices are complements, gang 2 reacts by
decreasing its own price.
Furthermore, total drug sales for both gangs are
q2 =k23S
µS
µ1 + k2k2
¶+A2v2 −A1v1
¶(8)
18If the market share of the strong gang is also under contest, the weak gang could exploit the
direct benefits of having an increase in its initial market share by increasing its price.19In equilibrium, the increase in the strong gang’s level of violence will depend on the weak
gang’s market share which, in turn, may balance the effect of the market share on the weak gang’s
price. However, as we will see, under sufficiently high switching costs, the effect of the strong gang’s
violence will not be sufficient to increase the weak gang’s price when its market share increases.
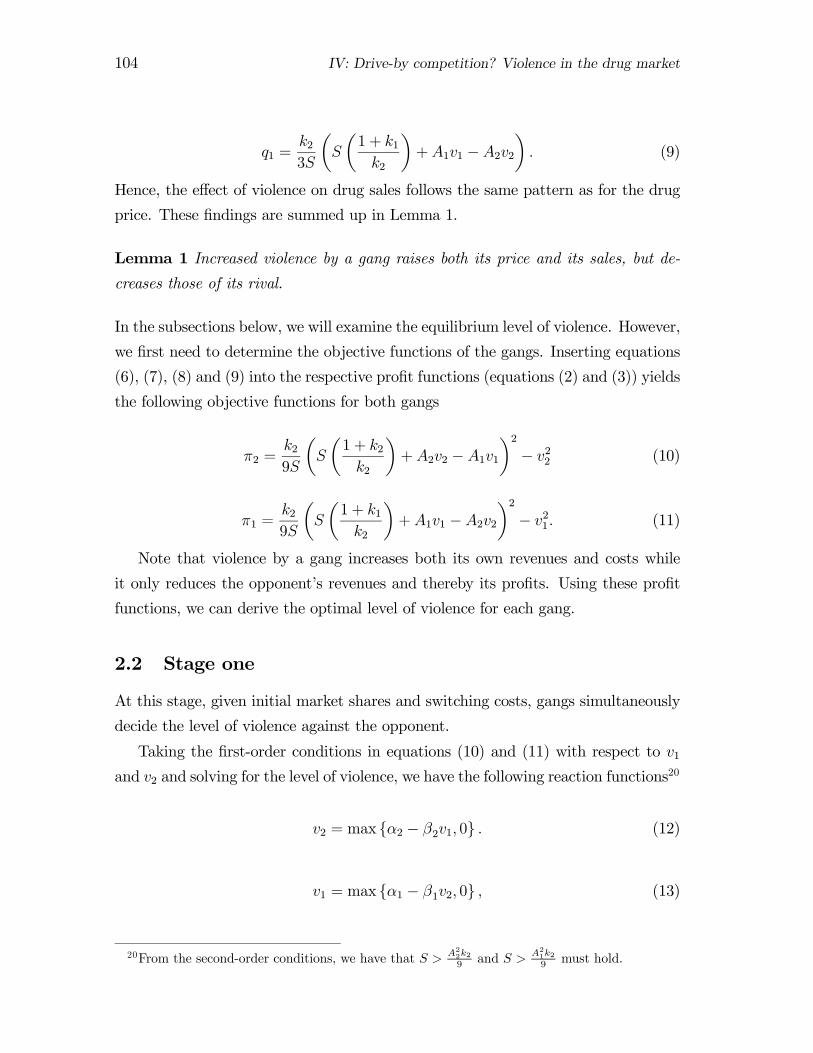
104 IV: Drive-by competition? Violence in the drug market
q1 =k23S
µS
µ1 + k1k2
¶+A1v1 −A2v2
¶. (9)
Hence, the effect of violence on drug sales follows the same pattern as for the drug
price. These findings are summed up in Lemma 1.
Lemma 1 Increased violence by a gang raises both its price and its sales, but de-
creases those of its rival.
In the subsections below, we will examine the equilibrium level of violence. However,
we first need to determine the objective functions of the gangs. Inserting equations
(6), (7), (8) and (9) into the respective profit functions (equations (2) and (3)) yields
the following objective functions for both gangs
π2 =k29S
µS
µ1 + k2k2
¶+A2v2 −A1v1
¶2− v22 (10)
π1 =k29S
µS
µ1 + k1k2
¶+A1v1 −A2v2
¶2− v21. (11)
Note that violence by a gang increases both its own revenues and costs while
it only reduces the opponent’s revenues and thereby its profits. Using these profit
functions, we can derive the optimal level of violence for each gang.
2.2 Stage one
At this stage, given initial market shares and switching costs, gangs simultaneously
decide the level of violence against the opponent.
Taking the first-order conditions in equations (10) and (11) with respect to v1and v2 and solving for the level of violence, we have the following reaction functions20
v2 = max {α2 − β2v1, 0} . (12)
v1 = max {α1 − β1v2, 0} , (13)
20From the second-order conditions, we have that S > A22k29 and S > A21k2
9 must hold.
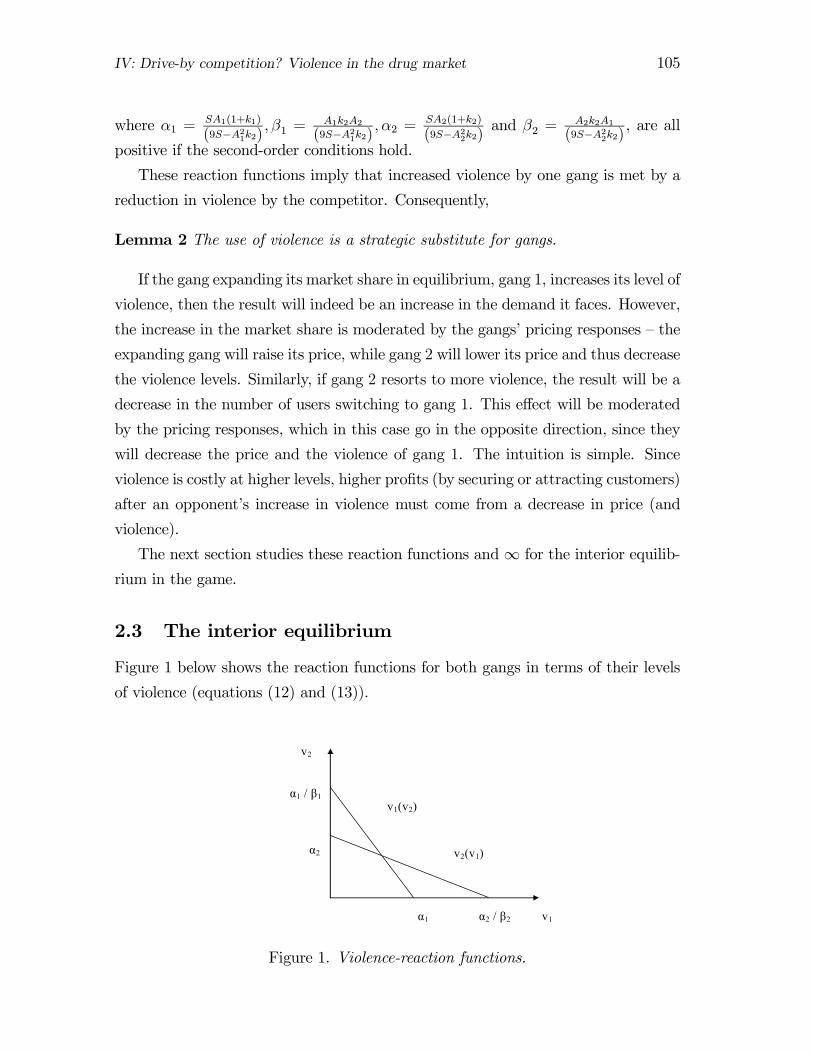
IV: Drive-by competition? Violence in the drug market 105
where α1 =SA1(1+k1)
(9S−A21k2),β1 =
A1k2A2
(9S−A21k2),α2 =
SA2(1+k2)
(9S−A22k2)and β2 =
A2k2A1
(9S−A22k2), are all
positive if the second-order conditions hold.
These reaction functions imply that increased violence by one gang is met by a
reduction in violence by the competitor. Consequently,
Lemma 2 The use of violence is a strategic substitute for gangs.
If the gang expanding its market share in equilibrium, gang 1, increases its level of
violence, then the result will indeed be an increase in the demand it faces. However,
the increase in the market share is moderated by the gangs’ pricing responses — the
expanding gang will raise its price, while gang 2 will lower its price and thus decrease
the violence levels. Similarly, if gang 2 resorts to more violence, the result will be a
decrease in the number of users switching to gang 1. This effect will be moderated
by the pricing responses, which in this case go in the opposite direction, since they
will decrease the price and the violence of gang 1. The intuition is simple. Since
violence is costly at higher levels, higher profits (by securing or attracting customers)
after an opponent’s increase in violence must come from a decrease in price (and
violence).
The next section studies these reaction functions and∞ for the interior equilib-
rium in the game.
2.3 The interior equilibrium
Figure 1 below shows the reaction functions for both gangs in terms of their levels
of violence (equations (12) and (13)).
v1(v2)
v2(v1)
v2 α1 / β1
α2
α1 α2 / β2 v1
Figure 1. Violence-reaction functions.
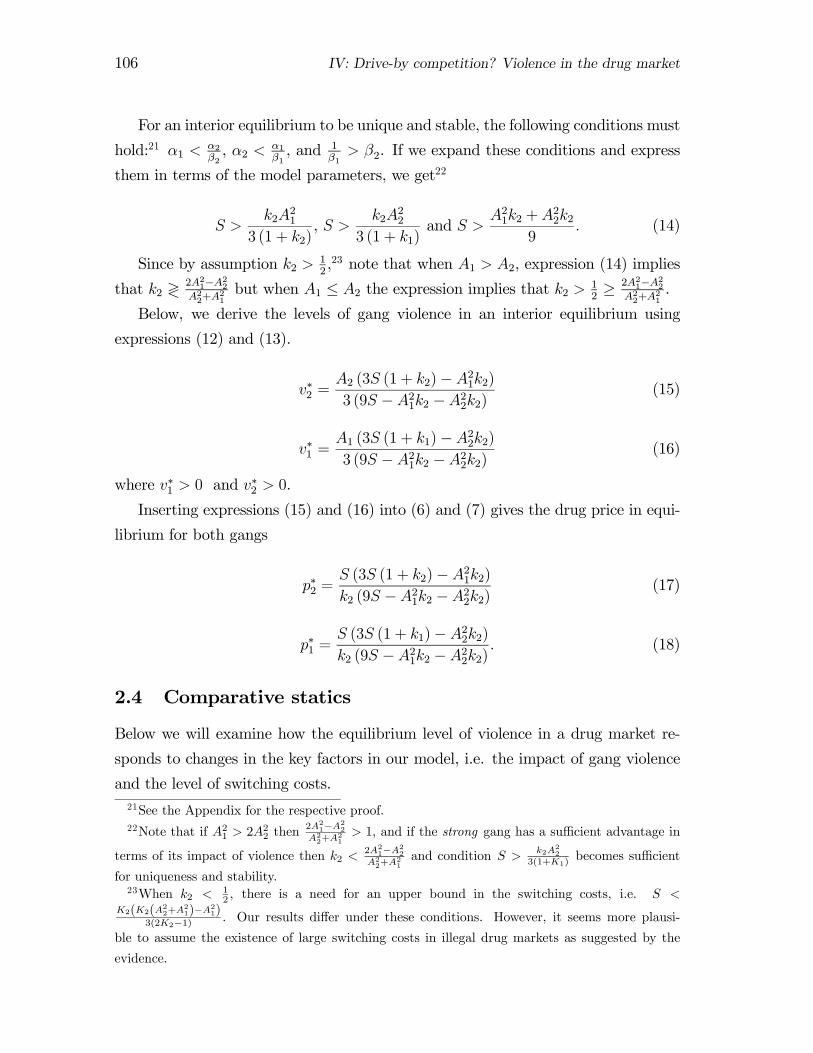
106 IV: Drive-by competition? Violence in the drug market
For an interior equilibrium to be unique and stable, the following conditions must
hold:21 α1 <α2β2, α2 < α1
β1, and 1
β1> β2. If we expand these conditions and express
them in terms of the model parameters, we get22
S >k2A
21
3 (1 + k2), S >
k2A22
3 (1 + k1)and S >
A21k2 +A22k2
9. (14)
Since by assumption k2 > 12,23 note that when A1 > A2, expression (14) implies
that k2 ≷ 2A21−A22A22+A
21but when A1 ≤ A2 the expression implies that k2 > 1
2≥ 2A21−A22
A22+A21.
Below, we derive the levels of gang violence in an interior equilibrium using
expressions (12) and (13).
v∗2 =A2 (3S (1 + k2)−A21k2)3 (9S −A21k2 −A22k2)
(15)
v∗1 =A1 (3S (1 + k1)−A22k2)3 (9S −A21k2 −A22k2)
(16)
where v∗1 > 0 and v∗2 > 0.
Inserting expressions (15) and (16) into (6) and (7) gives the drug price in equi-
librium for both gangs
p∗2 =S (3S (1 + k2)−A21k2)k2 (9S −A21k2 −A22k2)
(17)
p∗1 =S (3S (1 + k1)−A22k2)k2 (9S −A21k2 −A22k2)
. (18)
2.4 Comparative statics
Below we will examine how the equilibrium level of violence in a drug market re-
sponds to changes in the key factors in our model, i.e. the impact of gang violence
and the level of switching costs.21See the Appendix for the respective proof.22Note that if A21 > 2A
22 then
2A21−A22A22+A
21> 1, and if the strong gang has a sufficient advantage in
terms of its impact of violence then k2 <2A21−A22A22+A
21and condition S > k2A
22
3(1+K1)becomes sufficient
for uniqueness and stability.23When k2 < 1
2 , there is a need for an upper bound in the switching costs, i.e. S <K2(K2(A22+A21)−A21)
3(2K2−1) . Our results differ under these conditions. However, it seems more plausi-
ble to assume the existence of large switching costs in illegal drug markets as suggested by the
evidence.
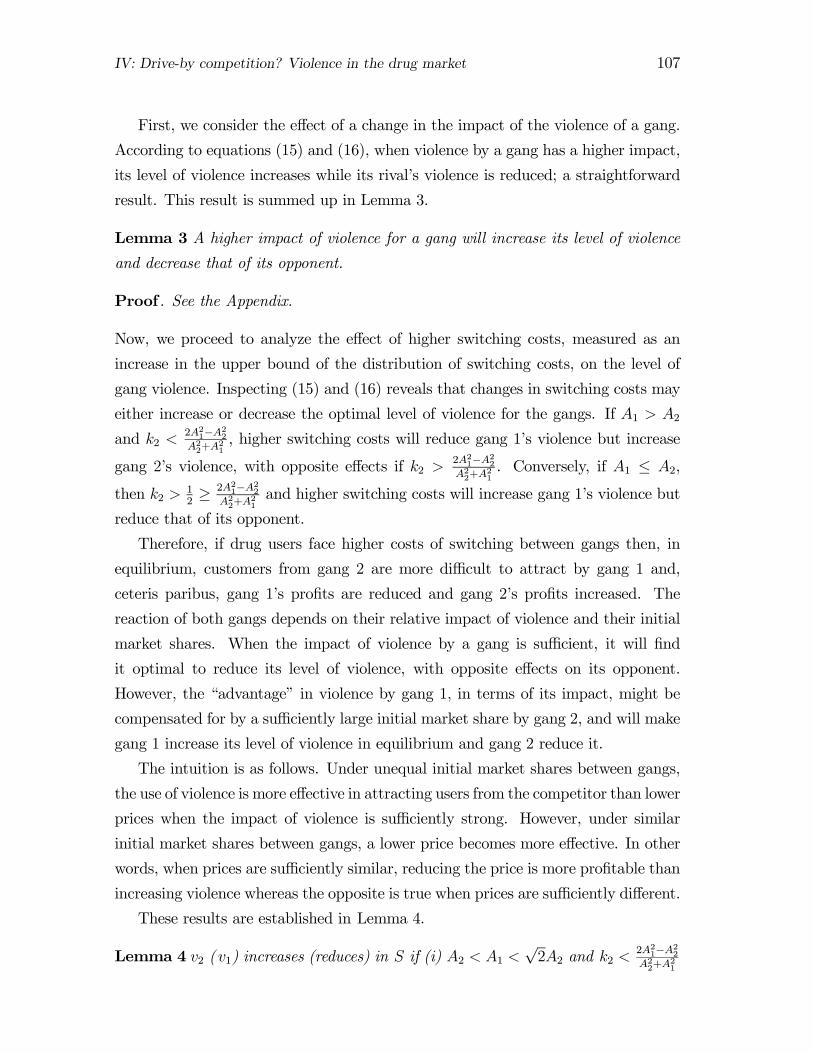
IV: Drive-by competition? Violence in the drug market 107
First, we consider the effect of a change in the impact of the violence of a gang.
According to equations (15) and (16), when violence by a gang has a higher impact,
its level of violence increases while its rival’s violence is reduced; a straightforward
result. This result is summed up in Lemma 3.
Lemma 3 A higher impact of violence for a gang will increase its level of violence
and decrease that of its opponent.
Proof . See the Appendix.
Now, we proceed to analyze the effect of higher switching costs, measured as an
increase in the upper bound of the distribution of switching costs, on the level of
gang violence. Inspecting (15) and (16) reveals that changes in switching costs may
either increase or decrease the optimal level of violence for the gangs. If A1 > A2and k2 <
2A21−A22A22+A
21, higher switching costs will reduce gang 1’s violence but increase
gang 2’s violence, with opposite effects if k2 >2A21−A22A22+A
21. Conversely, if A1 ≤ A2,
then k2 > 12≥ 2A21−A22
A22+A21and higher switching costs will increase gang 1’s violence but
reduce that of its opponent.
Therefore, if drug users face higher costs of switching between gangs then, in
equilibrium, customers from gang 2 are more difficult to attract by gang 1 and,
ceteris paribus, gang 1’s profits are reduced and gang 2’s profits increased. The
reaction of both gangs depends on their relative impact of violence and their initial
market shares. When the impact of violence by a gang is sufficient, it will find
it optimal to reduce its level of violence, with opposite effects on its opponent.
However, the “advantage” in violence by gang 1, in terms of its impact, might be
compensated for by a sufficiently large initial market share by gang 2, and will make
gang 1 increase its level of violence in equilibrium and gang 2 reduce it.
The intuition is as follows. Under unequal initial market shares between gangs,
the use of violence is more effective in attracting users from the competitor than lower
prices when the impact of violence is sufficiently strong. However, under similar
initial market shares between gangs, a lower price becomes more effective. In other
words, when prices are sufficiently similar, reducing the price is more profitable than
increasing violence whereas the opposite is true when prices are sufficiently different.
These results are established in Lemma 4.
Lemma 4 v2 ( v1) increases (reduces) in S if (i) A2 < A1 <√2A2 and k2 <
2A21−A22A22+A
21
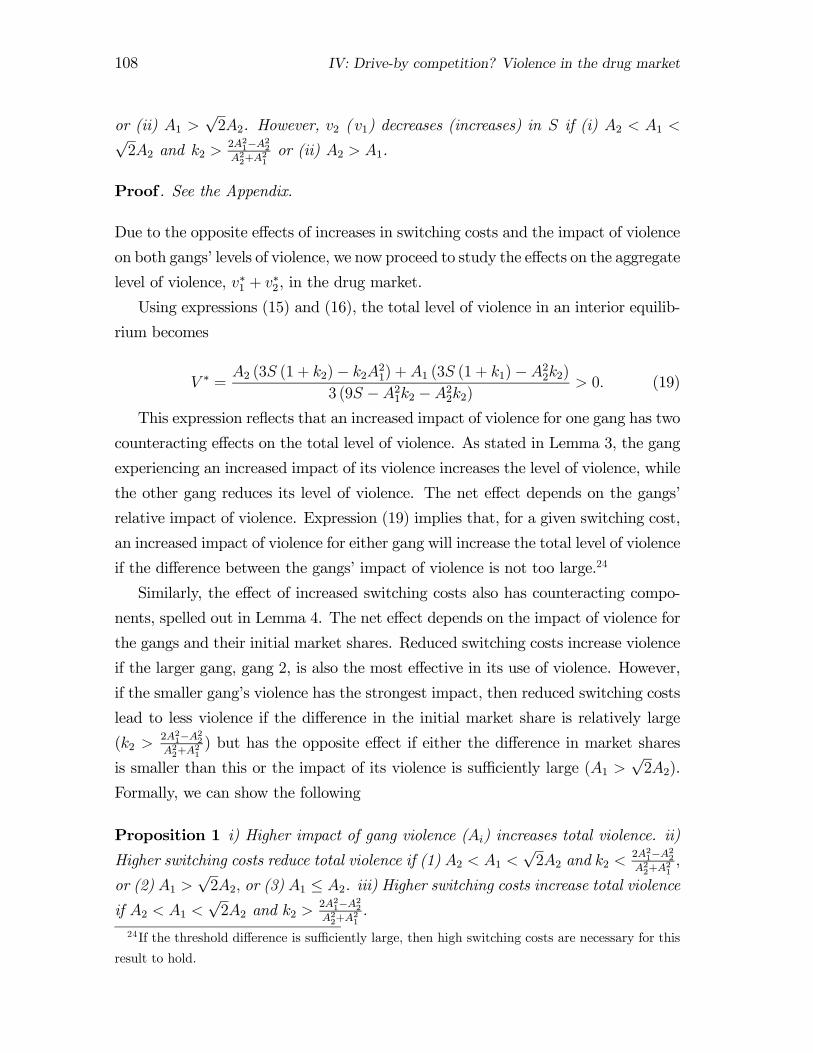
108 IV: Drive-by competition? Violence in the drug market
or (ii) A1 >√2A2. However, v2 ( v1) decreases (increases) in S if (i) A2 < A1 <√
2A2 and k2 >2A21−A22A22+A
21or (ii) A2 > A1.
Proof . See the Appendix.
Due to the opposite effects of increases in switching costs and the impact of violence
on both gangs’ levels of violence, we now proceed to study the effects on the aggregate
level of violence, v∗1 + v∗2, in the drug market.
Using expressions (15) and (16), the total level of violence in an interior equilib-
rium becomes
V ∗ =A2 (3S (1 + k2)− k2A21) +A1 (3S (1 + k1)−A22k2)
3 (9S −A21k2 −A22k2)> 0. (19)
This expression reflects that an increased impact of violence for one gang has two
counteracting effects on the total level of violence. As stated in Lemma 3, the gang
experiencing an increased impact of its violence increases the level of violence, while
the other gang reduces its level of violence. The net effect depends on the gangs’
relative impact of violence. Expression (19) implies that, for a given switching cost,
an increased impact of violence for either gang will increase the total level of violence
if the difference between the gangs’ impact of violence is not too large.24
Similarly, the effect of increased switching costs also has counteracting compo-
nents, spelled out in Lemma 4. The net effect depends on the impact of violence for
the gangs and their initial market shares. Reduced switching costs increase violence
if the larger gang, gang 2, is also the most effective in its use of violence. However,
if the smaller gang’s violence has the strongest impact, then reduced switching costs
lead to less violence if the difference in the initial market share is relatively large
(k2 >2A21−A22A22+A
21) but has the opposite effect if either the difference in market shares
is smaller than this or the impact of its violence is sufficiently large (A1 >√2A2).
Formally, we can show the following
Proposition 1 i) Higher impact of gang violence (Ai) increases total violence. ii)
Higher switching costs reduce total violence if (1) A2 < A1 <√2A2 and k2 <
2A21−A22A22+A
21,
or (2) A1 >√2A2, or (3) A1 ≤ A2. iii) Higher switching costs increase total violence
if A2 < A1 <√2A2 and k2 >
2A21−A22A22+A
21.
24If the threshold difference is sufficiently large, then high switching costs are necessary for this
result to hold.
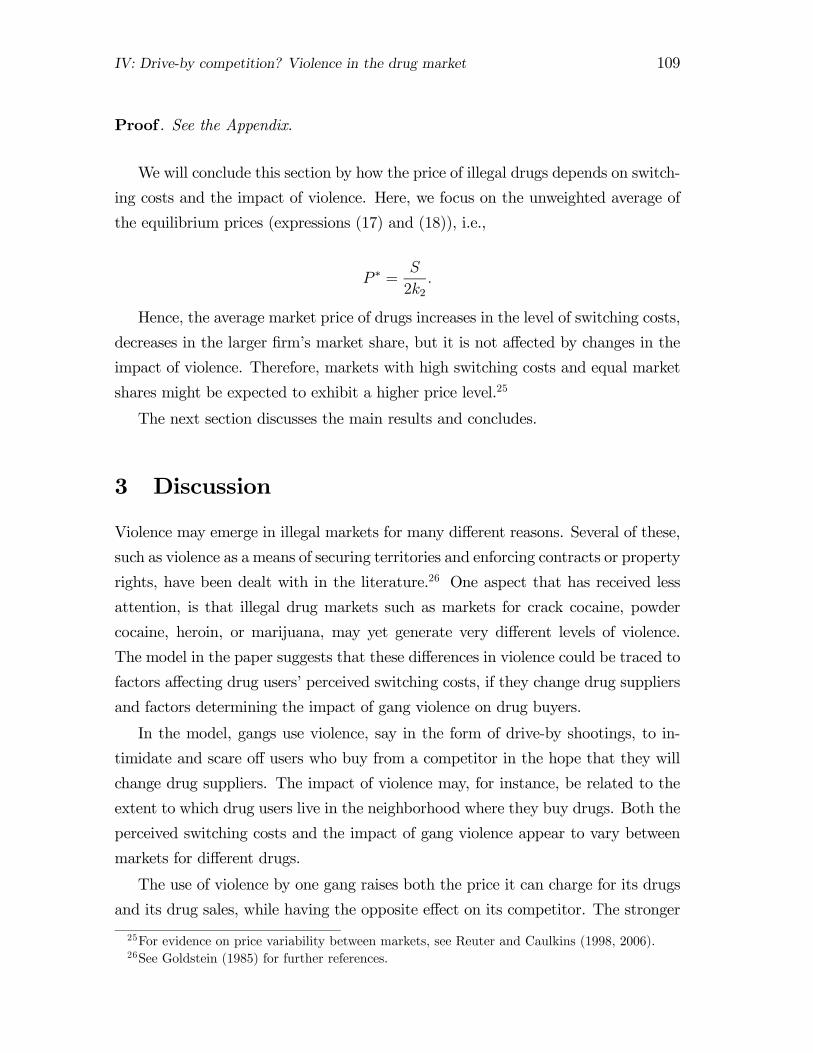
IV: Drive-by competition? Violence in the drug market 109
Proof . See the Appendix.
We will conclude this section by how the price of illegal drugs depends on switch-
ing costs and the impact of violence. Here, we focus on the unweighted average of
the equilibrium prices (expressions (17) and (18)), i.e.,
P ∗ =S
2k2.
Hence, the average market price of drugs increases in the level of switching costs,
decreases in the larger firm’s market share, but it is not affected by changes in the
impact of violence. Therefore, markets with high switching costs and equal market
shares might be expected to exhibit a higher price level.25
The next section discusses the main results and concludes.
3 Discussion
Violence may emerge in illegal markets for many different reasons. Several of these,
such as violence as a means of securing territories and enforcing contracts or property
rights, have been dealt with in the literature.26 One aspect that has received less
attention, is that illegal drug markets such as markets for crack cocaine, powder
cocaine, heroin, or marijuana, may yet generate very different levels of violence.
The model in the paper suggests that these differences in violence could be traced to
factors affecting drug users’ perceived switching costs, if they change drug suppliers
and factors determining the impact of gang violence on drug buyers.
In the model, gangs use violence, say in the form of drive-by shootings, to in-
timidate and scare off users who buy from a competitor in the hope that they will
change drug suppliers. The impact of violence may, for instance, be related to the
extent to which drug users live in the neighborhood where they buy drugs. Both the
perceived switching costs and the impact of gang violence appear to vary between
markets for different drugs.
The use of violence by one gang raises both the price it can charge for its drugs
and its drug sales, while having the opposite effect on its competitor. The stronger
25For evidence on price variability between markets, see Reuter and Caulkins (1998, 2006).26See Goldstein (1985) for further references.
110 IV: Drive-by competition? Violence in the drug market
is the impact of a gang’s violence in terms of shifting drug business from the com-
petitor to itself, the more attractive it is to use violence as a means for competition.
Therefore, the level of violence in a market tends to increase with its impact on drug
buyers.27 This is the first of the two main results of the paper. The second result
is that changed switching costs may either raise or reduce the level of violence in
the market, depending on the degree of equality of the initial market shares and the
relative impact of violence between gangs. For instance, if the gang with the largest
initial market share is also more effective in its use of violence, then lower switching
costs raise the level of violence in the market. Conversely, if initial market shares
are very unequal and the smallest gang’s violence has the strongest impact, then
lower switching costs reduce violence in the market.
Regarding the comparison between the markets for crack cocaine and marijuana,
it was noted in the paper that in markets for crack cocaine, there are approximately
twice as many dealers per user as in marijuana markets, which suggests that switch-
ing costs are lower for crack users. Moreover, in crack markets, a higher proportion
of drug users buy drugs in their own neighborhood which makes them more exposed
to violence and presumably results in a high impact of violence in crack markets.
Taken together, these observations suggest that switching costs are lower and the im-
pact of violence higher in crack cocaine markets than in marijuana markets. Hence,
the predictions of the model regarding the level of violence in illegal drug markets
seem consistent with the empirical observations.
Since some drug enforcement policies may affect the impact of gang violence as
well as switching costs for drug users, the model can also serve an important purpose
in highlighting possible indirect effects on the level of violence in drug markets.
For example, increased police presence is likely to raise the cost of switching to a
new supplier. In a drug market where the impact of violence by the gang with a
lower initial market share is stronger but not sufficiently larger than the impact
of violence by the opponent, then under sufficiently different initial market shares,
higher switching costs will actually increase the levels of violence in the market.
This might have happened in the study by Fritsch et al. (1999) which found that
27The qualification “tends to” refers to gang violence being shown to be a strategic substitute,
so that increased violence by one gang is met by reduced violence by the other. However, unless
the impact of violence differs radically between gangs, the total effect of an increased impact of
violence for one party is to increase the total level of violence in the market.
IV: Drive-by competition? Violence in the drug market 111
in some of the areas that were the homes of Dallas’ most violent gangs, increased
police presence was not effective in decreasing the level of gang violence.
In the paper, we have focused on violence as a means of competing for customers
and have abstracted from other uses of violence, such as inflicting costs on or elimi-
nating a competitor. The latter uses of violence are probably most important in the
initial stages of the development of illegal drug markets. When studying mature,
or stable, drug markets, it does not seem very restrictive to limit the analysis to
the strategic use of violence. In the paper, we have also abstracted from dynamic
aspects of the analysis. While interesting, a formal analysis of, say, a repeated inter-
action over time becomes quite complex and is left to future research. Furthermore,
endogenizing drug consumption can be the next step to follow. Nonetheless, the
paper provides a starting point for analyzing the strategic use of violence in markets
for illegal drugs and the potential effects of law enforcement policies on the level of
violence in these markets.
112 IV: Drive-by competition? Violence in the drug market
References
Aluf, Y. and Shy, O. “Comparison-advertising and competition”, Mimeo. Depart-
ment of Economics, University of Haifa, 2001.
Block, C., Christakos, A., Jacob, A., and Przybylski, R.“Street gangs and crime:
Patterns and trends in Chicago”, Research Bulletin Illinois Criminal Justice
Information Authority, Sept. 1996.
Brownstein, H.H., Crimmins, S.M., and Spunt, B.J. “A conceptual framework for
operationalizing the relationship between violence and drug market stability”,
Contemporary drug Problems, 27, 2000.
Caulkins, J. “Developing Price series for cocaine”. RAND Corporation, 1994.
Caulkins, J., Reuter, P. and Taylor, L. “Can Supply Restrictions Lower Price?
Violence, Drug dealing and Positional Advantage”. Contributions to Economic
Analysis & Policy, Vol. 5, No. 1. 2006.
Chang, J., Lu, H. and Chen, M. “Organized crime or individual crime? Endogenous
size of criminal organization and the optimal law enforcement”. Economic
Inquiry, Vol. 43, No. 3, 2005.
Chen, Y. “Paying customers to switch”. Journal of Economics and Management
Strategy, Vol. 6, N. 4, Winter 1997.
Fiorentini, G. “Oligopolistic competition in illegal markets”. In The Economics of
Organised Crime, edited by Fiorentini and Peltzman. Cambridge University
Press. 1995.
Fritsch, E., Caeti, T., and Taylor, R. “Gang suppression through saturation patrol,
aggressive curfew, and truancy enforcement: A quasi-experimental test of the
Dallas gang initiative”. Crime and Delinquency, 45 (1), 122-139, 1999.
Gehrig, T. and Stenbacka, R. “Differentiation-Induced switching costs and poach-
ing”. Journal of Economics and Management Strategy, Vol. 13, N. 4, Winter
2004
Goldstein, P. “The Drugs/Violence nexus: A Tripartite conceptual framework”,
Journal of Drug Issues, 14, 1985.
Harocopos, A. and Hough, M. “Drug Dealing in Open-air markets”, Problem Specific
Guides series No. 31, available at www.cops.usdoj.gov, 2005.
Haller, H. and Chakrabarti, A. “An Analysis of advertising wars”. CIE Discussion
Papers, 2002.
IV: Drive-by competition? Violence in the drug market 113
Howell, J. and Decker, S. “The Youth Gangs, Drugs and Violence connection”. U.S.
Department of Justice, 1999.
Klemperer, P. “Competition when consumers have switching costs: An overview
with applications to Industrial Organization, Macroeconomics, and Interna-
tional Trade”. Review of Economic Studies (1995) 62, 515-539.
––– “Markets with consumer switching costs”. The Quarterly Journal of Eco-
nomics, May (1987), 375-394.
––– “The competitiveness of markets with switching costs”. RAND Journal of
Economics, Vol 18, Number 1, Spring 1987.
Kugler, M., Verdier, T. and Zenou, Y. “Organized crime, corruption and punish-
ment”. Journal of Public Economics, 89, 2005.
Levitt, S. and Venkatesh, S. “An Economic analysis of a drug-selling gang’s fi-
nances”. The Quarterly Journal of Economics, Vol 15, No. 3, 2000.
MacCoun, R., Kilmer, J. and Reuter, P. “Research on Drugs-Crime linkages: The
next generation”. Toward a Drugs and Crime Research Agenda for the 21st
Century. The U.S. Department of Justice. 2003.
Mansour, A., Marceau, N. and Mongrain, S. “Gangs and Crime Deterrence”. The
Journal of Law, Economics & Organization, Vol. 22, No.2, 2006.
Mason, M. and Bucke, T. “Evaluating actions against local drug markets: A “sys-
tematic” review of research”. The Police Journal, Vol. 75, 2002.
Mazerolle, L., Kadleck, C. and Roehl, J. “Differential Police Control at Drug-dealing
Places”. Security Journal, Vol. 17, No. 1. 2005.
Mazerolle, L., Soole, D. and Rombouts, S. “Drug Law Enforcement: The Evidence”.
Drug Policy Modelling Project, Monograph 05, Griffith University. 2005.
Miron, J., “Violence and the U.S. Prohibitions of Drugs and Alcohol”, Boston Uni-
versity, 2001a, available at http://econ.bu.edu/miron/.
–––—. “Violence, Guns, and Drugs: A Cross-Country Analysis”, Journal of Law
and Economics, vol. XLIV, 2001b.
Office of Fair Trading, Department of Trade and Industry, United Kingdom. “Switch-
ing costs”. Economic Discussion Papers 5, Annex A - Literature Review. April
2003.
Office of National Drug Control Policy. “Pulse check: Drug markets and chronic
users in 25 of America’s largest cities”, 2004.
–––—. “The Major City Initiative”, 2005.
114 IV: Drive-by competition? Violence in the drug market
–––—. “Crack, powder cocaine and heroin: Drug purchase and use patterns in
sic U.S. cities”, 1997.
Ousley, G. and Lee, M. “Investigating the connections between race, illicit drug
markets, and lethal violence, 1984-1997”. Journal of Research in Crime and
Delinquency, Vol. 41. No. 4, 2004.
Ousley, G. and Lee, M. “Examining the conditional nature of the illicit drug market-
homicide relationship: a partial test of the theory of contingent causation ”.
Criminology, Vol. 40. No. 1, 2002.
Poret, S. “Paradoxical effects of law enforcement policies: the case of the illicit drug
market”. International Review of Law and Economics, Vol. 22. 2003.
Poret, S. and Téjédo, C. “Law enforcement and concentration of illicit drug mar-
kets”. European Journal of Political Economy, 22, 2006.
Rasmussen, D. and Benson, B. “Rationalizing drug policy under federalism”. Florida
State University Review, Vol 30. 2001.
Resignato, A. “Violent crime: a function of drug use or drug enforcement?”. Applied
Economics, Vol. 32. 2000.
Reuter, P. and Caulkins, J. “Illegal “lemons”: price dispersion in heroin and cocaine
markets”, Socio-Economic Planning Sciences 40, 1—14. 2006 .
–––. “What Price data tell us about drug markets”, Journal of Drug Issues, Vol.
28, No. 3. 1998.
Shaffer, G. and Zhang, J. “Pay to switch or pay to stay: Preference-Based price
discrimination in markets with switching costs”. Journal of Economics and
Management Strategy, Vol. 9, N. 3, Fall 2000.
Sherman, L. and Rogan, D. “Deterrent effects of police raids on crack houses: A
randomized, controlled experiment”, Justice Quarterly, Vol. 12, No. 4.1995.
Skaperdas, S. “The political economy of organized crime: providing protection when
the state does not”, Economics of Governance, Vol. 2, pp 173-202, 2001.
Skott, P. and Jepsen, G. “Paradoxical effects of drug policy in a model with im-
perfect competition and switching costs”. Journal of Economic Behavior &
Organization, Vol. 48. 2002.
Sviridoff, M. and Hillsman, S. “Assessing the community effects of Tactical Narcotics
Teams”. In D. MacKenzie and C. Uchida (Eds.), Drugs and crime: evaluating
public policy initiatives, London. 1994.
Taylor, C. “Supplier surfing: competition and consumer behavior in subscription
IV: Drive-by competition? Violence in the drug market 115
markets.”. RAND Journal of Economics Summer/2003, Volume: 34 , Issue: 2
, Pages: 223-46.
U.S. Department of Justice. Drug Threat Assessments, National Drug Intelligence
Center, 2001-2004.
––– National Gang Threat Assessment, National Alliance of Gang Investigators
Associations, 2005.
–––“Violence by gang members, 1993 - 2003”, Bureau of Justice Statistics, Crime
Data Brief, June 2005.
––– Arrestee Drug Abuse Monitoring (ADAM), 2003.
Venkatesh, S. “The Gang and the Community” in Gangs in America, 2nd. edition,
CA: Sage Publications. 1996.
Weisburd, D. and Green, L. “Policing drug hot spots: The Jersey City Drug market
Analysis Experiment”, Justice Quarterly, Vol. 12, No. 4. 1995.
Weisburd, D. and Mazerolle, L. “Crime and Disorder in Drug Hot Spots: Impli-
cations for theory and practice in Policing”, Police Quarterly, Vol. 3, No. 3.
2000.
Zimring, F. and Hawkins, G. Crime is not the problem: lethal violence in America.
New York, Oxford University Press. 1997.
Zunin, M. and Zigic, K. “Strategic trade policy and vertical product differentiation:
intra-industry trade between developed and developing countries”. Center for
Economic Research and Graduate Education, Working Paper Series 230, 2004.
116 IV: Drive-by competition? Violence in the drug market
Appendix
Uniqueness and stability of an interior equilibrium
(a) The interior equilibrium: We need to prove that both best response functions
cross once and only once. On the one hand, the inverse of the best response function
for gang 1, v12(v1) > 0, where α1 > 0 and β1 > 0 implies that ∂v12(v1)
∂v1< 0, given
that v12(v1) is continuous and differentiable. Therefore, v12(v1) ∈
hα1β1, 0i∀v1 > 0. On
the other hand, the best response function for gang 2, v2(v1) > 0 where α2 > 0 and
β2 > 0 implies that∂v2(v1)∂v1
< 0, given that v2(v1) is continuous and differentiable.
Therefore, v2(v1) ∈ [α2, 0] ∀v1 > 0. Hence, if α1β1> α2 and | ∂v12(v1)
∂v1|>| ∂v2(v1)
∂v1|,
both response functions cross once. Replacing these values, we have α1β1> α2 −→
3S (1 + k1) > A22k2 and |
∂v12(v1)
∂v1|>| ∂v2(v1)
∂v1|−→ 1
β1> β2 −→ (9S −A22k2 −A21k2) >
0. Note also that when | ∂v12(v1)
∂v1|>| ∂v2(v1)
∂v1|, an interior equilibrium is stable. Q.E.D.
(b) The corner equilibria: There are also two corner equilibria when either α1β1<
α2 −→ 3S (1 + k1) ≤ A22k2 or α2β2< α1 −→ 3S (1 + k2) ≤ A21k2), which are stable if
9S > A21k2 +A22k2.
(c) The multiple equilibria: If α1β1< α2 and | ∂v12(v1)
∂v1|<| ∂v2(v1)
∂v1|, both response
functions cross once but there are now three possible equilibria, two corner and one
interior equilibria. Replacing these values, we have α1β1< α2 −→ 3S (1 + k1) < A
22k2
and | ∂v12(v1)
∂v1|<| ∂v2(v1)
∂v1|−→ 1
β1< β2 −→ (9S −A22k2 −A21k2) < 0. However, if
| ∂v12(v1)
∂v1|<| ∂v2(v1)
∂v1|, the interior equilibrium is unstable.
Conditions for a duopolistic market (0 < s2 < S)
To ensure duopoly, besides the conditions for uniqueness and stability, the critical
switching cost must be positive in an interior equilibrium and the following expres-
sion must hold28
s2 = p∗2 − p∗1 −A2v∗2 +A1v∗1 > 0. (20)
Inserting equations (15), (16), (17) and (18) into expression (20), we have that
3S (k2 − k1) > k2 (A22k2 −A21k1) and since k2 > 12then
28The other condition for having a duopoly, s2 = p∗2 − p∗1 −A2v∗2 +A1v∗1 < S always holds.
IV: Drive-by competition? Violence in the drug market 117
S >k2
3 (k2 − k1)¡A22k2 −A21k1
¢.
Hence, if k2 > 12and switching costs are sufficiently large, expression (20) always
holds. Note that our necessary and sufficient conditions (from expression (14)) will
always hold under sufficiently large switching costs.
Comparing expressions (20) and (14), we find that when k2 >2A21−A22A22+A
21then S >
k23(k2−k1) (A
22k2 −A21k1) becomes the sufficient condition in an interior equilibrium.
However, if k2 <2A21−A22A22+A
21then this condition is always satisfied under expression
(14).
Proofs of Lemmas 3 and 4
i) Differentiation of v∗1, expression (15), with respect to S yields∂v∗1∂S
=3(9S−A21k2−A22k2)3A1(1+k1)−27A1(3S(1+k1)−A22k2)
9(9S−A21k2−A22k2)2 ≷ 0, and solving this expression
for k2 we get k2 ≷ 2A21−A22A22+A
21. And we conclude that (1) If k2 >
2A21−A22A22+A
21then ∂v∗1
∂S> 0,
and (2) If k2 <2A21−A22A22+A
21then ∂v∗1
∂S< 0.Q.E.D.
ii) ∂v∗1∂A1
> 0.
iii) Differentiation of v∗1, expression (15), with respect to A2 yields∂v∗1∂A2
=3(9S−A21k2−A22k2)(−2A1A2k2)+3A1(3S(1+k1)−A22k2)(2A2k2)
9(9S−A21k2−A22k2)2 ≷ 0, and solving this ex-
pression we get A21k2 < 3S (1 + k2) . Hence,∂v∗1∂A2
< 0. Q.E.D.
iv) Differentiation of v∗2, expression (16), with respect to S yields∂v∗2∂S=
9(9S−A21k2−A22k2)A2(1+k2)−A2(3S(1+k2)−A21k2)279(9S−A21k2−A22k2)
2 ≷ 0, and solving this expression for
k2, we get2A21−A22A22+A
21≷ k2. And we conclude that (1) If k2 < 2A21−A22
A22+A21then ∂v∗2
∂S> 0, and
(2) If k2 >2A21−A22A22+A
21then ∂v∗2
∂S< 0.Q.E.D.
v) Differentiation of v∗2, expression (16), with respect to A1 yields∂v∗2∂A1
=−6(9S−A21k2−A22k2)A2A1k2+A2(3S(1+k2)−A21k2)6A1k2
9(9S−A21k2−A22k2)2 ≷ 0, and solving this expression,
we get A22k2 < 3S (1 + k1). Hence,∂v∗2∂A1
< 0.
vi) ∂v∗2∂A2
> 0.
Proof of Proposition 1
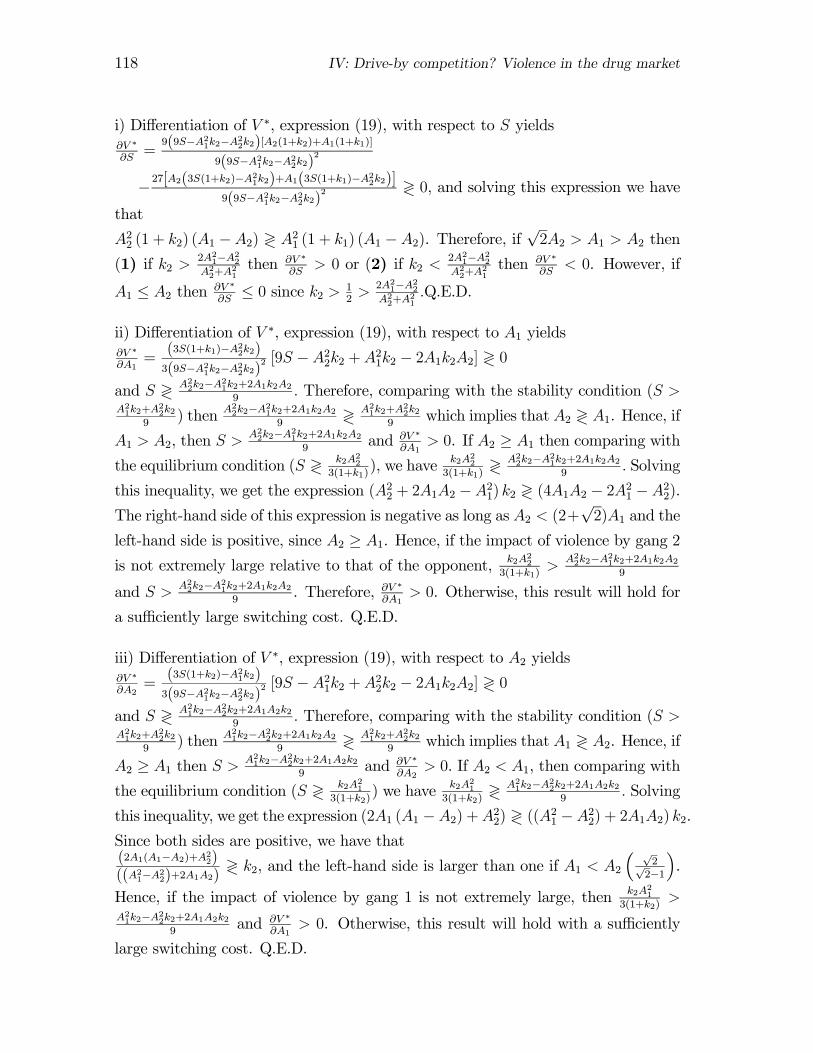
118 IV: Drive-by competition? Violence in the drug market
i) Differentiation of V ∗, expression (19), with respect to S yields∂V ∗
∂S=
9(9S−A21k2−A22k2)[A2(1+k2)+A1(1+k1)]9(9S−A21k2−A22k2)
2
−27[A2(3S(1+k2)−A21k2)+A1(3S(1+k1)−A22k2)]
9(9S−A21k2−A22k2)2 ≷ 0, and solving this expression we have
that
A22 (1 + k2) (A1 −A2) ≷ A21 (1 + k1) (A1 −A2). Therefore, if√2A2 > A1 > A2 then
(1) if k2 >2A21−A22A22+A
21then ∂V ∗
∂S> 0 or (2) if k2 <
2A21−A22A22+A
21then ∂V ∗
∂S< 0. However, if
A1 ≤ A2 then ∂V ∗
∂S≤ 0 since k2 > 1
2>
2A21−A22A22+A
21.Q.E.D.
ii) Differentiation of V ∗, expression (19), with respect to A1 yields∂V ∗
∂A1=(3S(1+k1)−A22k2)3(9S−A21k2−A22k2)
2 [9S −A22k2 +A21k2 − 2A1k2A2] ≷ 0
and S ≷ A22k2−A21k2+2A1k2A29
. Therefore, comparing with the stability condition (S >A21k2+A
22k2
9) then A22k2−A21k2+2A1k2A2
9≷ A21k2+A
22k2
9which implies that A2 ≷ A1. Hence, if
A1 > A2, then S >A22k2−A21k2+2A1k2A2
9and ∂V ∗
∂A1> 0. If A2 ≥ A1 then comparing with
the equilibrium condition (S ≷ k2A223(1+k1)
), we have k2A223(1+k1)
≷ A22k2−A21k2+2A1k2A29
. Solving
this inequality, we get the expression (A22 + 2A1A2 −A21) k2 ≷ (4A1A2 − 2A21 −A22).The right-hand side of this expression is negative as long as A2 < (2+
√2)A1 and the
left-hand side is positive, since A2 ≥ A1. Hence, if the impact of violence by gang 2is not extremely large relative to that of the opponent, k2A22
3(1+k1)>
A22k2−A21k2+2A1k2A29
and S > A22k2−A21k2+2A1k2A29
. Therefore, ∂V ∗
∂A1> 0. Otherwise, this result will hold for
a sufficiently large switching cost. Q.E.D.
iii) Differentiation of V ∗, expression (19), with respect to A2 yields∂V ∗
∂A2=(3S(1+k2)−A21k2)3(9S−A21k2−A22k2)
2 [9S −A21k2 +A22k2 − 2A1k2A2] ≷ 0
and S ≷ A21k2−A22k2+2A1A2k29
. Therefore, comparing with the stability condition (S >A21k2+A
22k2
9) then A21k2−A22k2+2A1k2A2
9≷ A21k2+A
22k2
9which implies that A1 ≷ A2. Hence, if
A2 ≥ A1 then S > A21k2−A22k2+2A1A2k29
and ∂V ∗
∂A2> 0. If A2 < A1, then comparing with
the equilibrium condition (S ≷ k2A213(1+k2)
) we have k2A213(1+k2)
≷ A21k2−A22k2+2A1A2k29
. Solving
this inequality, we get the expression (2A1 (A1 −A2) +A22) ≷ ((A21 −A22) + 2A1A2) k2.Since both sides are positive, we have that(2A1(A1−A2)+A22)((A21−A22)+2A1A2)
≷ k2, and the left-hand side is larger than one if A1 < A2³ √
2√2−1
´.
Hence, if the impact of violence by gang 1 is not extremely large, then k2A213(1+k2)
>A21k2−A22k2+2A1A2k2
9and ∂V ∗
∂A1> 0. Otherwise, this result will hold with a sufficiently
large switching cost. Q.E.D.
Recent Dissertations in Economics 2003:1. Yoshihiko Fukushima: Essays on Employment Policies 2003:2. Lena Nekby: Empirical Studies on Health Insurance, Employment of Immigrants
and the Gender Wage Gap 2003:3. Nils Bohlin: Essays on Urban Wages, Location and Retail Trade 2003:4. Dan Nyberg: Essays on Exchange Rate Risk and Uncertainty 2003:5. Tobias Lindqvist: Essays on Mergers and Financial Markets 2003:6. Adam Jacobsson: War, drugs and media - Arenas of conflict 2004:1. Tobias Nilsson: Essays on Voting and Government Inefficiency 2004:2. John Ekberg: Essays in Empirical Labor Economics 2004:3. Pavlos Petroulas: International Capital Flows: Effects, Defects and Possibilities 2005:1. Carlos Razo Pérez: Mergers, Collusion and Congestion: Essays on Merger
Policy 2005:2. Jan Petterson: Three Empirical Studies on Development: Democracy, the
Resource Curse and Aid 2005:3. Anna Nilsson: Indirect effects on unemployment and low earnings: Crime and
children's school performance 2005:4. Bo Larsson: Essays on Banking and Portfolio Choice 2005:5. Carl Wilkens: Interest Rates - Prediction, Jumps and the Market Price of Risk 2006:1. Magnus Wiberg: Essays on the Political Economy of Protection and Industrial
Location 2007:1. Alberto J. Naranjo R.: Drugonomics: Industrial Organization of Illegal Drug
Markets


![[Illegal] drug ! - the beginner's guide to hash-growing](https://img.pdfslide.us/doc/110x75/58ee461c1a28ab0c798b4685/illegal-drug-the-beginners-guide-to-hash-growing.jpg)