Embed Size (px)
Citation preview

Drug/Cell-line Browser (DBC) v1.0 - User Manual
Written by Qiaonan Duan and Avi Ma’ayan
Last Updated: 6/26/2014
Table of Contents
I. Abstract
II. Installation and Requirements
III. Instructions
1. Cell-line canvas
2. Drug canvas
3. Viewing cell-lines that are most sensitive to a drug
4. Viewing drugs that are most effective to inhibit a cell-line
5. Filtering the cell-line canvas by tissue or subtype
6. Labeling the tiles on the cell-line canvas
7. Switching between datasets
8. Sharing DCB with colleagues
IV. Contact
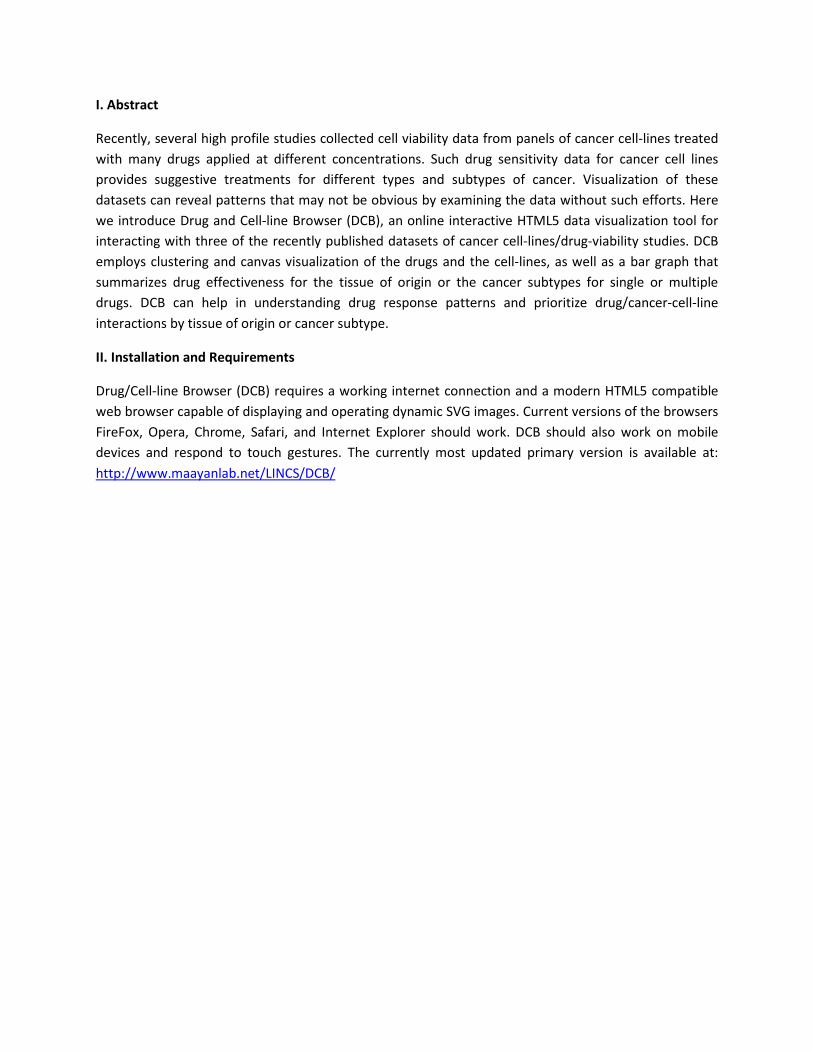
I. Abstract
Recently, several high profile studies collected cell viability data from panels of cancer cell-lines treated with many drugs applied at different concentrations. Such drug sensitivity data for cancer cell lines provides suggestive treatments for different types and subtypes of cancer. Visualization of these datasets can reveal patterns that may not be obvious by examining the data without such efforts. Here we introduce Drug and Cell-line Browser (DCB), an online interactive HTML5 data visualization tool for interacting with three of the recently published datasets of cancer cell-lines/drug-viability studies. DCB employs clustering and canvas visualization of the drugs and the cell-lines, as well as a bar graph that summarizes drug effectiveness for the tissue of origin or the cancer subtypes for single or multiple drugs. DCB can help in understanding drug response patterns and prioritize drug/cancer-cell-line interactions by tissue of origin or cancer subtype.
II. Installation and Requirements
Drug/Cell-line Browser (DCB) requires a working internet connection and a modern HTML5 compatible web browser capable of displaying and operating dynamic SVG images. Current versions of the browsers FireFox, Opera, Chrome, Safari, and Internet Explorer should work. DCB should also work on mobile devices and respond to touch gestures. The currently most updated primary version is available at: http://www.maayanlab.net/LINCS/DCB/

III. Instructions
1. Cell-line canvas
The cell-line canvas (Figure 1) visualizes cell-lines as tiles on a canvas. The locations of the tiles are arranged such that similar cell-lines are placed together. The similarity between cell-lines can be computed in different ways, each resulting in a different arrangement of the tiles on the canvas. The cell-lines are clustered in four ways, each providing different views. The default view is the category view (Figure 2A). With this view cell-lines are clustered by tissue type or subtype. The second view (Figure 2B) is based on the response to drug vector for each cell-line. The third view is based on basal gene expression within each cell-line. Cell lines are clustered by their gene expression profile vectors (Figure 2C). The fourth view is based on the mutation status (Figure 2D). In this view cell lines are clustered by their gene mutations status. The four views could be switched using the radio buttons below the cell-line canvas (Figure 1). The animation during view switching illustrates how cell-lines change their locations from one view to another. The cell-line canvas has no boundaries. This mean that the top row is adjacent to the bottom row and the leftmost column is adjacent to the rightmost column. Users can drag the canvas to shift the canvas boundaries.
Figure 1. Cell-line canvas and view switching buttons
In the category view, tiles are colored by their tissue type or by the cancer subtype. These categories colors map to the colors in tissue the legend (Figure 3). In the other three views, the tiles are colored by clustering fitness. Clustering fitness indicates how similar a cell-line is to its eight surrounding
cell-line canvas
cell-line canvas view switching buttons

neighboring cell-lines. The brighter the color, the more similar the cell-line is to its eight surrounding neighbors. A scale bar below the canvas shows the range of the clustering fitness (Figure 2). A value of 8 means perfect fit while a value of 0 means the least possible fit. Mouse hovering on a tile that represents a cell-line canvas shows the cell-line name.
Figure 2. Four different views of the cell-line canvas
Figure 3. Tissue legend
tissue legend
A. Category view B. Sensitive score view
C. Gene expression view
D. Mutation view
Clustering fitness scale bar

2. Drug canvas
Similar to the cell-line canvas, the drug canvas visualizes drugs as tiles on a canvas (Figure 4). Drugs are also clustered in four different ways, resulting in four different views. The first view (Figure 5A) is based on clustering by the drug efficacy to cell-line vectors. In the second view (Figure 5B) the drugs are clustered by their chemical structure similarity. In the third view (Figure 5C) drugs are clustered by their shared known target proteins. In the fourth view (Figure 5D) drugs are clustered by their LINCS L1000 gene expression profiles’ similarity. The LINCS gene expression profiles are from results of experiments in which the drugs were applied to MCF7 breast cancer cell lines at 10uM and gene expression was measured at 6 hours. All the four views of the drug canvases are colored by clustering fitness and a scale bar similar to that of the cell-line canvas is provided to show the range of the clustering fitness (Figure 4A). The four radio buttons below the drug canvas can be used to switch between different views (Figure 4C). Mouse hovering on a tile that represents a drug on the drug canvas shows the drug name. The drug canvas is also continuous where the user can drag the canvas to shift its boundaries.
Figure 4. The drug canvas

Figure 5. Four different views of the drug canvas
Clustering fitness scale bar
Drug canvas view switching buttons
A. Sensitive score view B. Structure view C. Target view D. Perturbation view

3. Viewing cell-lines that are most sensitive to a drug
Clicking on a tile on the drug canvas (Figure 4) shows the cell-lines that are most sensitive to the drug (Figure 6). Alternatively, choosing a drug using the “Select Drug” dropdown menu does the same thing (Figure 6). Either way, the most sensitive cell-lines would be highlighted by circles on cell-line canvas. The brightness of the circles indicates the degree of sensitivity of a cell-line to the selected drug (Figure 6). Switching between the different views can be used to see how the locations of the most sensitive cell-lines change from one clustering method to another. By default, the cell-line canvas shows the top 25% most sensitive cell-lines. This percentage can be adjusted using the slider located on the left of the cell-line canvas (Figure 7). In the meantime, when a drug is selected, the tissue legend changes to show the enrichment for each tissue or cancer subtype (Figures 6 and 7). The black line appearing on the right side of the tissue legend indicates the p=0.05 significance level.
Figure 6. The most sensitive cell-lines to the drug AZ628 are highlighted on the cell-line canvas after the drug is selected on the drug canvas
At the same time when a drug is selected, the “Download Results” button (Figure 7) becomes enabled. Clicking on the Download Results button provides the results in text format. The downloaded file includes information about the most sensitive cell-lines and the p-values for each tissue type. The cell-lines in the output text file are sorted by their sensitive scores from high to low. Sensitivity scores range from zero to one, with one being the greater possible sensitivity. Sensitive score is a normalized transformation of the original sensitivity measurement provided by the study, for example, IC50 or
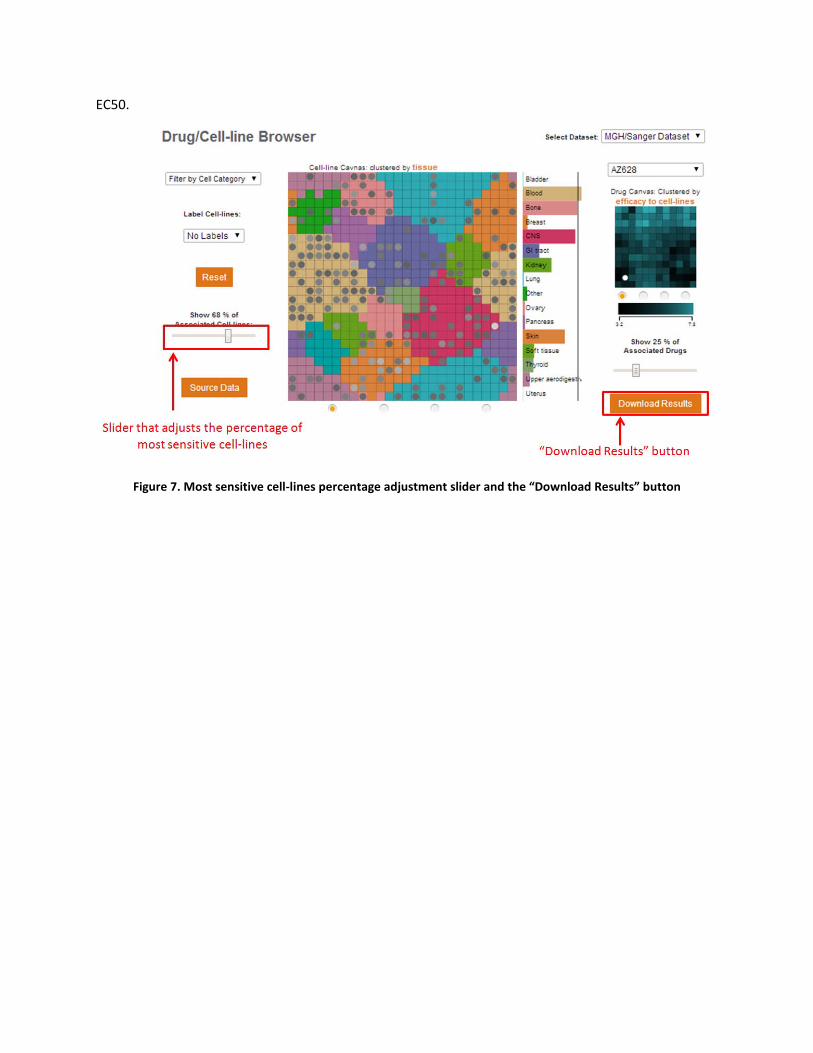
EC50.
Figure 7. Most sensitive cell-lines percentage adjustment slider and the “Download Results” button

4. Viewing drugs that are most effective to inhibit a cell-line
Clicking on a tile from the cell-line canvas (Figure 1) shows the most effective drugs to inhibit the selected cell-line (Figure 8). The most effective drugs would be highlighted by circles on drug canvas. The brightness of the circles indicates the degree of efficacy of a drug to the selected cell-line. Switching between different views can be used for seeing how the locations of the most effective drugs change from one clustering method to another. By default, the drug canvas shows the top 25% most effective drugs. This percentage could be adjusted using the slider (Figure 8) beneath the drug canvas.
Figure 8. The most effective drugs to inhibit the cell-line EFO-27 are highlighted on drug canvas after the tile that represents the cell-line is clicked
In the meantime when a cell-line is clicked, the “Download Results” button becomes enabled. Clicking on the Download Results button downloads the results in text format. The downloaded file includes information about the most effective drugs. The drugs in the downloaded file are also sorted by their sensitivity scores from high to low. From the perspective of the drugs, sensitivity scores represent efficacy, with one being the largest.
The Reset button can be used to clear any drug or cell-line selection. After reseting, the “Download Results” button would become disabled.
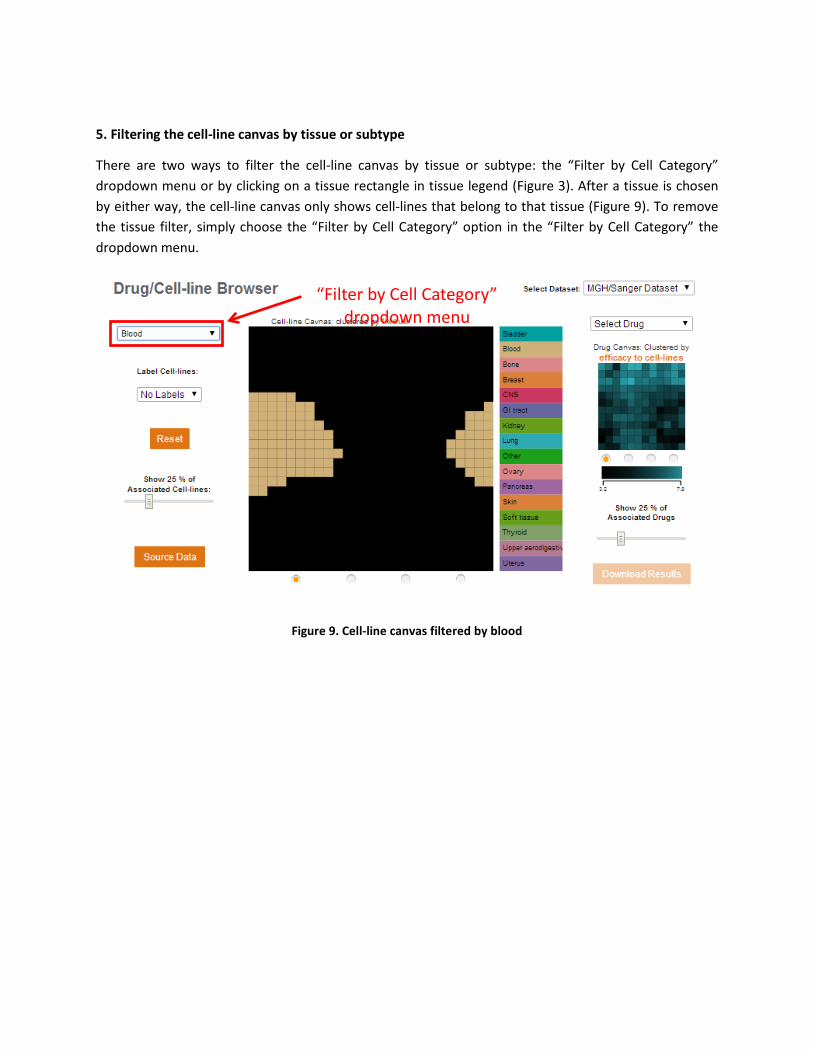
5. Filtering the cell-line canvas by tissue or subtype
There are two ways to filter the cell-line canvas by tissue or subtype: the “Filter by Cell Category” dropdown menu or by clicking on a tissue rectangle in tissue legend (Figure 3). After a tissue is chosen by either way, the cell-line canvas only shows cell-lines that belong to that tissue (Figure 9). To remove the tissue filter, simply choose the “Filter by Cell Category” option in the “Filter by Cell Category” the dropdown menu.
Figure 9. Cell-line canvas filtered by blood
“Filter by Cell Category” dropdown menu

6. Labeling the tiles on the cell-line canvas
Tiles on the cell-line canvas can be labeled using the “Label Cell-lines” dropdown menu (Figure 10). There are two options for the color of the labels: white or black. The labels may be too small to observe. Using the mouse wheel can be used to zoom-in to see the labels. In zoom-in mode, users can drag the canvas to examine different areas. The zoom function also applies to the drug canvas.
Figure 10. “Label Cell-lines” dropdown menu

7. Switching between datasets
DCB includes drug sensitivity data of cancer cell-lines from three separate studies. Using the “Select Dataset” dropdown menu (Figure 11) can be used to switch between these three datasets.
Figure 11. “Select Dataset” dropdown menu
“Select Dataset” dropdown menu

8. Sharing DCB with colleagues
If you find the DCB website useful, please share it with others using the toolbar on the left (Figure 12).
Figure 12. Website sharing toolbar
IV. Contact
For suggestions, help and bug report please contact: